The Nation’s Number Two Tight Oil Play After a Year of Low Oil Prices
The Bakken Play, located in North Dakota and Montana, is the birthplace of tight (shale) oil and
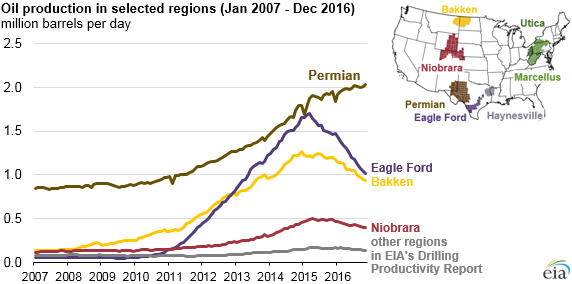
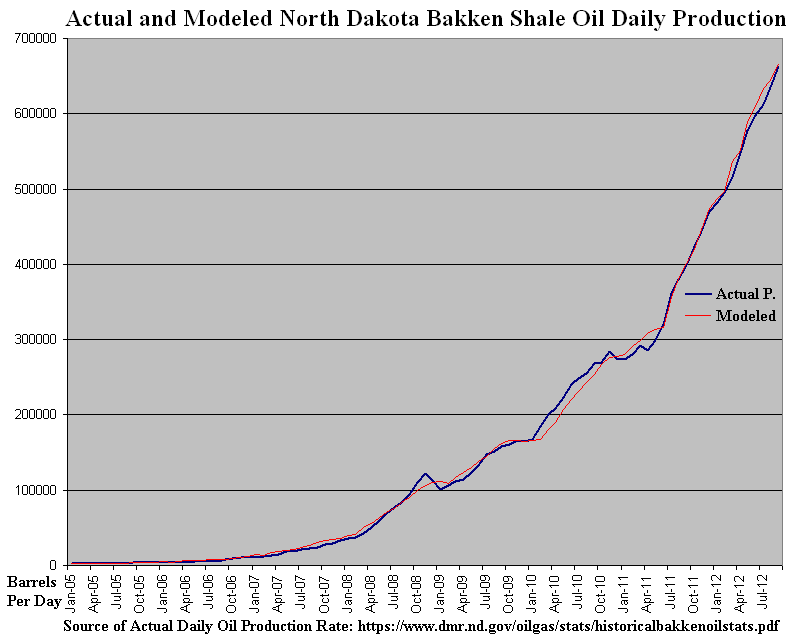
in many ways the poster child of the so-called “shale revolution.” Between 2010 and 2014, oil production
in North Dakota grew nearly five-fold, from 236,000 barrels/day in January 2010 to over 1,167,000 barrels/day
in January 2015, according to the U.S. Department of Energy’s
Energy Information Administration (EIA), which every
year publishes its Annual Energy Outlook
(AEO).
The EIA forecast this production growth to continue and — despite thousands of wells having already
been drilled in the most productive areas of the play, and the steep decline in oil prices in 2014 —
even raised its projection in 2015 for the total amount of tight oil produced in the Bakken through
2040 by 85% over the previous year’s forecast.
But a new report throws cold
water on the thinking that U.S. shale production will be around for the long
haul. The Post Carbon Institute
conducted an
analysis of the top seven oil and top seven natural gas plays, which
together account for 89 percent of current shale oil production and 88 percent
of shale gas production.
In Bakken Reality Check, David Hughes, author of Drilling Deeper(which
likely remains the most thorough independent analysis of U.S. shale gas and tight oil production ever
conducted) and a number of other reports on North American shale gas and tight oil production, looks
at how production in the Bakken has changed after a year of low oil prices.
Predicting what oil production will be in 25 years is difficult, to
say the least, but the Post Carbon report projects that oil production from the
Bakken and Eagle Ford will be just
one-tenth of the level that EIA is forecasting. The EIA predicts
that the Bakken and the Eagle Ford will be producing a combined 1 million bpd in
2040. Hughes thinks it will be just a small fraction of that amount – a mere
73,000 bpd.
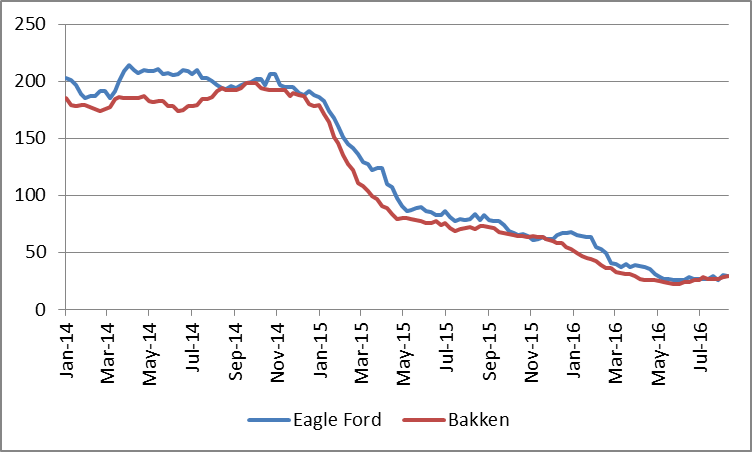
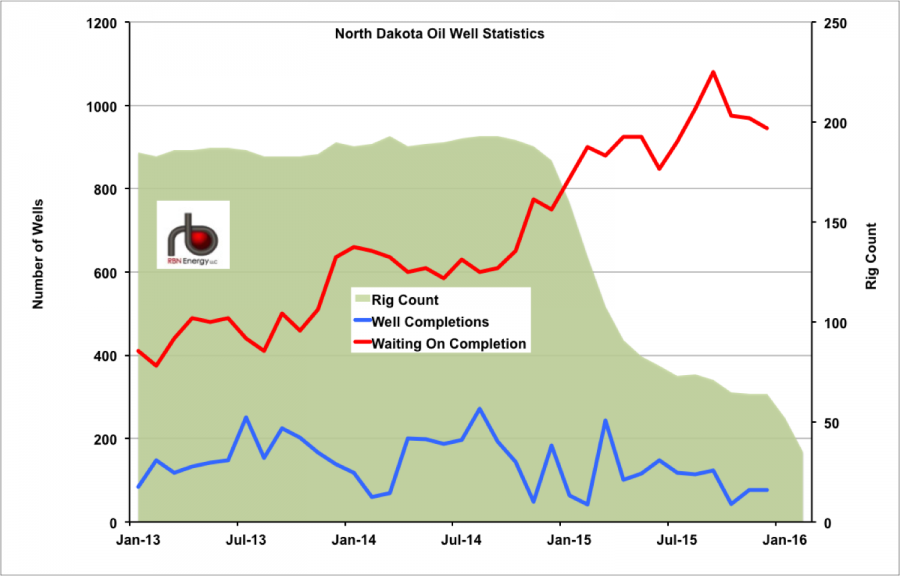
Oil production in the Bakken Play is now falling after more than a year of low oil prices—but it
has proven more resilient than many observers expected. This paper reviews the latest developments in
the Bakken Play and provides an update of the assessment in Drilling Deeper, which was published
in October 2014 just as the turmoil in the oil markets began.
The report found that both shale oil and shale gas production will peak
before 2020. More importantly, the report’s author, David Hughes, says oil
production will decline much more quickly than the EIA has predicted.
That’s largely because of high decline rates at shale wells across
the country. Unlike conventional wells, which can produce relatively
stable rates for a long period of time, shale oil and gas wells experience an
initial burst of production in the first few years, followed by a precipitous
decline thereafter.
Hughes
estimates that the average shale oil well declines at a rate of between 60
and 91 percent over three years. Wells in the Bakken decline by 45 percent per
year, which stands in stark contrast to the 5 percent annual decline for an
average conventional well.
Or put another way, oil and gas companies will have to keep drilling
at a feverish pace just to stand still. This means the industry is on a
“drilling
treadmill” that will be unsustainable over the long-term.
This is not the first time that David Hughes has taken aim at EIA
data. In a
December
2013 report, he skewered the high estimates for the potential of the
Monterrey Shale in California, calling the EIA’s numbers “simplistic and highly
overstated.” Several months later, the EIA was forced to back track on its
figures,
downgrading the recoverable oil estimates in the Monterrey by 96 percent.
Hughes says the implications of getting it wrong are “profound,” since so
many companies are basing very large investments on incorrect projections. He
says rosy estimates have cut into investment for renewables, while steering
capital towards expensive oil and gas export terminals that should now be called
into question.
An article in CleanTechnica points to the possibility of boom towns turning
into “ghost towns” if the pace of drilling drops off. If David Hughes
and The Post Carbon Institute are correct, there could be quite a few ghost
towns popping up in the coming years as the shale revolution begins to fizzle.
HB. I have used leases developed in our field in the past ten years to demonstrate that shale
is high cost. Again, rule of thumb the cost of a conventional well in our field is
approximately 1/100 of a shale oil well ($70K range v $7 million range).
Here are some examples with production through 10/31/19:
8 producers 4 injection wells. Cumulative BO 83,466. YTD BO 2,085. First production
4/2003.
10 producers 4 injection wells. Cumulative BO 116,065. YTD BO 2089. First production
9/2005.
10 producers 4 injection wells. Cumulative Bo 55,595. YTD BO 3,023. First production
3/2006.
4 producers 1 injection well. Cumulative BO 37,418. YTD BO 1,289. First production
8/2008.
8 producers 3 injection wells. Cumulative BO 42,494. YTD BO 2,328. First production
10/2008.
4 producers 1 injection well. Cumulative BO 19,216. YTD BO 1,220. First production
12/2010.
8 producers 3 injection wells. Cumulative BO 46,463. YTD BO 1,877. First production
8/2011.
4 producers 2 injection wells. Cumulative BO 10,700. YTD BO 634. First production
10/2011.
8 producers 3 injection wells. Cumulative 59,592 BO. YTD 4,956 BO. First production
11/2011.
1 producer. Water disposed of in adjoining lease. Cumulative BO 7,872. YTD BO 444 BO.
First production 5/2012.
8 producers 3 injection wells. Cumulative 56,500 BO. YTD 3,858 BO. First production
6/2012.
4 producers 1 injection well. Cumulative BO 11,758. YTD BO 1,457. First production
6/2013.
2 producers. Water disposed of on adjoining lease. Cumulative 3,524 BO. YTD BO 393. First
production 11/2013.
6 producers Two injection wells. Cumulative 25,988 BO. YTD 3,233 BO. First production
9/2014.
Figure in anywhere from $60K-80K to drill, complete and equip each well including
electric, flow and/or injection lines. Figure another $20-30K for a tank battery.
Assume anywhere from 12.5 to 20 percent royalty.
Of course, some projects do better than others. But compare this to shaleprofile.com
wells.
There was very little drilling in our field from 1987 to 2003. There has been very little
since 2015. Century plus year old stripper field.
There have also been many reclamation projects in our field during 2005-2014 of abandoned
wells wherein the producers went bust in the 1990s, with 1998 being a knockout blow.
We took over 2 wells drilled in the 1950s they were abandoned in 1998. We just had to
equip them and build a new tank battery. We also took over three wells also drilled in the
1950s where we had to do the same, plus plug the injection well and convert one producer to
an injector. These work well at $55-65 WTI also.
I can also point to many projects developed in our field in the 1980s where cumulative per
well has topped 40K BO to date.
Conventional oil is a much better deal than shale usually when you can find it. And also
when you aren't trying to pay for 8 figure CEO pay, skyscrapers and jets out of it.
Shale just has the scale. Huge scale. Worldwide game changing size.
Shallow, I can't thank you enough. Alot to digest here. My first glance gave me the feeling
shale drilling dollars are about half as productive. Maybe you have a better number.
When a new field is drilled, is it always under pressure without the cost of lifting it
from the hole? Then once the pressure is exhausted it becomes a stripper?
A lot of the Huntington Beach field lays under the ocean. There is over a mile long row of
wells along the shoreline. I'm assuming they go horizontal under the ocean. Only a few wells
have lift Jacks. Can strippers wells go horizontal?
There isn't enough down hole pressure here for natural flow. Everything goes on pumping unit
immediately and injection wells are also drilled at the same time as production wells.
To put into perspective, the field was originally drilled over 100 years ago. Waterflood
was initiated on a large scale right after WW2. Many wells were plugged in the late
1960s-early 1970s when oil prices were low. The field was redrilled in the late 1970s –
early 1980s. Little activity after 1986, until prices took off during the Iraq War.
For example, we operate a lease that was originally drilled in the 1950s. It was plugged
out in 1972. In 1979-81, all of the plugged wells were drilled out (casing had not been
pulled). New injection wells were drilled.
Cumulative from 9 producing wells since 1979 is over 140K BO with production currently at
5.5 BOPD. It is difficult to tell what these wells produced from 1953-1972, because they were
part of a larger unitized waterflood project. Our guess is around 200-250K BO during that
time frame.
Only a small company would be interested in 9 wells making 5.5 BOPD, but they have been
economic even during the worst part of 2016 (barely during Q1 – 2016).
There haven't been HZ wells drilled in the shallow zones (1,500' and below). However,
there has been some success with 1,800'-5,000' TVD hz wells. Not sure of the economics.
There has been success with slick water fracks in deeper vertical wells also.
If we assume as 10 million per well total cost, then 200K barrel needs to be extracted to
break even. Assuming average life of the well of 5 years you need to produce on average 1000
barrel a day to break even. In the past that were possible (the average was 143), now it is
not
The Monterrey shale estimate was by the EIA not the USGS. The EIA had a private consultant
do the analysis and it was mostly based on investor presentations, very little geological
analysis.
It would be better if the USGS did an economic analysis as they do with coal for the
Powder River Basin. They could develop a supply curve based on current costs, but they
don't.
Do you have any idea of the capital cost of the wells (ballpark guess) for a horizontal
multifracked well in the Wolfcamp? Would $7 million be about right (a WAG by me)?
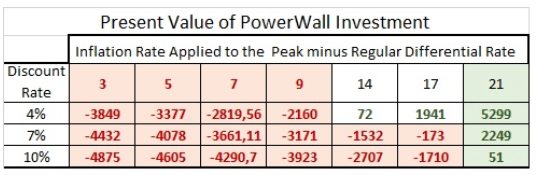
On ignoring economics, I show my oil price assumptions. Other financial assumptions for
the Bakken are $8 million for capital cost of the well (2016$). OPEX=$9/b, other costs=$5/b,
royalty and taxes=29% of gross revenue, $10/b transport cost, and a real discount rate of 7%
(10% nominal discount rate assuming 3% inflation).
I do a DCF based on my assumed real oil price curve. Brent oil price rises to $77/b
(2016$) by June 2017 and continue to rise at 17% per year until Oct 2020 when the oil price
reaches $130/b, it is assumed that average oil prices remain at that level until Dec 2060.
The last well is drilled in Dec 2035 and stops producing 25 years later in Dec 2060.
EUR of wells today is assumed to be 321 kb and EUR falls to 160 kb by 2035. The
last well drilled only makes $243,000 over the 7% real rate of return, so the 9 Gb scenario
is probably too optimistic, it is assumed that any gas sales are used to offset OPEX and
other costs, though no natural gas price assumptions have been made to simplify the
analysis.
This analysis is based on the analyses that Rune Likvern has done in the past, though his
analyses are far superior to my own.
I think when seismic, land, surface and down hole equipment is included, the number is much
higher. With $20-60K per acre being paid, land definitely has to be factored in. Depending on
spacing, $1-5 million per well?
I am doing the analysis for the Bakken. A lot of the leases are already held and I don't
know that those were the prices paid. Give me a number for total capital cost that makes sense,
are you suggesting $10.5 million per well, rather than $8 million? Not hard to do, but all the
different assumptions you would like to change would be good so I don't redo it 5 times.
Mostly I would like to clear up "the number".
I threw out more than one number, OPEX, other costs, transport costs, royalties and taxes,
real discount rate (adjusted for inflation), well cost.
I think you a re talking about well cost as "the number". I include down hole costs as part
of OPEX (think of it as OPEX plus maintenance maybe).
Dennis. The very high acreage numbers are for recent sales in the Permian Basin. In reading
company reports, it seems they state a cost to drill and case the hole, another to complete the
well, then add the two for well cost.
This does not include costs incurred prior to the well being drilled, which are not
insignificant. Nor does it include costs of down hole and surface equipment, which also are not
insignificant.
Land costs are all over the map, and I think Bakken land costs overall are the lowest,
because much of the leasing occurred prior to US shale production boom. I think a lot of
acreage early on cost in the hundreds per acre. Of course, there was quite a bit of trading
around since, so we have to look project by project, unfortunately. For purposes of a model, I
think $8 million is probably in the ballpark.
I would not include equipment for the well, initially, as OPEX (LOE is what I prefer to
stick with, being US based). The companies do not do that, those costs are included in
depreciation, depletion and amortization expense.
Once the well is in production, and failures occur, I include the cost of repairs, including
replacement equipment, in LOE. I am not sure that the companies do that, however.
I think the Permian is going to be much tougher to estimate, as there are different
producing formations at different depths, whereas the Bakken primarily has two, and the Eagle
Ford has 1 or 2.
An example:
QEP paid roughly $60,000 per acre for land in Martin Co., TX. If we assume one drilling unit
is 1280 acres (two sections), how many two mile laterals will be drilled in the unit?
1280 acres x $60,000 = $76,800,000.
Assume 440′ spacing, 12 wells per unit.
$76,800,000/12 = $6,400,000 per well.
However, there are claims of up to 8 producing zones in the Permian.
So, 12 x 8 = 96 wells.
$76,800,000 / 96 = $800,000 per well.
Even assuming 96 wells, the cost per well is still significant.
If we assume 96 wells x $7 million to drill, complete and equip, total cost to develop is
$.75 BILLION. That is a lot of money for one 1280 acre unit, need to recover a lot of oil and
gas to get that to payout.
I am neither an oil man nor an accountant, so regardless of what we call it I am assuming
natural gas sales (maybe about $3/barrel on average) are used to offset the ongoing costs to
operate the well (LOE, OPEX, financial costs, etc), we could add another million to the cost of
the well for surface and downhole equipment and land costs.
Does an average operating cost over the life of a well of about $17/b ($14/b plus natural
gas sales of $3/b of oil produced)seem reasonable? That would be about $5.4 million spent on
LOE etc. over the life of the well (assuming 320 kbo produced). Also does the 10% nominal rate
of return sound high enough, what number would you use as a cutoff?
You use a different method than a DCF and want the well to pay out in 60 months. This would
correspond to about a 14% nominal rate of return and an 11% real rate of return (assuming a 3%
annual inflation rate.)
"The Monterrey shale estimate was by the EIA not the USGS. The EIA had a private consultant do
the analysis and it was mostly based on investor presentations, very little geological
analysis."
Exactly. USGS' estimate as of October 2015 is very conservative:
"The Monterey Formation in the deepest parts of California's San Joaquin Basin contains an
estimated mean volumes of 21 million barrels of oil, 27 billion cubic feet of gas, and 1
million barrels of natural gas liquids, according to the first USGS assessment of continuous
(unconventional), technically recoverable resources in the Monterey Formation."
"The volume estimated in the new study is small, compared to previous USGS estimates of
conventionally trapped recoverable oil in the Monterey Formation in the San Joaquin Basin.
Those earlier estimates were for oil that could come either from producing more Monterey oil
from existing fields, or from discovering new conventional resources in the Monterey
Formation."
Previous USGS estimates were for conventional oil:
"In 2003, USGS conducted an assessment of conventional oil and gas in the San Joaquin Basin,
estimating a mean of 121 million barrels of oil recoverable from the Monterey. In addition, in
2012, USGS assessed the potential volume of oil that could be added to reserves in the San
Joaquin Basin from increasing recovery in existing fields. The results of that study suggested
that a mean of about 3 billion barrels of oil might eventually be added to reserves from
Monterey reservoirs in conventional traps, mostly from a type of rock in the Monterey called
diatomite, which has recently been producing over 20 million barrels of oil per year."
I am corrected, RE; USGS and Monterrey. I still don't believe there is 20G BO in the Wolfcamp.
Most increases in PB DUC's are not wells awaiting frac's but lower Wolfcamp wells that are TA
and awaiting re-drills; that should tell you something. With acreage, infrastructure and water
costs in W. Texas, wells cost $8.5-9.0M each. The shale industry won't admit that, but that's
what I think. What happens to EUR's and oil prices after April of 2017 is a guess and a waste
of time, sorry.
What most interests me are suggestions that there is so much available oil in Wolfcamp and what
that will do to oil prices and national policy.
Seems like any announcement of more oil will likely keep prices low. And if they stay low,
there's little reason to open up more areas for oil drilling.
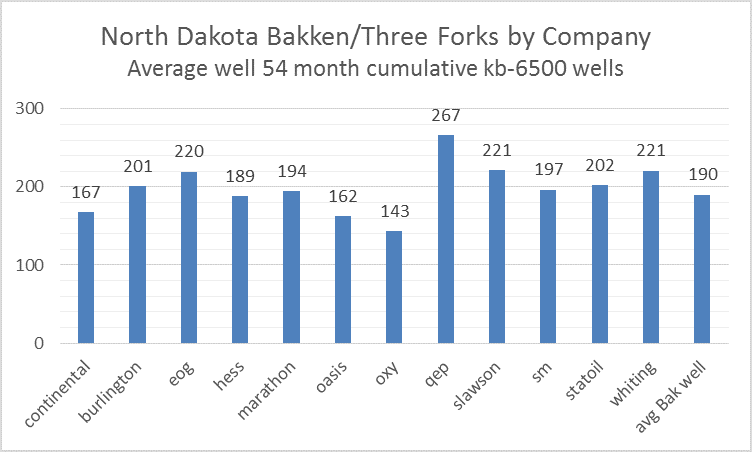
"Their assessment method for Bakken was pretty simple – pick a well EUR, pick a well
spacing, pick total acreage, pick a factor for dry holes – multiply a by c by d and
divide by b."
USGS estimates for average well EUR in Wolfcamp shale look reasonable: 167,ooo barrels in the
core areas and much lower in other parts of the formation.
I do not know if the estimated potential production area is too big, or assumed well spacing
is too tight.
The key question is what part of these estimated technically recoverable resources are
economically viable at $50; $60; $70; $80; $90, $100, etc.
Significant part of resources may never be developed, even if they are technically
recoverable.
Keep in mind these USGS estimates are for undiscovered TRR, one needs to add proved reserves
times 1.5 to get 2 P reserves and that should be added to UTRR to get TRR. There are roughly 3
Gb of 2P reserves that have been added to Permian reserves since 2011, if we assume most of
these are from the Wolfcamp shale (not known) then the TRR would be about 23 Gb. Note that
total proved plus probable reserves at the end of 2014 in the Permian was 10.5 Gb (7 Gb proved
plus 3.5 GB probable with the assumption that probable=proved/2). I have assumed about 30% of
total Permian 2P reserves is in the Wolfcamp shale. That is a WAG.
Note the median estimate is a UTRR of 19 Gb with F95=11.4 Gb and F5=31.4 Gb. So a
conservative guess would be a TRR of 13.4 Gb= proved reserves plus F95 estimate. If prices go
to $85/b and remain at that level the F95 estimate may become ERR, at $100/b maybe the median
is potentially ERR. It will depend how long prices can remain at $100/b before an economic
crash, prices are Brent Crude price in 2016$ with various crude spreads assumed to be about
where they are now.
Dennis,
where your number for proven reserves in the Permian comes from?
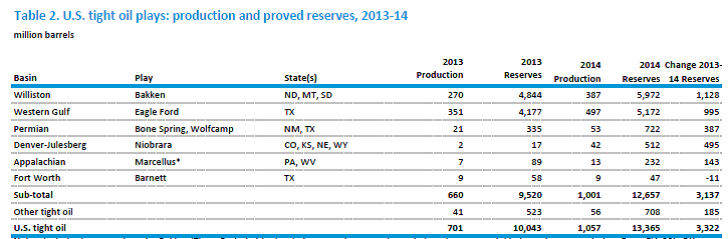
In November 2015, the EIA estimated proven reserves of tight oil in Wolfcamp and Bone Spring
formations as of end 2014 at just 722 million barrels.
I just looked at Permian Basin crude reserves (Districts 7C, 8 and 8A) and assumed the
change in reserves from 2011 to 2014 was from the Wolfcamp. I didn't know about that page for
reserves. It is surprising it is that low.
In any case the difference is small relative to the UTRR, it will be interesting to see what
the reserves are for year end 2015.
Based on this I would revise my estimate to 20 Gb for URR with a conservative estimate of 12
Gb until we have the data for year end 2015 to be released later this month.
My guess is that the USGS probably already has the 2015 year end reserve data.
The EIA proved reserves estimate for 2015 will be issued this month. I think we will see a
significant increase in the number for the Permian basin LTO.
Also note that USGS TRR estimate is only for Wolfcamp.
I can only guess what could be their estimate for the whole Permian tight oil reserves.
But the share of Wolfcamp in the Permian LTO output is only 24% (according to the
EIA/DrillingInfo report).
That makes sense. I also imagine the USGS focused on the formation with the bulk of the
remaining resources. It is conceivable that the 30 Gb estimate is closer to the remaining oil
in place and that more like 90% of the TRR is in the Wolfcamp, considering that the F5 estimate
is about 30 Gb. That older study from 2005 may be an under estimate of TRR for the Permian,
likewise the USGS might have overestimated the UTRR.
If oil prices go back to $100/b in 2018 as the IEA seems to be concerned about, it could
ramp up at the speed of the Eagle Ford (say 2 to 3 years). It will be oil price dependent and
perhaps they won't over do it like in 2011-2014, but who knows, some people don't learn from
past mistakes. If you or Mike were running things it would be done right, but the LTO guys, I
don't know.
"This estimate is for continuous (unconventional) oil, and consists of undiscovered,
technically recoverable resources.
Undiscovered resources are those that are estimated to exist based on geologic knowledge and
theory, while technically recoverable resources are those that can be produced using currently
available technology and industry practices. Whether or not it is profitable to produce these
resources has not been evaluated."
If it requires slave labor at gunpoint to get the oil out, then that's what will happen
because you MUST have oil, and a day will soon come when that sort of thing is reqd.
Nice apocalyptic vision of the future you've got there!
Whatever happened to the ideals of democracy, capitalism, business, profits, free markets
etc ? Don't worry, no need to answer, that was purely a rhetorical question. I'm quite aware of
the realities of the world!
However, not to pour too much sand on your vision, But I have to wonder? Since your
potential slaves in 21st century America are already armed to the teeth, they might decide not
to just go with the flow. (pun intended)
Anyways slaves don't buy cars or too many consumer goods so that might, in and of itself,
put a bit of a damper on the raison d'etre, excuse my french, of the oil companies and the very
existence of these future slave owners.
because you MUST have oil
Really now?! You know, as time goes by, I'm less and less convinced of that!
This follows on from reserve post above (two a couple of comments). In terms of changes over
the last three years – there really weren't anything much dramatic. We'll see what 2016
brings, especially for ExxonMobil, but it looks like they already knocked a big chunk off of
their Bitumen numbers already in 2015.
Note I went through a lot of 20-F and 10-K reports watching the rain fall this morning and
copied out the numbers, I'm not guaranteeing I got everything 100%, but I think the general
trends are shown.
Note the figures are totals for all nine companies I looked at.
IEA WEO is out: http://www.iea.org/newsroom/news/2016/november/world-energy-outlook-2016.html
presentation slides, fact sheet and summary are available online (report can be purchased). IEA
seems to be _very_ concerned about underinvestment in upstream oil production. Several pages of
the report is devoted to this, the title of that section is "mind the gap". More or less all of
the content has been discussed on this website, including the issue with high levels of debt
and that this can affect suppliers' capacity to rebound, and how much demand can be reduced as
a result of a stringent carbon cap.
From the fact sheet (available free of charge):
"Another year of low upstream oil investment in 2017 would risk a shortfall in oil production
in a few years' time. The conventional crude oil resources (e.g. excluding tight oil and oil
sands) approved for development in 2015 sank to the lowest level since the 1950s, with no sign
of a rebound in 2016. If there is no pick-up in 2017, then it becomes increasingly unlikely
that demand (as projected in our main scenario) and supply can be matched in the early 2020s
without the start of a new boom/bust cycle for the industry"
Presentation 1:09 – Dr. Birol gives his view: "depletion never sleeps"
I wonder who that paragraph is aimed at. As I indicated above the companies that would be
investing in long term conventional projects don't have a very large inventory of undeveloped
reserves (17 Gb as of end of 2015, some of this has gone already this year and more is in
development and will come on stream in 2017 and 2018 (and a small amount in later years for
approved projects). I'd guess there might only be less than 10 Gb (and this the most expensive
to develop) that is currently under appraisal among the major western IOCs and larger
independents; allowing for their partnerships with NOCs in a lot of the available projects that
could represent 20 to 30 Gb total. That really isn't very much new supply available, and a
large proportion is in complex deep water projects that wouldn't be ramped up fully until 6 to
7 years after FID (i.e. already too late for 2020). Really the main players need to find new
fields with easy developments, but they obviously aren't, probably never will, and actually
aren't looking very hard at the moment.
My interpretation is that this is IEAs way of saying that it does not look good. Those who can
read between the lines get the message. Also, a few years from they will be able to say "see we
told you so".
It's impossible for IEA to make statements like: "the end of low cost oil will negatively
affect economic growth", "geology is about to beat human ingenuity" etc.
WEO have become more and more bizarre over the years. On the one hand they contain
quantitative projections which tell the story politicians wants to hear. On the other hand, the
text describes all sorts of reason of why the assumptions are unlikely to hold. Normally, if
you don't believe in your own assumptions you would change them.
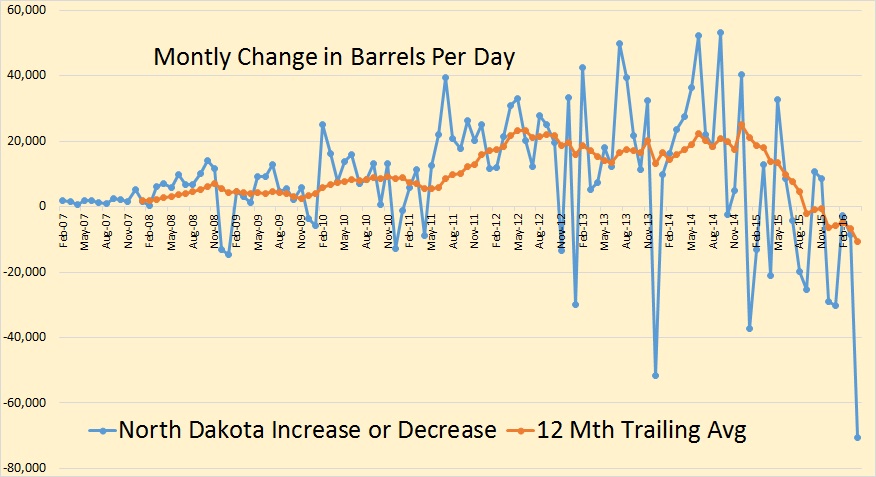
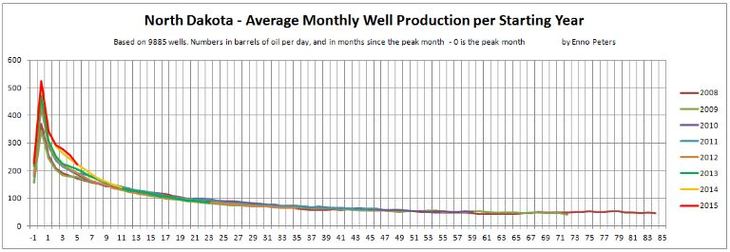
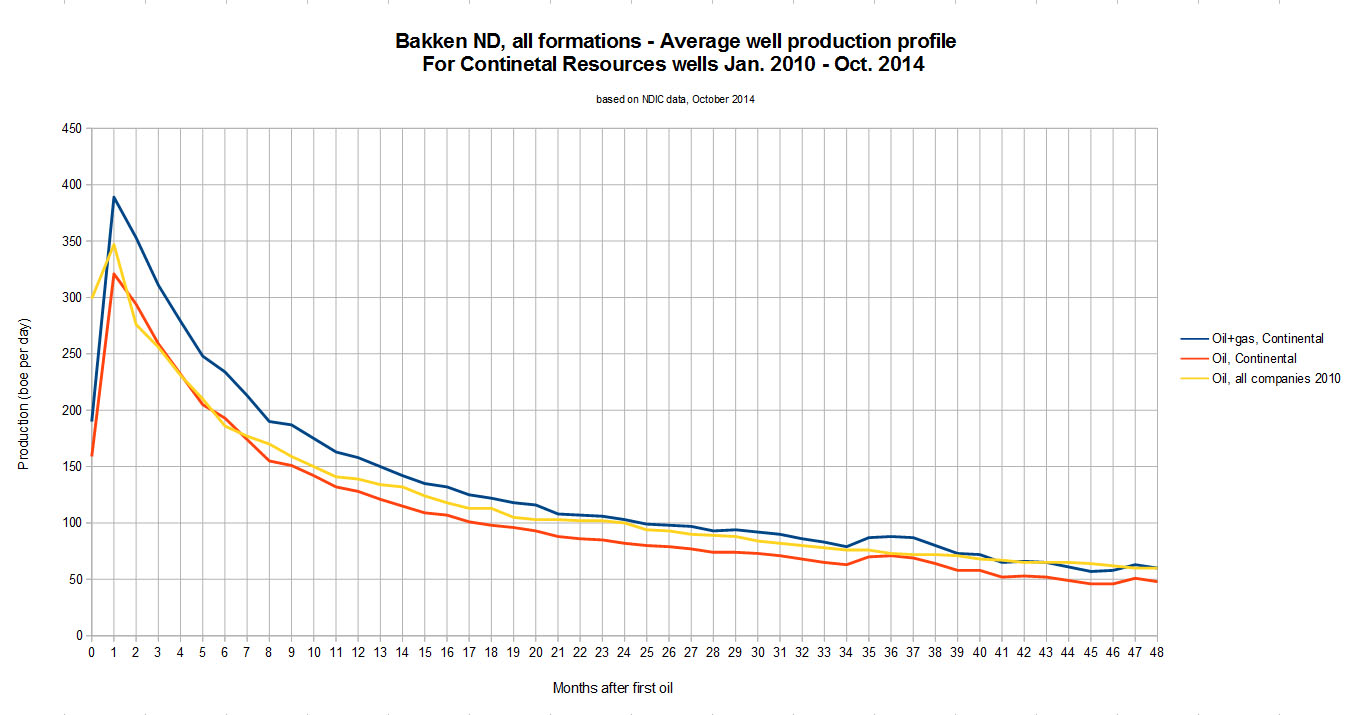
Here is the production graph. Not that much has happened. There was a big drop for 2011. 2009
on the other hand saw an increase. Up to the left, which is very hard to see, 2015 continues to
follow 2014 which follows 2013 which follows 2012. Will we see 2013 reach 2007 the next few
months?
Its on purpose both because I wanted to zoom in and because the data for first 18 months or so
for the method I used above is not very usable. Bellow is the production profile which is
better for seeing differences the first 18 months. Above graph is roughly 6 months ahead of the
production profile graph.
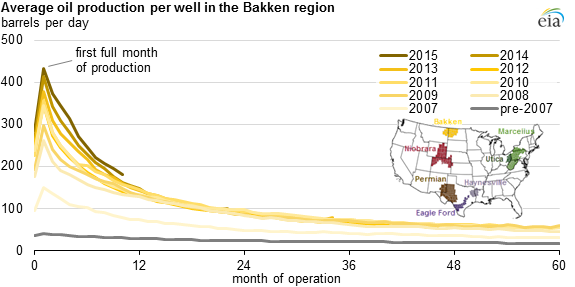
And I guess we can all see no technological breakthru. 2014's green line looks superior to
first 3 mos 2015.
2016 looks like it declines to the same level about 2.5 mos later, but is clearly a steeper
decline at that point and is likely going to intersect 2014's line probably within the
year.
There is zero evidence on that compilation of any technological breakthrough surging output
per well in the past 2-3 yrs.
In fact, they damn near all overlay within 2 yrs. No way in hell there is any spectacular
EUR improvement.
And . . . in the context of the moment, nope, no evidence of techno breakthrough. But also
no evidence of sweetspots first.
I suppose you could contort conclusions and say . . . Yes, the sweetspots were first - with
inferior technology, and then as they became less sweet the technological breakthroughs brought
output up to look the same.
clarifying, the techno breakthrus are bogus. They would show in that data if they were real.
And it would be far too much coincidence for techno breakthrus to just happen to increase
flow the exact amount lost from exhausting sweet spots.
This suggests the sweetspot theory is also bogus, unless there are 9 years of them, meaning
it's ALL been sweetspots so far. 9 yrs of sweetspots might as well be called just normal rather
than sweet.
It is pretty much all bogus, yes, Watcher. With any rudimentary understanding of volumetric
calculations of OOIP in a dense shale like the Bakken, there is only X BO along the horizontal
lateral that might be "obtained" from stimulation. More sand along a longer lateral does not
necessarily translate into greater frac growth (an increase in the radius around the horizontal
lateral). Novices in frac technology believe in halo effects, or that more sand equates to
higher UR of OOIP per acre foot of exposed reservoir. That is not the case; longer laterals
simply expose more acre feet of shale that can be recovered. Recovery factors in shale per acre
foot will never exceed 5-6%, IMO, short of any breakthroughs in EOR technology. That will take
much higher oil prices.
Its very simple, actually bigger fracs (that cost lots more money!!) over longer laterals
result in higher IP's and higher ensuing 90 day production results. That generates more cash
flow (imperative at the moment) and allows for higher EUR's that translate into bigger booked
reserve assets. More assets means the shale oil industry can borrow more money against those
assets. Its a game, and a very obvious one at that. Nobody is breaking new ground or making big
strides in greater UR. That's internet dribble. Freddy is right; everyone in the shale biz is
pounding their sweet spots, high grading as they call it, and higher GOR's are a sure sign of
depletion. Moving off those sweet spots into flank areas will be even less economical (if that
is possible) and will result in significantly less UR per well. That is what is ridiculous
about modeling the future based on X wells per month and trying to determine how much
unconventional shale oil can be produced in the US thru 2035. The term, "past performance is
not indicative of future results?" We invented that phrase 120 years ago in the oil
business.
That, sir, is pretty much the point. I see what looks like about 20% IP increase for the extra
stages post 2008/9/10. How could there not be going from 15 stages to 30+?
I see NO magic post peak. They all descend exactly the same way and by 18-20 months every
drill year is lined up. That's actually astounding - given 15 vs 30 stages. There should be
more volume draining on day 1 and year 2, but the flow is the same at month 20+ for all drill
years. This should kill the profitability on those later wells because 30 stages must cost
more.
But profit is not required when you MUST have oil.
Freddy, is there something going on in the data? How can 30 stage long laterals flow the
same at production month 24 as the earlier dated wells at their production month 24
–whose lengths of well were MUCH shorter?
I can only speculate why the curves look like they do. It could be that the newer wells would
have produced more than the older wells, but closer well spacing is causing the UR to go down.
Here is the updated yearly decline rate graph. 2010 has seen increased decline rates as I
suspected. The curves are currently gathering in the 15%-20% range.
2007 only has 161 wells. So it makes the production curve a bit noisy as you can see above.
Current yearly decline rate for 2007 is 7,2% and the average from month 98 to 117 would
translate to a 10,3% yearly decline rate. The 2007 curve look quite different from the other
curves, so thats why I did not include it.
Thanks. The 2008 wells were probably refracked so that curve is messed up. If we ignore
2008, 2007 looks fairly similar to the other curves (if we consider the smoothed slope.) I
guess one way to do it would be to look at the natural log of monthly output vs month for each
year and see where the curve starts to become straight indicating exponential decline. The
decline rates of many of the curves look similar through about month 80 (2007, 2009, 2010,
2011) after 2011 (2012, 2013, 2014) decline rates look steeper, maybe poor well quality or
super fracking (more frack stages and more proppant) has changed the shape of the decline
curve. The shape is definitely different, I am speculating about the possible cause.
2007 had much lower initial production and the long late plateau gives it a low decline rate
also. But yes, initial decline rates look similar to the other curves. If you look at the
individual 2007 wells then you can see that some of them have similar increases to production
as the 2008 wells had during 2014. I have not investigated this in detail, but it could be that
those increases are fewer and distributed over a longer time span than 2008 and it is what has
caused the plateau. If that is the case, then 2007 may not be different from the others at and
we will see increased decline rates in the future.
Regarding natural log plots. Yes it could be good if you want to find a constant exponential
decline. But we are not there yet as you can see in above graph.
One good reason why decline rates are increasing is because of the GOR increase. When they
pump up the oil so fast that GOR is increasing, then it's expected that there are some
production increases first but higher decline rates later. Perhaps completion techniques have
something to do with it also. Well spacing is getting closer and closer also and is definitely
close enough in some areas to cause reductions in UR. But I would expect lower inital
production rather than higher decline rates from that. But maybe I´m wrong.
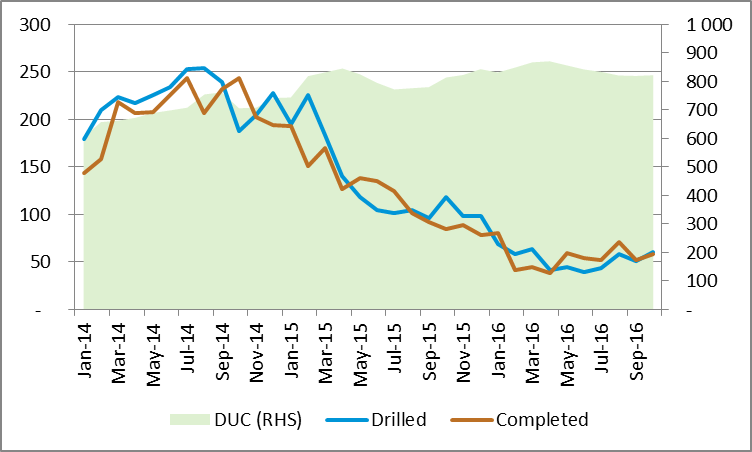
Ok Enno's data from NDIC shows 73 well completions in North Dakota in Sept 2016, 33 were
confidential wells, if we assume 98% of those were Bakken/TF wells that would be 72 ND
Bakken/TF wells completed in Sept 2016.
I have 75 in my data, so about the same. They have increased the number of new wells quite alot
the last two months. It looks like the addtional ones mainly comes from the DUC backlog as it
increased withouth the rig count going up. But I see that the rig count has gone up now too.
Ron you say " Bakken production continues to decline though I expect it to level off soon."
A few words of wisdom as to the main reasons why it would level off? Price rise?
Even though you asked Ron. He might think that the decline in the number of new wells per
month may have stabilized at around 71 new wells per month. If that rate of new completions per
month stays the same there will still be decline but the rate of decline will be slower.
Scenario below shows what would happen with 71 new wells per month from Sept 2016 to June 2017
and then a 1 well per month increase from July 2017 to Dec 2018 (89 new wells per month in Dec
2018).
I am not so convinced that either Texas or the Bakken is finished declining at the current
level of completions. There was consistent completions of over 1000 wells in Texas until about
October of 2015. Then it dropped to less than half of that. The number of producing wells in
Texas peaked in June of this year. Since then, through October, it has decreased by roughly
1000 wells a month. The Texas RRC reports are indicating that they are still plugging more than
they are completing.
I remember reading one projection recently for what wells will be doing over time in the Eagle
Ford. They ran those projections for a well for over 22 years. Not sure which planet we are
talking about, but in Texas an Eagle Ford does well to survive 6 years. They keep referring to
an Eagle Ford producing half of what they will in the first two years. In most areas, I would
say that it is half in the first year.
The EIA, IEA, Opec, and most pundits have the US shale drilling turning on a dime when the oil
price reaches a certain level. If it was at a hundred now, it would still take about two years
to significantly increase production, if it ever happens. I am not a big believer that US shale
is the new spigot for supply.
The wells being shut in are not nearly as important as the number of wells completed because
the output volume is so different. So the average well in the Eagle Ford in its second month of
production produces about 370 b/d, but the average well at 68 months was producing 10 b/d. So
about 37 average wells need to be shut in to offset one average new well completion.
Point is that total well counts are not so important, it is well completions that drive
output higher.
Output is falling because fewer wells are being completed. When oil prices rise and profits
increase, completions per month will increase and slow the decline rate and eventually raise
output if completions are high enough. For the Bakken at an output level of 863 kb/d in Dec
2017 about 79 new wells per month is enough to cause a slight increase in output. My model
slightly underestimates Bakken output, for Sept 2016 my model has output at 890 kb/d, about 30
kb/d lower than actual output (3% too low), my well profile may be slightly too low, but I
expect eventually new well EUR will start to decrease and my model will start to match actual
output better by mid 2017 as sweet spots run out of room for new wells.
Guess I will remember that for the future. The number of producing wells is not important.
Kinda like I got pooh poohed when I said the production would drop to over 1 million barrels
back in early 2015.
Do you agree that the shut in wells tend to be low output wells? So if I shut down 37 of
those but complete one well the net change in output is zero.
Likewise if I complete 1000 wells in a year, I could shut down 20,000 stripper wells and the
net change in output would be zero, but there would be 19,000 fewer producing wells, if we
assume the average output of the 1000 new wells completed was 200 b/d for the year and the
stripper wells produced 10 b/d on average.
How much do you expect output to fall in the US by Dec 2017?
Hindsight is 20/20 and lots of people can make lucky guesses. Output did indeed fall by
about 1 million barrels per day from April 2015 to July 2016, can you point me to your comment
where you predicted this?
Tell us what it will be in August 2017.
I expected the fall in supply would lead to higher prices, I did not expect World output to
be as resilient as it has been and I also did not realize how oversupplied the market was in
April 2015. In Jan 2015 I expected output would decrease and it increased by 250 kb/d from Jan
to April, so I was too pessimistic, from Jan 2015 (which is early 2015) to August 2016 US
output has decreased by 635 kb/d.
If you were suggesting World output would fall from Jan 2015 levels by 1 Mb/d, you would
also have been incorrect as World C+C output has increased from Feb 2015 to July 2016 by 400
kb/d. If we consider 12 month average output of World C+C, the decline has been 340 kb/d from
the 12 month average peak in August 2015 (centered 12 month average).
The dropping numbers are not as much from the wells that produce less than 10 barrels a day,
but from those producing greater than 10, but less than 100. The ones producing greater than
100 are remaining at a consistent level over 9000 to 9500. The prediction on one million was as
to the US shale only. It is your site, you can search it better than I can,
But then don't take my word for it. You can find the same information under the Texas RRC site
under oil and gas/research and statistics/well distribution tables. Current production for Sep
can be found at online research queries/statewide. It is still dropping, and will long term at
the current activity level. Production drop for oil, only, is a little over 40k per day
barrels, and condensate is lower for September. Proofs in the pudding.
My guess is that you would see a lot more plugging reports, if it were not so expensive to plug
a well. At net income levels where they are, I expect they would put that off as long as they
could.
I trust the NDIC numbers much more than the EIA numbers which are based on a model. Enno
Peters data has 66 completions in August 2016, he has not put up his post for the Sept data yet
so I am using the Director's estimate for now. I agree his estimate is usually off a bit, Enno
tends to be spot on for the Bakken data, for Texas he relies on RRC data which is not very
good.
Dennis. Someone pointed out Whiting's Twin Valley field wells being shut in for August.
It appears this was because another 13 wells in the field were recently completed.
It appears that when all 29 wells are returned to full production, this field will be very
prolific initially. Therefore, on this one field alone, we could see some impact for the entire
state.
Does anyone know if these wells are part of Whiting's JV? Telling if they had to do that on
these strong wells. Bakken just not close to economic.
I also note that average production days per well in for EOG in Parshall was 24. I haven't
looked at some of the other "older" large fields yet, but assume the numbers are similar.
I agree higher prices will be needed in the Bakken, probably $75/b or more. To be honest I
don't know why they continue to complete wells, but maybe it is a matter of ignoring the sunk
costs in wells drilled but not completed and running the numbers based on whether they can pay
back the completion costs. Everyone may be hoping the other guys fail and are just trying to
pay the bills as best they can, not sure if just stopping altogether is the best strategy.
There is the old adage that when your in a hole, more digging doesn't help much.
So my model just assumes continued completions at the August rate for about 12 months with
gradually rising prices as the market starts to balance, then a gradual increase in completions
as prices continue to rise from July 2017($78/b) to Dec 2018 (from 72 completions to about 90
completions per month 18 months later). At that point oil prices have risen to $97/b and LTO
companies are making money. Prices continue to rise to $130/b by Oct 2020 and then remain at
that level for 40 years (not likely, but the model is simplistic).
I could easily do a model with no wells completed, but I doubt that will be correct.
Suggestions?
Dennis. As we have discussed before, tough to model when there is no way to be accurate
regarding the oil price.
I continue to contend that there will be no quick price recovery without an OPEC cut.
Further, the US dollar is very important too, as are interest rates.
At some point OPEC may not be able to increase output much more and overall World supply
will increase less than demand. My guess is that this will occur by mid 2017 and oil prices
will rise. OPEC output from Libya an Nigeria has recovered, but this can only go so far, maybe
another 1 Mb/d at most. I don't expect any big increases from other OPEC nations in the near
term.
A big guess as to oil prices has to be made to do a model.
I believe my guess is conservative, but maybe oil prices will remain where they are now
beyond mid 2017.
I expected World supply to have fallen much more quickly than has been the case at oil
prices of $50/b.
"EIA does this by using a relatively new dataset-FracFocus.org's national fracking chemical
registry-to identify the completion phase, marked by the first fracking. If a well shows up on
the registry, it's considered completed "
There is an unlikely peak oil related editorial writer hiding in the most unlikely place: a
weekly English business paper called Capital Ethiopia. The latest editorial is again putting an
excellent perspective on world events. http://capitalethiopia.com/2016/11/15/system-failure/#.WC1ZCvl9600
For the record, I have no interest or connection to this publication other than that of a
paying reader.
Wouldn't it be nice if mainstream publications would sound a bit more like this.
Thanks all. I thought that the red queen concept meant that there had to be an increase in the
rate of completions. So that 71 year-on-year in north Dakota would only stabilise temporarily.
Perhaps the loss of sweet spots are being counteracted by the improvements in technology? I'm
assuming that even with difficulties of financing there will be a swift increase in completions
should the oil price take off, but not sure how sustainable this would be
Sometimes I think that once the price of oil is up enough that sellers can hedge the their
selling price for two or three years at a profitable level, it will hardly matter what the
banks have to say about financing new wells.
At five to ten million apiece, there will probably be plenty of money coming out of various
deep pockets to get the well drilling ball rolling again, if the profits look good.
Sometimes the folks who think the industry will not be able to raise money forget that it's
not a scratch job anymore. The land surveys, roads, a good bit of pipeline, housing, leases,
etc are already in place, meaning all it takes to get the oil started now is a drill and frack
rig.
I don't know what the price will have to be, but considering that a lot of lease and other
money is a sunk cost that can't be recovered, and will have to be written off, along with the
mountain of debts accumulated so far, the price might be lower than a lot of people
estimate.
Bankruptcy of old owners results in lowering the price at which an old business makes money
for its new owners.
The Red Queen effect is that more and more wells need to be completed to increase
output. As output decreases fewer wells are needed to maintain output. So at 1000 kb/d output
it might require 120 wells to be completed to maintain output (if new well EUR did not
eventually decrease), but at 850 kb/d it might require about 78 new wells per month to maintain
output.
I think your numbers reflect numbers reported from ND DMR but Bloomberg might be closer to
reality for wells that will actually ever be completed (just a guess by me though). How do
Bloomberg get their numbers (e.g. removing Tight Holes, or removing old wells, not counting
non-completed waivers etc.)?
Yes indeed. The difficulty with DUCs is always, which wells do you count. I don't filter old
wells for example, and already include those that were spud last month (even though maybe
casing has not been set). I don't do a lot of filtering, so the actual # wells that really can
be completed is likely quite a bit lower. I see my DUC numbers as the upper bound. I don't know
Bloombergs method exactly, so I can't comment on that.
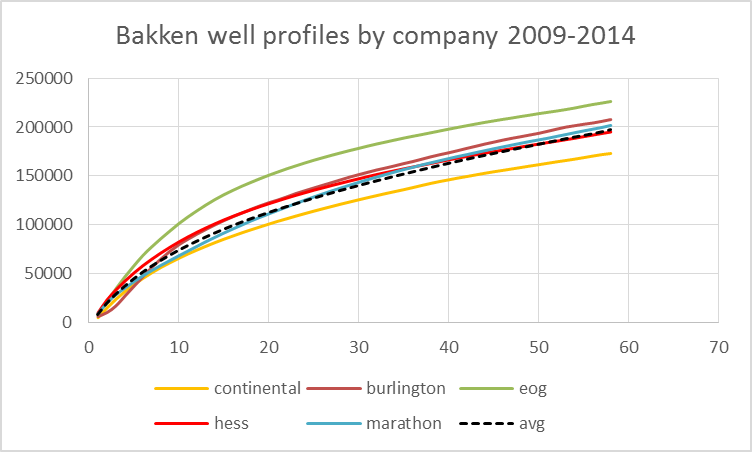
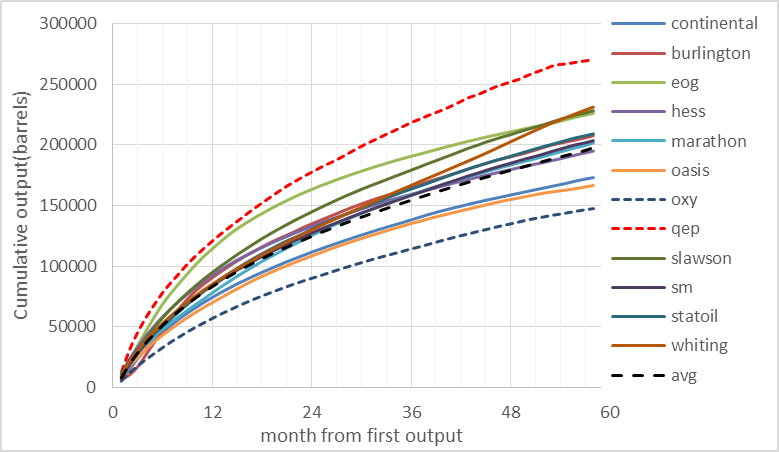
Concerning Freddy's chart of production profile of wells drilled in various years.
They all line up by about month 18 of production. This should not be possible. The later
wells have many more stages of frack. They are longer, draining more volume of rock. But the
chart says what it says. At month about 18 the 2014 wells are flowing the same rate as 2008
wells. We know stage count has risen over those 6 yrs. 2014 wells should flow a higher rate.
The shape of the curve can be the same, but it should be offset higher.
Explanation?
How about above ground issues . . . older wells get pipelines and can flow more oil . . .
nah, that's absurd.
There needs to be a physical explanation for this.
These new wells have higher IPs, but also higher decline rates.
Closer spacing (see Freddy's comment above) and depletion of the sweet spots may also impact
production curves and EURs.
That doesn't make sense. They are longer. By a factor of 2ish. How can a 6000 foot lateral flow
exactly the same amount 2 yrs into production as a 3000 foot lateral flows 2 yrs into
production?
Look at the lines. At 18 months AND BEYOND, these longer laterals flow the same oil rate as
the shorter laterals did at the same month number of production. Higher IP and higher decline
rate will affect the shape, but There Is Twice The Length..
I don't think we have information on the length of the wells, since 2008 the length of the
lateral has not changed, just the number of frack stages and amount of proppant. This seems to
primarily affect the output in the first 12 to 18 months, and well spacing and room in the
sweet spots no doubt has some effect (offsetting the greater number of frack stages etc.).
The combination of longer lateral lengths and advancements in completion technology has
allowed operators to increase the number of frac stages during completions and space them
closer together. The result has been a higher completion cost per well but with increased
production and more emphasis on profitability.
In the past five years, DTC Energy Group completion supervisors in the Bakken have helped
oversee a dramatic increase from an average of 10 stages in 2008 to 32 stages in 2013. Even
40-stage fracs have been achieved.
One of the main reasons for this is the longer lateral lengths – operators now have
twice as much space to work with (10,000 versus 5,000 feet along the lateral). Frac stages are
also being spaced closer together, roughly 300 feet apart as compared to spacing up to 800 feet
in 2008, as experienced by DTC supervisors.
By placing more fracture stages closer together, over a longer lateral length, operators
have successfully been able to improve initial production (IP) rates, as well as increase EURs
over the life of the well.
blah blah, but they make clear the years have increased length. Freddy was talking about
well spacing, this text is about stage spacing, but that is achieved because of lateral
length.
Freddy can you revisit your graph code? It's just bizarre that different length wells have
the same flow rate 2 yrs out, and later.
Take a look at Enno´s graphs at https://shaleprofile.com/ . They look the same as my graphs and
we have collected and processed the data independently from each other.
If the wells have the same wellbore riser design irrespective of lateral length (i.e. same
depth, which is a given, same bore, same downhole pump) then that section might become the main
bottleneck later in life and not the reservoir rock. With a long fat tail that seems more
likely somehow compared to the faster falling Eagle Ford wells say (but that is just a guess
really). But there may be lots of other nuances, we just don't have enough data in enough
detail especially on the late life performance for all different well designs – it looks
like the early ones are just reaching shut off stage in numbers now. I doubt if the E&Ps
concentrated on later life when the wells were planned – they wanted early production,
and still do, to pay their creditors and company officers bonuses (not necessarily in that
order).
Hmmm. I know it is speculation, but can you flesh that out?
If some bottleneck physically exists that defines a flow rate for all wells from all years
then that does indeed explain the graphs, but what such thing could exist that has a new number
each year past year 2?
We certainly have discussed chokes for reservoir/EUR management, but the same setting to
define flow regardless of length?
The flow depends on the available pressure drop, which is made up of friction through the rock
and up the well bore (plus maybe some through the choke but not much), plus the head of the
well, plus a negative number if there is a pump. The frictional and pump numbers depend on the
flow and all the numbers depend on gas-oil ratio. Initially there is a big pressure drop in the
rock because of the high flow, then not so much. Once the flow drops the pressure at base of
the well bore just falls as a result of depletion over time, the effect of the completion
design is a lot less and lost in the noise, so all the wells behave similarly. That's just a
guess – I have never seen a shale well and never run a well with 10 bpd production,
conventional or anything else.
A question might be if the flow is the same why doesn't the longer well with the bigger
volume deplete more slowly, and I don't know the answer. It may be too small to notice and lost
in the noise, or to do with gas breakout dominating the pressure balance, or just the way the
the physics plays out as the fluids permeate through the rock, or we don't have long enough
history to see the differences yet.
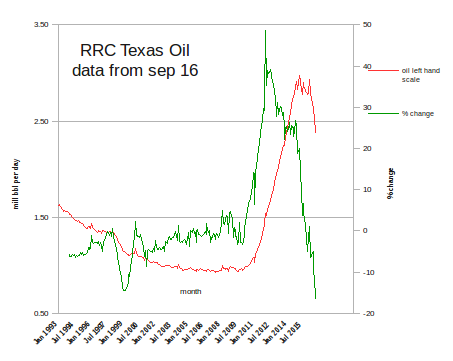
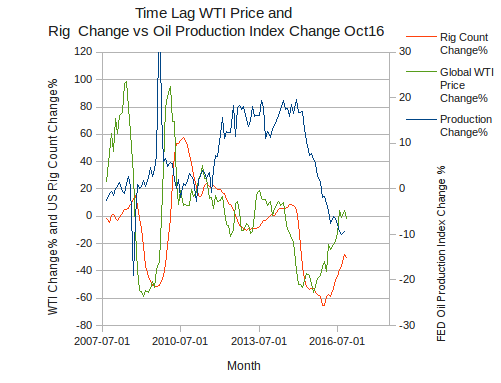
RRC Texas for September came out recently. As others will probably elaborate more on the data,
I just want to show if year over year changes in production could be use as a predictive tool
for future production (see below chart).
It is obvious that year over year changes (green line) beautifully predicted oil production
(red line) at a time lag of about 15 month. Even when production was still growing, the steep
decline of growth rate indicated already the current steep decline.
The interesting thing is that the year over year change is a summary indicator. It does not
tell why production declines or rises. It can be the oil price, interest rates or just
depletion – even seasonal factors are eliminated. It just shows the strength of a
trend.
I am curious myself how this works out. The yoy% indicator predicts that Texas will have
lost another million bbl per day by end next year. That sounds quite like a big plunge. One
explanation could be the fact that we have now low oil prices and high interest rates. In all
other cycles it has been the other way around: low oil prices came hand in hand with low
interest rates. This could be now a major obstacle for companies to grow production.
This concept of following year over year changes works of course just for big trends, yet
for investment timing it seems exactly the right tool. Another huge wave is coming in electric
vehicles which are growing in China by 120% year over year. Here we have the same situation as
for shale 7 years ago: Although current EV sales are barely 1 million per year worldwide, the
growth rate reveals already an huge wave coming. So as an investor it is always necessary to
stay ahead of the trend and I think this can be done by observing the year over year%
change.
Big trouble is brewing in the mighty North Dakota Bakken Oil Field. While oil production in
the Bakken has reversed since it bottomed in 2016 and increased over the past few years, so has
the amount of by-product wastewater. Now, it's not an issue if water production increases along
with oil. However, it's a serious RED FLAG if by-product wastewater rises a great deal more
than oil.
And... unfortunately, that is exactly what has taken place in the Bakken over the past two
years. In the oil industry, they call it, the rising "Water Cut." Furthermore, the rapid
increase in the amount of water to oil from a well or field suggests that peak production is at
hand . So, now the shale companies will have an uphill battle to try to increase or hold
production flat as the water cut rises.
According to the North Dakota Department of Mineral Resources, the Bakken produced 201
million barrels of oil in the first six months of 2018. However, it also produced a stunning
268 million barrels of wastewater:
Thus, the companies producing shale oil in the Bakken had to dispose of 268 million barrels
of by-product wastewater in just the first half of the year. I have spoken to a few people in
the industry, and the estimate is that it cost approximately $4 a barrel to gather, transport
and dispose of this wastewater. Which means, the shale companies will have to pay an estimated
$2.2 billion just to get rid of their wastewater this year.
Now, some companies may be recycling their wastewater, but this isn't free. Actually, I have
seen estimates that it cost more money to recycle wastewater than it does to simply dispose of
it. So, as the volume of wastewater increases while the percentage of oil production declines,
then the shale companies are hit with a double-whammy... less oil revenue and rising wastewater
disposal costs.
To give you an idea just how much more water is being produced versus oil in the Bakken, I
went back to the North Dakota Department of Mineral Resources and looked at their data back to
2015. Unfortunately, the data published in excel only goes back to 2015, even though they have
figures published in PDF form starting in 2003.
Regardless, four years is plenty of time to show just how bad the situation is becoming in
the Bakken. In June 2015, the North Dakota Bakken produced 16% more water than oil. However
June this year, the Bakken field produced 38% more water than oil :
You will notice that overall oil and water production declined in 2016, due to the falling
oil price, but as production grew in 2017 and 2018, the percentage increase of by-product
wastewater surged to 32% and 38% respectively. Here is an interesting comparison:
Bakken Oil & Water Production:
June 2015 Oil = 34.4 million barrels
June 2015 Water = 39.8 million barrels (16% more water)
June 2018 Oil = 33.8 million barrels
June 2018 Water = 46.8 million barrels (38% more water)
As we can see, while overall Bakken oil production in June 2018 was less than it was in June
2015, the volume of waster water increased by an additional 7 million barrels.
I believe there are two negative forces at work in the Bakken as it pertains to the rising
volume of wastewater.
As the wells and field age, more water is produced than oil
Larger Frac Stages, which require more water and sand, are now being utilized to keep
production growing or to keep it from falling
While a rising water cut isn't a surprise to the industry as it is a natural progression of
an aging oil well or field, the use of Larger Frac Stage wells should be a WAKE-UP CALL to
investors. Why? Because Larger Frac Stage wells consume a great deal more water and sand to
produce more oil initially, but the decline rates are even more severe than regular shale
wells.
So, when the Investor Relations are bragging how the companies are using the newer
technology of more complex Large Frac Stage wells, this isn't a good sign. This means that the
company is now desperate to try and grow production, or at worst, to keep it from falling.
Unfortunately, the U.S. Shale Industry is in serious trouble. Most of the shale fields have
reached a peak and when production starts to decline, especially during a collapsing oil price,
I forecast a rapid disintegration of the industry. We must remember, as the oil price and oil
production falls, then company stock and asset values will plummet while the high debt levels
remain. Thus, the shale industry will have increasing difficulty in servicing its debt.
I will continue to monitor the production of oil and wastewater in the Bakken. Please check
back for updates.
The completed around 95 according to my data. The is lag in the data on confidential wells
that will show up next month in the final data. Also if the Bakken was to get and hold 1.4
million barrels a day the would need to complete around 1500 wells per year.
"... I have mentioned this before, but SERIOUS TROUBLE will come down hard on the Bakken. Looks like someone hasn't been honest about its production figures. ..."
"... Fireworks will arrive shortly .. hehehe. ..."
I have mentioned this before, but SERIOUS TROUBLE will come down hard on the Bakken. Looks like someone hasn't been honest
about its production figures.
active wells increased by 158 from August to Sept and output increased by 19 kb/d for the Bakken Three Forks to 1055 kb/d.
Only 77 new wells were completed in the North Dakota in August 2017 and output increased that month by 23 kb/d.
They have added over 1,100 Bakken and/or Three Forks wells to boost production back to where it was in March, 2016.
So, conservatively $8 billion spent just to climb back up.
The amount of capital being burned on energy in the USA is truly remarkable.
Dennis, I have seen data that shows the total cost of all "shale" oil and gas wells from maybe 2003 forward, and then the gross
proceeds from same. Very interesting how far from payout the USA wells are, in aggregate.
"... So perhaps Bakken oil production peaked in 2015. But that depends on how many new wells will be added the coming years. ..."
"... Regarding downspacing, it has been a real crapshoot throughout all the shale plays. Operators had been purposefully drilling closer and closer and monitoring results. The biggest influencing factors (among many) seems to be the permeability and brittleness of the rock. ..."
"... Utica operators are back to 1,000 foot spacing while Marcellus operators continue to drill 500′ or less. Again, the thickness of these formations plays a big role as 3 dimension, not 2, come into play. 80% production in offset wells is the commonly quoted figure from several operators, and they seem to be okay with that. ..."
"... Be advised, Bakken operators have recently changed their flowback procedures and early month produced water numbers have skyrocketed. New wells now show 150/200 thousand barrels produced water their first few months online. ..."
Thanks that is really interesting. As most wells in Bakken are 10000 feet long, 500 feet well
spacing would translate into about 5 wells per section in Bakken. As I mentioned some time
ago, the Grail area in McKensey has close to 5 wells per section now. The 2016 wells there
had worse production than previous years and they have almost stopped drilling new wells
there. As there are maybe 1500 well locations left in the sweet spot area of McKensey
(assuming 5 wells per section) and they are adding perhaps 40 wells per month now, it means
that there are only some 3 years of new wells left. But it's not like they will add 40 wells
per month and then suddenly stop.
So more and more wells need to come from outside the sweet spots the coming years. Because
of the red queen phenomena, if new wells start to produce less, then more wells are needed
just to keep total production flat. So perhaps Bakken oil production peaked in 2015. But
that depends on how many new wells will be added the coming years.
One needs to remember the Three Forks formation when doing those kind of calculations.
Some of the higher producing wells in North Dakota these past 2 years targeted the second
bench of the TF.
There have been very few third bench TF wells and, I believe, only a couple targeting the
fourth bench so far.
Regarding downspacing, it has been a real crapshoot throughout all the shale plays.
Operators had been purposefully drilling closer and closer and monitoring results. The
biggest influencing factors (among many) seems to be the permeability and brittleness of the
rock.
Utica operators are back to 1,000 foot spacing while Marcellus operators continue to
drill 500′ or less. Again, the thickness of these formations plays a big role as 3
dimension, not 2, come into play. 80% production in offset wells is the commonly quoted
figure from several operators, and they seem to be okay with that.
BTW, I appreciate the charts you regularly post here.
Be advised, Bakken operators have recently changed their flowback procedures and early
month produced water numbers have skyrocketed. New wells now show 150/200 thousand barrels
produced water their first few months online.
"... Hopefully everyone involved in defending Bakken production upswings will not disappear into the woodwork next month, or the month after, when production drops again. ..."
"... Of course marginal shale oil wells that are at or below economic limits get shut in during winter, or get shut in and stay shut in because workover costs to restore production simply do not make economic sense. ..."
"... Re-frac's cost more money. At $20.00 per barrel net back prices a $2.5-3.0M re-frac requires ANOTHER 137,000 BO to payout. Productivity should never be confused with profitability (or lack thereof); in the end the latter always wins out. ..."
"... A little more time and realized production data will prove that downsizing actually reduced UR per incremental well and was yet another economic disaster in a string of economic disasters for the shale oil industry, the biggest being oversupply and an ensuing 70% drop in product prices. ..."
Hopefully everyone involved in defending Bakken production upswings will not disappear into
the woodwork next month, or the month after, when production drops again.
Of course marginal shale oil wells that are at or below economic limits get shut in during
winter, or get shut in and stay shut in because workover costs to restore production simply do
not make economic sense. There are gazillions of those kinds of well in all three of America's
shale oil basins. There need not be a flush 'uptick' of production when those wells come back
on line (that's investor presentation dribble), in fact it can be just the opposite because of
bubble point/higher water saturations.
Re-frac's cost more money. At $20.00 per barrel net back prices a $2.5-3.0M re-frac requires
ANOTHER 137,000 BO to payout. Productivity should never be confused with profitability (or lack
thereof); in the end the latter always wins out.
Imagine a situation where you are drilling these $6.5M wells so close together (Marathon at
330 feet, toe to toe) that you have to "protect" them by shutting them in for prolonged periods
of time while you frac a new well 3000 feet away. That makes a lot of sense, doesn't it?
A little more time and realized production data will prove that downsizing actually reduced
UR per incremental well and was yet another economic disaster in a string of economic disasters
for the shale oil industry, the biggest being oversupply and an ensuing 70% drop in product prices.
The actual reserve that is being produced in the Bakken was "discovered, undeveloped and developed"
in 2013, and not covered by the USGS. It's difficult to find break out information for individual
areas in most companies reports but I don't think there was more than about 5 Gb developed and
undeveloped reserves in 2013, and it might have declined a bit since then, even including actual
production.
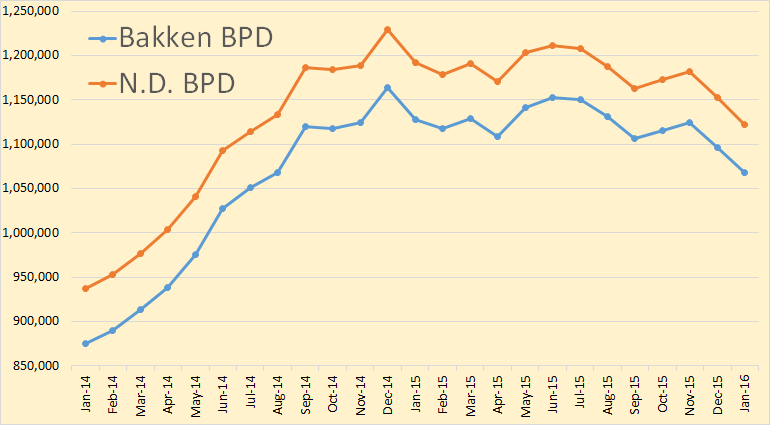
Bakken production down 86,150 barrels per day to 895,330 bpd. North Dakota production
down
92,029 bpd
to 942,455 bpd. It was noted that this the largest decline ever in North Dakota
production. But it should not be overlooked that the October in crease in production was also the
largest ever increase in North Dakota production.
EIA wildly optimistic in Bakken, Gulf and Texas. Their current numbers have
to be way high in relation to what is actually happening. Even Texas RRC
site is not predicting an upturn until current permits and completions get a
lot higher. At $53 oil, it is not happening, or going to happen.
In my view there is simply a cost issue here. If a
well goes from 100 barrels to 20 barrels per day, the mainenance,
operating and transport costs go up fivefold per barrel, even if
they are the same for the well. So, it might not pay off to send a
crew there and pay for transport. Unless, the oil price does not go
up, these wells and many more wells are likely to shut down for a
while.
I saw a recent story about the rise in the cost of fracking to completion
for these DUC wells. Costs are said to have risen to something like $3.2
million in some of the areas where wells need completion. I believe the
Director's Cut said last month there were 86o wells awaiting completion.
If the story I read was true, then it will be around $2.8 billion to
frack those 860 wells. I don't know what the cost of getting a well to
the DUC stage is, but it sure seems a lot of money to have sunk in the
ground for wells that will be outputting just 100 barrel a day after
their first 24 months.
Bruno Verwimp wrote back in 2016, September 16th, " .Hold your breath for
the next winter. It might bring severe decline in oil production in ND
Bakken ."
I wrote at the same time: " FWIW my 'money' is on Verwimp's observation
and model for the Bakken. I for one will be interested to see your chart
next spring!"
Another 3 months will be interesting. By the look of it, it might well be
down to 700,000 bpd in a year if the uncanny accuracy continues. As I
understand it, his chart has nothing in it derived from price.
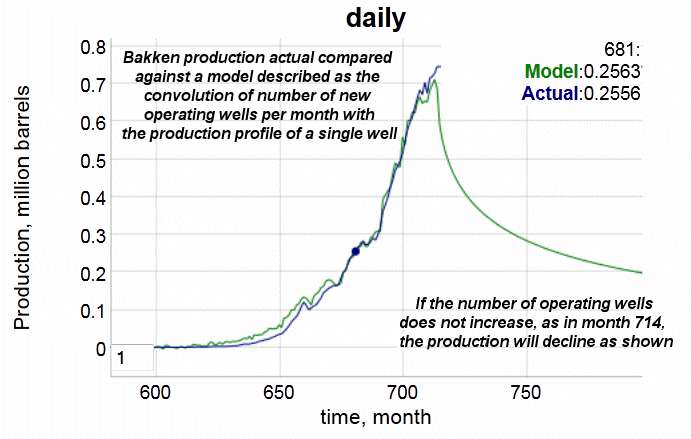
That is correct. Verwimp's model has no oil price input. This is a
serious problem since everybody recognizes that oil price has been
determinant in the current oil situation. Therefore one can only conclude
that Verwimp's model is accurate due to chance, and therefore has no
predicting capability. It will continue to be accurate until it doesn't.
It probably represents oil production decay in the absence of sufficient
economical incentive.
Geology absolutely plays a role, especially when oil
prices are relatively high it is clear which fields are constrained by
geology. When oil prices fall by a factor of 3 or 4 fields that are
not constrained by geology will decline due to economic constraints
(poor profitability.) The Bakken only increased in output due to high
oil prices and a high well completion rate. Eventually geology will be
the reason for Bakken decline, low oil prices clearly are the reason
at present.
In Jan 2018 your model predicts about 680 kb/d for ND Bakken/TF
output. My 61 well model predicts about 818 kb/d in Jan 2018 and the
85 well model predicts 900 kb/d in Jan 2018, I expect ND Bakken/Three
Forks output will be around 825 to 900 kb/d in Jan 2018, with a best
guess of 866 kb/d (847 kb/d in Dec 2018). This corresponds to a 75
well model, chart below.
A big contributor to the legacy oil decline is the unrelenting physics of
fluid phase behavior, with gas becoming more prevalent in the production
stream. Statewide GOR increased from 1200 to 1500:1 cuft/bo in 2015. The
legacy wells will be worse (i.e. the newer wells dampen the effect, which
have an initial GOR of ~ 1000:1). For reference, generally a GOR> 2000:1 is
considered a "gas" well or field.
Most of these LTO fields will eventually be abandoned as gas fields.
note – I tried to post a *.png graph, but the reply tool failed.
Is the 2000 GOR a North Dakota convention? There's no reservoir
engineering reason to designate a depleted well as a gas well when GOR
increases to 2000 scf/bo. Depleted oil wells under depletion drive do
experience very high GORs, but they remain oil wells.
My recall is there's a regulation in Texas that classifies liquids
from a gas well as condensate vs oil from an oil well. Almost
certainly has some tax consequence.
Munger would have us import oil and gas now from OPEC so that we can save
our oil and gas for the future when the world is going to have major
shortages."
The day comes when a firebrand is in control and dares to rock the
societal systemic boat by declaring the price of oil will be non
monetary. You want oil from Russia, America? Disarm. You want oil from
KSA, America? Convert to Islam.
"We have enough of your dollars created from thin air. Let's have
something of real value to us before we send you oil. The price is
described above."
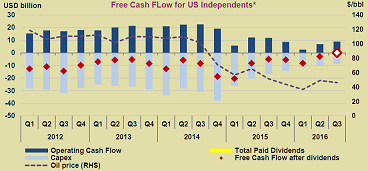
"... Looking at Bakken(ND) as one big project, it has now spent an estimated total of about $36Billion more than generated from net operational cash flows (Jan-09 – Dec-16). To reach pay out for the wells started in 2009-2016 requires an estimated oil price of $65/bo (WTI) starting Jan-17. To get a return of 2.5% (which is, call it, an inflation hedge) on the $36B requires an estimated oil price of $77/bo (WTI). ..."
"... To enable a debt reduction requires a net positive cash flow from operations and the longer it takes before positive cash flow happens, the higher the required oil price becomes to earn some return. ..."
"... Some of this $36B debt has already been written down (also through bankruptcies (Chapter 11s), the business model is not sustainable with low oil prices!), which means that the companies now needs to recover less than the $36B. ..."
"... Write downs/impairments shrinks the affected companies' assets/equities and thus debt carrying capacities. Some make forecasts about future developments without considering the companies' balance sheets. ..."
"... At present oil pries (low/mid 50's) the companies may add an average of 60-70 wells/month from cash from operations, this will likely be a mixture of DUCs and "new" wells. ..."
"... For 2017 I expect companies in Bakken(ND) will continue to spend above what is generated from operations. ..."
To keep the Dec-15 output level from Bakken(ND) through 2016, I estimated this would require
the addition of an average of about 95 wells/month (61 wells/month were added through 2016).
In 2016 an estimated $2.0 – $2.5Billion more than (net) cash flow from operations was spent.
This is about 300 – 350 new wells (spud to flow).
Without this external capital infusion fewer wells would have been brought to flow and thus
a steeper decline in production.
Looking at Bakken(ND) as one big project, it has now spent an estimated total of about
$36Billion more than generated from net operational cash flows (Jan-09 – Dec-16). To reach
pay out for the wells started in 2009-2016 requires an estimated oil price of $65/bo (WTI)
starting Jan-17. To get a return of 2.5% (which is, call it, an inflation hedge) on the $36B
requires an estimated oil price of $77/bo (WTI).
To enable a debt reduction requires a net positive cash flow from operations and the
longer it takes before positive cash flow happens, the higher the required oil price becomes
to earn some return.
Some of this $36B debt has already been written down (also through bankruptcies (Chapter
11s), the business model is not sustainable with low oil prices!), which means that the companies
now needs to recover less than the $36B.
Write downs/impairments shrinks the affected companies' assets/equities and thus debt
carrying capacities. Some make forecasts about future developments without considering the
companies' balance sheets.
At present oil pries (low/mid 50's) the companies may add an average of 60-70 wells/month
from cash from operations, this will likely be a mixture of DUCs and "new" wells.
For 2017 I expect companies in Bakken(ND) will continue to spend above what is generated
from operations.
"... Looking at Bakken(ND) as one big project, it has now spent an estimated total of about $36Billion more than generated from net operational cash flows (Jan-09 – Dec-16). To reach pay out for the wells started in 2009-2016 requires an estimated oil price of $65/bo (WTI) starting Jan-17. To get a return of 2.5% (which is, call it, an inflation hedge) on the $36B requires an estimated oil price of $77/bo (WTI). ..."
"... To enable a debt reduction requires a net positive cash flow from operations and the longer it takes before positive cash flow happens, the higher the required oil price becomes to earn some return. ..."
"... Some of this $36B debt has already been written down (also through bankruptcies (Chapter 11s), the business model is not sustainable with low oil prices!), which means that the companies now needs to recover less than the $36B. ..."
"... Write downs/impairments shrinks the affected companies' assets/equities and thus debt carrying capacities. Some make forecasts about future developments without considering the companies' balance sheets. ..."
"... At present oil pries (low/mid 50's) the companies may add an average of 60-70 wells/month from cash from operations, this will likely be a mixture of DUCs and "new" wells. ..."
"... For 2017 I expect companies in Bakken(ND) will continue to spend above what is generated from operations. ..."
To keep the Dec-15 output level from Bakken(ND) through 2016, I estimated
this would require the addition of an average of about 95 wells/month (61
wells/month were added through 2016).
In 2016 an estimated $2.0 –
$2.5Billion more than (net) cash flow from operations was spent. This is
about 300 – 350 new wells (spud to flow).
Without this external capital infusion fewer wells would have been brought
to flow and thus a steeper decline in production.
Looking at Bakken(ND) as one big project, it has now spent an
estimated total of about $36Billion more than generated from net operational
cash flows (Jan-09 – Dec-16). To reach pay out for the wells started in
2009-2016 requires an estimated oil price of $65/bo (WTI) starting Jan-17.
To get a return of 2.5% (which is, call it, an inflation hedge) on the $36B
requires an estimated oil price of $77/bo (WTI).
To enable a debt reduction requires a net positive cash flow from
operations and the longer it takes before positive cash flow happens, the
higher the required oil price becomes to earn some return.
Some of this $36B debt has already been written down (also through
bankruptcies (Chapter 11s), the business model is not sustainable with low
oil prices!), which means that the companies now needs to recover less than
the $36B.
Write downs/impairments shrinks the affected companies'
assets/equities and thus debt carrying capacities. Some make forecasts about
future developments without considering the companies' balance sheets.
At present oil pries (low/mid 50's) the companies may add an average
of 60-70 wells/month from cash from operations, this will likely be a
mixture of DUCs and "new" wells.
For 2017 I expect companies in Bakken(ND) will continue to spend
above what is generated from operations.
Bakken production down 86,150 barrels per day to 895,330 bpd. North Dakota production
down
92,029 bpd
to 942,455 bpd. It was noted that this the largest decline ever in North Dakota
production. But it should not be overlooked that the October in crease in production was also the
largest ever increase in North Dakota production.
If I'm not mistaken, this means that the North Dakota production (BPD) is now
only slightly more than than the existing pipeline capacity leading out of
North Dakota (BPD), which is 851,000 at the end of 2016. Production will
probably be down to the existing pipeline capacity by March.
Now this isn't quite comparable because part of the Williston isn't in North
Dakota, so I'd have to look at the Montana numbers. But still, it looks likely
that the moment Dakota Access is built, there will be a pipeline capacity glut.
So is the Dakota Access Pipeline going to be half-empty, or will some of the
other pipelines be empty and go bankrupt? They're fighting over market share in
a surplus-capacity environment.
"The incremental investment is budgeted to deliver an average
estimated ultimate recovery (EUR) of, or approximately 15% over the
previous average EUR of 850,000 Boe per well. At $55 per barrel WTI,
these completions should generate a cost forward average rate of
return in excess of 100%"
The estimated EUR's appear VERY high
for Bakken wells by my untrained eye. Any thoughts from the
resident experts?
I am certainly not an expert on tight oil but see above. If they
get 30 to 40% extra from gas I think they might make it (GOR of
1500 adds 25% I think, and it looks like it will be more than
that for most wells). What I don't get is a 'previous average'
of 850,000. There's not even one well that looks like that at
the moment, based on Enno Peters' charts.
"The Company plans to complete 131 gross (100
net) operated wells out of its Bakken uncompleted well inventory with
first production commencing by year end. In addition, Continental
plans to complete with first production approximately 17 gross (8 net)
newly drilled Bakken wells in 2017. At year-end 2017, the Company
expects to have 140 Bakken wells in inventory, of which 72 gross (40
net) wells will have been completed but waiting on first sales and 68
gross (47 net) operated wells will be waiting on completion.
The Company also plans to participate in completing 40 net
non-operated wells in 2017, 35 of which will be in the Bakken.
Continental expects to grow Bakken production by approximately 26%
in 2017, when comparing the 2017 exit rate to the fourth quarter 2016.
Approximately $550 million, or 70%, of the operated Bakken capital
investment in 2017 will be focused on completing wells from the
Company's uncompleted well inventory. The Company has five stimulation
crews working currently and plans to average seven crews for 2017 as a
whole.
Continental plans to apply various enhanced stimulation techniques
on all Bakken completions in 2017 to define the optimum designs for
future completions. This includes larger proppant loads, diverter
technology, shorter stage lengths and shorter cluster spacing. The
Company is also applying high-rate production lift technology to
accelerate fluid recovery and early production rates. Combined, these
techniques add an average of approximately $1.4 million to the
previous standard enhanced completion cost of $3.5 million.
For the uncompleted well inventory, the average budgeted completion
cost for the larger enhanced completion is approximately $4.9 million
per well. The incremental investment is budgeted to deliver an average
estimated ultimate recovery (EUR) of 980,000 Boe per well, or
approximately 15% over the previous average EUR of 850,000 Boe per
well. At $55 per barrel WTI, these completions should generate a cost
forward average rate of return in excess of 100%.
The Company also plans to maintain four operated drilling rigs in
the Bakken throughout 2017 and drill 101 gross (57 net) operated
wells, with 17 gross (8 net) of these wells completed in 2017 with
first production. The 17 gross wells will have an average budgeted
well cost of approximately $7.0 million. The average EUR for wells
drilled in 2017 is expected to be 920,000 Boe per well. At a WTI price
of $55 per barrel, these wells should generate over a 40% rate of
return."
According to Enno, an average
Bakken well gives about 200k+ of oil, not 900k. It looks like it's
much more gas than oil, or the numbers are completely bogus. Or
they have bought the sweetest center of all sweet spots in Bakken?
As of 3Q16, oil accounted for 61% of total CLR output.
Apparently, oil's share in CLR production in the Bakken is
higher.
According to Enno, CLR Bakken wells with the first
flow in 2014 have on average already produced > 200kb of oil.
Their average EUR may exceed 400 kb and probably reach 500 kb.
Wells with first flow in 2015 and 2016 perform better.
That said, even including gas, EURs of 900 kboe look
unrealistic
I have mentioned company proved reserves and PV10 quite a bit
here in the past two years.
I am coming to the opinion that these numbers, required by the
SEC, have too many uncertainties to make them worthwhile, at least
as to PUD. PDP may be useful.
They appear to have been increasing well performance since 2014,
maybe getting above 400k for oil if the curves continue (as below).
It looks like they recomplete after some time. It will be
interesting to see how the two 2016 curves go – started high and
then the first took a dive. The late 2015 wells did the same and
then jumped up, which looks like a re-completion. How much area
does one of their new wells drain? Presumably the savings must
mostly be on reduced drilling and completions cost, and maybe front
loading the returns with higher initial production, not overall
additional recovery.
Marathon announced today they'd have six
rigs average this year – up one – not sure if that is enough to
hold the decline near present levels, mostly that depends on
completions rather than rigs though, but they are going for
"multiple enhanced completion trials" and expect to increase
overall USA production by up to 20% (also six rigs in Eagle Ford).
Bakken data were out yesterday and we have seen a steep drop below 900 000
bbl/d nearly 300 000 bbl/d below its peak of 1.164 mill bbl/d in December (see
below chart). Well performance (new and existing wells) is down to a five year
low of 83 bbl per well and falling -20% year over year. This means a cost
increase per produced barrel of 20%, even if new wells are performing better
and costs per rig are down.
Since the well production declines by -20% over two years now, costs per
produced barrel are up 40% and rising fast. No wonder companies seem to abandon
Bakken for less mature fields such as the Permian. New permits are at five year
low and rig count is also grinding down slowly. Inerestingly, number of wells
are also falling – down 100 wells in December – which has been deemed as
impossible in some forecasting models.
"... Furthermore, well productivity in the Eagle Ford is detereorating over time compared to the wells drilled in previous years, which may suggest that longer laterals and bigger fracs result in only slightly higher IPs but much steeper declines. ..."
"... By contrast, new wells in the Permian continue to perform better than older wells. ..."
"... That may explain why drilling/completion activity and LTO production in the Permian have remained more resilient and are quickly recovering; while EFS has seen the biggest decline in production among the key LTO plays. ..."
"There is no data on average well quality for the wells that started production
in 2016. Is that because the data for last year is incomplete?"
If you go to the "Well quality" tab in the first presentation, you'll see 2016 profiles
as well.
The "Ultimate Recovery" overview only supports displaying production histories for wells
of the same age. As there are still 2016 vintage wells on which I have no data (the ones
that started in Nov/Dec), 2016 is not yet shown if you display it by "Year of first flow".
However, if you change the selection to "Quarter of first flow", or "Month of first flow",
then you will see more recent data as well, incl 2016.
You may remember past discussions here where we discussed displaying or omitting incomplete
tails in the well profile graphs. The Well Quality tab can show incomplete tails, while
the Ultimate Recover tab can't.
I just found that the number 2016 in the legend was hidden.
Comparing well performance in the Permian and the Eagle Ford, it seems that average
IP rates are not that different (582 b/d and 510 b/d, respectively, in the second month
of production), but declines in the EFS are much steeper.
As a result, by the tenth month, average well in the Permian produces 210.7 b/d, and
in the EFS only 122.6 b/d.
Furthermore, well productivity in the Eagle Ford is detereorating over time compared
to the wells drilled in previous years, which may suggest that
longer laterals and bigger fracs result in only slightly higher IPs but much steeper
declines.
By contrast, new wells in the Permian continue to perform better than older wells.
That may explain why drilling/completion activity and LTO production in the Permian
have remained more resilient and are quickly recovering; while EFS has seen the biggest
decline in production among the key LTO plays.
Cumulative total of Bakken Formation oil production.
One billion of those barrels produced in the past five years, four billion
barrels to go with the projected 5.7 billion recoverable, another 20 years of
production in the pipeline to go.
By 2035, the Bakken oil will be about done, can't get anymore.
75 new wells per month, 12×20, 240×75=18,000 more wells over twenty years
time.
The price of oil at 50, 4.5 billion barrels of oil, 225 billion dollars.
5,000,000 dollars of cost per well, 90,000,000,000 dollars invested in
drilling those 18,000 new wells, 400,000,000 barrels for the extraction taxes,
money for the state, 20% for royalties, 80,000,000 barrels for mineral owners,
480,000,000 barrels to keep everyone happy all of those years.
The oil companies can keep 3.52 billion barrels to sell to get them some
money.
Times 50 USD per barrel to assess a value, 160,000,000,000 dollars in future
income to pay the 90,000,000,000 dollars owed for oil wells drilled. After
twenty years of production you will have 70,000,000,000 dollars left over for
the buzzards to pick clean.
A measly 3,500,000,000 dollars per year for the oil companies to share. 350
oil companies working, ten million dollars to share amongst stockholders and
employees.
The price of oil has to be more or the Bakken will slow to a crawl, then an
end.
U.S. independent shale oil and gas producers are now cash flow neutral
From
the IEA Oil Market Report:
"So far, the shale and tight oil industry has always been characterized by
spending levels exceeding cash flow generated. Benefitting from the improved
price environment (including a 50% natural gas price increase over the last six
months), increased activity and enhanced cost efficiency, the US shale industry
is now closer to being able to fund capex programs within operational cash
flows. During 3Q16, for the first time in its history, the sector reached free
cash flow neutrality. In other words, after more two years of very difficult
times, the US shale business model seems on a much more sustainable path.
Nonetheless, it remains to be seen whether companies can remain cash flow
positive when the industry scales up activity and capital spending and as
upward pressure on costs once again takes hold."
Free Cash FLow for US Independents* (USD billion)
* / Free Cash Flow has been calculated analyzing balance sheets of about 50
US shale operators, having more than 80% of their revenues coming from shale
activities and covering over 60% of US tight oil and shale gas production
Operating cashflow
= net income excluding all non-cash items: depreciation and
amortization; asset writedowns; gains and losses on asset sales,
etc.
Operating cashflow includes only those interest expenses and taxes
that were actually paid during a certain period and differ from
"nominal" interest expenses and taxes that are shown in income
statement (as interest can be capitalized, tax payments can be
delayed, etc.).
In my view, operating cashflow is a better metric of oil and gas
companies' operating results than net income.
Free cashflow shows what is left in a company's coffer after it
has spent part of its cash on organic (non-acquisition) capex.
Negative free cashflow means that the company has to borrow money
to cover its expenses.
Positive free cashflow means that the company can pay down part of
its debt or keep free cash on its accounts.
Unlike oil majors, which tend to spend a significant part of
their cash on dividends and repurchase of their own shares, U.S.
E&Ps normally do not pay or pay relatively small dividends.
The above chart from the IEA monthly report shows that the group
of 50 largest shale companies have finally achieved free cash flow
neutrality in 3Q2016, which means their quarterly operating
cashflow is roughly equal to the sum of their capex and dividends.
That was due to a sharp reduction in capex and lower costs.
I came to similar conclusions, as the IEA, after looking at 2Q
and 3Q results from a few large U.S. shale companies.(Of course, my
sample group was much narrower than 50 companies).
The shale oil industry has been in positive cash flow situation
since prices got above 40 dollars a barrel. Sorry, this is a
meaningless assessment of a meaningless article. Positive cash
flow basis to what extent, exactly?
"Free cash flow (two words) shows what is left in a company's
coffer after it has spent part of its cash on organic
(non-acquisition) capex." Negative. This implies that all wells
being drilled by the 50 shale oil companies referenced are now
being paid for out of positive cash flow. I don't think so. If
so, at the expense of deleveraging, so what?
"Negative free cash flow (two words) means that the company
has to borrow money to cover its expenses." Define expenses,
please. Including developmental CAPEX?
"Positive free cash flow (two words) means that the company
can pay down part of its debt or keep free cash on its
accounts." Right. Give me a percentage of the total 50 shale
companies surveyed that paid down debt in 2016 and to what
extent, please. Last I looked even EOG did not have COH to cover
this years maturities.
"The above chart from the IEA monthly report shows that the
group of 50 largest shale companies have finally achieved free
cash flow neutrality in 3Q2016, which means their quarterly
operating cash flow (two words) is roughly equal to the sum of
their capex and dividends." How many of these stinking shale oil
companies even pay dividends? Come on, Alex. That's BS and you
know it. List the 50 and show their losses for 3Q16.
Shallow is right, positive cash flow fills the coke machine
down the hall, for the first time in 25 months, that's it. If
these shale guys are using cash flow to drill more stinking
wells, they are doing so at the expense of deleveraging legacy
debt. The marginal price per barrel of shale oil is a
meaningless metric now. All of these guys are up to their asses
in debt. Folks have got to let this ridiculous IEA, EIA, SPCA
and NCAA bunk go and get planted on earth about this shale oil
stuff. Nothing has changed in the past 5 months except that OPEC
added 5 dollars a barrel to the bottom line. Temporarily.
I guess our goal every time we have borrowed money to buy an
asset, be it an oil lease or otherwise, was to pay down the
loan principal to zero.
Further, we have not borrowed money to drill or work over
wells.
Currently, in the commodity spaces I am familiar with,
most asset values are still high, despite much lower
commodity prices (grains, oil and natural gas).
I assume increasing interest rates may change this, but
maybe not?
We looked at a small oil lease recently. It was priced as
if the price of oil was a steady $80. It sold for the asking
price. In the first quarter of 2016 the lease lost money on
an operating basis. It was barely cash flow positive for
2016. Fifteen years ago, the same lease, being also barely
cash flow positive in 2001, would have sold for 1/10 of the
current sale price, IMO.
Witness record acreage prices paid in the Permian earlier
this year.
Farmland is the same. Grain prices are down for the third
year, yet land is barely off highs. Net cash rental income,
after payment of real estate taxes, is 2.5% or less. This is
pre-income tax returns.
I am not smart enough to know what this means, or what one
should do in this situation, unfortunately.
I will say, however, I believe few now have the goal of
buying assets and paying the debt down to zero. It appears
commodity assets are now about leverage, churn and other ways
to make money from them, besides from the income produced by
the assets themselves.
One area that I think will only get worse is commodity
price volatility. I read a long article recently about this
with regard to grain prices, written by a large, well
respected farm management company. They have really put an
emphasis on marketing, they say farmers that don't
aggressively hedge will have a tough time.
This I believe is true for oil and gas too. Unfortunately,
the cost to hedge has risen dramatically. I recall buying put
options near the market for under a buck a barrel around
12-14 years ago. Those now go for $4+.
AlexS, I do not think operating cash flow is the only
metric to look at. If we had paid $150K per barrel in 2013
with borrowed funds, the fact that we have had positive
operating cash flow in 2016 would be of little solace.
I contend there is mucho debt in the industry that will
continue to be "rolled", little will be paid through net
operating income. However, much may be paid through equity
issuance.
I sure hope the upstream oil and gas industry is not a
microcosm for the whole economy. I'm not smart enough to know
that either.
"I am not smart enough to know what this means, or what
one should do in this situation, unfortunately."
That's
fascinating data, "shallow sand". This is the sort of
information I love to get so that I can analyze it, so
I'll give it a shot. This is first pass.
I think we're watching a bubble. This smells like
bubble.
(1) There is too much money among very rich people
chasing too few good investments. Accordingly, the prices
of investment products are getting bid up in a bubble.
(2) The bubble in oil, in particular, will burst as they
see how terrible the rates of return are.
(3) The middlemen and speculators are of course
exacerbating the bubble; they always do.
(4) When the bubble bursts, a lot of wealth will "vanish"
overnight. It is best to be out of it before it bursts -
sell at the top of the bubble if you can, and switch to
something which is selling with less inflated prices.
(5) Farmland might be the same sort of bubble. The other
possibility is that it might not have the same bubble
behavior: its value might increase - if you get the right
farmland, farmland which is likely to continue to do well
despite climate change - as there are definitely
predictions of droughts and crop failures coming in the
next few years.
(6) Because of the excess of investment money, it may be
impossible to find anything you're comfortable with which
isn't selling at inflated prices, sadly. Paying off debt
is an option if you have debt. Or insuring yourself
against liabilities (are all your well capping and
clean-shutdown costs prepaid?). That sort of thing.
Clueless should weigh in. I've seen the definition get massaged
here and there.
Cash flow is inputs and outputs, and while SS
is asking about interest above, that's not the debt focus. New
borrowing can be called a cash influx. I've seen it done. New
borrowing improves cash flow over a period measured. If you
define it that way, you can borrow your way to prosperity.
Watcher is mostly right. For example, there are only a small
minority of companies that use GAAP earnings as their primary
earnings measure. They all must report GAAP earnings, but
usually tout some other earnings measure as their earnings
that "are more useful for investors to understand the
company's financial performance." The GAAP earnings for the
most part are standardized. The "more useful" numbers are
based upon each company determining for themselves what they
will include/exclude. In many cases, totally self-serving.
However, they must provide a reconciliation between GAAP
earnings and the "more useful" earnings.
With respect to
cash flow, each 10-K (annual) report and 10-Q (quarterly)
report includes a GAAP standardized statement of cash flow.
You may not be able to glean the information that you seek
from that report, but it is the only one that I would trust.
Other statements that a company may make in presentations,
discussions, etc about "cash flow" I would not trust without
a complete detailed discussion of what they were
including/excluding in the calculation.
I used the term for GAAP earnings as being "somewhat"
standardized. With respect to oil and gas exploration
companies, there are 2 different acceptable GAAP standards:
successful efforts and full cost. Successful efforts expenses
dry holes. Full cost capitalizes them into the pool of
depletable costs and expenses them as the reserves are
depleted. [Kind of like a manufacturer. Say that quality
control finds one out of every 500 circuit boards to be
defective. The company does not immediately expense that
circuit board. The total manufacturing costs are allocated to
the inventory of 499 circuit boards.] But, in the event of
significant oil/gas price plunges, the calculation of the
amount of write-downs of capitalized/depletable property is
also different, depending on which method is used. That
becomes a big deal if prices fully recover, because the
write-downs are never reinstated.
Not very busy at this moment, so you got a lot of
rambling, which I hope is mostly correct.
Free cash flow is a widely used measure of a
company's financial performance.
Unlike breakeven price and similar indicators which everyone
calculates using its own methodology (and nobody discloses this
methodology), free cash flow can be easily calculated using the data
from company's SEC fillings.
Below is a definition of free cash flow from investopedia:
Free cash flow (FCF) is a measure of a company's financial
performance, calculated as operating cash flow minus capital
expenditures. FCF represents the cash that a company is able to
generate after spending the money required to maintain or expand its
asset base.
FCF is an assessment of the amount of cash a company generates
after accounting for all capital expenditures. The excess cash is used
to expand production, develop new products, make acquisitions, pay
dividends and reduce debt.
Some believe that Wall Street focuses only on earnings while
ignoring the real cash that a firm generates. Earnings can often be
adjusted by various accounting practices, but it's tougher to fake
cash flow. For this reason, some investors believe that FCF gives a
much clearer view of a company's ability to generate cash and profits.
However, it is important to note that negative free cash flow is not
bad in itself. If free cash flow is negative, it could be a sign that
a company is making large investments. If these investments earn a
high return, the strategy has the potential to pay off in the long
run. FCF is also better indicator than the P/E ratio.
FCF is a good indicator of the performance of a public company.
Many investors base their investment decisions on the free cash
generated by a company or its equity price to FCF ratio.
It may seem strange that shale companies had negative free cash
flow when oil prices were around $100, but achieved FCF neutrality
in 3Q16 when WTI averaged only about $45.
The explanation is very
simple. In 2010-14, shale companies were heavily investing, which
helped them to achieve double-digit growth in production and to
increase overall U.S. LTO output by ~1 mb/d each year in 2012-14.
While negative FCF is not necessarily negative, in this
particular case, shale companies' strategies proved
self-destroying.
1) Negative FCF led to accumulation of very high debt;
2) High demand from shale companies resulted in a sharp increase in
unit costs for oil services and other inputs;
3) Rapid growth in LTO production caused the glut in the the global
oil market and consequent drop in oil prices.
Lower oil prices led to a sharp reduction in shale companies'
operating cash flows. But these companies even more sharply reduced
their capex.
Finally, in 3Q2016 their combined capex was roughly equal to
combined operating cash flow.
The above chart from the IEA Oil Market Report shows it very
clearly.
AlexS. I do not disagree with you that the metrics you are
explaining (very well, I might add) are very important.
However, I assume you agree that balance sheets and estimates
of future cash flows are also important to look at.
In reality, all can be reviewed in SEC filings, which are the
only numbers that are reliable. Company power point
presentations are meant to be promotional material.
FCF is a good shapshot of a company's
financial performance in a particular period. Of course, it
is not sufficient for understanding of this company's whole
financial situation and its future prospects.
FCF neutrality in 3Q2016 means that the group of 50
companies didn't have to increase their debt, but debt
accumulated over the previous years remains on their balance
sheets and is a heavy burden for future development.
Furthermore, FCF neutrality was achieved thanks to lower
capex which resulted in declining oil production.
Higher oil and gas prices expected for 2017 should improve
oil companies' operating cash flows. A number of shale
players have already announced planned increases in capex of
10-50% for next year. That will likely reverse the decline in
LTO output. But higher capex will not allow shale companies
to achieve significant positive FCF, and hence to start
repaying their debt.
At $55-60 they will be able to only slightly increase
output by year-end 2017 vs. year-end 2016, while maintaining
FCF neutrality. A more aggressive increase in capex would
result again in negative FCF and increase in debt.
Furthermore, increase in shale companies' spending will
reverse oil service cost deflation, which was the main
contributor to declining unit costs in 2015-16.
In my view, a conservative financial and operational
strategy, with gradual and modest increases in capex, should
allow a moderate growth in LTO production over the next few
years without significant increase in debt levels.
But a return to previous growth rates of 1 mb/d p.a.
anticipated by some experts (including Rystad Energy) from
2018, would result in further deterioration of shale
companies' financial situation. And it would have a negative
impact on oil prices.
Yeah, something critically important in addition to free
cash flow is the growth (or, in *this* industry, decline)
trajectory. It's great to have free cash flow this year,
but if your wells all run out in two years and you haven't
drilled more, well, your free cash flow this year and next
*is the total value of the company*, because there won't
be any free cash flow in year three.
Well, actually,
it's not even that good: liabilities also have to be
considered.
Easier said than done. Look at the latest 10-Q for CLR. It seems to
me that there would be a lot of questions about their results,
especially when you look at their operating cash flow and notice
the large impairment charge that is added back, thereby not
affecting cash flow from operations negatively. But they lost that
cash almost as surely as if they drilled a dry hole.
clueless. Regarding CLR and SEC filings, I have brought up
several times that the company managed to reduce its estimate of
future production costs by 60% from 2014 to 2015, while only
reducing all categories of proved reserves by just 9% during the
same period.
I believe there were some things pulled to keep
PV10 above long term debt in 2015 and I expect the same for year
end 2016.
the large property impairment charge in CLR accounts
for 3Q2016 ( $57 million for 3Q and $203 million for 9 months of
2016) is the result of negative revaluation of their reserves
(due to lower oil price). It is reflected in the balance sheet
as lower net property and equipment (compared with previous
period) and as lower shareholers equity.
It is also shown in the income statement, but added back in cash
flow statement as that's not real cash paid by the company.
It's a paper loss.
Dry hole cost is very small ( $27 thousands for 3Q and $233
thousands for 9 months of 2016). The cost of drilling wells was
already accounted as capex. Then the cost of of successful wells
was capitalized (and added to PP&E in the balance sheet) and dry
hole costs are expensed and appear in the income statement as
expenses. But they are added back in cash flow statement as cash
paid for both succesful and dry wells was already included in
capex.
Alex, thank you for your detailed explanation of free cash
flow. After 40 years of operating oil and gas wells I
understand the definition very well. It can indeed be used,
as you have said, as a snapshot of financial activity within
in a brief period of time. As I have said, and Shallow, I
believe, it is of little importance in the grand scheme of
things. The shale oil industry is in serious financial
trouble and 5 dollars a barrel on the "hope" of OPEC cuts has
not changed that.
Its curious to me this intense need for some folks to make
predictions about the future. Predicting the role shale oil
might play in that future over the next decade, or decades,
without understanding the financial condition of those
companies extracting it, is a big mistake in my opinion. The
shale oil phenomena has not been paid for yet, nevertheless
you and others are counting on it decades thirty years from
now. I do not understand that, sorry. I really don't have
much to contribute here, it seems.
I agree LTO will contribute very little in the
grand scheme.
Lots of agencies and companies provide outlooks of the
future. The Chart below shows the BP Outlook 2016 for
C+C+NGL and my "medium" scenario for C+C+NGL with URR=3600
Gb for 2015 to 2035.
I don't know who is the author of that
article, but the very first phrase about operating cash
flow is a complete nonsense:
"The way Cash Flow from Operations is calculated is by
starting with net income (equity earnings) which doesn't
include interest paid to debt holders."
Of course, net income includes "Interest expense".
See CLR's 3Q accounts; income statement.
Net interest expense for the quarter was $82 million.
"... This suggests the sweetspot theory is also bogus, unless there are 9 years of them, meaning it's ALL been sweetspots so far. 9 yrs of sweetspots might as well be called just normal rather than sweet. ..."
"... It is pretty much all bogus, yes, Watcher. With any rudimentary understanding of volumetric calculations of OOIP in a dense shale like the Bakken, there is only X BO along the horizontal lateral that might be "obtained" from stimulation. More sand along a longer lateral does not necessarily translate into greater frac growth (an increase in the radius around the horizontal lateral). Novices in frac technology believe in halo effects, or that more sand equates to higher UR of OOIP per acre foot of exposed reservoir. That is not the case; longer laterals simply expose more acre feet of shale that can be recovered. Recovery factors in shale per acre foot will never exceed 5-6%, IMO, short of any breakthroughs in EOR technology. That will take much higher oil prices. ..."
"... Its very simple, actually bigger fracs (that cost lots more money!!) over longer laterals result in higher IP's and higher ensuing 90 day production results. That generates more cash flow (imperative at the moment) and allows for higher EUR's that translate into bigger booked reserve assets. More assets means the shale oil industry can borrow more money against those assets. Its a game, and a very obvious one at that. ..."
Here is the production graph. Not that much has happened. There was a big drop for 2011. 2009
on the other hand saw an increase. Up to the left, which is very hard to see, 2015 continues to
follow 2014 which follows 2013 which follows 2012. Will we see 2013 reach 2007 the next few months?
Its on purpose both because I wanted to zoom in and because the data for first 18 months or so
for the method I used above is not very usable. Bellow is the production profile which is better
for seeing differences the first 18 months. Above graph is roughly 6 months ahead of the production
profile graph.
And I guess we can all see no technological breakthru. 2014's green line looks superior to
first 3 mos 2015.
2016 looks like it declines to the same level about 2.5 mos later, but is clearly a steeper
decline at that point and is likely going to intersect 2014's line probably within the year.
There is zero evidence on that compilation of any technological breakthrough surging output
per well in the past 2-3 yrs.
In fact, they damn near all overlay within 2 yrs. No way in hell there is any spectacular EUR
improvement.
And . . . in the context of the moment, nope, no evidence of techno breakthrough. But also
no evidence of sweetspots first.
I suppose you could contort conclusions and say . . . Yes, the sweetspots were first - with
inferior technology, and then as they became less sweet the technological breakthroughs brought
output up to look the same.
clarifying, the techno breakthrus are bogus. They would show in that data if they were real.
And it would be far too much coincidence for techno breakthrus to just happen to increase flow
the exact amount lost from exhausting sweet spots.
This suggests the sweetspot theory is also bogus, unless there are 9 years of them, meaning
it's ALL been sweetspots so far. 9 yrs of sweetspots might as well be called just normal rather
than sweet.
It is pretty much all bogus, yes, Watcher. With any rudimentary understanding of volumetric
calculations of OOIP in a dense shale like the Bakken, there is only X BO along the horizontal
lateral that might be "obtained" from stimulation. More sand along a longer lateral does not necessarily
translate into greater frac growth (an increase in the radius around the horizontal lateral).
Novices in frac technology believe in halo effects, or that more sand equates to higher UR of
OOIP per acre foot of exposed reservoir. That is not the case; longer laterals simply expose more
acre feet of shale that can be recovered. Recovery factors in shale per acre foot will never exceed
5-6%, IMO, short of any breakthroughs in EOR technology. That will take much higher oil prices.
Its very simple, actually bigger fracs (that cost lots more money!!) over longer laterals
result in higher IP's and higher ensuing 90 day production results. That generates more cash flow
(imperative at the moment) and allows for higher EUR's that translate into bigger booked reserve
assets. More assets means the shale oil industry can borrow more money against those assets. Its
a game, and a very obvious one at that.
Nobody is breaking new ground or making big strides in greater UR. That's internet dribble.
Freddy is right; everyone in the shale biz is pounding their sweet spots, high grading as they
call it, and higher GOR's are a sure sign of depletion. Moving off those sweet spots into flank
areas will be even less economical (if that is possible) and will result in significantly less
UR per well. That is what is ridiculous about modeling the future based on X wells per month and
trying to determine how much unconventional shale oil can be produced in the US thru 2035. The
term, "past performance is not indicative of future results?" We invented that phrase 120 years
ago in the oil business.
That, sir, is pretty much the point. I see what looks like about 20% IP increase for the extra
stages post 2008/9/10. How could there not be going from 15 stages to 30+?
I see NO magic post peak. They all descend exactly the same way and by 18-20 months every drill
year is lined up. That's actually astounding - given 15 vs 30 stages. There should be more volume
draining on day 1 and year 2, but the flow is the same at month 20+ for all drill years. This
should kill the profitability on those later wells because 30 stages must cost more.
But profit is not required when you MUST have oil.
Freddy, is there something going on in the data? How can 30 stage long laterals flow the same
at production month 24 as the earlier dated wells at their production month 24 –whose lengths
of well were MUCH shorter?
I can only speculate why the curves look like they do. It could be that the newer wells would
have produced more than the older wells, but closer well spacing is causing the UR to go down.
Here is the updated yearly decline rate graph. 2010 has seen increased decline rates as I suspected.
The curves are currently gathering in the 15%-20% range.
2007 only has 161 wells. So it makes the production curve a bit noisy as you can see above. Current
yearly decline rate for 2007 is 7,2% and the average from month 98 to 117 would translate to a
10,3% yearly decline rate. The 2007 curve look quite different from the other curves, so thats
why I did not include it.
Thanks. The 2008 wells were probably refracked so that curve is messed up. If we ignore 2008,
2007 looks fairly similar to the other curves (if we consider the smoothed slope.) I guess one
way to do it would be to look at the natural log of monthly output vs month for each year and
see where the curve starts to become straight indicating exponential decline. The decline rates
of many of the curves look similar through about month 80 (2007, 2009, 2010, 2011) after 2011
(2012, 2013, 2014) decline rates look steeper, maybe poor well quality or super fracking (more
frack stages and more proppant) has changed the shape of the decline curve. The shape is definitely
different, I am speculating about the possible cause.
2007 had much lower initial production and the long late plateau gives it a low decline rate also.
But yes, initial decline rates look similar to the other curves. If you look at the individual
2007 wells then you can see that some of them have similar increases to production as the 2008
wells had during 2014. I have not investigated this in detail, but it could be that those increases
are fewer and distributed over a longer time span than 2008 and it is what has caused the plateau.
If that is the case, then 2007 may not be different from the others at and we will see increased
decline rates in the future.
Regarding natural log plots. Yes it could be good if you want to find a constant exponential
decline. But we are not there yet as you can see in above graph.
One good reason why decline rates are increasing is because of the GOR increase. When they
pump up the oil so fast that GOR is increasing, then it's expected that there are some production
increases first but higher decline rates later. Perhaps completion techniques have something to
do with it also. Well spacing is getting closer and closer also and is definitely close enough
in some areas to cause reductions in UR. But I would expect lower inital production rather than
higher decline rates from that. But maybe I´m wrong.
Ok Enno's data from NDIC shows 73 well completions in North Dakota in Sept 2016, 33 were confidential
wells, if we assume 98% of those were Bakken/TF wells that would be 72 ND Bakken/TF wells completed
in Sept 2016.
I have 75 in my data, so about the same. They have increased the number of new wells quite alot
the last two months. It looks like the addtional ones mainly comes from the DUC backlog as it
increased withouth the rig count going up. But I see that the rig count has gone up now too.
Ron you say " Bakken production continues to decline though I expect it to level off soon."
A few words of wisdom as to the main reasons why it would level off? Price rise?
Even though you asked Ron. He might think that the decline in the number of new wells per month
may have stabilized at around 71 new wells per month. If that rate of new completions per month
stays the same there will still be decline but the rate of decline will be slower. Scenario below
shows what would happen with 71 new wells per month from Sept 2016 to June 2017 and then a 1 well
per month increase from July 2017 to Dec 2018 (89 new wells per month in Dec 2018).
I am not so convinced that either Texas or the Bakken is finished declining at the current level
of completions. There was consistent completions of over 1000 wells in Texas until about October
of 2015. Then it dropped to less than half of that. The number of producing wells in Texas peaked
in June of this year. Since then, through October, it has decreased by roughly 1000 wells a month.
The Texas RRC reports are indicating that they are still plugging more than they are completing.
I remember reading one projection recently for what wells will be doing over time in the Eagle
Ford. They ran those projections for a well for over 22 years. Not sure which planet we are talking
about, but in Texas an Eagle Ford does well to survive 6 years. They keep referring to an Eagle
Ford producing half of what they will in the first two years. In most areas, I would say that
it is half in the first year.
The EIA, IEA, Opec, and most pundits have the US shale drilling turning on a dime when the oil
price reaches a certain level. If it was at a hundred now, it would still take about two years
to significantly increase production, if it ever happens. I am not a big believer that US shale
is the new spigot for supply.
The wells being shut in are not nearly as important as the number of wells completed because
the output volume is so different. So the average well in the Eagle Ford in its second month of
production produces about 370 b/d, but the average well at 68 months was producing 10 b/d. So
about 37 average wells need to be shut in to offset one average new well completion.
Point is that total well counts are not so important, it is well completions that drive output
higher.
Output is falling because fewer wells are being completed. When oil prices rise and profits
increase, completions per month will increase and slow the decline rate and eventually raise output
if completions are high enough. For the Bakken at an output level of 863 kb/d in Dec 2017 about
79 new wells per month is enough to cause a slight increase in output. My model slightly underestimates
Bakken output, for Sept 2016 my model has output at 890 kb/d, about 30 kb/d lower than actual
output (3% too low), my well profile may be slightly too low, but I expect eventually new well
EUR will start to decrease and my model will start to match actual output better by mid 2017 as
sweet spots run out of room for new wells.
Guess I will remember that for the future. The number of producing wells is not important. Kinda
like I got pooh poohed when I said the production would drop to over 1 million barrels back in
early 2015.
Do you agree that the shut in wells tend to be low output wells? So if I shut down 37 of those
but complete one well the net change in output is zero.
Likewise if I complete 1000 wells in a year, I could shut down 20,000 stripper wells and the
net change in output would be zero, but there would be 19,000 fewer producing wells, if we assume
the average output of the 1000 new wells completed was 200 b/d for the year and the stripper wells
produced 10 b/d on average.
How much do you expect output to fall in the US by Dec 2017?
Hindsight is 20/20 and lots of people can make lucky guesses. Output did indeed fall by about
1 million barrels per day from April 2015 to July 2016, can you point me to your comment where
you predicted this?
Tell us what it will be in August 2017.
I expected the fall in supply would lead to higher prices, I did not expect World output to
be as resilient as it has been and I also did not realize how oversupplied the market was in April
2015. In Jan 2015 I expected output would decrease and it increased by 250 kb/d from Jan to April,
so I was too pessimistic, from Jan 2015 (which is early 2015) to August 2016 US output has decreased
by 635 kb/d.
If you were suggesting World output would fall from Jan 2015 levels by 1 Mb/d, you would also
have been incorrect as World C+C output has increased from Feb 2015 to July 2016 by 400 kb/d.
If we consider 12 month average output of World C+C, the decline has been 340 kb/d from the 12
month average peak in August 2015 (centered 12 month average).
The dropping numbers are not as much from the wells that produce less than 10 barrels a day, but
from those producing greater than 10, but less than 100. The ones producing greater than 100 are
remaining at a consistent level over 9000 to 9500. The prediction on one million was as to the
US shale only. It is your site, you can search it better than I can,
But then don't take my word for it. You can find the same information under the Texas RRC site
under oil and gas/research and statistics/well distribution tables. Current production for Sep
can be found at online research queries/statewide. It is still dropping, and will long term at
the current activity level. Production drop for oil, only, is a little over 40k per day barrels,
and condensate is lower for September. Proofs in the pudding.
My guess is that you would see a lot more plugging reports, if it were not so expensive to plug
a well. At net income levels where they are, I expect they would put that off as long as they
could.
I trust the NDIC numbers much more than the EIA numbers which are based on a model. Enno Peters
data has 66 completions in August 2016, he has not put up his post for the Sept data yet so I
am using the Director's estimate for now. I agree his estimate is usually off a bit, Enno tends
to be spot on for the Bakken data, for Texas he relies on RRC data which is not very good.
Dennis. Someone pointed out Whiting's Twin Valley field wells being shut in for August.
It appears this was because another 13 wells in the field were recently completed.
It appears that when all 29 wells are returned to full production, this field will be very
prolific initially. Therefore, on this one field alone, we could see some impact for the entire
state.
Does anyone know if these wells are part of Whiting's JV? Telling if they had to do that on
these strong wells. Bakken just not close to economic.
I also note that average production days per well in for EOG in Parshall was 24. I haven't
looked at some of the other "older" large fields yet, but assume the numbers are similar.
I agree higher prices will be needed in the Bakken, probably $75/b or more. To be honest I
don't know why they continue to complete wells, but maybe it is a matter of ignoring the sunk
costs in wells drilled but not completed and running the numbers based on whether they can pay
back the completion costs. Everyone may be hoping the other guys fail and are just trying to pay
the bills as best they can, not sure if just stopping altogether is the best strategy.
There is the old adage that when your in a hole, more digging doesn't help much.
So my model just assumes continued completions at the August rate for about 12 months with
gradually rising prices as the market starts to balance, then a gradual increase in completions
as prices continue to rise from July 2017($78/b) to Dec 2018 (from 72 completions to about 90
completions per month 18 months later). At that point oil prices have risen to $97/b and LTO companies
are making money. Prices continue to rise to $130/b by Oct 2020 and then remain at that level
for 40 years (not likely, but the model is simplistic).
I could easily do a model with no wells completed, but I doubt that will be correct. Suggestions?
Dennis. As we have discussed before, tough to model when there is no way to be accurate regarding
the oil price.
I continue to contend that there will be no quick price recovery without an OPEC cut. Further,
the US dollar is very important too, as are interest rates.
At some point OPEC may not be able to increase output much more and overall World supply will
increase less than demand. My guess is that this will occur by mid 2017 and oil prices will rise.
OPEC output from Libya an Nigeria has recovered, but this can only go so far, maybe another 1
Mb/d at most. I don't expect any big increases from other OPEC nations in the near term.
A big guess as to oil prices has to be made to do a model.
I believe my guess is conservative, but maybe oil prices will remain where they are now beyond
mid 2017.
I expected World supply to have fallen much more quickly than has been the case at oil prices
of $50/b.
"EIA does this by using a relatively new dataset-FracFocus.org's national fracking chemical
registry-to identify the completion phase, marked by the first fracking. If a well shows up on
the registry, it's considered completed "
There is an unlikely peak oil related editorial writer hiding in the most unlikely place: a weekly
English business paper called Capital Ethiopia. The latest editorial is again putting an excellent
perspective on world events.
http://capitalethiopia.com/2016/11/15/system-failure/#.WC1ZCvl9600
For the record, I have no interest or connection to this publication other than that of a paying
reader.
Wouldn't it be nice if mainstream publications would sound a bit more like this.
Thanks all. I thought that the red queen concept meant that there had to be an increase in the
rate of completions. So that 71 year-on-year in north Dakota would only stabilise temporarily.
Perhaps the loss of sweet spots are being counteracted by the improvements in technology? I'm
assuming that even with difficulties of financing there will be a swift increase in completions
should the oil price take off, but not sure how sustainable this would be
Sometimes I think that once the price of oil is up enough that sellers can hedge the their
selling price for two or three years at a profitable level, it will hardly matter what the banks
have to say about financing new wells.
At five to ten million apiece, there will probably be plenty of money coming out of various
deep pockets to get the well drilling ball rolling again, if the profits look good.
Sometimes the folks who think the industry will not be able to raise money forget that it's
not a scratch job anymore. The land surveys, roads, a good bit of pipeline, housing, leases, etc
are already in place, meaning all it takes to get the oil started now is a drill and frack rig.
I don't know what the price will have to be, but considering that a lot of lease and other
money is a sunk cost that can't be recovered, and will have to be written off, along with the
mountain of debts accumulated so far, the price might be lower than a lot of people estimate.
Bankruptcy of old owners results in lowering the price at which an old business makes money
for its new owners.
The Red Queen effect is that more and more wells need to be completed to increase output.
As output decreases fewer wells are needed to maintain output. So at 1000 kb/d output it might
require 120 wells to be completed to maintain output (if new well EUR did not eventually decrease),
but at 850 kb/d it might require about 78 new wells per month to maintain output.
The FED oil production number for October came out yesterday. In below chart the production decline
(blue line) is the same as in the previous month, yet the trend is still a massive decline year
over year. In my view year over year comparison can show the dynamic of a trend. And it shows
clearly that in the current cycle the oil price recovery is – in contrast to the cycle in 2008/9
– very slow and tentative.
The year over year oil price (green line in below chart) actually decreased again year over
year and the risk of a double dip in the oil price is growing by the day. Drilling follows very
cautiously the oil price in a parallel line (red line in below chart). If there would be really
a technological advantage for shale, the red and the green line would not be paralell, but the
red line for drilling would rise much stronger. This is actually the case for Middle East drilling,
which barely fell during this cycle. This indicates that most Middle East producers still have
high margins at the current oil price. Middle East producers – and also Russia – can quite easily
cope with an oil price of 40 +/- 10 USD per barrel. This is why I think that the oil price will
bounce at the bottom of the barrel within above range for a few years.
There is also something interesting going on with the world economy. The shippers rose exponentionally
over the last few days (DRYS up over 1000%). Also the baltic Dry index is up 600% since the beginning
of this year. House prices here in London fell – mostly at the high end. Rents for expensives
homes are down by up to 36%. Donald Trump has clearly changed something already as it becomes
increasingly clear that the dollar hoarders are paying for the infrastructure spending. I am not
sure if he understands that he is doing a lot of harm to his own business empire as well.
I expect if that depressing old banker were here he would note that instability is dangerous,
and that all the moves in treasuries currency and possibly trade flow create changes of which
the results are difficult or impossible to predict
I can easily understand your assertion that Middle Eastern and Russian oil is profitable at
forty bucks.
But if the price is to stay around forty, then it follows that you think that between them,
the producers in the Middle East and Russia will be able to supply all the oil the world wants
for the next few years.
Am I correct in saying this?
Do you think western producers will continue to pump enough at a loss ( most of them are apparently
losing money at forty bucks ) to make up the difference?
If you are willing to venture a guess, when do you think the price will get back into the sixty
dollar and up range?
If you think it won't for a lot of years, is that because you believe the economy is will be
that anemic, or because electric cars will substantially reduce demand, or both ? Or maybe you
have other reasons ?
The US has thrown the gauntlet to OPEC by claiming to becoming an oil net exporter. This has
brought OPEC in a very difficult situation. If they cut – and oil gets to 70 USD per barrel –
shale will pick up the slack and produce the amount OPEC has cut within a short period of time.
So, OPEC is forced to cut again, until it has lost a lot of market share – and thus also a lot
of revenue.
In my view OPEC has no other choice than to produce come hell and water – until something breaks.
This could be that many shale companies give up or that for instance Iran is not allowed to export
as much as they do, or there is a major conflict in the Middle East, or Saudi Arabia is running
out of cash ..
He who has the market share now, will cash in when the oil price rises. And it will rise, yet
not until something breaks. This is how business works. This is how Microsoft crushed Apple in
the nineties in the PC market – and Apple then crushed Nokia in the smart phone market .
I do not think that Saudi Arabia has the freedom to compromise here – even if they want. If
they blink they will be crushed by shale producers. So, the stand-off will go on for a while,
at a loose-loose situation for both parties. However this is great luck for consumers as they
can enjoy low energy prices for 2 to 3 years.
I think your numbers reflect numbers reported from ND DMR but Bloomberg might be closer to
reality for wells that will actually ever be completed (just a guess by me though). How do Bloomberg
get their numbers (e.g. removing Tight Holes, or removing old wells, not counting non-completed
waivers etc.)?
Yes indeed. The difficulty with DUCs is always, which wells do you count. I don't filter old
wells for example, and already include those that were spud last month (even though maybe casing
has not been set). I don't do a lot of filtering, so the actual # wells that really can be completed
is likely quite a bit lower. I see my DUC numbers as the upper bound. I don't know Bloombergs
method exactly, so I can't comment on that.
Discussion of Venezuelan politics should be in the open thread, but politics are going to determine
how much oil is produced there for the next few years, and the situation looks iffy indeed.
Concerning Freddy's chart of production profile of wells drilled in various years.
They all line up by about month 18 of production. This should not be possible. The later wells
have many more stages of frack. They are longer, draining more volume of rock. But the chart says
what it says. At month about 18 the 2014 wells are flowing the same rate as 2008 wells. We know
stage count has risen over those 6 yrs. 2014 wells should flow a higher rate. The shape of the
curve can be the same, but it should be offset higher.
Explanation?
How about above ground issues . . . older wells get pipelines and can flow more oil . . . nah,
that's absurd.
There needs to be a physical explanation for this.
These new wells have higher IPs, but also higher decline rates.
Closer spacing (see Freddy's comment above) and depletion of the sweet spots may also impact production
curves and EURs.
That doesn't make sense. They are longer. By a factor of 2ish. How can a 6000 foot lateral flow
exactly the same amount 2 yrs into production as a 3000 foot lateral flows 2 yrs into production?
Look at the lines. At 18 months AND BEYOND, these longer laterals flow the same oil rate as
the shorter laterals did at the same month number of production. Higher IP and higher decline
rate will affect the shape, but There Is Twice The Length..
I don't think we have information on the length of the wells, since 2008 the length of the
lateral has not changed, just the number of frack stages and amount of proppant. This seems to
primarily affect the output in the first 12 to 18 months, and well spacing and room in the sweet
spots no doubt has some effect (offsetting the greater number of frack stages etc.).
The combination of longer lateral lengths and advancements in completion technology has allowed
operators to increase the number of frac stages during completions and space them closer together.
The result has been a higher completion cost per well but with increased production and more emphasis
on profitability.
In the past five years, DTC Energy Group completion supervisors in the Bakken have helped oversee
a dramatic increase from an average of 10 stages in 2008 to 32 stages in 2013. Even 40-stage fracs
have been achieved.
One of the main reasons for this is the longer lateral lengths – operators now have twice as
much space to work with (10,000 versus 5,000 feet along the lateral). Frac stages are also being
spaced closer together, roughly 300 feet apart as compared to spacing up to 800 feet in 2008,
as experienced by DTC supervisors.
By placing more fracture stages closer together, over a longer lateral length, operators have
successfully been able to improve initial production (IP) rates, as well as increase EURs over
the life of the well.
blah blah, but they make clear the years have increased length. Freddy was talking about well
spacing, this text is about stage spacing, but that is achieved because of lateral length.
Freddy can you revisit your graph code? It's just bizarre that different length wells have
the same flow rate 2 yrs out, and later.
Take a look at Enno´s graphs at https://shaleprofile.com/
. They look the same as my graphs and we have collected and processed the data independently
from each other.
If the wells have the same wellbore riser design irrespective of lateral length (i.e. same depth,
which is a given, same bore, same downhole pump) then that section might become the main bottleneck
later in life and not the reservoir rock. With a long fat tail that seems more likely somehow
compared to the faster falling Eagle Ford wells say (but that is just a guess really). But there
may be lots of other nuances, we just don't have enough data in enough detail especially on the
late life performance for all different well designs – it looks like the early ones are just reaching
shut off stage in numbers now. I doubt if the E&Ps concentrated on later life when the wells were
planned – they wanted early production, and still do, to pay their creditors and company officers
bonuses (not necessarily in that order).
Hmmm. I know it is speculation, but can you flesh that out?
If some bottleneck physically exists that defines a flow rate for all wells from all years
then that does indeed explain the graphs, but what such thing could exist that has a new number
each year past year 2?
We certainly have discussed chokes for reservoir/EUR management, but the same setting to define
flow regardless of length?
The flow depends on the available pressure drop, which is made up of friction through the rock
and up the well bore (plus maybe some through the choke but not much), plus the head of the well,
plus a negative number if there is a pump. The frictional and pump numbers depend on the flow
and all the numbers depend on gas-oil ratio. Initially there is a big pressure drop in the rock
because of the high flow, then not so much. Once the flow drops the pressure at base of the well
bore just falls as a result of depletion over time, the effect of the completion design is a lot
less and lost in the noise, so all the wells behave similarly. That's just a guess – I have never
seen a shale well and never run a well with 10 bpd production, conventional or anything else.
A question might be if the flow is the same why doesn't the longer well with the bigger volume
deplete more slowly, and I don't know the answer. It may be too small to notice and lost in the
noise, or to do with gas breakout dominating the pressure balance, or just the way the the physics
plays out as the fluids permeate through the rock, or we don't have long enough history to see
the differences yet.
The number of rail cars hauling petroleum is a constant in the range of 7,200 to 7,400 petroleum
cars hauled each week for a good six months now.
Seems as though petroleum by rail is more of a necessity than a choice.
The volume is down a good thirty percent since about 2013 when over 10,000 cars were hauled
per week.
Demand decreases, contracts expire, better modes of transport emerge and cost less. not as
much call for Bakken oil. Plenty of the stuff somewhere else in this world.
The trend is down, not up for petroleum hauled by rail.
If there were orders for Bakken oil for one million bpd, the production would be one million
bpd.
Over the whole rail system, petroleum and petroleum product rail car loadings were down to
10.5 thousand in September. That compares to a high point of 16.3 thousand railcars in Sept of
2014.
Coal car loadings are on the rise, from a low of 61,000 in April to 86,000 in Sept. Coal was
running a near steady 105,00 to 110,000 railcars every month in 2013 and 2014.
The chart below from RBN shows that Bakken pipeline capacity did not increase since early 2015.
But production dropped, and this primarily affected volumes of Bakken oil transported by rail.
Given the higher percentage of oil transported by pipelines, the average transporation cost
for Bakken crude should have decreased. Interesting, however, that the price differential between
the well-head Bakken sweet crude and WTI has remained within the $10-12/bbl range.
Bakken Crude Production and Takeaway Capacity
Source: RBN
Bakken Blend differentials at terminals close to North Dakota wellheads held their lowest assessment
since December Tuesday, closing at the calendar-month average of the NYMEX light sweet crude oil
contract (WTI CMA) minus $6.25/b.
While one factor dragging on Bakken differentials has clearly been a tight Brent/WTI spread -
trading around 42 cents/b Tuesday, well in from the steady $2/b seen this summer - the return
of Louisiana Light Sweet to the Midwest market may also be having an impact, according to traders.
One trader said there was an increase in volumes heading up the Capline pipeline, however, differentials
suggest LLS is still too expensive, at least compared to Bakken. Platts assessed LLS at WTI plus
$1.15/b Tuesday.
Considered by some to be the "champagne of crudes," it is unclear what appeal LLS still has for
a Midwest refiner as margins for LLS actually - and unusually - lag those for Bakken.
S&P Global Platts data shows LLS cracking margins in the Midwest closed at $3.30/b Monday, compared
to Bakken cracking margins of $6.37/b. In fact, the advantage of cracking Bakken has grown steadily
since August.
Platts margin data reflects the difference between a crude's netback and its spot price.
Netbacks are based on crude yields, which are calculated by applying Platts product price assessments
to yield formulas designed by Turner, Mason & Co.
What is clear however, is that the steeper discounts available for Bakken provide the biggest
incentive for a Midwest refiner.
The cost of getting Bakken to this market is around $3.48/b, according to Platts netback calculations,
compared to just $1.02/b for LLS.
These costs make up a significant portion of the Bakken discount.
Further, LLS moving up the Capline after many years of relative inactivity does not necessarily
suggest a new trend is in the making. However, recent pipeline reversals between Texas and Louisiana
mean more Permian crudes are capable of reaching Louisiana refineries, and thus, if priced accordingly,
could displace incremental volumes of LLS from its home market.
With current pipeline capacity out of North Dakota typically full, the marginal Bakken barrel
often gets to market via rail, and this cost has traditionally sets the floor to Bakken's discount
to WTI. And part of the recent downturn in Bakken could be chalked up to an increase in railed
volumes to the US Atlantic Coast, as Bakken cracking margins there are again in the black.
In fact, Association of American Railroad's latest monthly and weekly data shows crude and refined
product rail movements appear to have bottomed, having grown in September from August.
Weekly data bears this out as well, showing increases in three of the last four weeks.
It remains to be seen how long this will last, however, should Energy Transfer Partners Dakota
Access Pipeline go ahead as planned.
Linefill for the pipeline could boost Bakken differentials, potentially making the grade too expensive
to rail east. However, the devil is in the details.
Traders and analysts have pegged Dakota Access pipeline tariffs between $4.50-$5.50/b for uncommitted
shippers between North Dakota and Patoka, Illinois. A further $6.50/b would be needed to bring
the crude south from Patoka to Nederland, Texas, sources have said.
If this $11-$12/b combined pipeline estimated cost were to pan out, it would be more expensive
than the $10.20/b Platts assumes in its Bakken USAC rail-based netback calculation.
Oil rig count in the Permian is up 73.5% from this year's low – the biggest increase among
all US basins.
It is still only 41% of October 2014 peak, but this is much better than the Bakken and especially
the Eagle Ford where drilling activity remains depressed.
As of September 2016, 4 counties produced 90.1% of all the Bakken/Three Forks oil production
in North Dakota: McKenzie, Mountrail, Williams and Dunn. Relative to December 2014, North Dakota
Bakken/Three Forks oil production is off 243,098 b/d relative to December 2014 while the number
of producing wells is up 1861 based upon data from the state.
Based upon state data, the number of producing wells/square mile is 1.29 in Mountrail County,
1.22 in McKenzie County, 1.02 in Willams County, and 0.86 in Dunn County. How high can the number
of producing wells/square mile go?
Is there something more than reduced drilling to explain the drop in production?
This shows well density and production from last September. The distance is concentric from a
"production centre of gravity" – i.e. weighted average by production for all wells. The core area
("sweet spot") is a circle of about 50 to 60 kms only (it's squashed out a bit to the west and
missing a bite in the SW). Maximum well density (and with the best wells is 120 to 160 acres,
and falls off quickly outside the core. The core is getting saturated.
"U.S. drilling activity is increasingly concentrated in the Permian Basin . The Permian now
holds nearly as many active oil rigs as the rest of the United States combined, including both
onshore and offshore rigs, and it is the only region in EIA's Drilling Productivity Report where
crude oil production is expected to increase for the third consecutive month."
Permian Basin also dominates M&A activity in the US E&P sector.
From the same EIA report:
"Several of the larger M&A deals involved Permian Basin assets, where drilling and production
is beginning to increase.
Based on data through November 10, the second half of 2016 already has more M&A spending than
the first half of 2016, but on fewer deals. The 93 M&A announcements in the third quarter of 2016
totaled $16.6 billion, for an average of $179 million per deal, the largest per deal average since
the third quarter of 2014. Although only 11 of the 49 deals so far in the fourth quarter of 2016
are in the Permian Basin, they accounted for more than half of total deal value."
RRC Texas for September came out recently. As others will probably elaborate more on the data,
I just want to show if year over year changes in production could be use as a predictive tool
for future production (see below chart).
It is obvious that year over year changes (green line) beautifully predicted oil production
(red line) at a time lag of about 15 month. Even when production was still growing, the steep
decline of growth rate indicated already the current steep decline.
The interesting thing is that the year over year change is a summary indicator. It does not
tell why production declines or rises. It can be the oil price, interest rates or just depletion
– even seasonal factors are eliminated. It just shows the strength of a trend.
I am curious myself how this works out. The yoy% indicator predicts that Texas will have lost
another million bbl per day by end next year. That sounds quite like a big plunge. One explanation
could be the fact that we have now low oil prices and high interest rates. In all other cycles
it has been the other way around: low oil prices came hand in hand with low interest rates. This
could be now a major obstacle for companies to grow production.
This concept of following year over year changes works of course just for big trends, yet for
investment timing it seems exactly the right tool. Another huge wave is coming in electric vehicles
which are growing in China by 120% year over year. Here we have the same situation as for shale
7 years ago: Although current EV sales are barely 1 million per year worldwide, the growth rate
reveals already an huge wave coming. So as an investor it is always necessary to stay ahead of
the trend and I think this can be done by observing the year over year% change.
"... As of September 2016, 4 counties produced 90.1% of all the Bakken/Three Forks oil production in North Dakota: McKenzie, Mountrail, Williams and Dunn. Relative to December 2014, North Dakota Bakken/Three Forks oil production is off 243,098 b/d relative to December 2014 while the number of producing wells is up 1861 based upon data from the state. ..."
"... This shows well density and production from last September. The distance is concentric from a "production centre of gravity" – i.e. weighted average by production for all wells. The core area ("sweet spot") is a circle of about 50 to 60 kms only (it's squashed out a bit to the west and missing a bite in the SW). Maximum well density (and with the best wells is 120 to 160 acres, and falls off quickly outside the core. The core is getting saturated. ..."
"... "U.S. drilling activity is increasingly concentrated in the Permian Basin . The Permian now holds nearly as many active oil rigs as the rest of the United States combined, including both onshore and offshore rigs, and it is the only region in EIA's Drilling Productivity Report where crude oil production is expected to increase for the third consecutive month." ..."
"... "Several of the larger M&A deals involved Permian Basin assets, where drilling and production is beginning to increase. Based on data through November 10, the second half of 2016 already has more M&A spending than the first half of 2016, but on fewer deals. The 93 M&A announcements in the third quarter of 2016 totaled $16.6 billion, for an average of $179 million per deal, the largest per deal average since the third quarter of 2014. Although only 11 of the 49 deals so far in the fourth quarter of 2016 are in the Permian Basin, they accounted for more than half of total deal value." ..."
The number of rail cars hauling petroleum is a constant in the range of 7,200 to 7,400
petroleum cars hauled each week for a good six months now.
Seems as though petroleum by rail is more of a necessity than a choice.
The volume is down a good thirty percent since about 2013 when over 10,000 cars were
hauled per week.
Demand decreases, contracts expire, better modes of transport emerge and cost less. not
as much call for Bakken oil. Plenty of the stuff somewhere else in this world.
The trend is down, not up for petroleum hauled by rail.
If there were orders for Bakken oil for one million bpd, the production would be one
million bpd. Bakken oil lost marketshare due to price drop. Buyers can buy oil from
anywhere.
More Bakken petroleum is being moved by pipeline. Over the whole rail system, petroleum
and petroleum product rail car loadings were down to 10.5 thousand in September. That
compares to a high point of 16.3 thousand railcars in Sept of 2014.
Coal car loadings are on the rise, from a low of 61,000 in April to 86,000 in Sept.
Coal was running a near steady 105,00 to 110,000 railcars every month in 2013 and 2014.
The chart below from RBN shows that Bakken pipeline capacity did not increase since
early 2015. But production dropped, and this primarily affected volumes of Bakken oil
transported by rail.
Given the higher percentage of oil transported by pipelines, the average
transportation cost for Bakken crude should have decreased. Interesting, however,
that the price differential between the well-head Bakken sweet crude and WTI has
remained within the $10-12/bbl range.
Bakken Crude Production and Takeaway Capacity
Source: RBN
Bakken Blend differentials at terminals close to North Dakota wellheads held their
lowest assessment since December Tuesday, closing at the calendar-month average of
the NYMEX light sweet crude oil contract (WTI CMA) minus $6.25/b.
While one factor dragging on Bakken differentials has clearly been a tight Brent/WTI
spread - trading around 42 cents/b Tuesday, well in from the steady $2/b seen this
summer - the return of Louisiana Light Sweet to the Midwest market may also be having
an impact, according to traders.
One trader said there was an increase in volumes heading up the Capline pipeline,
however, differentials suggest LLS is still too expensive, at least compared to
Bakken. Platts assessed LLS at WTI plus $1.15/b Tuesday.
Considered by some to be the "champagne of crudes," it is unclear what appeal LLS
still has for a Midwest refiner as margins for LLS actually - and unusually - lag
those for Bakken.
S&P Global Platts data shows LLS cracking margins in the Midwest closed at $3.30/b
Monday, compared to Bakken cracking margins of $6.37/b. In fact, the advantage of
cracking Bakken has grown steadily since August.
Platts margin data reflects the difference between a crude's netback and its spot
price.
Netbacks are based on crude yields, which are calculated by applying Platts
product price assessments to yield formulas designed by Turner, Mason & Co.
What is clear however, is that the steeper discounts available for Bakken provide
the biggest incentive for a Midwest refiner.
The cost of getting Bakken to this market is around $3.48/b, according to Platts
netback calculations, compared to just $1.02/b for LLS.
These costs make up a significant portion of the Bakken discount.
Further, LLS moving up the Capline after many years of relative inactivity does
not necessarily suggest a new trend is in the making. However, recent pipeline
reversals between Texas and Louisiana mean more Permian crudes are capable of
reaching Louisiana refineries, and thus, if priced accordingly, could displace
incremental volumes of LLS from its home market.
With current pipeline capacity out of North Dakota typically full, the marginal
Bakken barrel often gets to market via rail, and this cost has traditionally sets the
floor to Bakken's discount to WTI. And part of the recent downturn in Bakken could be
chalked up to an increase in railed volumes to the US Atlantic Coast, as Bakken
cracking margins there are again in the black.
In fact, Association of American Railroad's latest monthly and weekly data shows
crude and refined product rail movements appear to have bottomed, having grown in
September from August.
Weekly data bears this out as well, showing increases in three of the last four
weeks.
It remains to be seen how long this will last, however, should Energy Transfer
Partners Dakota Access Pipeline go ahead as planned.
Linefill for the pipeline could boost Bakken differentials, potentially making the
grade too expensive to rail east. However, the devil is in the details.
Traders and analysts have pegged Dakota Access pipeline tariffs between
$4.50-$5.50/b for uncommitted shippers between North Dakota and Patoka, Illinois. A
further $6.50/b would be needed to bring the crude south from Patoka to Nederland,
Texas, sources have said.
If this $11-$12/b combined pipeline estimated cost were to pan out, it would be
more expensive than the $10.20/b Platts assumes in its Bakken USAC rail-based netback
calculation.
Oil rig count in the Permian is up 73.5% from this year's low – the biggest increase
among all US basins.
It is still only 41% of October 2014 peak, but this is much better than the Bakken and
especially the Eagle Ford where drilling activity remains depressed.
As of September 2016, 4 counties produced 90.1% of all the Bakken/Three
Forks oil production in North Dakota: McKenzie, Mountrail, Williams and Dunn.
Relative to December 2014, North Dakota Bakken/Three Forks oil production is off
243,098 b/d relative to December 2014 while the number of producing wells is up 1861
based upon data from the state.
Based upon state data, the number of producing wells/square mile is 1.29 in
Mountrail County, 1.22 in McKenzie County, 1.02 in Willams County, and 0.86 in Dunn
County. How high can the number of producing wells/square mile go?
Is there something more than reduced drilling to explain the drop in production?
This shows well density and production from last September. The distance is
concentric from a "production centre of gravity" – i.e. weighted average by
production for all wells. The core area ("sweet spot") is a circle of about 50 to
60 kms only (it's squashed out a bit to the west and missing a bite in the SW).
Maximum well density (and with the best wells is 120 to 160 acres, and falls off
quickly outside the core. The core is getting saturated.
"U.S. drilling activity is increasingly concentrated in
the Permian Basin . The Permian now holds nearly as many active oil rigs as the rest of
the United States combined, including both onshore and offshore rigs, and it is the only
region in EIA's Drilling Productivity Report where crude oil production is expected to
increase for the third consecutive month."
Permian Basin also dominates M&A activity in the US E&P sector.
From the same EIA
report:
"Several of the larger M&A deals involved Permian Basin assets, where drilling
and production is beginning to increase.
Based on data through November 10, the second half of 2016 already has more M&A spending
than the first half of 2016, but on fewer deals. The 93 M&A announcements in the third
quarter of 2016 totaled $16.6 billion, for an average of $179 million per deal, the
largest per deal average since the third quarter of 2014. Although only 11 of the 49
deals so far in the fourth quarter of 2016 are in the Permian Basin, they accounted for
more than half of total deal value."
"U.S. shale oil production is expected to fall for a tenth consecutive month
in September, according to a U.S. government forecast released on Monday, as
low oil prices continue to weigh on production.
"Total output is expected to drop 85,000 bpd to 4.47 million bpd, according
to the U.S. Energy Information Administration's drilling productivity report.
That is the lowest output number since April 2014.
"The EIA's previous forecast calling for an output decline in August of 99,000
bpd was revised up to nearly 112,000 bpd, data shows.
"Bakken production from North Dakota is expected to fall 26,000 bpd, while
production from the Eagle Ford formation is expected to drop 53,000 bpd. Production
from the Permian Basin in West Texas is expected to rise 3,000 bpd, according
to the data."
Ron's graphs summarised this better but I don't have the previous history
to show it. Has anybody here explained why Eagle Ford drops are so much more
than Bakken?
The DPR tends to overestimate the decline in the Eagle Ford.
Enno Peters uses Texas RRC data to estimate Eagle Ford output and that also
underestimates output for the same reason that Texas data in general is too
low because it is incomplete.
I have estimated Eagle Ford output by finding the percentage of total Texas
C+C output from the Eagle Ford for each of the most recent 24 reported months
and than multiplied this percentage by Dean Fantazzini's estimate of Texas C+C
output (which is better than any other estimate in my opinion).
The Chart below compares this method using Dean's estimate (DC estimate)
and the EIA estimate for Texas C+C output, to find Eagle Ford output through
June 2016.
The reason Eagle Ford output has decreased more rapidly is because the wells
decline more rapidly and because the ramp up in the Eagle Ford was more rapid
than in the Bakken/Three Forks so that a lot more wells are declining at once.
It shows the number of new wells completed in the Eagle Ford (he calls these
wells "first flow" as in the month that the well started producing oil). Compare
this chart to the Bakken chart in the post.
I don't know if they might have reached saturation in the sweet spots in
the Eagle Ford, they seem to have an advantage in Texas with infrastructure
and pipeline capacity, but a lot of that has now been established in North Dakota
so going forward the main advantage for Texas is lower transportation costs
to refineries.
> Has anybody here explained why Eagle Ford drops are so much more than Bakken?
Although the number of new wells producing dropped very similarly (relatively)
in these two basins, Eagle Ford wells decline faster after initial production.
You can see this most clearly by:
1. Going to my latest US presentation
here .
2. Go to the "Well quality" tab.
3. Group wells by "Basin".
=> You can see the profiles of the average well in each of the basins, and
that Bakken wells in general have a longer production life. Note that there
is some distortion as especially the early 2007-2008 Bakken wells (Sanish &
Parshall) were exceptionally good.
You can play with the "first flow" filter to see this for wells starting
in different years.
Thanks. Using your link above I created the following chart from your website.
I compare only wells with first flow from 2012 to 2016 because the Eagle
Ford play did not really start being developed as an oil basin until late 2010
and they probably hadn't really figured out optimal well spacing and frack setup
until 2012.
This demonstrates the steeper decline for the Eagle Ford that you refer to.
No, the "other" represents other horizontal wells that were drilled in Texas
in the last couple of years, outside the Eagle Ford & Permian area, e.g. in
the Barnett, Granite Wash, etc.
These charts from the EIA confirm your conclusions.
They show that, while IP rates in the Bakken and the Eagle Ford are similar,
EFS production rates are declining much faster.
Would be interesting to know if this is due to more rapidly falling reservoir
pressures, different completion techniques, or something else.
New-well oil production per rig is higher in the Eagle Ford.
Apparently, this is because EFS is shallower and it takes less time to drill
a well than in the Bakken.
As a result, more wells can be drilled by 1 rig in the same period of time.
To put Enno's "relatively" into perspective: Peak output of Eagle Ford used
to be bigger than peak output of Bakken. The more you have, the more you can
lose.
The number of drilled but uncompleted wells is bigger in the Eagle Ford.
According to Rystad Energy, it was 1000 as of May 2016 in EFS vs. 850 in the
Bakken.
The intentionally postponed (abnormal) part of the DUC inventory has been growing
much faster in the Eagle Ford than in the Bakken since mid-2015.
That could also explain steeper declines in EFS oil production vs. the Bakken.
Bloomberg shows a different trend in DUCs inventory: a decline in the Eagle
Ford vs. continued growth in the Bakken. That would suggest more resilient production
volumes in EFS.
But I think that Rystad's estimate is more reliable.
"... it seem that the IP's out of the Bakken in the Daily reports are trending towards the "less spectacular"? Lots of sub 1,000, and more than a few sub 500 BO IP. ..."
"... I always thought that EOG was the "darling" of the group. But, they having the lowest % of remaining – 36% (64% produced). In that regard, with respect to the production remaining, can you advise "about" how many years of production is represented for an average producer that you note? ..."
This comment is without me doing any analysis, but does it seem that the IP's out of the Bakken
in the Daily reports are trending towards the "less spectacular"? Lots of sub 1,000, and more
than a few sub 500 BO IP.
I created a presentation where I show where
oil production from existing shale US wells is heading in the coming years. It only includes
the actual & projected production of horizontal wells that started production before 2016.
Enno – Excellent information! I always thought that EOG was the "darling" of the group. But, they
having the lowest % of remaining – 36% (64% produced). In that regard, with respect to the production
remaining, can you advise "about" how many years of production is represented for an average producer
that you note?
I don't get your question exactly, can you rephrase? The remaining production is all the production
that is still expected from the legacy wells, in the coming 20 years, although most of it will
of course be produced early on.
"... It looks like the increase in GOR has finally stopped, at least for wells earlier than 2015. GOR for 2015 is still increasing fast. 2008 and 2009 are on the other hand decreasing. ..."
"... Here we can see that for 2009 there is a huge drop, about 6%. As a comparison it would translate into more than 50% in one year. ..."
"... This graph looks like a mess, I know. I hope you can make something out if though. It shows the percentage of wells that are producing in a certain month. There is a downward trend over time, but the oil price is not affecting it much at all. ..."
Hello guys. Here is my updated Bakken GOR graph. It looks like the increase in GOR has finally
stopped, at least for wells earlier than 2015. GOR for 2015 is still increasing fast. 2008 and
2009 are on the other hand decreasing. So what does this mean for production? Lets see in
my next graph bellow.
Here we can see that for 2009 there is a huge drop, about 6%. As a comparison it would translate
into more than 50% in one year. But of course you should not extrapolate from a (cherry picked)
single month like that. For 2008 there is instead a slight increase. At least some of that can
be explained by that some wells that were previously not producing, are now back online. I don´t
know how much of an effect that has though. I´ll show more about that in my next graph. 2013 has
slowed down the decline since last month, but is still bellow 2012. So overall nothing dramatic
except for 2009.
This graph looks like a mess, I know. I hope you can make something out if though. It shows the
percentage of wells that are producing in a certain month. There is a downward trend over time,
but the oil price is not affecting it much at all. It´s only this spring when the oil price was
in the 30s that you can notice some decline. But it´s not more than 1-2% of the wells that were
put offline. Never the less, there were some wells that were put back on production in May which
should have a positive effect on production. Also ,the total producing "days" for all wells combined
has increased by about 5% since last month (which I don´t show in any graph here).
"... You and SS (and others) have quite the inaccurate idea about shale company financing and the role of oil price on that. This type of linear/classical thinking (i.e.: "…price rose, so the banks must lent to the drillers now…") does not represent the reality today when loans to the drillers are used as futures' derivatives' bets and far, far, far exceed the ability of some of these companies to pay back their debt even if oil was to be $1.000/brl for the next 20 years. ..."
"... Much higher oil prices would give the shale folks the ABILITY to pay debt. Question is, wouldn't they drill more wells instead, and roll over the debt? So, what would happen if US, Europe and Japan just coordinated .25 rate hikes each quarter for the next three years? Would that result in a catastrophe? Rune Likvern , 06/16/2016 at 10:07 pm Shallow, What most oil companies [other companies/entities as well] did as they assumed more debt was in reality to enter into a bet that consumers would be able to access more credit/go deeper into debt to enable the oil companies to retire their debts which was assumed to pay for development of costlier oil. [Rollovers are not retirement.] ..."
"... Debt is borrowing from the future. ..."
"... "Some describes this process as transforming wealth into income." Or perhaps it's just transforming billionaires into trillionaires and leaving the rest where they are (or worse). ..."
"... If oil went to $100 WTI, and stayed there for 5 years, and gas went to $6 per mcf, and stayed there for five years, and if the shale companies determined to only spend enough CAPEX to maintain flat production, I think they could generally pay off, or at least substantially pay down debt, in that 5 year period. Some are better off than others. ..."
you get entangled so much in numbers, data and lines that you miss and/or
confuse the logical big picture.
-Before we enter price/brl/oil and financing of drillers into the equation
and, well before we then discuss if your's or somebodyelse's (i.e.: virwimp's)
are the more plausible scenarios and more likely to materialize, we have
to see if your chart stands logically and mathematically.
And looking at it, that can be only if the following conditions are met:
The "sweet spot/s" of Bakken has not yet been found and it will
be in 2019-2020.
The "i-gadgets" of fracking technology have gotten so advanced by
2019-2020 that we can expects wells then to have 30-50-70% more output/day
than the comparable well of 2014-2015 (% are for illustration only,
I have not crunched the numbers to be precise).
Judging by that almost plateau-ish curb top you have on your production
line 2020-2025, the decline rates of wells in 2020-2025 are far, far.
far less than those of comparable wells of 2014-2015.
All of the above
Now, can you (or anyone who knows a thing, or two about oil and mathematics
for that matter) explain and defend the above scenario logically and scientifically?
Don't you see to much magic and wishful thinking?
If you can do that (explain logically and scientifically), then and only
then I will engage in the price/financing debate with you and after that,
in the one that discusses which is the most plausible to represent reality
10-20-30 years in the future.
Be well,
Petro
P.S.: You and SS (and others) have quite the inaccurate idea about
shale company financing and the role of oil price on that.
This type of linear/classical thinking (i.e.: "…price rose, so the banks
must lent to the drillers now…") does not represent the reality today when
loans to the drillers are used as futures' derivatives' bets and far, far,
far exceed the ability of some of these companies to pay back their debt
even if oil was to be $1.000/brl for the next 20 years.
But that is a very complex matter which you (and I am not being offensive
here…believe me!) and almost all here cannot understand easily, so I will
leave that for another day.
Much higher oil prices would give the shale folks the ABILITY to pay
debt. Question is, wouldn't they drill more wells instead, and roll over
the debt?
So, what would happen if US, Europe and Japan just coordinated .25
rate hikes each quarter for the next three years?
What most oil companies [other companies/entities as well] did as
they assumed more debt was in reality to enter into a bet that consumers
would be able to access more credit/go deeper into debt to enable the oil
companies to retire their debts which was assumed to pay for development
of costlier oil. [Rollovers are not retirement.]
Central banks lowering the interest rate [described as interest suppression
by many] served several purposes like easing services of existing debt overhang
and allow for further debt expansion in an effort to bring our economies
back on the [economic] growth trajectory.
Debt is borrowing from the future.
Increasing the interest rate as described by a quarter percent over 3
years would introduce severe strain on the system as it becomes harder to
service the present huge debt overhang and make it hard for anyone to assume
more debt [it would likely blow out many balance sheets].
The Fed now keeps deferring further increases to the feds funds rate.
The Fed is worried about what an increase could entail.
In short a higher interest rate would bring the oil price down as more income
becomes diverted to servicing debts and thus less available to pay for amongst
other things higher priced oil.
First you described the interest rate with raising it a quarter percent
each quarter over 3 years. (Something became omitted in my reply, but it
looks like the objective of the discussion was sustained.)
What you describe about those who live on income from their own savings
or pension funds I agree with, lower interest rates now wreaks havoc with
many pension plans and also the insurance industry.
I also agree that ultra low rates have caused misallocation of capital.
Yield starved investors started chasing riskier projects/investments.
To me this illustrates that there is no easy fix to the interest dilemma.
Damned if interest rates are raised and damned if they are not.
Low rates have led to capital destruction, I agree.
Some describes this process as transforming wealth into income.
"Some describes this process as transforming wealth into income." Or
perhaps it's just transforming billionaires into trillionaires and leaving
the rest where they are (or worse).
"Much higher oil prices would give the shale folks the ABILITY to pay debt."
-NO.
Debt is at unsustainable levels. You seem to have missed the P.S. section
of the comment of mine you replied to. I suggest you revisit it.
"Question is, wouldn't they drill more wells instead, and roll over the
debt?"
-That is NOT the question. That is the ONLY thing they can do with higher
oil prices at this point.
"So, what would happen if US, Europe and Japan just coordinated .25 rate
hikes each quarter for the next three years?
Would that result in a catastrophe?"
Folks who say: "ahh, what's a .25% increase to our economy? Nothing…let
the FED do that…" know nothing about the economy and finance. Do not waste
your time listening to them.
As I said this is a very complex matter, but for now let me tell you that
the economy and finance work NOT on nominal rates (the famous FED rate,
or BOJ rate or ECB rate you hear about on TV and how they manipulate it…ha,
ha, ha…), but on REAL interest rates …which are totally a different beast.
If the FED, BOJ and ECB did what you suggest and in a coordinated matter
increased the nominal rate .25% every quarter we would literally plunge
into the dark ages in short, very short order!!!!
Who tells you otherwise is an idiot.
Forget about the "PONZI FIAT money scheme" and the "FED MANIPULATION" you
hear from obviously "experts" on the matter here and elsewhere….
FED, BOJ and ECB have NO choice but to lower the rates and print digits/money.
Again, I cannot stress this enough:
who tells you otherwise, and who tells you that (at this point in time)
we can go to a gold standard, or some kind responsible debt reduction economy
knows nothing of today's economy and finance and is an idiot.
And NO, this has nothing to do with some kind of Marxist redistribution
of wealth.
Even if we somehow did that, we would still be in the same place in the
near future.
It is human nature and the behavior of our inner human animal.
That is why a while back – when everybody was saying that FED is increasing
rates and rates will go up – I told you: " 10year note is going to 1% BEFORE
going to 3% like everybody says…."
….and perhaps is going to 0% soon.
Expect no more rate increases and going back to QE (with other names perhaps)
– NOT because the FED is evil (as you hear here all the time) but because
there is NO other choice!
Rates shall spike up in the future, but when they do is time to go underground
with our loved ones, a loaf of bread, a gun and pray….if you believe that
is'
Pay, pray, pray that Yellen, Kuroda and Draghi go each month on TV and
bullshit us some more, for if they do not …..well let's just say that we
will not have computers to reply to each other anymore…..
"Rates shall spike up in the future, but when they do is time to go underground
with our loved ones, a loaf of bread, a gun and pray….if you believe that
is'"
Petro ….'a' gun come now. all things being equal i think I will have
a couple of semi auto, as well as revolvers, pump action and double barrels.
Ironic so many here can make a reasoned case for civil breakdown and at
the same time want to restrict guns of law abiding citizens. I suspect your
analysis posted here is more realistic than many others, the timing issue
is the real question. Next up more QE and then helicopter money!
If oil went to $100 WTI, and stayed there for 5 years, and gas went
to $6 per mcf, and stayed there for five years, and if the shale companies
determined to only spend enough CAPEX to maintain flat production, I think
they could generally pay off, or at least substantially pay down debt, in
that 5 year period. Some are better off than others.
I suspect costs would rise, both LOE and CAPEX, but I will do an example.
Shale R Us has 200,000 BOE per day, 80% oil 20% gas. So, lets say after
well head discounts, they get $85 per BOE. LOE is $8. G & A is $3. They
have to spend $20 per BOE in CAPEX to keep production at 200,000 BOE per
day ($1.46 billion per year). Severance tax is 10%. They have $3 billion
of debt, interest rate is 6%.
By my calculations, over five years, Shale R Us generates $16.6075 billion
of pre-tax and pre-interest cash flow in this scenario. There is $900 million
of interest that has to be paid, plus the $3 billion of principal. Assuming
income tax of 35%, subtract about $5.5 billion for income tax.
I come up with Shale R Us having $7.2 billion left in this scenario,
at the end of five years after payment of income tax, principal and interest.
I did this quickly, so if there are computational errors, let me know
and I will correct them.
Now, my example is of a strong company. Most wont work out that well,
but they can pay the debt off at $100 WTI plus $6 gas.
Petro, you are either talking over my head and/or we are talking past
each other. I am not considering what those prices do to the world economy,
demand, etc., only whether Shale R Us can eliminate their debt.
Sorry if I am too dense to follow how $1,000 oil for 20 years would not
cause all the LTO companies to mint money. Again, not talking about the
economy, etc. Just doing math, really.
you are falling in the same trap as Dennis: getting entangled in too
much data.
Yes indeed, as you say, I am talking way above your head here.
Now before you hate me, trust me I mean no disrespect.
But the subject is such….so please stay with me.
What you are asking me is another difficult and long answer.
I either have to do that post I mentioned about debt and money, or stop
answering and replying.
First of, you have the wrong idea as to how the financing of shale drillers
happens.
The way you think it happens (i.e.: they go to bank, present their business
model and oil price expectations and blah, blah , blah and bingo….Goldman
gives them the money!) does not exist anymore.
It indeed happened that way (more or less, of course I am simplifying) PRIOR
to 2000 – not today.
Goldman (or any bank…put the name you like here) uses the oil price and
business model of the sale player ONLY to bullshit the shareholders into
voting it…..it does not give a crap what the company does and how it does
it and at what price.
Here where the "beauty" starts:
that loan then, which on bank's balance sheet is considered an asset, is
re-hypothecated dozens, upon dozens, upon dozens of times as a futures'
OTC derivatives' bet with businesses that have nothing to do with shale
players and are half a world away – china let's say.
So, if one too many of them fail, driven out of business by responsible
guys like you – even though their combined debt size is nothing compared
to….oh, lets say JP Morgans' assets, the avalanche it starts buries us all.
You are thinking in terms of only one good company – that my friend is
linear/classical thinking.
Is like this: the risk increased by 2 times so the outcome shall be 2 times
worse or maybe 4.
That to you (and most) is manageable if you tighten your belt and plan well.
-But our economy and our energy/finance system is a COMPLEX INTERCONNECTED
SYSTEM.
That means that small stimuli, bring about exponentially worse and uncontrollable
outcomes.
Its like Lehman Bros. in 2008.
Their assets and liabilities were nothing compared to the whole economy…..but
the cascade they would have started would have plunged the entire global
finance/economy into dark ages within hours…literally.
So, contrary to what you have learned by "experts" here that: "…the Evil
FED helped their crony bodies and destroyed the economy…ha, ha , ha…", if
the 1st QE aka TARP did not happened, we literally would have eaten each
other as food by now (walking dead type thing….ish).
DEBT cannot be eliminated.
It has to increase more and more if you would like to continue the life
you have.
If we eliminate debt, we eliminate money including that $100 that you like
to get per barrel of your own oil…………it cannot be!
Stick that in your head.
Petro. I'd like to see a post from you. I doubt you'd get blasted, and if
you do, so what? If anything, I kind of enjoy debating this stuff with someone
on the other side.
Couple of questions.
First, you talk about shareholders approving loans. I am assuming you
just misspoke, as shareholders of banks do not approve of anything, except
voting on directors, some compensation issues, and sometimes stuff put on
proxy cards by activists (i.e. divest of fossil fuel loans LOL!)
Second, I did not think that reserve based energy loans were being packaged
and sold in derivative markets, at least not like home mortgages were. I
also was unaware banks were insuring them to a large extent with CDS's.
My understanding is there is a consortium of banks on most of these,
with one bank as lead, the others each taking a participating percentage.
The note is secured by a first lien on the shale company assets. The size
of the loan is based on the PV10 (or PV9) of the assets, with PDP valued
at 100% and with PDNP, PDBP and PUD possibly being given some collateral
value, but being greatly discounted, say for PUD, maybe assigned only 20-30%
of PV10.
The maximum amount that may be extended should be no more than 65% of
PV10 or PV9. If the value of the reserves drops, the borrowing base is cut.
Petro, you probably know all this stuff, maybe more in depth than me.
I'm posting this for other's benefit.
The game the shale guys played in 2010-2014 was to fill up the first
lien bank line, then float an unsecured bond to pay it off. Most shale guys
did this several times. I assume it is on these unsecured bonds, where credit
default swaps (insurance) was likely sold, where you think there will be
a black swan event? My understanding is this junk is a small fraction of
what the mortgage derivative market was and still is. Many of these bonds
have defaulted, or are at extreme stress levels already.
Would seem to me, given oil cratered to the $20s in early 2016, we would
have seen signs of the black swan, maybe we did, as the markets fell, almost
perfect correlation with oil, which has now, somewhat broken.
However, if we take my hypothetical $100 WTI and $6 HH per mcf, how do
those CDS on shale bonds cause any problems?
Also, back to the horse and pony show with regard to bank loans, I am
not so sure how much puffery there has been. It really depends on how the
engineering firm did the reserve report, and if the bank's price deck utilized
was realistic.
I will say, unlike the mortgage meltdown, where there were fraudulent
appraisals all over the place, there are not a lot of petroleum engineering
firms, and they are not fly by night outfits.
I will also say, it seems to me energy lending is pretty specialized,
there weren't energy loan brokers setting up shop on every street corner
and advertising on late night cable TV. Mostly big banks, or large regionals,
in this market.
Finally, these loans are not of the $150K mortgage variety. When the
bank examiners come, they look into the big loans much more closely. Easier
for OCC to examine 10 billion $ worth of 10 reserve backed energy loans
than $10 billion $ of home mortgages, of which there would be 50-100K individual
loan files, appraisals, etc.
Where the OCC screwed up was by not figuring in the junior debt when
they examined the bank loans. But, they finally are now, and that is a big
deal IMO.
The way I see it, if WTI hits $100 2017-2021, and gas is $6 during the
same time, and the shale knuckleheads have learned something from the most
recent Arab OPEC "good sweating" and don't overdo it, they mostly pay down
substantially/payoff debt.
I'm talking Newfield, QEP, OXY, PXD, EGN, EOG, COP, MRO, WPX, SM, HES,
APA, APC, XEC, FANG, MTDR, DVN and a few others. CLR and WLL would pay down,
but not off. Same with OAS. CHK too. The few MLP that have survived thus
far, would also at least pay down, but think they are required to distribute
most cash flow.
Oil at $125 for five years, they about all get out of debt IMO.
And, in the event this happens, these guys would be well advised to just
issue equity to grow, going forward. Where price wont help them is when
the locations run out. Especially the good ones. Better to have little to
no debt when that happens, which is probably by 2021, even if these dudes
are more sane about development.
Keep in mind, in my example, the pre-tax, pre-interest profit margin
is $45.5 per BOE. Right now, and pretty much since Thanksgiving, 2014 unhedged
profit margin has been less than zero.
I agree, the world economy is screwed up. But, I think I am going to
need some more detail to figure out what you are saying. I also do not think
TARP was bad. Clueless described TARP very well recently.
Don't worry about offending me, I'm called a lot of stuff and don't care.
Know who I am pretty well. Would really like a post, but understand if you
don't. Its kind of daunting.
I am just going to touch a couple of points only.
First, as far as offending you:
yeah, you might have been called names and have a thick skin, but I do not
want to go that route to begin with.
Not because you don't care, but because I do not offend people…intentionally
that is.
So, I said that to warn you that if it comes out that way, it is not my
intention.
Second, I did not misspeak.
I already spent too much time comenting and I went short, obviously way
short.
I meant they'd have it on the books in order in case something happened,
or somebody inquired, or to present their "strategy" at their shareholders
or their newsletters for investors (i.e.: Goldmans' outlook on the oil market….and
BS like that)
Most of the big guys repackaged and resold those loand to greater fools
way, way before oil price rout started.
They own very little directly……
However – and this is the important part – they are affected by them indirectly
by other companies derivatives which have direct exposure to the loans presently.
Think of it as: you fire a gun at a target in front of you, but it makes
10 ricochets at the walls and trees and what not around and comes back and
kills you.
Third, as the result of the repeal of Glass_Stegal in 1999 – thank you
very much R. Rubin, L. Summers and most importantly our dear B.Clinton who
signed it into law
(don't fuss democrats. For me there is NO difference between republicrats
and democlicans. Reagan and Bush were as bad, or worse!) – commercial and
investment banking became one and all and turned to what's called TRANSACTIONAL
banking.
Meaning: everything, without exception is repackaged and resold multiple
times to grater fools.
Forth, the task of a post is not daunting!
heck, I have posted here in the last 2-3 years to last me for 3 posts.
It is first that, even knowledgeable, well meaning people have preset concepts
that they are not willing to change.
I mean, look at the amount of time I am spending replying to you and you
ask me the same things…..does "linear/classical" thinking ring a bell?
You wrote it yourself: "Hard to change long held views".
and second, some people act as experts in things they know nothing about….and
they are going to reply to me with stupid: "evil FED" , "Real Gold Money
vs. Fiat" and " Rockefeller- Rothchild cospiracy" bull shit…………………………………….
and I am not sure I can handle that politely…………………..
…and then you have Nik Gs and the rest who think that oil and energy are
just like any other commodity and we somehow can do without them and so
on and so on…..
You get my point….
" repeal of Glass_Stegal in 1999 – thank you very much R. Rubin, L. Summers
and most importantly our dear B.Clinton who signed it into law
(don't fuss democrats. For me there is NO difference between republicrats
and democlicans."
Petro, you are one heap big smart fella, or else I am a mental midget.
I just can't see any way you are wrong.
The key problem with our current two party political set up is that both
parties were long ago captured by Wall Street type interests.
Political reform on the grand scale would help immensely, but political
reform is not enough to solve the overshoot problem.
Also, I should point out my banking experience is with a small, local
bank, privately traded shares, less than 500 shareholders. The stock price
barely moves, however it has slowly ground upward over time. Has always
paid a dividend which has been 4-5% of share price.
The bank makes fixed rate mortgages, which it sells off to Fannie or
Freddie, but retains all servicing. It retains all other loans in house,
such as auto, Ag, small business, rental real estate. It has a few larger
customers where it has to participate with others, and occasional will participate
with other banks on loans the others originate.
The 2008 financial crisis did not affect it. No one sold their shares
anymore than usual, the stock price didn't drop.
The only real thing they do which was prohibited by Glass Stegal is they
have an in house stock broker, where customers hold brokerage accounts.
I don't see that as a problem, and that service ties in well with the primary
duty of being a trust officer.
The primary problem in the aftermath of 2008 is the banks cost of compliance
went up.
So, you can see, my background in this area is very foreign. I am coming
from a totally different view, so yours, or any other serious and on topic
views are appreciated. My views are very 1980s, I remember when a bank in
one town could not open a branch in the next town over.
I continue to be surprised that interest rates "have not risen on their
own".
Petro,
Thanks for your interesting contributions and viewpoints to this debate.
I believe we are headed for some non linear events and the thing is the
human brains are NOT evolved/trained to think in non linear terms. We tend
to extrapolate past experiences into the future with some noise around a
constructed [wished for] trend line.
Looking forward to your future elaborations on this subject.
"... As for damage, that will be the final proof of what has been happening. I will be watching Rune's graphs to see if the recent years start to drop below previous years totals. ..."
"... There was a great summary by somebody else a few posts back. The big issue is that you have condensate get into gasphase inside the reservoir. This in turn will result in more "stranded" oil. I fear we will only see the results later this year/2017. I would expect the production rates to drop of steeper than before and result in lower ultimate recoveries (but i know conventional plays much better). Maybe somebody with more knowledge can chime in? ..."
"... As for damaged wells. We will just have to wait for the data to come in. April's decreasing GOR has given me confidence in my original suspicions of over producing wells. Not sure how keen Shallow will be pumping dead oil from 10,000 ft TVD and 20,000 ft MD. At least there will be plenty of wells to experiment with, until you can make it work! ..."
"... Although it intrigues me, don't worry, we will leave the deep stuff to someone else. Low volume wells that produce little to no water can work even in a low price environment. ..."
"... Besides the costs in the event of a down hole failure being down right frightening, it has not been determined where these wells will settle out in years 10-30+ ..."
I believe you are in the patch? Do you have any on the ground experience
you can relate? As for damage, that will be the final proof of what
has been happening. I will be watching Rune's graphs to see if the recent
years start to drop below previous years totals.
There was a great summary by somebody else a few posts back. The big
issue is that you have condensate get into gasphase inside the reservoir.
This in turn will result in more "stranded" oil. I fear we will only see
the results later this year/2017. I would expect the production rates to
drop of steeper than before and result in lower ultimate recoveries (but
i know conventional plays much better). Maybe somebody with more knowledge
can chime in?
You raised an interesting point. Everybody that bothers to write on these
blogs, that have any hands on experience, all seem to be from the conventional
oil field. Either the shale players, are not interested, or are keeping
a big secret. Smiles.
I would really love to hear some real inside info. I am sure a lot of
speculation could be put to rest very quickly.
As for damaged wells. We will just have to wait for the data to come
in. April's decreasing GOR has given me confidence in my original suspicions
of over producing wells. Not sure how keen Shallow will be pumping dead
oil from 10,000 ft TVD and 20,000 ft MD. At least there will be plenty of
wells to experiment with, until you can make it work! lol
Although it intrigues me, don't worry, we will leave the deep stuff
to someone else. Low volume wells that produce little to no water can work
even in a low price environment.
Besides the costs in the event of a down hole failure being down
right frightening, it has not been determined where these wells will settle
out in years 10-30+.
Higher borrowing costs and tighter lending standards will act to restrain growth in the Bakken
going forward and along with continued advances in alternatives may well make it unlikely to
peak higher. Prices however can go substantially higher before restraining U.S. growth
than they could in 2008 since the economy has changed.
New vehicle efficiency alone increased 25 percent:
http://www.umich.edu/~umtriswt/img/EDI_mpg_May-2016.png
This is only a little surprise. This decline takes away the surplus that was built up during the
last two months (Fabruari and March) compared to the Season Effect Model. I was rather surprised
by the modest declines those last two months.
I try to attach the graph once more to this comment (or I will ask Ron for support).
You can clearly see the dataset crosses the modelled line for the sixth time now. The first
derivative of the model and the change of the data are still within the same error range as prior
to the moment the model was built.
Difference between the model and the data is -2.4% now. The age of the model is 29 months now.
Excellent chart. Just wanted to let you know that you were one of the few who presented the
CORRECT Bakken chart in this blog. There may have been others, but well done. Jean Laherrere and
Tad Patzek both have the same Bakken production profile as yours.
By 2025, the United States will be pumping 75% less oil than it is today. It will be interesting
to see how we run the LEECH & SPEND SERVICE ECONOMY on that little amount of oil. Americans who
think we will be able to exchange worthless paper dollars or Treasuries for oil at that time,
better stop sniffing the glue.
"... April 13,050 (preliminary)(all-time high was Oct 2015 13,190) ..."
"... March 56 drilling and 4 seismic ..."
"... April 66 drilling and 0 seismic ..."
"... May 42 drilling and 0 seismic (all time high was 370 in 10/2012) ..."
"... ND Sweet Crude Price ..."
"... March $26.62/barrel ..."
"... April $30.75/barrel ..."
"... May $33.74/barrel ..."
"... Today $38.25/barrel (all-time high was $136.29 7/3/2008) ..."
"... Today's rig count is 28 (lowest since July 2005 when it was 27)(all-time high was 218 on 5/29/2012) ..."
"... The drilling rig count fell 3 from March to April, 2 from April to May, and increased 1 from May to today. Operators remain committed to running the minimum number of rigs while oil prices remain below $60/barrel WTI. The number of well completions fell from 66 (final) in March to 41 (preliminary) in April. Oil price weakness is the primary reason for the slow-down and is now anticipated to last into at least the third quarter of this year and perhaps into the second quarter of 2017. There was 1 significant precipitation event, 15 days with wind speeds in excess of 35 mph (too high for completion work), and no days with temperatures below -10F. ..."
"... Over 98% of drilling now targets the Bakken and Three Forks formations. ..."
"... Estimated wells waiting on completion services is 892, down 28 from the end of March to the end of April. Estimated inactive well count is 1,590, up 67 from the end of March to the end of April. ..."
"... Crude oil take away capacity remains dependent on rail deliveries to coastal refineries to remain adequate. ..."
"... Low oil price associated with lifting of sanctions on Iran and a weaker economy in China are expected to lead to continued low drilling rig count. Utilization rate for rigs capable of 20,000+ feet is 25-30% and for shallow well rigs (7,000 feet or less) 15-20%. ..."
"... Drilling permit activity increased from March to April then fell back in May as operators continue to position themselves for low 2016 price scenarios. Operators have a significant permit inventory should a return to the drilling price point occur in the next 12 months. ..."
by
Ron Patterson
Posted on
06/15/2016
The
Bakken
and
North
Dakota
production data is out. Big surprise. The Bakken was down 69,420 barrels per
day in April while all North Dakota was down 70,414 bpd.
Largest drop ever in North
Dakota production. The Bakken is now under one million barrels per day.
This gives you some idea of the erratic nature of North Dakota production.
But as you can see, the decline is accelerating.
The EIA's Drilling Productivity Report gives past Bakken production numbers, which includes the
Montana portion, and future estimates for the next couple of months. The average difference between
North Dakota production and total Bakken production has been about 27,500 bpd. However for April the
difference is almost 63,000 barrels. So it looks like for once the DPR estimate is way too
conservative. The DPR estimate is through July while the north Dakota data is only through April.
In April Bakken barrels per day per well fell by 7 to 94, North Dakota bpd per well fell by 5 to
82.
March 13,052
April 13,050 (preliminary)(all-time high was Oct 2015 13,190)
Permitting
March 56 drilling and 4 seismic
April 66 drilling and 0 seismic
May 42 drilling and 0 seismic (all time high was 370 in 10/2012)
ND Sweet Crude Price
March $26.62/barrel
April $30.75/barrel
May $33.74/barrel
Today $38.25/barrel (all-time high was $136.29 7/3/2008)
Rig Count
March 32
April 29
May 27
Today's rig count is 28 (lowest since July 2005 when it was 27)(all-time high was
218 on 5/29/2012)
Comments:
The drilling rig count fell 3 from March to April, 2 from April to May, and
increased 1 from May to today. Operators remain committed to running the minimum number
of rigs while oil prices remain below $60/barrel WTI. The number of well completions
fell from 66 (final) in March to 41 (preliminary) in April. Oil price weakness is the
primary reason for the slow-down and is now anticipated to last into at least the third
quarter of this year and perhaps into the second quarter of 2017. There was 1
significant precipitation event, 15 days with wind speeds in excess of 35 mph (too high
for completion work), and no days with temperatures below -10F.
Over 98% of drilling now targets the Bakken and Three Forks formations.
Estimated wells waiting on completion services is 892, down 28 from the end of
March to the end of April. Estimated inactive well count is 1,590, up 67 from the end of
March to the end of April.
Crude oil take away capacity remains dependent on rail deliveries to coastal
refineries to remain adequate.
Low oil price associated with lifting of sanctions on Iran and a weaker economy in
China are expected to lead to continued low drilling rig count. Utilization rate for
rigs capable of 20,000+ feet is 25-30% and for shallow well rigs (7,000 feet or less)
15-20%.
Drilling permit activity increased from March to April then fell back in May as
operators continue to position themselves for low 2016 price scenarios. Operators have a
significant permit inventory should a return to the drilling price point occur in the
next 12 months.
... ... ...
New wells added in the Bakken/Three Forks are assumed to drop to 25 new wells in April and remain
at that level until Jan 2017. Last month about 64 new wells were added.
"... Note that at $90/b at the wellhead, the average 2014-2015 Bakken well pays out in 27 months. ..."
"... Note that 10,000 wells were drilled over an 8 year period from 2008 to 2016. ..."
"... My scenario has another 14,000 wells drilled over 11 years, possibly too optimistic, but similar to past history. ..."
"... 'Rationing' the remaining affordable oil supply will ONLY work as intended if the entire world does it together and the same time simultaneously and harmoniously.. . Not a snowballs chance of that is there. ..."
"... Usually rationing causes more problems than it solves, it usually is best to let the market handle it, high prices will reduce the quantity that people are able to purchase and behaviors will change. More efficient vehicles, car pooling, use of public transportation where available, etc. ..."
"... In june 2010 the average well production was 145 barrels per day, with a total of 1663 wells. Now the average well production is 94 barrels per day with a total of ten thousand five hundred and six wells. That's a lot of wells. All of them declining from day one. There is an enormous amount of inertia built in into the system now. It will take another ten-, twenty- of even fiftythousand wells to make the red queen recover. She will not. In the mean time companies go broke and the whole thing comes to a grinding halt. ..."
"... Dennis. $75 [is Ok to drill shale well] using cash. How many in the Bakken shale are using cash? Also, $75 assumes service companies continue to agree to low to no profit from services provided. Bakken wells were north of $10 million per in 2011-14. Again, CLR $11 million cash, $7.3 billion debt. WLL over $5 billion debt. HRC is bankrupt. From memory QEP, SM, HES, EOG, MRO, etc. All have billions of debt. PDP PV10 is less than long term debt at current prices. ..."
"... One thing, it appears that only equity markets are open to shale drillers. That, of course, is the best approach IMO. Promoters usually make money if investors pay for the well, regardless of whether the well pays out. Issuing gobs of debt turned out to be a big mistake. Think how much $$ shale could have gotten 2011-14 by just issuing shares. Break even would certainly be less. ..."
"... You think perhaps they drilled the worst spots first, saving the sweet spots for last? No, the sweet spots have already been drilled. Future wells will, almost certainly, produce less oil than those already drilled. Drillers just don't think that way Dennis. They would never save the sweet spots for last. ..."
"... Dennis, in the early days of Bakken fracking the wells had short laterals and fewer fracking stages. They got better with much longer laterals. They also got better at locating the sweet spots. But now the laterals and number of stages has maxed out. And the sweet spots are all drilled up. ..."
"... There is no doubt whatsoever that the very best and most productive wells have already been drilled. ..."
"... Low oil prices are forcing operators to focus drilling activity only in the core areas of the Bakken where wells have the greatest production. As oil prices recover and drilling expands to other areas of the Bakken, those high-producing wells will be declining, Helms said. "It's really kind of doubtful that we're going to make that (2 million barrels per day) because we're drilling everything in the core where the best wells are," he said. ..."
The E&P companies stopped drilling wildcats starting in 2013, and haven't
applied for such a permit for months, I'd suggest that means there are no
undiscovered reserves, all wells are in known areas now.
What do you think will happen to oil prices when oil output decreases?
The scenario is optimistic and assumes high oil prices, note that output
does not start to increase until 2019 in this scenario, when oil prices
have risen to $88/b (2015$).
The high oil price for this model is $116/b in 2016$ which is reached
in late 2020, does that seem unreasonable? The number of wells added is
1800 per year starting in 2021 with a gradual ramp up to that level over
a 2.5 year period from mid 2018 to the end of 2020.
I think it likely that if oil prices rise and remain over $100/b for
a few years that oil output will expand rapidly.
Note that at $90/b at the wellhead, the average 2014-2015 Bakken
well pays out in 27 months.
The net discounted cash flow for that well, a 10% annual discount rate
is $12.6 million with a well cost of about $8.5 million that leaves $4.1
million for profit or to be used to pay interest and debt.
I doubt we will be seeing more oil surpluses in the near future. Perhaps
if people start to move to EVs in 20 years or so we might see demand fall
faster than supply, but it will probably be 30 years or more before we get
there so 2045, beyond the scope of my scenario.
At some point there could be a financial crisis, but I will leave it
to others to predict when that will occur. In that case demand for oil will
fall along with oil prices and supply.
You asked "What do you think will happen to oil prices when oil output
decreases?"
I agree the initial reaction will be higher oil prices, but I don't expect
the stability in high prices, oil markets, and free money that existed in
the last cycle will ever be repeated. And you need those conditions to ramp
up shale again to production levels that can overcome the inertia of decline.
I think the stability expected is the root of our separate views. You
foresee (and hope) for it while I don't see it (but hope for it).
I think the only reason the global economy seemed to be able to afford
$100 oil is because abundant cheap money (from central banks) reduced interest
costs, which were able to help pay for higher energy costs. It bought time,
but I'm still seeing its effects, in the form of activities and businesses
that just aren't productive enough to continue, and shut down, without being
replaced. The effects of the last round of high oil prices are still slowly
but surely creeping around in the US economy.
Sure, oil prices will go back up soon enough. But can they go up and
stay stable at high enough levels to overcome the memories of shale ponzi
financials? And can the rest of the world avoid instability that affects
oil demand and supply for that same period?
Seems unlikely from here.
I'm glad I'm not making your models because I would go nuts trying to
figure out how to build in some of my variables of instability. It can't
be easy or you would have done because I (and others) have suggested it
in recent past.
Thanks for putting some numbers and graphics on these things. We may
not all agree with you, but you sure make us think. Thank you for that.
I don't expect the price will be stable, I don't know how the instability
will manifest.
When you look at my models just imagine the real values will wiggle above
and below the trend line, prices are very hard to predict. Also if we look
at the 36 month centered running average of monthly WTI prices since 1986,
prices look somewhat less volatile. I expect prices will rise to the 80
to 90 dollar range and perhaps stabilize (if we looked at future 36 month
running average). I also don't predict oil prices well so perhaps it will
be $60 to $70/b, in that case there will be less LTO wells drilled, or perhaps
none.
Wouldn't it be a lot more prudent to just ration oil and move to EV's and
renewables as fast as possible?
Putting in another 15,000 wells that are mostly not in sweet spots will
make most of the players even more vulnerable to a downturn in oil prices
than they were the last time.
At high oil prices wells will be drilled. If oil prices stay low because
we move quickly to EVs, the scenario will be incorrect. I would love to
be wrong, unfortunately this is fairly likely to occur. Note that 10,000
wells were drilled over an 8 year period from 2008 to 2016.
My scenario has another 14,000 wells drilled over 11 years, possibly
too optimistic, but similar to past history.
Dennis, I don't see any way that low oil prices can occur again for any
period of time. We are entering the final descent phase of LTO, exports
will be falling worldwide and prices will stay high.
Rationing is just around the corner anyway, so why not be sensible about
it and start it sooner. People can put up with being transport limited or
they can switch to EV's.
15.000 more wells in the Bakken saturate it and there is no more room. End
of story. Probably stop drilling long before that as they will be far off
the sweet spots and profits will not be there, even at high oil prices.
'Rationing' the remaining affordable oil supply will ONLY work as intended
if the entire world does it together and the same time simultaneously and
harmoniously.. . Not a snowballs chance of that is there.
So if say UK and USA ration, all it will do is reduce the price (due
to reduced demand) which will encourage other unconstrained users to increase
their consumption.
In the absence of a One World Govt and its associated Inspired Benevolent
Dictator we are screwed either way. The yeast is running our of sugar, we
are heading down the back of the resource supply curve, and everybody here
knows what a bumpy horrid ride it is going to be.
(That's my cheerful appreciation of our predicament for today! Carry
on!)
When you have a shortfall, rationing what you do have has no effect on world
demand or use. It is merely a way of controlling distribution of product
in hand and product you can get hold of. If you can't get more, how does
that change anything.
Demand reduction will occur as alternatives and lifestyle changes take
over. That is going to happen anyway. Let the ROTFW fight over the last
dribbles if they are stupid.
Usually rationing causes more problems than it solves, it usually
is best to let the market handle it, high prices will reduce the quantity
that people are able to purchase and behaviors will change. More efficient
vehicles, car pooling, use of public transportation where available, etc.
Still, I stick to my model as I have been doing for 29 months now. Especially
because price is not a parameter in the model. In june 2010 the average well production was 145 barrels per day, with
a total of 1663 wells. Now the average well production is 94 barrels per
day with a total of ten thousand five hundred and six wells. That's a lot
of wells. All of them declining from day one. There is an enormous amount
of inertia built in into the system now. It will take another ten-, twenty-
of even fiftythousand wells to make the red queen recover. She will not.
In the mean time companies go broke and the whole thing comes to a grinding
halt.
That's my take on it.
I like your analyses and, subject to unexpected crises, suspect you've
pretty well nailed it. Of course, expired (and expiring) hedges will serve
to exacerbate decline as well.
The average Bakken well pays back drilling and completion costs in 60
months at about $75/b. The resources are there, if oil prices are high enough
the oil will be recovered. the F50 technically recoverable resources are
about 11 Gb based on USGS estimates and the F95 estimate is about 8 Gb.
I will go with the USGS and the likelihood that as oil output decreases
oil prices will increase.
"The average Bakken well pays back drilling and completion costs in 60 months
at about $75/b."
That is impossible to happen in short term because business cycle (real
economy) has to grow at least the same rate or higher then finance cycle
of shale drillers (money that shale borrowed) and that went exponential
in the last 8 years.
-We can say that about your chart, but for Dennis' there is nothing to
tell!
The curbs on that chart cannot coexist together mathematically.
Whether one believes that projections for 2020, 2030 or 2040 and beyond
shall materialize, or not is besides the point – we can argue that forever
(as we have been).
-Dennis' chart cannot be, both logically and mathematically.
Unless one believes that they used the wrong narrow pipes from 2010 to
2015 and the large correct ones from 2020-2025 to get the oil out of the
ground (I am joking, of course!), for that chart to make sense, either production
curb 2020-2025 has to come down below the level of that 2014-2015, or the
line representing wells during 2020-2025 has to be way above the level of
that representing wells from 2012-2015…or both.
Or, here's a third " bright" scenario for you:
one has to believe that some very advanced (not known today) way of fracking
will exist by 2020 in order to "squeeze" far more oil than we do today from
a, by then – for all practical intents and purposes – totally exhausted
oil field (i.e.: Bakken, circa 2025).
I am surprised some of you "well versed on charts guys" did not see that.
The output has decreased because fewer wells have been added each month,
if the number of wells completed per month increases, output also increases.
Do you see a logical reason that the number of wells completed per month
cannot increase if oil prices increase to a level which makes wells profitable?
Shallow sand has shown very clearly that $75/b is enough to make an average
Bakken well profitable.
Also my scenario has 8 Gb from 24,000 wells, and average EUR per well
of about 330 kb. The average well from 2008 to 2015 gas a well profile with
a URR of about 350 kb.
The model is very straightforward, but could overestimate the well profile
for recent wells.
We do not know what the wells will produce in the future,
I have estimated future well output on the performance of past wells,
future well could be worse (or better than I have estimated). The scenario
below assumes higher oil prices ($154/b) and fewer wells added per month
(a maximum of 130 new wells per month), a more conservative well profile
for 2015 and later is used (EUR=369 kb), ERR is 8.5 Gb with 33,000 total
wells completed. That is fairly close to the USGS F95 estimate.
Dennis. $75 [is Ok to drill shale well] using cash. How many in the
Bakken shale are using cash? Also, $75 assumes service companies continue
to agree to low to no profit from services provided. Bakken wells were north
of $10 million per in 2011-14. Again, CLR $11 million cash, $7.3 billion
debt. WLL over $5 billion debt. HRC is bankrupt. From memory QEP, SM, HES,
EOG, MRO, etc. All have billions of debt. PDP PV10 is less than long term
debt at current prices.
One thing, it appears that only equity markets are open to shale
drillers. That, of course, is the best approach IMO. Promoters usually make
money if investors pay for the well, regardless of whether the well pays
out. Issuing gobs of debt turned out to be a big mistake. Think how much
$$ shale could have gotten 2011-14 by just issuing shares. Break even would
certainly be less.
I have estimated future well output on the performance of past wells,
future well could be worse (or better than I have estimated).
They could be better? Really? You think perhaps they drilled the
worst spots first, saving the sweet spots for last? No, the sweet spots
have already been drilled. Future wells will, almost certainly, produce
less oil than those already drilled. Drillers just don't think that way
Dennis. They would never save the sweet spots for last.
My projection of future output from recent wells has much steeper decline
than older wells, so I could have overestimated or underestimated what the
future output will be from a well that was drilled in 2015.
In 2005 to 2007 the EUR of the average well was much lower than 2008
to 2013, so it is possible that improved techniques might increase output,
the first 12 months of output was higher in 2013 wells and 2014 wells than
the earlier 2008 to 2012 average well. At some point this will reverse and
my model has new well EUR decreasing after June 2018, this guess could be
too early or too late.
So basically I am not assuming anyone is saving the sweet spots, just
that my estimate could be low or high, we won't know until we have more
data.
Dennis, in the early days of Bakken fracking the wells had short laterals
and fewer fracking stages. They got better with much longer laterals. They
also got better at locating the sweet spots. But now the laterals and number
of stages has maxed out. And the sweet spots are all drilled up.
There is no doubt whatsoever that the very best and most productive
wells have already been drilled.
I will wait for the data that confirms you are correct. So far the productivity
of the average well for the first 12 months of output has been increasing,
later months we can only guess at for the wells that were recently drilled
(wells starting production after May 2015 we don't have data for production
beyond month 12).
I thought we would see new well EUR decreasing by 2014, so far the data
shows little evidence of that.
Low oil prices are forcing operators to focus drilling activity only
in the core areas of the Bakken where wells have the greatest production.
As oil prices recover and drilling expands to other areas of the Bakken,
those high-producing wells will be declining, Helms said.
"It's really kind of doubtful that we're going to make that (2 million
barrels per day) because we're drilling everything in the core where the
best wells are," he said.
He said he thinks North Dakota production will eventually reach 1.8 million
barrels per day. I wonder if he said that with a straight face, especially
after just admitting that all the good spots will soon be gone.
I repeat, I do not expect the well profile will increase. When I said
it may be better or worse than my estimate of the well profile, it
simply means that we do not know what the well profile is, we have to estimate
and sometimes the "best guess" is too high and other times it is too low,
just like any other guess.
When you make an estimate is it always too high? My estimates may be
different, about half the time they are too high, and the other half they
are too low. :)
That is all that I meant.
Also, my "funny model" uses exactly the same well profile that I have
been using since Enno suggested I should correct my model because it consistently
was under predicting Bakken output.
Maybe new well EUR will start to decrease sooner than I have predicted
(June 2018), but with only 980 new wells completed in the model over a 28
month period and that for the past 2 years the well profile has been increasing,
I think the June 2018 guess is reasonable.
The eventual number of wells was 150 per month which is 21% less than
the high 12 month rate of 186 wells per month, only 80 wells per month are
needed for 1000 kb/d with the current well profile.
If i understand Verwimp's chart correctly, he started it when the price
of oil was over 100. So Verwimp, did you know something the rest of us didn't
or was this just a good educated guess.
At any rate your chart has nailed it to date. Congrats.
You do understand correctly. The model was built before the price collapse.
It's a Hubbert analysis basically. The dataset prior to the moment the model
was built was a Hubbert poster child and it still is. When linearised according
to Hubbert Linearisation, the data is still a straight line. There is no
drop in that line. A sudden policy change coinciding with lower prices would
have generated a drop in that line. That would also be visible in the change
in daily oil shifting away from the first derivative of the model. Both
are not occuring. So the only resulting conclusion is: ND Bakken is running
out of oil, despite the high USGS EUR estimate.
I may stand corrected in the future. If prices rise and production rises
again, I missed something. Until now (today's WTI prices are almost double
the WTI price in Februari -- ) that is not the case, as you can see.
A Hubbert analysis only makes sense when a lot of data on the upgoing side
of the curve already exists. 10 years ago there was virtually no LTO. So
no Hubbert analysis could have been made.
No, it wasn't a guess. It's just the nature of things that what goes up
must come down. The Hubbert analysis provides a tool to calculate the altitude
and the timing of the top, as well as the steepness of the decline. These
calculations are more accurate when the top is closer by (or past). Apparently
29 months after the calculations were done, the reality is still in line
with the modelled curve.
(I also added a seasonal correction to the Hubbert Curve, that as proven
to be pretty accurate, but that is a minor feature of the curve compared
to the underlying Hybbert Curve.)
The only guess was that ND Bakken would stay being the Hubbert poster
child it was prior to the calculations. Apparently it still is. That guess
was based on the fact Lower48 and Alaska production are also pretty Hubbert-like
curves, just like earlier smaller booms in North Dakota. It's in the 'genes'
of Americans, I presume, to go for it as soon as possible, as hard as possible
and as fast as possible when it comes to earn money extracting a resource,
until the show is over. A Hubbert curve is the result then…
"... I hope everyone understands that by 2020, most of the 2014 and prior vintage Bakken and TFS wells will be just like what Oasis sold, 21,000′ well bores making under 20 bopd. ..."
"... There are going to be about 40,000 stripper wells in the US that have a TD in excess of 15,000′ in about 5 years. If those are economic I think we will be very happy. ..."
"... I sure agree, hope this rally isn't a repeat of last year. ..."
"... WPX Energy Inc prices public offering of 49.5 mln shares for total gross proceeds (before estimated expenses) of about $485 mln ..."
"... You know that Permian, break even at $30, 30% IRR at $35. LOL! ..."
"... The Mighty MIGHTY MARKET and the ( near) Invincible Invisible Hand really can work economic miracles, sometimes, not every time, given time enough. ..."
"... The "Invisible Fist" generally just plummets our proletarian friends. ..."
Article in WSJ about shut in wells in the Bakken and various entities and individuals who are
taking their first stab in the oil business by purchasing distressed Bakken production.
Hope they have their eyes wide open, so to speak.
Saw that Oasis sold all of its non Middle Bakken/TFS wells and acreage for $16.5 million to
Samson. Not the KKR bankrupt Samson, but the Austrailian penny stock Samson.
780 BOEPD net and over 50K of acreage, but lots of shut in wells.
I hope everyone understands that by 2020, most of the 2014 and prior vintage Bakken and TFS
wells will be just like what Oasis sold, 21,000′ well bores making under 20 bopd.
Think we'll stick to the ones that make 1/20th of the oil but are also 1/20th of the depth.
There are going to be about 40,000 stripper wells in the US that have a TD in excess of
15,000′ in about 5 years. If those are economic I think we will be very happy.
is that "we" meant to be the you oil barrons :-), I think the Nathaniel's and Fred's of the world
might have a different perspective, but it may also be a learning experience. For the first time
in a year the light at the end of the tunnel might not be the another freakin train.
BRIEF -- WPX Energy Inc prices public offering of 49.5 mln shares for total gross proceeds (before
estimated expenses) of about $485 mln
The stock went up with the dilution (?) and they plan to use the money to drill wells:
"WPX says it plans to use the proceeds for general corporate purposes, which may include an acceleration
of drilling and completion activities, bolt-on acreage acquisition, and midstream infrastructure
in the Delaware Basin."
The Mighty MIGHTY MARKET and the ( near) Invincible Invisible Hand really can work economic
miracles, sometimes, not every time, given time enough.
Here is an example of incremental change that can WORK, NOW. Plug in hybrid trucks aren't going
to solve the oil depletion problem. Electric cars won't solve it either. But they will DELAY the
day of reckoning- maybe long enough for us to change our ways sufficiently to avoid an economic
catastrophe.
Twenty four miles on battery power alone is enough to cut substantially into diesel fuel consumption
if a truck is running a short route. Ten years from now, fifty miles on battery power alone will
probably be feasible.
"... If one assumes that gas stays low priced, WTI will need to pass $55 sustained for 3 months for most US LTO producers to not show losses for GAAP purposes. This, of course, does not include hedges. ..."
ExxonMobil and Chevron also had large North American losses.
Due to the high CAPEX spent 2011-14, and given depreciation, depletion
and amortization methods selected by US producers, expect $20-$25 per BOE
in D,D & A for US oil weighted LTO producers for at least the next 3 years.
Then add in $8 or more of LOE, $3-5 G & A, and $4-$7 in interest, all in
BOE terms. Also, some monetized gathering, so there could be expenses there.
Also include severance taxes of 6-10% of $ per BOE sold.
If one assumes that gas stays low priced, WTI will need to pass $55
sustained for 3 months for most US LTO producers to not show losses for
GAAP purposes. This, of course, does not include hedges.
"... So at $35/b at the wellhead you get $31.85/b after taxes, then if we deduct OPEX we get $23.85/b, so net revenue would be 1.67 million the first year. Also remember the future revenue should be discounted at 10% per year. With no discount shallow sands wants the net revenue to pay for the well after 5 years. In this case the net revenue is $3.737 million after 5 years and the well is a failure (it loses money). Even after 14 years net revenue is only $5.25 million. I have ignored interest in this example and have assumed the well has been paid for out of cash flow. If the well head price were between 50 and 51 per barrel the well would be paid for after 5 years. ..."
"... I quickly checked the same analysis for the recent Bakken well profile, which has a higher 60 month EUR (266 kb vs 196 kb for the 2013 well). The well is paid for in 60 months at a wellhead price of $40/b using the same assumptions I used in the previous example. ..."
"... Of course, as you mention, none of the companies are able to pay for wells right now out of cash flow. All have interest expense, many have interest expense in excess of $5 per barrel. ..."
"... Also, another expense I have noticed with more frequency are gathering expenses. Many of the LTO companies sold their gathering and/or produced water disposal infrastructure in order to raise cash. They now are required to pay $X per barrel or mcf of gas in order to get their products to market. ..."
"... I would also note, 20% is a "base case" for Bakken royalties. The actual figures can range from 12.5% (1/8) to over 25% (1/4). If one is looking at the EFS or Permian, I suggest using a "base case" royalty of 25% (1/4). However, taxes in TX are less than ND. ..."
"... "We are slowly technologizing ourselves into extinction. Technology is seductive. Is it the power? Is it the comfort? Or is it some internal particularly human attribute that drives it? Technology surrounds us and becomes part of our story and myths. Technology tantalizes the human mind to make, combine, invent. There are always unintended consequences with technology. It affects how we experience the world in time and space. It affects how we feel about the world. If all the externalities were included in the prices and cost to nature, we would be very, very wary of technology. ..."
"... We will do more of the same, business as usual until there are no more holes in the ground to dig, no more water above and below to contaminate, no humans to wage slave, no other lifeforms to eliminate. Yes, we are building Trojan horses in our hearts, minds and spirits. It will be elitist and entitlement and hubris – it will end with both a bang and a whimper." ~ John Weber ..."
The wells never stop declining so for your final three years each year
should be 93% of the previous year, this doesn't really happen for about
10 to 15 years. Below are annual decline rates for an average new Bakken
well in 2013. The first year's average output is 2.9 kb/d and the decline
rates are year 1 to 2, 2 to 3, …, 9 to 10.
Output in barrels per year
87696
42170
28453
20911
16643
13811
11796
10289
9120
8187
7425
6792
6252
5763
Hope that helps. The decline rate eventually levels out at about 7% per
year by year 15 and remains at that rate until the well is shut in about
12 years later (with the well producing about 6 b/d).
Thanks Dennis, I worked those decline rates into my spreadsheet but the
essential message is the same, relative to PV shale oil will generate more
than 15 times the gross revenue in year 1 and still be generating more than
twice the gross revenue in year 7! Your figure of 2.9 kb/d for the average
first year production seems way out of line with the numbers that shallow
sand used in the analysis I referred to or anything that can be interpreted
from Enno's graph below. I was really hoping that shallow or Ciaran would
have commented on my estimate but, I guess my work is way too amateurish
for them! :-)
Edit: Dennis, after I posted this, I noticed your additional responses
below. I will try to add these additional factors into my spreadsheet as
I am interested in how these enterprises gobble up millions of dollars!
I also noticed where you mention 266 kb as EUR and wonder how a well
that produces 2.9 kb/d can end up with an EUR of 266 kb after 60 months?
My mistake 2.9 is a factor of 12 too high, I multiplied by 12 where I
shouldn't have, but the numbers for barrels per year are correct. It should
have been 240 barrels per day for the average first year output.
Also if you look at the numbers for output per year that I posted (which
can be copied and pasted into a spreadsheet) it is clear that 87,696/365
is not equal to 2900 b/d, it is 240.2 b/d. Sorry for the mistake.
The royalties are 20% of output, taxes are another 9% or so. So if you
had 100,000 barrels of output, you keep 80,000 barrels and then figure you
only get net revenue of 91% of the wellhead price and then you have to subtract
opex, G+A, etc.
So at $35/b at the wellhead you get $31.85/b after taxes, then if
we deduct OPEX we get $23.85/b, so net revenue would be 1.67 million the
first year. Also remember the future revenue should be discounted at 10%
per year. With no discount shallow sands wants the net revenue to pay for
the well after 5 years. In this case the net revenue is $3.737 million after
5 years and the well is a failure (it loses money). Even after 14 years
net revenue is only $5.25 million. I have ignored interest in this example
and have assumed the well has been paid for out of cash flow. If the well
head price were between 50 and 51 per barrel the well would be paid for
after 5 years.
Shallow sand can correct my mistakes. Note that I have used my numbers
for yearly well output, based on data from Enno Peters. The well used is
the average 2013 Bakken well.
I quickly checked the same analysis for the recent Bakken well profile,
which has a higher 60 month EUR (266 kb vs 196 kb for the 2013 well). The
well is paid for in 60 months at a wellhead price of $40/b using the same
assumptions I used in the previous example.
Of course, as you mention, none of the companies are able to pay
for wells right now out of cash flow. All have interest expense, many
have interest expense in excess of $5 per barrel. Then, the question
is when will any of these companies begin to use cash flow to reduce debt
principal. Some have reduced debt, by buying back their own debt at distressed
levels, and/or exchanging the debt with creditors for reduced principal
new debt, but at much higher interest rates and more stringent terms (liens
upon company assets as opposed to unsecured bonds).
Also, another expense I have noticed with more frequency are gathering
expenses. Many of the LTO companies sold their gathering and/or produced
water disposal infrastructure in order to raise cash. They now are required
to pay $X per barrel or mcf of gas in order to get their products to market.
I would also note, 20% is a "base case" for Bakken royalties. The
actual figures can range from 12.5% (1/8) to over 25% (1/4). If one is looking
at the EFS or Permian, I suggest using a "base case" royalty of 25% (1/4).
However, taxes in TX are less than ND.
I was trying to keep it simple. For someone like you who probably does
not borrow, there would be very little interest expense. This may also be
true for XTO and Statoil. So basically someone who uses a 60 month payout
rule, probably is not in debt so interest payments are not a factor. I also
was trying to get it done in 5 minutes so skipped some steps.
I get 137 million miles of driving, if we ignore the energy used for
refining and distribution of the oil produced for the 2013 average Bakken
well, for the more recent wells it is 185 million miles over 7 years. For
the late 2015 to early 2016 Bakken average well we get 248 million miles
of driving over a 25 year well life (ignoring refining and distribution
energy). So over the long term we get more driving miles out of the PV.
Note that the average Bakken well really costs more like 8 million rather
than 5.9 million so the apples to apples comparison over 25 years would
be 378 million miles from PV and 248 million miles from the LTO well. So
50% more miles of driving per dollar spent on energy to fuel the ICEV or
EV.
2.8 acres of PV produces 1 GWh annually of output (fixed array). PV farm
cost is about $500,000 per acre. Typical well cost is $15 million (initial
plus continuous costs) and lasts for about 15 years, with low output the
last 10.
So $15 million of PV would be thirty acres at 10.7 GWh output. By year 15
the output might be at 90% so average is 95% over 15 years giving 152 GWh
total ouput for 15 years. Since the PV is local I won't use transmission
losses. At 0.3 kWh per mile that is 506 million miles. The PV farm will
produce almost double that over it's full lifetime. No pollution produced,
no pipelines, no refineries, no spills, no smog, no noise, no global warming,
etc. No Red Queen effect. No depletion problem. PV panels are getting better
and cheaper, oil is not.
URR of well being about 300,000 barrels would give 265 million miles
at 30 mpg (70 percent fuel recovery). When one starts to take into account
the energy losses in drilling, transport, refining, more transport, etc.
That would drop significantly.
No brainer for transportation.
Consider also that hydropower uses over 25 times the area to produce
the same amount of power and also messes up the environment. PV looks a
lot better all around.
Photovoltaic panels have a significant opex. This is associated with parts
replacement, as well as panel washing (they are worse than cars left in
the open). When you compare apples to lemons make sure you include everything.
Yair . . .
This "panel washing" may be a factor on commercial installations but I occasionally
see it mentioned in relation to domestic as a difficult problem on hard
to access roofs . . . well we have been running panels for over twenty five
years and they get washed when it rains.
"We are slowly technologizing ourselves into extinction. Technology
is seductive. Is it the power? Is it the comfort? Or is it some internal
particularly human attribute that drives it? Technology surrounds us
and becomes part of our story and myths. Technology tantalizes the human
mind to make, combine, invent. There are always unintended consequences
with technology. It affects how we experience the world in time and
space. It affects how we feel about the world. If all the externalities
were included in the prices and cost to nature, we would be very, very
wary of technology.
I think we have moved from technology in the service of religion
(pyramids and gothic cathedrals) to religion and culture in the service
of technology. It isn't a deity that will save humanity but in the eyes
of many – it will be technology.
We will do more of the same, business as usual until there are
no more holes in the ground to dig, no more water above and below to
contaminate, no humans to wage slave, no other lifeforms to eliminate.
Yes, we are building Trojan horses in our hearts, minds and spirits.
It will be elitist and entitlement and hubris – it will end with both
a bang and a whimper." ~
John Weber
"... 0-12 month production is a combination of reservoir and fracture dominated flow. Increases in mean rates are mainly related to advances in completion technology (longer horizontals, > number of stages, reduced spacing between stages, improved proppant technology). ..."
"... After 12 months, liquid production is reservoir dominated. Decline curves converge to +/- 5 bopd. Geology is the main controlling factor. From 2008 to 2015, the following increases have been observed; ..."
"... Completion technology gets you more gas (and oil) in the short term. In the longer term geology plays a far more important role on single well life of field economics than completion technology. ..."
Completion technology gets you more gas (and oil) in the short term. In
the longer term geology plays a far more important role on single well life
of field economics than completion technology.
0-12 month production is a combination of reservoir and fracture
dominated flow. Increases in mean rates are mainly related to advances
in completion technology (longer horizontals, > number of stages, reduced
spacing between stages, improved proppant technology).
After 12 months, liquid production is reservoir dominated. Decline
curves converge to +/- 5 bopd. Geology is the main controlling factor.
From 2008 to 2015, the following increases have been observed;
197% increase in 90 day gas only production
46% increase in 90 day oil and gas production
27% increase in 90 day oil only production
10% increase in 90 day income
Extrapolating the 2008 to 2015 curves to 20 years of production,
the following changes have been estimated;
6% increase in 20 year income
Break Even oil price lowered from $64 to $60
Conclusion: Completion technology gets you more gas (and oil) in
the short term. In the longer term geology plays a far more important role
on single well life of field economics than completion technology.
"... Increasing gor in an oil reservoir is not good. But I thought you were inferring that Texas was in worse shape. My point was you can't make that assumption. My only point ..."
"... I thought maybe the units should be thousands of cubic feet of natural gas per barrel of oil because both Texas and North Dakota are over 1200 cf/bo GOR. ..."
My point is simply that currently North Dakota is at about 1500 cubic
feet natural gas per barrel of oil produced.
Fernando says this is a problem, I think.
Not sure if it is or isn't. Increasing gor in an oil reservoir is not
good. But I thought you were inferring that Texas was in worse shape. My
point was you can't make that assumption. My only point
I thought maybe the units should be thousands of cubic feet of natural
gas per barrel of oil because both Texas and North Dakota are over 1200
cf/bo GOR.
"... Both candidates said they had planned to hold the press conference next Monday but moved it up after they were contacted by an attorney for a division employee who claimed Mineral Resources Director Lynn Helms ordered the destruction of emails and records related to the transportation and sale of oil. ..."
"... Sorum said a recent audit of the state Department of Trust Lands that identified errors in how oil and gas royalty payments were made underscores the need for an independent audit of the Oil and Gas Division, which oversees about 13,000 active oil and gas wells. ..."
"... He said mineral owners who receive oil and gas royalty payments often receive revised settlement sheets notifying them that a mistake was made, which indicates production numbers aren't being adequately tracked and shows the need for an audit so mineral owners don't get shortchanged. ..."
Two gubernatorial candidates from opposing parties called Thursday for an audit of North Dakota's
Oil and Gas Division, raising concerns that production numbers are not being verified and citing
a tip that employees were ordered to destroy public records – a claim the agency's spokeswoman called
"completely baseless." Republican candidate Paul Sorum of Bismarck and Democratic hopeful Marvin
Nelson, a state representative from Rolla, held a joint press conference in Bismarck to call for
a performance audit of the division within the Department of Mineral Resources.
"This is not a partisan issue, which is why Marvin and I and many other people are on the same
page. We just want the law to be followed," Sorum said.
Both candidates said they had planned to hold the press conference next Monday but moved it up
after they were contacted by an attorney for a division employee who claimed Mineral Resources Director
Lynn Helms ordered the destruction of emails and records related to the transportation and sale of
oil.
Sorum and Nelson said they had no proof that records were destroyed. The attorney asked not to
be named publicly because it would identify the employee, they said, agreeing that the state's whistleblower
laws provide inadequate protection.
"Even without those rumors, there's still significant reasons why we should be do that (audit),
and it should be urgent that we do that," Sorum, an oilfield consultant, said in an interview.
Division spokeswoman Alison Ritter said the allegation of destroying records was untrue. "That's completely baseless," she said. "I think it's just absurd, actually." Ritter added that the office had a staff meeting Wednesday which involved making sure staff were
reading the code of ethics policy, which includes a page related to records and making records available.
Sorum and Nelson said they did not contact Attorney General Wayne Stenehjem, chief enforcer of
the state's open records laws, about the report of records being destroyed. Stenehjem, who is the
Republican Party's endorsed candidate for governor and also serves on the three-member Industrial
Commission that oversees the Oil and Gas Division, "is part of the problem," Sorum said.
Stenehjem was on the campaign trail and could not immediately be reached for comment. Fargo businessman
Doug Burgum also is seeking the GOP nomination in the June 14 primary.
Sorum said a recent audit of the state Department of Trust Lands that identified errors in how
oil and gas royalty payments were made underscores the need for an independent audit of the Oil and
Gas Division, which oversees about 13,000 active oil and gas wells.
A bill co-sponsored by Nelson last year would have required a performance audit of state agencies
that regulate oil and gas development, but House lawmakers rejected it 67-22.
Nelson serves on the Legislative Audit and Fiscal Review Committee, which has the authority to
request performance audits, but he couldn't recall if there had been a formal request for a division
audit.
He said mineral owners who receive oil and gas royalty payments often receive revised settlement
sheets notifying them that a mistake was made, which indicates production numbers aren't being adequately
tracked and shows the need for an audit so mineral owners don't get shortchanged.
"There's really a public responsibility to get it right," he said.
Ritter noted the state auditor's office recently completed a routine audit of the agency for the
2013-15 biennium and there were no formal findings for the Oil and Gas Division and a few formal
fin
Republican candidate Paul Sorum of Bismarck and Democratic hopeful Marvin Nelson, a state representative
from Rolla, held a joint press conference in Bismarck to call for a performance audit of the division
within the Department of Mineral Resources.
"This is not a partisan issue, which is why Marvin and I and many other people are on the same
page. We just want the law to be followed," Sorum said.
Both candidates said they had planned to hold the press conference next Monday but moved it up
after they were contacted by an attorney for a division employee who claimed Mineral Resources Director
Lynn Helms ordered the destruction of emails and records related to the transportation and sale of
oil.
Sorum and Nelson said they had no proof that records were destroyed. The attorney asked not to
be named publicly because it would identify the employee, they said, agreeing that the state's whistleblower
laws provide inadequate protection.
"Even without those rumors, there's still significant reasons why we should be do that (audit),
and it should be urgent that we do that," Sorum, an oilfield consultant, said in an interview.
Division spokeswoman Alison Ritter said the allegation of destroying records was untrue.
"That's completely baseless," she said. "I think it's just absurd, actually."
Ritter added that the office had a staff meeting Wednesday which involved making sure staff were
reading the code of ethics policy, which includes a page related to records and making records available.
Sorum and Nelson said they did not contact Attorney General Wayne Stenehjem, chief enforcer of
the state's open records laws, about the report of records being destroyed. Stenehjem, who is the
Republican Party's endorsed candidate for governor and also serves on the three-member Industrial
Commission that oversees the Oil and Gas Division, "is part of the problem," Sorum said.
Stenehjem was on the campaign trail and could not immediately be reached for comment. Fargo businessman
Doug Burgum also is seeking the GOP nomination in the June 14 primary.
Sorum said a recent audit of the state Department of Trust Lands that identified errors in how
oil and gas royalty payments were made underscores the need for an independent audit of the Oil and
Gas Division, which oversees about 13,000 active oil and gas wells.
A bill co-sponsored by Nelson last year would have required a performance audit of state agencies
that regulate oil and gas development, but House lawmakers rejected it 67-22.
Nelson serves on the Legislative Audit and Fiscal Review Committee, which has the authority to
request performance audits, but he couldn't recall if there had been a formal request for a division
audit.
He said mineral owners who receive oil and gas royalty payments often receive revised settlement
sheets notifying them that a mistake was made, which indicates production numbers aren't being adequately
tracked and shows the need for an audit so mineral owners don't get shortchanged.
"There's really a public responsibility to get it right," he said.
Ritter noted the state auditor's office recently completed a routine audit of the agency for the
2013-15 biennium and there were no formal findings for the Oil and Gas Division and a few formal
fin
Republican candidate Paul Sorum of Bismarck and Democratic hopeful Marvin Nelson, a state representative
from Rolla, held a joint press conference in Bismarck to call for a performance audit of the division
within the Department of Mineral Resources.
"This is not a partisan issue, which is why Marvin and I and many other people are on the same
page. We just want the law to be followed," Sorum said.
Both candidates said they had planned to hold the press conference next Monday but moved it up
after they were contacted by an attorney for a division employee who claimed Mineral Resources Director
Lynn Helms ordered the destruction of emails and records related to the transportation and sale of
oil.
Sorum and Nelson said they had no proof that records were destroyed. The attorney asked not to
be named publicly because it would identify the employee, they said, agreeing that the state's whistleblower
laws provide inadequate protection.
"Even without those rumors, there's still significant reasons why we should be do that (audit),
and it should be urgent that we do that," Sorum, an oilfield consultant, said in an interview.
"... While oil production in the Bakken has been in decline for more than a year, natural gas production continues to increase. As there is no big natural gas fields in North Dakota and most of the gas is associated, this trend can be entirely attributed to the rising GOR. ..."
"... Since the beginning of the shale boom in the Bakken North Dakota the natural gas to oil production ratio has increased almost 3 times ..."
While oil production in the Bakken has been in decline for more than a year, natural gas production
continues to increase. As there is no big natural gas fields in North Dakota and most of the gas
is associated, this trend can be entirely attributed to the rising GOR.
Oil and natural gas production in the Bakken
source: NDIC
"... Generally speaking (in Texas anyway) a lease must generate cash flow in excess of its monthly cost of production. $1 over that monthly cost is sufficient. Naturally, each operator's cost are different and each lease/well is different. ..."
Generally speaking, an OGL that is past its primary term must produce
oil and/or gas in "paying quantities" with no cessation of more than xx
days (depends on lease language) to continue to be held in effect. There
are many ways an operator can handle this situation by producing just a
few days a month. An operator can pay a "shut-in gas" royalty to defer a
production obligation in certain circumstances. Each situation is different
and requires its own analysis.
An operator is not required to show that a well or leasewell is capable
of "paying out" it's cost of the lease, drilling and completion, gathering,
treating facilities and so forth.
The important issue is that a well or lease must be capable of producing
oil or gas in "paying quantities".
Generally speaking (in Texas anyway) a lease must generate cash flow
in excess of its monthly cost of production. $1 over that monthly cost is
sufficient. Naturally, each operator's cost are different and each lease/well
is different.
In my opinion, many wells are "magically" producing just enough oil and
gas to generate a marginally positive cash flow. Why you ask? To avoid plugging
and abandonment until a greater fool comes along to buy the lease and allow
the current operator to get off the hook.
I know of one case where SandRidge Energy (Arena Acquisition) drilled
52 vertical wells in one 640 acre section. Each well is capable of producing
1-2 bbls/day. Payout will never happen and I doubt that production in paying
quantities is happening. I also doubt that a greater fool exists to take
over this lease
But…… someday someone (perhaps you) will be on the hook to plug and abandon
and restore the surface to its original condition.
Russia is not planning to significantly ramp production capacity.
Energy Minister Novak said today that the country will be able to maintain
long-term production levels within the range 525-545 million tons per year
(10.5-10.9 mb/d). That's what Russian officials were saying earlier.
According to the Saudi officials, planned expansion of the Khurais and
Shaybah oil fields will only
compensate for falling output at other fields. They claim that the country's
"maximum sustainable output capacity is 12 million barrels per day and the
nation's total capacity is 12.5 million bpd", but there are no plans to
increase capacity and there is no evidence that this capacity really exists.
I think that in reality Saudi Arabia is able to increase crude production
from the current 10.2 mb/d to 10.5-10.6 mb/d during the peak season for
local demand in the Summer, but not well above those levels.
"... We just did some work on the EIA/IHS report on well costs that came out a little while ago. We suspect that these longer peaking wells may be possible due to lower service costs. Operators have switched to natural sand, and lots of it. Not being an engineer, this is only an educated guess, but the general gist I can gather is that natural sand crushes more easily than artificial ceramic proppant, but is significantly cheaper. ..."
"... Our assumption on the interests of operators like CLR and WLL is that they currently want to maximise short-term production to boost revenue, and they care significantly less about maximising recovery. Using lots of natural sand fits in with that – though the sand will be crushed more quickly than if artificial proppant will be used, more fractures will be propped open in the short term. ..."
"... Many of these short term production gains may be given up shortly after any price increase, as the service costs will also rise, and the short term revenue considerations will become less important. That's the theory we're working under currently, anyway… ..."
Great comment, Enno, as ever. It's important to remember that the EIA's
forecasts seem to generally be very "smooth", and their models are mostly
done at an economic level, meaning they aren't working from number of wells
upwards. This meant they completely missed the beginning of the production
decline – their initial forecasts kept on adding ~30kbpd a month to Bakken
until April15, for example. Now they are a little to heavy to the downside.
We just did some work on the EIA/IHS report on well costs that came
out a little while ago. We suspect that these longer peaking wells may be
possible due to lower service costs. Operators have switched to natural
sand, and lots of it. Not being an engineer, this is only an educated guess,
but the general gist I can gather is that natural sand crushes more easily
than artificial ceramic proppant, but is significantly cheaper.
Our assumption on the interests of operators like CLR and WLL is
that they currently want to maximise short-term production to boost revenue,
and they care significantly less about maximising recovery. Using lots of
natural sand fits in with that – though the sand will be crushed more quickly
than if artificial proppant will be used, more fractures will be propped
open in the short term.
Many of these short term production gains may be given up shortly
after any price increase, as the service costs will also rise, and the short
term revenue considerations will become less important. That's the theory
we're working under currently, anyway…
The decline after peak of new wells appears to be significantly steeper
than previous years, so when companies claim 40% IP increase = 40% EUR increase,
one should be extremely skeptical. By month 7 of production, the average
2014 well had produced 18% more oil than the average 2010 well at the same
stage of its life – but by month 26, that difference was down to 7.6%. In
month 3, the average 2014 well had produced nearly 9% more than the average
2013 well – by month 26, that was down to 2%. Those are total cumulative
oil produced figures, btw.
"... Total oil production in North Dakota Bakken fell to 1057 kb/d in March, a monthly drop of 8 kb/d. Decline in February-March was only 10 kb/d. Cumulative decline from December 2014 peak level is 107 kb/d (-9%). ..."
"... as Shallow Sand pointed out: "It surprised me that production in ND didn't fall much when Mr. Helms stated there would be a dramatic drop." ..."
Total oil production in North Dakota Bakken fell to 1057 kb/d in March, a monthly drop of 8
kb/d.
Decline in February-March was only 10 kb/d. Cumulative decline from December 2014 peak level is 107 kb/d (-9%).
The chart below shows that both the EIA Drilling Productivity Report and the EIA/DrillingInfo
monthly LTO production statistics tend to underestimate the resilience of tight oil production,
at least in the case of the Bakken. The EIA estimates for February and March will likely be revised
upward. I think that even bigger upward revisions will be done for the Eagle Ford.
Bakken oil production statistics: NDIC data vs. the EIA reports (kb/d)
Early March oil production numbers show that North Dakota will likely drop below 1.1 million
barrels per day for the first time since June 2014, the state's top oil regulator said.
An official update will be released next week, but Director of Mineral Resources Lynn Helms told
an oil industry group in Williston he expects to see a "severe" production drop.
"It's going to be bad," Helms told the Williston Basin chapter of the American Petroleum Institute
Tuesday night."
In fact, the decline was not as big as was expected and total ND oil production (incl. conventional)
in March was 1109 kb/d.
The chart below does not show any acceleration in monthly decline rates:
Year-on-year and month-on-month growth/decline rates in Bakken North Dakota oil production
(%)
Another myth is the drilling efficiencies being touted by E&Ps. Yes,
drilling has gotten better, but most of the price gains touted by E&P management
are related to pricing concessions extracted from the OFS sector. OFS operators
simply are fighting for survival and are doing what it takes to keep customers
- cutting prices as much as they can and even taking losses. Once activity
begins to pick up, OFS pricing mostly will reverse, he said.
"The fact remains that the industry's technical and financial performance
was already challenged with oil prices at $100/bbl, as seen by the fading
cash flow and profitability of both the IOCs and independents in recent
years," Kibsgaard said.
"Over the past decade, our industry has simply not progressed sufficiently
in terms of total system performance to enable cost-effective development
of increasingly complex hydrocarbon resources. This can be seen by the escalating
industry cost per barrel."
The U.S. land rig count peaked in October 2014, and the "rate of disruption"
across the energy sector has led to a "full-scale cash crisis."
"The latest data points have, in recent weeks, sent the oil price up
toward $40/bbl, and we would expect the upward trend to continue as the
physical balances tighten further in the coming quarters," said Kibsgaard.
"In spite of this, we maintain our view that there will be a noticeable
lag between higher oil prices and higher E&P investments given the fragile
financial state of our customer base, which means that there will be no
meaningful improvement in our activity until 2017" .
The EIA's latest
Drilling Productivity Report has US shale oil production down by 114,000
barrels per day in May. On an annualized basis that is 1,368,000 barrels
per day. That is huge.
Notice that the rate of decline is now increasing every month. It took
a while, until December 2015, for the decline to really get started in earnest.
But now it is clearly underway. It appears that the decline will now clearly
be far greater than a lot of people estimated. Well, that is if the EIA
has any idea of what they are talking about.
I more and more suspect that geology is a significant part of the LTO production
decline. The production curves for each major shale and total of all US
LTO play (ref. Enno Peter's
http://shaleprofile.com/
) are starting to look like bell curves. Also, top producer EOG seemed
to stop its growth in June 2014 and that's before the oil price decline.
Rune Likvern in his recent post @ fractionalflow mentions that some sweet
spots in Bakken are becoming satured with wells. In fact it looks like Bakken
stopped the production increase between July – Nov 2015 which in my eyes
is a bit too early to blame it solely on the oil price.
Maybe Verwimp and Paztec are right? Now it is probably a combination
of oil price and geology, but to me it seems that geology is a significant
part of it.
"... Your point on the Marcellus displacing production from the other less productive basins is fair enough. That said I don't really see how anyone is making money in the Marcellus. ..."
"... I am reminded of what Rex Tillerson said about gas producers a number of years ago, "Everyone is losing their shirts. It's all in the red." ..."
"... As a conventional oil and natural gas producer who is suffering financially at the moment because of overleveraged shale oversupply, Mr. Coffee might rightfully suggest that I am bias against the shale industry. Truthfully, I want the shale industry to succeed but it must do so by standing on it's own feet, without borrowing money from outside sources it cannot pay back. It must develop it's remaining reserves from net cash flow, in a manner that is commensurate with worldwide supply/ demand fundamentals, at a reasonable, rational pace that will ensure price stability, not price volatility. It must find a way to do that AND pay back it's indebtedness. ..."
"... America has 2.8 million BOPD of conventional oil production that is getting hammered right now largely because of an LTO industry who has had, for the most part, no finding costs the past nine years. There are thousands of shale gas wells in the App Basin that were drilled with borrowed money that have been shut in for years with no takeaway capacity. I can find no success story in that kind of stupidity. ..."
"... Another summary on the investing disaster in shale here, it all comes down greed, corruption and stupidity in the end: ..."
"... My main argument that production potential of all shale plays in the U.S. has been vastly exaggerated for political and propaganda reasons is unchanged and now supported by sufficient data. ..."
"... And for economic reasons too. The principal question here is "Whether deferred adjustment to higher oil prices is beneficial to the USA economy in a long run?". They were definitely beneficial to "team Obama", but this might well be "after us deluge" type of thinking. ..."
Tad Patzek makes a wise point in a
reply to Coffeeguyzz in his post above.
My main argument that production potential of all shale plays in
the U.S. has been vastly exaggerated for political and propaganda reasons
is unchanged and now supported by sufficient data. While the overall
resource is giant, the recovered fraction will remain small because
of the generally poor quality of this resource. For the record, let
me restate the obvious: Some operators in the small sweet spots in all
plays will make a lot of money; most others will lose money and go bankrupt.
In the old fashioned reservoir engineering practiced by people of
my age, these sweet spots are called reservoirs.
I think the most 'agreeable' point Mr. Patzek and I may hold is the inclination
to embrace, promote and disseminate data that reinforces our already held
positions.
If you read Mr. Patzek's piece, and the comments I made in reply on his
blog site, you would see how I questioned virtually everything he presented
as being , at best, skewed.
Now, anyone following would be strongly inclined to favor a professional,
published-numerous-times and highly regarded in his field such as Mr. Patzek,
over some anonymous commenter.
That's natural.
But how in the heck could Mr. Patzek virtually dismiss the Marcellus'
output, ignore the Utica, mischaracterize the current Pennsylvania reporting
parameters and MOST importantly, NOT recognize that the decline in output
from the other formations is a direct consequence of being displaced by
the much bigger, more economic Appalachian Basin?
I claim no special insight. I acknowledge my partiality to fossil fuel
use/consumption now and for the foreseeable future. I would suggest that
those who feel/think otherwise are not so immune from cognitive bias as
they would wish to be.
What prompted me to post was how Patzek characterized sweet spots. From
what I understood in Patzek's post was that he felt there really wasn't
enough data to honestly assess the Marcellus. Which is why he gave it an
optimistic fudge factor. Your point on the Marcellus displacing production
from the other less productive basins is fair enough. That said I don't
really see how anyone is making money in the Marcellus.
I am reminded of what Rex Tillerson said about gas producers a number
of years ago, "Everyone is losing their shirts. It's all in the red."
Btw, you may have a pseudonym, but I don't consider you anonymous. You
are familiar enough to no longer appear anonymous. :-)
Coffee, it took nuts to stir up Tad Patsek's oatmeal on some stinking shale
gas play; I'll give you that. He is a renown reservoir engineer having taught
at one of the best, if not THE best petroleum engineering schools in the
entire world. He is a "distinguished" member of the Society of Petroleum
Engineers. The SPE does not hand those out to anyone. I have set in on his
lectures, and his talks; he is a good man and I can assure you he has only
the need for truth in his heart about the future of hydrocarbons.
You, on the other hand, are anonymous and won't say why exactly you are
such a adamant cheerleader for the shale industry. You "claim no special
insight" in shale matters yet you are willing to go toe to toe with a reservoir
engineer who taught tens of thousands of petroleum engineers to deal with
facts, the science of the rock and how to extract the hydrocarbons from
that rock…profitably. Forgive me, but you appear to simply be using stuff
you glean from the internet, most of which is put there by shale companies
themselves.
You cannot credibly root for an industry based on MCF's, or monster IP's,
and not dollars, sir. It has to make money. For instance, 16.5 BCF wells
in 3 years are war horses, for sure; at 5 dollar gas. At 70 cent gas those
cherry picked wells of yours still have not paid out and might themselves,
in yet another 3-4 years, but won't ever help pay back the sorry wells the
same company drilled nearby. Tight shale gas formations in the App basin
are displacing other gas production in the US by natural decline, not because
they are more economic. That statement put the b in bias.
For instance, 16.5 BCF wells in 3 years are war horses, for sure; at
5 dollar gas. At 70 cent gas those cherry picked wells of yours still have
not paid out and might [pay] themselves in yet another 3-4 years, but won't
ever help [to] pay back the sorry wells the same company drilled nearby
The issue of "ultimate profitability" brings us back to the "cheap, abundant
money supply" theme. Or more correctly the Feb induced regime of "cheap
credit for shale" that existed for the last 7 years. When anybody with a
rig could get loans or sell bonds because banks were flush with the Fed
money and wanted to put them to work somewhere, even if this "somewhere"
was extremely risky (somewhat similar to subprime mortgages). Add to this
the political pressure from Obama administration (energy independence theme)
and we get a unique environment for shale producers that existed probably
until the second half of 2015. This regime of abundant credit lines and
junk bond issuance for now is over.
With enough money you can make pigs fly, but you better do not stand
at the place where they are going to land.
This is the issue that Coffeeguyzz and Co fail to understand.
As a conventional oil and natural gas producer who is suffering financially
at the moment because of overleveraged shale oversupply, Mr. Coffee might
rightfully suggest that I am bias against the shale industry. Truthfully,
I want the shale industry to succeed but it must do so by standing on it's
own feet, without borrowing money from outside sources it cannot pay back.
It must develop it's remaining reserves from net cash flow, in a manner
that is commensurate with worldwide supply/ demand fundamentals, at a reasonable,
rational pace that will ensure price stability, not price volatility. It
must find a way to do that AND pay back it's indebtedness.
America has 2.8 million BOPD of conventional oil production that
is getting hammered right now largely because of an LTO industry who has
had, for the most part, no finding costs the past nine years. There are
thousands of shale gas wells in the App Basin that were drilled with borrowed
money that have been shut in for years with no takeaway capacity. I can
find no success story in that kind of stupidity.
The shale industry must find a way to make shale oil and shale gas extraction
profitable or it will play NO role in the energy future of America. The
first place to start, in my humble opinion, is to quit lying to the America
public about it's sustainability. I detest that BS. As I do cheerleading
for an industry who is about to financially implode. Thank you likbiz, and
Mr. Leopold.
I really hope that in a year or 2, we can climb out of the bunker, pat
one another on the back and say we made it through this mess. If we do…..adult
beverages are on me. Anywhere in Texas that is.
I'd just like to get to $55 WTI, because then we can go back to normal
and we could see how well LTO will do at that price.
I suspect that would not do them any good other than get some more money
out of investors, especially into the Permian companies. Share issuance,
but likely not much more debt issuance.
I hope $55 works for you. I don't think it will be enough to save the
debtor class in the oil patch. $55 won't be enough to make the PE/HF crowd
whole so I think you are right. Those days are gone.
It is going to be fascinating to watch the secured and unsecured creditors
carve up the carcasses in the LTO & shale gas. Where is all that off balance
sheet financing going to land?
Carrion and dead carcasses everywhere. We are going to need a lot of
vultures to clean up the dead and dying.
The IRS is standing at the head of the line to get its cut. A lot of
liens are going to be filed and bank accounts frozen.
As I peck away here, creditors are putting in lock boxes to intercept
account receivable payments. Debtors are intercepting the lock boxes to
keep funds away from creditors. Local bank accounts are being closed and
funds are redirected to the home office (some out of the country)
Ever tried to secure a place in line with the other creditors when the
debtor files for bankruptcy outside the USA?
My main argument that production potential of all shale plays
in the U.S. has been vastly exaggerated for political and propaganda
reasons is unchanged and now supported by sufficient data.
And for economic reasons too. The principal question here is "Whether
deferred adjustment to higher oil prices is beneficial to the USA economy
in a long run?". They were definitely beneficial to "team Obama", but this
might well be "after us deluge" type of thinking.
"... What matters for a company's bottom line is the average output of all there wells. I imagine if you take a close look at the 10k you can determine how many producing wells they have and what their total output is, pretty sure it is going to be about 5 to 10% of that monster well, maybe less. Talk of the best well is a red herring. ..."
"... Don't understand why they don't recognize this and just complete their DUCs (if it will not result in cash burn, at current oil prices it will) once prices make it profitable to do so. Enno Peters has more data so perhaps he sees something that I do not. ..."
"... According to Enno, the average productivity for Pioneer's wells in the Permian is much lower than what the company shows in the presentation. ..."
"... Enno Peters' numbers for 629 Pioneer's wells that started production in Spraberry formation in 2015 show ~34 kbo average cumulative production for the first 3 months. Pioneers's numbers for 11 wells in 4Q15 show ~60kboed (48 kbo, assuming 80% oil)As in all shale companies' presentations, the numbers for individual wells is simply cherry picking ..."
"... Anyway, a likely reason for the increased productivity for the well is much due to the fact the the wells are drilled longer. I have a source (unfortunately not in English) saying that 1st generation fracking wells were 200-300m long, second generation wells up to 2-3km, with increased number of explosions. No wonder the well productivity goes up. ..."
"... I suspect that the parameter "Production/area" would be more meaningful and most likely not show such a large an increase, maybe even a decrease. ..."
"... Remember an oil man really doesn't care about the oil produced, it is the dollars produced that is the aim. So to the oil company oil per unit area is not something they would really consider. They are really interested in the oil produced per dollar spent, but most interested in the profits produced. Often the higher productivity wells are more expensive to complete (more frack stages, more proppant, or longer laterals), if they spend 10% more on the D+C and get 15% more output from the well (especially if the extra output happens early in the life of the well) that is money worth spending. ..."
"... Usually they figure out the optimum setup after 2 or 3 years, eventually sweet spots will run out of room and well productivity will decrease, so far there is little evidence of well productivity decrease in the Bakken or Eagle Ford. ..."
"... I still think the 2015 average Permian well will have an EUR over 180 months of under 210 kb, similar to the average Eagle Ford well and at $8 million per well and current oil prices, these wells should not be drilled. ..."
"... Pioneer does have a few big Sprayberry wells, but most will never produce more than 300-400K barrels of oil, absent refracks or EOR breakthroughs. Most seem to really tail off after hitting 75-150K BO, and will produce the remainder over the next 20-40 years. At least that is what I see generally. ..."
Richard Zeits raised some eyebrows with his latest Seeking Alpha post
projecting Cabot's Susquehanna county wells (northeast PA) with putting
out 27 Bcf EUR … a seemingly preposterous number for an $8 million well.
Thing is, their #1 producer in the Marcellus, the T Flower 2, has ALREADY
produced 16 1/2 Bcf in three years time.
What matters for a company's bottom line is the average output of
all there wells. I imagine if you take a close look at the 10k you can determine
how many producing wells they have and what their total output is, pretty
sure it is going to be about 5 to 10% of that monster well, maybe less.
Talk of the best well is a red herring.
Pioneer's average well in 2015 looks like it has high output for 10 months
and then looks like it will revert to the average 2011 well profile from
months 12 to shut in. I would estimate the EUR on these wells is about 160
kbo at most, adding in 20% natural gas would get the well to maybe 200 kboe
of oil, NGL, and natural gas (in boe) for a URR. The return on these wells
will be negative.
Don't understand why they don't recognize this and just complete
their DUCs (if it will not result in cash burn, at current oil prices it
will) once prices make it profitable to do so. Enno Peters has more data
so perhaps he sees something that I do not.
I have also looked at Enno Peters' recent post on the Permian.
According to Enno, the average productivity for Pioneer's wells in
the Permian is much lower than what the company shows in the presentation.
Enno's numbers are for total wells, and the presentation mentions only
those wells that were completed in 2015. There were obviously improvements
in average productivity in the past few years, but I doubt that they were
that big.
I know Enno cautions on reading too much into the the last couple months
data, as it can wriggle around a bit, but if PDX's 2015 wells continue as
shown in your graph, it may just mean that PDX were just trying a little
too hard to get good production figure from the Sprayberry, and potentially
are going to pay the price for this over production with long under performance
of the well.
Enno Peters' numbers for 629 Pioneer's wells that started production
in Spraberry formation in 2015 show ~34 kbo average cumulative production
for the first 3 months. Pioneers's numbers for 11 wells in 4Q15 show ~60kboed
(48 kbo, assuming 80% oil)As in all shale companies' presentations, the
numbers for individual wells is simply cherry picking
Anyway, a likely reason for the increased productivity for the well
is much due to the fact the the wells are drilled longer. I have a source
(unfortunately not in English) saying that 1st generation fracking wells
were 200-300m long, second generation wells up to 2-3km, with increased
number of explosions. No wonder the well productivity goes up.
But I wonder how meaningful this parameter is. I suspect that the
parameter "Production/area" would be more meaningful and most likely not
show such a large an increase, maybe even a decrease.
Remember an oil man really doesn't care about the oil produced, it
is the dollars produced that is the aim. So to the oil company oil per unit
area is not something they would really consider. They are really interested
in the oil produced per dollar spent, but most interested in the profits
produced. Often the higher productivity wells are more expensive to complete
(more frack stages, more proppant, or longer laterals), if they spend 10%
more on the D+C and get 15% more output from the well (especially if the
extra output happens early in the life of the well) that is money worth
spending.
Usually they figure out the optimum setup after 2 or 3 years, eventually
sweet spots will run out of room and well productivity will decrease, so
far there is little evidence of well productivity decrease in the Bakken
or Eagle Ford. In the Permian in 2015 it looks like high output in
the first 13 months has hurt the well productivity for months 15 and later
bringing the well to the level of the 2011 or 2012 wells after month 13.
It is also possible that the last data point (month 13 for the 2015 wells)
is based on too few wells to be reliable and may be statistical noise.
I still think the 2015 average Permian well will have an EUR over
180 months of under 210 kb, similar to the average Eagle Ford well and at
$8 million per well and current oil prices, these wells should not be drilled.
I have a data subscription and have finally broken down and paid a little
$$ to satisfy myself about both the Permian hz wells, and also the OK hz
wells.
I cannot legally reproduce the data, but my view is:
A. Enno's data is trustworthy re Permian.
B. The OK hz wells are generally gas wells, with associated liquids,
which rapidly deplete. Will not impact US oil production in a meaningful
way. Some prolific gas wells, however.
Pioneer does have a few big Sprayberry wells, but most will never
produce more than 300-400K barrels of oil, absent refracks or EOR breakthroughs.
Most seem to really tail off after hitting 75-150K BO, and will produce
the remainder over the next 20-40 years. At least that is what I see generally.
Now compare what is said about those excellent wells IPs, EURs and D&C costs
with Pioneer's actual 2015 results.
With annual average WTI oil price of $48.66 + hedges, the company posted
net loss of $273 million.
Oil and gas revenues were $2 178 million,
Net derivative gains: $ 879 million;
Net gain on disposition of assets: $782 million.
So, without hedges and gains on asset sales, Pioneer's net loss would be
much bigger.
Now look at their cash flow statement:
Net cash provided by operating activities: $1 248 million
Cash capex: $2 393 million;
Negative free cashflow: $1 145 million.
Not surprisingly, they had to borrow almost $1bn and sell assets for
$553 miilion.
And this is one of the leaders in the shale sector!
CLR and WLL have ceased completing oil wells. They are projected to lose
major $$.
BTW, it looks like CLR Red River wells will wind up being a much better
investment at $30 oil than their Bakken and TFS wells are. Those Red River
wells cost a fraction of the Bakken/TFS and will wind up producing similar,
if not superior cumulative oil per well.
What happens if it is nationalized? The shareholders might get, say,
a 10% premium over market price for their shares (making them happy), paid
for with printed money.
The employees get gov't benefit packages and the executives even have
a bonus plan like AMTRAK or USPS.
"... At some point people realize that the emperor has no clothing. ..."
"... And that also gives an explanation to Dennis' supposition that rigs will fly at $50 oil (or maybe pigs will fly). Using the same numbers at $50, you get a negative return on a well that produces 148k over 36 months. Who can afford to wait 36 months in this environment, anyway? ..."
"... They have been completing wells at $40/b or less, I agree nobody is making money at these prices, but if you have already spent $2 million to drill and case a well, that horse has left the barn. Now the question is do you spend another $3.5 million to frack and complete the well so you can generate some cash flow to keep the lights on. ..."
"... When these companies are losing money, which I am confident was the case in 2015, and will likely be the case in 2016 also, income tax is zero, I think. Perhaps 30% would be a better number for royalties and taxes in Texas, 27% was a guess on my part. ..."
"... Note that 148 kb is the average cumulative output over the first 36 months of the average 2013 to 2015 Eagle Ford Shale(EFS) oil well. ..."
"... I think the rule of thumb is that the payout in 36 months means the well is acceptable for Mike who is conservative, the shale players are not very conservative financially so 36 months would be outstanding as far as they were concerned. If the well cost was $6.5 million simple interest would be $325,000 at 5% and would be covered by the well in our example above, land and development costs might be covered by associated gas, I don't have numbers on that. ..."
"... Let's assume no associated gas (unlikely to be the case) and using Reno's land numbers from below say land and development costs are $350k/well, then we would need $83/b for the well to pay out in 36 months for the average well. ..."
"... So if we need $83 to payout in 36 months, the current price is $38 and the NYMEX strip for 36 months is well below $50 WTI, why are there any wells being drilled and completed in the EFS? ..."
"... Commodity markets can remain irrational longer than many can stay solvent, unfortunately. ..."
"... I am getting a little more conservative in my price predictions seeing maybe $50/b by Dec 2016 and maybe $80/b by Dec 2017, but the faster output falls the quicker the turnaround in oil prices will be. ..."
"... The main and probably only reason they are drilling in non-sweet spots in the Eagle Ford, now, is to hold the lease. I think, even the DUCs that are being completed now fall into that category. Or, in some cases, like Dennis says, the completion cost as current year capex would be covered. The only reason a company would drill with a three year payout, is if they had adequate lending or capital resources. Otherwise, they well should mainly pay for itself the first year, or they lose the capex for next year in cash flow loss. ..."
"... Most of the revenue is in the first year, about 63% of the oil flows in the first year. For the well to pay out in the first year would take an oil price of $117/b, but after a few years of wells you have cash flow not just from this years wells but the cash flow from previous years as well, this is why the 36 month rule probably works, to get the operation started you would need to borrow some money, but if you do it right you pay off those loans after 5 years or so and then work from cash flow and never need to borrow money, if you do it right and don't have oil prices in the toilet for a couple of years. ..."
"... Why are the shale guys given massive lines of credit based on the" assets" that are still in the ground and essentially worthless in today's market? ..."
"... "Analysts" are projecting a 30% haircut on the shale guys lines of credit in April, why only 30%? How about 100%? ..."
"... I just don't see the hyped OK plays adding much crude, based on available data. Would be neat if all states had ND data. ..."
At some point people realize that the emperor has no clothing.
Quick question on Eagle Ford.
Assume
transport cost= $5/b
royalty and taxes=27% of wellhead revenue
OPEX+ water disposal=$6/b
downhole maintenance+repair=$10,000/month
cumulative output=148 kb over 36 months
well cost=$6.5 million
refinery gate oil price=$77/b
With the assumptions above the net revenue per barrel is $44.13/b and
the cost of the well is covered in 36 months (with no discounting).
Mike has often said he wants his wells to "pay out" in 36 months at minimum
(he prefers 24 months, I would prefer 12 months :- ). At $77/b at the refinery
gate and 148 kb cumulative in 36 months, does the well meet those requirements
under the assumptions I have given?
How might you revise the assumptions to make them more realistic? What
am I missing, if it does not require a book length answer :-) ?
Assume $11 LOE, water disposal, transport cost = $1,302,400.00
Assume $10K per month of "maintenance CAPEX" = $360,000.00
Subtract those two figures from our net oil = $6,816,224.00
You payout in 36 months, assuming no interest expense. Also, need to
allocate lease acquisition cost, seismic, permitting etc., to our well.
On the plus side, we need to also figure in the gas/natural gas liquid revenues.
Also, need to see how income taxes figure in. Also, not sure if LOE is correct,
does it include county ad valorem taxes?
So in 36 months, we still need to pay our interest expense, our up front
land and development costs. Maybe some income tax, maybe we need to add
ad valorem taxes.
Oh, also, where is our G & A allocation? Or is that included up there
somewhere? That seems to be running about $2-4 per BOE (note not BO, and
likewise, all other expenses are always set forth as BOE, so we need to
know our GOR to adjust for that maybe?)
Finally, should we factor in time value of money, or if we add actual
interest expense does that solve the problem? I agree interest rates are
super low, maybe we should us PV8 or PV7? Rune and I have discussed this
some.
I assume this is a pretty darn good EFS well? I guess just need to look
at shaleprofile.com don't we?
Dennis. I suppose your example is close to what will be the "average" EFS
well in 2016.
One thing to remember, the EFS has different "windows" and many areas produce
all, or mostly gas.
Sánchez Energy is a prime example. Only 37% of 2015 production was oil.
Their Catarina area is mostly gas and natural gas liquids, yet it is their
primary field, and well costs are much lower.
Sánchez plans on completing 55 net wells, 36 in Catarina. This compares
to 116 well completions in 2015, companywide. Cost for all wells will be
$180-220 million, only 3 net DUC wells from 15, rest are new drills. Plan
on spending another $20-30 million on facilities.
Just some EFS company info that might interest some.
I suggest looking at Sánchez Energy's 2015 10K. Very detailed.
One area they reported was royalty burdens. Those range from 20.9% to
30.5%. I think royalty burdens are more onerous in EFS than Bakken, I think
25% is very common, and 30+% is not unheard of.
Despite a high percentage of gas, Sánchez production expenses (which
appear to include gathering and transport) were $8.16 per BOE. Production
and ad valorem taxes were$1.40 per BOE on realized per BOE of $24.80. DD
&A was $17.96 per BOE, interest expense was $6.60 per BOE, G & A $2.89 per
BOE, and impairments were $71.15 per BOE.
Sánchez has $435 million of cash, $1.75 billion of long term debt, PV10
of $593.5 billion, PDP PV10 of $465.5 billion.
They have two large acreage areas where they have no present plans for
new wells, very few currently producing wells, and almost no PV10, being
EFS Marquis area, and in the Tuscaloosa Marine Shale.
To achieve the above stated PV10, future production cost estimates were
slashed from $2.635 billion as of 12/31/14 to $1.745 billion as of 12/31/15.
Another interesting thing I noted that Sánchez reported, that few others
do, is that they have a NOL carry forward of $765.9 million. More interesting
is they adopted some type of plan to keep a hostile acquirer from obtaining
benefits of this NOL. Clueless, if you are out there, would love to hear
your comments on this.
Sánchez has an interest in 621 gross, 504.6 net wells.
Despite being in EFS, their oil sold for an average price of $42.98 per
barrel, well below WTI.
Their production really increased, from 43,893 boepd in Q4 14 to 58,115
boepd in Q4 15. They completed more wells in 2015 than in any prior year,
and do not appear to have DUC's.
And that also gives an explanation to Dennis' supposition that rigs
will fly at $50 oil (or maybe pigs will fly). Using the same numbers at
$50, you get a negative return on a well that produces 148k over 36 months.
Who can afford to wait 36 months in this environment, anyway?
They have been completing wells at $40/b or less, I agree nobody
is making money at these prices, but if you have already spent $2 million
to drill and case a well, that horse has left the barn. Now the question
is do you spend another $3.5 million to frack and complete the well so you
can generate some cash flow to keep the lights on.
All the G&A, land acquisition and development costs and so forth have
been allocated to other producing wells, income tax is not an issue because
last I checked you don't pay taxes when you are losing money.
When we do the calculation using all the same assumptions as before and
look only at the fracking and completion cost of $3.5 million, that cost
is paid in 36 months at $50/b.
Perhaps that is why some wells continue to be completed at $50/b, the
$40/b completions may be the best well locations that have higher than average
EUR.
EFS is tougher to get a handle on, because it is much more variable than
the Bakken in terms of GOR and well depth.
I would note SM Energy still has two rigs going in Divide Co., ND. Apparently
the wells there aren't as costly as in the core of McKenzie Co. Other than
that, seems like Bakken activity right now is centered in one area, where
things are similar.
I don't know a whole lot about EFS, but do know that some areas, like
Catarina, are almost all gas and liquids, little to no oil. Pioneer seems
to have the gassy acreage, thus zero rigs running.
I have focused on oil wells and ignore the gas and condensate wells.
In the most recent 12 months about 80% of the C+C output is from oil wells
and 20% is condensate from gas wells.
When these companies are losing money, which I am confident was the
case in 2015, and will likely be the case in 2016 also, income tax is zero,
I think. Perhaps 30% would be a better number for royalties and taxes in
Texas, 27% was a guess on my part.
The 36 month payout rule that Mike uses, would be a company that operates
by using cash flow, so interest expense would be zero, the associated gas
of the average oil well in the EFS I am not sure about, but the gas and
NGL might offset some of the LOE. I was assuming all taxes and royalties
would be covered by the 27% of wellhead revenue, does that seem too low,
maybe 30% would be more realistic?
Note that 148 kb is the average cumulative output over the
first 36 months of the average 2013 to 2015 Eagle Ford Shale(EFS) oil well.
When the 36 month payout rule is used, I thought the discount rate was
left out of the calculation. Also note that the land and development costs
is spread over many wells, what would your estimate be for these costs per
well, I have no clue.
See my Sánchez Energy post re their royalty burden and production and
ad valorem taxes per bbl.
Some acreage went for over $50K per acre. So if we are on 100 acre spacing,
that would be $5 million per well? I agree, that is extreme. So use $10K
per acre, 60 acre spacing, still $600K per well. Not insignificant. I do
not know what seismic shoots were costing, you have the bill to the land
man, and the attorney. So much of the shale plays have severed minerals,
so landowner had to be paid. Plus, look at the division of interests on
some of these shale units, usually over 100 separate mineral owners, all
have to be contacted to sign. And the land men had to run the records in
the remote county court houses to figure all of this out, very costly, leasing.
Just because Mike doesn't borrow doesn't mean shale doesn't. Wouldn't
the fact that shale borrows means they need a quicker payout than Mike,
who pays cash?
The gas in EFS is much more relevant than Bakken.
Dennis, would really help you to read some 10K. On EFS, I highly recommend
Sánchez for starters, as they are solely EFS (TMS insignificant) and have
acreage in different EFS windows, yet they break out a lot of detail on
each.
I think the rule of thumb is that the payout in 36 months means the
well is acceptable for Mike who is conservative, the shale players are not
very conservative financially so 36 months would be outstanding as far as
they were concerned. If the well cost was $6.5 million simple interest would
be $325,000 at 5% and would be covered by the well in our example above,
land and development costs might be covered by associated gas, I don't have
numbers on that.
Let's assume no associated gas (unlikely to be the case) and using
Reno's land numbers from below say land and development costs are $350k/well,
then we would need $83/b for the well to pay out in 36 months for the average
well.
Dennis, sounds good. And right now the app on my phone says WTI is $38.51.
So if we need $83 to payout in 36 months, the current price is $38
and the NYMEX strip for 36 months is well below $50 WTI, why are there any
wells being drilled and completed in the EFS?
For example, Sanchez, who has $1.75 billion of long term debt with PDP
PV10 of just $450 million, plans on spending over $200 million of CAPEX
in the EFS in 2016. They do have hedges, but they really do not help much.
See why this stuff frustrates the heck out of people like Mike and me?
It is like throwing cash in a burn barrel.
I gave an example above for why someone might complete a DUC at $50/b
for an average well.
So find your better DUCs that might produce in the 75th percentile and
maybe completing the well makes sense at $38/b, I really don't know desperate
times call for desperate measures I guess. Every oil company is secretly
hoping they can outlast the other company so that output goes down and prices
go up, this is a game of last man standing as far as I can tell.
Dennis. Pretty much all are in dire straits, I agree.
Looks like ND rig count is ready to drop below 30, at 30 today with one
to stack.
I like that you see a quick rebound in oil prices, but I think you have
been saying that for awhile.
Commodity markets can remain irrational longer than many can stay
solvent, unfortunately.
The same game is going on in the grains, there is supposedly a glut there
too, but, like oil, a world wide price trades heavily on US government inventory
estimates, with little data on stocks in huge chunks of the world.
Unfortunately, sentiment is so much more important than it should be
in the commodity markets.
I am getting a little more conservative in my price predictions seeing
maybe $50/b by Dec 2016 and maybe $80/b by Dec 2017, but the faster output
falls the quicker the turnaround in oil prices will be.
I hope for the sake of the oil guys and the environment, that oil prices
get to $85/b sooner rather than later, but you are correct that I am wrong
on oil prices more than I am right.
The reason I have been wrong is that I have expected a steep decline
in LTO output that has not occurred, when it finally happens then within
6 to 12 months we will see oil prices rise, perhaps very quickly.
Nobody knows what oil prices will be unless a huge range is chosen ($10
to $200/b for the next 5 years would probably be right, but far from useful).
The internal accounting standards that I use to drill wells, for instance
ROI and time to payout, were actually taught to me nearly a half century
ago by numerous oilmen before me. I think there is a reason that those standards
have been passed down over generations. They work. They essentially enable
an operator to be, for lack of a better term, "self sufficient." By that
I mean reserve inventory that is being liquidated can be replaced with net
cash flow, and not borrowed funds. Well costs, oil prices and risk affect
those accounting standards and when and if to pull the trigger, sure. The
same standards SHOULD apply to the shale oil industry but of course they
haven't and profitability has taken a back seat to reserve growth, which
now of course, has proven to be a dumb mistake also. Along with a half dozen
other dumb mistakes.
I won't speculate on DUC wells and when and why they would become profitable
to complete; I think perhaps it might be a mistake to assume there will
be enough money to borrow to complete those wells. I see a lot of DUC wells
being completed in the EF; in fact that is all I see being done in the EF.
Myself and others believe the rig count in the EF is grossly over exaggerated.
EF production is going to nose dive now to the rest of the year.
S. Texas is a very mature producing province and mineral owners very
savvy; 25% royalty burdens are the norm and many of those leases are burdened
with additional ORRI's. Severance taxes are 4.6% of gross revenue and ad
valorem taxes generally another 2.4% of net revenue to the WI.
Sanchez put all of its eggs in the Catarina basket several years ago
and they are under one of the most onerous drilling commitment provisions
I have ever seen. They drill it, or they lose it. That stuff is in the liquids
rich gas interface window, and close to Mexico; they appear to have a plan
of some kind. Others still drilling anything unconventional right now, anywhere,
have no plan whatsoever. They are doing stupid things with borrowed money
they will never be able to pay back at anything less than 100 dollar oil
prices, sustained. The "breakeven" metric is now even more irrelevant because
for a shale oil company to survive they must generate sufficient cash flow
to replace very high decline rate wells… AND pay back massive amounts of
accumulated debt. That ain't gonna happen and all of them, with few exceptions,
are now in Hospice care.
Not sure how to translate 2.4% of net revenue of working interest for
the ad valorem tax.
Lets take the example where Mike owns the well with a 25% royalty and
gets $40/b at the wellhead for any oil he sells, lets assume the well produced
1000 barrels yesterday and OPEX+ water disposal+ G+A+ land and development
costs + the stuff I don't know about is $15/b.
How much money does Mike take home in this example (I am unsure about
how the ad valorem tax works)?
Before taxes it looks like $25/b times 750 barrels so $18,750 of revenue,
the severance tax would be $1380, is the ad valorem only on the $15,000
of net revenue? That would be $360 at 2.4% of $15,000 net revenue. So I
think the take home (before income taxes) would be $17,010.
Probably that is wrong, I am not good at accounting.
The net revenue would be $25/b times 750 barrels or 18750 and at 2.4%
that would be $450 for the ad valorum tax, so taxes would be 1380+450=$1830
and before income tax the take home would be $16920. If the marginal income
is taxed at 35%, then the take home pay would be $10,998 if I did it correctly
this time. :-)
On that nosedive in the Eagle Ford, does Enno Peters estimate of about
60 completions per month in the Eagle Ford in 2016 sound right? The past
3 months (Nov to Jan) the completion rate has been about 145 wells per month
and for all of 2015 it was about 185 wells completed per month. So a rate
of 60 per month in 2016 would be about 1/3 of the 2015 completion rate.
I expect something like 90 wells per month, but my guesses are usually not
very good.
From your comment above I am thinking that you might choose something
like 40 completions per month, maybe lower.
The main and probably only reason they are drilling in non-sweet spots
in the Eagle Ford, now, is to hold the lease. I think, even the DUCs that
are being completed now fall into that category. Or, in some cases, like
Dennis says, the completion cost as current year capex would be covered.
The only reason a company would drill with a three year payout, is if they
had adequate lending or capital resources. Otherwise, they well should mainly
pay for itself the first year, or they lose the capex for next year in cash
flow loss.
Most of the revenue is in the first year, about 63% of the oil flows
in the first year. For the well to pay out in the first year would take
an oil price of $117/b, but after a few years of wells you have cash flow
not just from this years wells but the cash flow from previous years as
well, this is why the 36 month rule probably works, to get the operation
started you would need to borrow some money, but if you do it right you
pay off those loans after 5 years or so and then work from cash flow and
never need to borrow money, if you do it right and don't have oil prices
in the toilet for a couple of years.
Maybe Hamm has better contacts on Wall Street? That's all it takes, remember
that there are different rules and laws for the regular citizens and for
those that fund campaigns. It is what it is.
Why are the shale guys given massive lines of credit based on the"
assets" that are still in the ground and essentially worthless in today's
market?
Why did the federal reserve step in during the redetermination period
last year and tell the bankers to encourage the sale of assets rather than
call the loans?
Why are some people forced to mark to market while others skate?
Why aren't guys like me and you given say a 20 million line of credit?
I wouldn't sell my soul to those assholes anyway, so no need to answer that.
"Analysts" are projecting a 30% haircut on the shale guys lines of
credit in April, why only 30%? How about 100%?
If you and I were running a pretend business, would they loan us a lot
of money and then look the other way when it all heads south on us? They
would if Wall Street has figured out how to make big bucks and on it.
One thing some argue is that CLR has so much acreage that they got so cheap.
My response to that is go look at how much they have expiring. They are
not completing any wells in Bakken, meaning all of their acreage in ND and
MT is very uneconomic at Q1 prices.
So we are left with the mostly gassy OK acreage, with wells that are
more costly than, but far less productive than the Marcellus. Again, we
really need better info, but CLR companywide went from 70% oil 30% gas in
2014 to projected 60%/40% in 2016.
Their BOE is poised to drop 10% in 2016, but oil will drop much more
steeply.
I just don't see how under $2 gas works, although they do have some gas
hedged, unlike oil.
So if an OK well produces 70% gas and ngls, hypothetically, with wellhead
oil of $35 and gas of $1.75, per BOE is just $17.85. Over the life of the
well, ignoring all other expenses, you are looking at just under $20 million
of gross revenue using their EUR of 1.1 million BOE. That is over 30 plus
years, I assume.
I don't get SCOOP and STACK attractiveness. Devon did pay big $$ for
acreage there recently, another head scratcher, especially given their enormous
Barnett shale exposure, which right now is likely negative on an operating
basis. DVN used to be cream of the crop independent, but have to wonder?
OK C + C production per day per EIA has fallen from a peak of 473K in
3/15 to 400K in 12/15, very steep, and even steeper when you consider there
is a stripper production C + C base of 130-150K per day (although it likely
declined at least 10% as well during the same timeframe).
I do agree, part of the collapse is due to Mississippian activity falling
off the table. See SD and CHK, for example.
I just don't see the hyped OK plays adding much crude, based on available
data. Would be neat if all states had ND data.
"... I have grave reservations about the alleged spare capacity of Iran. The assumption is that the big, bad sanctions resulted in a huge drop in Iran's oil production. I am not buying it. I think the sanctions were a joke. For starters many nations refused to take part in the sanctions. Nations like India, china, japan and South Korea for starters. It would not be difficult to then reexport this oil to the rest of the world on the sly. ..."
2) select the "Well quality" tab and compare CLR vs all operators for
each year.
From the map there ("Top companies" tab), I see that CLR has a lot of poor
acreage scattered around the Bakken, but not much acreage in real sweet
spots, like Whiting and EOG had in the past in Mountrail. I was therefore
wondering at which WTI price do you think that CLR can drill profitable
wells in the Bakken? In my estimation they need over $50 WTI to just pay
back the cost of the well within 5 years. I come to this figure by
1) taking a rather optimistic 200k barrels of oil output within 5 years,
for their average well.
2) subtracting a rough 30% for royalties & production taxes: 200kbo -30%
= 140kbo. $6.7m per well / 140kbo = $48 of well cost for each barrel of
oil.
3) and adding a WTI differential.
If you then add all other costs, such as lifting costs, extra CAPEX later
in the well life for pumps etc, G&A, interest, income taxes, etc, wouldn't
they need WTI to be much higher than $70-80 to be profitable on these wells?
I know non-shale operators who want to see their money back within 3 years,
so the 5 years payback time I took above is still rather risky, especially
given the faster decline of shale wells.
You mentioned that you like them
because of STACK/SCOOP, about which I don't have much info. I just hoped
you can share your thoughts on the above, as they are still big in the Bakken.
As a member of the oil fraternity for the last 45 years it is refreshing
to read a post from someone who really understands the economics of production
and the cost/benefits of today's price environment.
I don't do average payback times for companies like CLR because much
of the marginal areas wont see any development at all (unless oil prices
head much higher, which we don't see happening in the near term).
Operators will focus on core areas and this plus well design improvements
are why we have seen EURs drive higher. We probably have different estimates
as to the number of bbls produced over the first five years which would
cloud the results some.
Working core acreage and switching to slickwater, we believe these wells
will produce about 360K BO over the first five years.
$40 WTI minus approximately $13 in costs
$27 minus $7 differential
$20 x 360000 BO
7.2 million minus 6.7 million in D&C
$500K
This is probably the biggest issue right now with those bearish and bullish,
its estimates. Not saying you are wrong or that I am for that matter, just
that we will have to wait and see. To your point on acreage, it does have
a pretty decent footprint in NE McKenzie County or in the southern part
of the Nesson Anticline and those wells could produce about 450K BO in the
first five years depending on estimates. Now if we look at its acreage in
Burke, N Williams or Montana the well results are no where near as good
and that acreage will need considerably higher WTI to develop. I would also
say that you are right about 5 year payback times being way too long and
that operators use to think at least 18 months was adequate.
We are definitely in interesting times. I don't have time to do it right
now, I am heading to the gym but will try to put some quick thoughts in
on the STACK/SCOOP this evening. The reason we like CLR isn't the Bakken
and we do see production in ND dropping here more than in Texas and Oklahoma.
We actually think that we could continue to see the Permian and SCOOP increase
production while the Bakken and Eagle Ford roll over a bit. Thanks again,
real good questions and I always appreciate our conversations. Unlike some
here you are always respectful and that only adds to the current debate
on some of these names.
Re Continental's historic underperformance in its Bakken wells compared
to peers ...
1). They were VERY early movers in this play and accumulated vast acreage
at rock bottom prices.
2). This 'Land Grab' phase generally only offered 36 months in which
to get a producing well in place so as to HPB.
3). A significant portion of this acreage is now recognized as being
outside the sweet spots.
4). CLR purposefully chose a cookie cutter approach to completions, namely,
30 stage and sliding sleeve. Reasons for this were speed through repetition
(they were racing the HPB clock), relative cost reduction with operational
familiarity, and - ALSO - having a position-wide identical well design so
as to evaluate the differing resource potentials throughout their vast holdings.
The future of their Bakken wells is apt to be far more productive than their
past.
Great work gentlemen - it is indeed awesome to see experts on here. Couple
of points that might be of interest: -In case you wanted a real data point,
avg. well head price for *cough* was ~$16.86/bbl last month, probably +$3
now based on the flat price. -I saw Jim Volker two weeks ago and he said
his research lab in Denver had found "the holy grail" of shale rock oil
extraction technology.
Interesting for whiting...perhaps CLR isn't far behind. -The production
math from ND DMR does not add up to CLR's type curve slides. I'm still trying
to figure out why. Do you think reworks are baked into type curves? I thought
not. -I would attribute the lower than expected IP rates to the choke...only
a few people like Statoil like to blow their wells out (although there are
a couple of exceptions) Option B: go the classic route of rocks are bad
or poor frac design.
Michael, Thanks for your elaborate response. I also enjoy these civil debates
with you, and I appreciate your comments on my site. You do got me very
surprised by the estimates you mentioned: 360 kbo & 450 kbo in 5 years.
Those are really exceptional numbers, that so far only a few companies
been able to get in highly prolific spots in the Bakken. 360 kbo is more
than double the results of CLRs wells that already reached 5 years.
You don't expect the average well of CLR in 2015 or 2016 in the Bakken
to come close to that, right? But if you're not, then that means that your
example should be adjusted if we look at the economic performance of CLR
in ND, and that would then show that CLR would not be able to expect its
money back on all wells drilled under current conditions within 5 years
(even though we both agree that to be a very long time already), right?
Phaedrus, "The future of their Bakken wells is apt to be far more productive
than their past." Can you be more specific, e.g. indicate using ranges what
you expect, and when, from the average wells from CLR in the Bakken? Note
that it is not a given that companies improve their results in the Bakken
every year. Whiting, and EOG already have shown several years of declining
well results, as is what we can see in several locations. So far, on the
aggregate, this has been compensated elsewhere. Also, what I think is very
clearly shown on my site, on average, the main improvements have been during
the initial months of production, but not in the long production phase after
12 months. You expect CLR to buck these trends?
alpha, We have a current target of WTI to 41.80 or so, so would add to
the DWTI position into that number. $40 will be very difficult to breach
and some traders think momentum could take us to $49 in the short term,
so this trade does have significant risk. We would close this trade in the
$32 to $34 range. But if we breach $30 may climb back in. Have a great day!
It is interesting to note the following from CLR's 2015 10K: CLR suffered
from a rather large discount concerning realized oil prices. 2015 SEC oil
price was $50.28, but CLR had to discount that to $41.63 per barrel. The
gas discount resulted in utilizing $2.35 per mcf. CLR's proved reserves
dropped 9% from 12/31/14 to 12/31/15.
More importantly, however, they became much more gas weighted, as 43%
of proved reserves are gas on a BOE basis. Therefore, analysis of gas production
and future gas prices is required in analysis of CLR. A look at CLR's statement
of future cash flows is also important. In 2014, CLR's estimate of future
cash inflows was $90.9 billion.
This dropped to $35.6 billion in 2015. This is largely the result of
the commodity crash, so it is very important if a lower for longer scenario
is correct. In 2014 the estimated future production costs were $25.8 billion.
In 2015 that fell by 60% to $10.9 billion. That is a very large drop, and
I hope analysts are able to get CLR management to walk through the steps
that they undertook to achieve such a large drop in future production costs,
but yet not a similar drop in proved reserves.
I compared these results to industry leader, ExxonMobil, and CLR knocks
it out of the park, as ExxonMobil suffered about a 24% drop in proved reserves
while cutting future production costs about 29% during the same period.
CLR also cut future development cost and abandonment cost estimates from
$12.8 billion in 2014 to $6.9 billion in 2015.
These production, development and abandonment cost cuts are critical,
had they not been achieved, CLR would have negative $1 billion in estimated
net future cash flows. Estimated net future cash flows from 2014 to 2015
fell from $38.4 billion to $15 billion. Standard measure PV10 fell from
2014 $18.433 billion to 2015 $6.476 billion. CLR has never carried much
cash, 2014 $24.4 million, 2015 $11.5 million.
Long term debt increased from $5.927 billion to $7.116 billion. CLR's
traded enterprise value continues to greatly exceed its peers.
I think it would be interesting to know if there are any other industries,
besides E&P, where such a high market capitalization could be achieved,
with such a low amount of cash, such a high long term level of debt, and
with future net cash flows, utilizing a discount rate of 10%, below the
amount of long term debt. Tesla comes to mind.
Michael. Is CLR's high density Poteet Unit a good representation of the
productivity of its SCOOP assets? Are there some other wells/units you could
recommend. I have an IHS Global subscription, would like some guidance on
assets you feel would be best to review.
Good article Iran doesn't have 50 million barrels on ships anymore though.
They started selling those shortly before sanctions were lifted late last
year and have been gradually selling those takers this year not sure there
is that much left to sell. of those at this point.
22023171, Where did you get that information? As of March 17th Iran had
an estimated 51.6 million bbls in floating storage including condensate.
It has steadily increased since Oct of last year when it had 42.02 million
bbls
Bison, Production taxes in ND dropped from 11.5% to 10% since Jan 1st this
year. E.g. link at http://bit.ly/1WApDmP
Royalties : I have seen many numbers & estimates in the range of 18%-24%.
For convenience, I took 20%. Together this means that companies have to
turn over a 30% or so of production before subtracting their own costs.
Enno: I think the royalties and excise taxes are off the wellhead price,
not off of the WTI reference. So, that adds about $3 per barrel back to
the margin. (WTI-BD)*0.7 > WT*0.7-BD Because [(WTI-BD)*0.7] - (WT*0.7-BD)
= 0.3*BD ~ 0.3*10 = 3
Please review my calculation again. I didn't take the severance taxes
& royalties from the WTI reference, I took them straight off the gross production
volume.
200 kbo gross oil production volume from an average CLR well within the
first 5 years means (subtracting production taxes & royalties of 30% or
so) about 140 kbo net oil production volume for CLR, right?
Besides, my calculation wasn't meant to be ultra-precise. I also didn't
add land costs, seismic & other CAPEX, stock-based compensation, time value
of money (discount factor), or the positive contribution from some gas.
I just wanted to show that oil prices have to be materially higher than
the strip prices in order for CLR to have its money back on these kind of
wells within a reasonable time frame. I'd love it if someone could point
out to me where I am wrong on this.
Thanks. I have one comment on royalties. Most of the early drillers got
in for a lot less than the 20% you estimated. My mineral acres are 13% and
I know several others that are in the 16% range. The reason for the low
royalties is that a lot of the mineral rights owners didn't know what they
had and in hindsight got rooked out of a lot of money.
1. If you subtracted the barrels explicitly, than that would seem to make
sense so my comment is wrong.
2. I wasn't trying to nitpick one thing to shoot down an overall argument.
Just to note the one place I (thought I) saw an error. Chill. I thought
you were doing well and just wanted to hone it better.
3. Since your discussion was already about simple payback, no reason
to model time value of money. It's already understood that this not an NPV.
4. I would treat the land costs as sunk. We are trying to think about
what price of oil it takes to drill now. (Similar for long ago seismic or
infrastructure buildout.) Obviously this is a judgment call and if you acquire
new acres or build new infrastructure than you need to charge the drill-or-not
decisions with the cost. Similarly stock costs and the corporate center
G&A are a little bit of a question.
I would probably keep them clear from the project decision (if you don't
drill, do you recover those costs? Maybe, if you do a layoff like SWN did...)
Bison. I have reviewed many non-operated working interests for sale on energynet.com
located in the Williston Basin. 1/8 royalties are rare. I have seen 72-83.3%
NRI.
My understanding is land men and others were able to latch onto significant
ORI. However, go ahead and do Enno's calculation with 87.5 NRI. You still
don't get there. We stay under $50 for awhile, eventually CLR will be bankrupt.
Too much debt, not enough future net cash flow.
This is supported by the numbers in their own 10K submitted to the SEC.
It is now almost a year and a half into the worst bust my family has endured,
yet shale proponents are still in denial.
I do not deny shale is a game changer, is very important for our country,
has had many technical breakthroughs, etc. I only deny it works broadly
sub $50, or even sub $70 oil as a good, or even marginal investment.
We have enough well histories and cost statistics, including horrific
2015 earnings, massive layoffs and depressed and wildly volatile stock prices
to know that. So please acknowledge this and join me in praying shale will
stop completing wells and fibbing about $30 break even. I unfortunately
own shares in two previously good companies COP and EGN, who got caught
up in the allure of shale. One has cut its dividend and the other eliminated
it. The shares are way down, and very volatile. They only go back up if
oil prices recover.
Rig count has crashed to below 400. It continues to go down as rigs come
off contract or as projects complete. How much less drilling do you need?
Seems like they have laid the drill bit down.
I hope you are right, but what happens if WTI hits $50? I don't want a repeat
of the spring of 2015, and the resulting price crash. Look at what happened
Friday. Add one stinking oil rig, and WTI turns lower.
shallow sand, Oil price forecasts are never concrete
but some analysts think oil will see $60/bbl this year (this means we see
it, not average it), or early next year. Lets hope oil prices are much higher
next year, as it could be a tough 6 months, but if things go well the oil
markets will balance at that point.
We have discussed this before. $20 long term = destruction of the US oil
industry, which will be followed by a massive oil super spike. Commodity
volatility is not good for the world economy. What is not good for the world
economy is not good for the US economy, generally. $100 is not good. $20
is not good. But we are all entitled to our own opinions.
Very good point, Michael. I would rather see the DUC wells completed, before
rigs are added, as there is no good DUC count quoted, and it seems traders
aren't trading off that. It seems more logical to complete all DUCS, than
add rigs, if prices rise.
But, there were some long rig agreements entered
into, compared to completion agreements. I hope you are right about $60.
I hope you know my primary beef with the shale industry is the failure,
a long time ago, to acknowledge they cannot win a "to the death" price war
with Russia and Saudi Arabia. In retrospect, had this been acknowledged,
with activity limited to establishing HBP, I doubt prices would have stayed
so low. I note that prices jumped almost immediately after 10K came out,
showing there are no future net cash flows for these companies at sub $30
WTI. However, when shale continues at it, claiming massive cost and production
improvements that will make $30 work, it sends the wrong signals to the
market concerning where prices should be, IMO. What shale has done is truly
remarkable on the production side, but the companies seem to forget they
are in business to make money first. This is why EOG's $30 competition with
OPEC statement surprised me. I had viewed them as disciplined, they stated
as much, then came out with that presentation. Very confusing. In summary,
we own production in a very shallow, old field.
The field was old in the 1970s, annual decline is less than 2%. Since
1997, when I started, I have lost $$ two years, 1998 and 2015. 2015 was
worse than 1998. 2016 is setting up to be worse than 2015. An example I
use is Coca Cola. What happens to them if top line revenues drop 70%? In
one year? Or Apple, or any other company in any industry.
I agree with Mike about tracking completion crews. CLR has 135 DUCs and
expects to exit 2016 with 195. EOG has some 300. HAL and many other sources
estimate as many as 4,000 DUCs. However this includes wells on pads just
waiting for crew not higher oil price. Maybe 2,000 waiting on higher oil???
shallow sand, It would seem that many of the "better" rigs were kept on
contract and instead of paying to end the contract early they just kept
drilling for wells to be completed at a later date. I would agree with you
in that this is not a great way to run business. Spending investor money
to do work that may or may not get done depending on oil prices isn't the
best way to run a business.
Normally EOG is one of the more disciplined operators, but I would guess
everyone is a little scared, and fear does a better job than anything of
getting people to make poor decision choices. Not saying it is right, especially
since some investors don't know what is meant by such statements. Operators
seem more scared what a production decrease announcement would do to stock
prices than working for a profit. 2016 could still have significant pain
ahead. Since supply and demand is only off by a couple percent, it has just
taken way too long to correct. Something to be said for massive overproduction,
at least the bottom is hit hard and fast.
Pablomike, More importantly, how many of those are in marginal areas that
will need $70 or $80 oil to complete? Some operators were still drilling
marginal wells when this all started and then just decided to sit on those
holes and wait. I am guessing the newer DUCs are probably in core or Tier
2 type acreage, but some of this overhang could end up sitting for a while
(while some operators will go out of business and never complete). I would
say somewhere in between 4000 and 2000 is a good number, but that one I
don't know for sure.
EOG had a hefty rig penalty if they stopped all drilling. They were clear
about this on the call and that is why they are drilling DUCs. The money
is effectively gone already. Sunk cost.
They would be drilling less (maybe not at all) in the Bakken if it were
not for the rig contracts. I suspect same is true for CLR although details
were not pinned down as well in their conf call. The meme of crazy E&P companies
is overdone by the peak oilers.
Remember these are the same critics who complained about growth when
oil was at 100+. These E&Ps are very NPV oriented and they have CRASHED
the amount of drilling down. There is a limit to how fast rigs can roll
off. But we are already down to sub 400.
The backlog of DUCs is already shrinking. Wolfcamp/Bone Spring and Eagle
Ford formations - in each of those formations, the excess has fallen by
about 150-175 over the past six months, bringing the surplus to around 300
wells in each.
In North Dakota, it might not be economic. There, the number
of DUCs climbed above 1,000 in September before falling to 945 in December,
according to the latest data from the state's energy regulator.
Wood Mackenzie reckons that the backlog of excess DUCs will decline over
the next two years and return to normal levels by the end of 2017. It is
expected to fall 35% from current levels in the Bakken and 85% in the Eagle
Ford by the end of 2016.
These are excerpts from the following article released today:
So, Bakken 1,000, 300 each Permian and Eagle Ford = 1,600. Other formations?
If one excludes NG Marcellus/Utica etc, perhaps other primary oil formations
would bring total to 2,000?
Good point. I suppose we need to categorize DUCs. Some operators realize
they have poked holes in some really lousy rock and won't complete without
much higher prices. Some like WLL, while in their best core acreage, will
keep poking holes but won't complete ANY wells until prices rise. Then there
is EOG which claims profit at $30 oil but has as many DUCs as anybody.
re: DUCs. I wanted to update my previous post. After reading again the cited
Reuters article, I realize one has to differentiate between their talking
about 'excess' DUCs (above average) and actual nominal DUCs.
So, consider
the following excerpt: "Typically, average DUC inventory is around 550 in
the Wolfcamp/Bone Spring formations and around 300 in the Eagle Ford....In
each of those formations, the excess has fallen by about 150-175 over the
past six months, bringing the surplus to around 300 wells in each." So if
the surplus is 300 each, then the total DUCs would be 850 in Wolfcamp/Bone
Spring and 600 in Eagle Ford. So formation totals would = ~1,000 Bakken
+ 850 Permian + 600 Eagle Ford = 2,450 for these three formations. Anyone
have any insight on where the remaining oil primary formations currently
sit at regarding their DUCs?
I have grave reservations about the alleged spare capacity of Iran.
The assumption is that the big, bad sanctions resulted in a huge drop in
Iran's oil production. I am not buying it. I think the sanctions were a
joke. For starters many nations refused to take part in the sanctions. Nations
like India, china, japan and South Korea for starters. It would not be difficult
to then reexport this oil to the rest of the world on the sly.
Would you please comment on this important matter. Does anyone have any
inside information about this?
Agree, most of us follow news as herd effect, but devil is in the detail.
Before the sanction, Iran was export 2.5 million barrels of oil per day
but had to import almost 0.5million barrels of processed fuel, gasoline
and diesel.
Now, 4 years after the sanction starts, Iran already built up the refinery
capacity, so it will no longer need import of refined fuels; instead it
will be exporting, how much is yet to be decided. So, right there, we will
see over 0.5 million barrels of reduction in the oil to be exported from
Iran. Yes, the sanction reduced the Iranian oil export from 2.5million to
1.5million per day, but the net effect after sanction now will be less than
0.5 million per day to the world market.
40 years, I would be surprised if you didn't have reservations. You aren't
the only one. Iran's infrastructure wasn't that great before the sanctions
so I would guess they are abysmal now. I don't think they can get to 4 million
this year, but the problem with that is I am speculating so we will just
have to track its exports and see what happens. Right now, I think it would
be ok to reduce that number by 400K BO/d. I think the biggest issue is Iran
thinks its possible, so maybe there is something going on we haven't thought
about. Probably not, but it is still something to consider. I wasn't a big
fan of the sanctions either, but some politicians would say they worked.
I think it is very possible to re-export the oil the only problem is the
very large volumes Iran can produce. If this was a small producer it is
probably easy if you sell it cheap enough (like ISIS does).
FracDaddy, I agree on EOG, but I wouldn't say they are really Bakken focused.
I think they like the Eagle Ford and Delaware Basin better. I would probably
call them a top Eagle Ford pick though. Hess has done a great job with costs
and has excellent margins, but they are still doing sleeves for the most
part, and I don't think they offer as much from a growth in production per
foot perspective. I probably like EOG more and HES less than CLR but I wouldn't
say I dislike any of them.
Do you know why CLR drilled much less number of wells in the
Springer than the Woodford below? If the economics for Springer is much
better than Woodford as CLR said before (such hype like "3X better" is no
longer in their latest PPT), they should be targeting Springer, like they
are targeting STACK? The 300K curve in 240days in Woodford is for wet gas
or NGL, probably not even light condensate.
Looking at CLR's 2016 plan, they will drill almost zero wells in Springer.
Is it possible Springer actually is hard to drill? Studying the Springer/STACK/Meramec
and found that these stacks,although quite thick, i.e. >400', they are not
homogeneous, meaning the sweetspot layers could be hard to locate within
<50'. This is different than the Woodford shale below, where the target
is well defined, i.e. the core is in the shale. It is easy to do geosteering
using gamma.
nuassembly, I think it has much to do with what you said. They are still
getting comfortable with the Springer geology while the Woodford is already
seeing pilot projects. The Springer definitely looks better though. I cant
comment on the wetgas/NGL versus light condensate comment, as Im not sure
about that.
It is possible that right now CLR doesn't want any failures given the
current economic conditions (especially with no hedge book). Thank you for
sharing your knowledge with respect to the Springer/STACK/Meramec.
You are using old info - at lot of SAGD oil sand production has half the
costs indicated in your chart. To may authors just scrape up the old obsolete
charts that are out there and use them in their articles.
marpy, Sorry if you didnt like the chart. Feel free to share links to any
charts you feel are appropriate. The article had little to do with oil sands,
but if you think PIRA's data is off feel free to correct it in future comments.
Have a good day!
Is this article a joke? Discussion the investment value of an oil company
that does not pay a dividend! Executives may be getting fat on this company,
but I doubt this result for stockholders.
Bruce909, No joke and no one is getting fat of any oil companies right now.
When investing we generally try to estimate where companies and oil prices
are going not where they are right now. I don't know what the plans are
for a dividend, but CLR and most unconventional producers aren't in a position
to do much. Thanks for the comments, and glad I could make you laugh :)
I don't see why HBP drilling a couple years ago was such a great decision.
After all, the costs were higher at that time, then they are now.
Also, the value of the acreage has dropped. Would seem to have been better
to keep the cash and wait to HBP (or let leases lapse even) now. The one
possible benefit from CLR's approach might be that they have stuck to a
plan and done a huge Design of Experiments assessment of geology and completion
techniques across the basin. And then there is some value of that. I don't
really buy that though. Don't think that kind of knowledge has as much value
in the world where marginal acreage doesn't get drilled, in a world where
downspacing is less. (Because oil is worth less.)
For that matter, I have read that many companies put too much value on
data points that they acquire themselves and too little value on the data
that is easily acquired on wells that competitors did (from logs, cores,
NDIC database, DrillingInfo, etc.). So, I don't really buy it as a rationale.
But just listing it as a possibility.
21793061, Thanks for the comment. In hind sight you are definitely correct.
I bet the mineral rights owners are happy they got the royalties they did
(and I am happy for them too, but wish Bison73 would have gotten more).
I think many thought we would have high oil prices for a long time, as not
too many thought it would be possible for unconventional production to grow
enough to cause a glut. That said, you are correct. Bigger names with some
cash will make out like bandits, as they are able to add acreage at what
will look like great deals in a year or two.
217930681 CLR actually has small working interests in a great many of the
wells that their peers drilled with operational control. Hamm has said repeatedly
that CLR studied and learned just about everything that occurred with these
non operated wells.
They have a huge amount of acreage with minimal second
and third bench TF development ... to say nothing about the almost nonexistent
delineation of the fourth bench.
CLR has made an enormous investment very early on in the Bakken.
When
prices recover, they are apt to reap significant benefits.
Mike - my mother signed the rights for that royalty although her initial
rate was 12 and 1/2%. She is 91 years old and when they came and initially
got the rights (back in 1985 or so) it was considered a good rate. That's
why I sometimes laugh at everyone who thinks that mineral owners in the
Bakken got 20% especially in the Parshall area (EOG prime area).
And my mineral acres are between Van Hook and New Town! I am not complaining
by the way. Some people unknowingly sold their mineral rights when they
sold their land and when the reservoir was created the Corp of Engineers
bought a lot of land and a lot of people lost their mineral rights but I
digress!
Bison, I am guessing any rate in that area would be pretty good. When people
start talking about royalty payments the number always seems to get bigger
as each person passes the rumor around. When the deals were signed in Parshall
Field no one new the volumes of oil the operators would get out of the ground,
or how high oil prices would go.
Thanks for the comment. Since Parshall is my hometown I know quite a
bit about what happened during the run up to the Bakken boom. Landmen were
throwing money (what people in the area thought was a lot) around and they
signed on the dotted line very quickly. I remember bonuses being paid in
2010 in the thousands of dollars/acre range which in hindsight was insane.
Michael - nice article, some really good data here. I'd like your opinion
on something, if I may. Shale plays have completely changed the game over
the past few years. Their startup economics is pennies on the dollar compared
to say, deepwater, where only the biggest players could play and the investment
costs were enormous before even a single barrel of oil was produced. Relatively
cheap to get into = lots of potential players. Now one of the things I've
only seen mentioned in one or two SA articles is this business of "producer
discipline".
There was a recent quote by the CEO of EOG saying something to the effect
that US operators had "learned their lesson" (I'm paraphrasing) and that
producer discipline would definitely be an active concern going forward
once the recovery comes. You appear to know the players in the unconventional
space pretty well. Given the current operators and any new we may see once
a recovery does come, is "producer discipline" even a remote possibility?
I personally have my doubts but would like to know what you think. Thanks.
In a free market (non collusion), then the only thing that enforces "discipline"
is the marginal producer effect. If there are operators who produce below
cost of capital (irrational), then eventually the market disciplines them.
Conversely if there is irrational hesitation to invest, then other entrants
will come and take the opportunities. It makes me cringe to hear all this
talk about "discipline". Reminds me of Dick Cheney talking about reducing
volatility.
These are code words for collusion. Fortunately this is against the law
and also difficult to achieve, given all the small producers. Well...fortunate
for consumers. For producers, they would love to have them some collusion.
Even better if OPEC will do the job for them.
Devon paid 1.6Billion in the past December, 3 months ago, for Felix acreage.
It is $20K/acre!!! while oil price dipped below $40!!
According to CLR STACK PPT, more than half of the Felix acreage is outside
(east) the so called "Pressurized zone", which means under par?
According to CLR's initial Springer story, it is over 200' thick, while
Newfield claimed it is as thick as 700'. Boy, that means everywhere you
drill there is oil--- it can not be that easy, you need to be able to geosteer
in the sweet stack, e.g. within 50' of the 700' possible. Do you see that
CLR is no longer mentioning its Springer in their latest report?
My speculation is that they will have similar challenges in Springer, or
even greater challenges, in the STACK than in Springer.
Not sure how CLR and Felix compare in sweetness (or
in wells dug and producing, i.e. steel in the ground.) But just looking
at the latest CLR conf call powerpoint, they have 595,000 acres of STACK
& SCOOP. If you make simplest assumption and say same price as Felix than
that gives you $14.1 billion for their OK acreage.
2. I agree that they don't seem to be pushing the Springer as much as earlier.
That said, it was still in several pages of their PowerPoint and in the
10-K. So not sure what you mean when you say "no longer mentioning". And
which CLR report are you referring to?
Michael, Thanks for all the work you put in for this article. Lots of good
information.
The one problem I have with most oil companies, is using BOE. It was
refreshing to see CLR state actual bbls /day in their presentation. Look
like decent wells but they are going to have to reduce their CWC to make
it a great play. I expect a year from this time, these well cost will have
decreased significantly.
Excellent article, but my question is one of changing the oil curve. Most
of CLR's success had been as oil stayed above $80.BBL from 2003 until 2014.
If we are resetting the standard price based on supply and demand oil could
end up between $15-$45 for the next 2-4 years. How can CLR sustain a longer
period of lower prices with the amount of debt currently to equity, and
taking into consideration the low float? I cannot recall a time when they
were as cash strapped as they are now and debt ridden.
If I understand your theory oil would have to be $40-$80 and if you compare
current supply to that of 1985 I believe too many investors are forgetting
how long we can stay in the lower end of $25 BBL.
green law. If you have the time, go to the section near the back of CLR
10K where is contained future cash flow estimates for the years 2013, 2014
and 2015. Reduce the estimate of future cash flows to $25 billion and estimated
future income taxes to zero for 2015.
Undiscounted future net cash flows fall to $7 billion under your pricing
scenario, which means trouble given company debt levels.
"... A lot is written at the moment about shale break even prices of 24 to 40 usd. Every time i try to calculate those numbers, even when using best wells as per shaleprofile.com i cannot get even close to those numbers. Does somebody have the basics behind the above break-evens? ..."
"... There are outlier wells that work, but Enno's shale profile.com site is an excellent resource which shows that really no company can make these wells work at prices under $50 WTI, and really that $80+ is needed to have a good business. Remember when CLR cashed their hedges, they said they saw prices returning to $80-$90 soon. They did not. CLR and all others have cut to the bone on costs, but it is impossible to cut enough to overcome a 60-70% loss of gross revenue. ..."
"... Daniel, in 50 years of being an oil producer I had never heard the term "breakeven" until the shale oil industry came along; it is a meaningless, much overused metric. The oil industry drills wells to make money, so we can drill more new wells with net cash flow from old wells. Profitability is all that matters. Reserve growth cannot occur without profitability; unless of course you are in the shale oil business, in which case you simply borrow enough money to grow, in spite of unprofitability, and suffer the consequences down the road. Which is precisely what is happening now. ..."
"... I don't borrow money to drill wells (that is a well known no-no) so I can't wait 60 months to get my money back on a well I've drilled and completed. Thirty six months is the maximum and even that is too long. The 150% ROI numbers the shale industry use to throw around regarding "profitability" (but certainly can't any longer!!) is insufficient return on investment to keep moving forward, at least to me. I need at least 300% ROI. If my CAPEX is risked I need even higher ROI. If I can't achieve that, I don't drill the well. I was taught these standards by many before me and they still apply today. ..."
"... With great respect for my friend Shallow sand, I think it would actually require in excess of 120 dollar oil prices for the shale industry to be able to drill wells off net cash flow, in other words, to live within its means and not borrow money it can't pay back. As far as I am concerned the hundreds of billions of dollars it has already borrowed…we'll never see that. It's gone. ..."
A lot is written at the moment about shale break even prices of 24 to
40 usd. Every time i try to calculate those numbers, even when using best
wells as per shaleprofile.com i cannot get even close to those numbers.
Does somebody have the basics behind the above break-evens?
Enno and Daniel. The simple, undiscounted 60 month payout calculation has
not been refuted, with really even no attempt to, since I first used it
in early 2015 on LTO.
The only real criticism that has been valid has been from Mike, and a
few other oil producers, who say 60 months is too long. Mike is probably
right, but I am trying to give the companies the benefit of the doubt.
There are outlier wells that work, but Enno's shale profile.com site
is an excellent resource which shows that really no company can make these
wells work at prices under $50 WTI, and really that $80+ is needed to have
a good business. Remember when CLR cashed their hedges, they said they saw
prices returning to $80-$90 soon. They did not. CLR and all others have
cut to the bone on costs, but it is impossible to cut enough to overcome
a 60-70% loss of gross revenue.
I have posted this model on seeking alpha several times. No successful
attacks of my fifth grade math that I am aware of.
Enno, I think you made a good point with me awhile ago that the audience
needs it dumbed down. Given few can understand the 60 month payout, let
alone discounting future net cash flows, I wholeheartedly agree.
I encourage all to visit Enno's site. It exposes the 900K EUR fallacy
very well. Of course, the 900K is routinely half or more BOE gas, which
has been selling below $12 per BOE for months.
There is a producer who posts on Oilpro.com named Jackie, whose posts
I really enjoy. He keeps it simple, and I agree with him. If there is less
money coming in the bank account than going out, you are losing money. No
amount of slick investor presentations can refute that.
Daniel, in 50 years of being an oil producer I had never heard the term
"breakeven" until the shale oil industry came along; it is a meaningless,
much overused metric. The oil industry drills wells to make money, so we
can drill more new wells with net cash flow from old wells. Profitability
is all that matters. Reserve growth cannot occur without profitability;
unless of course you are in the shale oil business, in which case you simply
borrow enough money to grow, in spite of unprofitability, and suffer the
consequences down the road. Which is precisely what is happening now.
I don't borrow money to drill wells (that is a well known no-no)
so I can't wait 60 months to get my money back on a well I've drilled and
completed. Thirty six months is the maximum and even that is too long. The
150% ROI numbers the shale industry use to throw around regarding "profitability"
(but certainly can't any longer!!) is insufficient return on investment
to keep moving forward, at least to me. I need at least 300% ROI. If my
CAPEX is risked I need even higher ROI. If I can't achieve that, I don't
drill the well. I was taught these standards by many before me and they
still apply today.
And by the way, anybody claiming that shale oil CAPEX is not highly "risked"
I submit to you that the price of oil has fallen 70% in the past 16 months.
With great respect for my friend Shallow sand, I think it would actually
require in excess of 120 dollar oil prices for the shale industry to be
able to drill wells off net cash flow, in other words, to live within its
means and not borrow money it can't pay back. As far as I am concerned the
hundreds of billions of dollars it has already borrowed…we'll never see
that. It's gone.
Shallow you and Enno did great yesterday on Alpha; Filloon is a big time
Bakken cheerleader. Those guys are getting desperate with their we're OK
rhetoric now. Its not about big IP's and EUR's, it's not barrels and mcf's…its
about dollars and cents, nothing else. Keep up the good work, y'all.
As always, it is a pleasure to read your "no B.S." comments. Cut to the
chase and tell us like it is. Nice to have people in the reality based world
weigh in on the madness.
"Filloon is a big time Bakken cheerleader. Those guys are getting
desperate with their we're OK rhetoric now." ~ Mike
"My husband's company has it's own studies saying to expect 2 million
barrels a day from this state in 2019 and staying at that level until
around 2030." ~ dn_girl
"We had a proud young woman post yesterday about her… optimism about…
future in the oilfields of North Dakota. It is a powerful message that
we should have all embraced…" ~ Mike
"I gotta go let some good kids go. Damn, I hate that…" ~ Mike
"As always, it is a pleasure to read your 'no B.S.' comments. Cut
to the chase and tell us like it is. Nice to have people in the reality
based world weigh in on the madness." ~ islandboy
"I mix with professional people and and I know i have earnt up to
double their pay scale…" ~ toolpush
I believe that $100 plus oil prices was the real fuel that fed the growth
in LTO production. At that price a very good ROR was made and fund were
provided.
It was simply the situation in which Wall Street needed
a place to dump money provided by Fed and shale came quite handy.
According to Art Berman, during the 5 year period (2008-2012), Chesapeake,
Southwestern, EOG, and Devon spent over 50 billion dollars more than they
took in. Such a great profitability.
"... You also may be interested in the discussion (in the comment section) I had yesterday with Michael Filloon (a writer on Seeking Alpha), in which also a few calculations were presented: http://seekingalpha.com/article/3959718-bakken-update-continental-resources-top-bakken-player-2016 ..."
"... There are outlier wells that work, but Enno's shale profile.com site is an excellent resource which shows that really no company can make these wells work at prices under $50 WTI, and really that $80+ is needed to have a good business. Remember when CLR cashed their hedges, they said they saw prices returning to $80-$90 soon. They did not. CLR and all others have cut to the bone on costs, but it is impossible to cut enough to overcome a 60-70% loss of gross revenue. ..."
"... I encourage all to visit Enno's site. It exposes the 900K EUR fallacy very well. Of course, the 900K is routinely half or more BOE gas, which has been selling below $12 per BOE for months. ..."
"... There is a producer who posts on Oilpro.com named Jackie, whose posts I really enjoy. He keeps it simple, and I agree with him. If there is less money coming in the bank account than going out, you are losing money. No amount of slick investor presentations can refute that. ..."
A lot is written at the moment about shale break even prices of 24 to 40
usd. Every time i try to calculate those numbers, even when using best wells
as per shaleprofile.com i cannot get even close to those numbers. Does somebody
have the basics behind the above break-evens?
Enno and Daniel. The simple, undiscounted 60 month payout calculation has
not been refuted, with really even no attempt to, since I first used it
in early 2015 on LTO.
The only real criticism that has been valid has been from Mike, and a
few other oil producers, who say 60 months is too long. Mike is probably
right, but I am trying to give the companies the benefit of the doubt.
There are outlier wells that work, but Enno's shale profile.com site
is an excellent resource which shows that really no company can make these
wells work at prices under $50 WTI, and really that $80+ is needed to have
a good business. Remember when CLR cashed their hedges, they said they saw
prices returning to $80-$90 soon. They did not. CLR and all others have
cut to the bone on costs, but it is impossible to cut enough to overcome
a 60-70% loss of gross revenue.
I have posted this model on seeking alpha several times. No successful
attacks of my fifth grade math that I am aware of.
Enno, I think you made a good point with me awhile ago that the audience
needs it dumbed down. Given few can understand the 60 month payout, let
alone discounting future net cash flows, I wholeheartedly agree.
I encourage all to visit Enno's site. It exposes the 900K EUR fallacy
very well. Of course, the 900K is routinely half or more BOE gas, which
has been selling below $12 per BOE for months.
There is a producer who posts on Oilpro.com named Jackie, whose posts
I really enjoy. He keeps it simple, and I agree with him. If there is less
money coming in the bank account than going out, you are losing money. No
amount of slick investor presentations can refute that.
"... I have read all about the sweet spot and certainly understood the concepts, but maybe I put a little too much belief in the corporate presentations. It is had to find a good balance, with so much information at hand, but it is also hard to come to any other conclusion with EOG, that their sweet spots are just not so sweet these days! ..."
"... Look at Whiting. Another early entrant. 2008, 2009 and 2010 far superior to all years thereafter. Look at these two in Niobrara also. ..."
"... I love Whiting Niobrara, 2015 well productivity. So much for all the "productivity" improvements. lol These graphs, really cut though the gloss put out by the companies. ..."
"... I also found the EOG results quite shocking. Do note though that their average well is still performing nicely compared with other operators. I get the strong impression that EOG is only interested in clearly profitable operations, and not the unprofitable/marginal stuff. EOG has also hardly drilled into the Three Forks formation, which is clearly (>15%) performing worse than the Middle Bakken, while other operators have shifted new wells to a great extent (up to 50%) to the Three Forks. The annual total number of new wells in the Middle Bakken formation already peaked in 2012. ..."
"... EOG was the first big operator to rapidly pull back from Bakken in 2014, and its production has halved by now since Sep 2014. ..."
"... Although we don't yet see a major deterioration of new wells in ND overall yet, there are several areas within the Bakken where this can be found – so far this effect gets compensated in other areas. It is also striking to me that despite a drop in completions of > 30% from 2014 to 2015, there has not been a marked improvement in well productivity which you would expect as operations shifted to better areas. ..."
"... If the meme of retreating to the sweet spots and bigger better completions was true, then we should be seeing an increase in well productivity during 2015. Certainly across some of the major companies, this is shown not to be true. This must bring doubt upon the validity of closer well spacings, that have been the flavour of the day, and allowed high intensity well pad drilling. ..."
Firstly, I love Enno's graphs. I know they have been up for a while, but today is the day I have
really had a chance to explore.
I got a shock when I looked at EOG well quality. 2013, was obviously a high water mark for
well quality. But it is the poor performance of 2014 and 2015, that caught my eye. I do know EOG
were one of the first to cut back drilling, and also made even deeper cuts in completions. I can
understand the severe cut backs, and EOG could afford them, but I don't understand any reason
why they would be selectively completing their poorer wells, especially when the drop in productivity
starts in 2014. It is not just the initial production that is down. The 2014/15 continue dropping,
with both about to fall below the 2010 line, which is the lowest water mark.
I have read all about the sweet spot and certainly understood the concepts, but maybe I put
a little too much belief in the corporate presentations. It is had to find a good balance, with
so much information at hand, but it is also hard to come to any other conclusion with EOG, that
their sweet spots are just not so sweet these days!
EOG were the first in, and maybe the first to show the longer term future, or lack of it?
I love Whiting Niobrara, 2015 well productivity. So much for all the "productivity" improvements.
lol These graphs, really cut though the gloss put out by the companies.
I also found the EOG results quite shocking. Do note though that their average well is still
performing nicely compared with other operators. I get the strong impression that EOG is only
interested in clearly profitable operations, and not the unprofitable/marginal stuff. EOG has
also hardly drilled into the Three Forks formation, which is clearly (>15%) performing worse than
the Middle Bakken, while other operators have shifted new wells to a great extent (up to 50%)
to the Three Forks. The annual total number of new wells in the Middle Bakken formation already
peaked in 2012.
EOG was the first big operator to rapidly pull back from Bakken in 2014, and its production
has halved by now since Sep 2014.
Although we don't yet see a major deterioration of new wells in ND overall yet, there are several
areas within the Bakken where this can be found – so far this effect gets compensated in other
areas. It is also striking to me that despite a drop in completions of > 30% from 2014 to 2015,
there has not been a marked improvement in well productivity which you would expect as operations
shifted to better areas.
If the meme of retreating to the sweet spots and bigger better completions was true, then we
should be seeing an increase in well productivity during 2015. Certainly across some of the major
companies, this is shown not to be true. This must bring doubt upon the validity of closer well
spacings, that have been the flavour of the day, and allowed high intensity well pad drilling.
That a company with the technical ability and cash of
Shell would find production from fracked shale had not "play(ed) out as
planned" should give pause to the investors and commentators who have become
believers in the shale miracle.
Mr
Voser commendably took responsibility in August for a
$2.1bn writedown on the value of the company's US shale assets – particularly
since I also misestimated the productivity of some US unconventional gas reserves,
although in a different direction.
I had thought, when the benchmark US Henry Hub gas price bottomed at the
beginning of last year,
that a decline in gas drilling forced by a shortage of exploration and production
sector cash flows would result in a very rapid rise in price to cover the full
cost of production.
Well, prices have risen, but not as fast as I imagined.
That is due to high production from two sources that increased at greater
rates than most industry people – and I – expected: "associated" gas, from oil
or gas-liquids directed drilling, and gas wells in the
Marcellus Shale .
The Marcellus is a huge "play" of sedimentary rock across much of the northeastern
US, with gas and liquids production concentrated in western Pennsylvania, Ohio
and West Virginia. There are also a lot of Marcellus reserves in New York state,
but there is effective political opposition to developing them.
Without new production from the Marcellus, US gas supplies would probably
have declined since President Obama hailed
the shale revolution in his January 2012 State of the Union address. From
a technical point of view, the strength of Marcellus production has been driven
by shallow depth and short lead times, along with the industry's rapid productivity
increases.
Even so, there are some reasonable questions that can be raised about the
Marcellus miracle, setting aside any tightening of federal, state or local
regulation of shale gas drilling .
To begin with, despite the extraordinary success of the exploration and production
effort, not a lot of money is being made. Consider
Cabot Oil and Gas , which has an excellent reputation for management, reserve
quality and technical ability, especially in the Marcellus region.
Last year, it chalked up a return on equity of about 9.5 per cent.
That is good; if it were a European bank, COG would be at the head of the
class, but it is not at the lighting-cigars-with-$100-bills end of capitalism.
As Mr Voser told the FT: "[Shale well] decline rates are very high, so after
18 months your production drops very sharply, which means you have a business
model of constant investment."
That is demanding enough for a highly diversified investment grade company
such as Shell; if your company is junk-rated, it is much harder.
Also, rising Henry Hub prices overstate how much Marcellus producers have
benefited from their hard work and good luck. Ryan Smith, an analyst at Bentek,
an energy research firm that recently published a report on the Marcellus and
Utica shale plays, points to the "basis", or discount, that Marcellus gas is
getting. "Producers are constrained by pipeline capacity, which is vital. When
[one of two new pipelines comes on line] in November, that will be filled up
within a month. Drilling is backlogged."
Beyond next year , though, there is a steep wall of capital demands for
new pipelines, reversals of existing pipelines, export terminals, nearby chemical
plants, and gas-fired power plants.
What really surprised the industry was the continuing supply of new capital
from lenders and return-short investors. This interrupted what would have been
a typical oil and gas drilling cutback phase.
In other words, yes, there is a big Marcellus effect, but it may turn out
to have been superhyped by quantitative easing. We will see what happens if
the oil price falls and interest rates ever rise.
John Kemp: Why shale skeptics are wrong: http://www.reuters.com/article/2013/10/17/shale-idUSL6N0I72FD20131017?feedType=RSS&feedName=everything&virtualBrandChannel=11563
The UK has over 2,000 years of shale gas. This is a proven fact. Shale
gas is incredibly cheap (the price of gas in the US has plummeted) and abundant.
We could add many percentage points to our growth if we embraced shale
gas 100%. Brush aside the useless hippies and enviro-wack-jobs and get drilling.
In an instant we would become 100% energy independent, household energy
bills - including electric - would plummet to about only 10% of what they
are now which would free up a tidal wave of money to be spent into the economy.
Also, about 500,000 new jobs would be created in the shale gas industry.
This is a no brainer! Frankly the naysayers should be arrested for treason.
Did anyone read Dr. Tim Morgan's piece from earlier this year saying
shale gas is the next big popular delusion? It was on FT Alphaville.
He says that the whole global growth story of the last century boiled
down to a "surplus energy equation": in the past, one unit of energy used
could extract fuel that created 100 units of energy. But now this ratio
is declining and will continue to do so.
If it now takes 20 people to extract X amount of fuel whereas in the
past it used to take 1, then that's 19 people who can't be deployed elsewhere
to do other useful stuff. And it costs more to extract energy, in line with
the thesis above.
A FT front page image from about 6 months ago seemed to support this
point. The FT published a "heat map" photo from space showing fracking sites
in the US. They were all aglow - much more so than other production sites
or towns and cities!
Please - Try accrual accounting and you get a different picture - unfunded
entitlements and lets not forget promises that pols will make to voters
at the expense of those yet to be born.
The depletion rate for a well has been given as 80% in two years The
well can be re-stimulated and will produce some more , any further efforts
bring decreasing yield .
an operating company must then drill one new well for each older than one
year old , this just to keep their flow rate .
there is good money but not a given, each well pan out differently
If it costs $5mm per well and you recover $10mm PV over the life of the
well, then it appears to be a good investment. Wash, rinse and repeat. If
you spent too much on the leases and your all in cost of each well is higher
than PV production values (Shell), then wind it up. One real issue for these
properties is their nature as a depleting asset, an asset the rarely gets
valued correctly in the markets. And one real offset for this risk is the
potential for stacked plays (layer upon layer of frackable gas under the
same piece of land) - for COG it's the Utica under the Marcellus, and for
Bakken, Permian and Niobrara players it's multiple stacked layers. Hence
the recent conclusion by analysts that the Permian basin is still one of
the largest oilfields in world with future production numbers that are expected
to massively surprise on the upside. FT, don't make us do your work.
Analysis seems a bit limited in its understanding of the drilling business
model - need to drill land to hold reserves requires lots of upfront expenses,
etc. As always, the FT seems to dig enough for our attention, but not enough
for conclusions worth the read.
Thank you for an article which mentions depletion - "decline rates" in
a serious way. The fact is that the only people who have made serious money
in this game were the people who speculated in "prime acreage" and sold
it on to the big boys like Shell and BHP.
Of course, the best acreage is that which is used early on so the idea
that the productivity will always increase is at variance with geological
reality. The document below shows that in the 12 months to July 2013, the
number of wells in the Bakken increased by 1,628 (36%) - and the oil produced
increased by 172,643 barrels per day (27%). So much for the much touted
"the industry's rapid productivity increases.". True, these figures are
for oil, but there is little reason to think they are dramatically different
for gas.
I think the Red Queen understood it well: "Now, here, you see, it takes
all the running you can do, to keep in the same place. If you want to get
somewhere else, you must run at least twice as fast as that!"
@Felix Drost: You are quite right when you say "Shale is only profitable
in a world where energy prices are high". What people tend to forget is
that the shale plays were known about decades ago, and the first fracking
of a well happened in the 1940's. Clearly we are only exploiting these expensive
resources because all the cheap resources have been exploited and are in
production decline. It's not as if they are a bonus for some great new technological
achievement!
truth serum | October 13 12:28am
thank you for your reply.
"you look into statistics on the time to drill wells, you'll see that in
each emerging play, the time taken to drill and complete wells decreases
over time. "
Those would be really interesting data.
I googled the expressions you suggested, namely Fayetteville Shale, Eagle
Ford and Barnett Shale, and there comes out a flood of references.
Would you please be more specific ? I would really appreciate.
Is there a website where those data are available beyond anectodical evidence
?
Shell paid far too much to get into the market, that's the main reason
why it has a substantial write off. It bought into shale during the heady
days when it seemed "There's gold in them thar hills." They took a large
risk. But right now they have expanded the expertise to explore shale and
are increasingly good at it.
Shale is only profitable in a world where energy prices are high, it
is simply too costly to exploit otherwise. That returns are around 10% and
will probably stabilize around there isn't odd, returns never would have
reached Saudi-levels, that was plain from the start. Neither do oil majors
earn much from easy to access resources, the host countries typically do.
10% ROI sounds pretty good in an industry that must continue risky investments
to exploit smaller and harder to access fields.
What's great about shale in the US is the huge investments required which
translate into jobs jobs jobs, powering a recovery in many states. The low
ROI and high costs ensures a more equitable spread of the proceeds in the
economy when compared to e.g. Saudi Arabia.
During the 5 year period (2008-2012), Chesapeake, Southwestern, EOG,
and Devon spent over 50 billion dollars more than they took in according
the Houston consulting geologist Art Berman. Rapidly declining very low
productivity "shale" gas wells are the culprit. The operators have to keep
drilling or their production drops like a rock! The smaller public companies
cannot allow this to happen or their stock tumbles and it is curtains for
the company. Shell's Voser explained what many oil & gas folks in the U.S.
determined two or three ago. The "shale players" over-estimated the productivity
and under-estimated cost by a factor of two or more. Add the low natural
gas prices and most shale plays will be gone in a few more years. Raise
natural gas prices to $8 or more and the fragile U.S. economy heads south
again.
Five other operators - EOG Resources, ConocoPhillips, Continental Resources,
Oasis, Pioneer. Hess, Apache are two others. Of course, not all of these
are PURE unconventional plays. Petrohawk was another one but they were acquired
by BHP. Don't have time to look up the stats right now. Look, if these plays
were unprofitable why would companies continue to pour resources into them?
I think it you look into statistics on the time to drill wells, you'll see
that in each emerging play, the time taken to drill and complete wells decreases
over time. Look to Fayetteville Shale, Eagle Ford and Barnett Shale for
evidence.
Would you turn to the CEO of Blackberry for an assessment of the profitability
of smartphones in 2013, and future market trends? I didn't think so. Ask
Ryan Lance (ConocoPhillips), Mark Papa (EOG) and Harold Hamm (Continental)
what they think of unconventionals' profitability.
The reason Shell lost money is hey did not appreciate gas was so abundant
and costs to produce it would fall so much. We have hundreds of years worth
of gas
Great Article.
@truth serum | October 12 2:17am
great remarks.
"Shell is unwilling or unable to learn from successful operators"
would you please list five of them ? it would be a very interesting counter
evidence. Especially if you manage to mention their ROE and their Free Cash
Flow.
If I have understood well what the article means, shale gas extraction is
in a profitable stage of its life cycle but, at the same time, in a negative
Free Cash Flow one, because competitors need to invest a lot to keep the
pace of a constant decrease of extraction costs coupling it with pre-emptive
strategies on prime acreage.
Those are the strategic business units which many years ago used to be called
"stars" in the Boston Consulting Group Matrix, see http://bit.ly/1g9n21U
moreover,
"cutting costs in manufacturing mode while ascending a steep learning curve"
do you mean that shale gas/oil costs are decreasing rapidly for those who
keep investing? a sort of "learning by doing" (and investing)?
again, do you have any evidence for that ?
My interest is purely academic. Shale gas extraction industry would be worth
setting up a case study and some research papers.
Just because Peter Voser's Shell cannot figure out a way to produce unconventional
gas and oil profitably, this does not mean that the industry as a whole
has not figured out a way to produce unconventional gas and oil profitably.
Alas, Shell is unwilling or unable to learn from successful operators. It's
all about 1) getting prime acreage early and 2) cutting costs in manufacturing
mode while ascending a steep learning curve to optimize well completions
and spacing. Ask Harold Hamm if he thinks the Bakken Shale is unprofitable.
My colleague Tim Morgan clearly highlighted shale's poor energy return on
energy invested, which is the root of the problem, in his publication
Dangerous Exponentials in June 2010.
Of course his warnings about this troublesome equation have been universally
ignored by the cheerleaders for the "US shale miracle", so I suppose to them
this disappointment is surprising.
T C Smith, Chief Executive, Tullett Prebon, Chief Executive, Fundsmith,
UK
Yes we are, I would direct people to Enno Peters website.
He does a fine job on this,
Based on the latest NDIC data, total oil production in North Dakota fell to 1122 kbo/d
in January, again a monthly drop of 30 kbo/d. This decline was slightly higher than I expected.
The number of new wells producing dropped to 70.
"... Seems to be the possibility of a decrease of 200K-400K in one state over a two year period is noteworthy. ..."
"... I think that ND production could decline to 800 kb/d by year-end only if very few new wells are drilled and completed. ..."
"... I actually expect ND rig count and completion activity to rebound in the second half of the year. Therefore, oil production is unlikely to drop to 800 kb/d, in my view. ..."
Dennis: Not to steal your thunder concerning your post, but the last two months' ND data indicate
an annualized decline of approximately 30%.
Way too early to tell, but if that rate held up throughout 2016, by year end ND production
would be in the low 800K range, by my math at least.
If that occurs, I question whether the 12/14 peak could be surpassed. I suppose if operators
work through their DUC inventories this year, assuming prices rebound enough, 800K range is out
of question, but I think below 1 million is very likely.
Seems to be the possibility of a decrease of 200K-400K in one state over a two year period
is noteworthy.
I think that ND production could decline to 800 kb/d by year-end only if very few new wells
are drilled and completed.
Theoretically, the December 2014 peak could be surpassed, but only several years from now,
and only if oil prices stay at relatively high levels (above $70) for at least 2-3 years.
I actually expect ND rig count and completion activity to rebound in the second half of
the year. Therefore, oil production is unlikely to drop to 800 kb/d, in my view.
Based on the latest NDIC data, total oil production in North Dakota fell to 1122 kbo/d in January,
again a monthly drop of 30 kbo/d. This decline was slightly higher than I expected. The number of
new wells producing dropped to 70.
I have added 2 tabs in the above presentation; one that shows
the top operators, and another one that shows the gas and water production that is produced together
with the oil, in North Dakota. By using the arrows you can browse through the 5 tabs.
Drilling activity has continued to drop sharply during the last months. There were 88 wells spudded
in December, 61 in January, and based on preliminary data it looks like just 30 wells were spudded
in February. This sharp drop surprised me, as the drop is even more steep than the drop in rigs.
This indicates that the drilling efficiency has dropped again these months.
"... A number of signs point to the decline in production continuing during the rest of 2016 unless there is an extended oil price recovery. For a start, the number of new permits to drill wells in North Dakota is at a seven year low – indicating a low appetite for drilling (more on that in a minute). Second, there were 1183 inactive wells in the state in December - about 30% above normal for this time of year. The operators have essentially abandoned these inactive wells – usually because they are losing money. Many of these inactive wells are older and had very low production rates - less than 35 b/d. Such older wells are known as "stripper" wells and their costs are long ago written off – so operators usually keep them running unless transport and maintenance costs exceed the value of the crude – i.e. prices get too low. ..."
"... The strongest indicators of a slowdown in Bakken production come in the reduction in drilling rigs operating in North Dakota and a parallel decline in the number of well completions. We'll look at the rig count first then get to completions. ..."
"... The combination of the potential tax incentive early in 2015 and the extension of the one year limit in October led to a growing backlog of DUC wells in North Dakota that is now having an impact on production forecasts ..."
"... It seems that those producers who can afford to are increasingly opting not to complete Bakken wells but instead to leave DUC wells "on the shelf" as a kind of storage play – waiting for prices to improve. ..."
"... Many smaller companies do not have the luxury of waiting and many of these are likely to be either already casualties of the price crash or living on borrowed time (see Zombies ). ..."
"... The summary chart shows that at $30/Bbl - to achieve a consistent IRR above 20% (for even the highest cost wells) - producers need to target wells with an IP of at least 1500 b/d. Looking at historic drilling and production records, NDPA found only 63 wells – concentrated in McKenzie, Mountrail and Dunn Counties that had IP rates of 1500 b/d or higher. Those 63 wells represent just 1% of the 6000 Bakken wells that would breakeven if wellhead prices were between $55 and $70/Bbl. In short the analysis makes clear that only a fraction of existing wells would breakeven or produce an acceptable IRR at today's low crude prices. ..."
"... The expectation that oil prices might remain low for a long time is rapidly sinking in for U.S. shale producers. Many smaller operators have already fallen victim to bankruptcy but now even those with a strong balance sheet are recognizing that continued drilling and production no longer make financial sense. As a result all expectations are that U.S. shale production will tumble this year (although despite the suggestion in today's title it is not quite "all over" yet). The situation on the ground in North Dakota that we have reviewed today indicates that the slowdown is gaining momentum. The extent of any decline in production is still hard to forecast accurately – clouded as it is by the unknown impact of an increase in DUCs. As 2016 progresses you can be sure that we'll be keeping a close track on the trends for you. ..."
For the past, year many shale oil producers have defied the expectations of many and kept output
at or near to record levels in the face of falling oil prices and much tougher economics. Improvements
in productivity, cost cutting and a concentration on "sweet spot" wells that generate high initial
production (IP) rates have all helped cash strapped producers survive. But with oil prices so far
in 2016 stuck in the $35/Bbl and lower range and with the worldwide crude storage glut still weighing
on the market – producers are finally pulling back. Today we look at how increased pressure on North
Dakota producers is putting the brakes on Bakken crude production.
In December 2015, crude production in North Dakota Bakken fell by 2.5% to 1,152 Mb/d (from 1,182
Mb/d in November). That December output is down 6% from the record 1,227 Mb/d produced a year earlier
in December 2014. Lynn Helms – Director of the North Dakota Industrial Commission (NDIC) Department
of Mineral Resources commented in a February 2016 press conference that the December 2015 drop in
production was the first significant decline in North Dakota crude output not explained by other
factors such as weather. A number of signs point to the decline in production continuing during
the rest of 2016 unless there is an extended oil price recovery. For a start, the number of new permits
to drill wells in North Dakota is at a seven year low – indicating a low appetite for drilling (more
on that in a minute). Second, there were 1183 inactive wells in the state in December - about 30%
above normal for this time of year. The operators have essentially abandoned these inactive wells
– usually because they are losing money. Many of these inactive wells are older and had very low
production rates - less than 35 b/d. Such older wells are known as "stripper" wells and their costs
are long ago written off – so operators usually keep them running unless transport and maintenance
costs exceed the value of the crude – i.e. prices get too low. A third indicator of declining
producer interest in the Bakken is the large number of producing wells in North Dakota currently
being transferred (sold) by one operator to another – 697 wells as of February 17, 2016 according
to Helms. Some large producers such as Occidental Petroleum that is selling 346 wells - are leaving
the North Dakota Bakken oil patch altogether. Others that are staying in the Bakken have sold off
wells to other operators to raise cash – including Whiting Petroleum Corp (the largest Bakken producer
– selling 331 wells) and EOG Resources, grandfather of the crude-by-rail phenomenon.
The strongest indicators of a slowdown in Bakken production come in the reduction in drilling
rigs operating in North Dakota and a parallel decline in the number of well completions. We'll look
at the rig count first then get to completions. As of March 8, 2016 the rig count in North Dakota
stood at 33 – down 85% from the all time high (218) in May 2012. The green shaded area in Figure
#1 shows the North Dakota rig count since January 2013 (right axis). The number of rigs operating
hovered between 180 and 195 from January 2013 to December 2014 before dropping off a cliff from January
2015 onwards. By the end of 2015 the average rig count was down to 64 and the number fell to an average
of 52 in January 2016. The NDIC has not released the February average rig count yet – but their daily
count was down to 35 at the end of February. Just 16 producers operated those 35 rigs with only eight
companies operating more than one rig – headed by ExxonMobil affiliate XTO who still had 5 rigs and
followed by Continental Resources, Hess and Conoco Phillips running 4 each. In the past week XTO
and Hess have each dropped one more rig.
Figure #1 Source NDIC, RBN Energy (Click to Enlarge)
Turning now to completions – by which we mean when the first oil is produced through wellhead
equipment into tanks from a new well. As we have described previously – completion occurs in shale
wells after the well is drilled and the hydrocarbons are stimulated to flow by hydraulic fracturing
(see
I Cannot Complete With Your Tax Scheme). When oil prices were riding high any delays in completions
were usually practical rather than deliberate – caused by a lack of fracking crews able to complete
new wells. Producers had every incentive to complete wells to get cash flowing to help finance more
new drilling. But in an era of falling oil prices completion timing has become a big deal for
producers because waiting for a hoped for increase in prices before producing oil has become a strategy
for protecting future revenue. In North Dakota that strategy has led to a steady increase in wells
that are drilled but uncompleted (the DUCs) since the start of 2015. We previously discussed how
the North Dakota Legislature provided incentives for producers to hold off completions in the first
half of 2015 while they waited for low prices to trigger a tax break (see
Tax Scheme). Those tax incentives did not pan out due to a jump in oil prices in May 2015. However
the issue of completions in North Dakota stayed on the front burner when producers began to ask for
waivers from State mandated completions one-year after drilling (see
Incomplete).
In October 2015 the NDIC decided to issue waivers to allow producers to delay completions by up to
two years from drilling. The combination of the potential tax incentive early in 2015 and the
extension of the one year limit in October led to a growing backlog of DUC wells in North Dakota
that is now having an impact on production forecasts in 2016. Figure #1 shows NDIC data for
well completions - that have been falling (blue line left axis) and wells waiting on completion
that have been increasing since mid-2014 (red line left axis). As of the end of December 2015 there
were 945 DUC wells in North Dakota – down from an all time high of 1080 in September 2015 but 26%
higher than the 750 DUCs the previous December (2014).
It seems that those producers who can afford to are increasingly opting not to complete Bakken
wells but instead to leave DUC wells "on the shelf" as a kind of storage play – waiting for prices
to improve. A couple of weeks ago (February 27, 2016) the largest Bakken producer - Whiting
Petroleum - stated in an earnings report that they would suspend well completions in the Bakken in
April 2016 until prices rebound. In the meantime they will maintain 2 drilling rigs in North Dakota
– basically increasing their DUC inventory with no new production. Another large Bakken producer
Continental Resources announced plans in their January 2016 guidance to defer completing most Bakken
wells in 2016 - increasing DUC inventory from 135 at year-end 2015 to 195 at year-end 2016. Note
that we are just highlighting DUCs in North Dakota here but this phenomenon is widespread in the
oil shale sector and has also impacted natural gas drilling in the Northeast. The strategy is only
feasible for those production companies that have reasonably robust balance sheets and can afford
to wait before completing wells. Many smaller companies do not have the luxury of waiting and
many of these are likely to be either already casualties of the price crash or living on borrowed
time (see
Zombies). It remains to be seen to what extent large increases in DUCs during 2016 will
accelerate expected declines in output that have been forecast based on ever lower rig counts and
low prices.
The economic realities that are pushing operators to withdraw rigs and avoid completions in once
bustling plays like the Bakken are aptly illustrated by a video
presentation from the Director of the
North Dakota Pipeline Authority (NDPA) Justin Kringstad at the end of December 2015. The presentation
is an update on analysis Justin provided earlier in the year that is designed to show how lower oil
prices impact the number of wells in North Dakota that would produce an internal rate of return (IRR)
between 10 and 20% based on different drilling cost scenarios. The analysis is specific to the Bakken
but otherwise similar to the models RBN uses for production forecasting that were explained in detail
in out January 2015 Drill Down Report "It
Don't Come Easy" available to our Backstage Pass
subscribers. We are in the process of updating this analysis to reflect current drilling economics.
The chart in Figure #2 shows a summary of the NDPA's December analysis with Bakken wellhead crude
priced at $30/Bbl. That equates roughly to a West Texas Intermediate (WTI - the U.S. Domestic benchmark)
price of $35/Bbl less transportation discounts to get crude to market from North Dakota. As
of yesterday (March 8, 2016) WTI prices on the CME/NYMEX futures exchange closed at $36.50/Bbl. The
blue bars on the chart indicate the % IRR that a producer might expect based on a range of 30-day
average initial production (IP) scenarios between 400 B/d and 1500 b/d (numbers along the top of
the chart). For each IP scenario there are 3 alternate well drilling and completion cost cases -
$6 Million, $7 Million and $8 Million (indicated on the bottom axis).
Figure #2; Source: NDPA (Click to Enlarge)
As you can see the blue bars get higher from left to right as the well IP increases – because
the higher the IP rate the faster the oil revenues accrue towards the IRR. The IRR rates are also
higher when the drilling and completion costs are lower. The summary chart shows that at $30/Bbl
- to achieve a consistent IRR above 20% (for even the highest cost wells) - producers need to target
wells with an IP of at least 1500 b/d. Looking at historic drilling and production records, NDPA
found only 63 wells – concentrated in McKenzie, Mountrail and Dunn Counties that had IP rates of
1500 b/d or higher. Those 63 wells represent just 1% of the 6000 Bakken wells that would breakeven
if wellhead prices were between $55 and $70/Bbl. In short the analysis makes clear that only
a fraction of existing wells would breakeven or produce an acceptable IRR at today's low crude prices.
The expectation that oil prices might remain low for a long time is rapidly sinking in for
U.S. shale producers. Many smaller operators have already fallen victim to bankruptcy but now even
those with a strong balance sheet are recognizing that continued drilling and production no longer
make financial sense. As a result all expectations are that U.S. shale production will tumble this
year (although despite the suggestion in today's title it is not quite "all over" yet). The situation
on the ground in North Dakota that we have reviewed today indicates that the slowdown is gaining
momentum. The extent of any decline in production is still hard to forecast accurately – clouded
as it is by the unknown impact of an increase in DUCs. As 2016 progresses you can be sure that we'll
be keeping a close track on the trends for you.
"It's All Over Now" was written by Bobby
and Shirley Womack and first released by The Valentinos in 1964. The Rolling Stones had their first
number-one hit (in the U.K.) with a cover version in July 1964 – also a hit for the band worldwide.
"... I do not agree that $55 (assume WTI) is enough to keep the basins flat or grow production, without significantly more cost reductions. The company 10K, demonstrate that. Not enough future net cash flow. Especially as those calculations are sans interest and g & a. ..."
"... the average Bakken well produces 190K in 60 months. 152K is assumed 80% NRI. ..."
"... These guys just throw out prices, never any substance behind what they say. For once I would like to see an article that walks through the numbers and proves us wrong, but they can't, so they won't. ..."
I do not agree that $55 (assume WTI) is enough to keep the basins flat
or grow production, without significantly more cost reductions. The company
10K, demonstrate that. Not enough future net cash flow. Especially as those
calculations are sans interest and g & a.
Again, the average
Bakken well produces 190K in 60 months. 152K is assumed 80% NRI.
152,000 x $48 per barrel (assumed $7 basis discount) is $7,296,000.00
$7,296,000.00 less 10% severance = $6,566,400.00
Subtract gathering of $1.50, LOE of $8 and G &A of $2.50. We are now
at $4,742,000.00. This isn't enough in 60 months for a well that costs $6.5-8
million.
These guys just throw out prices, never any substance behind what
they say. For once I would like to see an article that walks through the
numbers and proves us wrong, but they can't, so they won't.
Sure, a standout well can work. Our standout wells work at $20. No one
has only standouts, unless they are fairly small.
Actually that's just a wild ass guess. It takes about a month, I am told,
do drill a horizontal well, a lot shorter for a vertical well. But I may
be wrong. Mike or some other oilman may chime in and tell me how wrong I
am. I found this so it looks I was pretty close.
While there have been instances when wells were drilled in as little
as 15 days, a reasonable expectation for the time required to drill a well
in the Eagle Ford is around one month.
How long does it take to drill a well and begin producing natural
gas?
Horizontal drilling currently takes approximately 18-25 days from start
to finish. Then, the well needs to be fracture stimulated in order to release
the gas. It is then connected to a pipeline, which transports the gas to
the market. From drilling to marketplace, the entire process can take up
to 3-4 months. Mike ,
07/27/2014 at 1:08 pm
Mr. Patterson, I enjoyed this post and sent it immediately to my employees
and my family with a beware or be square header; I can't give you a
bigger compliment than that. I hope it gets attention outside the peak
community.
A typical 14,000 ft. TMD well in unconventional shale takes about
3 weeks, spud to TD, you are correct. They can blow them down these
days because there are no intermediate casing strings to set, or logging
or evaluating to do going down, and the top drives they use now, instead
of rotary tables, makes the radius and lateral a piece of cake. To reach
some economy of scale, as we now know, they drill multiple wells on
long pads simply being able to walk the rig from well to well; that
is where the 2 1/2 to 3 weeks per well number comes from, IMO. It takes
a good week to tear down a big rig, load it out (35-50 loads), get it
down the highway, unload it, put it all back together again and ready
to turn to the right. In that case, 4 weeks, plus.
I think we can't use unconventional shale data for well time or costs
in Russia, however. That's all typical conventional reservoirs, many
of which are under pressured, and over pressured, require several casing
strings and everything in Russia happens in very slow motion. Many big
fields in Russia range greatly in depth too.
While I am on, I always get a kick out of the notion that other shale
resources throughout the rest of the world will save the day. The maps
sure look perddy. But no other country in the world will have the ability
to develop its shale resources as efficiently, and cheaply, as N. America
can, IMO.
And by the by, here in the US all we can hope for from shale is internal
rates of return of 70-80% of total CAPEX, over 20 years, so the shale
industry hopes.
Can the rest of the world find the money to get on the shale treadmill,
for only those kinds of returns? No way, Jose. I always like to remind
folks who look forward to abundant shale production from the rest of
the world…of Poland.
"... Offshore oil exploration success has not been good recently. Admittedly there was a hit in the GoM from the BP disaster and now the price collapse, but in the past some of the best quality finds occurred in slow down periods. ..."
"... The decline rates for deep water are very high, not quite in the LTO league but requiring a lot of drilling to keep the production facilities at high capacity ..."
"... For me that would present much higher risk to future price volatility than for what I would think of as "conventional" developments, so requiring bigger resources and/or guaranteed higher prices for FID decisions. ..."
"... George, US is NOT the world. Canadian conventional drilling slowed greatly already a year ago. Deep water drilling plans off the cost of Africa and North Sea are also cancelled. Shell Arctic drilling is cancelled. Are you telling me that all these worldwide projects are equivalent to 3 mediocre Shale plays in US? ..."
"... Well said -- Simultaneous production of junk bonds and shale oil was probably the most recent of Wall Street "innovations". Which under close look are always reincarnations of some old financial scam. In this case, in price range 0-70 per bbl it is just a Ponzi scheme or, at best, a speculative investment which fully relies on "evergreen" loans. ..."
As long as shale corps. will find any kind of financing, then they will keep drilling. The only
reason that they have decreased drilling by so much recently is because their access to loans
has been slashed. Their last line of defense is that they have managed to issue shares on Wall
Street.
But at the end of the day there is way more conventional, deep water around the world that will
not be drilled at these prices so on the global scale shale is just too small to make up a difference
and eventually they will run out of sweet spots anyway. Shale is like one hit wonder like "99
Luftbaloons" from Nena in the 80's :-)
The long-term for US shale oil production is definitely down, also of US oil production in general.
For that there can be no doubt. But there will be ups and downs along the way.
"conventional, deep water" is a bit close to an oxymoron for me. And is there really "way more"
of it or has that just been wishful thinking as we've run out of other plays?
Offshore oil exploration success has not been good recently. Admittedly there was a hit
in the GoM from the BP disaster and now the price collapse, but in the past some of the best quality
finds occurred in slow down periods.
The discoveries I've seen recently have mostly been small gas fields. But Marathon and
COP look to have lost interest. The decline rates for deep water are very high, not quite
in the LTO league but requiring a lot of drilling to keep the production facilities at high capacity
.
For me that would present much higher risk to future price volatility than for what I would
think of as "conventional" developments, so requiring bigger resources and/or guaranteed higher
prices for FID decisions.
George, US is NOT the world. Canadian conventional drilling slowed greatly already a year
ago. Deep water drilling plans off the cost of Africa and North Sea are also cancelled. Shell
Arctic drilling is cancelled. Are you telling me that all these worldwide projects are equivalent
to 3 mediocre Shale plays in US?
Volatility? Shale is synonym for volatility. So the rest of the higher cost world oil industry
said "Let the Shale pump what it has to pump and then we will get back to oil business again"
George, I can assure you that the rest of the world, including US conventional, pumps oil not
for the sake of practice but for the sake of profit.
So they will let Wall Street run their shale pet project to the ground and go back to business
later.
let Wall Street run their shale pet project to the ground and go back to business later.
Well said -- Simultaneous production of junk bonds and shale oil was probably the most recent
of Wall Street "innovations". Which under close look are always reincarnations of some old financial
scam. In this case, in price range 0-70 per bbl it is just a Ponzi scheme or, at best, a
speculative investment which fully relies on "evergreen" loans.
In a Ponzi scheme the operator pays returns to its investors from new capital,
rather than from profit earned by the operator in the expectation of oil price rise. This is
were "unlimited" Wall Street financing of shale bubble played the crucial role. It allowed
carpet bombing of shale plays with wells and eventually led to the current oil price crash.
And new profits to Wall Street. A new redistribution of wealth up.
As John Kenneth Galbraith said: "Financial operations do not lend themselves to innovation. What is recurrently so described and
celebrated is, without exception, a small variation on an established design . . . The world of
finance hails the invention of the wheel over and over again, often in a slightly more unstable
version."
It will be very interesting to see the situation in oil market three years from now.
Hedging only gets the job done if you can hedge at a price higher than
breakeven. If the spot price is $50/b. You would need to be able to hedge
at $75/b or more for the average well to break even, in practice this is
not likely to happen.
Currently the futures price in Dec 2018 is $10/b above the April 2016
futures price.
So possibly if oil prices reach $65/b hedging might be an option, below
this maybe not. (I have ignored transaction costs in this example.)
"... And the number of DUCs reached their peak while prices were still high. There are DUCs because there is always a delay between when the drillers finish their work and when the frackers start their work. And the number of DUCs grew, during high prices, because there were more wells being drilled than wells fracked. ..."
"... higher prices will only bring on more completions if there is money to pay for them, which is not a given. ..."
"... You don't have to be an economist or a CPA to figure out how difficult it will be for oil companies to again be growing at this point. ..."
There are always DUCs. There have always been DUCs, even when the price
was well above $100 a barrel. In fact the inventory of DUCs grew every year
that the price of oil was in the $100 range. And the number of DUCs
reached their peak while prices were still high. There are DUCs because
there is always a delay between when the drillers finish their work and
when the frackers start their work. And the number of DUCs grew, during
high prices, because there were more wells being drilled than wells fracked.
Higher prices will bring on more completions, bringing on more production,
knocking prices back down again, keeping prices lower for longer. Right
or wrong, that is simple logic. It is not nonsense.
That interrupts the logic, and is not to be considered. It is not important
that upstream companies are out of bucks, and nobody will lend them any.
Drilling will continue to be done with cash available until which time,
the coffers start filling. May take some time to put into completing those
wells that are only profitable at 80. Be quacking for quite a while. However,
that interrupts the logic of lower for longer, so it is not to be considered.
You don't have to be an economist or a CPA to figure out how difficult
it will be for oil companies to again be growing at this point. It
is mostly going to be funded by internal cash flow. Let's assume that EIA'S
estimate of the average Eagle Ford's EUR to be 168,000 bbls, and somewhat
meaningful. So, maybe the average first year's production to be 75,000 bbls.
At 100 a barrel, they recover the cost of the capex, plus a little more.
They can drill another well with positive cash flow. Probably describes
the average DUC. At 80 a barrel, they are in negative cash flow. Probably,
a profitable well, but negative cash flow. They did not make back enough
money to drill a new well the first year. Later, next year, but not by the
end of the year. So amount available for capex goes down. At 40, they may,
or may not recover the cost of the well. If the DUC is an average Eagle
Ford EUR, then it could sit for quite a while if lower for longer is the
logic.
That is the main reason you won't see large scale ramp ups on production
until it stays over 70 for a while. A large percentage of the area is average,
or less than average.
"... Another reason why production hasn't fallen as rapidly as some expected was that newer wells produce a bit more in the first couple of months, followed by a steeper decline. This can be seen from the production profiles from the different shale areas. This is more like a one-time gain however. ..."
"... Completion is about 2/3 of the total well cost. ..."
"... If production for a group of wells (not my model wells) completed in 2010 declines by 80% from 2010 to 2015, while the percentage of plugged/inactive wells (completed in 2010) increases from 0% in 2010 to 50% in 2015, are you seriously asserting that there is not a survivor bias issue? Or for that matter, if the percentage of plugged/inactive wells increases from 0% in 2010 to 1% in 2015. ..."
"... The average 2008 to 2012 well will be shut in at about year 15 if they are profitable to produce at up to 7 b/d of output. This will depend on oil prices in 2023, which are hard to predict. ..."
"... "the percentage of plugged/inactive wells (completed in 2010) increases from 0% in 2010 to 50% in 2015" This is a hypothetical assumption. The real number of plugged wells is low and therefore it can be ignored ..."
"... The 50% abandonment number in five years was based on a real life case history in the Barnett Shale Play, the 2007 vintage wells on the DFW Airport Lease that Chesapeake asserted would produce "for at least 50 years." ..."
"... So I don't see any survivorship bias. As long as we include all the wells in the data (including those abandoned) survivorship bias is eliminated. ..."
Couple of comments:
– I think the rig count is an important metric to follow. However, some
adjustment is needed to correct for the fact that rigs are more efficient
now in drilling wells. Probably several reasons for this (better rigs, crews,
methods, pad drilling, drilling in a closer area, etc). E.g., in ND in 2012
every rig on average drilled 0.8 well per month. In 2014 this was 1.1, and
in the last few months it was 1.4. I agree with you that the rig count eventually
has to impact production (it will be with some delay, and corrected with
the above factor).
– Shallow showed a comment from the Hess CEO that another reason to keep
drilling was to keep at least some experienced production staff in the company.
– Another reason why production hasn't fallen as rapidly as some
expected was that newer wells produce a bit more in the first couple of
months, followed by a steeper decline. This can be seen from the production
profiles from the different shale areas. This is more like a one-time gain
however.
– Some companies apparently do intend to drill more wells than complete
them in 2016. Continental Resources plans to drill 73 wells, and complete
26 (net) wells in 2016. Note that in 2015 they actually reduced the number
of wells waiting for completion by 35. Completion is about 2/3 of the
total well cost.
Imagine the production profile if they could complete every single well
in the fracklog on the same day, vs if they complete one a day for the next
11 years.
These are obviously absurd examples, but just to make the point that
really what we would like in order to accurately predict production is a
'frac crew count' rather than a rig count, and to agree with what you say
above.
Following is a link to, an excerpt from, a question I posed on a prior
thread. It's my understanding that you are attempting to correct for survivor
bias, in regard to decline rates, by dividing annual production by the original
number of producing wells. I constructed a simple model which seems to show
that this makes no difference. It seems to me that one is calculating rates
of change in total production in both cases (total production or total production
divided by original number of wells).
As my example model shows, one can produce a year over year rate
of change chart that looks a lot like the Bakken year over year rates
of change, but by the time that the decline has settled down to 10%
per year, 90% of the wells completed in year one of the model (2010)
are no longer producing.
I don't know what the percentage of inactive wells is for the Bakken
Play by year, for example, the percentage of Bakken wells completed
in 2007 that are no longer producing, and I don't know whether the percentages
are material, but there are numerous examples of very high abandonment
rates in other shale plays.
For example, Chesapeake claimed that their 2007 vintage wells on
the DFW Airport Lease, in the Barnett Shale Play, would produce "For
at least 50 years." Five years later, about half of the 2007 wells had
already been plugged and abandoned.
I don't use the well count. For each vintage group, for each exact year
on production, I sum the latest 12 months production, and compare it with
the total (again over all relevant wells) 12 months production of the prior
year on production.
For example, to calculate the decline rate of the 2008 vintage group,
in year 4, I calculate the total production these wells had in their 4th
year of production, and compared it to the total production from the same
wells in year 3 on production.
I have excluded wells that appear to have been refracked from the whole
set, to try to establish the natural rate of decline.
As I noted in my comment, I agree that this works for volumes, but not for
rates of decline, i.e., there is no difference between rates of change for
total production by vintage year versus total production by vintage year,
divided by the original number of wells.
Following is an excerpt from my comment linked above:
Following is a model with more relevant (hyperbolic) simple percentage
decline rates. I assume a fully developed lease with 10 producing wells,
all completed in 2010. There is one very good well, with 9 relatively
poor wells. Production drops by 40%, then 30%, then 20% and then settles
down to a 10%/year decline rate. The lease loses three wells per year,
until it is down to the one good producing well. Here is the model:
From 2014 on, production declines at 10%/year, from one well.
The exponential year over year rate of decline in total production from
2012 to 2013 was 22%/year (natural log of 336/420).
If we divide the 2012 and 2013 production by 10, i.e., the original number
of wells completed in 2010, the exponential year over year rate of decline
in production was also 22%/year (natural log of 33.6/42.0)–as the number
of producing wells on the lease fell by 75%.
So, again, unless I am missing something, it seems to me that the rates
of decline chart you showed reflects the rates of decline in total production
by year, without any weight given to survivor bias.
Are you disputing this?
The only way I see to address the survivor bias issue is to show the
number or percentage of plugged/inactive wells by year, on the same chart
as the year over year rates of decline chart. On the example I showed, the
plugged/inactive percentage would be 0% in 2010, rising to 90% in 2013.
I understand your example, but I don't see an issue regarding survivor
bias. The 22% is the decline number I am interested in, as it reflects the
total decline that can be expected for that group, for that year.
In any case, it's a non-issue for now, as not many wells are dropping
out yet (about 1% of wells a year). Let's leave it at this.
I understand your example, but I don't see an issue regarding
survivor bias. The 22% is the decline number I am interested in,
as it reflects the total decline that can be expected for that group,
for that year.
I agree that the 22% decline number reflects the decline from the wells
still producing, and the percentage of plugged/inactive wells may or may
not be material in regard to survivor bias. But that is not the issue. It
doesn't matter whether 1% of the original producing wells or 50% of the
original producing wells are plugged/abandoned at a given point in time.
This is a math question.
If production for a group of wells (not my model wells) completed
in 2010 declines by 80% from 2010 to 2015, while the percentage of plugged/inactive
wells (completed in 2010) increases from 0% in 2010 to 50% in 2015, are
you seriously asserting that there is not a survivor bias issue? Or
for that matter, if the percentage of plugged/inactive wells increases from
0% in 2010 to 1% in 2015.
In any case, why not include a chart showing the percentage, by year,
for the plugged/inactive wells along with the chart showing decline rates
by year? For example, 100% of the wells completed as oil wells in 2010 had
some level of production, and what percentage of those 2010 wells were plugged/inactive
by year, as time goes on?
Probably the best way to show a survivor bias chart is to show the number
of wells showing some level of production as time goes on, expressed as
a percentage of total number of wells with reported production in the reference
year. That way, the slope of the curve would be in the same direction as
the slopes of the decline rates. For my example, the survivor percentage
by year for my 10 well model would be:
2010: 100%
2011: 70%
2012: 40%
2013: 10%*
*2013 and subsequent years until last producing well is plugged.
Of course, when the survivor percentage hits 0%, production = zero.
An interesting question would be projected half-life, to-wit, how many
years would it take for the survivors among a group of wells completed in
a given year, e.g., 2010, to be reduced to 50% of the original number?
As noted above, the observed half-life for the 2007 vintage wells completed
on the DFW Airport Lease in the Barnett Shale Play–the wells that Chesapeake
asserted would produce "for at least 50 years–was about five years.
As Enno points out for the Bakken/Three Forks after 8 years about 1%
of 2007 wells that were not refracked have been permanently abandoned.
The average 2008 to 2012 well will be shut in at about year 15 if they
are profitable to produce at up to 7 b/d of output. This will depend on
oil prices in 2023, which are hard to predict.
Are you now arguing that the survivor bias is not material, whereas you
previously, and repeatedly, asserted that there was no survivor bias in
regard to rates of change calculations? Following is a link to the original
question, followed by three of your comments:
I have given you that data in the past. The well profiles do not
have survivorship bias as long as a zero is entered for output for abandoned
wells.
That is what Enno does.
I can send you Enno's spreadsheet or Ron can, just email and ask.
Dennis Coyne ,
02/24/2016 AT 7:11 AM
Hi Jeffrey,
To me (and possibly Enno), using the original 10 wells in the denominator*
is adequate to calculate the average well profile. Note that in the
first five years the wells abandoned are very low (probably less than
1% per year). As I said before, request Enno Peter's data from Ron and
make any chart you would like. Oh and it would be nice if you stop claiming
survivorship bias when both Enno and I have repeated this several times,
but you continue to bring it up.
Dennis Coyne ,
02/24/2016 AT 1:36 PM
As I said before get the spreadsheet and do what you like.
There is no survivorship bias in the average well profiles published
by Enno Peters.
Following is my original question, followed by Enno's response. My point
was and is that Enno's approach is a pointless exercise in regard to rates
of change, since he is, in both cases (with or without attempted survivor
bias adjustments) simply calculating rates of change in total production.
Jeffrey J. Brown ,
02/23/2016 AT 11:47 AM
Is there a provision for "Survivor bias?"
In other words, how many wells that were put on line in 2007, 2008,
etc. are plugged & abandoned or temporarily abandoned?
REPLY
Enno ,
02/23/2016 AT 11:57 AM
Jeffrey,
Yes, in my ND data I always add 0 production months after the last
reported month by the NDIC. So no survivor bias in the info I present.
And here is the question that Enno has still refused to address:
If production for a group of wells (not my model wells) completed
in 2010 declines by 80% from 2010 to 2015, while the percentage of plugged/inactive
wells (completed in 2010) increases from 0% in 2010 to 50% in 2015,
are you seriously asserting that there is not a survivor bias issue?
Or for that matter, if the percentage of plugged/inactive wells increases
from 0% in 2010 to 1% in 2015.
"the percentage of plugged/inactive wells (completed in 2010) increases
from 0% in 2010 to 50% in 2015" This is a hypothetical assumption. The real
number of plugged wells is low and therefore it can be ignored
The 50% abandonment number in five years was based on a real life case
history in the Barnett Shale Play, the 2007 vintage wells on the DFW Airport
Lease that Chesapeake asserted would produce "for at least 50 years."
As I said, it doesn't matter whether one assumes a 50% or a 1%
abandonment percentage in five years, this is a math question.
Are you guys incapable of answering a math question?
Enno and Dennis have repeatedly asserted that that there is NO survivor
bias.
In any case, at least for people who do not reject fundamental mathematical
principles, it's when, not if, that survivor bias becomes a factor in regard
to year over year rates of change calculations.
Lets say output was 500 kb/d in 2010 from 500 wells and in 2015 these
same 500 wells were producing 100 kb/d, but only 250 of the wells were producing.
If I use 250 wells in the denominator for both 2010 and 2015 to find the
output of the "average" well then in 2010 the average well produced 1000
b/d and in 2015 the average well produced 200 b/d.
There would be survivorship bias if I claimed the "average" well produced
200 b/d in 2015 and that is not what I do.
So I don't see any survivorship bias. As long as we include all the
wells in the data (including those abandoned) survivorship bias is eliminated.
Perhaps Enno and I understand this term differently from you.
Enno and I consider output from the entire play or in my case I will
often construct a hypothetical "average well" where the average well profile
is equal to total output divided by the total wells completed.
You are correct that this is a question of arithmetic.
Let's say 50% of the wells were abandoned and initially there were 100
wells completed. If we take total output and divide by 100 to find the average
well profile, then for this hypothetical average well there is no survivorship
bias.
There would be survivorship bias if I divided output by the number of
producing wells to find the average well profile, but that is not
what is done, I use 100 in the denominator even if there are only 50 wells
producing (in the example above.)
I agree that the 22% decline number reflects the decline from the
wells still producing, and the percentage of plugged/inactive wells may
or may not be material in regard to survivor bias.
The 22% decline rate reflects the decline rate of all wells completed
not only the wells still producing.
Let's say 1000 wells were completed and output was
100 kb/d (example chosen for simple arithmetic rather than realism) in the
first year, let's also assume that 1 year later output fell to 80 kb/d from
the initial 1000 wells, but that 100 wells were plugged and abandoned.
No survivorship bias
year 1 output is 100 b/d for average well
year 2 output is 80 b/d for average well
a decline of 20% for first year
Survivorship bias
year 1 100 b/d for avg well
year 2 89 b/d for avg well (80,000b/900 producing wells)
a decline of 11% for first year
I don't use the number of producing wells, I use the total wells completed
in the denominator no matter how many wells are producing, that eliminates
any survivorship bias.
The answer to your question in bold is yes that is exactly what
I am asserting.
As long as one uses 10 wells in the denominator for all years to construct
an "average" well profile there is no survivorship bias, if one used the
number of producing wells in the denominator there would be survivorship
bias.
I use your model above to find a NSB (no survivorship bias) average well
profile and an SB (survivorship bias) average well profile. Chart below.
As noted up the thread, I showed that dividing annual production by the
original number of producing wells (10 wells in the model I showed) to correct
for survivor bias has no effect on rates of change calculations. In both
cases, one is simply calculating the year over year rates of change in total
production from surviving wells , and as noted, it's when, not if
that it becomes a material factor.
Dennis had the following response in one of his previous comments:
To me (and possibly Enno), using the original 10 wells in the denominator
is adequate to calculate the average well profile.
How does one respond to people who reject fundamental mathematical principles?
More importantly perhaps, why should one waste one's time responding to
people who reject fundamental mathematical principles?
I think it's time for another grizzled oil patch veteran to bid you guys
adieu. Good luck with your continuing efforts to, in effect, to assert that
1 + 1 = 3, because it feels like a better answer.
Jean Laherrere had a post on POB that indicated a 20 to 30 month lag between
rig count and production, during the expansion phase. Empirically the curves
seemed to match but I don't get why the delay is that high or the correlation
so close. However if true it would suggest production is going to fall off
of a cliff over the next 2 to 6 months.
"Another reason why production hasn't fallen as rapidly as some expected"
Rats can chew thru a PV Source circuit and you have barbecue but Future
Energy Production is not Jeopardized. With an unconventional well It's my
understanding that the Resource may be affected if shut in or altered. Perhaps
in the environment, E&P's "can not afford" to take this risk (??)
Baker Bughes in 2012-2014 issued well count for key U.S. oil and gas
basins.
Using the well count and rig count, they have calculated the number of wells
drilled per 1 rig per 1 quarter and year.
Unfortunately, this product was discontinued in 2015.
I was wondering about my claim (which may be incorrect), that during
a bust the less qualified or hard working people get laid off and a company
is left with their best workers.
If that is correct it would seem that the elite crew that remains would
make fewer mistakes and get more accomplished on average on any given day.
This would tend to increase rig efficiency (number of wells drilled per
month per rig) if we assume everything else is unchanged (which is never
correct in the real world.)
Dennis, company men (middle management, on site supervisors) get comfortable
with certain rigs and the personal on those rigs. If Dennis is given 14
wells to drill in 2015 he will stick with H&P 395, if he can, because he
is on a first name basis with the toolpusher and everyone else and they
all work in 3 part harmony; hands will stay with a rig and the rig boss
(toolpusher). There might be some inner rig contractor personal movement
based on time with the company, etc., I don't know anymore. If Nabors 419
gets stacked, most of the hands on that rig will go to the house. When I
roughnecked, and was a driller, when my rig got stacked I went mostly to
the wine shop and waited it out. Certain companies generally ask for certain
rigs if they can.
Again, I don't think rig efficiency can improve much; I think I have
already said as much. Those shale rigs get it and go. Its like tire manufacturing,
almost. There is always a problem that comes up. Think of all the wells
they have drilled in the past 7 years; everyone on a rig, and steering,
and running casing, and cementing and frac'ing know what the drill is now.
Fourteen wells per rig per year is what I guess, maybe 15 depending on pad
stuff. Costs will not go down based on efficiency as much as competition
between rig and pumping services vying for limited work.
I read that CLR will return to activity if prices reach $45. At least that is the headline.
Assuming 200K gross barrels of oil from a CLR Bakken well in 60 months, 160K net with 20% royalty,
with a $7 discount to WTI, per CLR recent 10K, such a well will only gross $6 million dollars
in 60 months.
So after 60 months CLR will still be over $1 million short of reaching the cost of the well,
BEFORE, considering 10% severance tax, OPEX, G & A and interest. Also, none of the land acquisition,
permitting , seismic, etc is considered.
Why do the MSM ignore this. It seems so elementary to me.
Bakken LTO needs $80 WTI, minimum, to be a good investment. Just do my 5th grade math. Don't
need any exotic presentations to figure this out.
SS,
Don't pay attention to headline. They are just part of deception game. Shale production is adjusting,
US on shore is adjusting. Today I have briefly scanned that Russian paper is stating that Russian
big oil have a meeting today where among the topics are "freeze" (previously discussed with Saudis,
Qataris) and even some possible cuts. Pieces are coming together although it looks like at snail
pace from the perspective of someone like you that is caught in this bullshit politics. But it
is coming.
Bakken LTO needs $80 WTI, minimum, to be a good investment. Just do my 5th grade math. Don't
need any exotic presentations to figure this out.
Exactly!
Bakken oil production is more like mining coal than it is drilling for oil ("Red Queen effect").
All company operating in this areas have crushing debt levels. Obtaining revolving credit line
when prices are below $80 might become very difficult as Bakken has the highest marginal cost
of production. So this slump will last longer for Bakken then for other plays.
Also "carpet bombing" drilling is new and might have some additional effects that we now can't
predict. I would give three years on restoring investor confidence.
Click to Edit
Request Deletion (56 minutes and 59 seconds)
Thanks Shallow for digging thru these filings and Uncovering what should be clear --
Fernando posted this yearly cash flow matrix ROI for the Powerwall which shows that Energy stored
via Electro-Chem can not compete yet with the Delta of baseline vs peak power rates. When I point
this out to people this they think I'm clueless. Anyway – Need something like this for wells in
different plays or companies to point out the Insanity. Perhaps I missed it or i'm actually clueless.
Three Big Shale Plays Decline Rate Going To a More Than One Million Barrels A Day!
Using Ron Patterson's updated rig counts per play, I used that data along with production data
from the EIA Productivity Report to calculate the expected overall decline rate per play.
All data is per month.
The Bakken has 36 rig running, and has a "New Well Production Per a rig" of 725 barrels per
day, and a decline rate ("Legacy Production Change) of 58,000 b/d.
New production (rig times rate) is 26,000 b/d so the net decline rate (new – decline rate)
is 32,000 b/d
Doing the same calculation for the Eagle Ford
Rig = 41
Production per rig = 800
Baseline Decline rate = 110,000
Net decline rate = 77,000'b/d per month
Permian
Rigs = 162
Production per rig = 425
Baseline decline rate = 83,000 b/d
Net decline rate = 14,000 b/d per month
Adding the net decline rate for the three plays we have an overall decline rate of 123,000'barrels
a day per month.
That comes out to a yearly rate of 1.47 million barrels a day.
We are not at that rate today as it takes time for dropping a rig to effect production rates.
I would expect to see thus overall rate by some time this summer. It is much larger than anyone
is expecting.
In a previous article "
The Real Natural Gas Production Decline ", I discussed a simple and effective way of estimating
the real declines and realistic EURs (Estimated Ultimate Recovery) of shale wells based on two things
that shale gas and oil producers can not lie about: number of wells added during a period of time,
and the total daily productions.
The Simple and Effective Method of Estimating EUR
The idea is simple. All shale wells are in steep decline. Thus as the producers put new wells
into production, a considerable portion of the new production merely compensates the decline of existing
wells. If we assume producers add just enough wells to exactly compensate for the decline, then the
EUR times number of wells added equals the amount of production during the same period.
Let me explain in formulas. Let the combined daily decline of existing wells be D, and IP being
the Initial Production rate per well:
Total_Production * D = IP * Well_Additions
EUR = Total_Production/Well_Additions = IP/D
In surveying several different shale plays, I found that all of them have a combined decline rate
of 0.2% per day. Combined decline rate means the decline of the total production from existing wells.
For example if the total production is 500 MMCF one day and 499 MMCF the next day, the 499-500)/500
= -0.2%/day.
Thus, a rough estimate of EUR equals to IP/D = IP/0.2% = 500 IP, or roughly 500 days worth of
production at the IP rate.
Estimating the Bakken Shale Well Productions
The North Dakota Mineral Resource Commission has a
web site
that publishes the shale well counts and monthly productions of Bakken.
I decide to crunch some numbers to see the real productivity of the Bakken oil wells, using the
idea discussed above. Let's start from the oil productions of the latest two months:
Aug-2012: 635,177 Barrels/Day
Sep-2012: 662,428 Barrels/Day
Wells added: 170
Let's do the calculation using the above numbers. The production rate increased by 27251 Barrel/Day
in 30 days. So the daily increase was 908.4 Barrel/Day. Daily well addition is 170/30 = 5.67 wells/day.
Let's assume the combined decline rate of D=-0.2% also applied in Bakken. The median production rate
during the 30 days from mid Aug. to mid Sep. was 648,660 Barrels/Day. So the natural decline would
have been 0.2% * 648,660 BPD = 1297.320 BPD. So 5.67 new wells per day not only compensates for loss
of 1297.320 BPD, but also boost the production by 908.4 BPD. Thus:
So that's the IP per well that I estimates, 389 Barrels/Day. The EUR then would be EUR = IP/D
= IP/0.2% = 500*IP = 0.1945M barrels.
Consider that there are so far 4629 wells in d the accumulative oil production is 458.860M barrels,
averaging 0.099M per well. My EUR estimate is roughly twice the accumulative oil production per well.
So I think my estimate is pretty good.
A good thing of my method is it is pretty fair. Let's say I over-estimated the D. Let's say the
combined decline rate is less than I thought, repeating the same calculation, it results in a less
IP as well. Since EUR = IP/D, a less value divided by a less value, gives you a result that is about
the same.
Let's try a D = -0.15% instead of -0.2% and see what I get:
Thus, knowing the previous month's production rate, we can calculate what the next month's production
rate should be, by subtracting the decline, then add number of new wells times IP.
Let me assume D = -0.2%/Day. I assume IP = 365 Barrels/Day. I further assume that in 2005, 2006,
2007, 2008, 2009, the IP was only 30%, 50%, 70%, 80%, 90% of the current IP level, as the technology
was less sophisticated than today, and well productivity was less than what we get today. Let's see
how my calculation looks like compare with actual production:
click to enlarge)
It looks like a perfect match. Thus my assumed values, D=-0.2% and IP = 365 Barrels/Day, a good
numbers that give perfect fit. Had I used an IP higher or lower, my projection would not match the
data.
So based on that, the average Bakken shale well EUR is
My EUR estimate is far below what producers have been pitching.
Case Study on Continental Resources Shale Wells
Let's have a look at Continental Resources (NYSE:
CLR ), who is considered the most
successful developer of the Bakken shale oil resources.
I pulled out CLR's most recent
quarterly report . Here are a few relevant numbers:
Oil and gas revenue received in the quarter was $617.93M
Oil and gas production was 0.103M BOE/day in the quarter.
Oil and gas production was 0.095M BOE/day in last quarter.
In 3 quarters, CLR participated completion of 541 wells, net 222 that belongs to CLR. So that's
74 per quarter.
Capital spending for 3 quarters totaled $2584.434M
First the capital spending of %2584.434M divided by 222 net wells completed is $11.64M
per well. This is the per well capital cost, not including the production cost yet.
What is the per well IP, and the combined decline rate D? Note that production rate increased
from 0.095M to 0.103M barrels in 92 days. That's a daily increase of 86.96 Barrels/Day. If D=0.2%,
the daily decline would be roughly 0.2%*0.1M/Day = 200 Barrels/Day. So the daily production increase
due to new wells is 200+86.96 = 287 BPD. Daily well addition is 74 wells / 92 days = 0.804 wells/Day.
Thus:
IP = 287 BPD / 0.804 = 357 Barrels/Day
EUR = IP / D = 357 BPD / 0.2% = 0.1785M Barrels
These numbers look lower than the average of the whole Bakken, or IP = 365 BPD and EUR = 0.1825M
Barrels.
What is CLR's profitability outlook under these numbers? From CLR's Q3 revenue and production
volume, I calculated that the unit price they fetched on the oil and gas was about $65/BOE
.
So a CLR well's expected EUR=0.1785M BOE would fetch a revenue of $65*0.1785M = $11.60M per well.
But as discussed above, the per well capital spending was $11.65M. So CLR barely breaks even for
the well capital spending. But the capital spending is not the only cost. We have not calculated
the production and maintenance costs, the G&A costs. Thus, at the current oil price, CLR is not making
any real profit in developing Bakken shale wells.
Discussions and Investment Implications?
So then, how could CLR manage to report positive profits for the quarters? Let me explain how
it works out for them.
Just like other shale oil and gas producers, CLR does not record well drilling capital spending
as cost directly. Instead, they first record it as investment activity. The the capital cost is recognized
in each quarter as depletion and armortization costs.
I discovered that as producers tend to over-estimate the EURs and over-estimate the life span
of shale wells, they end up armortizing the cost way below the fair amount of armortization they
should calculated. Thus, as they under-estimate the costs, they end up over-estimate the profitability
of the operations.
But one thing they could not hide is that in quarters after quarters, the producers have consistently
spend several times higher on capital spending, than the revenue they take in. Producers continue
to borrow more and more on debts in order to continue their well drilling programs.
Is a business profitable, if it continues to borrow more debts quarter after quarter, and it continue
to spend several times more on capital spending, than the revenue it takes in? This is neither profitable,
nor sustainable. I can see that when the banks get suspicious and stop lending money, then the shale
industry will collapse.
As I stated many times. The shale gas and oil adventure is deeply un-profitable. The "cheap natural
gas replacing coal" is a pipe dream. Investors should bet their money on the rebound of the coal
sector, not on the false promise of shale gas or shale oil.
Full disclosure: I have no vested interest in CLR but I may consider a short position in the near
future. I have heavy long positions in coal stocks like James River Coal (JRCC), Alpha Natural Resources
(ANR), Arch Coal (NYSE: ACI ) and
Peabody Energy (NYSE: BTU ).
Gaucho , contributor
,
premium contributor
Comments (879) | + Follow Following - Unfollow | Send Message But not to worry. With the US government support they are now planning on selling all of our
gas overseas. That way we will be out of fuel much sooner than other wise. It will also drive
the prices up here so we can be less competitive. Great planning once again by the US government.
Or should I say by the corporations that control the US government. 10 Dec 2012, 08:48 AM
Reply Like 1
Carl Martin
, contributor ,
premium contributor Comments (1530)
| + Follow Following - Unfollow | Send Message Mark,
Why are you simply making this assumption?
"Let's assume the combined decline rate of D=-0.2% also applied in Bakken."
Because, if your assumption is wrong, then the direction of your whole article/blog is wrong.
I believe that decline rates for shale gas are far steeper then for shale oil.
But, do you happen to have any proof to offer to back up your assumption?
Meanwhile, I will put some effort into finding some proof for my belief. But, I have noticed over
at TOD, that most PO believers also assume that shale oil behaves exactly like shale gas. That's
where I think you are going all wrong, but we'll see... 11 Dec 2012, 03:24 PM
Reply Like 0
Mark Anthony
, contributor ,
premium contributor Comments (3595)
| + Follow Following - Unfollow | Send Message Author's reply
" Carl Martin:
The D=-0.2%/Day combined decline rate is a very reasonable assumption. The proof is right in my
article and in the chart. My projection based on that value matches the actual production. Had
I used a less steep (smaller) decline rate, the calculation will be much higher than the actual
data. Likewise, had I used a higher IP value, the calculation will also come out to be higher
than actual.
You simply have to use IP = 365 BPD, and not any higher, and D = 0.2%/Day, and not any lower,
to project the correct total Bakken production rate as reported.
Now I do have actual proof that Bakken shale wells actuall DO decline that fast. Look at this
on page 63:
http://bit.ly/VAYoHb
The CLR chart shows the cumulative production of Charlotte 2-22H well. They claim the IP was 1396
BPD and at the end of 9.8 months (295 days), it dropped to 167 BPD and accumulative production
was 87 MBOE. Going from 1396 to 167 is a loss of 88%, and in only 295 days. That is an average
decline of -0.72% per day. Much higher than the -0.2%/Day I used. Of course I am talking the combined
decline of all wells, old and new. That's an annualized rate of -51.8% decline/year. I think that
is reasonable. 11 Dec 2012, 04:46 PM
Reply Like 0
Mark Anthony
, contributor ,
premium contributor Comments (3595)
| + Follow Following - Unfollow | Send Message Author's reply
" I forget to embed the link to the ND statistics of historic Bakken shale oil productions, which
is indicated in the graph any way. The link is:
http://1.usa.gov/VCJyQv
The DMR of ND has a good collection of all sorts of data. I will continue to study and analysis
data related to Bakken shale wells. 12 Dec 2012, 04:06 PM
Reply Like 0
My name is Zoltan Ban, I have a double honors degree in history and anthropology, as well as a
BA in economics. I am the author of the book "Sustainable Trade"
Latest StockTalk With Oil Under $60/Barrel, Shale Oil Revolution May Be Over (Permanently)
http://seekingalpha.com/a/1nf8x
Dec 22, 2014 Latest articles & Instablog posts
Here is another, much simpler calculation, which shows that there is a reasonable chance that
the whole Eagle Ford field will ultimately prove to be unprofitable. http://bit.ly/V7dtqs
"... If you dont believe what the industry is saying, then you just admitted that your point of view is based upon BELIEF, not facts. Therefore, PO is a religion. If you want it to be a science, then you have to first disprove what the industry is saying. I have noticed, that no one here is actually doing that. ..."
"... All the recent mega activity at this site just seems to be one big cover up of the fact, that all your great PO theories got shot to shit with the recent fall in oil price due to over production from US shale. The latest figures from the EIA show that 9,137,000 bpd were being produced in the US as of 12/12/14, and that is an increase. Sorry, but that is not how terminal decline plays out in the world of reality. ..."
"... CLR was $30 a few days ago. $80 a few months ago. Maybe theyll go bankrupt. That will really mess up Mrs. Hamms lawyers. ..."
But I'm having an extremely difficult time even believing, that these PO discussions about
Bakken sweet spots supposedly being tapped out are still going on….AFTER ALL THESE YEARS!!!!!
All you had to do was to look at the maps KOG was putting on their website, which show exactly
where each Bakken well is drilled. Then you compare that drilling pattern to CLR's maps, which
show you where all the sweet spots are. Even Rune is now "aware" that the sweet spots are largely
determined by pressure gradients, which is what CLR's maps shows. I found out about all this,
MORE THAN FOUR YEARS AGO !!! by simply writing an email to CLR and asking why they choked back
their wells so much.
CLR also presently claims to have more than eight years of future drilling sites available
in the Bakken (at their present rate of drilling) which they say will yield more than 750,000
boe in EUR's per well. As CLR is a good proxy for the entire Bakken, what does that tell you about
the future of the entire Bakken?
I might mention that "the best" definition of a Bakken sweet spot given at this website by
a true believer, "Watcher", was that sweet spots were defined by latitude and longitude, not EUR's.
How pathetic.
If you don't believe what the industry is saying, then you just admitted that your point of
view is based upon BELIEF, not facts. Therefore, PO is a religion. If you want it to be a science,
then you have to first disprove what the industry is saying. I have noticed, that no one here
is actually doing that.
As for this sentence from the above "article"…… " The first measured 24 hour production from
Bakken wells is a very good predictor of the future production of that well." The truth is exactly
the opposite, for among many other reasons, the choking history is not even taken into account.
All the recent mega activity at this site just seems to be one big cover up of the fact, that
all your great PO theories got shot to shit with the recent fall in oil price due to over production
from US shale. The latest figures from the EIA show that 9,137,000 bpd were being produced in
the US as of 12/12/14, and that is an increase. Sorry, but that is not how terminal decline plays
out in the world of reality.
8 yrs. 750K barrels EUR per well. At current 175ish/month well addition rate that's 16000ish wells
added in 8 years.
Current total 11,000ish. So 27000 wells total then. X 750K =
about 2 Trillion barrels of oil. Don't think even CLR expects more than 50 billion, and they
are bizarre. But hey, at $40 barrel Bakken sweet prices, that's a lot of money. $80 Trillion.
What a bonanza.
CLR was $30 a few days ago. $80 a few months ago. Maybe they'll go bankrupt. That will really
mess up Mrs. Hamm's lawyers.
I'm not going to even bother to check your math. Your numbers are way too far out for me. But,
more than four years ago, CLR estimated 24 billion boe recoverable. That was recently upped to
62-96 billion boe "recoverable" (@$100) Call it less, if you like at today's prices. But, the
Bakken is still Ghawar sized, so you can eventually expect Ghawar sized production.
As to the number of eventual wells, try starting at 100,000, and go up from there. In the 4,000
square mile CLR designated sweet spot, their plan is for 16 wells per square mile (in four different
zones) which means 160 acre spacing. That's 64,000 wells right there.
How about Y-O-U defining what constitutes a PO Bakken sweet spot in EUR's, instead. Then, we
can start communicating. (maybe).
Carl Martin: Is an average EUR of 750,000 net bbl of oil per well accurate in the Bakken? It doesn't
appear that it is when one looks through the public information put out by the State of North
Dakota. Further, it doesn't appear generally that Continental has the wells capable of hitting
this figure. EOG and Whiting are the primary companies to have the wells capable of 750,000 net
bbl EUR, based upon public data.
I have read on this site that 320,000 gross bbl EUR is more probable overall in the Bakken,
although I am sure if people have agendas they can skew the numbers. I think at least a few of
the people who post here appear to have strong enough math/science/engineering backgrounds to
make some pretty reasonable calculations and are making an unbiased attempt to be as accurate
as possible.
Trying to figure out what is accurate and what is not is more difficult than what you let on,
IMO. It does appear that substantially lower oil prices may provide some answers.
There is that. 2.7 Billion at $10 million/well, from the CLR Nov investor briefing, is 270 wells.
For the whole year.
Avg flow year 1 is about 450 bpd? So incremental revs in 2015 would be 270 X 450 X $30 (net
of Bakken Sweet minus royalties, taxes) = $3.65 million, for the whole field for the whole year
from new wells.
Maybe Warren Buffett will do what he did for BoA. They created a special preferred issue for
him to buy $5 B of. Paid 8% dividend or something. Hell, he may get more of Harold's money than
the ex.
"Avg flow year 1 is about 450 bpd? So incremental revs in 2015 would be 270 X 450 X $30 (net of
Bakken Sweet minus royalties, taxes) = $3.65 million, for the whole field for the whole year from
new wells."
err I think you forgot that a year has 365 days? That comes out to more than 1.3 billion dollars
even at these depressed prices!
The average well flow for the first year is about 233 b/d, not 450 b/d (second month output is
usually highest at about 400 b/d), the average well produces roughly 85 kb in year 1.
Using Watcher's figure of 270 wells and call refinery gate oil prices $60/b, transport costs
$12/b, OPEX plus other costs $8/b leaving $40/b, then we need to pay taxes and royalties of roughly
25% on wellhead revenue of $48/b, so we need to subtract another $12/b and we get to $36/b net.
If 270 average wells are drilled we get about 23 million barrels of oil in year 1 for a net of
$826 million. The wells cost about $9 million each for a total of $2.4 billion. Looking at a single
well, we need 250 kb for simple payback (ignoring the time value of money), but the average Bakken
well takes at least 8 years to reach 250 kb of output, typically a "good well" pays out in 18
months or less. At two years the average Bakken/Three Forks well in North Dakota produces about
130 kb which is about $4.3 million in net revenue and far short of a $9 million payout level.
No, the 750,000 boe is just a reference to CLR's claim, that they have eight years of drilling
activities, that can produce that much per well. TRANSLATION: The current low oil price environment
is easily weathered by simply high grading. Any company with similar property can do the same.
But, many of the newer, smaller Bakken dotcoms have no such property, so their very existence
is in great danger.
It is nowhere near the average Bakken EUR.
By the way, unlike so many others here, I don't guess anything, and have very few opinions
of my own. I mostly just repeat what is generally accepted knowledge about the shale industry,
because no one has so far been able to prove any of it to be wrong.
It's just that none of my researched information supports any PO theory at all. That's the
rub.
So at what cost does oil have to be produced in the future? Where are we find this oil? And are
you so negative about renewables you think they won't be competitive with oil at $500 per barrel
in today's dollars?
Enno Peters collects data on all North Dakota wells from the NDIC, the EUR of the average Bakken
well between 2011 and 2014 is about 325 kb of oil, if you add in natural gas and convert to barrels
of oil equivalent(boe), it increases to 406 kboe, but note that the extra 80 kboe is very low
value relative to crude.
Note that the typical well in an investor presentation is not the same as an average well.
Maybe CLR only drills above average wells.
I don't dispute your average EUR numbers, as I don't have the neccesary info to do so. Besides
that, they sound about right to me. But you need to be careful about getting too hung up in the
word or concept of average. After all, what do you think is the average gender in the US in Dec.
2014?
Investor presentations ALWAYS show their best results, and almost never reveal all the failures,
that bring their averages down. This is just business as usual. But, it is okay because they are
always moving up the learning curve, so by showing their best results now, they are giving a clear
indication of where they expect their average results to one day be.
Also, if you want to understand this industry, it does no good to focus on average companies,
you need to look at the leaders, because they are the trend setters. Ultimately everything is
based upon best practices, and EOG is presently the undisputed best at everything. They just don't
keep investors very well informed. Therefore, I still get most of my info from CLR.
This sentence of yours is not as silly as you might think. "Maybe CLR only drills above average
wells." In a sense, "they do." That is to say, that they have no monster wells, that I know of,
they choke a lot more than others, and they have used their standard 10,000 foot lateral and 30
frack stages well design over most of the Bakken, even when it didn't make economic sense to use
it. It is because they use their standard well as a measuring stick. Now they have a fixed point
for reference to compare different areas of the Bakken.
That's why they know exactly what they are talking about, and why I accept most everything
they say. You obviously don't. But, you have never given a good reason for not doing so, other
than the results they are claiming don't show up in the data bases you are using. Why don't you
just send them an email and try to clear up a major misunderstanding on your part? Then everyone
at this website will be able to move forward.
Continental wells with first month of output between Jan 2009 and Oct 2014 have an average
cumulative output over 70 months of 186 kb, this is slightly below the average Bakken well over
the same period for all wells completed(925 wells).
There is a lot of hype in investor presentations.
The Continental wells will produce considerably less oil that the 480 kb claimed (only 80%
of the 600 boe EUR is oil) in investor presentations. The EUR is more in the 250- 300 kb range
for the average Continental well.
I wonder if they have run flow meters to check how much flow they get from the toe of a 10 thousand
foot lateral. You seem to follow this closely, are those wells slugging?
Dennis, sometimes very long wells in three phase flow can have phase segregation in the horizontal
section. This causes liquid slugs to accumulate, which tend to move up the well in slug flow.
This can be avoided by placing the heel higher than the toe. But I've never worked with a 10 thousand
foot well. And I was wondering if they had sensors to confirm the toe is producing.
I came to the same conclusion as you Dennis. The Continental wells are actually bellow average.
I have attached a graph showing the production profile for Continental wells from January 2010
to October 2014. I also included the average Bakken well profile for 2010 for reference. The first
3 year cumulative oil + gas production for an average Continental well is about 170.000 boe. No
one knows what the EUR will be, but EIA suggests that 50% of the oil has been produced during
that time ( http://www.eia.gov/forecasts/aeo/tight_oil.cfm
) which gives an EUR of about 340.000 boe.
Carl, you are saying yourself that they only show the best results and don´t tell about their
failures. So why should we then believe in anything they tell us? I have learned that you should
never ever trust in what companies tell in their presentations. Especially not smaller companies
which are dependent on cheap credits. It is actually quite disturbing that companies can make
such exaggerations and get away with it.
I however agree with you Carl that there are still drillable locations left in sweetspots.
But perhaps some companies start to run out of them. That would affect total Bakken output, which
I am mostly interested in.
I posted a chart for average Bakken cumulative output per well by company for four large companies
over the Jan 2009 to Oct 2014 period( about 1/3 of all ND bakken/Three Forks wells drilled(3462
wells).
The "avg" well is for all Bakken/Three Forks wells in North Dakota over the same period with a
cumulative of 197 kb per well over the first 58 months of output.
Chart came out a little small the first time so I will try it again.
I put together data for more companies, about 75% of total wells, too many for a clear well profile
so I am using a bar chart with 54 month (4.5 year) cumulative output for the average well for
each company over the Jan 2009 to Oct 2014 period. The average Bakken well is shown for comparison.
Companies with more than 200 wells over the chosen period are presented below.
Surprised by QEP, they don't get the hype the others do. Always assumed EOG had the most productive
wells in the Balkan due to Parshall. Must have wells in other areas which bring the average way
down.
I wish TX reported by well as opposed to by lease. Would be really interesting to see the same
info for EFS and Permian horizontal wells.
Really seems irresponsible for these companies to claim EUR oil at 600,000+. I guess they assume
the wells will produce 40-60 bbl per day for 25 years. Will be interesting to see if they do.
It looks like the quote from the other day, "Continental must drill all above average wells",
may need some adjustment. To "Continental must drill all below average wells"?
I show the North Dakota Bakken/Three Forks cumulative average well profiles by company for
the Jan 2009 to Oct 2014 period, total wells for this set of companies is 6472 wells of about
8054 wells completed (drilled and fracked) for all companies operating in the North Dakota Bakken/Three
Forks (80%). This is where I got the data for the bar chart. QEP energy is the high well profile
and OXY is the low well profile, the middle dashed line is the average well profile for all companies
(including those not presented in the chart).
Dec 10, 2012 5:39 AM | about stocks:
CLR
,
CHK
,
UNG
,
EOG
,
COGQZQ
,
ACI
,
BTU
In a previous article "
The
Real Natural Gas Production Decline
", I discussed a simple and effective
way of estimating the real declines and realistic EURs (Estimated Ultimate
Recovery) of shale wells based on two things that shale gas and oil
producers can not lie about: number of wells added during a period of time,
and the total daily productions.
The Simple and Effective Method
of Estimating EUR
The idea is simple. All shale wells are in steep decline. Thus as the
producers put new wells into production, a considerable portion of the new
production merely compensates the decline of existing wells. If we assume
producers add just enough wells to exactly compensate for the decline, then
the EUR times number of wells added equals the amount of production during
the same period.
Let me explain in formulas. Let the combined daily decline of existing
wells be D, and IP being the Initial Production rate per well:
Total_Production * D = IP * Well_Additions
EUR = Total_Production/Well_Additions = IP/D
In surveying several different shale plays, I found that all of them have
a combined decline rate of 0.2% per day. Combined decline rate means the
decline of the total production from existing wells. For example if the
total production is 500 MMCF one day and 499 MMCF the next day, the
499-500)/500 = -0.2%/day.
Thus, a rough estimate of EUR equals to IP/D = IP/0.2% = 500 IP, or
roughly 500 days worth of production at the IP rate.
Estimating the Bakken Shale Well Productions
The North Dakota Mineral Resource Commission has a
web site
that publishes the shale well counts and monthly productions of
Bakken.
I decide to crunch some numbers to see the real productivity of the
Bakken oil wells, using the idea discussed above. Let's start from the oil
productions of the latest two months:
Aug-2012: 635,177 Barrels/Day
Sep-2012: 662,428 Barrels/Day
Wells added: 170
Let's do the calculation using the above numbers. The production rate
increased by 27251 Barrel/Day in 30 days. So the daily increase was 908.4
Barrel/Day. Daily well addition is 170/30 = 5.67 wells/day. Let's assume the
combined decline rate of D=-0.2% also applied in Bakken. The median
production rate during the 30 days from mid Aug. to mid Sep. was 648,660
Barrels/Day. So the natural decline would have been 0.2% * 648,660 BPD =
1297.320 BPD. So 5.67 new wells per day not only compensates for loss of
1297.320 BPD, but also boost the production by 908.4 BPD. Thus:
So that's the IP per well that I estimates, 389 Barrels/Day. The EUR then
would be EUR = IP/D = IP/0.2% = 500*IP = 0.1945M barrels.
Consider that there are so far 4629 wells in d the accumulative oil
production is 458.860M barrels, averaging 0.099M per well. My EUR estimate
is roughly twice the accumulative oil production per well. So I think my
estimate is pretty good.
A good thing of my method is it is pretty fair. Let's say I
over-estimated the D. Let's say the combined decline rate is less than I
thought, repeating the same calculation, it results in a less IP as well.
Since EUR = IP/D, a less value divided by a less value, gives you a result
that is about the same.
Let's try a D = -0.15% instead of -0.2% and see what I get:
Thus, knowing the previous month's production rate, we can calculate what
the next month's production rate should be, by subtracting the decline, then
add number of new wells times IP.
Let me assume D = -0.2%/Day. I assume IP = 365 Barrels/Day. I further
assume that in 2005, 2006, 2007, 2008, 2009, the IP was only 30%, 50%, 70%,
80%, 90% of the current IP level, as the technology was less sophisticated
than today, and well productivity was less than what we get today. Let's see
how my calculation looks like compare with actual production:
click to enlarge)
It looks like a perfect match. Thus my assumed values, D=-0.2% and IP =
365 Barrels/Day, a good numbers that give perfect fit. Had I used an IP
higher or lower, my projection would not match the data.
So based on that, the average Bakken shale well EUR is
My EUR estimate is far below what producers have been pitching.
Case Study on Continental Resources Shale Wells
Let's have a look at Continental Resources (NYSE:
CLR
),
who is considered the most successful developer of the Bakken shale oil
resources.
I pulled out CLR's most recent
quarterly report
. Here are a few relevant numbers:
Oil and gas revenue received in the quarter was $617.93M
Oil and gas production was 0.103M BOE/day in the quarter.
Oil and gas production was 0.095M BOE/day in last quarter.
In 3 quarters, CLR participated completion of 541 wells, net 222 that
belongs to CLR. So that's 74 per quarter.
Capital spending for 3 quarters totaled $2584.434M
First the capital spending of %2584.434M divided by 222 net wells
completed is
$11.64M
per well. This is the per well capital
cost, not including the production cost yet.
What is the per well IP, and the combined decline rate D? Note that
production rate increased from 0.095M to 0.103M barrels in 92 days. That's a
daily increase of 86.96 Barrels/Day. If D=0.2%, the daily decline would be
roughly 0.2%*0.1M/Day = 200 Barrels/Day. So the daily production increase
due to new wells is 200+86.96 = 287 BPD. Daily well addition is 74 wells /
92 days = 0.804 wells/Day. Thus:
IP = 287 BPD / 0.804 =
357 Barrels/Day
EUR = IP / D = 357 BPD / 0.2% =
0.1785M Barrels
These numbers look lower than the average of the whole Bakken, or IP =
365 BPD and EUR = 0.1825M Barrels.
What is CLR's profitability outlook under these numbers? From CLR's Q3
revenue and production volume, I calculated that the unit price they fetched
on the oil and gas was about
$65/BOE
.
So a CLR well's expected EUR=0.1785M BOE would fetch a revenue of
$65*0.1785M = $11.60M per well. But as discussed above, the per well capital
spending was $11.65M. So CLR barely breaks even for the well capital
spending. But the capital spending is not the only cost. We have not
calculated the production and maintenance costs, the G&A costs. Thus, at the
current oil price, CLR is not making any real profit in developing Bakken
shale wells.
Discussions and Investment Implications?
So then, how could CLR manage to report positive profits for the
quarters? Let me explain how it works out for them.
Just like other shale oil and gas producers, CLR does not record well
drilling capital spending as cost directly. Instead, they first record it as
investment activity. The the capital cost is recognized in each quarter as
depletion and armortization costs.
I discovered that as producers tend to over-estimate the EURs and
over-estimate the life span of shale wells, they end up armortizing the cost
way below the fair amount of armortization they should calculated. Thus, as
they under-estimate the costs, they end up over-estimate the profitability
of the operations.
But one thing they could not hide is that in quarters after quarters, the
producers have consistently spend several times higher on capital spending,
than the revenue they take in. Producers continue to borrow more and more on
debts in order to continue their well drilling programs.
Is a business profitable, if it continues to borrow more debts quarter
after quarter, and it continue to spend several times more on capital
spending, than the revenue it takes in? This is neither profitable, nor
sustainable. I can see that when the banks get suspicious and stop lending
money, then the shale industry will collapse.
As I stated many times. The shale gas and oil adventure is deeply
un-profitable. The "cheap natural gas replacing coal" is a pipe dream.
Investors should bet their money on the rebound of the coal sector, not on
the false promise of shale gas or shale oil.
Full disclosure: I have no vested interest in CLR but I may consider a
short position in the near future. I have heavy long positions in coal
stocks like James River Coal (JRCC), Alpha Natural Resources (ANR), Arch
Coal (NYSE:
ACI
)
and Peabody Energy (NYSE:
BTU
).
Instablogs
are blogs which are instantly set up and networked within the Seeking Alpha
community. Instablog posts are not selected, edited or screened by Seeking
Alpha editors, in contrast to contributors' articles.
var ratings_hash={};
comment_ids = [12437651];
ratings_hash = { 12437651: [1] };
Gaucho
, contributor
,
premium contributor
Comments (879)
|
+ Follow
Following
- Unfollow
|
Send Message
But not to worry. With the
US government support they are now planning on selling all of our gas
overseas. That way we will be out of fuel much sooner than other wise.
It will also drive the prices up here so we can be less competitive.
Great planning once again by the US government. Or should I say by the
corporations that control the US government.
10 Dec 2012,
08:48 AM
Reply
Like
1
"Let's assume the combined decline rate of D=-0.2% also applied in
Bakken."
Because, if your assumption is wrong, then the direction of your whole
article/blog is wrong.
I believe that decline rates for shale gas are far steeper then for
shale oil.
But, do you happen to have any proof to offer to back up your
assumption?
Meanwhile, I will put some effort into finding some proof for my
belief. But, I have noticed over at TOD, that most PO believers also
assume that shale oil behaves exactly like shale gas. That's where I
think you are going all wrong, but we'll see...
11 Dec 2012,
03:24 PM
Reply
Like
0
The D=-0.2%/Day combined decline rate is a very reasonable assumption.
The proof is right in my article and in the chart. My projection based
on that value matches the actual production. Had I used a less steep
(smaller) decline rate, the calculation will be much higher than the
actual data. Likewise, had I used a higher IP value, the calculation
will also come out to be higher than actual.
You simply have to use IP = 365 BPD, and not any higher, and D =
0.2%/Day, and not any lower, to project the correct total Bakken
production rate as reported.
Now I do have actual proof that Bakken shale wells actuall DO decline
that fast. Look at this on page 63:
The CLR chart shows the cumulative production of Charlotte 2-22H well.
They claim the IP was 1396 BPD and at the end of 9.8 months (295
days), it dropped to 167 BPD and accumulative production was 87 MBOE.
Going from 1396 to 167 is a loss of 88%, and in only 295 days. That is
an average decline of -0.72% per day. Much higher than the -0.2%/Day I
used. Of course I am talking the combined decline of all wells, old
and new. That's an annualized rate of -51.8% decline/year. I think
that is reasonable.
11 Dec 2012,
04:46 PM
Reply
Like
0
Mark Anthony
, contributor
,
premium contributor
Comments (3595)
|
+ Follow
Following
- Unfollow
|
Send Message
Author's reply "
I forget to embed the link
to the ND statistics of historic Bakken shale oil productions, which
is indicated in the graph any way. The link is:
The DMR of ND has a good collection of all sorts of data. I will
continue to study and analysis data related to Bakken shale wells.
12 Dec 2012,
04:06 PM
Reply
Like
0
My name is Zoltan Ban, I have a double honors degree in
history and anthropology, as well as a BA in economics.
I am the author of the book "Sustainable Trade"
Latest StockTalk
With Oil Under $60/Barrel, Shale Oil Revolution
May Be Over (Permanently)
http://seekingalpha.com/a/1nf8x
Dec 22, 2014
Latest articles & Instablog posts
Here is another, much
simpler calculation, which shows that there is a reasonable chance
that the whole Eagle Ford field will ultimately prove to be
unprofitable.
http://bit.ly/V7dtqs
"... Jeb Armstrong, Vice President of Energy Research for the Marwood Group, doesnt expect most producers to have a large inventory of DUCs. Instead, he sees the backlog as a matter of circumstance rather than a way of loading up on potential volumes. The only reason why I can see a company willingly drilling DUCs is because they have a rig contract thats too expensive to cancel, he said in an email to Oil Gas 360®. Might as well keep the rig operating and plow the capital into the ground than pay a penalty to the rig owner. ..."
"... Raymond James analysts shared a similar viewpoint, noting a certain dynamic on the oilservice industry. Lower returns and crimped cash flow lead operators to slow activity and conserve cash in any way possible, the note said. Since many of the land rigs had longer-term contracts and the frac crews didnt, the quickest way to conserve cash is to drill but not complete. ..."
"... Many prognosticators of oil and gas markets have found themselves on the wrong side of US production calls throughout the shale era after failing to understand and model the risks associated with operational momentum. Increases in well productivity brought higher potential returns, and every company in the oil patch scrambled to gain the assets, people, and infrastructure to grow production (and hopefully cash) in the future. As supply growth outpaced demand, prices sank, but production hasnt responded with an equal intensity. Why doesnt production respond accordingly? The same reason you cant turn around an aircraft carrier on a dime, momentum. ..."
"... The momentum of the shale boom can be seen in the large overhang of drilled but uncompleted wells (DUCs) sitting out in the field today, ..."
"... looming over the market and weighing on any potential oil price recovery… ..."
"... Until the number of DUCs returns to levels more aligned with historical working inventory levels (3-6 months of drilling), we expect their threat to loom large over the market and have a dampening effect on any near-term price recovery. But their longer term impact could loom just as large. If producers steer too much capital away from drilling, and instead harvest DUCs to maintain production and cash flow in 2016, the human capital behind the rig fleet could be lost to other industries, making service cost inflation all but guaranteed when US supply growth is again needed. It looks like this hangover will be felt for years to come. ..."
"... This sharp downward trend has to have a direct effect on the Bakken oil production, in the shorter time frame, rather than the longer term. ..."
Bakken October 10, 2014 198 rigs February 26, 2016 36 rigs Percent decline 82%
Eagle Ford October 10, 2014 202 rigs February 26, 2016 41 rigs Percent decline 80%
Total rigs outside shale basins:
October 10, 2014 581 rigs .
February 26, 2016 143 rigs.Percent decline 75%
In the shale plays a drop in the rig count does not mean a drop in well completions. And except
for the Bakken, we have only a vague idea how many wells are being completed each month. We know
that the inventory of DUCs, (drilled but uncompleted wells), is quite high. But if so, why are any
shale wells being drilled at all? Well here is one reason:
Jeb Armstrong, Vice President of Energy Research for the Marwood Group, doesn't expect most
producers to have a large inventory of DUCs. Instead, he sees the backlog as a matter of circumstance
rather than a way of loading up on potential volumes. "The only reason why I can see a company willingly
drilling DUCs is because they have a rig contract that's too expensive to cancel," he said in an
email to Oil & Gas 360®. "Might as well keep the rig operating and plow the capital into the ground
than pay a penalty to the rig owner."
Raymond James analysts shared a similar viewpoint, noting a certain dynamic on the oilservice
industry. "Lower returns and crimped cash flow lead operators to slow activity and conserve cash
in any way possible," the note said. "Since many of the land rigs had longer-term contracts and the
frac crews didn't, the quickest way to conserve cash is to drill but not complete."
But wells are obviously being completed. In fact more wells are being completed than being drilled
but we obviously don't know just how many. And…
Many prognosticators of oil and gas markets have found themselves on the wrong side of US
production calls throughout the shale era after failing to understand and model the risks associated
with operational momentum. Increases in well productivity brought higher potential returns, and every
company in the oil patch scrambled to gain the assets, people, and infrastructure to grow production
(and hopefully cash) in the future. As supply growth outpaced demand, prices sank, but production
hasn't responded with an equal intensity. Why doesn't production respond accordingly? The same reason
you can't turn around an aircraft carrier on a dime, momentum.
The momentum of the shale boom can be seen in the large overhang of drilled but uncompleted
wells (DUCs) sitting out in the field today, looming over the market and weighing
on any potential oil price recovery…
Until the number of DUCs returns to levels more aligned with historical working inventory
levels (3-6 months of drilling), we expect their threat to loom large over the market and
have a dampening effect on any near-term price recovery. But their longer term impact could
loom just as large. If producers steer too much capital away from drilling, and instead harvest DUCs
to maintain production and cash flow in 2016, the human capital behind the rig fleet could be lost
to other industries, making service cost inflation all but guaranteed when US supply growth is again
needed. It looks like this hangover will be felt for years to come.
Conclusion
The decline in the oil rig count cannot, in the near term, be directly linked to a decline in
oil production due to so many DUCs. But eventually it must. Steep declines in oil production must
eventually follow steep declines in the rig count. And as we see a drop in production we will see
a corresponding rise in prices. This, in turn, will cause an increase in well completions, knocking
the price back down again.
So don't expect any quick recovery of either oil prices or production. Yes, it looks like the
hangover will be felt for years to come. And in the meantime peak oil will be in the rear view mirror.
But no one will notice for years to come.
This chart from Rystad Energy indeed shows that the number of DUCs was rapidly increasing during
the shale boom, when oil prices were around $100. It has peaked in late 2014 and was decreasing
since then
If the number of DUCs is almost unchanged for the last 9 months it implies the number of completions
is falling in lock step with the number of wells being drilled. Drill rigs are becoming more efficient
on average, but it still implies a very rapid fall-off in production in the coming months.
If no wells are completed in 2016, output in the Bakken drops by roughly 40%per year in the first
year. Not a very realistic scenario, though. If an average of 35 wells per month are completed,
the drop is about 25%/year. If 60 wells per month are completed, output drops about 20%/year and
70 wells completed per month results in about a 15% drop in Bakken/Three Forks output.
I have no guess about how many wells will be completed, but somewhere between 0 and 70 new
wells per month on average for 2016 will probably cover it.
Bakken rigs down to 35, with one to lay down/stack.
McKenzie county, makes up 19 of those 35 rigs.
Mountrail and Williams are at 5 and 4 respectively, with Williams about to go to 3!
Dunn Co at 6.
I have to agree with Ron. This sharp downward trend has to have a direct effect on the Bakken
oil production, in the shorter time frame, rather than the longer term.
The number of drilling rigs working in the Eagle Ford Shale is a fraction of what it was a year
ago, down 70 percent. There are 47 drilling rigs still working in the South Texas field, which
arcs from the border near Laredo toward the College Station area on the eastern edge of the field.
"... Whiting Petroleum Corp. (NYSE:WLL), the largest oil producer in North Dakota, has announced that it will suspend all fracking in the state and cut its budget for this year by 80% ..."
"... As of 1 April, Whiting will halt all fracking and stop completing its wells at 20 Bakken and three Forks sites. By this summer it will cut spending to $160 million for the rest of year to fund maintenance. ..."
"... The news comes along with Whiting's fourth-quarter results, which posted a net loss of $0.80 per share and revenues of $2.05 billion compared with 2014 EPS of $4.15 and revenues of $3.09 billion. ..."
"... It's also in a better position despite all the setbacks because it doesn't have any bonds maturing until 2019 ..."
Whiting Petroleum Corp. (NYSE:WLL), the largest oil producer in North Dakota, has
announced that it will suspend all fracking in the state and cut its budget for this year by 80%
in a move that sent its shares up 9% on Wednesday, back down to a record low on Thursday, and
$4.02 this morning.
... ... ...
As of 1 April, Whiting will halt all fracking and stop completing its wells at 20 Bakken
and three Forks sites. By this summer it will cut spending to $160 million for the rest of year
to fund maintenance.
... ... ...
The news comes along with Whiting's fourth-quarter results, which posted a net loss of
$0.80 per share and revenues of $2.05 billion compared with 2014 EPS of $4.15 and revenues of
$3.09 billion.
In an earnings call on 25 February, Whiting noted that its production for the fourth quarter
averaged 155,210 barrels of oil equivalent per day, and that enhanced completion designs in the
Williston Basin drove performance by delivering 22% production increases quarter over quarter on
a per well basis.
"Despite the sharp drop in commodity prices, our proved reserves increased 5% to 821 million
barrels of oil equivalent, even after 53 million barrels of oil equivalent of asset sales which
equated to almost 7% of our year-end 2014 reserves," Whiting executives noted.
The company sold $512 million of assets last year, ending the year with $2.7 billion of
liquidity. It's also in a better position despite all the setbacks because it doesn't have
any bonds maturing until 2019, and will not be negatively affected by the "March madness"
that is threatening other producers.
"... Once that pressure is down the dribbles that gravity will draw through those tiny cracks will still be tiny dribbles with twice as many cracks. Refracking wont do much to increase the gas pressure around a gas depleted horizontal run. ..."
This is a guest post from
WebHubbleTelescope
. Here he provides a simplified explanation of his Oil Shock Model as applied to oil production
from the Bakken formation. Previous contributions to THe Oil Drum from WHT can be found
here and
here .
My premise for participating was that I wanted to see how far I could get in understanding our
fossil fuel predicament by applying the mathematics of probability and statistics. There were enough
like-minded individuals that it turned out to be a productive exercise, and I found that even the
contrarian and cornucopian viewpoints could add value.
This was an ongoing process and I documented my progress with occasional posts on TOD and regular
posts on my blog http://mobjectivist.blogspot.com
. I treated the process as an experiment and as I collected more pieces of the puzzle, I realized
that I had collected enough information to aggregate it into a more comprehensive format.
After I finished the book (which incidentally I titled The Oil ConunDRUM as a nod to The Oil Drum)
the mobjectivist blog went dormant. I essentially treated that bog as a lab notebook, and I considered
that notebook was complete and finished as a historical record of what went into the book. So everyone
that mourns the closing of The Oil Drum has to remember that progress marches on, and something else
will spring from the analysis and research that went on here.
In passing, and as a short note to what one can do with some of the research that went into The
Oil Conundrum book, I thought to consider explaining how we can apply the Oil Shock Model to projecting
future Bakken formation production rates. Several TOD commenters have asked for a simple and intuitive
definition for how the shock model works, and it has always been a challenge to express it concisely.
In mathematical terms, it is simply the application of the convolution function to a model
of the statistical flow rate operating on the reserve potential of the reservoirs of interest.
The problem in casting it in this stark a mathematical form has been that the concept of convolution
is neither intuitive nor readily available to the layman. For example, the Excel spreadsheet application
does not have a convolution function in its toolbox of statistical operators. This is odd considering
that the great statistician William Feller once remarked that "It is difficult to exaggerate the
importance of convolutions in many branches of mathematics."
The best intuitive explanation that I can come up with is that a convolution (in the oil production
context) is a "sliding" summation of extraction applied to reserves.
Thus, the convolution algorithm automatically keeps track of older reserves as well as new reserves
as the total production accumulates with varying levels of extraction over time. Whether this is
completely intuitive to the layperson, we can always remember that a convolution is largely a cookbook
accounting exercise and once the form of the two inputs are known, a simple algorithm can be applied
to obtain a result.
For modeling the Bakken ala the convolution-based shock model, the inputs are two time-series.
The forced input is the time series of newly available wells.
The response input is the time series of expected decline from a single well.
The convolution function takes the forced input and applies the response input and generates the
expected aggregate oil production over time.
DC at his blog http://OilPeakClimate.blogspot.com/
has used this approach to good effect in modeling historical and projecting future Bakken production.
I apply a slightly different response function than DC and get this shock model output:
The two curves correspond to (1) the actual production data and (2) that which is modeled after
applying the convolution-based shock model to the well build-up, assuming a fairly rapid decline
response per well. The decline after month 714 would show what would happen if no new wells were
added. That of course won't happen, but it illustrates the Red Queen effect that Rune Likvern
has argued on these pages. The Red Queen hypothesis is that production will continue to increase
as long as a fresh supply of new wells with nominal reserve potential comes on line at a good pace.
As a detail, where DC and I differ is in how we apply the response model for the average well.
I have been applying a diffusional model based on the physics of flow, whereas DC has been using
a hyperbolic decline model which is favored by reservoir engineers. Not much of a difference between
the two, apart from gaining an understanding of what is actually happening underground, which is
likely an initially rapid diffusional flow followed by a the long tails of a diffusional decline.
As a caveat, the model would likely work even better if the North Dakota Department of Mineral
Resources had kept a cumulative total instead of an active count in their PDF table --
but as is the case with most of the data, you use what you can get.
The take-home point is that analysis approaches do exist outside of the insider oil patch knowledge-base.
Us mere mortals can formulate and apply these simple models to at least try to get a handle on future
fossil fuel supplies. That was the objective that I had when I started my blog and followed along
with TOD as we watched crude oil production plateau the last 9 years.
---
Doing this work on applying probability and statistics to the energy predicament has opened up
other possibilities which I have since pursued. Recently I have started up another blog on general
environmental modeling called http://ContextEarth.com
. This has an associated interactive modeling web server called the Dynamic Context Server, which
builds up from a semantically-organized knowledge-base of land, water, and atmospheric information.
I have incorporated the shock model as one of the functionalities in the server and intend to
maintain other capabilities to make it useful for environmental model activities, such as wind, solar,
and transportation simulations. Comments and collaboration opportunities are welcomed.
As you can see, The Oil Drum is only a start to the on-going energy transformation that we are
going through.
Any thoughts on how to incorporate price effects - e.g., the effect of the recent price hike,
which took Bakken production from it's former peak to a new growth phase?
The thinking is that the profit margin isn't that great and some have even speculated that
many operators will lose money. It sounds very similar to making a Hollywood movie -- all the
costs are eaten up during production with few films actually making money.
The early days include some wells that were borderline conventional wells, which made them
more competitive with other conventional wells in that timeframe. But there weren't many like
that, and it took the price increases to open up the rest to hydrofracturing technology.
Correction, in the last sentence: "But there weren't many like that".
I didn't want to edit and send it back into moderation. Sorry for delays in responding if I
include links. I have today off from work so can respond to questions quickly if no links are
involved.
In an ideal world, we'd have a single model that could project production for multiple price levels.
That is to say, something that in 1980 would have projected a ND peak of around 150k bpd under
a regime of $25 oil, and in 2007 would have projected a peak above 800k bpd for $90 oil.
My suggestion for these Bakken wells is to have a good model for when they get shut-in. That would
suggest the minimum level of production while still maintaining profitability.
You had the right scent when you brought up price but lost the trail with this last question.
It is the strong gas drive that makes these Bakken wells pay off quickly. Once that pressure
is down the dribbles that gravity will draw through those tiny cracks will still be tiny dribbles
with twice as many cracks. Refracking won't do much to increase the gas pressure around a gas
depleted horizontal run.
On the price thing, we can certainly evision that once a certain price threshold is achieved
somewhat less sweet spots will begin to pay and that those less and less sweet spots will encompass
greater acreage. More or less an inverse relationship between sweetness and area...but what we
can envision and the real facts under the ground might diverge wildly.
Oh and Web's diffusion light bulb came on when I posted this chart from the Great Bear site
Rock's comment on the chart was more or less that is was a crock as below a certain size crack
oil just wasn't going to have a significant increase in flow...but he kind of skipped mentioning
that gas flowed through those smaller cracks quite readily and that the increased gas drive those
cracks create might be the the real pay off.
This is a representation I made of the diffusional model:
The fissures are truly random pathways and the oil randomly walks to the collection point as
shown. They could just as easily travel away from the intended direction. It is true that the
pressure release enhances the flow but this flow is not as direct as a straight line. There is
really no control over the fissure formation.
The substantiation of this model is that the production follows a type of inverse square root
of time dependence, which is the signature of Fickian diffusion.
Look at the diffusion paper on the ContextEarth blog linked to above (go to Figure 17 shown
above to find the right section). Diffusional models are fairly general and can be used to describe
lots of applications. One of my favorite recent ones is that of Lithium ion battery charge and
discharge.
The math is very similar to oil flow, ions in the Lithium composite have to follow a random
walk to move between the anode and cathode. The random walk helps prevent the battery from discharging
(or charging) all at once.
It is really diminishing returns after the first fracturing attempt.
The model is one of diffusive flow, so if the volume is fractured one time, the second time
the fluid gets even more dispersed to points even further away from the collection points.
I have a paper describing diffusive flow on the ContextEarth server linked above that describes
the math.
They do refrac in some cases. While it is "diminishing returns", sometimes a refrac can increase
production enough to be worth the expense to the operator. However refracs probably won't change
the "big picture" of Bakken production all that much.
The technology of controlling fracs has become sophisiticated enough that in some cases the
refrac can open up new rock that wasn't fractured in the initial job. Or a refrac may help when
the original frac wasn't optimally done. See for example
Restimulating
the Bakken: What have we learned?
The model is one of diffusive flow, so if the volume is fractured one time, the second time
the fluid gets even more dispersed to points even further away from the collection points.
Your model may be diffusive flow and it may well mirror the actual oil and gas flow rates,
but what you must realize is the diffusion in fracking is the creation of the fractures themselves.
Once the big frac pumps shut down the fluids are not diffusing anymore, they are all following
the path of least resistance from a high pressure environment to a low pressure environment. And
that path is always little cracks feeding bigger cracks because bigger cracks relieve pressure
faster...as long as they stay open.
Wouldn't that be more like the reverse of diffusive flow just as much as tributary springs
flowing into brooks and creeks creeks, flowing into rivers and ultimately into the ocean is the
reverse of diffusive flow. Of course evaporation from those water courses and bodies is diffusive
flow and it does keep the cycle going but that is another story and is not what is happening in
a fracked well.
The pressure from the over burden is relentless and is always closing down fizzures pores that
no longer have enough fluid in them to push back. Its always a big squeeze out of any fluid that
can escape to low pressure areas just as long as the channels stay propped open. Refracking will
still have the liberated fluids attempt to leave high pressure environment for the low not disperse
them away from collection points for just as long as the refracking leaves open paths to the low
pressure zone.
I responded yesterday with an image from my paper but that got held up in moderation, so this
is what I said without the Figure 17 from the paper.
The fissures are truly random pathways and the oil randomly walks to the collection points.
They could just as easily travel away from the intended direction. It is true that the pressure
release enhances the flow but this flow is not as direct as a straight line. There is really no
control over the fissure formation.
The substantiation of this model is that the production follows a type of inverse square root
of time dependence, which is the signature of Fickian diffusion. I add an element of dispersion
to the flow which allows a range of diffusivities to the mix.
Look at the diffusion paper on the ContextEarth blog linked to above (go to Figure 17 to find
the right section). Diffusional models are fairly general and can be used to describe lots of
applications. One of my favorite recent ones is that of Lithium ion battery charge and discharge.
The math is very similar to oil flow, ions in the Lithium composite have to follow a random
walk to move between the anode and cathode. The random walk helps prevent the battery from discharging
(or charging) all at once.
"Wouldn't that be more like the reverse of diffusive flow just as much as tributary springs
flowing into brooks and creeks creeks, flowing into rivers and ultimately into the ocean is
the reverse of diffusive flow."
Once it gets to a river, that is definitely a gravity-fed flow. However, for tracing of flow
through porous media, hydrologists measure what are called breakthrough curves, and these are
largely diffusional flow with some gravity feed as well. I solved these dispersive transport equations
in The Oil Conundrum, and that is why it was fairly easy to make the connection to the Bakken
flow rates.
The Bakken flow is extremely diffusional because it has the strong diffusional spike at the
beginning followed by the fat-tails. Reservoir engineers use a heuristic curve called hyperbolic
decline, which happens to match the dispersive diffusional flow for a specific set of heuristic
parameters.
I could post some diagrams, but that would just go back in moderation, so I suggest you look
at the diffusional paper on the ContextEarth site and also The Oil Conundrum book where I have
a chapter on porous media dispersive diffusional flow.
The fissures are truly random pathways and the oil randomly walks to the collection points.
They could just as easily travel away from the intended direction. It is true that the pressure
release enhances the flow but this flow is not as direct as a straight line. There is really no
control over the fissure formation.
I never claimed the flow to be a straight line, the randomness of fissure direction is what
makes your diffusional flow math work, however the flow is not truly random. The fluids are moving
from high pressure to low pressure zones following the path of least resistance through open pathways
many of which only remain open because of the propant injected into the them.
The high initial flow after the first frac' job is generally very dependent on the gas drive.
That was my quibble when you described the diminishing returns of a refrac job to Nick. The first
frac' job will have found most of the larger natural fissures thus the bulk of the mobile fluids
in the horizontal well's sphere of influence. That is the main reason a second frac' would have
diminishing returns--there just won't be that much mobile gas and oil left for the horizontal
run to liberate--it wouldn't be because the new pathways opened will offer even longer routes
from high to low pressure zones or even that some of those longer routes lower pressure zones
will lead to already drained dead ends--though both are likely results of a second frac' job.
Unlike near surface water moving through porous medium fluids trapped in the Bakken medium
won't move much at all until a pressure differential is made available to them--a pressure differential
like the one created by frac'ed pathways leading to the horizontal collection pipe. As long the
pathways from higher to lower pressure remain open, the fluids will be travelling to low pressure
from high regardless how random the the direction of the pathway looks.
Without direct evidence that the flow is not random, the best we can do is look at the empirical
flow rates of a typical well. This seems to fit best either a diffusional flow profile or a hyperbolic
profile with a tuned exponent. The former is based on physics while the latter is a heuristic.
That essentially describes my model of the initial fracturing attempt.
Perhaps what happens on successive fracturing attempts is a moot point. The speculation is
the amount of oil rapidly diminishes -- but without some data to analyze, we are guessing as to
what the flow actually looks like.
I guess the next logical question is: is there a price for oil at which it would be worth drilling
new wells in between the old ones – In other words is there a price point at which well spacing
changes?
I'd argue that production is driven by profit rather than price. Consumption however is likely
pretty much a function of price.
If one assumes a required minimum return on capital OVER TIME profit and price then should be
causal but certainly not in the shorter run. What constitutes short run vs long run is related
to the nature of the project. Short run for somebody selling oysters is different from somebody
developing oil fields.
Correct me if I am wrong, but convolution is a cookbook technique for doing mathematically
what could be done with a lot of patience and a spreadsheet.
I produced this graph with a spreadsheet. Assume a well like the red line with production of
100, 60, 40, 30, 25, 20, ... in succeeding years (these numbers are just a guess for illustration,
not based on any real well), and open one new well a year. Then production will be as follows:
Yr 1: 100 total Yr 2: 60 + 100 = 160 total Yr 3: 40 + 60 + 100 = 200 total etc etc.
If I could do convolutions I could produce the totals 100, 160, 200, ... mathematically without
having to draw up a spreadsheet.
The accuracy of the model depends on two factors:
1. The correct shape of the well depletion curve.
2. The correct prediction of the number of wells drilled.
If sweet spots are drilled first one would expect individual wells to become less productive
with time, and the number of wells drilled to decrease. I presume these changes over time can
be modelled mathematically as well.
So, assuming WHT has done his sums correctly, and I believe he has, one's assessment of the
model must depend on one's assessment of how closely the depletion curves and drilling numbers
match reality.
I think these input factors should always be shown along with the final output curve.
Aa, you have the algorithm down about right for convolution.
In the context server that I mentioned, the calculation uses an expressive language whereby one
only has to write the phrase, A convolve B, to invoke a convolution. It is commutative so that
the order does not matter.
It is called the shock model since one can add perturbations, or slight shocks, to the extraction
rate as a final step. This is normally used for significant geopoltical shocks, as described in
Stuart Staniford's last post.
I am glad you got this piece written and my thanks to you and Joule for posting.
I find it helpful and will be pleased to follow your future 'experiments' with data in a variety
of fields!
That DC and Rune take a very similar approach to data is encouraging.
I await developments.
Even if I can 'follow' your logic, it does not mean that I could engage in creative or critical
discussion of methodology (!) but I am personally encouraged that you engage with 'entropy' as
a basis for your logic concerning probability, and that you appeal to known physical processes
such as diffusion in the case of tight-oil. All of which does indeed seem fundamental for the
outcomes we are interested in, if and when as you say the numbers are available.
Thanks again
Phil H
PS Can the 'shock' approach be used to test historical data retrospectively - e.g. perhaps
looking at USSR oil production, to test assumptions about industrial / technological / political
continuity, or indeed somewhat differently, effects of technology innovation? Perhaps to get a
handle on the size of 'shocks' and their effects? For the latter there is the example of USA tight-oil
extraction emerging during extraction from 'almost-conventional' oil-bearing formations, and then
expanding into a new phase with a new territory of opportunity. This was itself a 'shock', no?
"Can the 'shock' approach be used to test historical data retrospectively "
Certainly. In the book that I linked to, "The Oil Conundrum", I have more thorough examples
of how the shock model applies to historical geopolitical situations.
The Bakken example of this post is the simplest case of the convolution approach and so does
not incorporate the shocks of sudden changes to production levels.
A good example of a simple shock is looking at the historical UK North Sea production and then
consider the Piper Alpha incident. This caused a depression in extraction levels that the shock
model can approximate, resulting in the "dual hump" of UK oil production levels. This is also
described in the book.
This is an example of the shock applied to the UK production using the convolution-based shock
model:
The lower left is an extraction rate profile, which models the actual production level on the
upper right. The main point is that relatively small perturbations on the extraction rate leads
to noticeable changes in the production. The Piper Alpha caused both a reduction in that platform,
but also an overall reduction in the North Sea extraction as safety concerns propagated down the
line to other platforms.
As a caveat, the model would likely work even better if the North Dakota Department of Mineral
Resources had kept a cumulative total instead of an active count in their PDF table --
but as is the case with most of the data, you use what you can get.
I'm puzzled by this - do you mean cumulative production, or something else?
When a well stops producing it no longer shows up in the statistics. That makes it hard to tell
what the true cumulative is and how many new wells are being added. In other words, the running
total is new wells minus those removed, with no distinguishing between the two.
If you pay the N Dakota Department of Mineral Resources you can get the detailed records from
what I understand.
The given link did not bring me to a pdf file of the book.
(My books are free on line, but I'm a long ways up stream from you guys.)
To find my books, Google for Jon Claerbout books
Go to the menu item labeled The Oil Conundrum and that will take you to the PDF.
"The aim of every political constitution is, or ought to be, first to obtain for rulers men
who possess most wisdom to discern, and most virtue to pursue, the common good of the society;
and in the next place, to take the most effectual precautions for keeping them virtuous whilst
they continue to hold their public trust." -James Madison, FEDERALIST #57 (1787)
"... Lest anyone forget, if the number of additional wells does not increase in Bakken year-over-year, then the result will be as we showed in the last of The Oil Drum posts http://www.theoildrum.com/node/10221 ..."
Lest anyone forget, if the number of additional wells does not increase in Bakken year-over-year,
then the result will be as we showed in the last of The Oil Drum posts
http://www.theoildrum.com/node/10221
Individual Bakken wells have little long-term capacity, so that the decline effects are seen almost
immediately.
"... With those sort or numbers, we will nearly be able to count the number of rigs drilling in the Bakken, on our fingers and toes! And if XTO cut their 5 rigs to similar to their competitors, we will! ..."
"... If these numbers hold, looking at as low a 900K bopd this summer from ND. ..."
With Halcon and EOG releasing 2016 guidance, estimate the following companies:
QEP, SM Energy, Enerplus, Continental, Marathon, Oasis, Hess, WPX, Whiting, Newfield, HRC Operating
(Halcon) and EOG…
will complete in between 200-250 Middle Bakken and/or Three Forks wells in 2016. This is just
an ESTIMATE, as the companies report this guidance in many different formats, and in gross and/or
net wells.
The remaining companies with rigs running are XTO, Burlington, Statoil, Liberty and PetroHunt.
I cannot find Bakken specific 2016 guidance for XTO (ExxonMobil) Burlington(COP) and Statoil.
If anyone finds this, please post it.
PetroHunt and Liberty Resources, I believe, are private companies. They each have just one
rig running.
The above companies, I believe, are the only ones running rigs in the Williston Basin at present.
Clearly, there are other companies that have, and that could have DUCS to complete in 2016. Anyone
with any information on those, please post.
FYI, it appears the bulk of the completions will occur in Q1.
With those sort or numbers, we will nearly be able to count the number of rigs drilling in
the Bakken, on our fingers and toes! And if XTO cut their 5 rigs to similar to their competitors,
we will!
Toolpush. Went over those numbers with Rune, he came up with a little higher number than me, so
I will revise that to 250-325. Still a very low number for the large number of companies involved.
If these numbers hold, looking at as low a 900K bopd this summer from ND.
"... There are 3100 wells in the Williston Basin that are producing 40 bpd and less, if they all are producing close to the forty barrels per day, the shutting of those wells will reduce the production by some 120,000 bpd, maybe. Daily production would fall to one million bpd and maybe even close in on 900,000 bpd with decline. ..."
"... Bakken well horizontals are known to fill up with sand, so you have to keep pumping oil to prevent plugging the horizontal. ..."
"... Madison Formation oil is a heavier oil than Bakken oil, the classic dark green gray color of the oil is there, it is oily oil, clings to the side of the jar, not the light stuff like Bakken crude. A distinct color difference between the two oils. ..."
There are 3100 wells in the Williston Basin that are producing 40 bpd and less, if they all
are producing close to the forty barrels per day, the shutting of those wells will reduce the
production by some 120,000 bpd, maybe. Daily production would fall to one million bpd and maybe
even close in on 900,000 bpd with decline.
Madison Formation wells and Red River Formations have produced plenty of oil over the years,
nothing like the Bakken though. If you view the pdf, the production for each formation is right
there. Bakken well horizontals are known to fill up with sand, so you have to keep pumping oil
to prevent plugging the horizontal. You will need two hamsters in the wheel to make it go faster.
Madison Formation oil is a heavier oil than Bakken oil, the classic dark green gray color of
the oil is there, it is oily oil, clings to the side of the jar, not the light stuff like Bakken
crude. A distinct color difference between the two oils.
…Enerplus delivered fourth quarter production of 106,905 BOE per day, contributing to annual
average production of 106,524 BOE per day, approximately 3% higher than 2014 and above guidance
of 106,000 BOE per day. This strong production was despite a 39% reduction in capital spending
year-over-year and over 6,000 BOE per day of production divested during the year which,
given the timing of the divestments, reduced annual average volumes by approximately 1,300
BOE per day.
…Fourth quarter funds flow was $103 million ($0.50 per share), down approximately 15% from
the previous quarter primarily as a result of lower commodity prices and production volumes.
Full year funds flow was $493 million ($2.39 per share), down approximately 43% primarily
due to significantly lower crude oil and natural gas prices relative to 2014. Commodity hedging
helped support funds flow during 2015 with cash gains of $288 million.
…Enerplus reported a net loss of $625 million in the fourth quarter as it incurred
non-cash charges including $266 million related to an asset impairment and a $426 million valuation
allowance for deferred tax assets.
Enerplus has also reduced its 2016 capital budget a further 43% to $200 million. This
represents a 60% reduction from 2015 spending levels. The reduced budget is focused on
balance sheet preservation and maximizing the long-term value of the Company's assets. The
revised 2016 capital program comprises drilling 25.9 net wells (18.5 in North Dakota, 1.5 in
the Marcellus and 6.0 in the Canadian waterfloods) and bringing on-stream 24.2 net wells (13.6
in North Dakota, 4.6 in the Marcellus and 6.0 in the Canadian waterfloods).
Taking into account the reduced capital program, and the approximately 8,000 BOE per
day of production divested since Enerplus released its original 2016 guidance, the revised
production guidance for 2016 is 90,000 – 94,000 BOE per day. Expected crude oil and natural
gas liquids production is modestly lower at 43,000 – 45,000 barrels per day, now representing
48% of total 2016 production at the midpoint (versus 44% previously).
Note assets sales and 10% drop in production forecasted for 2016.
"... The CEO of Devon [which cut 75% of their drilling budget] essentially asked: Who would ever drill for new production at these prices. Then Marathon came out with essentially the same thing with their budget. And, EOG will not have any rigs running in ND. I think that Harold Hamm finally got religion over at CLR. ..."
"... I am sensing an emerging consensus to just bite the bullet and bring production down as fast as possible unless a lender forces the issue. ..."
Does anyone know what the status of crude pipelines to haul Bakken oil is? I ask because I believe
that the decline in rail car loading is greater than any decline in production. So, I am curious
how much of the Bakken oil is now avoiding the extra cost that rail shipment incurs.
The CEO of Devon [which cut 75% of their drilling budget] essentially asked: "Who would
ever drill for new production at these prices." Then Marathon came out with essentially the same
thing with their budget. And, EOG will not have any rigs running in ND. I think that Harold Hamm
finally got religion over at CLR.
So, the big unknown now seems to be how fast they will complete the inventory of drilled but
uncompleted wells. I am sensing an emerging consensus to just bite the bullet and bring production
down as fast as possible unless a lender forces the issue.
"... Wells in the Williston Basin that produce 40 barrels per day and less are going to be shut. I think it is about a thousand of them, if they have been shut already, it would explain the 29,000 bpd drop. Shut wells will result in an increase of daily production per well. ..."
Wells in the Williston Basin that produce 40 barrels per day and less are going to be shut. I
think it is about a thousand of them, if they have been shut already, it would explain the 29,000
bpd drop. Shut wells will result in an increase of daily production per well.
When the price of oil increases, the wells will recommence pumping.
"... Winter just started affecting the North Dakota production numbers. There is more decline to be expected the coming months. Consider seasonal conditions combined with the maturity of the field and with low prices. The peak is behind us. ..."
"... The accuracy of your curve would suggest that the drop in oil price hasnt had as marked an impact as would be expected – i.e. the decline was going to happen anyway, no matter what. Can you comment on that? ..."
"... basically, I believe ND Bakken is producing every barrel it can, from a geology point of view – despite the low prices. ..."
"... for the coming year we agree. Down down down. Prices may (and will) rise again. But I do not see another 27k wells being drilled in that North Dakota landscape. Just look at it on Google Maps. There are wells everywhere! Where are the North Dakotans going to drill 27k new wells? The USGS is an important institution, but I believe they overestimate Bakken URR greatly. ..."
"... the number of potential well locations is still high. Many of them are outside the sweet spots, but if and when oil prices rebound, a large part of potential B-TF wells may be economically viable. ..."
"... And how many loans are created in consumer/real estate economy based on oil being $100 where was incentive to provide enough liquids at that price for our endless car circling that we call GDP. That debt is no different than E P debt and will be crashing down at same time. ..."
Winter just started affecting the North Dakota production numbers. There is more decline to
be expected the coming months. Consider seasonal conditions combined with the maturity of the
field and with low prices. The peak is behind us.
The accuracy of your curve would suggest that the drop in oil price hasn't had as marked an impact
as would be expected – i.e. the decline was going to happen anyway, no matter what. Can you comment
on that?
I am, honestly, stupified myself by the accuracy of the curve, that is 25 months old now without
ever tinkering the parameters of the model. It was based on Hubbert analysis, adding a seasonal
effect on it. So basically it is pure geology, no impact of price whatsoever. Besides that, one
needs to aware of the price collapse and the possible impact on the industry. So I might be just
"lucky" to be right with my prediction, because the price collapse happened to coincide with the
predicted decline in production.
For that reason I added the other set of curves: the first derivative of the model and the
change in production (5 month moving average). The cool thing is: there is basically no disturbance
of the expected/predicted changes in the data. The changes in the data do follow the first derivative
of the model too. Would there have been a sudden policy change (due to lower prices) there would
occur a mismatch between the first derivative of the model and the change in the data. That did
not happen.
So, basically, I believe ND Bakken is producing every barrel it can, from a geology point
of view – despite the low prices.
Can you remind us what the URR of your Hubbert model is?
I ask because Proved plus probable reserves at the end of 2014 were about 9.3 Gb, cumulative
production was about 1.2 Gb at the end of 2014,which suggests a URR of 10.5 Gb, if no new reserves
are added from possible reserves or contingent resources in the future .
The decline has very little to do with geology and much to do with the oil price.
If new wells were being added at a rate of 150 new wells per month in a scenario where oil
prices only fell to $80/b instead of $50/b in 2015 and then gradually rose from $80/b in June
2017 to $160/b in Oct 2020, then output would increase until mid 2020 and then gradually decrease.
If we assume profitable well locations run out at about 40,000 total wells drilled, we get
the scenario below when 150 new wells per month are added from May 2015 to Sept 2031.
An alternative to Bruno Verwimp's model where the wells added decreases due to low oil prices
and then increase when oil prices increase in the future. The URR is consistent with USGS estimates
of about 10 Gb for the Bakken Three Forks.
Nice to meet you again, Dennis! I was waiting for you. :-)
The future will tell who had the
best idea. Reality may turn out to be something in between our ideas. At least I understand
for the coming year we agree. Down down down. Prices may (and will) rise again. But I do not
see another 27k wells being drilled in that North Dakota landscape. Just look at it on Google
Maps. There are wells everywhere! Where are the North Dakotans going to drill 27k new wells? The
USGS is an important institution, but I believe they overestimate Bakken URR greatly.
There are currently 10,756 producing unconventional Bakken–Three forks wells. Even including
the shut-in wells, the total number of drilled Bakken-TF wells unlikely exceeds 12-13 k.
So the number of potential well locations is still high. Many of them are outside the sweet
spots, but if and when oil prices rebound, a large part of potential B-TF wells may be economically
viable.
"Citing up-to-date analysis of production data and cash costs from over 10,000 oil fields,
Wood Mac said it believes 3.4 million b/d, or less than 4% of global oil supply, is unprofitable
at oil prices below $35/b.
Even the majority of US shale and tight oil, which has been under the spotlight due to higher-than-average
production costs, only becomes cash negative at Brent prices "well-below" $30/b, according to
the study."
So why are so many producers struggling and/or going broke?
That $30 to $35 mark must be well-head costs of production without overheads?
The present ND price is $16.50 for one thing. The analysis is for operating fields and does not
include exploration or new developments, without which oil companies would have a short lifetime.
I think they are only including OPEX or what I call LOE.
As I have mentioned previously, these expenses typically include only the electricity or other
power costs to operate the wells, the chemicals used on a regular basis down hole, minor repairs,
and direct lease labor. At least that is the way the shale guys report it. Otherwise, why do they
always report $4-$8 per BOE in company reports, yet I see much higher than that on the lease operating
statements sent to non-operated working interest owners for interests for sale on the auction?
I have my doubts as to whether they are including in OPEX finding and development costs, including
the costs to lease the land, permit the well, drill the well, complete the well, equip the well,
any subsequent equipment that is capitalized and not expensed, including replacement of tubulars,
rods, down hole pumps, etc. over the life of the well, both ordinary work overs such as repair
of tubing leaks and replacement of down hole pumps, as well as work overs such as sand pumping,
acid, re-perforation, re-fracking, all transportation costs, all general and administrative expenses,
all severance, extraction, production, income, ad valorem, etc. taxes, and interest payments on
debt.
In the real oilfield, not the one displayed by the shale cos. in their Urban skyscrapers, what
is most important is what goes in the checkbook, what goes out of the checkbook and the current
balance in the checkbook. Classifying a rod job as CAPEX does not change the fact that a check
has to be written within 30 days (apparently 180+ days for shale) to the contract company who
pulled the pump.
Due to the skyrocketing of costs in the industry from 2005-2014, I believe this crash is more
severe than 1998-1999, despite Brent and WTI oil prices not quite falling to the inflation adjusted
lows of that period, as well as the fact the basis spreads are much wider for certain crudes (think
Bakken, Western Canadian Select, etc.) than they were in that era.
We are suffering much more than in 1998-1999 for sure, on the very same leases. The combination
of cost inflation, reserves that are tougher to produce, and in the case of marginal producers
like us, natural decline, makes dropping into the $20s (or below) brutal.
The vast majority of US publicly traded E & P have PDP PV10 reserve values LESS than long term
debt at $50 WTI. At least I suspect the 10K will show that in the next 15-45 days as they are
released.
Keep in mind we have been hovering around $30 WTI in 2016, after hovering around $40 WTI since
last fall. I imagine PDP PV10 is less than half at $30 WTI as opposed to $50 WTI. I further suspect
that PUD PV10 in almost non-existent in the US onshore lower 48 fields at $30 WTI.
Remember that reserve based lending standards typically do not allow for a borrowing base in
excess of 65% of PDP PV10 (recently PV9 due to historically low interest rates). This includes
not only first lien bank debt, but any other types of second lien or junior debt.
Therefore, at $50 WTI, almost all US onshore based E & P DO NOT qualify for reserve based credit
with US banks. And we are at $30 and change today.
In reality, any equity value these companies have is purely a bet that the current WTI and
HH futures will not hold, but will go substantially higher in the near future (yet this year).
I know I and others have been beating this drum for a long time, but dang it the truth has
to be said. Just because 1% of wells in the Sprayberry Wolfcamp play in Midland Co., TX are worth
drilling and completing at $30 WTI does negate the fact that the entire industry is in jeopardy
without a significant price spike.
I would really like to know how much industry debt to banks is delinquent. I bet there is still
a lot of pretending going on by the banks with regard to provisioning energy loan losses.
Make no mistake about it, this has been a price crash of epic proportions.
"I think they are only including OPEX or what I call LOE. "
Woodmac mentions cash operating costs, not full-cycle costs
Cash operating costs include not only LOE, but also taxes, G&A.
Not sure if they include interest expense.
As regards LTO full cycle costs:
"full life cycle economics require an oil price in the range of $40-$60," Wood Mackenzie said.
AlexS. They may include taxes and interest, but I bet a lot of costs that are necessary to keep
the lease producing are put in CAPEX and not included.
For example, I look at a lot of LOS for shale wells.
LOE runs $10-20K routinely per well in the Williston Basin, with newer wells tending to be
more costly due to higher produced water disposal costs.
Invariably, however, there will be a monthly LOS with an extraordinary charge, some times in
excess of 5 times the routine monthly LOE. Sometimes it is not readily apparent what these charges
are for. Sometimes they are routine work overs, pump changes, tubing leaks. In any event, I believe
at least some of these costs are being capitalized. Anything permissible to reduce the per BOE
cost of LOE in company reports will be taken advantage of, and likely even required by GAAP, and
reported differently for income tax purposes.
It appears ND is granting operators the ability to idle wells producing 40 bopd or less for
up to 24 months.
Based on Enno Peters shale profile website, it is apparent many wells fall below 40 bopd within
60 months of first production. I suspect most wells under 40 gross bopd in the Williston Basin
cost $25 per BOE+ to keep online. Given the differential to WTI in that basin, I suspect they
generally are in the negative at current prices.
Regardless, if a 3-4 million bopd cut were announced by Russia and OPEC, I suspect prices would
rally significantly. So even if Wood Mac is including all the necessary expenses to keep production
online, 3-4 million bopd underwater is a big deal.
"The vast majority of US publicly traded E & P have PDP PV10 reserve values LESS than long term
debt at $50 WTI."
SS,
It is no different in District XI aka Canada :-)
And how many loans are created in consumer/real estate economy based on oil being $100
where was incentive to provide enough liquids at that price for our endless car circling that
we call GDP. That debt is no different than E&P debt and will be crashing down at same time.
Thank you, Ron, for this update. Assuming Bakken decline follows Bruno Verwimp's predicted curve
we are going to see an increase in the rate of fall over coming months. Noting that the model
is Hubbert, seasonally adjusted, implies that it is price insensitive; we shall see.
This will focus minds on the reality of the Red Queen and, to use another fairy tale analogy,
demonstrate that the Emperor has few clothes.
I read an article on Bloomberg a couple of days ago, saying that if oil gets to $50/bbl, that
the US oil companies will sell forward contracts and flood the market with oil.
I hope that Ron comments on this. But, I see some problems. The first problem is that the average
oil company has PROVED [with $100's billion of write-offs and worthless junk bonds] that they
cannot make a profit at $49 oil [2015 PV-10].
The second problem is: Suppose, at $50 oil, a company could sell forward 2 years of production
at $55. They cannot. Why not? Because they have no collateral. All of their assets are pledged
to existing loans. Why do they need collateral? Because, what if the price rises – to let's say
to $85. In that hypothetical, they need $30/bbl of margin CASH. I believe that Ron will confirm
that you HAVE to make margin calls within 24 hours or your position is sold out.
Well, how did companies like Chesapeake Energy do it. Well, at the time [several years ago],
they had enough reserves that were not pledged on any loans, even though they were highly leveraged.
So they pledged that collateral to, like Goldman Sachs, to cover any margin calls. So GS would
put up the margin calls, if needed.
Today is different. Most to these companies do not have any unpledged collateral. So, it is
a catch 22. They will not be able to sell forward contracts.
The the nine hundred forty five wells awaiting completion is in ND is probably an accurate number,
plus or minus maybe a couple of dozen, depending on how up to date the data is.
I read somewhere a couple of days ago that there are about four thousand wells awaiting completion,
in total, in the USA.
ND Bakken December 2015 data are out. Production fell back to levels not seen since August/September
2014. Exactly what the Season Effect Model predicted 25 months ago (within a 0.64% error margin).
That means that just to recover drilling cost at $30 per barrel you need 267K barrels of
oil to be extracted. Or around 730 barrels per day during the first year (assuming that
other years oil will pay for everything else)
Notable quotes:
"... Drilling is about 1/3 of total cost, in any case not exceeding 40% ..."
"... The article below suggests about 38% of the total well cost is drilling cost in 2013 in the Bakken/Three Forks. ..."
In the Bakken/Three Forks total well cost is about $8 million and in the
Eagle Ford it is somewhat less, maybe 6.5 to 7 million dollars. I believe I have read that drilling
is about half and fracking is about half the cost. If the money has already been spent to drill
the well (a sunk cost) and these companies can find the money to complete the wells, they might
do so. Finding someone to lend money may be problematic at current oil prices. At an oil price
of $40/b or more, if we ignore the "sunk cost" as the money has already gone down that hole, then
the money from the oil at $40/b may pay for the fracking costs. This may be the game some of the
LTO companies will play.
Thank you for the correction. I imagine this might vary from Bakken to Eagle Ford,
though perhaps not if the longer laterals in the Bakken lead to a higher number of frack stages
so that the drilling cost to fracking cost remains proportional at 1/3 to 2/3 or 40% to 60%.
Here is an article with drilling and completion costs which are much lower in the Eagle Ford
than I realized ($4.5 million).
A good article covering LTO in general gives 35 to 40% as an estimate for drilling cost and
60 to 70% for completion (which doesn't seem to add up). I would call it 37% drilling and 63%
for completion. Note that fracking alone is about 50%, but other completion costs (besides fracking)
are around 13% of total cost.
Looks like "beginning of the end" not "end of the beginning" for North Dakota shale, which
did not survives at the current prices. for refiners that content of North Dakota oil also
represents a problem, as this is a light oil that does not contain important for refining margins
components of heavier fuels such as kerosene and diesel.
The EIA expects the Bakken's production to drop by 23,000 barrels in November, a decline
second only to the Eagle Ford in terms of size.
Notable quotes:
"... Several East Coast refiners are losing interest in Bakken crude, instead preferring to import oil from abroad to use in their refineries. ..."
"... The problem is that the drop off in production has eliminated the discount that Bakken oil traded at to WTI, making it more expensive than oil from other areas that are still suffering from excess supply. Transporting oil by rail can add $10 to the price of a barrel of oil, but importing by tanker only adds $2 to $3 per barrel. The rail transport costs have made North Dakota unattractive for refiners. ..."
The EIA expects the Bakken's production to drop by 23,000 barrels in November, a decline
second only to the Eagle Ford in terms of size.
But falling production is contributing to another problem for the region. Several East
Coast refiners are losing interest in Bakken crude, instead preferring to import oil from abroad
to use in their refineries. According to Reuters, it is now cheaper for East Coast refiners
to import oil from South America, Africa, or the Middle East, than it is to buy oil from North
Dakota. The transit costs of moving crude by rail from North Dakota across the country tips the
balance in favor of foreign oil.
... ... ....
The problem is that the drop off in production has eliminated the discount that Bakken oil
traded at to WTI, making it more expensive than oil from other areas that are still suffering
from excess supply. Transporting oil by rail can add $10 to the price of a barrel of oil, but
importing by tanker only adds $2 to $3 per barrel. The rail transport costs have made North
Dakota unattractive for refiners.
... ... ...
Occidental says it sold its North Dakota assets, which it believes will bring in $600 million.
In its third quarter earnings call, Occidental CEO Steve Chazen said that North Dakota simply
isn't as attractive as other shale basins.
"... a break even price for most shale producers is $70-75 / barrel, and at below $50, every single well is losing money. ..."
"... It is and always was a Ponzi scheme: Note the fine print under the WILL 2015 Well Economics graph; All volumes shown are un risked . Thats an SEC ass covering… since these are not RESERVES; thats why WILL calls them volumes not RESERVES . Every shale company presentation Ive seen plays the same game of deception. Having been in this industry for some 45 years as a PE in E P, banking and as a CFO CEO; thats a straight up CON. ..."
"... As long as banks and investors threw money at it (many billions billions), everyone was happy. But when the price collapsed, it unmasked the ugly truth about unconventional risk . If you didnt get your investment before the collapse, its gone. Theres not enough remaining volumes to get you through to a recovery on other side of a collapse since more than half the wells volumes are produced in the first year and with the extremely high decline rate your headed to stripper production rates. ..."
"... Excellent comment, thanks for your insight. Being an old retired oil guy myself, Ive never understood how these shale people get away with defining reserves using their own criteria. Volumes explain it perfectly, they dont have Reserves, they have Volumes. ..."
"... I had seen a projection that when Bakken field density reached 11000 to 12000 wells, drilling results would likely diminish because the best spots would be gone. Current wells drilled are in that neighborhood. Do you have any thoughts on how future results might differ from historic results ..."
"... For the average Bakken well using a similar model breakeven oil price is about $80/b, if natural gas is ignored (so that is different from the analysis in the post.) If we assume about $3/b of income from the sales of natural gas (and reduce OPEX by $3/b to account for this) then the breakeven oil price is $76/b for the average Bakken/TF well. In each case I have assumed the capital cost to complete the well is 8 million dollars. ..."
"... I have never gotten a very good explanation for why these companies can continue to borrow money to drill wells at low oil prices, nor does it seem to be rational economic behavior to drill new wells at such low oil prices. It really seems there should be no new wells drilled, but either the hope is that oil prices will rise or they need to do it to keep the lights on. It would seem to make more sense to just complete all the wells that have been drilled and wait for higher oil prices. ..."
"... If it makes no sense to drill long life conventional reserves at these prices, how can it make any sense to drill short life unconventional plays (from high IPs to stripper production rates)? Because the development costs are 3 or 4 times higher for unconventional plays? Or could it be the attraction of higher but short lived IPs of unconventional plays? That was the luring attraction at $100/B oil. Perhaps the objective is to convert the capital intensive development costs (OPM) and high depletion production rates of these unconventional plays into longer term losses for short term cash flow. The problem with the latter is were well over a year into this down cycle. ..."
I do not have the knowledge to judge the quality of this report, but first impression is a detailed,
stunning analysis of shale oil, answering a lot of difficult questions, and indicating that
a break even price for most shale producers is $70-75 / barrel, and at below $50, every single
well is losing money.
This analysis only covers Bakken / Three Forks plays, but are other plays likely to be different?
The post seems excellent. At some point they stop drilling new wells and wait for higher prices,the
sooner the better for all concerned.
The Bakken is the best US LTO play, other areas would likely have economics that are worse
than the Bakken, my analysis of the Eagle Ford has yielded similar breakeven oil prices as the
Bakken. There is a lot of activity in the Permian basin lately so perhaps the economics are slightly
better there, but that is a simple guess based on no data, simply news reports and rig counts.
Ciaran – is there anything to be read into the fact that most of the high production wells for
2008 were in Mountrail, but currently there are only eight rigs (of 59) operating there, compared
to 27 in McKenzie and 13 in Dunn? That would appear to indicate the sweet spots have been used
up there, but I think you can get ahead of yourself in making such conclusions sometimes.
Excellent job on all the details of what is one of the biggest Energy Ponzi schemes in history.
I spoke with a President of his own oil company in Texas and he won't start looking for oil again
until the price reaches $60-65. And he goes after the conventional stuff, not the resource shale
garbage that really hasn't made a profit in the past five years. And this is when the price of
oil was for the most part, above $100… LOL
I think the major factor that is overlooked in the Energy Market is the amount of debt. This
is also true for the entire market. The massive amount of Debt in the markets cannot continue
to be financed… which is why we have zero interest rates. Even though the Fed raised rates by
a paltry 25 basis points, they are most likely going negative. World can't sustain its massive
debt at normal interest rates. There lies the rub.
I see a bloodbath coming soon to a theater near you in the U.S. Shale Oil & Gas Industry. Time
to place your short bets on the Dead Shale Carcasses before the vultures get to em.
Great work & well presented. Finally, the application of a solid industry standard probability/risk
analysis to Shale Oil plays; and further a comparison to shale oil "promotion" reserve/economics;
it reveals an ugly past and bleak future. The results of excessive promotion (on un-risked "reserve/economics")
securing lots of relatively free capital on abstract "assets".
It is and always was a Ponzi scheme: Note the fine print under the WILL 2015 Well Economics
graph; "All volumes shown are un risked". That's an SEC ass covering… since these are not RESERVES;
that's why WILL calls them "volumes" not "RESERVES". Every shale company presentation I've seen
plays the same game of deception. Having been in this industry for some 45 years as a PE in E&P,
banking and as a CFO CEO; that's a straight up CON.
As long as banks and investors threw money at it (many billions & billions), everyone was
happy. But when the price collapsed, it unmasked the ugly truth about unconventional "risk". If
you didn't get your investment before the collapse, it's gone. There's not enough remaining "volumes"
to get you through to a recovery on other side of a collapse' since more than half the well's
"volumes" are produced in the first year and with the extremely high decline rate your headed
to stripper production rates.
Excellent comment, thanks for your insight. Being an old retired oil guy myself, I've never
understood how these shale people get away with defining reserves using their own criteria. "Volumes
"explain it perfectly, they don't have Reserves, they have Volumes.
Excellent analysis. Thank you.
I had seen a projection that when Bakken field density reached
11000 to 12000 wells, drilling results would likely diminish because the best spots would be gone.
Current wells drilled are in that neighborhood. Do you have any thoughts on how future results
might differ from historic results
.
For the average Bakken well using a similar model breakeven oil price is about $80/b, if
natural gas is ignored (so that is different from the analysis in the post.) If we assume about
$3/b of income from the sales of natural gas (and reduce OPEX by $3/b to account for this) then
the breakeven oil price is $76/b for the average Bakken/TF well. In each case I have assumed the
capital cost to complete the well is 8 million dollars.
I have never gotten a very good explanation for why these companies can continue to borrow
money to drill wells at low oil prices, nor does it seem to be rational economic behavior to drill
new wells at such low oil prices. It really seems there should be no new wells drilled, but either
the hope is that oil prices will rise or they need to do it to keep the lights on. It would seem
to make more sense to just complete all the wells that have been drilled and wait for higher oil
prices.
I am not in the oil industry so I am probably missing something very basic.
The think they know oil prices will rise. You guys would have a blast watching a real meeting
where decisions are made to drill (or not) individual wells.
Fernando, I've certainly been a participant and held many of those meetings, but what I can't
understand is why there's a drilling meeting in the first place at these prices?
By the ND's Directors Cut Bakken producers were receiving an average of $27/B in November when
WTI was at about $37/B.
Though current prices (Jan 2016) "appear" to have recovered some from Dec 2014 lows, WTI Avg
December prices were even worse than Nov.
If it makes no sense to drill long life conventional reserves at these prices, how can
it make any sense to drill short life unconventional plays (from high IP's to stripper production
rates)? Because the development costs are 3 or 4 times higher for unconventional plays? Or could
it be the attraction of higher but short lived IP's of unconventional plays? That was the luring
attraction at $100/B oil. Perhaps the objective is to convert the capital intensive development
costs (OPM) and high depletion production rates of these unconventional plays into longer term
losses for short term cash flow. The problem with the latter is we're well over a year into this
down cycle.
Well written. It's nice to see another geologist here. I wonder what a similar look at the
Eagle Ford and Permian Basin (though a bit more complex than a single formation play) would yield.
Same crap. Management over pays for acreage to make all of these plays look similarly mediocre.
It's different if you start with a blank sheet of paper. In that case you can sit down with the
rights owner and lowball the offer.
Reply
R Walter,
01/04/2016 at 5:33 pm
A mineral owner that has a couple of acres of acreage on a 1280 spacing
can hold out for top dollar or agree to participate, that is not sign the lease agreement at all.
Non-participating has a penalty, after the penalty is paid, you receive 100 percent of the of
oil income from the acreage owned, not just the 1/5 or 1/6 of the oil under the lease agreement.
Non-participating is more or less a decision not to lease and not participate.
You have to remember that the mineral owner owns 100 percent of the oil, not the oil company.
The one way I do see unconventionals possibly working: the operator having the mineral fee
acreage. It's somewhat common here for unconventional wells drilled within the geographic boundaries
of older conventional fields, and I do think it might make enough of an impact to make the wells
profitable. But I don't work unconventional assets so I couldn't say for sure. However, I did
see a decline curve from a Bone Spring well that only had 5 months of production but had already
cum'd 133 mbopd and 211 mmcf, though that's just an outlier of the average well production.
"... The fast adoption of multi-well pad drilling, or the ability to drill several wells from one location, should reduce the average cost per well to $7.5 million on average in 2014, allowing companies to make more off each barrel of oil, Wood Mackenzie analyst Jonathan Garret said. ..."
"... This year, more than 90 percent of wells drilled in the Bakken will be drilled from multi-well pads, Garret said. Multi-well pad drilling is more efficient by reducing the amount of time it takes to drill each well as well as the equipment used. ..."
"... Companies are expected to spend more than $15 billion on drilling and completion in the Bakken and Three Forks formations in 2014, according to the report, a figure that could mean as many as 2,000 new wells in the region. ..."
"... Continental Resources remains the largest player there with over 1.2 million acres. In 2013, the company reported its average costs per well were about $8 million and is targeting costs of $7.5 million this year, which supports Wood Mackenzies projections. ..."
"... Bakken cash crude oil prices at the Clearbrook, Minnesota, hub traded at $3.25 a barrel below U.S. futures, or just under $96 per barrel. ..."
New efficient drilling practices may drive breakeven rates in the best areas of the Bakken shale
oil play as low as $58 per barrel, Wood Mackenzie said on Tuesday, far lower than the traditional
$70 per barrel figure frequently touted by analysts.
The fast adoption of multi-well pad drilling, or the ability to drill several wells from one
location, should reduce the average cost per well to $7.5 million on average in 2014, allowing companies
to make more off each barrel of oil, Wood Mackenzie analyst Jonathan Garret said.
"The major driver of (well cost) reduction has to do with the number of wells drilled from pads,"
Garret said. "You're now drilling 3, 4, 12, even 16 wells from a single pad."
This year, more than 90 percent of wells drilled in the Bakken will be drilled from multi-well
pads, Garret said. Multi-well pad drilling is more efficient by reducing the amount of time it takes
to drill each well as well as the equipment used.
Bakken breakeven prices are closely watched by the industry because, while the development of
the massive shale play has outpaced forecasts in recent years, a lack of pipeline infrastructure
has kept Bakken oil prices relatively low.
The fear is Bakken's production growth, a force driving the U.S. oil renaissance, will slow once
local oil prices reach the breakeven level. North Dakota is home to the largest part of the play
but it also stretches into Montana and over the border to Canada.
A Wood Mackenzie report issued on Monday estimated breakeven costs based on sub-plays. Breakeven
rates in the Sanish basin, one of the best areas of the play, are expected to average $58 per barrel,
while breakeven costs in the Nesson anticline are forecast to be $61 per barrel.
Companies are expected to spend more than $15 billion on drilling and completion in the Bakken
and Three Forks formations in 2014, according to the report, a figure that could mean as many as
2,000 new wells in the region.
Continental Resources remains the largest player there with over 1.2 million acres. In 2013,
the company reported its average costs per well were about $8 million and is targeting costs of $7.5
million this year, which supports Wood Mackenzie's projections.
Smaller players are getting in on the cost benefits as well.
Oasis Petroleum, which has about half a million acres in the Bakken, holds acreage along two typically
less fruitful areas, the Williams county perimeter and sub-play 13, a new play just across the Montana
border, which Wood Mackenzie called the 'Montana Frontier'.
Oasis reported seeing results in these regions that are on par with the best parts of the Bakken.
Bakken cash crude oil prices at the Clearbrook, Minnesota, hub traded at $3.25 a barrel below
U.S. futures, or just under $96 per barrel.
(Reporting by Elizabeth Dilts; editing by Sabina Zawadzki and Andrew Hay)
The Last but not LeastTechnology is dominated by
two types of people: those who understand what they do not manage and those who manage what they do not understand ~Archibald Putt.
Ph.D
FAIR USE NOTICEThis site contains
copyrighted material the use of which has not always been specifically
authorized by the copyright owner. We are making such material available
to advance understanding of computer science, IT technology, economic, scientific, and social
issues. We believe this constitutes a 'fair use' of any such
copyrighted material as provided by section 107 of the US Copyright Law according to which
such material can be distributed without profit exclusively for research and educational purposes.
This is a Spartan WHYFF (We Help You For Free)
site written by people for whom English is not a native language. Grammar and spelling errors should
be expected. The site contain some broken links as it develops like a living tree...
You can use PayPal to to buy a cup of coffee for authors
of this site
Disclaimer:
The statements, views and opinions presented on this web page are those of the author (or
referenced source) and are
not endorsed by, nor do they necessarily reflect, the opinions of the Softpanorama society.We do not warrant the correctness
of the information provided or its fitness for any purpose. The site uses AdSense so you need to be aware of Google privacy policy. You you do not want to be
tracked by Google please disable Javascript for this site. This site is perfectly usable without
Javascript.