Low oil prices and an increasingly
costly war in Yemen have torn a yawning hole in the Saudi budget and created a crisis that has led
to cuts in public spending, reductions in take-home pay and benefits for government workers and a
host of new fees and fines. Huge subsidies for fuel, water and electricity that encourage
overconsumption are being curtailed. ...
"Bonanza Creek Energy Inc and two other energy firms announced on Friday plans
to file for bankruptcy in coming weeks, joining a long list of U.S. energy
companies that have succumbed to a drop in oil prices."
"As of Dec. 14, 114 oil and gas producers had filed for bankruptcy in 2016 with
$57 billion in total debt, more than double the number of filings in 2015, "
"Among companies that provide well-site services to energy exploration firms,
110 had filed for Chapter 11 protection with $17 billion of debt as of Dec. 14,
also more than double the 2015 number, according to Haynes & Boone."
224 total companies, $74 billion total debt – whoo whee, sounds like a lot
of write downs
Dakota Plains Holdings Inc. (NYSE MKT: DAKP) and six of its wholly owned
subsidiaries filed voluntary Chapter 11 petitions in the United States
Bankruptcy Court for the District of Minnesota on Tuesday, December 20,
2016, initiating a process intended to preserve value and accommodate an
eventual going-concern sale of Dakota Plains' business operations.
.
Dakota Plains Holdings Inc. is an integrated midstream energy company
operating the Pioneer Terminal transloading facility. The Pioneer Terminal
is centrally located in Mountrail County, North Dakota, for Bakken and Three
Forks related Energy & Production activity.
Essentially this is very close to BofA Merrill Lynch price prediction. Does not
promise great profitability for shale ;-).
This price might increase the chance of Seneca Cliff.
And does not save KAS from its huge budget deficit (Platt thinks that they need
at least $85 to balance the budget). Russia probably can balance budget at this
price (anything about $55 average will suit)
In February of this year, when WTI was just over US$31, Brandon Blossman
at Tudor Pickering Holt & Co said he expected oil at US$70 by the end of the
year, and at US$90 by the end of next year, commenting on the Colliers International
Trends 2016 Commercial Real Estate Market Update, as quoted by Houston Agent
Magazine.
Raymond James forecast WTI at US$75 in the first quarter next year and at US$80
in the fourth quarter of 2017.
U.S. Energy Information Administration (EIA) expects Brent Crude prices to average
US$51.66 in 2017, with WTI Crude prices averaging US$50.66 next year.
BofA Merrill Lynch – one of the optimistic viewpoints among the investment banks
– said in its 2017 Market Outlook that its forecast for WTI Crude is US$59 and
Brent – at US$61. BofA Merrill Lynch also factors in a rebound of the U.S. shale
patch in its price projections.
How Americans Spent Their Money In The Last 75 Years (In 1 Simple Chart)
Tyler Durden
Dec 25, 2016 11:55 PM
0
SHARES
Consumer spending makes up 70% of the United States economy.
We all have
bills to pay and mouths to feed, but where do Americans spend their money?
Here is a
breakdown
of how Americans spent their money in the last 75 years...
In the chart above, spending is broken into 12 categories:
Reading, alcohol, tobacco, education, personal care, miscellaneous, recreation &
entertainment, healthcare, clothing, food, transportation and housing. Each category is
further broken down into spending by year, from 1941 to 2014, and each category is given
a unique color. The
data were
collected from the Bureau of Labor Statistics
. The data is adjusted for inflation
and measures median spending of all Americans.
Unsurprisingly, housing expenses have almost always been the largest area
of spending in America for over 70 years.
The only exception is 1941, when
spending on food averaged $8,311, whereas spending on housing came to $7,537.
However, in 1941 the government included alcohol in the food spending category, which
inflates the food spending data for that year. In the other years, alcohol was given its
own category. In every other year measured, spending on housing outpaced every other
category.
Another interesting trend is the downward slope of spending on
clothing.
Americans spent the most on clothing in 1961 for an average of
$4,157. In every year measured since 1961, spending on clothing fell, even when
accounting for inflation.
At the same time, Americans began spending more on education,
transportation and healthcare.
Spending on education has increased far more
than any other category, jumping from $242 in 1941 to $1,236 in 2014. Education spending
increased at a particularly fast rate between 1984 and 1994 and onward. While spending
on healthcare increased between 1941 and 2014, overall spending dipped between 1973 and
1984, but then began rising rapidly thereafter.
Between 1941 and 2014 Americans spent money on most of the same
things, with a few changes.
Housing has persisted as a large area of spending
for Americans, as has the food category. However, spending on food and clothing has
fallen when adjusting for inflation while spending on education and healthcare has risen
quickly.
"... "was the most traded contract on Tuesday across the whole ICE Brent market." ..."
"... "That's a relatively cheap lottery ticket," ..."
"... "It's clearly not the consensus in the market that we're going to see a return to those prices any time soon, so it's more likely a hedge against unforeseen geopolitical events during that time." ..."
Oil prices are rising and speculators are already staking out bullish positions on futures for the
next few months, but some traders are rolling the dice on a much bigger price spike in the next two
years.
Some contracts that pay off big time if oil prices hit $100 per barrel by December 2018 just saw
a spike in interest, according to
Bloomberg
. The $100 December 2018 call option, Bloomberg says,
"was the most traded contract
on Tuesday across the whole ICE Brent market."
That contract gives the owner the right to buy
Dec. 2018 futures at $100 per barrel.
Few oil analysts expect oil prices to rise that high within the next two years. The oil market is
still oversupplied, and even with the OPEC deal – which will take 1.8 million barrels per day off
the market if fully fulfilled – the world is still flush with oil sitting in storage. It will take
time to work through those inventories, providing a cushion to a tightening market. However, the
sudden interest in such a remote possibility of a large price spike suggests that investors are growing
more confident that the market is on the upswing.
"That's a relatively cheap lottery ticket,"
Ole Hansen, head of commodity strategy at Saxo
Bank A/S, said in an interview with Bloomberg.
"It's clearly not the consensus in the market
that we're going to see a return to those prices any time soon, so it's more likely a hedge against
unforeseen geopolitical events during that time."
Purchasing these options may not be such a huge risk – Bloomberg says they could cost a bit more
than $1 million while the payoff would be multiples of that if prices happened to go that high. It
is similar to going to Vegas and playing roulette, putting some money on a single number or a few
numbers, which have long odds but huge payouts. On the other hand, the spike in interest in the $100
options could also just be a small part of a broader hedging program from some companies, cropping
up now since the contracts are two years out.
With oil back above $50 per barrel, money managers have become much more bullish on crude. In fact,
collectively, hedge funds and other investors have sold off short bets and purchased long positions,
building up the
most bullish net-long position
in more than two years. OPEC has not yet cut back by a single
barrel, but its Nov. 30 deal in Vienna has succeeded in sparking a bull run for oil.
"... Efforts which led to impoverishment of lower 80% the USA population with a large part of the US population living in a third world country. This "third world country" includes Wal-Mart and other retail employees, those who have McJobs in food sector, contractors, especially such as Uber "contractors", Amazon packers. This is a real third world country within the USA and probably 50% population living in it. ..."
"... While conversion of electricity supply from coal to wind and solar was more or less successful (much less then optimists claim, because it requires building of buffer gas powered plants and East-West high voltage transmission lines), the scarcity of oil is probably within the lifespan of boomers. Let's say within the next 20 years. That spells deep trouble to economic growth as we know it, even with all those machinations and number racket that now is called GDP (gambling now is a part of GDP). And in worst case might spell troubles to capitalism as social system, to say nothing about neoliberalism and neoliberal globalization. The latter (as well as dollar hegemony) is under considerable stress even now. But here "doomers" were wrong so often in the past, that there might be chance that this is not inevitable. ..."
"... Shale gas production in the USA is unsustainable even more then shale oil production. So the question is not if it declines, but when. The future decline (might be even Seneca Cliff decline) is beyond reasonable doubt. ..."
"What is good for wall st. is good for America". The remains of the late 19th century anti
trust/regulation momentum are democrat farmer labor wing in Minnesota, if it still exists. An
example: how farmers organized to keep railroads in their place. Today populists are called deplorable,
before they ever get going.
And US' "libruls" are corporatist war mongers.
Used to be the deplorable would be the libruls!
Division!
likbez -> pgl...
I browsed it and see more of less typical pro-neoliberal sentiments, despite some critique
of neoliberalism at the end.
This guy does not understand history and does not want to understand. He propagates or invents
historic myths. One thing that he really does not understand is how WWI and WWII propelled the
USA at the expense of Europe. He also does not understand why New Deal was adopted and why the
existence of the USSR was the key to "reasonable" (as in "not self-destructive" ) behaviour of
the US elite till late 70th. And how promptly the US elite changed to self-destructive habits
after 1991. In a way he is a preacher not a scientist. So is probably not second rate, but third
rate thinker in this area.
While Trump_vs_deep_state (aka "bastard neoliberalism") might not be an answer to challenges the USA is
facing, it is definitely a sign that "this time is different" and at least part of the US elite
realized that it is too dangerous to kick the can down the road. That's why Bush and Clinton political
clans were sidelined this time.
There are powerful factors that make the US economic position somewhat fragile and while Trump
is a very questionable answer to the challenges the USA society faces, unlike Hillary he might
be more reasonable in his foreign policy abandoning efforts to expand global neoliberal empire
led by the USA.
Efforts which led to impoverishment of lower 80% the USA population with a large part of
the US population living in a third world country. This "third world country" includes Wal-Mart
and other retail employees, those who have McJobs in food sector, contractors, especially such
as Uber "contractors", Amazon packers. This is a real third world country within the USA and probably
50% population living in it.
Add to this the decline of the US infrastructure due to overstretch of imperial building efforts
(which reminds British empire troubles).
I see several factors that IMHO make the current situation dangerous and unsustainable, Trump
or no Trump:
1. Rapid growth of population. The US population doubled in less them 70 years. Currently
at 318 million, the USA is the third most populous country on earth. That spells troubles for
democracy and ecology, to name just two. That might also catalyze separatists movements with two
already present (Alaska and Texas).
2. Plato oil. While conversion of electricity supply from coal to wind and solar
was more or less successful (much less then optimists claim, because it requires building of buffer
gas powered plants and East-West high voltage transmission lines), the scarcity of oil is probably
within the lifespan of boomers. Let's say within the next 20 years. That spells deep trouble to
economic growth as we know it, even with all those machinations and number racket that now is
called GDP (gambling now is a part of GDP). And in worst case might spell troubles to capitalism
as social system, to say nothing about neoliberalism and neoliberal globalization. The latter
(as well as dollar hegemony) is under considerable stress even now. But here "doomers" were wrong
so often in the past, that there might be chance that this is not inevitable.
3. Shale gas production in the USA is unsustainable even more then shale oil production.
So the question is not if it declines, but when. The future decline (might be even Seneca
Cliff decline) is beyond reasonable doubt.
4. Growth of automation endangers the remaining jobs, even jobs in service sector .
Cashiers and waiters are now on the firing line. Wall Mart, Shop Rite, etc, are already using
automatic cashiers machines in some stores. Wall-Mart also uses automatic machines in back office
eliminating staff in "cash office".
Waiters might be more difficult task but orders and checkouts are computerized in many restaurants.
So the function is reduced to bringing food. So much for the last refuge of recent college graduates.
The successes in speech recognition are such that Microsoft now provides on the fly translation
in Skype. There are also instances of successful use of computer in medical diagnostics.
https://en.wikipedia.org/wiki/Computer-aided_diagnosis
IT will continue to be outsourced as profits are way too big for anything to stop this trend.
(nypost.com)
139
Posted by
BeauHD
on Friday December 09, 2016 @09:45PM
from the
hazmat-suit
dept.
An anonymous reader quotes a report from New York Post:
Radiation from
Japan's 2011 Fukushima nuclear disaster
has apparently traveled across the Pacific
. Researchers reported that
radioactive matter -- in the form of an isotope known as cesium-134 -- was
collected in seawater samples from Tillamook Bay and Gold Beach in Oregon. The
levels
were extremely low
, however, and don't pose a threat to humans or the
environment. In 2011, a 9.0-magnitude earthquake triggered a wave of tsunamis
that caused colossal damage to Japan's Fukushima Daiichi nuclear power plant.
The disaster released several radioactive isotopes -- including the dangerous
fission products of cesium-137 and iodine-131 -- that contaminated the air and
water. The ocean was later contaminated by the radiation. But cesium-134 is the
fingerprint of Fukushima due to its short half-life of two years, meaning the
level is cut in half every two years. Cesium-137 has a 30-year half-life.
Particles from Chernobyl, nuclear weapons tests, and discharge from other
nuclear power plants are still detectable -- in small, harmless amounts. While
this is the first time cesium-134 has been detected on US shores, Higley said
"really tiny quantities" have previously been found in albacore tuna. The
Oregon samples were collected by the Woods Hole Oceanographic Institution in
January and February. Each sample measured 0.3 becquerels, a unit of
radioactivity, per cubic meter of cesium-134 -- significantly lower than the 50
million becquerels per cubic meter measured in Japan after the disaster.
(bbc.com)
302
Posted by
BeauHD
on Monday November 28, 2016 @09:05PM
from the
unintended-consequences
dept.
An anonymous reader quotes a report from BBC:
Japan's government estimates
the cost of cleaning up radioactive contamination and compensating victims of
the 2011 Fukushima nuclear disaster
has more than doubled
,
reports say. The latest estimate from the trade ministry put the expected cost
at some 20 trillion yen ($180 billion). The original estimate was for $50
billion, which was increased to $100 billion three years later. The majority of
the money will go towards compensation, with decontamination taking the next
biggest slice. Storing the contaminated soil and decommissioning are the two
next greatest costs. The compensation pot has been increased by about 50% and
decontamination estimates have been almost doubled. The BBC's Japan
correspondent, Rupert Wingfield-Hayes, says it is still unclear who is going to
pay for the clean up. Japan's government has long promised that Tokyo Electric
Power, the company that owns the plant, will eventually pay the money back. But
on Monday it admitted that electricity consumers would be forced to pay a
portion of the clean up costs through higher electricity bills. Critics say
this is effectively a tax on the public to pay the debt of a private
electricity utility.
December U.S. light-vehicle sales are forecast to finish strong enough for
2016 to top 2015's record 17.396 million units. However, actual volume
largely will be determined by results in the final third of the month,
because a major portion of December's deliveries typically occur after
Christmas.
The forecast
17.7 million-unit seasonally adjusted annual rate
is
below November's 17.8 million, but above December 2015's 17.4 million.
...
Despite the drop in December's volume, total 2016 sales will end at 17.41
million units, barely edging out the all-time high set last year.
emphasis added
Here is a table (source: BEA) showing the 5 top years for light vehicle sales
through November, and the top 5 full years. 2016 will probably finish in the
top 3, and could be the best year ever - just beating last year.
Light Vehicle Sales, Top 5 Years and Through November
Saudi Arabia expects to earn 46% more from oil revenues in 2017
compared to this year, with expectations of rising global demand
combining with the OPEC-led global production cut to push prices higher.
In its annual budget unveiled Thursday, the kingdom said its oil revenues
were projected to hit Riyals 480 billion ($128 billion) next year, up
from Riyals 328 billion ($88 billion).
The budget did not reveal any details about Saudi Arabia's oil production
plans or targets, nor does it say what price it expects to receive for
its oil, though it cited the International Monetary Fund's estimate of
2017 oil prices at $50.60/b. Oil prices in 2016 averaged $43/b, the
budget document said.
Overall revenues for 2017, including non-oil revenues, are expected to
rise 31% from 2016 levels to Riyals 692 billion.
With the budget laying out an expenditure plan for Riyals 890 billion
($237 billion), an 8% increase over this year, this means the kingdom
will be facing a deficit of 198 billion riyals ($53 billion), down 33%
from this year, as Saudi Arabia has had to tap into its reserves to
withstand the low oil price environment of the last two years.
"The 2017 budget was prepared in light of developments in the local and
global economy, including the estimated price of oil," the budget
document states, attributing the increases in projected revenues and
expenditures to energy pricing reforms.
"As the kingdom's economy is strongly connected to oil, the decrease in
oil prices over the past two years has led to a significant deficit in
the government's budget and has impacted the kingdom's credit rating."
Total national debt for 2016 was about Riyals 316.5 billion ($84
billion), or 12.3% of projected GDP.
(bbc.com)
243
Posted by
BeauHD
on Friday December 02, 2016 @10:30PM
from the
cease-and-desist
dept.
The mayors of four major global cities -- Paris, Mexico City, Madrid and Athens
-- announced plans to
stop the use of
all diesel-powered cars and trucks by 2025
. The leaders made their
commitments in Mexico at a
biennial meeting of
city leaders
. BBC reports:
At the C40 meeting of urban leaders in
Mexico, the four mayors declared that they would ban all diesel vehicles by
2025 and "commit to doing everything in their power to incentivize the use of
electric, hydrogen and hybrid vehicles." "It is no secret that in Mexico City,
we grapple with the twin problems of air pollution and traffic," said the
city's mayor, Miguel Angel Mancera. "By expanding alternative transportation
options like our Bus Rapid Transport and subway systems, while also investing
in cycling infrastructure, we are working to ease congestion in our roadways
and our lungs." Paris has already taken a series of steps to cut the impact of
diesel cars and trucks. Vehicles registered before 1997 have already been
banned from entering the city
, with restrictions increasing each year until
2020. The use of diesel in transport has come under increasing scrutiny in
recent years, as concerns about its impact on air quality have grown.
The World Health Organization (WHO) says that around
three
million deaths every year are linked to exposure to outdoor air pollution
.
Diesel engines contribute to the problem in two key ways -- through the
production of particulate matter (PM) and nitrogen oxides (NOx). Very fine soot
PM can penetrate the lungs and can contribute to cardiovascular illness and
death. Nitrogen oxides can help form ground level ozone and this can exacerbate
breathing difficulties, even for people without a history of respiratory
problems. The diesel ban is hugely significant. Carmakers will look at this
decision and know it's just a matter of time before other city mayors follow
suit.
Posted by EditorDavid
on Saturday December 17, 2016 @02:34PM
from the
low-energy-nuclear-reactions
dept.
An anonymous reader writes:
Scientific American magazine has published a
guest column on low-energy nuclear reactions (LENR) [putting] into context the
history of what was mistakenly referred to as cold fusion and what happened.
The bottom line is that
there is compelling cumulative evidence for nuclear reactions taking place
,
including shifts in the abundance of isotopes, element transmutations, and
localized melting of metals. Furthermore, those reactions do not have the
characteristics of either nuclear fission or nuclear fusion. Despite sharp
criticism from much of the scientific community after the 1989 announcement by
Fleischmann and Pons, the Department of the Navy's Space and Naval Warfare
Systems Center and other reputable organizations continued the research and
published many papers.
The article reports that "to the surprise of many
people, a new field of nuclear research has emerged," adding that even in the
early 20th century, atomic scientists were already reporting "inexplicable
experimental evidence of elemental transmutations."
(newatlas.com)
156
Posted by
BeauHD
on Monday November 28, 2016 @08:25PM
from the
one-man's-trash-is-another-man's-treasure
dept.
Scientists at the University of Bristol have
found a way to
convert thousands of tons of nuclear waste into man-made diamond batteries
that can generate a small electric current for thousands of years. New Atlas
reports:
How to dispose of nuclear waste is one of the great technical
challenges of the 21st century. The trouble is, it usually turns out not to be
so much a question of disposal as long-term storage. Disposal, therefore is
more often a matter of keeping waste safe, but being able to get at it later
when needed. One unexpected example of this is the
Bristol team's work on a major source of nuclear waste from Britain's aging
Magnox reactors
, which are now being decommissioned after over half a
century of service. These first generation reactors used graphite blocks as
moderators to slow down neutrons to keep the nuclear fission process running,
but decades of exposure have left the UK with 104,720 tons of graphite blocks
that are now classed as nuclear waste because the radiation in the reactors
changes some of the inert carbon in the blocks into radioactive carbon-14.
Carbon-14 is a low-yield beta particle emitter that can't penetrate even a few
centimeters of air, but it's still too dangerous to allow into the environment.
Instead of burying it, the Bristol team's solution is to remove most of the
c-14 from the graphite blocks and turn it into electricity-generating diamonds.
The nuclear diamond battery is based on the fact that when a man-made diamond
is exposed to radiation, it produces a small electric current. According to the
researchers, this makes it possible to build a battery that has no moving
parts, gives off no emissions, and is maintenance-free. The Bristol researchers
found that the carbon-14 wasn't uniformly distributed in the Magnox blocks, but
is concentrated in the side closest to the uranium fuel rods. To produce the
batteries, the blocks are heated to drive out the carbon-14 from the
radioactive end, leaving the blocks much less radioactive than before. c-14 gas
is then collected and using low pressures and high temperatures is turned into
man-made diamonds. Once formed, the beta particles emitted by the c-14 interact
with the diamond's crystal lattice, throwing off electrons and generating
electricity. The diamonds themselves are radioactive, so they are given a
second non-radioactive diamond coating to act as a radiation shield.
(arstechnica.com)
351
Posted by
BeauHD
on Monday November 28, 2016 @05:00PM
from the
whole-is-greater-than-the-sum-of-its-parts
dept.
An anonymous reader quotes a report from Ars Technica:
Last week the
Environmental Protection Agency (EPA) announced its
final renewable fuel standards for 2017
, requiring that fuel suppliers
blend an additional 1.2 billion gallons of renewable fuel into U.S. gas and
diesel from 2016 levels
. The rule breaks down the requirements to include
quotas for cellulosic biofuels, biomass-based diesel, advanced biofuel, and
traditional renewable fuel. Reuters points out that the aggressive new biofuel
standards will
create a dilemma
for an incoming Trump administration, given that his
campaign courted both the gas and corn industries. While the EPA under the
Obama administration has continually increased so-called renewable fuel
standards (RFS), the standards were first adopted by a majority-Republican
Congress in 2005 and then bolstered in 2007 with a requirement to incorporate
36 billion gallons of renewable fuel into the fuel supply by 2022, barring "a
determination that implementation of the program is causing severe economic or
environmental harm," as the
EPA writes
. Some biofuels are controversial not just for oil and gas
suppliers but for some wildlife advocates as well. Collin O'Mara, CEO of the
National Wildlife Federation, said in a statement that the corn ethanol
industry that most stands to benefit from the EPA's expansion of the renewable
fuel standards "is responsible for the destruction of millions of acres of
wildlife habitat and degradation of water quality." Still, the EPA contends
that biofuels made from corn and other regenerating plants offer reductions in
overall fuel emissions, if the processes used to make and transport the fuels
are included. "Advanced biofuels" will offer "50 percent lifecycle carbon
emissions reductions," and their share of the new standards will grow by 700
million gallons in 2017 from 2016 requirements, the EPA says. Cellulosic
biofuel will be increased by 81 million gallons and biomass-based diesel will
be increased by 100 million gallons. "Non-advanced or 'conventional' renewable
fuel" will be increased to 19.28 billion gallons from 18.11 billion gallons in
2016. Conventional renewable fuel "typically refers to ethanol derived from
corn starch and must meet a 20 percent lifecycle GHG [greenhouse gas] reduction
threshold," according to EPA guidelines. Other kinds of renewable fuels include
sugarcane-based ethanol, cellulosic ethanol derived from the stalks, leaves,
and cobs leftover from a corn harvest, and compressed natural gas gleaned from
wastewater facilities.
"... Every OPEC nation is now producing at absolute maximum capacity. With the exception of the two countries, Libya and Nigeria, that have political production problems, they are all overproducing their reservoirs. They are doing this so when they are "forced" by OPEC to cut production, they can just cut back to normal production. ..."
"... People who still talk about "OPEC spare capacity" haven't a clue as to what the hell they are talking about. ..."
"... "Ultimately, our work on Saudi Arabia's fiscal balance suggests that the kingdom has a strong incentive to cut production to achieve a normalization of inventories, even if it requires a larger unilateral cut, consistent with comments last weekend by the energy minister," Goldman said in a note. ..."
OPEC oil production
comes primarily from conventional reservoirs. These reservoirs require
reservoir pressure management. Some have suggested that Saudi Arabia's
rationale for cutting production was to reverse the reservoir damage that
overproduction has, or may have, caused. Preservation of reservoir integrity
may ultimately limit "immediate" increases to inventories from OPEC.
Okay, will someone please tell me how Saudi Arabia could have any "spare
capacity" at all if their reservoirs have been damaged from overproduction? If
they are overproducing their reservoirs now, then to produce even more "spare
capacity", they would have to over-overproduce those reservoirs. That would be
an absurd proposal.
Every OPEC nation is now producing at absolute maximum capacity. With the
exception of the two countries, Libya and Nigeria, that have political
production problems, they are all overproducing their reservoirs. They are
doing this so when they are "forced" by OPEC to cut production, they can just
cut back to normal production.
People who still talk about "OPEC spare capacity" haven't a clue as to what
the hell they are talking about.
One of the biggest obstacles to Saudi Arabia's planned initial public
offering (IPO) for state oil giant Saudi Aramco has been the sensitive
requirement to subject Saudi oil reserves to public regulatory scrutiny. But
in an unconventional move, Riyadh is considering an approach to exclude
reserves from any formal accounting of Aramco's assets, according to
Petroleum Intelligence Weekly. Instead, it wants to value the company based
on financial returns from production over a period of years or decades.
While this approach risks lowering the valuation of the company and limiting
the foreign exchanges where it could have a listing, it has the advantage of
preserving an important state secret. The argument for this approach is that
the state owns the reserves, not Saudi Aramco, which is the monopoly
producer.
.
The reserves issue was always going to be thorny, and the current thinking
is to derive the value of the IPO from the value created from each barrel
produced, based on a revised tax and royalty scheme that the company has
been working on for months, according to Saudi industry sources. Investors
will be presented with details about Aramco's 12 million barrel per day
production capacity, which for the time being will not be expanded, its
average yearly production and profit per barrel - or "economic rent." Aramco
will only provide the unaudited 261 billion barrels of reserves that it
publishes in its annual reports, and uses in a bond prospectus, as it did in
October.
The justification for this unusual approach to the IPO is that Aramco does
not own the reserves, the state does. And while Aramco has a monopoly to
produce those barrels, it does not have the right to reveal what are the
kingdom's most important assets and a closely guarded secret. Inevitably, a
decision to avoid vetting reserves will reinforce suspicions by those that
already think Saudi Arabia has something to hide.
Goldman Sachs raised Friday its oil price forecasts for 2017 after
reassessing the likelihood that key global oil producers, led by Saudi
Arabia, will stick to output cut pledges under OPEC's efforts to clear the
oil market glut.
After analyzing Saudi Arabia's fiscal revenue outlook for 2017, the bank
said it sees the motivation for an average 84% compliance with the announced
collective OPEC and non-OPEC production cuts which it estimates at a total
1.6 million b/d.
"Ultimately, our work on Saudi Arabia's fiscal balance suggests that the
kingdom has a strong incentive to cut production to achieve a normalization
of inventories, even if it requires a larger unilateral cut, consistent with
comments last weekend by the energy minister," Goldman said in a note.
Saudi energy minister Khalid al-Falih on Saturday said his country was
prepared to slash production below 10 million b/d, after having previously
agreed to cut down to 10.058 million b/d.
Saudi Arabia expects to earn 46% more from oil revenues in 2017
compared to this year, with expectations of rising global demand
combining with the OPEC-led global production cut to push prices higher.
In its annual budget unveiled Thursday, the kingdom said its oil revenues
were projected to hit Riyals 480 billion ($128 billion) next year, up
from Riyals 328 billion ($88 billion).
The budget did not reveal any details about Saudi Arabia's oil production
plans or targets, nor does it say what price it expects to receive for
its oil, though it cited the International Monetary Fund's estimate of
2017 oil prices at $50.60/b. Oil prices in 2016 averaged $43/b, the
budget document said.
Overall revenues for 2017, including non-oil revenues, are expected to
rise 31% from 2016 levels to Riyals 692 billion.
With the budget laying out an expenditure plan for Riyals 890 billion
($237 billion), an 8% increase over this year, this means the kingdom
will be facing a deficit of 198 billion riyals ($53 billion), down 33%
from this year, as Saudi Arabia has had to tap into its reserves to
withstand the low oil price environment of the last two years.
"The 2017 budget was prepared in light of developments in the local and
global economy, including the estimated price of oil," the budget
document states, attributing the increases in projected revenues and
expenditures to energy pricing reforms.
"As the kingdom's economy is strongly connected to oil, the decrease in
oil prices over the past two years has led to a significant deficit in
the government's budget and has impacted the kingdom's credit rating."
Total national debt for 2016 was about Riyals 316.5 billion ($84
billion), or 12.3% of projected GDP.
Growth in African Energy Demand – If you build it they will come: Top line energy consumption
on the continent is growing by about 2% per annum as infrastructure spending multiplies. A growing
middle class is buying wheels and appliances. We've seen this movie before. The billion people
living in the sub-Sahara are embracing joules generated by oil and gas in greater quantities than
any other primary source (Figure 1). Is Africa the new China-and-India?
Escalating Oilfield Service Costs – Oil producers have been smug about how they have cut
their costs by 20 to 30% over the past two years. But much of that has been accomplished by crippling
the margins of the oilfield service sector. Rising rig counts are already germinating the first
hints of oilfield inflation. If costs escalate again, $60/B may not be the new $90 (see past blog
"$60 is in Style For Now").
In a
Reuters
poll of 29 analysts and economists carried out after the OPEC deal, Raymond James had the highest
2017 forecast for Brent price, at US$83 per barrel, while the poll saw Brent averaging US$57.01
next year.
...The market is likely to
move into deficit
in the first half next year by an estimated 600,000 bpd, said the
International Energy Agency (IEA), as long as OPEC and non-OPEC producers manage to (and are
willing to) stick to promised cuts.
... ... ...
At oil above US$55 next year, energy consultancy
Wood Mackenzie
sees the oil and gas
industry turning cash flow positive for the first time since the downturn, and expects 2017 will
be a year of "stability and opportunity" for the sector.
...(EIA) expects Brent Crude prices to average US$51.66 in 2017, with WTI Crude prices
averaging US$50.66 next year.
...BofA Merrill Lynch - one of the optimistic viewpoints among the investment banks – said in
its 2017 Market Outlook that its forecast for WTI Crude is US$59 and
And while the Saudis believe the country's budget deficit will fall modestly next year
even with an increase in spending
, it is still set to be a painful 8% of GDP
suggesting the Saudi cash burn will continue even with some generous oil price
assumptions
.
The budget deficit for 2017 is expected decline 33% to 198
billion riyals ($237 billion), or 7.7% of GDP, from 297 billion riyals or 11.5% of GDP
in 2016 year and 362 billion riyals in 2015, the Finance Ministry said in a
statement
on its website
on Thursday. In 2016, the finance ministry said its spending of 825
billion riyals ($220 billion) was under the budgeted 840 billion, and the 2016 budget
deficit came to 297 billion, below the 362 billion in 2015.
"... ...in 2016, 96 percent of all new vehicle sales featured a combustion engine. IHS Markit estimates the average vehicle life globally to be about 15 years, which means that the impact of new vehicle technologies is expected to take time to materially affect the vehicle fleet and overall fuel demand. ..."
...in 2016, 96 percent of all new vehicle sales featured a combustion engine. IHS Markit
estimates the average vehicle life globally to be about 15 years, which means that the impact of
new vehicle technologies is expected to take time to materially affect the vehicle fleet and
overall fuel demand.
Proved reserves of crude oil in the U.S. declined by 4.7 billion barrels or 11.8 percent from
their year-end 2014 level to 35.2 BBbls at year-end 2015. Natural gas proved reserves decreased
64.5 Tcf to 324.3 Tcf, a 16.6 percent decline.
... ... ...
Proved reserves are volumes of oil and natural gas that geological and engineering data
demonstrate with reasonable certainty to be recoverable in future years from known reservoirs
under existing economic and operating conditions.
"U.S. Rig Count Up on Land, Flat Offshore
permian"
By MarEx...2016-12-16
"For the seventh week in a row, the benchmark Baker Hughes Rig Count trended upwards, bringing
the combined count of active oil and gas rigs in the U.S. to 637. However, only 22 of these were
offshore rigs, essentially unchanged from the same period last year.
The largest part of the onshore increase was in Texas, where activity in the Permian Basin and
Eagle Ford fields has brought the state's count by 14 rigs in one week. Taken together, the
Permian and Eagle Ford accound for nearly half of U.S. drilling activity, with 302 rigs between
them. Compared with offshore projects, onshore shale drilling campaigns like those in the Eagle
Ford are remarkably inexpensive and brief; a shale well's breakeven price point is typically in
the range of $30-40, depending on the field, and it is often a matter of weeks between setting up
a rig and pumping first oil.
West Texas Intermediate crude prices were at $52 per barrel on Friday, well above the price
point that would induce shale producers to begin new drilling, analysts say. In addition, Goldman
Sachs raised its outlook for crude oil prices for mid-2017, predicting WTI prices at $57.50 by
the second quarter. Goldman cited the recent OPEC and non-OPEC agreements to cut production by
1.6 million barrels per day, and said that it expects compliance with the cut agreement in excess
of 80 percent.
However, assuming that the OPEC agreement holds and that competitors do not raise output to
offset it, a price of $57.50 is still below the level at which many offshore projects become
competitive, says Wood Mackenzie. In July, the firm found that only 20 percent of deep- and
ultra-deepwater projects at the pre-FID stage are commercially viable at $60 per barrel –
suggesting that offshore activity may remain quiet until prices rise further."
"... What's shocking about that chart AlexS is that even with the sharp price increases of oil between 2000 and 2014, the oil R/P ratio has still steadily declined. With investment having been crushed in the last few years, looks like we are facing a Seneca cliff. ..."
The situation with global natural gas is different.
1) There is significant spare capacity in a number of countries. For
example, Russia has reduced gas production in the past few years due to
falling demand from Europe, but can easily increase it if demand returns.
2) There are significant developed and undeveloped proven reserves.
Reserves/production ratio is much higher for natural gas (see the chart
below).
3) Natural gas resources are generally explored less than oil. Potential
for increase in proven reserves is much bigger for natural gas.
The countries and regions with significant resource potential and able to
sharply increase production include: Iran, U.S., Russia, East Mediteranean,
several countries in Asia (including China).
Several countries in Africa are not producing at full potential.
Global proven reserves / production ratio for oil and natural gas
source: BP Statistical Review of World Energy 2016
What's shocking about that chart AlexS is that even with the sharp price
increases of oil between 2000 and 2014, the oil R/P ratio has still
steadily declined. With investment having been crushed in the last few
years, looks like we are facing a Seneca cliff.
The chart is named "Annual conventional oil and gas volumes discovered".
Onshore Canada production is dominated by oil sands; US lower-48 onshore
– by tight oil.
Conventional output in both cases is from mature fields; and there were
no major conventional discoveries for many years.
US shallow-water GoM is also a mature province. New discoveries were
made in deepwater GoM.
Norway 2001 ..3.2 .1.6 +14.4
U.K. 1999 ..2.7 .1.5 -22.0
Sum .. 5.9 .3.1 .0.0
U.S. DOE/EIA's Projections
Norway ..2005 .3.9 .3.7 +97.9
U.K. ~2006 3.3 .3.0 ..+143.9
Sum .. 7.2 .6.7 ..+116.1
Actual Production Values
From U.S. DOE/EIA
Norway ..2001 .3.226 1.87
U.K. .. 1999 .2.684 1.23
Sum .. 5.91 3.1
The 2010 values for the US DOE/EIA are based upon an interpolation between the peak projected
values and the 2020 projected values
Actual Production data is based upon data from the US DOE/EIA
Mexican Oil Production
In 2003, the U.S. DOE/EIA was projecting that total liquid hydrocarbons production (crude oil
+ condensate + liquefied petroleum gas + biofuels + refinery gain) for Mexico would rise above
4.2 mb/d by 2010. Specifically, here is what they stated in their International Energy Outlook
2003:
"Mexico is expected to adopt energy policies that will encourage the efficient development
of its resource base. Expected production volumes in Mexico exceed 4.2 million barrels per day
by the end of the decade and remain near that level through 2025."
It was clear by 2003 that Cantarell complex oil production (crude oil + condensate) would start
declining in approximately 2005. Since the Cantarell complex produced about 60% of Mexico's oil
production in 2002, it appeared obvious that as Cantarell complex oil production started declining,
it would bring down Mexico's oil production as well as its total liquid hydrocarbons production.
Mexico's oil production peaked in 2004 at 3.48 mb/d. By 2010, it was down to 2.62 mb/d, a decline
of ~860,000 b/d. In 2010, Mexico's total liquid hydrocarbons production was down to 2.98 mb/d
according to US DOE/EIA data. The U.S. DOE/EIA was high by at least 1.22 mb/d for their 2010 Mexican
production forecast.
The Oil Mystery Behind Saudi Arabia's Production Cut
By
Nick Cunningham
- Dec 15, 2016, 4:56 PM CST
Saudi Arabia surprised the world by helping to engineer an unexpectedly
strong agreement from OPEC members to cut production by 1.2 million
barrels per day, followed by
additional cuts from non-OPEC members. While the two agreements
incorporate cuts from a wide range of oil producers, Saudi Arabia will do
much of the heavy lifting, cutting nearly 500,000 barrels per day and
even promising to go further than that should the markets warrant steeper
reductions.
Depending on one's perspective, Saudi Arabia demonstrated
its diplomatic prowess and made OPEC relevant again, succeeding in
talking up oil prices without sacrificing much. After all, Saudi Arabia
often lowers production in winter months. Other analysts look at it a
different way – Riyadh was actually pretty desperate for higher oil
prices, given the toll that the two-year bust has taken on the country's
economy. That led Saudi Arabia to shoulder most of the burden of
adjustment, achieving only small concessions from other OPEC members,
most notably Iran. Riyadh was the big loser of the deal, the thinking
goes, but ultimately had no choice as the government needed higher oil
prices.
There are arguments to made for both sides, but then there is a third
possibility: Saudi Arabia was motivated to pullback because it was
actually leaning on its oilfields too hard this year when it pushed
output up to 10.7 million barrels per day, an output level that might
have strained the reservoirs of some of its largest fields. Producing too
aggressively can ultimately damage the long-term recovery of oil
reserves. Reuters reports in an
exclusive report that Saudi Aramco could have been pushing its oil
fields to the limit this year, and had little choice to but to climb down
from record high output levels.
Instead of switch to
hybrids and smaller cars as well as using nat gas for local city tranport they are trying to comsume
as much as possible. Without high tax of SUVs and opther "oil waisting" personal tranporation
veiches it is impossible to sustain the US economy. the only question is when it falls from the
cliff.
I've never understood the urgency of using up US oil so quickly. Better to buy someone else's at
a cheap price and save ours for a time when it is depleted elsewhere.
Its' not only the USA. KAS, Iran and Russia are doing
the same. There are a lot of short termism obsessed
politicians besides Obama administration
Especially KAS in 2014-2016. Who were instrumental
in the current oil price crash.
But behavior of the Iran and Russia was also
deplorable. Iran decided to get back its former market
share at all costs. But they like KAS are governed by
religious fanatics, so what we can expect?
At the same time Russia, which theoretically should
be a rational player and have enough space and steel to
build huge national oil reserves, using it as
alternative currency reserves, did nothing. Instead
Russia also increased oil production selling its
national treasure left and right, while prices were
hovering below $50.
Another bunch of short termism obsessed suckers. So
much about Putin as a great statesman. And what he got
in return for his stupidity - only additional sanctions
and allegations that he fixed elections for Trump. Such
a huge payoff.
IMHO of big oil producing nations only China behaved
rationally.
Oil is not renewable resource and burning it in
large SUVs and small trucks carrying one person to
commute to work is a suicide. That's what the USA is
doing on the national scale. Add to this all those wars
for the expansion of the US neoliberal empire, the USA
is fighting, which also consume large amount of oil and
it looks even worse. See
http://www.ucsusa.org/clean_vehicles/smart-transportation-solutions/us-military-oil-use.html
The U.S. military is the largest institutional
consumer of oil in the world. Every year, our armed
forces consume more than 100 million barrels of oil
to power ships, vehicles, aircraft, and ground
operations-enough for over 4 million trips around
the Earth, assuming 25 mpg.
So out of the total US oil consumption (let's say 20
MB/day) around 0.3 MB/day is consumed by military. I
think that the figure in reality might be twice larger
that cited as it is not clear how consumption of planes
operating in Iran, Syria, Libya, Yemen (and generally
outside the USA) is counted. But even 0.3 Mb/day is
approximately the same amount that Greece, or Sweden,
or Philippines are consuming. The latter is a country
with over 100 million people.
In twenty-forty years this period would probably be
viewed as really crazy.
"... Saudi Arabia could produce more but it would likely come at the expense of optimal reservoir practices. They could certainly bring on new fields but this is a lengthy process (years) and expensive as well ..."
"... So far the kingdom is not adding any significant new producing capacity based on project announcements and rig activity but rather replacing the aforementioned 4 to 6 percent annual decline rate. ..."
"... As the chart below shows, in the past 2 years Saudi Arabia increased oil production by about 1 mb/d. The country was the main contributor to the current oil glut over that period. Now the Saudis pledge to remove from the market about half of this incremental supply. ..."
Article in Reuters explaining Saudi Arabia's shift from output maximization / market share defending
to price support policy.
There are also estimates of Saudi oil production capacity.
Cost of pump-at-will oil policy spurred Saudi OPEC U-turn
Saudi Arabia has long said it could produce as much as 12 million barrels per day (bpd) of
oil if needed, but that pump-at-will claim – which would require huge capital spending to access
spare capacity – has never been tested.
Sources say the kingdom may have stretched its current limits by extracting a record of around
10.7 million bpd this year, which could be one reason why Riyadh pushed so hard for a global deal
to cut production.
..
With tight resources, Saudi Arabia found itself weighing the prospect of investing billions of
dollars to raise oil output further if it wanted to gain more market share under a strategy adopted
in 2014.
Instead, cutting production amid a global glut and low prices to take the pressure off its oilfields,
secure better reservoir management and save itself unnecessary expenses, seemed the perfect deal.
"You invest in raising your production when prices are high, not when they are low," a Saudi-based
industry source said.
"Choices are tougher now. The question is, would the Saudi government with its tight budget put
huge investment in raising production or put it somewhere else where it's needed more?"
Under the deal, Saudi Arabia, de facto leader of the Organization of the Petroleum Exporting Countries,
will from January cut output to around 10 million bpd – well below the 12 million bpd that the
state has affirmed it can produce.
Saudi-based industry sources and market insiders say the kingdom cannot sustain historically high
output for long. State oil giant Saudi Aramco has never tested 12 million bpd and would find it
hard to keep the needed investments flowing with current low oil prices, they said.
Aramco, responding to a Reuters request for comment, said only that the company does not comment
on current production levels.
One source familiar with Aramco production management said the firm's capacity stood at 11.4 million
bpd and it was still working to boost that figure to 12 million by 2018.
"Twelve million bpd has been planned since 2008-2010 and every annual budget worked towards that
goal," the source told Reuters on condition of anonymity.
To achieve that goal, the company has annual operating expenses (opex) of $20 billion and capital
expenditure (capex) at around $40 billion, the source said.
"When the 12 million bpd plan is achieved
by 2018, the overall capex will fall to $20 billion," he added.
Aramco does not disclose its opex or capex figures.
SHIFT IN THINKING
In a note to clients in May, U.S. consultancy PIRA estimated Saudi Arabia's instantly available
capacity at that time at 10.5 million bpd, after tracing expansion plans since 2008 and calculating
an annual decline rate of 4 percent.
"Saudi Arabia could produce more but it would likely come at the expense of optimal reservoir
practices. They could certainly bring on new fields but this is a lengthy process (years) and
expensive as well," PIRA wrote.
"So far the kingdom is not adding any significant new producing capacity based on project announcements
and rig activity but rather replacing the aforementioned 4 to 6 percent annual decline rate."
Saudi oil officials have said they can produce up to 12 million or even 12.5 million bpd if needed,
particularly in the event of a sudden, global supply disruption.
Some say it is not a question of whether Saudi can do it, it is a matter of how soon.
Former oil minister Ali al-Naimi had said that to reach 12 million, Saudi Aramco would need 90
days to move rigs from exploration work to drill new wells and raise production.
Saudi Arabia has been working for most of this year towards boosting prices, rather than leaving
that job to market forces, a shift from the strategy it had championed since November 2014.
The pain of cheap oil was enough to bring other producers to the negotiating table, but industry
sources said the kingdom was also keen to seal a deal as it plans to offload a stake in Aramco
by 2018.
-----------------
My comment:
According to OPEC agreement, the Saudis pledged to cut supply by 486 kb/d from a reference
production level of 10,544 kb/d to 10,058 kb/d. According to Saudi official sources (shown as
"direct communication' in OPEC's monthly report), the country's crude output reached record level
of 10,720 kb/d in November. According to the IEA's estimate and Reuters survey, Saudi output was
also higher in November vs. October. By contrast, estimates from "secondary sources" (also shown
in OPEC's MOMR), indicate a slight decline to 10,512 kb/d.
In any case, important to note that in 2016, unlike the previous years, KSA's output has stayed
at elevated levels in 4Q despite the usual seasonal decline in winter when domestic consumption
of crude burning for power is less. Saudi crude exports have also been high in recent months.
Earlier this month, KSA cut January oil price to Asia to four-month low to keep market share.
It seems that the Saudis are trying to sell as much crude as they can before the planned cuts.
Meanwhile, Saudi Arabia has informed its clients in North America and Europe that their crude
oil deliveries in January will be lower, to reflect the country's compliance with the production
cut agreed by OPEC members.
As the chart below shows, in the past 2 years Saudi Arabia increased oil production by about
1 mb/d. The country was the main contributor to the current oil glut over that period. Now the
Saudis pledge to remove from the market about half of this incremental supply.
Saudi Arabia oil output and agreed production quota (mb/d)
source: OPEC Monthly Oil Market Report, December 2016
The IEA's estimate from its Oil Market Report shows an even bigger growth: by 300 kb/d to 34.20 mb/d,
led by increases from Angola along with Libya and Saudi Arabia. The group's output stood 1.4 mb/d
higher than a year ago.
https://www.iea.org/oilmarketreport/omrpublic/
China's crude oil production increased 3.6% in November from the previous month to about 3,915
kb/d, the highest since July.
Output was down 382 kb/d (8.9%) from the same month last year.
Crude production has fallen 294 kb/d (6.9%) in the first 11 months of 2016 to 3,984 kb/d.
Comment
from Bloomberg:
"China's output has declined this year as state-owned firms shut wells at mature fields that
are too expensive to operate at current prices. The country needs oil above $50 a barrel to stabilize
production, according to analysts at Sanford C. Bernstein, as well asFu Chengyu, the former chairman
of both Cnooc Ltd. and China Petroleum & Chemical Corp. Production is forecast to drop 335,000
barrels a day this year, followed by a further slide next year of 240,000 barrel a day, the International
Energy Agency said Tuesday.
"November's output pickup is probably just a blip, which won't likely persist," said Gao Jian,
an analyst with Shandong-based industry consultant SCI International. "For the next six months,
unless oil prices stay above $50 a barrel, we we won't see solid recovery."
The rise in production last month was in anticipation of higher crude prices amid OPEC meetings,
said Amy Sun, an analyst with Shanghai-based commodities researcher ICIS-China.
China's annual crude output is seen falling to 200 million tons this year (about 4 million
barrels a day), down roughly 7 percent from nearly 215 million tons last year, according to estimates
from SCI International and ICIS-China."
Yes, the US clearly needs some kind of energy policy, and I think one thing that highlights
how badly this is needed is the ability of anyone who can raise the money to be able
to drill 96 horizontal wells in one section of land (two if the laterals are the two
mile variety).
But, I guess any mention of conservation in the US industry these days
is heresy.
I would not be too critical of Chinese production falling. Seems to me they are buying
up all the cheap oil they can from overproducing nations, and storing it. Makes sense
to me.
The OPEC production agreement, which we called correctly, has already helped hoist the profitable
oil stocks we held, but what about 2017? One way I've looked at oil and oil stocks is by looking at
the crude curve – the differentials between monthly contract prices. And a recent big move in the
curve makes 2017 look very positive indeed.
I've seen all kinds of futures curves in my 30+ years of trading oil, and many analysts believe that
the crude curve is really predictive of the future –but more often than not, it is merely an outline
of what traders and hedgers are thinking.
here's a look at Thursday's curve:
... ... ...
These numbers represent an enormous change from the numbers we saw even two weeks ago, before the
big OPEC deal in Vienna. Since 2014, we had been seeing a deep contango market, where oil prices in
the future were a lot higher than where they were trading in the front (present) months. But what
does a contango market mean?
Many like to look at contango markets as a signal of crude storage, and that has merit – but I like
to look at the curve through the eyes of its participants: when the oil market is collapsing, as it
has been since 2014, players in the futures markets know that the costs of oil recovery fall well
above the trading price, and will buy future oil contracts banking on a recovery. This drives buying
interest away from the present and into the future and creates our contango. This kind of market is
dominated by the speculators, who are willing to buy (bet) on higher prices later on.
In contrast, the hedging players are in retreat in busting markets, dropping capex and working wells
and trying merely to survive to see the next boom. It's when prices begin to recover and they gain
confidence in future prices that they try to hedge and plan for the coming up-cycle. This is when
speculators, if they are buying, are likely to move closer to the front months if they're buying
while producers (commercials) are looking to sell futures 12-24 months out. Suddenly, you have a
curve that is being more dominated by commercial players, selling back months and creating the
backwardation we're starting to see right now.
You may remember that I was able to nearly predict this year's bottom in oil prices by looking
for that flattening move of the crude curve in February. This latest move from a discount to a
premium curve has moved more than two dollars in the last week alone. This gives me added confidence
in oil prices for 2017:
Let's look, as a practical matter, why a premium (backwardated) market is absolutely REQUIRED to
see a long-term recovery in oil.
Imagine you're a shale producer and you've seen prices move from $45 to $52. You've been waiting for
a move like this to restart some non-core acreage that you could have working by the middle of 2017.
With a deep contango market, you might have gotten $55 or even more for a hedged barrel of crude in
June of 2017.
But you're not alone in looking to come out of your bunker, hedge some forward production and
restart some idle wells – every other producer is trying to do the same thing. If all of you could
depend on a future premium, every producer would hedge out new production and ultimately add to the
gluts that have been already slow to disappear.
Related: The OPEC Effect? U.S. Rig Count Spikes Most In 31 Months
If you think about it, a premium market works to DISCOURAGE fast restarts and quick restoration of
gluts that a two-year rebalancing process has only slowly managed to fix – and this is a good thing.
Producers have to be wary of adding wells so quickly, even in a market that is clearly ready to
again rise in price. In a truly backwardated market, the futures work to keep the rebalancing
process on track and production increases slow. That governor on production is the key to keeping a
rallying market strong, and the frantic addition of wells at a minimum.
The proof of all this is in the type of curves we see depending on how the markets are trading.
Now, take another look at the December-December spread chart I put up and you'll see that a Contango
market was a critical component to the bull markets we saw in oil prior to 2014. Unless something
very strange is happening, a Contango curve is indicative of a strong market, while a backwardated
one indicates a market under pressure. It's something I've watched closely for more than 30 years to
help me find major trends.
And convinces me today that oil will have a constructive 2017.
"... its amazing to me, given how many times we have caught the shale oil industry lying thru its teeth, how many people (EIA and the NDIC) still believe everything it says about itself: http://www.worldoil.com/news/2016/9/22/analyst-touts-industry-s-cost-reductions-in-us-shale-plays ..."
"... "Technically" recoverable reserves is a wild ass guess based on volumetric calculations of shale OOIP over a hypothetical homogeneous area in all the producing basins throughout the country that has absolutely nothing to do with reality. Reality is that only about 5-6% of that oil is recoverable thru primary means, not 74%. ..."
"... as we have seen in the past, poor economics did not deter sharp growth in LTO production. It seems that financial markets are ready to resume funding of the shale sector, although more cautiously than in 2011-14. And shale companies are already announcing their growth plans for next year. ..."
"... I expect growth in LTO production to resume next year and accelerate in 2018. This growth will be much slower than during the years of the shale boom, but the U.S. LTO production may reach a new peak in the beginning of the next decade. ..."
"... When the EIA states we can recover 70 plus percent of TRR shale oil in America that is a grave disservice to the public. As is "undiscovered TRR," whatever the hell that is. ..."
"... If you were to poll most Americans I believe the vast majority would say we no longer have a hydrocarbon problem in America, that we have 150 years of shale oil and more than that in natural gas and that we should, and can, isolate ourselves from the rest of the energy world and become energy independent. That is a mistake. ..."
"... The shale industry, and its "groupies," has deceived many people over the past 14 years and that pisses me off, big time. ..."
Alex S is mostly talking about the short term forecast. I agree that the long term forecast
in the EIA's AEO for LTO is much too optimistic and that Hughes' estimates are quite good.
Note that one mistake Hughes makes is confusing the undiscovered TRR with TRR, he needs to
account for 2P reserves and add those to UTRR for the Bakken/Three Forks. His estimates for Bakken/Three
Forks are a bit low. Maybe a couple of Gb.
Dennis, what in the hell is the difference in undiscovered TRR and TRR? What shale oil resources
are out there left to be discovered, do you reckon? "Technically" recoverable reserves is a wild
ass guess based on volumetric calculations of shale OOIP over a hypothetical homogeneous area
in all the producing basins throughout the country that has absolutely nothing to do with reality.
Reality is that only about 5-6% of that oil is recoverable thru primary means, not 74%. Lordy.
As Dennis says, I was talking about the EIA's short-term forecasts, which are the initial topic
of this thread. The fact is that the EIA was generally too conservative in its forecasts for U.S. C+C production,
which my charts above show. I think their forecast for 2017 is still too low and will be revised
upwards, especially as oil prices will likely be higher than the EIA was assuming in December
STEO ($51 average).
Long-term forecasts in the Annual Energy Outlook are a different story.
AEO-2012, 2013 and 2014 had too conservative projections.
AEO-2015 was more realistic, in my view, although it failed to predict the extent of the 2015-16
oil price slump and its impact on LTO production. Finally, projections in the AEO-2016 indeed look speculative, especially as they did not provide
detailed assumptions.
Note, that I totally agree with your view on shale economics. But as we have seen in the
past, poor economics did not deter sharp growth in LTO production. It seems that financial markets
are ready to resume funding of the shale sector, although more cautiously than in 2011-14. And
shale companies are already announcing their growth plans for next year.
I expect growth in LTO production to resume next year and accelerate in 2018. This growth
will be much slower than during the years of the shale boom, but the U.S. LTO production may reach
a new peak in the beginning of the next decade.
Thank you, Alex; I am aware of the title of the post and the fact that it contains information
on IEA export data for Iran, JODI data on the KSA, the Marcellus gas "miracle" a discussion of
Russian politics, the usual sprinkling of ant-oil, EV stuff, Donald Trump and Obamacare. You will
of course forgive me for not fully understanding this statement: " the EIA's projections tend
to underestimate U.S. oil production in general, and LTO output, in particular."
My interest in LTO economics is multi-faceted and because shale oil extraction is extremely
expensive, and woefully unprofitable, unlike yourself, perhaps, I do not believe it will have
a significant role in our energy future until we sort out how to pay for it. Hoping for higher
oil prices, and "predicting" higher oil prices is not a plan, therefore stating it will grow in
the future, without stating how, is dangerous, in my opinion. I don't believe it can be funded
as it has been; that WILL stop, eventually. At best, whether we believe people like David Hughes,
or the EIA, we only have 6-8 years of shale oil to provide to the US's total annual crude oil
needs. When the EIA states we can recover 70 plus percent of TRR shale oil in America that is
a grave disservice to the public. As is "undiscovered TRR," whatever the hell that is.
If you were to poll most Americans I believe the vast majority would say we no longer have
a hydrocarbon problem in America, that we have 150 years of shale oil and more than that in natural
gas and that we should, and can, isolate ourselves from the rest of the energy world and become
energy independent. That is a mistake.
The shale industry, and its "groupies," has deceived many
people over the past 14 years and that pisses me off, big time. MY industry should tell the truth
about the oil and gas future. It doesn't. We will likely have to explain to our children someday
why we pissed off all of our remaining resources and did not leave them anything.
IEA also upped its forecast for global oil demand for this year and next year due
to revised estimates for Russian and Chinese demand. It saw growth of 1.4 mb/d for 2016,
120,000 barrels a day above the previous forecast. Growth in 2017 is now seen at 1.3
mb/d, an increase of 110,000 barrels a day from its previous estimate.
likbez, 12/13/2016 at 11:40 am
Realistically the only country that can substantially increase its oil production in 2017 in
Libya. But that requires the end of the civil war in the country which is unlikely. Iran card was
already played.
Iraq is producing without proper maintenance. At some point they might have substantial
difficulties.
"... The IEA also upped its forecast for global oil demand for this year and next year due to revised estimates for Russian and Chinese demand. It saw growth of 1.4 mb/d for 2016, 120,000 barrels a day above the previous forecast. Growth in 2017 is now seen at 1.3 mb/d, an increase of 110,000 barrels a day from its previous estimate. ..."
...OPEC ... crude output in November was 34.2 million barrels per day (mb/d) - a record high -
and 300,000 barrels a day higher than in October.
The IEA also upped its forecast for global oil demand for this year and next year due to
revised estimates for Russian and Chinese demand. It saw growth of 1.4 mb/d for 2016, 120,000
barrels a day above the previous forecast. Growth in 2017 is now seen at 1.3 mb/d, an increase of
110,000 barrels a day from its previous estimate.
"... Peak oil is not just about cars. Oil is the reason why our civilization exists in its current form. Oil is why we have 7 billion people on this planet. Oil is about agriculture and food supply, it is about distribution of everything we buy and not least it is about the raw materials for many if not most of our goods. It is about almost every economic and social transaction that takes place. ..."
"... It is unbelievable what misinformation has been spread by the media. I attended a public forum of the Australian Energy Council and one participant thought that OPEC had increased oil production. My presentation on the need to replace oil by natural gas as transport fuel (instead of exporting it as LNG) was met with silence and did not spark a debate. Another participant was running away when he heard the word peak oil. ..."
"... Further re climate, most agree CO2 is a greenhouse gas but estimates of the temperature change caused by a doubling of its concentration have been coming down over the last 15 years. In other words, it may not warrant the type of policy response that is being promoted at present. ..."
"... Meanwhile the IPCC projections continue with climate sensitivity estimates of 3 to 6 degrees when the more recent estimates of ECS and TRC are consistently under 2 degrees. So contrary to what is alleged above, there is lots of doubt about the IPCC models. ..."
"... I agree with author. If you look at 2 previous OPEC meetings, the players claim disorder and inability to control output only to find resolution the day after the meeting. I believe OPEC is setting up for a freeze as we are only 1% oversupplied now. If the OPEC big wigs need to fatten the bank accounts, what better way than to set up your own long call on the cheap? ..."
"... Balance this with Iran and Iraq incapable of proper well maintenance and we will soon see inadequate supply not later than 2qtr 17′. ..."
is out with crude only production numbers for October 2016. All charts are in thousand barrels
per day.
OPEC crude only production reached 33,643,000 barrels per day in October. This includes Gabon.
Since May, OPEC production has increased 1.05 million barrels per day.
Algeria is in slow decline.
There was a sudden drop in Angola oil production in October, down 200,000 barrels per day
since August. I have no idea what the problem was. There is nothing in the news to indicate any
problem.
Ecuador was sharply down in August but seems to be holding steady for the last two years.
Gabon was added to OPEC a few months ago but their production is so low it will have little
effect one way or the other.
Indonesia will also not affect OPEC production in a big way one way or the other.
Iran's increase since sanctions were lifted has slowed to a crawl. There are other problems
on the horizon for Iran. They are talking about changing all their oil field contracts to "buy
back" contracts. That is they want the option to nationalize all everything. This will likely
cause a mass exodus of foreign oil companies from Iran and hit their production considerably.
Iraq's production was up 97,000 bpd in September and another 89,000 bpd in October. Iraq,
like everyone else in OPEC, is positioning themselves for an OPEC "freeze" in oil production.
So they are producing every barrel possible in order to freeze at the very highest level possible.
Kuwait has recovered from the problems they had in April. I expect their production to flatten
out soon with a slight decline over the next few years.
Libya's oil production was up 168,000 bpd in October. Is peace breaking out in Libya? I doubt
it but only time will tell.
Nigeria increased production 170,000 bpd in October. It is likely erratic increases and declines
in production will continue.
The decline in Qatar's oil production seems to have slowed since late 2014.
Saudi saw a slight decline in October.
The United Arab Emirates had some problems earlier this year but they seem to have recovered.
I think they will hold production steady for a while now. I really don't think they can increase
production much above 3 million barrels per day.
Venezuela's oil production is still dropping but the decline seems to be slowing. Venezuela has
very serious economic problems. They are nearing the "failed state" status.
World oil supply is very near its November 2015 peak.
All this oil tens of billions of barrels all of it non-renewable, never to be seen- or made
use of again for a hundred million or more years, for all practical purpose, ever!
the greatest bulk of it put into cars where it is wasted, by people driving aimlessly in
circles from gas station to gas station for entertainment purposes only By way of this idiocy
we destroy ourselves and our futures. We aren't doomed, we are damned.
The big mistake most energy illiterates make is to talk about their cars when the peak oil subject
comes up. Most hope or assume that another form of fuel or energy will power their ride post oil.
Peak oil is not just about cars. Oil is the reason why our civilization exists in its current
form. Oil is why we have 7 billion people on this planet. Oil is about agriculture and food supply,
it is about distribution of everything we buy and not least it is about the raw materials for
many if not most of our goods. It is about almost every economic and social transaction that takes
place.
When oil becomes expensive our economies and societies will implode, jobs and goods imported
from far away will disappear. This will apply worldwide. The citizens of Addis Ababa are just
as dependent as the ones in Amsterdam or Atlanta.
We have exhausted most of our soils and lost the skill to eke out a living from Mother Nature
without fertilizers and machines. Could it be that the least "developed" countries will lead post
oil because our "developed" nations are the least able to cope without oil?
Mike, that's exactly what I have been trying to tell folks for years. Most just don't want to
believe it. They see solar, wind and other such things as keeping BAU going for awhile.
Why don't you post over on the post section. We get a lot more traffic over there.
Big mistake thinking that this crisis will not arrive with plenty of time to avoid it. Oil prices
will rise slowly over time. However we create energy, we will find a way to pay for locomotion
or create food.
Oil is down 50% This is because of new sources of supply combined with continuing energy efficiency
improvement. Doomed or damned, don't hold your breath. I am sure you will find something else
-- perhaps global warming, now climate change, to scare people with.
Argh. Your comment suggests that you are a militantly ignorant troll. 97% of the competent climatologists
fully support the IPCC global warming summary model. There is no reasonable doubt about this science.
In my opinion there has been a revolution in drilling technology over recent years. However,
the measured rate of additional improvement is now very modest as measured by the US EIA.
Most of the recent improvement is explained by the discovery and exploitation of sweet
spots which are being rapidly drained. For an objective look at prospects going forward for oil
and gas you should read David Hughes' Drilling Deeper report.
This is an exhaustive analysis based on a data base of all existing US oil and gas wells. It
impressively documents a future of peak oil and gas based on fully exploiting fracking technology.
I don't see any magical technology that will get the projected fossil fuel resources required
for business as usual. It is just not there.
Oil is the reason why our civilization exists in its current form.
Not really. There's nothing magical about oil. 100 years ago civilization was pretty recognizable,
and it didn't require oil.
Oil is about agriculture and food supply
For the moment. Batteries and synthetic fuel can move tractors. Electricity (from many sources)
can create fertilizer.
it is about distribution of everything we buy
Rail works awfully well.
is about the raw materials for many if not most of our goods.
Meh. It produces some of our raw materials. But plastic can be produced from a lot of different
hydrocarbons, and it's production doesn' necessarilly create CO2, so we could produce plastic
from coal for centuries. That's plenty of time for a smooth transition.
"Not really. There's nothing magical about oil. 100 years ago civilization was pretty recognizable,
and it didn't require oil." You missed his point entirely. The reason there is 7 billion people
now is because of oil and what it has done for industrial, agriculture ect ect ect.
There was 1.7 billion people 100 years ago. How many people do you think would be here if not
for oil and all it has done?
">For the moment. Batteries and synthetic fuel can move tractors. Electricity (from many sources)
can create fertilizer<".
This is lack of a better word retarded for you to even consider that a battery will be used
even in the distant future to power agricultural machinery on a mass scale. Maybe the little ride
on mower you cut grass with, but that is it.
" Rail works awfully well."
Ya it does, but when it gets to a terminal, it will have to be unloaded and transported
then. Which basically happens now, so what is your point? And your last comment I wont even pick
apart because you obviously know little to very little about the uses of oil and the advantages
it has brought humanity.
@ Steve from Vaginia: Did you ever consider that some People have to drive to *work* and *produce*
so that you can sit around and swing your testicles and so that your mommy can prepare your lunch
and dinner?
So when you sit around the whole day you can think what happens in 300 years, when most of the
oil and gas has been used up. We don't have time for that, but we are sure that People will find
a solution.
One or the solution will be not driving to work and wasting time in gridlock so we can
have more time to swing our balls be 'productive' on our own and our real community's
terms. Real community that includes momma
Oil will get more expensive, some day slowly. Right now the cost is down (50%!!!) because of new
sources and efficiency improvements. I think that those who predict doom will be disappointed.
The falling EROI destroys your lousy assumption in spades. Your time might be better spent burning books or working on one of the dozen worthless Presidential
campaigns.
Oil is very precious raw material, our demand for oil increases day after day, year after year
and century after another. The search and use other sources such as atomic, wind, tide, solar,
geothermal and others will continue but the prospects / trend to keep on using oil as a main source
of energy still quite high and will continue with time due to the following reasons:
– Worldwide population trend is going up drastically. (Main factor).
– Oil as a source of energy still quite cheap in comparison with other sources.
– It may be easy to apply the new technology in certain fields but not for all fields.
– Oil proofs to be available all over the world and at different levels, hence oil production
cost will suit all the times and condition worldwide but not for all the countries.
– Oil is quite important as a raw material for petrochemical products, and our needs for plastic,
paints and other products increases day after day drastically.
– Oil civilization will continue for a few centuries to come if not for ever and playing with
its prices is subject to market condition, political matters, and other technical issues.
Thanks for the graphs. Saudi Arabia may be ramping up production ahead of the air-conditioning
season. Around 600 kb/d are needed in the hottest month.
It is unbelievable what misinformation has been spread by the media. I attended a public
forum of the Australian Energy Council and one participant thought that OPEC had increased oil
production. My presentation on the need to replace oil by natural gas as transport fuel (instead
of exporting it as LNG) was met with silence and did not spark a debate. Another participant was
running away when he heard the word peak oil.
Im lost by ur comments. 1st of all the graphs clearly show that Opec has increased production
by 2+m/d in the last year.
2ndly, Saudi's oil output charts above are for just Oil not NG. Ive never been there, are you
suggesting they run generators from oil for electricity and subsequent air conditioning. Why
wouldn't
they run thier power plants on Natural Gas? Please educate me.
No doubt that investor sentiment and market makers are playing a significant role in price
decline, as opposed to actual supply/demand issues. How do you find out how much the Opec nations
have sold oil short in the various markets. Not a bad deal for them, if they can lay rigs down
World wide and make the money in the commodity markets while doing so. But prices can only slide
so far and for so long before that game is up. It seems like if short selling or hedging slows,
buyers will outweigh sellers and the price should rise soon
Greg, Saudi Arabia is very short of natural gas and have been for several years now. They would
love to run all their power plants and desal plants on natural gas if they just had enough of
it. They don't. They do burn a lot of natural gas but their supply is far short of what they need.
...Saudi is producing flat out right now just like every other OPEC country except Iran. Sanctions
are holding Iran back. Political violence is holding Libya back, but they are still producing every
barrel they can. It's just that violence keeps them from producing any more.
Re Saudi, yes their domestic usage of oil is around 3 M bopd (they produced 10.5 M in June
but exported around 7 M bopd). Their refinery capacity is increasing but a large amount is burnt
for electricity generation. They have delays in the development of some large gas fields, and
so gas supply is behind the demand curve. Various service companies such as Baker Hughes, Halliburton
and Schlumberger have been demonstrating unconventional gas production in Saudi as a response.
Meanwhile the IPCC projections continue with climate sensitivity estimates of 3 to 6 degrees
when the more recent estimates of ECS and TRC are consistently under 2 degrees. So contrary to
what is alleged above, there is lots of doubt about the IPCC models. The latter point comes from
peer reviewed science, by, among others, Nic Lewis.
Another point of interest is the relative steadiness of Venezuelan production. Allegedly various
of the empresas mixtas (Joint Ventures between PDVSA and International Oil Co.'s) are not proportionally
funded by PDVSA as they should be. As a result production is down or is not reaching targets.
Apparently contractor companies will not accept new contracts from PDVSA unless they set up an
escrow account or other arrangement that guarantees payment in foreign currency. It is surprising
therefore that Venezuelan production shows a slight rise since December.
Yes one day we will be without oil that is pumped from the earth. This is not going to happen
for 100's of years. Our intellect will probably find chemical or biological solution to this problem
long before we run out. If not humanity will survive. Global warming, yes its real and one day
the Sun will double in size and engulf the earth. I am not worried about either. I hate winter
anyway.
The problem humanity will face and not discussed near enough is the lack of clean drinking
water. Everyday it becomes harder to deliver enough clean water to all areas in need. States fight
over the rights to what little water pass through their terrain every year. Many times it has
to be pumped from other states at a premium. The worlds population grows larger every second.
crops demand more and more. Ethanol was forced on us without thought as usual by the oil fear
mongers. You do not grow food to solve a commodity problem.
The land resources, water resources, and corrosive properties that Ethanol introduced far out
weigh any benefit accomplished but still its forced down our throats destroying everything its
poured into. So please build those oil pipelines all across the country and pump that oil at rates
that keep our prices low so I can drive in circles any time I feel like it. I am not going to
worry about it because about the time we run out of oil we will need those pipelines to pump clean
water to all that need it.
I agree with author. If you look at 2 previous OPEC meetings, the players claim disorder and inability
to control output only to find resolution the day after the meeting.
I believe OPEC is setting up for a freeze as we are only 1% oversupplied now. If the OPEC big
wigs need to fatten the bank accounts, what better way than to set up your own long call on the
cheap?
OPEC will shut in wells before the Fed adjusts interest rates resulting in magnified downward
pressure on oil.
Balance this with Iran and Iraq incapable of proper well maintenance and we will soon see inadequate
supply not later than 2qtr 17′.
Shallow,
If we look just at numbers the biggest "cut" (non-volunteer) actually
come from Shale in the last year and half. Without that non-volunteer
"cut" price would not be where it is today. I suspect that the discussion
within/between OPEC and non-OPEC was aimed just to keep price between
$50-60 in the first half 2017. We really can't say at this point if they
are going to do that by just "talking about it" or doing some actual
"cuts". It seems at this point that it would be combination of both.
I wouldn't characterize an increase of 4% to be soaring.
Oil prices soar on global producer deal to cut crude output | Reuters :
"Oil prices shot up by 4 percent to their highest level since 2015 early on
Monday after OPEC and other producers over the weekend reached their first
deal since 2001 to jointly reduce output in order to rein in oversupply and
prop up the market."
Info like this makes me wonder what the pro-gas and oil Trump appointees
plan to do. Why do we need more production?
OPEC Skeptics Flee as Production Cut Rockets Oil Past $50 – Bloomberg :
"U.S. crude inventories at 485.8 million barrels are at the highest seasonal
level in at least 30 years, EIA data show. Total fuel demand slipped 1.4
percent to an average 19.6 million barrels a day in the four weeks ended
Dec. 2, the lowest since April.
'This tells me that a lot of U.S. output is going to be coming on line
early next year because they've sold forward production,' Stephen Schork,
president of the Schork Group Inc., a consulting company in Villanova,
Pennsylvania, said by telephone. 'The market still faces big, strong
headwinds. Inventories are still very high, demand is suspect.'"
Some OPEC countries increasing output ahead of the projected cut.
from
Reuters:
Saudi Arabia pumped record-high amounts of oil in November, amid talks
over a global deal to cut production, defying market expectations of lower
output on slower domestic demand and refinery maintenance.
The world's top oil exporter told the Organization of the Petroleum
Exporting Countries it pumped 10.72 million barrels per day last month, an
OPEC source said, up from 10.625 million bpd in October.
In July, the kingdom's production was 10.67 million bpd, the previous high.
Iraq said its November output was 4.8 million bpd, up from 4.776 million bpd
in October, another OPEC source said, as oil exports reached a record high
of 4.051 million bpd.
Gulf OPEC member Kuwait reported output at 2.9 million bpd in November,
lower than its 3 million bpd in October, while the United Arab Emirates kept
its output virtually steady at 3.195 million bpd, according to official
figures reported to OPEC.
"... An evaluation of giant fields by date of peak shows that new technologies applied to those fields has kept their production higher for longer only to lead to more rapid declines later. ..."
"... Land-based and offshore giants that went into decline in the last decade showed annual production declines on average above 10 percent. ..."
Some OPEC countries increasing output ahead of the projected cut.
from Reuters:
Saudi Arabia pumped record-high amounts of oil in November, amid talks over a global deal to cut
production, defying market expectations of lower output on slower domestic demand and refinery maintenance.
The world's top oil exporter told the Organization of the Petroleum Exporting Countries it pumped
10.72 million barrels per day last month, an OPEC source said, up from 10.625 million bpd in October.
In July, the kingdom's production was 10.67 million bpd, the previous high.
Iraq said its November output was 4.8 million bpd, up from 4.776 million bpd in October, another
OPEC source said, as oil exports reached a record high of 4.051 million bpd.
Gulf OPEC member Kuwait reported output at 2.9 million bpd in November, lower than its 3 million
bpd in October, while the United Arab Emirates kept its output virtually steady at 3.195 million
bpd, according to official figures reported to OPEC.
What is the estimate of global depletion of
operating oil wells for 2017? In other words
what part of OPEC and non-OPEC oil production
cut can be attributed to the natural decline
due to well depletion and malinvestment during
the last two years? And would happen anyway.
If you reread posts from this blog from
early 2015 (which is a pretty educational and
sobering read, I can tell) it is interesting
how slow things change as for oil production
decline in comparison with our expectations
(of cause Iran played the role of a Trojan
horse here, no question about it; it looks
like lifting sanctions was, at least
partially, designed to get this particular
effect).
Like inertia of a huge tanker, the inertia
of this giant global oil producing machine is
simply tremendous, as most oil producing
countries have state budgets linked to oil
price and oil prices crush created for them
classic "chess-style" Zugzwang situation in
which cutting oil production was as bad option
as continuing to sell oil at dumping prices
dictated by KSA and the wolf packs of global
"paper oil" speculators.
But, anyway, this sobering two year
experience suggests that like in software
development all forecasts of oil production
decline should be always multiplied by the
factor two, or even three
Still judging from hysterical reaction from
US MSM on OPEC cut (and instant publishing of
tons of stories about cheating as inevitable
outcome, size of inventories alarms, revival
of US shale fairy tales, etc ), 2017 might be
the time when supposed (illusive) neoclassical
"balance" of production and consumption is
achieved.
Although I never managed to understand how
realistic this simplistic concept of oil
"overproduction" works, and how much it was
trifecta of "Iran is back news" + "wolf packs
of oil speculators" + "KSA dumping the oil
(with the cheerful help from Iran ayatollahs)"
It is interesting how eagerly ayatollahs
were ready to waist their national treasure
selling it at really low prices after enduring
years of sanctions which supposedly should
teach them not to trust West (and undermining
Russia in the process).
BTW one interesting side effect of this oil
crush was a rapid raise of refining facilities
on oil producing nations, which makes export
of raw oil shrink in addition to well decline
as refined products almost always have better
margins then raw oil.
An interesting side question is what price
level EIA meant, when it forecasted really
rapid increase of shale production in the US
in the second half of 2017. It is over $80? Or
like Shallow Sand suggested shale oil will
again rely on loans from "investors" (who are
expected to be so greedy that they somehow
managed to forget the lesson or 2014-2016) to
get things rolling again.
"What is the estimate of global depletion of operating oil wells for
2017?"
There is no specific estimate for 2017.
Most estimates are for production declines in the fields that are post
peak.
Decline rates are very different for onshore and offshore fields, big and
small fields,
conventional, LTO and oil sands operations, etc.
There are estimates for natural declines; for declines with applied
secondary and tertiary recovery, etc.
Production in mature fields can be supported by drilling of new wells.
"In other words what part of OPEC and non-OPEC oil production cut can
be attributed to the natural decline due to well depletion and
malinvestment during the last two years? And would happen anyway."
Of course, some of the decline can be attributed to the natural
decline due to well depletion and lower investment during the last two
years. And would happen anyway.
But I cannot say exactly which portion of the projected declines is due
to these factors.
This question should be analyzed country-by-country.
> This question should be analyzed country-by-country.
You probably can limit yourself to giant fields, as in general
only they matter.
Here are the data for 2009: which suggest around 6% annual
decline, which is around 6 Mb/d a year.
I wonder, if three years of absence of new investments will get
us closer to this figure. But even half of that (3%) is more then
OPEC plans to cut. So IMHO they essentially do not need to do
anything to achieve the cut - the natural decline will cover the
bases and limited access to new investments might prevent "waive
dead chicken" tactic used in shale oil.
1.The world's 507 giant oil fields comprise a little over one
percent of all oil fields, but produce 60 percent of current
world supply (2005). (A giant field is defined as having more
than 500 million barrels of ultimately recoverable resources of
conventional crude. Heavy oil deposits are not included in the
study.)
2."[A] majority of the largest giant fields are over 50 years
old, and fewer and fewer new giants have been discovered since
the decade of the 1960s." The top 10 fields with their location
and the year production began are: Ghawar (Saudi Arabia) 1951,
Burgan (Kuwait) 1945, Safaniya (Saudi Arabia) 1957, Rumaila
(Iraq) 1955, Bolivar Coastal (Venezuela) 1917, Samotlor (Russia)
1964, Kirkuk (Iraq) 1934, Berri (Saudi Arabia) 1964, Manifa
(Saudi Arabia) 1964, and Shaybah (Saudi Arabia) 1998 (discovered
1968). (This list was taken from Fredrik Robelius's "Giant Oil
Fields -The Highway to Oil.")
3.The 2009 study focused on 331 giant oil fields from a
database previously created for the groundbreaking work of
Robelius mentioned above. Of those, 261 or 79 percent are
considered past their peak and in decline.
4.The average annual production decline for those 261 fields
has been 6.5 percent. That means, of course, that the number of
barrels coming from these fields on average is 6.5 percent less
EACH YEAR.
5. Now, here's the key insight from the study.
An
evaluation of giant fields by date of peak shows that new
technologies applied to those fields has kept their production
higher for longer only to lead to more rapid declines later.
As the world's giant fields continue to age and more start
to decline, we can therefore expect the annual decline in their
rate of production to worsen.
Land-based and offshore giants
that went into decline in the last decade showed annual
production declines on average above 10 percent.
6.What this means is that it will become progressively more
difficult for new discoveries to replace declining production
from existing giants. And, though I may sound like a broken
record, it is important to remind readers that the world remains
on a bumpy production plateau for crude oil including lease
condensate (which is counted as oil), a plateau which began in
2005.
The question to you - do any newer data for such fields exist,
as new technologies to extend the life of the field were developed
since 2010. Also infill drilling is now used extremely aggressively
by all major players, as if there is no tomorrow
Supream1
1
hour ago
Oil prices are about 10 to 20 below price
[needed for profitable shale and deep see
oil extraction]. Need to go up about to 63
this will be good for US oil. To low a
price will do no one any good high a price
hurt all
Just think of oil as you would think of the
USD. To high is bad to low is also way to
bad need a mid level ( Only few people will
understand this )
The one who wont are the people who want us
to go back to gold standard
XOM has long coveted the Siberian and sub-Arctic oil and Russia deeply needs
our technology and capital to develop them. Remember, Russia is a petro state
and their economy is highly dependent on hydrocarbons. Also, as one of the
great kleptocracies the ruling class, driven by Putin, needs higher oil prices
to continue to drive their personal wealth. A major reason Russia seized the
Crimea is that there is a very large offshore natural gas reserve that the
Ukraine was putting up for bid and it looked like Gazprom wouldn't get it. A
new, major source of natural gas to W. Europe is a direct threat to Russia
which uses natural gas for both economic gain and political leverage. As I
recall when they were trying to exercise political power in Ukraine they shut
down the pipe of gas to them. I do not believe it is an accident that the
Glencore investment into Rosneft occurred once Trump won and the prospects for
a change in US policy looked possible (probable?). Russia is heavily indebted
and any increase in export revenues can only help them. There has been some
appreciation in the Ruble since the election. [Though I would expect a cold
winter in W. Europe to help them more in the short run than the time it will
take to alter US policies.]
This probably means an end to the US participation in the multi-lateral
agreement with Iran, which somewhat helps Russia as it keeps US dollars out and
slows the development and export of Iran's oil. A modest potential bump up in
oil prices. I would expect a loosening or end to the sanctions against Russia
by Treasury pretty quickly.
One also has to wonder if the recent agreement by OPEC to cut production was
influenced by Trump's win. It either is a signal by the Saudi's that they can
influence oil prices in the short term, which in this case pushes them up.
Though I suspect they will be cautious and keep them below say $80 per barrel
for Brent to ensure that there isn't a resumption of fracking in the US. For
all the bluster, fracking is expensive oil and the drop in drilling reflects
economics and isn't a function of regulations.
Best rationale I've seen for the Saudis' sudden willingness to cut and
cut some more, is that $80 crude will bolster Aramco's valuation in the
planned 2018 IPO.
Another factor in pulling off Aramco's epic IPO will be keeping the
global economy out of recession and OECD stock prices bubbly.
Perhaps the Saudis could give us a hand with that last bit.
Dow
22,942!
The news that President-elect Donald Trump is expected to nominate Rex
Tillerson, the chairman and chief executive of ExxonMobil, as his Secretary of
State is astonishing on many levels. As an exercise of public diplomacy, it
will certainly confirm the assumption of many people around the world that
American power is best understood as a raw, neocolonial exercise in securing
resources.
"... I'd like to see a lot more about steady-state economics on here; that means I and you should dig up articles and sources and send them to "blogger" or to Lambert for the Watercooler. They don't take assignments and they're infernally busy, but they do appreciate suggestions. ..."
"Every species that finds a large amount of free energy reacts the same way: proliferation.
The unconscious drive is to use up the energy as fast as possible. If only we could understand
that. But understanding it would get in the way of the principle itself. The only thing we
can do to stop the extinction is for all of us to use a lot less energy. But because energy
consumption provides wealth and -more importantly- political power, we will not do that. We
instead tell ourselves all we need to do is use different forms of energy."
In the wake of the election, I have heard many on here (including the curators) talking about
how the election was all about jobs - read economic growth. As Herman Daly has pointed out, perpetual
growth is an oxymoron when constrained by a finite number of energy resources. So please, can
someone on here offer an explanation for the obvious cognitive dissonance? In general, I'm convinced
most of the people that interact on this page would call themselves environmentalists.
So how, out of the other side of our mouth, can we talk about focusing on economic growth as
a panacea to our political problems? This goes to the root of what I think my most important mission
is moving forward. Namely, finding a way to bring labor and environmentalism together. Thoughts
anyone?
To avoid death, for many people, it means having a job (or more).
When one is not facing death, one can elevate oneself to think about high ideals when one is
exceptional, perhaps one can do that while looking at the Grim Reaper.
I believe we can happier with a smaller GDP. That's not growth. That's opposite of growth.
As it turns out, the destination is easy to understand. Perhaps because its too late to avoid
arriving there, as more a few have commented, the game now is about taking control during the
journey with many climate renaissance sweet spots to live comfortable around the globe. That game
is tied to wealth and power inequality.
It's not about cutting down overall carbon emissions, but who should cut more. It's not that
there will be droughts, but securing water sources huge underground aquifers, for example.
And so on and so forth.
To the extent the deplorables are visible now, it gives hope that the journey will not be one
where they're simply jettisoned along the way.
Growth means an increase in wealth. Wealth and energy do not have a one-to-t-one relation,
it seems to me. A low-energy appliance can be more valuable than a high-energy one, for example.
So sustainable growth means doing more with less. Recycle old inefficient wealth into new, more
efficient wealth.
Wealth can also mean services, and many services can be performed without much use of energy or
resources.
You're not alone. In fact, there's NC slang for the concept: "groaf."
The contradiction is built into liberal economics, including MMT. The political motive is that
reality turns economics into a zero-sum game: the "grim science." As far as I know, Daly and his
movement are the only ones to really address the problem.
The solution is to substitute redistribution for growth. A refinement is to redefine "standard
of living," so it isn't just "standard of consumption" but measures quality of life. Of course,
redistribution is a big political challenge; furthermore, it tends to encourage growth – poor
people spend all they get.
I'd like to see a lot more about steady-state economics on here; that means I and you should
dig up articles and sources and send them to "blogger" or to Lambert for the Watercooler. They
don't take assignments and they're infernally busy, but they do appreciate suggestions.
Pretty easy really. I'll wing it and create a new offshoot of economics.
I'll call it Refrigerator Economics. Growth for the consumer would be if it could purchase
the good old refrigerator that lasted 25 years and pay 10% more to include energy saving technology.
More insulation and more efficient motor/compressor. Even if this doesn't sound very innovative.
Growth for the industry is when they crappify and sell 9 year refrigerators for the same money.
Then the consumer has to buy a new one and have the old one hauled to a landfill. Industry is
busy digging holes to obtain resources to make the new crappy refrigerator. In spite of industry
being known for it's beady eyed efficiency, typically these are not even the same hole in the
ground. Buying furniture works the same way.
Conventional economic theory tells us the second way is better. One more reason to hate economics.
I believe in the growth of knowledge as contributing to the GNP. We could invest in basic research.
The H1-B problem could be eliminated with major research efforts employing the brightest and best
from around the world. We used to do that kind of thing - the space race provides a pale example.
There are problems to solve - major problems - and we are on the cusp of great discoveries in
many fields. I am most bullish on chemistry and biochemistry.
If unused or under-utilized labor really is available to be employed through the machinations
of fiat currency I can't think of a better application of excess capacity than putting the many
researchers we've trained to work doing research.
I skimmed it the other day. Found it too long and whiny I'm afraid, but then I'm technically
minded and long familiar with the issues.
It seems unlikely to me that we can prevent the collapse of technological civilisation worldwide
due to our exhaustion, pollution and destruction of the ecosphere. We would need to reduce our
population quite quickly, keep (or put) most of it in poverty and only allow a small elite to
live like Americans. This seems to be the current gameplan.
A more ethically acceptable, but less certain, approach would be to try to quickly bring everyone
up to a level of prosperity and security where population falls naturally, whilst minimising resource
use and pollution. The latter will require technological improvements and is a race against time
and energy depletion. It will also require some kind of defeat of the current elite.
"... Libya and Venezuela peaked long ago. Russia is at her peak right now. Iran is very likely post peak. Iraq can increase production slightly but is very near her peak. Kazakhstan is at 1.75 million bpd and if they can manage to keep the toxic oil from Kashagan from corroding their pipes they may one day get to 2 million bpd. Big deal. ..."
"... The Ukraine crisis was provoked by NATO itself (see: EuroMaidan) and Russia reacted to it. NATO was long looking for an excuse as well as the right timing for imposing sanctions on Russia. ..."
What Ron Patterson and the Peak Oil-ers in general fail to include
in their calculations is the geopolitical aspect of oil, as well as
Global Economics.
In order for us to understand what the imperatives are in
dictating oil production levels, prices etc we should be at first
able to distinguish between the different types of oil producers.
To provide the most obvious contrasting example, let's take Russia
& the USA. These two major oil producers are quite dissimilar to
each other, if not outright opposites. For Russia – a much poorer
country – oil production is *the* core industry, as well as the
core export item which is vital for the country's success or
failure. The US – a much wealthier country – despite its high
production levels, is still a massive importer. This distinction
makes a world of difference. For the US, the aim of oil production
is to be maximized, so that imports can be minimized and also that
oil exporters (such as Russia) can enjoy far less strategic or
economic leverage. Hence, the expensive and risky gambit on shale
oil and tar sands in North America. For Russia on the other hand,
the goal is never to maximize production, their aim is to balance
production levels with price levels so that the Russian economy can
get the best results and the country the most leverage possible in
the long-run. My point here is that when we make forecasts over
future production we should always make the distinction between
countries that are producers, yet importers and countries that are
producers-exporters and rely to a high (or absolute) degree on oil
revenues for their well-being. So, the first distinction we can
make, is between oil-producing-exporters and
oil-producing-importers. The first category would include: Russia,
KSA, Iraq, Iran, Kuwait, UAE, Libya, Venezuela etc, while the 2nd
would include the US, China, UK, India etc But another, even more
important distinction is crucially important here. Some of the oil
exporters are part and parcel of the US-EU (NATO) economic-military
structure while others are not. The first category would include:
KSA, Kuwait, UAE, Norway, Canada etc while the second category
would include: Russia, Iraq*, Iran, Libya*, Venezuela, Kazakhstan
etc
From the above, another clear conclusion arises. The US-EU Axis
(NATO) has calculated that the oil exporters it doesn't already
control must be attacked until a high degree of control over them
can be imposed. This has taken the form of a direct military attack
as in the cases of Libya and Iraq, or the form of Hybrid Warfare
methods of sabotage and subversion against all the others.
Now, how does all this relate to actual production levels? My
point here is this, the dominant US-EU Axis is very much interested
in suppressing the levels of oil production (or conversely, the
level of prices) from places such as Russia, Iran, Iraq etc
whenever this is possible (for example, when the North Sea and
North Slope were being developed, or when shale/tar sands came
online more recently) In fact they have been doing exactly that for
decades now (pressure on Yeltsin's Russia, sanctions on Saddam's
Iraq, sanctions on Iran and now sanctions on Russia) As you can
see, the sanctions carousel shifts between these 3 oil giants that
NATO does not control.
This is the point I have been periodically making on this blog
but nobody seems to be picking up on it. Yes, countries such as the
US, Norway, UK, Indonesia etc have peaked to various degrees and
can only maintain or increase production temporarily via massive
capital expenditure and technological breakthroughs. While
countries that have been victims of US-EU (NATO) hostility are
merely trying to navigate out of the siege laid against them until
they hold enough leverage to produce closer to their real
potential.
So, for the umpteenth time, Russia, Iran, Iraq, Kazakhstan and
very possibly Libya and Venezuela are nowhere near the peaks and
will be growing producers in the coming decades. The only question
is whether this will be done under their own terms, or under NATO's
terms.
For the US, the aim of oil production is to be maximized, so
that imports can be minimized and also that oil exporters (such
as Russia) can enjoy far less strategic or economic leverage.
Baloney! The US
government
does not have an aim of oil
production. The US
government
does not produce a single
barrel of oil. Oil, in the USA, is produced by private and
publicly owned companies. Their aim is to make money, nothing
else.
Hence, the expensive and risky gambit on shale oil and tar
sands in North America.
Again, that risky gambit was not made by the US government,
it was made by private and publicly owned companies. They took
that risky gambit because they thought they could make a
fortune. Do you really believe they had Russia in mind when they
decided to drill and frack that oil bearing shale? Do you really
believe they did it because they wanted Russia to enjoy less
economic leverage? I doubt that any of them really gave a shit
about Russia's welfare.
The US sanctions against Russia was because of their takeover
of Crimea and their invasion into Ukraine. It had nothing to do
with trying to suppress their oil production. Ditto for the
Iranian sanctions. Obama wanted to halt their development of
nuclear weapons. Good God man, do you really believe those
sanctions was about suppressing their oil production instead?
So, for the umpteenth time, Russia, Iran, Iraq,
Kazakhstan and very possibly Libya and Venezuela are nowhere
near the peaks and will be growing producers in the coming
decades.
Libya and Venezuela peaked long ago. Russia is at her
peak right now. Iran is very likely post peak. Iraq can increase
production slightly but is very near her peak. Kazakhstan is at
1.75 million bpd and if they can manage to keep the toxic oil
from Kashagan from corroding their pipes they may one day get to
2 million bpd. Big deal.
So you really believe that the USG has no way of influencing
what the various American corporations do? There is no such
thing as "free-market" in the abstract, the state is involved
heavily every step of the way. Legislation, regulation,
taxation, subsidies (or lack thereof) directions to financial
institutions, bail-outs etc etc etc. I am not of course
saying that the USG commands US corporations as would be the
case under say a Stalinist system, but you can bet it can
*influence* it. Several laws were passed around more than a
decade ago in order to precisely encourage shale operations
(Cheney was behind them) Secondly, I find it shocking that
you deny the most obvious statement I made, namely that major
oil importers struggle any which way they can to minimize oil
imports, maximize own oil production (if they have any oil
reserves that is) and also control the countries that do
export oil. Just read what the CIA said about the Persian
Gulf right after WWII. Control of oil-rich regions has been
an absolute imperative for US FP since then. Astonishing that
anyone that can doubt that. As for your claims about
anti-Russian sanctions, again your ignorance about
geopolitics is astonishing.
The Ukraine crisis was provoked by NATO itself (see:
EuroMaidan) and Russia reacted to it. NATO was long looking
for an excuse as well as the right timing for imposing
sanctions on Russia.
The Ukraine crisis, as well as
rising oil production in North America provided a perfect
opportunity for those sanctions to be imposed at the time
they did, otherwise they would have looked pretty pathetic.
And notice what the sanctions were all about: a) no
selling of oil equipment to RUS firms, b) no lending to RUS
oil firms, c) no US-EU oil corporation can invest in RUS oil
or cooperate with RUS oil companies. This, coupled with a
crushed price was hoped that would discourage/impede the
Russian oil industry. It's so eye-popping it hurts. BTW, I am
not moralizing here, I am just presenting the facts as I see
them, from the prism of RealPolitik.
As for your persistent belief that every country in the
world has peaked in terms of oil production. How long do you
have to be proven wrong until you admit it? I am sure that
you thought that Iraq under Saddam had "peaked" or that
during the early years of US occupation it had also peaked.
But what do we see?
A war ravaged country being able to rapidly expand
production. Imagine what the Iraqi oil production levels
would be if the country enjoyed some relative piece and the
global market called for it? My point here is that these
countries are constrained by market as well as geopolitical
factors, which you seem to completely ignore.
So, I hope that your blog is still around in the coming
years, when all of Russia, Iran, Iraq, Libya, Venezuela &
Kazakhstan boost oil production. Some of them will boost
their production massively, others significantly. You will
see.
I'm sure the world looks like you depict it, from where
you look Stravos. But it doesn't look like that from here.
Russia has sanctions imposed on it for acting aggressive
on its borders. I'm sure it feels uncomfortable to be
surrounded, and not have a good port to the south for its
navy. I truly believe that USA and the rest of the modern
world were hoping Russia would join in a constructive and
cooperative role after the Soviet breakup, but they have
failed miserably so far. Still hope though.
And Iran has sanctions imposed because they have been
an extremely aggressive theocracy that no one wants to
have nukes- the sanctions imposed included China and
Russia as sponsors. Also, it was to Russia advantage
economically, to not have Iranian oil on the market.
China, Europe and USA do prefer to have Iranian oil on
the market, but not at the cost of a theocracy (bizarre)
with nucs.
More to say- but thats enough to chew on.
I talk Real-Politik but you have again collapsed into
the cheap hypocritical nonsense of the MSM and
pseudo-experts. The mere suggestion that Iran has been
"aggressive" is insulting to my intelligence. Iran
can't be aggressive regardless of their inner desires.
Iran can only hope to defend itself from the US & its
allies and even that would have been impossible without
Russian and Chinese support from behind the scenes. I
don't see why you think that Russia & China going along
with the West on imposing sanctions on Iran somehow
proves that the excuse for them was truthful. No,
Russia & China both make deals with the West all the
time, in the hope that they can serve their own
interests as best possible. If it means screwing Iran
in some cases, then so be it. Every state is in this
for its very own interests (no permanent allies, only
permanent interests)
As for Russia. There wouldn't be a more catastrophic
scenario imaginable for the West (especially Europe) if
Russia ever managed or was allowed to enter the global
marketplace in anything remotely resembling "fair
terms". The reason why NATO is so obsessed with Russia
is because that country possesses *all* the necessary
elements (massive hydrocarbon reserves, nukes, metals,
strategic location, geographic size) for a superpower,
except of course the economic part. But, as NATO
strategists are keenly aware, that can change, and if
it does, then the Global Balance of Power changes
radically and at the expense of NATO. This is why
Russia is NATO's number one target and not say China,
or India or anybody else. Most people have been fooled
by thinking that power in international relations is
all about the size of your GDP. While this may be true
for most countries, it's definitely not true when it
comes to Russia. If I were NATO I would be doing the
same and more in order to bring Russia down.
International rig counts are out – up five overall, mostly a bounce back to around September numbers
from an unusually big dip in October, especially in the North Sea.
Also I took a look at some of the Bakken daily reports for this week, new permitting and completions
announcements seem to have come to a stop – maybe the extra cold weather, or maybe someone on vacation
and not completing the paperwork, or a sign of things to come?
Is this the news of an industry with a rosy glow of optimism following the OPEC announcements?
Too early to feel the impact yet I guess.
"... Most shale oil companies are looking down the barrel of loans coming due beginning 2017 and continue to do stupid things with borrowed money because they have no choice. In spite of lower costs and higher EUR's brain washing campaign, they are all still losing money hand over fist. Even mighty EOG. ..."
I won't deny there is an uptick in drilling coming, it is just that I perceive
a different rationale for it, than assuming they are jumping at $50 oil to plan
to go all out for that reason. Some companies are completing wells that would
only be profitable at $100 a barrel. No rationale for those, other than they
are simply trying to hold on to the lease, and hope. I follow EOG fairly
closely, and from my own lease, I know they are trying to hold on to fairly
good leases, but only drill what they have to. I think that is the reason your
seeing an uptick. They are planning on what will hold the leases for 2017. They
are balancing those permits for "marginal" wells at $50, with permits in the
sweet spots. From a planning perspective, it makes sense on getting that over
with first. Then you can concentrate on what is going to keep you alive. It is
interesting to note that the Austin Chalk (Sugarcane) has become their new
sweet spot in Karnes County. They have 5 or 6 now producing, and 9 more planned
so far for next year. All are doing very well, and two had first month
production in excess of 100k barrels a month. Less decline than the Eagle Ford,
so far. Other companies are now jumping on it, too.
Mr. Minton do you have continuous drilling provisions in your lease and if
so may I ask, what year did you lease to EOG?
I contend that at these oil prices the speculation about "drilling to
hold leases" is vastly overblown, that most leases made in the Eagle Ford
and Bakken before 2012-2013 had no continuous drilling provisions in them,
and that most of the drilling still being done in those two plays, at these
oil prices, are actually related to loan covenants regarding booking PDP
reserves, SEC 5 year rules regarding PDNP reserves and to reduce taxable
income thru IDC deductions.
Most shale oil companies are looking down
the barrel of loans coming due beginning 2017 and continue to do stupid
things with borrowed money because they have no choice. In spite of lower
costs and higher EUR's brain washing campaign, they are all still losing
money hand over fist. Even mighty EOG.
HZ Austin Chalk wells cost considerably less that shale wells because
they don't typically require frac'ing. Some of the initial IP's and IP90's
in the Chalk have been spectacular, especially for EOG who is well know for
gutting wells to create big EUR's; take it from me, an old Chalk hand,
however, the decline on Chalk wells after 12-18 months will suck the hardhat
over the top of your head and I am quite certain 95% of those wells will NOT
payout either. They did not in 1981, 1991, 2001 nor will they this time
around the block either.
Yes it has continuous drilling clause.
Austin chalk wells by EOG are frac'ed. Who cares what happens to the
decline in 12 to 18, if you recover over 300k the first year?
If EOG frac's those Chalk wells then they cost essentially what an EF
well costs. If a Chalk well makes 300,000 BO in the first year, which
they don't, then declines 80% annually after the first 12 months and
every year thereafter, they'll never reach payout. If your only
interest in any of that is from the standpoint of a royalty owner,
then I am sure you don't care about profitability. I do.
I contend that most mineral leases made before 2013 did not contain
"drill and earn provisions" in them (drilling commitments) and that
one well could hold the entire lease. I can confirm that in S. Texas
and I suspect less knowledgeable mineral owners in the Bakken that
leased early in the play had no drilling commitment provisions in them
either. Leases made later in both plays involved more sophisticated
mineral owners who required drilling commitments. In W. Texas, for
instance, all that now being drilled is subject to drilling
commitments.
SEC rules are very clear regarding 'proven but not producing'
reserves that were "booked" and made into assets they must be drilled
within 5 years or lost. DUC wells are PDNP reserves and they too must
be completed within 5 years.
I am familiar with two new loan covenants, particularly relative to
recent credit swaps, etc. that if a company gets more money in the
equity swap, they must develop PDNP reserves or suffer penalties.
None of this precludes the fact that 95% of the shale oil wells
being drilled in America and these oil price levels will not payout
unless prices rise dramatically. Those wells ARE drilled at a sure
loss. The shale oil industry is penned up now like a heard of goats;
they voluntarily drill unprofitable wells with borrowed money because
they need cash flow and they need to book more assets to be able to
borrow more money. They are also forced to drill and complete wells
that are unprofitable for reasons I have explained. The ONLY way out
for them, even the biggest of them, is if oil prices rise into the
80's and 90's and that is not going to happen for a long time, short
of some big chicken fight somewhere in the world that would have an
affect on supply.
Not really. There is not a lot of interest in drilling for $50 to $60 oil in
the shale. Go back and look at what happened in 2009 when oil dropped to
$60. Most places are profitable to drill at $80 to $100. Very few are
profitable at $50. The press can hype all they want. It won't change
reality.
I think the press helps – if enough people buy it, silly money will give
free loans to these companies to continue drilling. You can loose as much
money as you like, as long as you have creative bookkeeping and a
neverending roll in of money.
We had this here in Germany in the wild
2000s – film making fonds have been the red hot burner, people lost
millions but continues investing until alle these companies where
history. Hollywood was laughing about Germany "silly money".
It's
little surprise that Credit Suisse recently stated:
"With service prices, particularly pressure pumping expected to rise in
2017 on the back of increased activity, a Permian operator commented that it is
already seeing greater than a 20% increase in completion costs. The biggest
concern for Permian management teams has been a potential scramble for
equipment and services that higher commodity pricing could introduce, and the
OPEC move has the potential to drive faster service cost inflation than we
would have otherwise seen, muting the impact of the oil spike on returns for US
shale operators."
In other words, the cost of drilling is likely to go up just as fast as the
price of oil goes up if there is a cut in production by OPEC.
Most of the new "drilling efficieny" is a result of depressed
costs and drilling in primarily "sweet spots". Easy financing
is a thing of the past. Can't see a big enough resurgence in
shale drilling to overcome drops in production in the short
term. A 20% increase is a killer, but that is only the
beginning. The way I see it, because the new drills won't
keep up wit the decline rates of the old wells; they have to
recoup all their drilling costs the first year, to enable
them to keep drilling. That leaves only a few areas to drill
in. The only reasons it surged in the past, were easy money
and oil at $100 a barrel. Both are no longer available, now.
"Iran's total crude oil and condensates sales likely reached around
2.8 million barrels per day in September, two sources with knowledge
of the matter said, nearly matching a 2011 peak in shipments before
sanctions were imposed on the OPEC producer.
Iran sold 600,000 bpd
of condensates for September, including about 100,000 bpd shipped from
storage, to meet robust demand in Asia, the two sources said.
September crude exports increased slightly from the previous month to
about 2.2 million bpd, they said."
"Iran's condensate production has exceeded 610,000 b/d this year,
with 561,000 b/d of this - or around 90% - coming from the 16
operating phases at the giant offshore South Pars gas field in the
Persian Gulf, Akbary said.
The latest additions to the project were phases 17, 18 and 19,
which came into operation this year, Akbary said.
In addition, eight new phases are currently being installed at the
field. Phases 20 and 21 will become operational in 2017, Akbary said,
while phases 13 and 22-24 are expected to begin in 2018. Iran hopes
the entire development will be completed in 2021.
By then, South Pars condensate production will exceed 1 million
b/d.
Smaller offshore fields under development could add another 50,000
b/d, with a further 55,000 b/d on top of this should additional
projects be approved.
Onshore fields could add a further 115,000 b/d, taking total capacity
to more than 1.2 million b/d.
Iran's domestic consumption currently stands at around 260,000 b/d,
leaving a surplus of more than 350,000 b/d this year. But consumption
is forecast to rise to more than 700,000 b/d by 2021 with the
completion of new condensate splitters, such as the 360,000 b/d
Persian Gulf Star.
as a result, Iran's condensate exports are expected to drop to
around 250,000 b/d in 2021."
http://www.platts.com/latest-news/natural-gas/dubai/major-investment-needed-to-avoid-output-fall-26601277
Crude prices could rise to $60 to $70 a barrel if the Organization of Petroleum Exporting
Countries succeeds in bring inventories back to a normal level, Venezuelan Oil Minister Eulogio
del Pino said last week, echoing a widely held view within the group, from Saudi Arabia to Iran.
... ... ...
The International Energy Agency expects the re-balancing will happen early next year, while
consultants at Rystad Energy expect a 1.26 million barrels-a-day deficit in the first quarter of
next year if Russia is the only non-OPEC country to join the effort.
Also, my google news feed is packed with articles touting peak demand not
peak production. Is this some sort of distraction effort? I know the topic
of peak demand has been discussed before, but I am having severe memory
issues.
Ezrydermike, did you not read the article that you, yourself, posted?
"Peak oil by any other name is still peak oil."
Peak oil is peak oil
is peak oil.
Peak demand and peak supply are the same thing. That is,
when the production of crude oil peaks, regardless of the cause, that
will be peak oil. I don't know how I could make it any simpler than that.
When there is peak supply, including
all hand waving about storage tapping and what's in pipelines and
assorted gobbledygook, there will be demand for more than that supply,
with lines at gas stations and requests for more than the ration
allowed, but the gas station guy will say no and the customer's
consumption will be limited to whatever rationing is available - if
his license plate is an even number and it's an even day - if an odd
numbered day, he gets to consume none, regardless of how much he
demands of gas station dood.
yes Ron I get that. I was more remarking on how my Google news feed is
presenting the articles as peak demand not peak oil. Many of these
seem to be trying to replace the terminology and pointing that some
oil can be left in situ for future production. For example, this
article from the CSM.
"The threat of the world facing a declining
supply of oil, so-called peak oil, has given way to a forecast that is
calling forth its much more benign cousin: peak demand."
"... The chain of announcements signal that Saudi Arabia is trying to push oil prices above $60 a barrel -- and perhaps closer to $70 a barrel -- as it attempts to fill a fiscal hole and prepares a partial flotation of its crown jewel, state-owned oil company Saudi Aramco, in 2018... ..."
Russia among non-OPEC nations pledging to cut 558,000 barrels
Saudi minister says he'll go beyond commitment at OPEC meeting
Saudi Arabia signaled it's ready to cut oil production more than expected, a surprise
announcement made minutes after Russia and several non-other OPEC countries pledged to
curb output next year.
... ... ...
"This is shock and awe by Saudi Arabia," said Amrita Sen, chief oil analyst at Energy
Aspects Ltd. in London. "It shows the commitment of Riyadh to rebalance the market and
should end concerns about OPEC delivering the deal."
.... ... ...
The chain of announcements signal that Saudi Arabia is trying to push oil prices above $60
a barrel -- and perhaps closer to $70 a barrel -- as it attempts to fill a fiscal hole and
prepares a partial flotation of its crown jewel, state-owned oil company Saudi Aramco, in 2018...
BP's numbers for oil exports (available from 1980) and production less
consumption (available from 1965) are slightly different, which may reflect
changes in inventories and other balancing items.
According to BP, Middle
East oil exports in 2015 was 20.6 mb/d, the record for the period from 1980.
Production less consumption was 20.5 mb/d vs. all-time high of 20.8 mb/d in
1976-1977.
But 2016 should see a new record due to ramp-up in production and exports
from Saudi Arabia, Iran and Iraq.
Middle East oil exports (mb/d)
Source: BP Statistical Review of World Energy
These EIA projections are indeed to be taken with a grain of salt, I think.
Especially concerning the USA. Why would the production suddenly stabilise?
There has been a -10% decrease over the course of the last 1,5 year. (= a
severe decline). And now, miraculously, things will stabilise?
I think, over the course of the next 365 days, the USA will lose another
million barrels per day of oil production.
Wasn't going to be the first one to go that far. Pretty sure we have another
half million to go by end of 2017. Including the Gulf. Still, that would be
about a million barrels less than EIA is projecting.
Supposedly the increase in oil price should stabilize US production that has
been severely affected by low prices. It remains to be seen if OPEC+Russia
cuts (no article on this?) in 2017 realize and if US production can increase
to compensate for the cuts. Obviously OPEC+Russia think not or they would
not be cutting production, unless it is a fake cut in the first place.
Stones: From the press release of the startup: " September 6, 2016. Shell
announces today that production has started from the Stones development in the
Gulf of Mexico. Stones is expected to produce around 50,000 barrels of oil
equivalent per day (boe/d) when fully ramped up at the end of 2017
That would suggest a gradual ramp all the way from Sept. 2016 through
December 2017. At best a 20% initial flow in September or 10k b/d
Julia: The first well came on line in April and the 2nd one was to start a
few weeks later:
ExxonMobil starts up Julia oil field in the deepwater Gulf of Mexico
04/19/2016
Offshore staff
IRVING, Texas – Exxon Mobil Corp. has started oil production at the Julia
field in the deepwater Gulf of Mexico under budget and ahead of schedule. The
first production well is now online and a second well will start production in
the coming weeks.
The Julia development is located about 265 mi (426 km) southwest of New
Orleans in water depths of more than 7,000 ft (2,134 m). The initial
development phase uses subsea tiebacks to the Chevron-operated Jack/St. Malo
production facility.
According to ExxonMobil, the development includes the use of subsea pumps
that have one of the deepest applications and highest design pressures in the
industry to date.
Neil W. Duffin, president of ExxonMobil Development Co., said: "Successful
deepwater developments like Julia, located more than 30,000 ft [9,144 m] below
the ocean's surface, benefit from ExxonMobil's disciplined project execution
capabilities and commitment to developing quality resources using advanced
technology.
"This initial production will provide ExxonMobil with insight into the
potential future development of the reservoir."
The Maersk Viking drillship is currently drilling a third well, which is
expected to come online in early 2017.
So when you consider the start dates and the companies own reports, then
there is no evidence of any material GOM oil production growth from the GOM
starting October 2016. Furthermore, there is not one 2017 GOM project. So, the
EIA forecasting oil production growth of 500k b/d by the end of 2017 is pure
fiction. To compound the error, the EIA excludes GOM depletion of what I recall
is ~22% depletion in the GOM for 2017 of ~300k b/d (1.5 million b/d of
production @20%).
The EIA oil production forecast for the GOM is a complete fabrication!
This shows production from the new leases reported to BOEM since 2015,
except Hadrian South which is mainly a gas field, but including Julia which
EIA missed. Also missing is Gunflint (nameplate 60 kbpd) which hasn't
reported any production although supposed to have started in early 2016. Son
of Bluto 2 started early and looks to be watering out quickly. Dantzler also
cut a lot of water early and is in decline. Silvertip was tied in as part of
Great White (Perdido spar). West Boreas and Deimos South are considered part
of Mars B (tied into Olympus spar I think) but I can't tell if they are
operating (there are two new leases that appear to have started in 2016).
Stones only started operating in September. Heidelberg has a very slow ramp
up. Julia has two wells on line but is only at half nameplate (I don't know
if it is limited by capacity at the Jack hub. As others I don't see where
300 kbpd of new capacity is supposed to come from, especially given high
declines in mature deep water fields.
I noticed I missed off Big Bend – that started up October last year hit
an early plateau and looks to be in slight decline at 16 kbpd at the
moment. (note the graph is stacked production, oil only – none of the
leases reported condensate).
Gunflint is probably identified by BOEM as
Freedom/Gunflint – but I don't see any reported production for that
either through September.
Julia production is not limited by Jack capacity. Jack capacity is around
170 kbopd, and is currently around 120 (with Jack, St. Malo and Julia).
George,
I think what you show as Horn Mountain Deep and Holstein Deep are
actually just the base production from those fields. I don't think
either Horn Mountain Deep or Holstein Deep are on production yet - I
think.
Agreed probably – the numbers are given by lease number only.
Sometimes there can be more than one well to a lease (they give the
number of completions so sometimes you can see when something
starts up then), but additional complications are that BOEM
sometimes use different names from the E&P company, and there are
often several leases per field. Tie backs, even if given a
particular name, are listed against the main filed only. I think
there is a way to apportion production to particular wells and from
there to a particular tie-back, but it's beyond may attention span
at the moment. I was more interested in the overall shape of the
curve – which shows a clear flattening. Horn Mountain Depp added
two completions in March/April, I need to check further on
Holstein, I might have screwed up there as the curve looks
suspiciously similar to Horn Mountain Deep. I think there probably
is another 150 kbpd ramp up nameplate capacity between Gunflint,
Stones, Heidelberg and Julia and maybe 50000 extra tiebacks if they
are drilled – but that would only just about cover decline over the
next 15 to 18 months.
It's also interesting that, though now in
decline, Dantzler and Big Bend initially exceeded expected
production capacity, and still do.
Another correction: Son of Bluto 2 didn't cut a lot of water, I
looked at the wrong column, so I don't know why it declined so
fast. I think it may have capacity for a second well there.
Interesting, that, in the Annual Energy Outlook 2016, the EIA projects
further growth in the U.S. Federal offshore (ex Alaska) oil production to
1.93 mb/d in 2021.
Given high decline rates for deepwater fields, that
implies new start-ups or ramp-ups.
One of these projects is BP's Mad Dog Phase 2 . Is there anything else?
The additional ones I can think of are Stampede and Big Foot, both in
2018, and Shell's Appomattox, but I don't know when that is slated to
come online.
In addition, there will be a fair number of 1-3 well tiebacks to
existing facilities. (Maybe 3-4 a year??)
There are Thunder Horse South tie backs next year (BP, nameplate maybe
42,000 bpd), Heidelberg Phase II might add another 30,000 in 2021,
small tie backs to Delta House (Odd Job next year at 5000, maybe
others), Vita (c/w Power Nap) has gone out for FEED but I don't think
it could get done before 2022 now, possibly Caesar/Tonga additions
next year (20,000 ??), and I think Typhoon (or might be called Tornado
now) might have started up recently at 13,000 tie back to Helix
producer.
So I corrected Holstein Deep (I don't think there have been any new tie
ins and it is in gradual decline), added Big Bend, Gunflint (though it is
zero flow) and Pheonix (no change in the dates shown but Tornado has
started up at 20 kbpd this month and will be choked to 13 to 16 kbpd at
plateau (this used to be Typhoon I think, but all these names are quite
confusing) there are other tie-back options for Phoenix, which is
serviced by the Helix producer, in the future, including a second Tornado
well and Motormouth.
The plateau through 2016 is maintained but I think
there will be a jump in October and then a steady rise at least for a few
months. I don't know the issue with Gunflint but if it has a lot of
predrilled wells and is just waiting on getting the production facilities
operating there could be another big increase then.
Also I had a thought on Julia and Horn Mountain Deep: it's possible
that the completions listed by BOEM include producer and injector pairs
so at the moment Julia has only one producer, but two wells, and
therefore with another producer to come to give full capacity (at up to
35 kbpd).
Alex – I don't think there will be as high a peak as they say – I
don't see where the projects ramping up or in late development
stages are that could achieve that (I still go for around 1.85
mmbpd sometime in mid 2017 as peak). But equally the decline might
be less steep than they show and the tail fatter. Two other
projects not yet approved are Shenandoah and Kaskida. I think they
would both be about 150 kbpd nameplate, but they are high
temperature / high pressure and Kaskida has sand issues I think
(maybe they both do), and both might need relatively many wells –
so very expensive. There's also Tiber / Gila / Gibson / Guadelupe
(I don't know much about that but over 100 kbpd), Anchor (also
about 100 kbpd), some fields around Tahiti for tie backs and
Constellation (ex-Hopkins) which used to be considered a big find
with BP but know looks like a smaller tie back (30 kbpd maybe) for
Anadarko. After those only bits and pieces are left, and with not
much frontier exploration going on so little prospect of big finds
either. Anadarko and BP have a lot of the prospects which would
tend to mean they'll get spread out a bit. I've also been surprised
at how long the schedules are for Appomatox and Mad Dog II (and
also Trion on the Mexican side) they all are around 7 years from
FID to plateau rates.
"... The real danger is that the media, as well as the general public, has been sold the idea that peak oil has now been discredited because of shale oil. It has not. And that only increases the dramatic shock effect it will have when it finally becomes obvious that peak oil has arrived. ..."
"... Of course some will agree but say that "No big deal, renewables will make peak oil a non event!" And these folks are in for an even bigger shock than the peak oil deniers . Well, in my opinion anyway. ..."
"... To me, that is like a farmer saying I estimate next year and beyond that the cost of seed, chemicals, fertilizer, fuel, labor, real estate taxes, etc, will fall by 60%. I am not familiar with any commodity based business where that is reality. Yet almost ALL US LTO did the same thing, 30-60% reduction. ..."
"... The point is, had they not done that, they would have basically lost ALL of their proved reserves at 2015 prices. My point is, how can a company that is losing large amounts, pre-reserve write downs, have any economic reserves? If the costs cannot all be recovered for the well at SEC prices, there are no reserves for that well. ..."
"... 2016 SEC prices are about $10 lower. We shall see what they come up with. ..."
"... I also agree peak oil will be obvious before long, I think eventually (by 2020 at least unless a big recession intervenes) oil prices will rise, maybe to $100/b. Most will expect a big surge in output, but any surge will be small (1 Mb/d at most) and likely short lived (if it happens at all). ..."
Hi Ron. Thanks for your awesome website. The word blog doesn't do it justice.. It is truly the
best, and attracts a great group of commenters. May I ask how you might see 'serious depletion'
playing out, roughly speaking? Do you have any predictions or wild ass guesses on the slope of
the production decline or perhaps where world crude plus condensate production might be by 2020
and/or 2025? Given your wisdom and insight into human nature what are your feelings about the
human response to these future conditions?
Do you have any predictions or wild ass guesses on the slope of the production decline or perhaps
where world crude plus condensate production might be by 2020 and/or 2025?
Not really. We all had a pretty good idea where things were heading until shale oil raised
its ugly head. No one that I know of predicted that. But now it looks like shale oil is a USA
phenomenon with no appreciable production anywhere else in the world.
My strong feeling right now is that the shale oil phenomenon has given the entire world the
idea that peak oil is, or was, an illusion or an idea that had no valid support in the real world.
But peak oil is as real as it ever was. The amount of recoverable oil in the ground is finite.
We may have had the numbers wrong in our personifications because of shale oil. But that does
not change the big picture. The peak oil phenomenon is as real as it ever was.
The real danger is that the media, as well as the general public, has been sold the idea that
peak oil has now been discredited because of shale oil. It has not. And that only increases the
dramatic shock effect it will have when it finally becomes obvious that peak oil has arrived.
Of course some will agree but say that "No big deal, renewables will make peak oil a non event!" And these folks are in for an even bigger shock than the peak oil deniers . Well, in my opinion
anyway.
2016 10K will be out in late February-early March for US LTO producers.
It will be interesting to compare 2014, 2015 and 2016. In particular I am waiting to see the
estimates of future cash flows to see how much more the engineering firms let them slash future
estimated production costs and estimated future development costs.
In my opinion, there was a lot of hocus pocus in those particular numbers, which, of course
provide the basis for proved reserves and PV10.
The amounts slashed from 2014 to 2015 were incredible, for example Mr. Hamm's CLR dropped its
estimate of future production costs by 60%.
To me, that is like a farmer saying I estimate next year and beyond that the cost of seed,
chemicals, fertilizer, fuel, labor, real estate taxes, etc, will fall by 60%. I am not familiar
with any commodity based business where that is reality. Yet almost ALL US LTO did the same thing,
30-60% reduction.
The point is, had they not done that, they would have basically lost ALL of their proved reserves
at 2015 prices. My point is, how can a company that is losing large amounts, pre-reserve write
downs, have any economic reserves? If the costs cannot all be recovered for the well at SEC prices,
there are no reserves for that well.
2016 SEC prices are about $10 lower. We shall see what they come up with.
"And these folks are in for an even bigger shock than the peak oil deniers . Well, in my opinion
anyway."
I think the odds are pretty good that Ron is right. We can hope that Dennis C and the others
who think production will stay on a plateau for a while and then gradually decline rather slowly
are right.
If they are, and the electric car industry does as well as hoped, then the economy national
and world wide can probably adapt fast enough to avoid catastrophic economic depression brought
on specifically by scarce and expensive oil.
If for some reason, any reason, oil production declines sharply and suddenly, for a long period
or permanently, we are going to be in a world of hurt.
People need not starve, at least in richer and economically advanced countries, but millions
of people could lose their jobs and a lot of businesses dependent on cheap travel would fail.
The effects of these lost jobs would expand outward thru the economy doing Sky Daddy alone knows
how much damage.
In poor countries, starvation is a real possibility.
The time frame I have in mind in making this comment is out to twenty or thirty years. After
that, it's anybody's guess what the population will be, and what the economy will be like.Hell,
it's anybody's guess as far as next week is concerned, so far as that goes.
Plateau until 2019 or 2020 then some decline slow at first and gradually accelerating. Unless
a recession hits in that case acceleration is more rapid.
I also agree peak oil will be obvious before long, I think eventually (by 2020 at least unless
a big recession intervenes) oil prices will rise, maybe to $100/b. Most will expect a big surge
in output, but any surge will be small (1 Mb/d at most) and likely short lived (if it happens
at all).
Whether oil prices spike and this leads to either Great Depression(GD) 2 or a lot of EV and
plugin sales is unknown, it might be the latter at first with GD2 following between 2025 and 2030.
It will depend on how quickly oil output falls, I think it might be 1% or less until 2030 if oil
prices are high with faster decline rates once the depression hits.
As usual big WAGs by me. Of course nobody knows, but your insights on how things might play
out would be interesting.
Hi Dennis,
If I am not mistaken, you have moved up your estimate of global petroleum peak, and perhaps the
pace of the decline.
Just months ago, your opinion was that it would not occur until 2025. Are you moved by any specifics
that you would like to share?
Thank you, and as a follower of your good work, I appreciate your insight.
Steve at SRS Rocco report has a new, very informative post up showing that Middle East oil exports
are lower today than 40 years ago!
"According to the 2016 BP Statistical Review, the Middle East produced 30.10 mbd of oil in
2015 compared to 22.35 mbd in 1976. This was a growth of 7.75 mbd. However, Middle East domestic
oil consumption increased from 1.51 mbd in 1976 to 9.57 mbd in 2015. Thus, the Middle Eastern
economies devoured an additional 8.06 mbd of oil during that 40 year time-period."
Would be great to see an update on the global export land model that Jeff Brown (westexas)
used to update us on. How much C+C is available on the global markets as of today after domestic
consumption?
I´m not Jeff B. but if I remember last version of BP stats. correctly, the net export market has
been on a bumpy plateau between 2005-2015. It has varied between 41-44 Mb/day (approx.). 2015
set a record which was just slightly higher than 2005. It´s possible that 2016 will be slightly
higher.
World exports have been bumpy flat for 10 years or so.
Ecuador might be an importer soon'ish.
I like this site as I take an interest in observing the changes as exporters become importers.
The country charts provide some rough idea of those timings.
2015 was indeed a net export record. The increase came mainly from Canada, Iraq and Russia. Iran
may boost net exports in 2016, Kazakhstan will also add some. At least to me it seems unlikely
that net-exports will grow substantially above the 2015/16-level. Increase from the mentioned
countries will be needed to compensate decline in Mexico, Colombia, etc (+problems in Venezuela).
Seems more likely it will continue on the plateau or decline. Nigeria and Libya are wildcards.
mazamascience also use BP-data but seems to give a much higher number, ~48Mb/day. Don't know
why.
How do you calculate world total net export numbers if total global exports = total global imports?
Meanwhile, BP statistics for world oil exports (not net exports) show a rising trend.
I expect further increase in 2016, due to rising exports from Saudi Arabia, Iran, Iraq and Russia.
The IEA Oil Market Report, November 2016 on Iran's oil production and exports:
"With gains of 810 kb/d so far this year, Iran has emerged as the world's fastest source of
supply growth. Crude oil output rose by 40 kb/d in October to reach a pre-sanctions rate of 3.72
mb/d and shipments of crude oil climbed well above 2.4 mb/d, a rate not seen in at least seven
years.
For six straight months, the National Iranian Oil Co (NIOC) has been exporting more than 2 mb/d
of crude – double the volume seen under sanctions."
But that's not what your chart says, in controvention to BP's data.
Your chart says KSA exports at 9. Production is known or thought to be 10.5. And since consumption
is all liquids, that chart's products level is the correct number.
"... the capitalist economy is more and more an asset driven one. This article does not even begin to address the issue of asset valuations, the explicit CB support for asset inflation and the effect on inequality, and especially generational plunder. ..."
"... the problem of living standards is obviously a Malthusian one. despite all the progress of social media tricks, we cannot fool nature. the rate of ecological degradation is alarming, and now irreversible. "the market" is now moving rapidly to real assets. This will eventually lead to war as all war is eventually for resources. ..."
No matter what central banks do, their actions will not be able to create the same level of
economic growth that we have become used to over the past seven decades.
Economic growth does not come from the central banks; if government sought to provide the basics
for all its citizens, including health care, education, a home, and proper food and all the infrastructure
needed to give people the basics, then you could have something akin to "growth" while at the
same time making life more pleasant for the less fortunate. There seems to be no definition of
economic growth that includes everyone.
This seems a very elaborate way of stating a simple problem, that can be summarised in three
points.
The living standards of most people have fallen over the last thirty years or so because of
the impact of neoliberal economic policies. Conventional politicians are promising only more
of the same. Therefore people are increasingly voting for non-conventional politicians.
Neoliberalism has only exacerbated falling living standards. Living standards would be falling
even without it, albeit more gradually.
Neoliberalism itself may even be nothing more than a standard type response of species that
have expanded beyond the capacity of their environment to support them. What we see as an evil
ideology is only the expression of a mechanism that apportions declining resources to the elites,
like shutting shutting down the periphery so the core can survive as in hypothermia.
I really don't have problem with this. Let the financial sector run the world into the ground
and get it over with.
In defference to a great many knowledgable commentors here that work in the FIRE sector, I
don't want to create a damning screed on the cost of servicing money, but at some point even the
most considered opinions have to acknowledge that that finance is flooded with *talent* which
creates a number of problems; one being a waste of intellect and education in a field that doesn't
offer much of a return when viewed in an egalitarian sense, secondly; as the field grows due to,
the technical advances, the rise in globilization, and the security a financial occuptaion offers
in an advanced first world country nowadays, it requires substantially more income to be devoted
to it's function.
This income has to be derived somewhere, and the required sacrifices on every facet of a global
economy to bolster positions and maintain asset prices has precipitated this decline in the well
being of peoples not plugged-in to the consumer capitalist regime and dogma.
Something has to give here, and I honestly couldn't care about your 401k or home resale value,
you did this to yourself as much as those day-traders who got clobbered in the dot-com crash.
the capitalist economy is more and more an asset driven one. This article does not even
begin to address the issue of asset valuations, the explicit CB support for asset inflation and
the effect on inequality, and especially generational plunder.
the problem of living standards is obviously a Malthusian one. despite all the progress
of social media tricks, we cannot fool nature. the rate of ecological degradation is alarming,
and now irreversible. "the market" is now moving rapidly to real assets. This will eventually
lead to war as all war is eventually for resources.
"... RBC Capital Markets' Global Head of Commodity Strategy Helima Croft outlined three potential scenarios for WTI crude on CNBC's "Fast Money" for the new year. The most bullish situation would be seeing more than a million barrels of oil pulled off the market and prices averaging in the $60 dollar range. ..."
"... "If you are thinking about sort of about a mid-$30s average for WTI, low-$40s, I think that's a bearish scenario," said Croft, who's also a CNBC contributor. ..."
"... "Our base case is this sort of middle range... $52 is our WTI call for next year," she said, implying that U.S. crude would be nearly one-third higher than its current trading levels. The fourth quarter "is really where you want to be looking for WTI to sort of take-off," she added. ..."
RBC Capital Markets' Global Head of Commodity Strategy Helima Croft outlined three potential
scenarios for WTI crude on CNBC's "Fast Money" for the new year. The most bullish situation would
be seeing more than a million barrels of oil pulled off the market and prices averaging in the
$60 dollar range.
The worst case scenario involves a tsunami of new production from OPEC, Saudi Arabia, Iran and
Libya hitting the market -- all but certain to drive prices even lower. On Thursday, the final day
of trading before the Christmas holiday, Brent and U.S. crude closed up by more than a percent,
but still well under $40 per barrel.
"If you are thinking about sort of about a mid-$30s average for WTI, low-$40s, I think that's
a bearish scenario," said Croft, who's also a CNBC contributor.
... ... ....
"Our base case is this sort of middle range... $52 is our WTI call for next year," she
said, implying that U.S. crude would be nearly one-third higher than its current trading levels.
The fourth quarter "is really where you want to be looking for WTI to sort of take-off," she
added.
"... mazamascience.com/oilexport and the BP bible says 2015 oil consumption growth in China was +5%. There is no continue to decline. And they have 21 million more cars this year burning oil. How can there be much decline, at all? ..."
"... Just checked EIA. No evidence of any significant fall in US consumption. It will probably rise. Indian consumption was +7% last year. No real evidence of a global drop in consumption. Population grows. So why is this surprising? ..."
Here is the sort of stuff going on. Some stuff profoundly right. Some stuff completely, factually
wrong. Final paras from a ZH article:
In sum, OPEC has so far managed to fool the market,
and send the price of oil surging off all time lows hit in early 2016 even as OPEC output has
reached record highs, and the just concluded deal may end up eliminating just a small fraction
of this excess supply.
All true.
There is also risk that demand – most notably out of China – will continue to decline, delaying
the so-called market equilibrium even assuming full OPEC and non-OPEC compliance.
mazamascience.com/oilexport and the BP bible says 2015 oil consumption growth in China was
+5%. There is no continue to decline. And they have 21 million more cars this year burning oil.
How can there be much decline, at all?
And, courtesy of Modi's ridiculous "demonetization" attempt, India's economic outlook is
suddenly in jeopardy: should Indian oil import demand decline as a result, OPEC will have to double
its daily production cuts just to catch up to the drop in global demand.
Just checked EIA. No evidence of any significant fall in US consumption. It will probably rise.
Indian consumption was +7% last year. No real evidence of a global drop in consumption. Population
grows. So why is this surprising?
Perhaps the best forecast at this point is that the price of oil will remain rangebound
between $45 and $55. Below that and more jawboning will emerge; above it and concerns about shale
output will dominate.
That's not best. They are all equally worthless.
Finally, it is safe to say that this is OPEC's final attempt to prove it is still relevant
in a shale-driven world after the "2014 Thanksgiving massacre" when Saudi Arabia essentially unilaterally
crushed the organization, and the price of oil. Should OPEC blow this, it will likely be game
over for any future attempts to artificially prop up the oil price by the world's oil exporters.
Prime Minister Haider al-Abadi told The Associated Press that current prices are not sustainable
for oil-producing countries.
Al-Abadi's comments could be critical because Iraq - along with Iran - has been reluctant to go
along with cuts, creating an obstacle for an OPEC deal, according to published reports.
Al-Abadi said he understands that OPEC members will agree to reduce production by between 900,000
and 1.2 million barrels per day - that would be a cut of between 2.7 percent and 3.6 percent from
October levels. He said it would be enough to push prices up.
"Yes, we will take our share and we agreed to this," he told the AP.
Kenneth Medlock, director of an energy-studies center at Rice University, said if Iraq pledges to
cut its own production it could influence other reluctant countries and help push OPEC to an
agreement. The size of the cuts suggested by al-Abadi would be big enough to push up prices, he
said.
A successful production-cut might re-establish the cartel as oil's swing producer - able to
balance global supply with demand and influence prices - "because they will then have the most
flexible capability of dealing with near-term price instability, Medlock said, particularly if
global inventories tighten quickly."
Benchmark international oil rose $1, or 2 percent, on Monday to close at $48.24 a barrel. Al-Abadi
said for every dollar oil prices rise, Iraq gains about $1 billion.
In late 2014, as crude prices tumbled from more than $100 a barrel, OPEC countries decided not to
intervene - they expected falling prices to drive high-cost producers in the U.S. out of
business.
But a worldwide glut of oil has persisted and OPEC has been pumping at record levels. Now the
cartel is trying to regain some of its historical ability to affect prices.
"... I do not understand the financial behavior of shale oil development, no. In the Bakken and the Eagle Ford it was indeed about reserve "growth," as Alex points out. Growth at the expense of profitability. That model failed (look at the debt, debt to asset ratios and losses for operators in those two shale oil plays) because the price of oil collapsed. ..."
"... Now, in spite of that, the Permian is using the same business model; growth at the expense of profitability. It is borrowing billions in the bottom of a price down cycle (it thinks) believing prices have no where to go but up. ..."
"... I think oil prices are a long way away from being high enough to save the shale oil industry. ..."
"... We may be overthinking all this and Alex is right again; it may be a simple matter of everyone taking advantage of a loosey goosey monetary policy in America. Money gets printed, Central Banks give it away, lenders are in desperate need of miniscule yields and CEO's and upper management borrow it, make millions personally on bonuses and incentives for growing reserves, then walk away from the whole shebang (Sheffield) before the loans come due. America looks the other way because they get cheap gasoline. ..."
I do not understand the financial behavior of shale oil development, no. In the Bakken and the
Eagle Ford it was indeed about reserve "growth," as Alex points out. Growth at the expense of profitability.
That model failed (look at the debt, debt to asset ratios and losses for operators in those two shale
oil plays) because the price of oil collapsed.
Now, in spite of that, the Permian is using
the same business model; growth at the expense of profitability. It is borrowing billions in the
bottom of a price down cycle (it thinks) believing prices have no where to go but up.
I would
say this particular shale play might work, except that from the data I see the UR's on those wells
are going to be pitiful at best, far less than the Bakken. Unless it is by the shear number of wells
those operators are not going to have a lot of reserves that will appreciate with rising prices.
It will therefore fail too, just like the others, perhaps for different reasons, I don't know.
I think oil prices are a long way away from being high enough to save the shale oil industry.
We may be overthinking all this and Alex is right again; it may be a simple matter of everyone
taking advantage of a loosey goosey monetary policy in America. Money gets printed, Central Banks
give it away, lenders are in desperate need of miniscule yields and CEO's and upper management borrow
it, make millions personally on bonuses and incentives for growing reserves, then walk away from
the whole shebang (Sheffield) before the loans come due. America looks the other way because they
get cheap gasoline.
Happy
Thanksgiving Mike! This article is for you! The RRC just refused to allow Pioneer to reclassify
oil wells in the Eagle Ford to .. wait for it .GAS WELLS.
I believe Pioneer just admitted the you, Shallow, Alex, and the others have been right all
along about the GOR going up, up and up.
It seems that Pioneer is trying to take advantage of the "high cost gas tax credit" designed
to encourage gas production in HIGH COST low permeable tight gas reservoirs.
Interestingly, this move by Pioneer has initiated a discussion about whether there should
be a new category for classifying wells. Hmmm sounds like the industry is about to hit the
new Texas Legislative session up for some new tax relief to encourage horizontal drilling in
its new favorite geological province the Permian Basin. But it will apply to the Barnett, Haynesville,
Eagle Ford, and all those other disasters.
Happy Thanksgiving to you too, John -- I had actually seen this before. Scoundrels they are,
one and all; Pioneer too, a Texas Company start to finish. The TRRC will roll over in another
year or so, watch.
Despite the CEOs not worrying about profits, I would think at some point the people
buying the bonds or stock of these companies would realize that the Emperor is naked.
Eventually when enough investors get burned, the money will stop flowing. Maybe not in 2016,
and perhaps not in 2017, but if oil prices remain low for the long term as experts in the field
seem to suggest is a likely event (though nobody really knows future oil prices), the money
will dry up. In that case these companies are done.
"... "Our analysis shows we are entering a period of greater oil price volatility (partly) as a result of three years in a row of global oil investments in decline: in 2015, 2016 and most likely 2017," IEA director general Fatih Birol said, speaking at an energy conference in Tokyo. ..."
"... Oil prices have risen to their highest in nearly a month, as expectations grow among traders and investors that OPEC will agree to cut production, but market watchers reckon a deal may pack less punch than Saudi Arabia and its partners want. ..."
"... BMI's outlook is more optimistic than groups like the International Energy Agency, which said last week that the industry might cut spending in 2017 for a third year in a row as companies continue to grapple with weaker finances. Oil prices still hover around $50 a barrel, less than half the level of the summer of 2014. ..."
"... The chart below shows Exxon's E&P capex in 2007-2015 (in US$bn). There was a sharp increase in US capex (both in absolute in relative terms) following the XTO deal. In 2015, the company cut spending both in the US and abroad ..."
Investment in new oil production is likely to fall for a third year in 2017
as a global supply glut persists, stoking volatility in crude markets, the head
of the International Energy Agency (IEA) said on Thursday.
"Our analysis shows we are entering a period of greater oil price
volatility (partly) as a result of three years in a row of global oil
investments in decline: in 2015, 2016 and most likely 2017," IEA director
general Fatih Birol said, speaking at an energy conference in Tokyo.
"This is the first time in the history of oil that investments are
declining three years in a row," he said, adding that this would cause
"difficulties" in global oil markets in a few years.
Oil prices have risen to their highest in nearly a month, as
expectations grow among traders and investors that OPEC will agree to cut
production, but market watchers reckon a deal may pack less punch than Saudi
Arabia and its partners want.
The Organization of the Petroleum Exporting Countries meets next week to try
to finalize to output curbs.
"Our analysis shows that when prices go to $60, we'll make a big chunk of
U.S. shale oil economical and within the nine months to 12 months of time, we
may see a response coming from the shale oil and other high-cost areas," Birol
told Reuters, speaking in an interview on the sidelines of the conference.
"And this may again put downward pressure on the prices."
Birol said that level would be enough for many U.S. shale companies to
restart stalled production, although it would take around nine months for the
new supply to reach the market.
The IEA director general said it is still early to speculate what Donald
Trump's presidency in the United States will have on energy policies.
"Having said that, both U.S. shale oil and U.S. shale gas have a very strong
economic momentum behind them," Birol said.
"Shale gas has significant economic competitiveness today, and we think it
will be so in the next years to come."
• Capital spending seen growing 2.5% in 2017 and 7%-14% in 2018
• U.S. independents, Asian giants seen spurring spending growth
The oil industry may be ready to open its wallet after two years of
slashing investments.
Companies will spend 2.5 percent more on capital expenditure next year
than they did this year, the first yearly growth in such spending since
2014, BMI Research said in a Sept. 22 report. Spending will increase by
another 7 percent to 14 percent in 2018. It will remain well below the $724
billion spent in 2014, before the worst oil crash in a generation caused
firms to cut back on drilling and exploration to conserve cash, the
researcher said.
North American independent producers, Asian state-run oil companies and
Russian firms are prepared to boost investments next year, outweighing
continued cuts from global oil majors such as Exxon Mobil Corp. and Total
SA, BMI said, based on company guidance and its own estimates. Spending will
increase to a total of $455 billion next year from $444 billion this year,
BMI said.
"North America is where we're really expecting things to turn around,"
Christopher Haines, BMI's head of oil and gas research, said by telephone.
"We've seen a push to really reduce costs, reduce spending and take out any
waste and inefficiency. These companies have gotten to the point where
they're all set up to react."
BMI's outlook is more optimistic than groups like the International
Energy Agency, which said last week that the industry might cut spending in
2017 for a third year in a row as companies continue to grapple with weaker
finances. Oil prices still hover around $50 a barrel, less than half the
level of the summer of 2014.
From what I am reading, Permian hz wells will be drilled in greater numbers in
2017, regardless of price.
These wells are generally less prolific than those in the Bakken and EFS.
However, the money has been raised and therefore it will spent.
To me, a good question is how much money is being diverted away from longer
term projects that will ultimately produce more oil, to drill these Permian
wells?
The Permain wells have no staying power. Under 50 bopd after 24 months is
the rule, not the exception. Under 200,000 cumulative in 60 months is the rule,
not the exception.
"To me, a good question is how much money is being diverted away from longer
term projects that will ultimately produce more oil, to drill these Permian
wells?"
shallow sand
The companies that are postponing longer term projects are not the same
companies that are planning to increase drilling in LTO plays.
"The companies that are postponing longer term projects are not the same
companies that are planning to increase drilling in LTO plays."
I
assumed he meant investment money. If investors want to be in gas and
oil, are they picking the companies with best chance of long-term success
(if there is such a thing anymore)?
ExxonMobil, Chevron, ConnocoPhillips, Hess, Marathon and Oxy all
have significant LTO production and all are, or were considered
international upstream producers.
I agree the supermajors are defensive stocks. But there were
many "growth" stock US companies which explored and produced
offshore/internationally or both, prior to the LTO boom.
Most of large US E&Ps and mid-sized integrateds have divested
their overseas assets during the years of shale boom.
I'm not sure that Exxon and Chevron are planning to increase
their shale exposure in the near term. For Exxon, US upstream
operations were hugely loss-making in 2015-16. And it has
recently made two relatively large discoveries outside US.
AlexS. Are those XOM international discoveries primarily oil
or gas?
Also, for the international assets you refer to
which US companies divested, do you know whether the buyers
are aggressively developing them? Just a guess, but I suspect
maybe not.
11/30 is a big day, hoping for a cut, hard to say if it
occurs whether it will be adhered to, other than by maybe the
Gulf States.
Interesting to
note Nexen is a partner in both ventures, while Hess
and Chevron are in one each.
I agree XOM has sustained significant losses in
North America, but they continue to spend money on new
wells. Had they not spent the money they have in North
America (both shale and tar sands) would the money have
been spent elsewhere. A tough one to know the answer
to.
I recall XOM was going to partner in Russia on
projects and those were halted for political reasons?
Did those projects go ahead without them?
I'm not saying that Exxon stopped
investing in U.S. upstream. My point is that oil
supermajors, like Exxon, Chevron, BP, Shell and Total are
not diverting investments from deep offshore, LNG and
other long-term projects to U.S. shale. They cut upstream
capex both in U.S. and in overseas projects.
The chart below shows Exxon's E&P capex in
2007-2015 (in US$bn). There was a sharp increase in US
capex (both in absolute in relative terms) following the
XTO deal. In 2015, the company cut spending both in the US
and abroad
"... In the second quarter of 2016, the companies reduced production by nearly 930,000 bpd, according to Morgan Stanley. ..."
"... Large oilfields, such as deepwater developments off the coasts of the United States, Brazil, Africa and Southeast Asia, typically take three to five years and billions in investment to develop. ..."
"... "Still, unless investment rebounds relatively soon, this steep downward trend is likely to resume in 2018 and beyond." ..."
"... We haven't even begun to see a "steep downward trend" yet. As to "softening" – there is less new production coming on next year, overall and for the IOCs, than this – highlighting Canada, Brazil etc. doesn't change that. ..."
"... Also when are they going to actually understand that the companies don't ever "slash" output, like its a choice – depletion does it for them. ..."
"... I don't know when peak decent reporting happened but it's well into decline now (another big internet age negative). ..."
"... Also, the author quotes a report by Morgan Stanley (that we haven't seen). Apparently, those "109 listed companies that produce more than a third of the world's oil" are covered by MS equity research team. And changes in their output may not fully reflect trends in overall global oil production. ..."
"... But I agree that articles in Reuters, Bloomberg and other MSM sources often misinterpret third party research. A recent example are numerous article about USGS assessment of TRR in the Wolfcamp formation ..."
The world's listed oil companies have slashed oil output by 2.4 percent so
far this year.
The aggregated production of 109 listed companies that produce more than a
third of the world's oil fell in the third quarter of 2016 by 838,000 barrels
per day from a year earlier to 33.88 million bpd, data provided by Morgan
Stanley showed.
In the second quarter of 2016, the companies reduced production by
nearly 930,000 bpd, according to Morgan Stanley.
The firms include national oil champions of China, Russia and Brazil,
international producers such as Exxon Mobil and Royal Dutch Shell, as well as
U.S. shale oil producers like EOG Resources and Occidental Petroleum.
The drop in oil companies' output is particularly compelling given the
increase in 2015, when third-quarter production rose by some 1.9 million bpd.
"Clearly, we have seen a large swing in the year-on-year trend in
production, from strong growth as recent as a year ago, now to steep decline.
This is the outcome of the strong cutbacks in investment," Morgan Stanley
equity analyst Martijn Rats said.
Capital expenditure for the companies combined more than halved from $136
billion in the third quarter of 2014 to $58 billion in the same period this
year, according to Rats.
Oil executives and the International Energy Agency have warned that a sharp
drop in global investment in oil and gas would result in a supply shortage by
the end of the decade.
Large oilfields, such as deepwater developments off the coasts of the
United States, Brazil, Africa and Southeast Asia, typically take three to five
years and billions in investment to develop.
Cost reductions and increased efficiencies have only partly offset the drop
in production as a result of the lower investment. Technological advancements
have also helped boost onshore U.S shale production.
"These declines should temporarily soften in 2017 as new fields are coming
on-stream in Canada, Brazil, the former Soviet Union and U.S. tight oil
probably stabilizes," Rats said.
"Still, unless investment rebounds relatively soon, this steep downward
trend is likely to resume in 2018 and beyond."
We haven't even begun to see a "steep downward trend" yet. As to
"softening" – there is less new production coming on next year, overall and
for the IOCs, than this – highlighting Canada, Brazil etc. doesn't change
that.
When is someone in Reuters or Bloomberg going to figure out that 2017 + 3
(or 5) + 1 (for FEED and FID approval at the beginning and ramp up at the
end) = 2021 (or 2023) so there is no way to cover drops "at the end of the
decade" now.
Also when are they going to actually understand that the
companies don't ever "slash" output, like its a choice – depletion does it
for them.
And how about this paragraph
"Cost reductions and increased efficiencies have only partly offset
the drop in production as a result of the lower investment. Technological
advancements have also helped boost onshore U.S shale production."
He/she has suddenly started to talk about company finances rather than
production, but without actually telling the reading public.
Cost reductions caused the drop for heavens sake. "Increased
efficiencies" and "technological advancements" – do you think the author has
the faintest idea what that actually means and how it is related to anything
else he says.
I don't know when peak decent reporting happened but it's well into
decline now (another big internet age negative).
"When is someone in Reuters or Bloomberg going to figure out that 2017 +
3 (or 5) + 1 (for FEED and FID approval at the beginning and ramp up at
the end) = 2021 (or 2023) so there is no way to cover drops "at the end
of the decade" now."
It should be actually 2015 + 3 (or 5), as pre-FID
projects have been posponed since end-2014 – early 2015.
Also, the author quotes a report by Morgan Stanley (that we
haven't seen). Apparently, those "109 listed companies that produce more
than a third of the world's oil" are covered by MS equity research team.
And changes in their output may not fully reflect trends in overall
global oil production.
But I agree that articles in Reuters, Bloomberg and other MSM
sources often misinterpret third party research. A recent example are
numerous article about USGS assessment of TRR in the Wolfcamp formation
"... This suggests the sweetspot theory is also bogus, unless there are 9 years of them, meaning it's ALL been sweetspots so far. 9 yrs of sweetspots might as well be called just normal rather than sweet. ..."
"... It is pretty much all bogus, yes, Watcher. With any rudimentary understanding of volumetric calculations of OOIP in a dense shale like the Bakken, there is only X BO along the horizontal lateral that might be "obtained" from stimulation. More sand along a longer lateral does not necessarily translate into greater frac growth (an increase in the radius around the horizontal lateral). Novices in frac technology believe in halo effects, or that more sand equates to higher UR of OOIP per acre foot of exposed reservoir. That is not the case; longer laterals simply expose more acre feet of shale that can be recovered. Recovery factors in shale per acre foot will never exceed 5-6%, IMO, short of any breakthroughs in EOR technology. That will take much higher oil prices. ..."
"... Its very simple, actually bigger fracs (that cost lots more money!!) over longer laterals result in higher IP's and higher ensuing 90 day production results. That generates more cash flow (imperative at the moment) and allows for higher EUR's that translate into bigger booked reserve assets. More assets means the shale oil industry can borrow more money against those assets. Its a game, and a very obvious one at that. ..."
Here is the production graph. Not that much has happened. There was a big drop for 2011. 2009
on the other hand saw an increase. Up to the left, which is very hard to see, 2015 continues to
follow 2014 which follows 2013 which follows 2012. Will we see 2013 reach 2007 the next few months?
Its on purpose both because I wanted to zoom in and because the data for first 18 months or so
for the method I used above is not very usable. Bellow is the production profile which is better
for seeing differences the first 18 months. Above graph is roughly 6 months ahead of the production
profile graph.
And I guess we can all see no technological breakthru. 2014's green line looks superior to
first 3 mos 2015.
2016 looks like it declines to the same level about 2.5 mos later, but is clearly a steeper
decline at that point and is likely going to intersect 2014's line probably within the year.
There is zero evidence on that compilation of any technological breakthrough surging output
per well in the past 2-3 yrs.
In fact, they damn near all overlay within 2 yrs. No way in hell there is any spectacular EUR
improvement.
And . . . in the context of the moment, nope, no evidence of techno breakthrough. But also
no evidence of sweetspots first.
I suppose you could contort conclusions and say . . . Yes, the sweetspots were first - with
inferior technology, and then as they became less sweet the technological breakthroughs brought
output up to look the same.
clarifying, the techno breakthrus are bogus. They would show in that data if they were real.
And it would be far too much coincidence for techno breakthrus to just happen to increase flow
the exact amount lost from exhausting sweet spots.
This suggests the sweetspot theory is also bogus, unless there are 9 years of them, meaning
it's ALL been sweetspots so far. 9 yrs of sweetspots might as well be called just normal rather
than sweet.
It is pretty much all bogus, yes, Watcher. With any rudimentary understanding of volumetric
calculations of OOIP in a dense shale like the Bakken, there is only X BO along the horizontal
lateral that might be "obtained" from stimulation. More sand along a longer lateral does not necessarily
translate into greater frac growth (an increase in the radius around the horizontal lateral).
Novices in frac technology believe in halo effects, or that more sand equates to higher UR of
OOIP per acre foot of exposed reservoir. That is not the case; longer laterals simply expose more
acre feet of shale that can be recovered. Recovery factors in shale per acre foot will never exceed
5-6%, IMO, short of any breakthroughs in EOR technology. That will take much higher oil prices.
Its very simple, actually bigger fracs (that cost lots more money!!) over longer laterals
result in higher IP's and higher ensuing 90 day production results. That generates more cash flow
(imperative at the moment) and allows for higher EUR's that translate into bigger booked reserve
assets. More assets means the shale oil industry can borrow more money against those assets. Its
a game, and a very obvious one at that.
Nobody is breaking new ground or making big strides in greater UR. That's internet dribble.
Freddy is right; everyone in the shale biz is pounding their sweet spots, high grading as they
call it, and higher GOR's are a sure sign of depletion. Moving off those sweet spots into flank
areas will be even less economical (if that is possible) and will result in significantly less
UR per well. That is what is ridiculous about modeling the future based on X wells per month and
trying to determine how much unconventional shale oil can be produced in the US thru 2035. The
term, "past performance is not indicative of future results?" We invented that phrase 120 years
ago in the oil business.
That, sir, is pretty much the point. I see what looks like about 20% IP increase for the extra
stages post 2008/9/10. How could there not be going from 15 stages to 30+?
I see NO magic post peak. They all descend exactly the same way and by 18-20 months every drill
year is lined up. That's actually astounding - given 15 vs 30 stages. There should be more volume
draining on day 1 and year 2, but the flow is the same at month 20+ for all drill years. This
should kill the profitability on those later wells because 30 stages must cost more.
But profit is not required when you MUST have oil.
Freddy, is there something going on in the data? How can 30 stage long laterals flow the same
at production month 24 as the earlier dated wells at their production month 24 –whose lengths
of well were MUCH shorter?
I can only speculate why the curves look like they do. It could be that the newer wells would
have produced more than the older wells, but closer well spacing is causing the UR to go down.
Here is the updated yearly decline rate graph. 2010 has seen increased decline rates as I suspected.
The curves are currently gathering in the 15%-20% range.
2007 only has 161 wells. So it makes the production curve a bit noisy as you can see above. Current
yearly decline rate for 2007 is 7,2% and the average from month 98 to 117 would translate to a
10,3% yearly decline rate. The 2007 curve look quite different from the other curves, so thats
why I did not include it.
Thanks. The 2008 wells were probably refracked so that curve is messed up. If we ignore 2008,
2007 looks fairly similar to the other curves (if we consider the smoothed slope.) I guess one
way to do it would be to look at the natural log of monthly output vs month for each year and
see where the curve starts to become straight indicating exponential decline. The decline rates
of many of the curves look similar through about month 80 (2007, 2009, 2010, 2011) after 2011
(2012, 2013, 2014) decline rates look steeper, maybe poor well quality or super fracking (more
frack stages and more proppant) has changed the shape of the decline curve. The shape is definitely
different, I am speculating about the possible cause.
2007 had much lower initial production and the long late plateau gives it a low decline rate also.
But yes, initial decline rates look similar to the other curves. If you look at the individual
2007 wells then you can see that some of them have similar increases to production as the 2008
wells had during 2014. I have not investigated this in detail, but it could be that those increases
are fewer and distributed over a longer time span than 2008 and it is what has caused the plateau.
If that is the case, then 2007 may not be different from the others at and we will see increased
decline rates in the future.
Regarding natural log plots. Yes it could be good if you want to find a constant exponential
decline. But we are not there yet as you can see in above graph.
One good reason why decline rates are increasing is because of the GOR increase. When they
pump up the oil so fast that GOR is increasing, then it's expected that there are some production
increases first but higher decline rates later. Perhaps completion techniques have something to
do with it also. Well spacing is getting closer and closer also and is definitely close enough
in some areas to cause reductions in UR. But I would expect lower inital production rather than
higher decline rates from that. But maybe I´m wrong.
Ok Enno's data from NDIC shows 73 well completions in North Dakota in Sept 2016, 33 were confidential
wells, if we assume 98% of those were Bakken/TF wells that would be 72 ND Bakken/TF wells completed
in Sept 2016.
I have 75 in my data, so about the same. They have increased the number of new wells quite alot
the last two months. It looks like the addtional ones mainly comes from the DUC backlog as it
increased withouth the rig count going up. But I see that the rig count has gone up now too.
Ron you say " Bakken production continues to decline though I expect it to level off soon."
A few words of wisdom as to the main reasons why it would level off? Price rise?
Even though you asked Ron. He might think that the decline in the number of new wells per month
may have stabilized at around 71 new wells per month. If that rate of new completions per month
stays the same there will still be decline but the rate of decline will be slower. Scenario below
shows what would happen with 71 new wells per month from Sept 2016 to June 2017 and then a 1 well
per month increase from July 2017 to Dec 2018 (89 new wells per month in Dec 2018).
I am not so convinced that either Texas or the Bakken is finished declining at the current level
of completions. There was consistent completions of over 1000 wells in Texas until about October
of 2015. Then it dropped to less than half of that. The number of producing wells in Texas peaked
in June of this year. Since then, through October, it has decreased by roughly 1000 wells a month.
The Texas RRC reports are indicating that they are still plugging more than they are completing.
I remember reading one projection recently for what wells will be doing over time in the Eagle
Ford. They ran those projections for a well for over 22 years. Not sure which planet we are talking
about, but in Texas an Eagle Ford does well to survive 6 years. They keep referring to an Eagle
Ford producing half of what they will in the first two years. In most areas, I would say that
it is half in the first year.
The EIA, IEA, Opec, and most pundits have the US shale drilling turning on a dime when the oil
price reaches a certain level. If it was at a hundred now, it would still take about two years
to significantly increase production, if it ever happens. I am not a big believer that US shale
is the new spigot for supply.
The wells being shut in are not nearly as important as the number of wells completed because
the output volume is so different. So the average well in the Eagle Ford in its second month of
production produces about 370 b/d, but the average well at 68 months was producing 10 b/d. So
about 37 average wells need to be shut in to offset one average new well completion.
Point is that total well counts are not so important, it is well completions that drive output
higher.
Output is falling because fewer wells are being completed. When oil prices rise and profits
increase, completions per month will increase and slow the decline rate and eventually raise output
if completions are high enough. For the Bakken at an output level of 863 kb/d in Dec 2017 about
79 new wells per month is enough to cause a slight increase in output. My model slightly underestimates
Bakken output, for Sept 2016 my model has output at 890 kb/d, about 30 kb/d lower than actual
output (3% too low), my well profile may be slightly too low, but I expect eventually new well
EUR will start to decrease and my model will start to match actual output better by mid 2017 as
sweet spots run out of room for new wells.
Guess I will remember that for the future. The number of producing wells is not important. Kinda
like I got pooh poohed when I said the production would drop to over 1 million barrels back in
early 2015.
Do you agree that the shut in wells tend to be low output wells? So if I shut down 37 of those
but complete one well the net change in output is zero.
Likewise if I complete 1000 wells in a year, I could shut down 20,000 stripper wells and the
net change in output would be zero, but there would be 19,000 fewer producing wells, if we assume
the average output of the 1000 new wells completed was 200 b/d for the year and the stripper wells
produced 10 b/d on average.
How much do you expect output to fall in the US by Dec 2017?
Hindsight is 20/20 and lots of people can make lucky guesses. Output did indeed fall by about
1 million barrels per day from April 2015 to July 2016, can you point me to your comment where
you predicted this?
Tell us what it will be in August 2017.
I expected the fall in supply would lead to higher prices, I did not expect World output to
be as resilient as it has been and I also did not realize how oversupplied the market was in April
2015. In Jan 2015 I expected output would decrease and it increased by 250 kb/d from Jan to April,
so I was too pessimistic, from Jan 2015 (which is early 2015) to August 2016 US output has decreased
by 635 kb/d.
If you were suggesting World output would fall from Jan 2015 levels by 1 Mb/d, you would also
have been incorrect as World C+C output has increased from Feb 2015 to July 2016 by 400 kb/d.
If we consider 12 month average output of World C+C, the decline has been 340 kb/d from the 12
month average peak in August 2015 (centered 12 month average).
The dropping numbers are not as much from the wells that produce less than 10 barrels a day, but
from those producing greater than 10, but less than 100. The ones producing greater than 100 are
remaining at a consistent level over 9000 to 9500. The prediction on one million was as to the
US shale only. It is your site, you can search it better than I can,
But then don't take my word for it. You can find the same information under the Texas RRC site
under oil and gas/research and statistics/well distribution tables. Current production for Sep
can be found at online research queries/statewide. It is still dropping, and will long term at
the current activity level. Production drop for oil, only, is a little over 40k per day barrels,
and condensate is lower for September. Proofs in the pudding.
My guess is that you would see a lot more plugging reports, if it were not so expensive to plug
a well. At net income levels where they are, I expect they would put that off as long as they
could.
I trust the NDIC numbers much more than the EIA numbers which are based on a model. Enno Peters
data has 66 completions in August 2016, he has not put up his post for the Sept data yet so I
am using the Director's estimate for now. I agree his estimate is usually off a bit, Enno tends
to be spot on for the Bakken data, for Texas he relies on RRC data which is not very good.
Dennis. Someone pointed out Whiting's Twin Valley field wells being shut in for August.
It appears this was because another 13 wells in the field were recently completed.
It appears that when all 29 wells are returned to full production, this field will be very
prolific initially. Therefore, on this one field alone, we could see some impact for the entire
state.
Does anyone know if these wells are part of Whiting's JV? Telling if they had to do that on
these strong wells. Bakken just not close to economic.
I also note that average production days per well in for EOG in Parshall was 24. I haven't
looked at some of the other "older" large fields yet, but assume the numbers are similar.
I agree higher prices will be needed in the Bakken, probably $75/b or more. To be honest I
don't know why they continue to complete wells, but maybe it is a matter of ignoring the sunk
costs in wells drilled but not completed and running the numbers based on whether they can pay
back the completion costs. Everyone may be hoping the other guys fail and are just trying to pay
the bills as best they can, not sure if just stopping altogether is the best strategy.
There is the old adage that when your in a hole, more digging doesn't help much.
So my model just assumes continued completions at the August rate for about 12 months with
gradually rising prices as the market starts to balance, then a gradual increase in completions
as prices continue to rise from July 2017($78/b) to Dec 2018 (from 72 completions to about 90
completions per month 18 months later). At that point oil prices have risen to $97/b and LTO companies
are making money. Prices continue to rise to $130/b by Oct 2020 and then remain at that level
for 40 years (not likely, but the model is simplistic).
I could easily do a model with no wells completed, but I doubt that will be correct. Suggestions?
Dennis. As we have discussed before, tough to model when there is no way to be accurate regarding
the oil price.
I continue to contend that there will be no quick price recovery without an OPEC cut. Further,
the US dollar is very important too, as are interest rates.
At some point OPEC may not be able to increase output much more and overall World supply will
increase less than demand. My guess is that this will occur by mid 2017 and oil prices will rise.
OPEC output from Libya an Nigeria has recovered, but this can only go so far, maybe another 1
Mb/d at most. I don't expect any big increases from other OPEC nations in the near term.
A big guess as to oil prices has to be made to do a model.
I believe my guess is conservative, but maybe oil prices will remain where they are now beyond
mid 2017.
I expected World supply to have fallen much more quickly than has been the case at oil prices
of $50/b.
"EIA does this by using a relatively new dataset-FracFocus.org's national fracking chemical
registry-to identify the completion phase, marked by the first fracking. If a well shows up on
the registry, it's considered completed "
There is an unlikely peak oil related editorial writer hiding in the most unlikely place: a weekly
English business paper called Capital Ethiopia. The latest editorial is again putting an excellent
perspective on world events.
http://capitalethiopia.com/2016/11/15/system-failure/#.WC1ZCvl9600
For the record, I have no interest or connection to this publication other than that of a paying
reader.
Wouldn't it be nice if mainstream publications would sound a bit more like this.
Thanks all. I thought that the red queen concept meant that there had to be an increase in the
rate of completions. So that 71 year-on-year in north Dakota would only stabilise temporarily.
Perhaps the loss of sweet spots are being counteracted by the improvements in technology? I'm
assuming that even with difficulties of financing there will be a swift increase in completions
should the oil price take off, but not sure how sustainable this would be
Sometimes I think that once the price of oil is up enough that sellers can hedge the their
selling price for two or three years at a profitable level, it will hardly matter what the banks
have to say about financing new wells.
At five to ten million apiece, there will probably be plenty of money coming out of various
deep pockets to get the well drilling ball rolling again, if the profits look good.
Sometimes the folks who think the industry will not be able to raise money forget that it's
not a scratch job anymore. The land surveys, roads, a good bit of pipeline, housing, leases, etc
are already in place, meaning all it takes to get the oil started now is a drill and frack rig.
I don't know what the price will have to be, but considering that a lot of lease and other
money is a sunk cost that can't be recovered, and will have to be written off, along with the
mountain of debts accumulated so far, the price might be lower than a lot of people estimate.
Bankruptcy of old owners results in lowering the price at which an old business makes money
for its new owners.
The Red Queen effect is that more and more wells need to be completed to increase output.
As output decreases fewer wells are needed to maintain output. So at 1000 kb/d output it might
require 120 wells to be completed to maintain output (if new well EUR did not eventually decrease),
but at 850 kb/d it might require about 78 new wells per month to maintain output.
The FED oil production number for October came out yesterday. In below chart the production decline
(blue line) is the same as in the previous month, yet the trend is still a massive decline year
over year. In my view year over year comparison can show the dynamic of a trend. And it shows
clearly that in the current cycle the oil price recovery is – in contrast to the cycle in 2008/9
– very slow and tentative.
The year over year oil price (green line in below chart) actually decreased again year over
year and the risk of a double dip in the oil price is growing by the day. Drilling follows very
cautiously the oil price in a parallel line (red line in below chart). If there would be really
a technological advantage for shale, the red and the green line would not be paralell, but the
red line for drilling would rise much stronger. This is actually the case for Middle East drilling,
which barely fell during this cycle. This indicates that most Middle East producers still have
high margins at the current oil price. Middle East producers – and also Russia – can quite easily
cope with an oil price of 40 +/- 10 USD per barrel. This is why I think that the oil price will
bounce at the bottom of the barrel within above range for a few years.
There is also something interesting going on with the world economy. The shippers rose exponentionally
over the last few days (DRYS up over 1000%). Also the baltic Dry index is up 600% since the beginning
of this year. House prices here in London fell – mostly at the high end. Rents for expensives
homes are down by up to 36%. Donald Trump has clearly changed something already as it becomes
increasingly clear that the dollar hoarders are paying for the infrastructure spending. I am not
sure if he understands that he is doing a lot of harm to his own business empire as well.
I expect if that depressing old banker were here he would note that instability is dangerous,
and that all the moves in treasuries currency and possibly trade flow create changes of which
the results are difficult or impossible to predict
I can easily understand your assertion that Middle Eastern and Russian oil is profitable at
forty bucks.
But if the price is to stay around forty, then it follows that you think that between them,
the producers in the Middle East and Russia will be able to supply all the oil the world wants
for the next few years.
Am I correct in saying this?
Do you think western producers will continue to pump enough at a loss ( most of them are apparently
losing money at forty bucks ) to make up the difference?
If you are willing to venture a guess, when do you think the price will get back into the sixty
dollar and up range?
If you think it won't for a lot of years, is that because you believe the economy is will be
that anemic, or because electric cars will substantially reduce demand, or both ? Or maybe you
have other reasons ?
The US has thrown the gauntlet to OPEC by claiming to becoming an oil net exporter. This has
brought OPEC in a very difficult situation. If they cut – and oil gets to 70 USD per barrel –
shale will pick up the slack and produce the amount OPEC has cut within a short period of time.
So, OPEC is forced to cut again, until it has lost a lot of market share – and thus also a lot
of revenue.
In my view OPEC has no other choice than to produce come hell and water – until something breaks.
This could be that many shale companies give up or that for instance Iran is not allowed to export
as much as they do, or there is a major conflict in the Middle East, or Saudi Arabia is running
out of cash ..
He who has the market share now, will cash in when the oil price rises. And it will rise, yet
not until something breaks. This is how business works. This is how Microsoft crushed Apple in
the nineties in the PC market – and Apple then crushed Nokia in the smart phone market .
I do not think that Saudi Arabia has the freedom to compromise here – even if they want. If
they blink they will be crushed by shale producers. So, the stand-off will go on for a while,
at a loose-loose situation for both parties. However this is great luck for consumers as they
can enjoy low energy prices for 2 to 3 years.
I think your numbers reflect numbers reported from ND DMR but Bloomberg might be closer to
reality for wells that will actually ever be completed (just a guess by me though). How do Bloomberg
get their numbers (e.g. removing Tight Holes, or removing old wells, not counting non-completed
waivers etc.)?
Yes indeed. The difficulty with DUCs is always, which wells do you count. I don't filter old
wells for example, and already include those that were spud last month (even though maybe casing
has not been set). I don't do a lot of filtering, so the actual # wells that really can be completed
is likely quite a bit lower. I see my DUC numbers as the upper bound. I don't know Bloombergs
method exactly, so I can't comment on that.
Discussion of Venezuelan politics should be in the open thread, but politics are going to determine
how much oil is produced there for the next few years, and the situation looks iffy indeed.
Concerning Freddy's chart of production profile of wells drilled in various years.
They all line up by about month 18 of production. This should not be possible. The later wells
have many more stages of frack. They are longer, draining more volume of rock. But the chart says
what it says. At month about 18 the 2014 wells are flowing the same rate as 2008 wells. We know
stage count has risen over those 6 yrs. 2014 wells should flow a higher rate. The shape of the
curve can be the same, but it should be offset higher.
Explanation?
How about above ground issues . . . older wells get pipelines and can flow more oil . . . nah,
that's absurd.
There needs to be a physical explanation for this.
These new wells have higher IPs, but also higher decline rates.
Closer spacing (see Freddy's comment above) and depletion of the sweet spots may also impact production
curves and EURs.
That doesn't make sense. They are longer. By a factor of 2ish. How can a 6000 foot lateral flow
exactly the same amount 2 yrs into production as a 3000 foot lateral flows 2 yrs into production?
Look at the lines. At 18 months AND BEYOND, these longer laterals flow the same oil rate as
the shorter laterals did at the same month number of production. Higher IP and higher decline
rate will affect the shape, but There Is Twice The Length..
I don't think we have information on the length of the wells, since 2008 the length of the
lateral has not changed, just the number of frack stages and amount of proppant. This seems to
primarily affect the output in the first 12 to 18 months, and well spacing and room in the sweet
spots no doubt has some effect (offsetting the greater number of frack stages etc.).
The combination of longer lateral lengths and advancements in completion technology has allowed
operators to increase the number of frac stages during completions and space them closer together.
The result has been a higher completion cost per well but with increased production and more emphasis
on profitability.
In the past five years, DTC Energy Group completion supervisors in the Bakken have helped oversee
a dramatic increase from an average of 10 stages in 2008 to 32 stages in 2013. Even 40-stage fracs
have been achieved.
One of the main reasons for this is the longer lateral lengths – operators now have twice as
much space to work with (10,000 versus 5,000 feet along the lateral). Frac stages are also being
spaced closer together, roughly 300 feet apart as compared to spacing up to 800 feet in 2008,
as experienced by DTC supervisors.
By placing more fracture stages closer together, over a longer lateral length, operators have
successfully been able to improve initial production (IP) rates, as well as increase EURs over
the life of the well.
blah blah, but they make clear the years have increased length. Freddy was talking about well
spacing, this text is about stage spacing, but that is achieved because of lateral length.
Freddy can you revisit your graph code? It's just bizarre that different length wells have
the same flow rate 2 yrs out, and later.
Take a look at Enno´s graphs at https://shaleprofile.com/
. They look the same as my graphs and we have collected and processed the data independently
from each other.
If the wells have the same wellbore riser design irrespective of lateral length (i.e. same depth,
which is a given, same bore, same downhole pump) then that section might become the main bottleneck
later in life and not the reservoir rock. With a long fat tail that seems more likely somehow
compared to the faster falling Eagle Ford wells say (but that is just a guess really). But there
may be lots of other nuances, we just don't have enough data in enough detail especially on the
late life performance for all different well designs – it looks like the early ones are just reaching
shut off stage in numbers now. I doubt if the E&Ps concentrated on later life when the wells were
planned – they wanted early production, and still do, to pay their creditors and company officers
bonuses (not necessarily in that order).
Hmmm. I know it is speculation, but can you flesh that out?
If some bottleneck physically exists that defines a flow rate for all wells from all years
then that does indeed explain the graphs, but what such thing could exist that has a new number
each year past year 2?
We certainly have discussed chokes for reservoir/EUR management, but the same setting to define
flow regardless of length?
The flow depends on the available pressure drop, which is made up of friction through the rock
and up the well bore (plus maybe some through the choke but not much), plus the head of the well,
plus a negative number if there is a pump. The frictional and pump numbers depend on the flow
and all the numbers depend on gas-oil ratio. Initially there is a big pressure drop in the rock
because of the high flow, then not so much. Once the flow drops the pressure at base of the well
bore just falls as a result of depletion over time, the effect of the completion design is a lot
less and lost in the noise, so all the wells behave similarly. That's just a guess – I have never
seen a shale well and never run a well with 10 bpd production, conventional or anything else.
A question might be if the flow is the same why doesn't the longer well with the bigger volume
deplete more slowly, and I don't know the answer. It may be too small to notice and lost in the
noise, or to do with gas breakout dominating the pressure balance, or just the way the the physics
plays out as the fluids permeate through the rock, or we don't have long enough history to see
the differences yet.
The number of rail cars hauling petroleum is a constant in the range of 7,200 to 7,400 petroleum
cars hauled each week for a good six months now.
Seems as though petroleum by rail is more of a necessity than a choice.
The volume is down a good thirty percent since about 2013 when over 10,000 cars were hauled
per week.
Demand decreases, contracts expire, better modes of transport emerge and cost less. not as
much call for Bakken oil. Plenty of the stuff somewhere else in this world.
The trend is down, not up for petroleum hauled by rail.
If there were orders for Bakken oil for one million bpd, the production would be one million
bpd.
Over the whole rail system, petroleum and petroleum product rail car loadings were down to
10.5 thousand in September. That compares to a high point of 16.3 thousand railcars in Sept of
2014.
Coal car loadings are on the rise, from a low of 61,000 in April to 86,000 in Sept. Coal was
running a near steady 105,00 to 110,000 railcars every month in 2013 and 2014.
The chart below from RBN shows that Bakken pipeline capacity did not increase since early 2015.
But production dropped, and this primarily affected volumes of Bakken oil transported by rail.
Given the higher percentage of oil transported by pipelines, the average transporation cost
for Bakken crude should have decreased. Interesting, however, that the price differential between
the well-head Bakken sweet crude and WTI has remained within the $10-12/bbl range.
Bakken Crude Production and Takeaway Capacity
Source: RBN
Bakken Blend differentials at terminals close to North Dakota wellheads held their lowest assessment
since December Tuesday, closing at the calendar-month average of the NYMEX light sweet crude oil
contract (WTI CMA) minus $6.25/b.
While one factor dragging on Bakken differentials has clearly been a tight Brent/WTI spread -
trading around 42 cents/b Tuesday, well in from the steady $2/b seen this summer - the return
of Louisiana Light Sweet to the Midwest market may also be having an impact, according to traders.
One trader said there was an increase in volumes heading up the Capline pipeline, however, differentials
suggest LLS is still too expensive, at least compared to Bakken. Platts assessed LLS at WTI plus
$1.15/b Tuesday.
Considered by some to be the "champagne of crudes," it is unclear what appeal LLS still has for
a Midwest refiner as margins for LLS actually - and unusually - lag those for Bakken.
S&P Global Platts data shows LLS cracking margins in the Midwest closed at $3.30/b Monday, compared
to Bakken cracking margins of $6.37/b. In fact, the advantage of cracking Bakken has grown steadily
since August.
Platts margin data reflects the difference between a crude's netback and its spot price.
Netbacks are based on crude yields, which are calculated by applying Platts product price assessments
to yield formulas designed by Turner, Mason & Co.
What is clear however, is that the steeper discounts available for Bakken provide the biggest
incentive for a Midwest refiner.
The cost of getting Bakken to this market is around $3.48/b, according to Platts netback calculations,
compared to just $1.02/b for LLS.
These costs make up a significant portion of the Bakken discount.
Further, LLS moving up the Capline after many years of relative inactivity does not necessarily
suggest a new trend is in the making. However, recent pipeline reversals between Texas and Louisiana
mean more Permian crudes are capable of reaching Louisiana refineries, and thus, if priced accordingly,
could displace incremental volumes of LLS from its home market.
With current pipeline capacity out of North Dakota typically full, the marginal Bakken barrel
often gets to market via rail, and this cost has traditionally sets the floor to Bakken's discount
to WTI. And part of the recent downturn in Bakken could be chalked up to an increase in railed
volumes to the US Atlantic Coast, as Bakken cracking margins there are again in the black.
In fact, Association of American Railroad's latest monthly and weekly data shows crude and refined
product rail movements appear to have bottomed, having grown in September from August.
Weekly data bears this out as well, showing increases in three of the last four weeks.
It remains to be seen how long this will last, however, should Energy Transfer Partners Dakota
Access Pipeline go ahead as planned.
Linefill for the pipeline could boost Bakken differentials, potentially making the grade too expensive
to rail east. However, the devil is in the details.
Traders and analysts have pegged Dakota Access pipeline tariffs between $4.50-$5.50/b for uncommitted
shippers between North Dakota and Patoka, Illinois. A further $6.50/b would be needed to bring
the crude south from Patoka to Nederland, Texas, sources have said.
If this $11-$12/b combined pipeline estimated cost were to pan out, it would be more expensive
than the $10.20/b Platts assumes in its Bakken USAC rail-based netback calculation.
Oil rig count in the Permian is up 73.5% from this year's low – the biggest increase among
all US basins.
It is still only 41% of October 2014 peak, but this is much better than the Bakken and especially
the Eagle Ford where drilling activity remains depressed.
As of September 2016, 4 counties produced 90.1% of all the Bakken/Three Forks oil production
in North Dakota: McKenzie, Mountrail, Williams and Dunn. Relative to December 2014, North Dakota
Bakken/Three Forks oil production is off 243,098 b/d relative to December 2014 while the number
of producing wells is up 1861 based upon data from the state.
Based upon state data, the number of producing wells/square mile is 1.29 in Mountrail County,
1.22 in McKenzie County, 1.02 in Willams County, and 0.86 in Dunn County. How high can the number
of producing wells/square mile go?
Is there something more than reduced drilling to explain the drop in production?
This shows well density and production from last September. The distance is concentric from a
"production centre of gravity" – i.e. weighted average by production for all wells. The core area
("sweet spot") is a circle of about 50 to 60 kms only (it's squashed out a bit to the west and
missing a bite in the SW). Maximum well density (and with the best wells is 120 to 160 acres,
and falls off quickly outside the core. The core is getting saturated.
"U.S. drilling activity is increasingly concentrated in the Permian Basin . The Permian now
holds nearly as many active oil rigs as the rest of the United States combined, including both
onshore and offshore rigs, and it is the only region in EIA's Drilling Productivity Report where
crude oil production is expected to increase for the third consecutive month."
Permian Basin also dominates M&A activity in the US E&P sector.
From the same EIA report:
"Several of the larger M&A deals involved Permian Basin assets, where drilling and production
is beginning to increase.
Based on data through November 10, the second half of 2016 already has more M&A spending than
the first half of 2016, but on fewer deals. The 93 M&A announcements in the third quarter of 2016
totaled $16.6 billion, for an average of $179 million per deal, the largest per deal average since
the third quarter of 2014. Although only 11 of the 49 deals so far in the fourth quarter of 2016
are in the Permian Basin, they accounted for more than half of total deal value."
RRC Texas for September came out recently. As others will probably elaborate more on the data,
I just want to show if year over year changes in production could be use as a predictive tool
for future production (see below chart).
It is obvious that year over year changes (green line) beautifully predicted oil production
(red line) at a time lag of about 15 month. Even when production was still growing, the steep
decline of growth rate indicated already the current steep decline.
The interesting thing is that the year over year change is a summary indicator. It does not
tell why production declines or rises. It can be the oil price, interest rates or just depletion
– even seasonal factors are eliminated. It just shows the strength of a trend.
I am curious myself how this works out. The yoy% indicator predicts that Texas will have lost
another million bbl per day by end next year. That sounds quite like a big plunge. One explanation
could be the fact that we have now low oil prices and high interest rates. In all other cycles
it has been the other way around: low oil prices came hand in hand with low interest rates. This
could be now a major obstacle for companies to grow production.
This concept of following year over year changes works of course just for big trends, yet for
investment timing it seems exactly the right tool. Another huge wave is coming in electric vehicles
which are growing in China by 120% year over year. Here we have the same situation as for shale
7 years ago: Although current EV sales are barely 1 million per year worldwide, the growth rate
reveals already an huge wave coming. So as an investor it is always necessary to stay ahead of
the trend and I think this can be done by observing the year over year% change.
"... I am a petroleum Geologist drilling wells in the Wolfcamp, the USGS report means nothing. They periodically review basins to assess how much petroleum is there, we have been drilling Horizontal wells in the Wolfcamp for almost a decade, and vertical wells for many decades. Right now there are as many rigs running drilling this rock formation as there are in the rest of the country combined, so it is already baked in to the US production data. This is not like a Saudi Arabia field with a low drill and complete and development cost, it will take many billions of drilling capital to get a small percentage of the oil in place. The big deal is that the area is fairly resilient to low oil prices and will cushion the drop in US production due to lack of investment in other basins. ..."
"... I think when seismic, land, surface and down hole equipment is included, the number is much higher. With $20-60K per acre being paid, land definitely has to be factored in. Depending on spacing, $1-5 million per well? ..."
"... In reading company reports, it seems they state a cost to drill and case the hole, another to complete the well, then add the two for well cost. This does not include costs incurred prior to the well being drilled, which are not insignificant. Nor does it include costs of down hole and surface equipment, which also are not insignificant. ..."
"... Land costs are all over the map, and I think Bakken land costs overall are the lowest, because much of the leasing occurred prior to US shale production boom. I think a lot of acreage early on cost in the hundreds per acre. Of course, there was quite a bit of trading around since, so we have to look project by project, unfortunately. For purposes of a model, I think $8 million is probably in the ballpark. ..."
"... I would not include equipment for the well, initially, as OPEX (LOE is what I prefer to stick with, being US based). The companies do not do that, those costs are included in depreciation, depletion and amortization expense. ..."
"... Once the well is in production, and failures occur, I include the cost of repairs, including replacement equipment, in LOE. I am not sure that the companies do that, however. ..."
"... I think the Permian is going to be much tougher to estimate, as there are different producing formations at different depths, whereas the Bakken primarily has two, and the Eagle Ford has 1 or 2. ..."
"... What most interests me are suggestions that there is so much available oil in Wolfcamp and what that will do to oil prices and national policy. Seems like any announcement of more oil will likely keep prices low. And if they stay low, there's little reason to open up more areas for oil drilling. ..."
"... The key question is what part of these estimated technically recoverable resources are economically viable at $50; $60; $70; $80; $90, $100, etc. ..."
"... In November 2015, the EIA estimated proven reserves of tight oil in Wolfcamp and Bone Spring formations as of end 2014 at just 722 million barrels. ..."
"... AlexS. Another key question, which is price dependent, is how many years will it take to fully develop the reserves? ..."
"... If oil prices go back to $100/b in 2018 as the IEA seems to be concerned about, it could ramp up at the speed of the Eagle Ford ..."
"... It's impossible for IEA to make statements like: "the end of low cost oil will negatively affect economic growth", "geology is about to beat human ingenuity" etc. ..."
I am a petroleum Geologist drilling wells in the Wolfcamp, the USGS report means nothing. They
periodically review basins to assess how much petroleum is there, we have been drilling Horizontal
wells in the Wolfcamp for almost a decade, and vertical wells for many decades. Right now there
are as many rigs running drilling this rock formation as there are in the rest of the country
combined, so it is already baked in to the US production data. This is not like a Saudi Arabia
field with a low drill and complete and development cost, it will take many billions of drilling
capital to get a small percentage of the oil in place. The big deal is that the area is fairly
resilient to low oil prices and will cushion the drop in US production due to lack of investment
in other basins.
Thank you, JG -- Straight from the horses mouth, respectfully. The USGS lost all credibility with
me as to estimating TRR in the Monterrey Shale in California. It baffles me, after five years
of publically discussing unconventional shale oil resources, that modelers, internet analysts
and predictors completely ignore economics, debt and finances. Extracting oil is a business; it
must make money to succeed. If it does not succeed, all bets are off regarding predictions.
The Monterrey shale estimate was by the EIA not the USGS. The EIA had a private consultant
do the analysis and it was mostly based on investor presentations, very little geological analysis.
It would be better if the USGS did an economic analysis as they do with coal for the Powder
River Basin. They could develop a supply curve based on current costs, but they don't.
Do you have any idea of the capital cost of the wells (ballpark guess) for a horizontal multifracked
well in the Wolfcamp? Would $7 million be about right (a WAG by me)?
On ignoring economics, I show my oil price assumptions. Other financial assumptions for the
Bakken are $8 million for capital cost of the well (2016$). OPEX=$9/b, other costs=$5/b, royalty
and taxes=29% of gross revenue, $10/b transport cost, and a real discount rate of 7% (10% nominal
discount rate assuming 3% inflation).
I do a DCF based on my assumed real oil price curve. Brent oil price rises to $77/b (2016$)
by June 2017 and continue to rise at 17% per year until Oct 2020 when the oil price reaches $130/b,
it is assumed that average oil prices remain at that level until Dec 2060. The last well is drilled
in Dec 2035 and stops producing 25 years later in Dec 2060.
EUR of wells today is assumed to be 321 kb and EUR falls to 160 kb by 2035. The last well drilled
only makes $243,000 over the 7% real rate of return, so the 9 Gb scenario is probably too optimistic,
it is assumed that any gas sales are used to offset OPEX and other costs, though no natural gas
price assumptions have been made to simplify the analysis.
This analysis is based on the analyses that Rune Likvern has done in the past, though his analyses
are far superior to my own.
I think when seismic, land, surface and down hole equipment is included, the number is much higher.
With $20-60K per acre being paid, land definitely has to be factored in. Depending on spacing,
$1-5 million per well?
I am doing the analysis for the Bakken. A lot of the leases are already held and I don't know
that those were the prices paid. Give me a number for total capital cost that makes sense, are
you suggesting $10.5 million per well, rather than $8 million? Not hard to do, but all the different
assumptions you would like to change would be good so I don't redo it 5 times.
Mostly I would like to clear up "the number".
I threw out more than one number, OPEX, other costs, transport costs, royalties and taxes,
real discount rate (adjusted for inflation), well cost.
I think you a re talking about well cost as "the number". I include down hole costs as part
of OPEX (think of it as OPEX plus maintenance maybe).
Dennis. The very high acreage numbers are for recent sales in the Permian Basin.
In reading company reports, it seems they state a cost to drill and case the hole, another
to complete the well, then add the two for well cost. This does not include costs incurred prior to the well being drilled, which are not insignificant.
Nor does it include costs of down hole and surface equipment, which also are not insignificant.
Land costs are all over the map, and I think Bakken land costs overall are the lowest, because
much of the leasing occurred prior to US shale production boom. I think a lot of acreage early
on cost in the hundreds per acre. Of course, there was quite a bit of trading around since, so
we have to look project by project, unfortunately. For purposes of a model, I think $8 million
is probably in the ballpark.
I would not include equipment for the well, initially, as OPEX (LOE is what I prefer to stick
with, being US based). The companies do not do that, those costs are included in depreciation,
depletion and amortization expense.
Once the well is in production, and failures occur, I include the cost of repairs, including
replacement equipment, in LOE. I am not sure that the companies do that, however.
I think the Permian is going to be much tougher to estimate, as there are different producing
formations at different depths, whereas the Bakken primarily has two, and the Eagle Ford has 1
or 2.
An example:
QEP paid roughly $60,000 per acre for land in Martin Co., TX. If we assume one drilling unit
is 1280 acres (two sections), how many two mile laterals will be drilled in the unit?
1280 acres x $60,000 = $76,800,000.
Assume 440′ spacing, 12 wells per unit.
$76,800,000/12 = $6,400,000 per well.
However, there are claims of up to 8 producing zones in the Permian.
So, 12 x 8 = 96 wells.
$76,800,000 / 96 = $800,000 per well.
Even assuming 96 wells, the cost per well is still significant.
If we assume 96 wells x $7 million to drill, complete and equip, total cost to develop is $.75
BILLION. That is a lot of money for one 1280 acre unit, need to recover a lot of oil and gas to
get that to payout.
I am neither an oil man nor an accountant, so regardless of what we call it I am assuming natural
gas sales (maybe about $3/barrel on average) are used to offset the ongoing costs to operate the
well (LOE, OPEX, financial costs, etc), we could add another million to the cost of the well for
surface and downhole equipment and land costs. Does an average operating cost over the life of
a well of about $17/b ($14/b plus natural gas sales of $3/b of oil produced)seem reasonable?
That
would be about $5.4 million spent on LOE etc. over the life of the well (assuming 320 kbo produced).
Also does the 10% nominal rate of return sound high enough, what number would you use as a cutoff?
You use a different method than a DCF and want the well to pay out in 60 months. This would correspond
to about a 14% nominal rate of return and an 11% real rate of return (assuming a 3% annual inflation
rate.)
"The Monterrey shale estimate was by the EIA not the USGS. The EIA had a private consultant do
the analysis and it was mostly based on investor presentations, very little geological analysis."
Exactly.
USGS' estimate as of October 2015 is very conservative:
"The Monterey Formation in the deepest parts of California's San Joaquin Basin contains an
estimated mean volumes of 21 million barrels of oil, 27 billion cubic feet of gas, and 1 million
barrels of natural gas liquids, according to the first USGS assessment of continuous (unconventional),
technically recoverable resources in the Monterey Formation."
"The volume estimated in the new study is small, compared to previous USGS estimates of conventionally
trapped recoverable oil in the Monterey Formation in the San Joaquin Basin. Those earlier estimates
were for oil that could come either from producing more Monterey oil from existing fields, or
from discovering new conventional resources in the Monterey Formation."
Previous USGS estimates were for conventional oil:
"In 2003, USGS conducted an assessment of conventional oil and gas in the San Joaquin Basin,
estimating a mean of 121 million barrels of oil recoverable from the Monterey. In addition, in
2012, USGS assessed the potential volume of oil that could be added to reserves in the San Joaquin
Basin from increasing recovery in existing fields. The results of that study suggested that a
mean of about 3 billion barrels of oil might eventually be added to reserves from Monterey reservoirs
in conventional traps, mostly from a type of rock in the Monterey called diatomite, which has
recently been producing over 20 million barrels of oil per year."
I am corrected, RE; USGS and Monterrey. I still don't believe there is 20G BO in the Wolfcamp.
Most increases in PB DUC's are not wells awaiting frac's but lower Wolfcamp wells that are TA
and awaiting re-drills; that should tell you something. With acreage, infrastructure and water
costs in W. Texas, wells cost $8.5-9.0M each. The shale industry won't admit that, but that's
what I think. What happens to EUR's and oil prices after April of 2017 is a guess and a waste
of time, sorry.
What most interests me are suggestions that there is so much available oil in Wolfcamp and what
that will do to oil prices and national policy. Seems like any announcement of more oil will likely keep prices low. And if they stay low,
there's little reason to open up more areas for oil drilling.
"Their assessment method for Bakken was pretty simple – pick a well EUR, pick a well spacing,
pick total acreage, pick a factor for dry holes – multiply a by c by d and divide by b."
USGS estimates for average well EUR in Wolfcamp shale look reasonable: 167,ooo barrels in the
core areas and much lower in other parts of the formation.
I do not know if the estimated potential production area is too big, or assumed well spacing
is too tight.
The key question is what part of these estimated technically recoverable resources are economically
viable at $50; $60; $70; $80; $90, $100, etc.
Significant part of resources may never be developed, even if they are technically recoverable.
Keep in mind these USGS estimates are for undiscovered TRR, one needs to add proved reserves times
1.5 to get 2 P reserves and that should be added to UTRR to get TRR. There are roughly 3 Gb of
2P reserves that have been added to Permian reserves since 2011, if we assume most of these are
from the Wolfcamp shale (not known) then the TRR would be about 23 Gb. Note that total proved
plus probable reserves at the end of 2014 in the Permian was 10.5 Gb (7 Gb proved plus 3.5 GB
probable with the assumption that probable=proved/2). I have assumed about 30% of total Permian
2P reserves is in the Wolfcamp shale. That is a WAG.
Note the median estimate is a UTRR of 19 Gb with F95=11.4 Gb and F5=31.4 Gb. So a conservative
guess would be a TRR of 13.4 Gb= proved reserves plus F95 estimate. If prices go to $85/b and
remain at that level the F95 estimate may become ERR, at $100/b maybe the median is potentially
ERR. It will depend how long prices can remain at $100/b before an economic crash, prices are
Brent Crude price in 2016$ with various crude spreads assumed to be about where they are now.
I just looked at Permian Basin crude reserves (Districts 7C, 8 and 8A) and assumed the change
in reserves from 2011 to 2014 was from the Wolfcamp. I didn't know about that page for reserves.
It is surprising it is that low.
In any case the difference is small relative to the UTRR, it will be interesting to see what
the reserves are for year end 2015.
Based on this I would revise my estimate to 20 Gb for URR with a conservative estimate of 12
Gb until we have the data for year end 2015 to be released later this month.
My guess is that the USGS probably already has the 2015 year end reserve data.
The EIA proved reserves estimate for 2015 will be issued this month. I think we will see a
significant increase in the number for the Permian basin LTO.
Also note that USGS TRR estimate is only for Wolfcamp.
I can only guess what could be their estimate for the whole Permian tight oil reserves.
But the share of Wolfcamp in the Permian LTO output is only 24% (according to the EIA/DrillingInfo
report).
That makes sense. I also imagine the USGS focused on the formation with the bulk of the remaining
resources. It is conceivable that the 30 Gb estimate is closer to the remaining oil in place and
that more like 90% of the TRR is in the Wolfcamp, considering that the F5 estimate is about 30
Gb. That older study from 2005 may be an under estimate of TRR for the Permian, likewise the USGS
might have overestimated the UTRR.
If oil prices go back to $100/b in 2018 as the IEA seems to be concerned about, it could ramp
up at the speed of the Eagle Ford (say 2 to 3 years). It will be oil price dependent and perhaps
they won't over do it like in 2011-2014, but who knows, some people don't learn from past mistakes.
If you or Mike were running things it would be done right, but the LTO guys, I don't know.
"This estimate is for continuous (unconventional) oil, and consists of undiscovered, technically
recoverable resources.
Undiscovered resources are those that are estimated to exist based on geologic knowledge and
theory, while technically recoverable resources are those that can be produced using currently
available technology and industry practices. Whether or not it is profitable to produce these
resources has not been evaluated."
If it requires slave labor at gunpoint to get the oil out, then that's what will happen because
you MUST have oil, and a day will soon come when that sort of thing is reqd.
This follows on from reserve post above (two a couple of comments). In terms of changes over the
last three years – there really weren't anything much dramatic. We'll see what 2016 brings, especially
for ExxonMobil, but it looks like they already knocked a big chunk off of their Bitumen numbers
already in 2015.
Note I went through a lot of 20-F and 10-K reports watching the rain fall this morning and
copied out the numbers, I'm not guaranteeing I got everything 100%, but I think the general trends
are shown.
Note the figures are totals for all nine companies I looked at.
IEA WEO is out:
http://www.iea.org/newsroom/news/2016/november/world-energy-outlook-2016.html presentation
slides, fact sheet and summary are available online (report can be purchased). IEA seems to be
_very_ concerned about underinvestment in upstream oil production. Several pages of the report
is devoted to this, the title of that section is "mind the gap". More or less all of the content
has been discussed on this website, including the issue with high levels of debt and that this
can affect suppliers' capacity to rebound, and how much demand can be reduced as a result of a
stringent carbon cap.
From the fact sheet (available free of charge):
"Another year of low upstream oil investment in 2017 would risk a shortfall in oil production
in a few years' time. The conventional crude oil resources (e.g. excluding tight oil and oil sands)
approved for development in 2015 sank to the lowest level since the 1950s, with no sign of a rebound
in 2016. If there is no pick-up in 2017, then it becomes increasingly unlikely that demand (as
projected in our main scenario) and supply can be matched in the early 2020s without the start
of a new boom/bust cycle for the industry"
Presentation 1:09 – Dr. Birol gives his view: "depletion never sleeps"
I wonder who that paragraph is aimed at. As I indicated above the companies that would be investing
in long term conventional projects don't have a very large inventory of undeveloped reserves (17
Gb as of end of 2015, some of this has gone already this year and more is in development and will
come on stream in 2017 and 2018 (and a small amount in later years for approved projects). I'd
guess there might only be less than 10 Gb (and this the most expensive to develop) that is currently
under appraisal among the major western IOCs and larger independents; allowing for their partnerships
with NOCs in a lot of the available projects that could represent 20 to 30 Gb total. That really
isn't very much new supply available, and a large proportion is in complex deep water projects
that wouldn't be ramped up fully until 6 to 7 years after FID (i.e. already too late for 2020).
Really the main players need to find new fields with easy developments, but they obviously aren't,
probably never will, and actually aren't looking very hard at the moment.
My interpretation is that this is IEAs way of saying that it does not look good. Those who can
read between the lines get the message. Also, a few years from they will be able to say "see we
told you so".
It's impossible for IEA to make statements like: "the end of low cost oil will negatively affect
economic growth", "geology is about to beat human ingenuity" etc.
WEO have become more and more bizarre over the years. On the one hand they contain quantitative
projections which tell the story politicians wants to hear. On the other hand, the text describes
all sorts of reason of why the assumptions are unlikely to hold. Normally, if you don't believe
in your own assumptions you would change them.
"... If we are to rethink capitalism, let's make sure to include as one key element the banishment of the phrase "human capital". ..."
"... "On both sides of the Atlantic, public companies are sitting on record piles of cash-around $2 trillion in the U.S. and a similar amount in Europe" ..."
"... The first function of unemployment (which has always existed in open or disguised forms) is that it maintains the authority of master over man. The master has normally been in a position to say: "If you don't want the job, there are plenty of others who do." When the man can say: "If you don't want to employ me, there are plenty of others who will," the situation is radically altered. ..."
"... Illiberal libertarians: Why libertarianism is not a liberal view ..."
"... "Sustained exponential growth is mathematically impossible." ..."
Where is the sustainable part? It is not in goals of growth. The goal should be sustainable
evolution.
Government enshrines process and practices. It doesn't evolve well. Government also has a devastating
track record on picking investments to incentivize - oil over ethyl alcohol back in the 1920's.
Promoting land development and farming practices in the western plains that created the dust bowl.
Government does do an amazing job of steam rolling contrary information, ideas, etc.
The rigorous and scientific economics profession just needs to decide
"Which way is up?"
40 years ago, most economists and almost everyone else believed the economy was demand driven
and the system naturally trickled up. Now most economists and almost everyone else believes the
economy is supply driven and the system naturally trickles down. Economics has been turned upside
down in the last 40 years.
For a supply side, trickle down world you need Neo-Keynesian stimulus, where money is fed into
the top of the economic pyramid, the banks, to be lent out, invested and trickle down.
For a demand driven, trickle up world you need traditional Keynesian stimulus, where money
is fed into the bottom of the economic pyramid through infrastructure spending, to create jobs
and wages which will be spent into the economy and trickle up.
The West has been doing Neo-Keynesian stimulus for the last eight years and asset prices have
been maintained but little has trickled down to the real economy.
Oh dear, today's economics is upside down, let's try some good old Keynesian fiscal stimulus.
Brexit and Trump are the result of not working out "which way is up?" a little sooner.
China did fiscal stimulus after 2008, how did that go? China was the engine of global growth
after 2008, its insatiable demand for raw materials made lots of other emerging economies boom
too. Keynes is the man; he's the right way up.
Let's form a global economy guided by ideas of economic liberalism where we put the economy
first over the interests of people.
1980s – boom
Early 1990s – bust
Late 1990s – boom
Early 2000s – bust
Mid 2000s – boom
Late 2000s – bust
2008 on – stagnation
Unfortunately, no one really understood how the economy worked.
2008 – "How did that happen?"
What more evidence do we need?
What is wrong with economics when science can successfully send space craft to the outer edges
of the solar system?
Science has been allowed to develop successfully as it cannot be modified to suit certain vested
interests to make them richer.
Economics is not like this.
There is something wrong with economics that was first spotted at the end of the 19th century
and pretending it is a real science today is little more than wishful thinking.
Thorstein Veblen wrote an essay in 1898 "Why is economics not an evolutionary science?". Real
sciences are evolutionary and old theory is replaced as new theory comes along and proves the
old ideas wrong. Economics jumps about like a cat on a hot tin roof and is not evolutionary, in
the late 1970s Keynesian ideas were ditched for the ideas of Milton Freidman. We threw out the
old Keynesian economics and bought in something new and untested just as we are about to embark
on globalisation, it was asking for trouble. Milton Freidman hadn't realised real science is evolutionary.
Looking back we can see other problems.
Malthus came up with an economics that worked for the vested interests of the land owning class.
Ricardo came up with an economics that worked for the vested interests of the financial class.
Marx came up with an economics that worked for the ideology he was trying to put forward.
It's complex, quite fuzzy and can be easily biased to suit vested interests.
Early on it became very apparent to the wealthy and powerful that economics needed to be biased
in the right direction for their interests.
As Classical Economics reached its zenith in the 19th Century it had come to some unfortunate
conclusions powerful, vested interests didn't like so they backed a new, neoclassical economics
that missed out the undesirable conclusions from Classical Economics like the differentiation
of "earned" and "unearned" income.
Most of the UK now dreams of giving up work and living off the "unearned" income from a BTL
portfolio, extracting the "earned" income of generation rent.
The UK dream is to be like the idle rich, rentier, living off "unearned" income and doing nothing
productive.
This distinction between "earned" and "unearned" income has been buried ever since, but was
hidden is later revealed by who this economics favours.
Neoclassical economics led to the Wall Street Crash of 1929 and the Great Depression, where
its ideas just made things worse.
Keynes came up with some new ideas that were incorporated into the "New Deal" and the recovery
began in the US.
Keynes ideas had some unpleasant conclusions as well and so economists moulded some of Keynes
ideas into neoclassical economics ready to use after the Second World War. Keynes had said that
capitalism was inherently unstable and recognised the dangers from financial asset investing,
not the sort of ideas that were desirable.
The Golden Age of the 1950s and 1960s followed.
The new hybrid Keynesian ideas went wrong in the 1970s and its ideas did not lead to recovery.
The powerful vested interests sought an opportunity to bring back their really biased pure
neoclassical economics and use it as the basis for a global economy.
It was improved, but still had all the old problems:
1920s/2000s – high inequality, high banker pay, low regulation, low taxes for the wealthy,
robber barons (CEOs), reckless bankers, globalisation phase 1929/2008 – Wall Street crash 1930s/2010s
– Global recession, currency wars, rising nationalism and extremism
Left to their own devices, powerful vested interests will develop an economics that is so biased
the economic system will collapse due to the polarisation of wealth at the personal and national
level (like now).
Lots of other inconvenient stuff is missing too, which has lead to many of the recent mistakes,
including 2008 and its aftermath:
1) The true nature of money and how it is created and destroyed on bank balance sheets.
2) The work of Irving Fischer, Hyman Minsky and Steve Keen on debt inflated asset bubbles.
Their inflation, bursting and the debt deflation that follows.
3) Richard Koo on balance sheet recessions.
You can bias economics to suit vested interests but you can't make that biased economics work.
Economics needs to be rebuilt form the bottom up in an evolutionary, scientific, manner not
missing out the bits that are inconvenient for wealthy and powerful vested interests.
You can't put the economy first without good economics.
"On both sides of the Atlantic, public companies are sitting on record piles of cash-around
$2 trillion in the U.S. and a similar amount in Europe"
Keynes called it the "liquidity trap". 1929 and 2008 were both debt inflated asset bubbles,
where securitising loans increased leverage. Keynes studied the Great Depression and noted monetary
stimulus lead to a "liquidity trap". Businesses and investors will not invest without the demand
there to ensure their investment will be worthwhile. The money gets horded by investors and on
company balance sheets as they won't invest. Cutting wages to increase profit just makes the demand
side of the equation worse and leads you into debt deflation. Central Banks today talk about the
"savings glut" not realising this is Keynes's "liquidity trap".
US firms engage in share buybacks as they don't want to invest in expansion.
Investors pour into negative yielding bonds and gold for safety.
Keynes realised wage income was just as important as profit as wage income looks after the
demand side of the equation.
This is why you need fiscal stimulus to create jobs and wage income to spur demand.
Say may have said "supply creates its own demand" but he was wrong.
As we can see businesses and investors don't believe Say either and this why they are hoarding.
>Stagnation is not caused by the deterministic forces of an ageing population, high savings,
and exhausted tech opportunities. Rather, it is a result of falling private and public investment
that has prevented the emergence of new investment opportunities.
So I expected an explanation of why "falling investment" isn't directly correlated to "exhausted
tech opportunities" and the like. Didn't get it.
The usual techno-libertarian babble with the libertarian part jammed into the closet so as
to appeal to the political classes.
I think the problem with your problem is that it's not clear where the next phase of growth
will come from, and as tech has reached a pinnacle, maybe the new thing will turn out to be surprisingly
luddite and the searching for it may be better done by collective action which then is picked
up by the private sector with the public part moving on to lead the thing that replaces that because
this old world keeps spinning around in spite of the fact that people are always haunted with
the notion that it might stop .think y2k, jan 1 2000 was going to and did happen regardless of
the perceived capacity for our systems to bear it. Like in the election where the private sector
thought it could lead us where they wanted us to go but it turns out they were wrong and they're
actually following
The secret is in how money works, which is why hardly any economists understand either the
problem or the solution.
Money and debt are opposite sides of the same coin. If there is no debt there is no money.
Money is created by loans and destroyed by repayments of those loans.
After the system has been flooded with lots of debt by encouraging bankers to maximise profit
with their debt products, you get to a point where everyone is paying down debt and few people
are taking on new loans. This makes the money supply contract, making it harder to pay down the
debt.
When the repayments are larger than the new debt being taken on, the money supply starts contracting.
The Government needs to step in as the borrower of last resort to keep the money supply stable,
otherwise you head into a deflationary spiral.
Central Banks are the lender of last resort and Governments are the borrowers of last resort.
Central Banks print money for banks (QE) and, as no one is borrowing, it stays in the financial
system blowing bubbles and doesn't get to the real economy as seen from the low inflation round
the world.
Central Banks printing money for the Government to engage in fiscal stimulus gets the money
directly into the economy.
What they have been trying to do all along, the intermediary has just changed.
Banks never got the money into the real economy.
Keynes studied a similar situation in the Great Depression where debt deflation had taken hold.
He realised businesses and investors won't invest in the real economy when there is no demand.
Today we see all the global businesses hoarding cash and engaging in share buybacks, they won't
invest because there is no demand to make this worthwhile.
Keynes realised wage income was just as important as profit, wage income creates demand.
Keynes understood money.
Today's businesses think they should maximise profit by cutting wages, reducing wage income
and demand and making the whole thing worse.
Today's economics is basically the same as that of the 1920s, its neoclassical economics and
its core remains unchanged.
Neoclassical economics believes supply creates its own demand "Say's Law". It didn't then and
it doesn't now.
Neoclassical economics believes capitalism naturally reaches stable equilibriums. It led to
a Wall Street Crash and Great Depression then and it led to a Wall Street Crash and global recession
now.
The FED engaged in QE then, it has engaged in QE now, it didn't really work either time.
It was the "New Deal" that bought the US out of the Great Depression, it's what the world needs
now.
Saturating an economy in debt will always lead to debt deflation and the only way out is fiscal
stimulus.
He explains the mistake Christina Romer made analysing data from the Great Depression leading
Central Banks to think they could get us over 2008 with monetary policy.
In the first 12 mins.
Austerity is the worst thing you can do as it accelerates the contraction of the money supply.
When the US was panicking about the fiscal cliff it was because Ben Bernanke had read Richard
Koo's book and knew cutting Government spending would drive the US economy into recession.
Richard Koo understands money, he has worked in a Central Bank (New York Federal Reserve).
The secrets of money are not included in the neoclassical economics studied by economists outside
the Central Banks. The consequences of the secrets of money are understood by very few who work
in the Central Banks, they often favour austerity when it is the worst thing you can do.
While I don't disagree with the this essay in the whole, I think it misses an important piece.
There must be something that drives government investment. In the 1950s the government's investment
in the highway system crowded in investment in the auto industry as well as investments in suburban
housing. Those were things that could drive generations of wealth creation.
Green energy investments might do some of that today, but nowhere near on that scale. Besides
that, what else is there?
Maybe a conversion to "single-payer" medicine expanded to include a geater range of services;
child-services, elder care, and the like. These are people intensive services that can be performed
by a wide range of skilled and semi-skilled people. It puts people to work at a job that is becoming
essential as boomers age.
I think that her idea of private public partnerships may be the opposite of that of Trump.
There is worry that Trump's idea of this is privatization of assets to benefit a few in line
with crony capitalism.
Mazzucato on the other hand wants the public to share profits and not just losses.
I think Trump does understand that fiscal stimulus is important and can outweigh the austerity
oriented goal of balancing a budget.
Government has the deep pockets that can get huge projects like energy alternatives and public
transportation off the ground. Mazzucato wants to do it in a way that benefits the public rather
than what we have been seeing with the profits of these projects funneled to the 1%.
>I think that her idea of private public partnerships may be the opposite of that of Trump.
Oh the Judean People's Front not those right b*stards in the People's Front of Judea. Got it.
>Government has the deep pockets that can get huge projects like energy alternatives and public
transportation off the ground.
Well then just do it. What does the private financial sector have to do with it? I'm pretty
sure Solyandra didn't cost anybody a single vote they would have gotten otherwise so why did
they even involve the private financial – again note the important word, here – sector?
I'm not opposed to a more socialistic type response and actually see this as a move in that
direction.
She wants though to work within a capitalist system. Recognizing that the government has a
lot of control even in so called 'free markets' this often leads to monopoly type activities.
The government gives away important work such as in drug research or technology to the private
sector and lets them run with it with little control.
She would like to see more control over this work. It can be given to pharmaceutical and tech
companies to improve and market but not without controls in the public interest such as limiting
excessive drug prices and not having all the tech gains of a product go to a few execs but be
distributed to the overall public which helped fund the research in the first place.
In infrastructure it would emphasize the overall good to the economy of good infrastructure
and not let a few companies benefit by control over tolls for example.
trying to better capitalism is the wrong path. the lack of investments is caused by the growing
impossibility to get profit out of it – which is the effect of capitalism itself (tendency of
falling profit rate).
Kalecki disagrees with you and later empirical work backs him up.
Capitalists choose to run the economy at less than full employment because they don't like
workers having the power they'd have (more say over work conditions, less of a pay gap with capitalists)
if they could quit their jobs and find another one readily. They seek a higher profit level than
is necessary and chronically underinvest as a result.
+1 YES! See also Joan Robinson (re: unemployment):
The first function of unemployment (which has always existed in open or disguised forms)
is that it maintains the authority of master over man. The master has normally been in a position
to say: "If you don't want the job, there are plenty of others who do." When the man can say:
"If you don't want to employ me, there are plenty of others who will," the situation is radically
altered.
Uh, one small problem. Capitalism isn't the problem. Unless we're simply using the word capitalism
to describe any fascist combination of imperialism abroad and corporate subsidies at home.
For example:
The failure by policy-makers to fully understand the dynamics of the capitalist system
This is the state of economic discourse on the left? Policy-makers understand the dynamics
quite well. That's why they have done everything possible to undermine the rule of law and individual
rights at the heart of market-based economics.
Concentration of wealth and power isn't a failure of public policy. It's the point.
Yas, No True Libertarian would allow erosion of the ruleoflaw and individualrights if only
those could be preserved, everythiing would fall into its preordained place Market-based economics
Accept Libertarians don't belive in rights, but rather in a batch of comodities they call "rights"
that exist for the soul purpous of being bartered away to the ownership class.
. . . What is striking about libertarians' conception of political power is
its resemblance to feudalism . By "feudalism" I mean a particular conception of political power,
not the manorial system or the economic system that relies on the institution of serfdom (as
in European medieval feudalism).
p.149
. . . Liberalism evolved in great part by rejecting the idea of privately
exercised political power, whether it stemmed from a network of private
contracts under feudalism or whether it was conceived as owned
and exercised by divine right under royal absolutism. Libertarianism
resembles feudalism in that it establishes political power in a web of
bilateral individual contracts. Consequently, it has no conception of
legitimate public political authority nor any place for political society,
a "body politic" that political authority represents in a fiduciary capacity.
Having no conception of public political authority, libertarians
have no place for the impartial administration of justice. People's
rights are selectively protected only to the extent they can afford protection
and depending on which services they pay for. Having no conception of a political society,
libertarians have no conception of the common good , those basic interests of each individual
that according to liberals are to be maintained for the sake of justice by the impartial exercise
of public political power.
Rethinking capitalism and rolling back the corporate coup d'etat will be difficult as most
citizens have no idea what has taken place. Trumps election is good in one sense, it will be no
longer possible to obfuscate corporate interests as somehow also in the best interests of the
citizenry. The are in fact opposites.
Rethinking capitalism leads to rethinking the legitimacy of power centers. The cyclical political
theatre between a sham duopoly hopefully is over, or will be over when Trump fails to deliver
in any meaningful way for the working class. The time is now for rediscovering the true power
in government lies with the people, not with some enthroned elite. It is somewhat ironic that
it took the Queen of England to point that out in her indirect way.
The author seems to have a hard time shaking certain conventional assumptions.
If future growth is to take a different path
If that path is negative then maybe they have a point but we can't have perpetual growth in
a closed system which is what this planet is.
And then this part:
As early as 1821, David Ricardo worried about the effect of mechanization on labor displacement.
What was important then, and should inform our thinking now, was that profits (from mechanization)
be reinvested into production, meaning that, in Ricardo's time, while some jobs fell away,
others were created.
This also seems a little shortsighted and somewhat vague. How much exactly do we need to produce?
Based on the amount of garbage floating around in the ocean and the rising global temperatures
it would seem we've probably already overdone it.
This is another author who seems to think that money really does grow on trees, ie it's a naturally
occurring phenomenon like the weather that we are subject to and can't change much rather than
a tool made by human beings that can be used any way we see fit.
Rather than factories running 24/7 producing mounds of cheap crap that breaks down and needs
to be replaced on a regular basis just to keep enough people marginally employed and constantly
buying stuff, would it really be so bad to have automation that produces enough of what we need
and then stops for a while until there's a new need, coupled with a job guarantee and BIG?
It boils down to, do you want a rip roaring economy for all or a habitable planet?
Perhaps we can escape this with a combination of jawb guarantee and BIG. You're hired and your
jawb is to do nothing. The problem is when you are off the jawb, spending the money earned by
doing nothing
What caused the economic collapse was hitting the obvious limits of economical resource extraction
and environmental limits to absorbing our industrial waste stream.
The global economy is 100% dependent on resource extraction, production, and disposal.
We have tried to deny this reality by jiggering around with economic, monetary, and financial
theories as if they, along with technolology can over come it. All that has done is increase inequality
and empower what I call the cannibalistic phase of capitalism.
What is needed is just about the opposite of capitalism. We need to figure out how to pay people
to do less way less, have less, consume less, procreate less .
We are facing a longer-term economic collapse if we don't restructure the economy to be vastly
less wasteful. But the crisis in 2008 was not the result of resource extraction. This was a financial
crisis and I (and many others) described at great length how it came about. My argument was that
it was the result of bad economic ideology, applied over a period of 50 years.
Sigh- another blind Economist wandering through the zoo, stumbling upon an elephant's trunk,
and conjuring up ideas to make it GROW longer.
Sustained exponential growth is mathematically impossible. At any rate of growth, the end result
is that humans and their things end up occupying every square inch of territory, using every joule
of energy, and consuming every natural resource until collapse intervenes.
Natural capital - the physical characteristics of the biosphere- is the foundation of all life
including that of homo sapiens. Any economic theory that fails to build from this fundamental
fact is mere econobabble.
Humans are a tribal species who have devoted much of their "human capital" to warfare since
the current genetic strain succeeded in exterminating the Neanderthals. Any discussion of contemporary
capitalism in the USA that fails to examine the pivotal role of the military-industrial state
is fatally flawed.
The goal of economic policy should be the maximization of quality of life for a population
level that can live in harmony with the billions of other inhalants of the biosphere- a goal diametrically
opposed to homo sapiens goal of growth in ability to dominate it.
You are wrong on both counts. If "growth" is just "compound intrest," than you have a pointless
economey, one that is not based in the real world,
Second, "human resourcs" is a "real resource" and thus havefundemental limits.
This is the origial point. You can not have an economey that violates the 2nd law of thermal
dynamics. Economist need to stop pretending physics dosn't apply.
the entropy that exists in our economies is a failure to organize at a much more complex and
complete level – they say that nuclear energy is an incomplete technology and we all know how
disastrous it can be – so is economics and it is because capitalism is a simplistic theory. Steve
Keen is so good on this subject. He almost makes me see in graphic form how we should reverse
our thinking from outward fractals of "productivity and profits" to something that goes deep instead.
We need to change the concept of vertical integration to deep integration – make productivity
be coherent all the way down the economic food chain from the profits to the bacteria in the ground.
Repair the environment at all levels of production and account for the costs of using even the
smallest thing – this would indeed put a cramp in capitalism.
"Economists need to stop pretending."
There, fixed it for you, the idea that an infinitely-complex system that is massively swayed by
human emotion is somehow "model-able" is silly. The queen called everybody's bluff, recall what
the august "economists" finally said after she asked what happened and why: "We don't know".
Second-order silly is the idea that a centrally-planned, command-and-control approach can work
on such a system. Keynes and the others that came up with this hoo-haw were admirers of Stalinist
Russia, at the time the Bloomsbury and other pink crowd were gushing "I have seen the future and
it works!". The idea is "let's raise X number cows because we project we will need leather for
Y number of shoes". After you're done falling off your chair laughing take a moment to realize
that's exactly what they try to do today with the price of money and the level of demand in the
economy.
There are too many unintended consequences, look at ZIRP for example, they thought free money
would make people borrow more but (being rational) people saw they would get no current income
so boosted their savings instead.
So:
Let bad debts clear, otherwise you're just suppressing brush fires on the forest floor and eventually
the whole thing burns to the ground. Mario Draghi buying CCC-rated junk is precisely what you
should not do.
And to Watt4 Bob below, the only "creative destruction" we have today is for people and households.
Zombie banks, oil companies, insurers, big pharma, military companies, the surveillance-industrial
complex are completely isolated from creative destruction by the big fat thumb of the gumment
on the scales.
Paul, Please step back and analyze the logical fallacy in your statement. Exponential growth
based upon human resources ("rather than real resources" means that at some point in the growth
cycle humans have to eat human resources rather than food.
Anyone who makes the (common) claim that you do simply does not understand the meaning of exponential
growth. Model growth at any rate and you eventually reach the point where the next increment of
growth fills the entirety of any finite universe. If production grows exponentially at the 3%
target often bandied about as desirable the entire world would be covered by the human capital
you hope will provide an escape from mathematical certainty. It only takes about 400 years of
3% exponential growth starting with only one Einstein or one bite of information to reach the
finite limit of our planet. And it matters not a whit whether the human capital walks around in
a physical body or is condensed into bits & bites and stored on a flash drive, the mathematics
are the same.
Because we live in a real world with real physical limits, sustained long term growth will
always be impossible and collapse of growth inevitable. Any theory of economics worth more than
toilet paper should recognize that fundamental fact.
Thor, with all due respect you've misunderstood what I wrote. Your response killed a bunch
of straw men.
The point about human resources was that the growth in consumption is some 20 times greater
than population growth. Take that for what it's worth, I think that is a big part of the problem.
The first point was purely arithmetic. An annuity of 1 at rate r for n periods fits the curve
of GDP growth (a proxy for growth) like a glove. Compound interest is calculated using the same
formula. Beyond that I don't know what you're arguing against.
You can do the same for growth in federal spending, growth in Investment, etc. They all fit
the annuity curve. Your "3% exponential growth" is an annuity of 1 at 3% compounded for n periods.
Which IS an exponential relationship, but it puts growth in perspective when you look at it
as analogous to compounding interest. For me at least.
Rethinking capitalism and rolling back the corporate coup d'etat will be difficult as most
citizens have no idea what has taken place.
It's worse than that.
Hysteresis, one of my favorite new vocabulary words, is the reason there's no easy fix for
the system that is currently circling the drain.
That being the damage done by neo-liberal, creative destruction was actually destructive
destruction.
It is impossible to simply turn-back the hands of time, the damage is done, the manufacturing
base that supported a healthy working-class has been destroyed, and there is no actual path for
revival of that reality.
This is the reason we are faced with the necessity of creating a new economy, TPTB have destroyed
any path to what we might call a 'normal' economy from our current condition.
Hysteresis, means "Nope, you can't get there from here."
That used to be a Yankee farmer joke, now it's a perfectly good explanation for our situation.
Assuming infinite growth on a finite planet is the fatal hubris of capitalism, which assumes
that economics exist apart from the laws of nature. We are experiencing inevitable contraction
because we have exceeded the limits of earth's ability to sustain our species' rapacious demands
and destructive lifestyles. We are already experiencing catastrophic effects from our destruction
of the planet's climate moderating system, which ultimately will destroy our habitat. We have
seen this coming for a long time, yet leaders, heads of state, and academicians (including this
author) continue to think in outmoded ways, particularly about our disregard of the ecosystem
which will result in near-term mass extinction. Human exceptionalism is the fatal flaw that will
wipe out most if not all life on this planet.
In the past, disaster was local, because hubris met its match locally. With a global civilization,
we dream of going to Mars to trash another planet from scratch. But when disaster is truly global,
the result will be truly apocalyptic. Humanity has had a good run; eat, drink and love while you
still can.
There is an ancient battle between Heraclitus and Parmenides. Either dynamics is reality, or
statics is reality. The reality is, both are real. Change is liberal, stasis is conservative.
Unfortunately neither is a panacea, because there is no panacea, it all depends on context. When
change is required, conservative-ism brings us the French Revolution as an unintended consequence.
When stasis is required, liberal-ism brings us the French Revolution as an intended consequence.
Sometimes change happens, sometimes things stay the same and either can be good or bad for you
individually. Generalizing beyond this is over-generalization.
While I acknowledge that this was written for an audience of economists, I do not think economists
should expect to have much influence on the development of new systems until they learn to express
themselves in language intelligible to an educated general audience. I can parse the clause, "Skills
have always been an endogenous function of investment." I know the meaning of every word in it.
I have no idea what it is supposed to communicate. It is not my problem, but the author's, that
she fails to state what she considers a key point in language that conveys meaning. In fact, the
sentence which follows the jargon appears to say what needed to be said; it is not at all clear
what purpose the jargon was intended to serve, other than to signal membership in a professional
club. Its primary effect is to break the flow of thought and annoy the non-specialist reader.
The point about companies hording profits is, I believe a key point. The money belongs to the
shareholders, and the individual shareholder have to place investments and not indulge in share
buybacks.
A second point not mentioned, after the great recession the chose solution was to preserve
as much debt and debt service as possible, ignoring the asserting "debt which cannot be repaid,
will not be repaid."
" shareholders have to place investments " in order for capitalism to progress. But oops,
we have come to the end of an era and altho there are trillions of dollars on the sidelines, there
is no place to invest. Like the guy in MASH said re Christianity: You guys haven't come up with
a new idea for 2000 years.
The fatal flaw of the current system is that it is not designed to benefit the majority of
people. It is a system of rent extraction, made to benefit a few people on top at the expense
of the general public.
It needs more than just a rethinking. It needs a ground up design. The problem is that the
rent seekers have control of business and government. Both institutions will not be used for public
benefit, but rather for the benefit of the extractive elite at the expense of the rest of society.
As for what has been learned – the elite do not "want" to learn the lessons that need to be
learned. That is the problem that we face.
"... "And even though neoliberals and international banks would have you believe otherwise, a fall in these money movements is entirely a good thing. As Ken Rogoff and Carmen Reinhart found in their study of 800 years of financial crises, high levels of international capital flows are correlated with more frequent and severe financial crises. Similarly, a 2010 Bank of International Settlements study by Claudio Borio and Petit Disyatat ascertained that cross border capital flows were over 60 times trade flows, meaning they had almost nothing to do with them. " ..."
"... I think it is apparent that the entire edifice of finance has been jiggered to benefit, Davos man and NO ONE ELSE. ..."
"... hy shouldn't Davos man want it to continue – the aftermath was set right for the 0.1% remarkably fast in the aftermath of the Great Recession – by HUGE infusions of government money, guarantees, credit, forbearance, etcetera – which for some reason can NEVER be made available to the 90% ..."
"... This is probably the most salient reason Hillary lost, but it can never, ever be proffered as a reason for it would reveal that ALL our problems are due to the rich . ..."
"... I've often wondered how "The Multiplier Effect" of money, [not] circulating and recirculating in our local economies, at the consumer level, is affected by money sent out of the country by "immigrants"? ..."
"... Is this such a small amount as not to be considered part of "cross border capital flows"? How does it affect local economies that are more important to us than what happens on Wall Street? ..."
m'kay so kind of like robbing peter (emerging markets with growth potential) to pay paul (goldman
et.al.) until peter goes broke (asset bubble collapse) so paul can't be paid until he "natural"
growth potential of emerging markets recovers (peters growth potential recovers from the asset
bubble/debt overhang with best performance to those with more flexible currency) so that paying
paul (new grifts, oops financial innovations) can be foisted on them again leading to, in hindsight
only of course, and notably after paul has been paid, another collapse? rinse and repeat .is there
any sense to this postulation?
Why do you use the term 'capital' when referring to credit/lending that is not related to economically
real outputs. The rest of the article tells this story but the lead groups it all as 'capital'
flows.
This is an editorial suggestion really one that does not conflate or mislead when treating
credit creation used for financial asset trading as if it were the same general thing as FDI,
that is, direct investment.
We have seen the financial system react to the crisis by recognizing their own unhinged behavior,
and doing much less of it for good reasons. They know their credit creating behavior was nit coverting
Savings into Investment, they know it was not 'capital' – so editors, let us help our writers
to bring more clarity.
I agree. We need a separate word for 'financial capital'. I am thinking 'ante' or 'stake' or
some similar word from the world of gambling and confidence tricks.
"And even though neoliberals and international banks would have you believe otherwise, a fall
in these money movements is entirely a good thing. As Ken Rogoff and Carmen Reinhart found in
their study of 800 years of financial crises, high levels of international capital flows are correlated
with more frequent and severe financial crises. Similarly, a 2010 Bank of International Settlements
study by Claudio Borio and Petit Disyatat ascertained that cross border capital flows were over
60 times trade flows, meaning they had almost nothing to do with them. "
This is probably something that not one in 10,000 people understand (I don't really either) –
but I think it is apparent that the entire edifice of finance has been jiggered to benefit, Davos
man and NO ONE ELSE. And why shouldn't Davos man want it to continue – the aftermath was set right
for the 0.1% remarkably fast in the aftermath of the Great Recession – by HUGE infusions of government
money, guarantees, credit, forbearance, etcetera – which for some reason can NEVER be made available
to the 90%
This is probably the most salient reason Hillary lost, but it can never, ever be proffered
as a reason for it would reveal that ALL our problems are due to the rich .
I've often wondered how "The Multiplier Effect" of money, [not] circulating and recirculating
in our local economies, at the consumer level, is affected by money sent out of the country by
"immigrants"?
Is this such a small amount as not to be considered part of "cross border capital flows"?
How does it affect local economies that are more important to us than what happens on Wall Street?
"... As of September 2016, 4 counties produced 90.1% of all the Bakken/Three Forks oil production in North Dakota: McKenzie, Mountrail, Williams and Dunn. Relative to December 2014, North Dakota Bakken/Three Forks oil production is off 243,098 b/d relative to December 2014 while the number of producing wells is up 1861 based upon data from the state. ..."
"... This shows well density and production from last September. The distance is concentric from a "production centre of gravity" – i.e. weighted average by production for all wells. The core area ("sweet spot") is a circle of about 50 to 60 kms only (it's squashed out a bit to the west and missing a bite in the SW). Maximum well density (and with the best wells is 120 to 160 acres, and falls off quickly outside the core. The core is getting saturated. ..."
"... "U.S. drilling activity is increasingly concentrated in the Permian Basin . The Permian now holds nearly as many active oil rigs as the rest of the United States combined, including both onshore and offshore rigs, and it is the only region in EIA's Drilling Productivity Report where crude oil production is expected to increase for the third consecutive month." ..."
"... "Several of the larger M&A deals involved Permian Basin assets, where drilling and production is beginning to increase. Based on data through November 10, the second half of 2016 already has more M&A spending than the first half of 2016, but on fewer deals. The 93 M&A announcements in the third quarter of 2016 totaled $16.6 billion, for an average of $179 million per deal, the largest per deal average since the third quarter of 2014. Although only 11 of the 49 deals so far in the fourth quarter of 2016 are in the Permian Basin, they accounted for more than half of total deal value." ..."
The number of rail cars hauling petroleum is a constant in the range of 7,200 to 7,400
petroleum cars hauled each week for a good six months now.
Seems as though petroleum by rail is more of a necessity than a choice.
The volume is down a good thirty percent since about 2013 when over 10,000 cars were
hauled per week.
Demand decreases, contracts expire, better modes of transport emerge and cost less. not
as much call for Bakken oil. Plenty of the stuff somewhere else in this world.
The trend is down, not up for petroleum hauled by rail.
If there were orders for Bakken oil for one million bpd, the production would be one
million bpd. Bakken oil lost marketshare due to price drop. Buyers can buy oil from
anywhere.
More Bakken petroleum is being moved by pipeline. Over the whole rail system, petroleum
and petroleum product rail car loadings were down to 10.5 thousand in September. That
compares to a high point of 16.3 thousand railcars in Sept of 2014.
Coal car loadings are on the rise, from a low of 61,000 in April to 86,000 in Sept.
Coal was running a near steady 105,00 to 110,000 railcars every month in 2013 and 2014.
The chart below from RBN shows that Bakken pipeline capacity did not increase since
early 2015. But production dropped, and this primarily affected volumes of Bakken oil
transported by rail.
Given the higher percentage of oil transported by pipelines, the average
transportation cost for Bakken crude should have decreased. Interesting, however,
that the price differential between the well-head Bakken sweet crude and WTI has
remained within the $10-12/bbl range.
Bakken Crude Production and Takeaway Capacity
Source: RBN
Bakken Blend differentials at terminals close to North Dakota wellheads held their
lowest assessment since December Tuesday, closing at the calendar-month average of
the NYMEX light sweet crude oil contract (WTI CMA) minus $6.25/b.
While one factor dragging on Bakken differentials has clearly been a tight Brent/WTI
spread - trading around 42 cents/b Tuesday, well in from the steady $2/b seen this
summer - the return of Louisiana Light Sweet to the Midwest market may also be having
an impact, according to traders.
One trader said there was an increase in volumes heading up the Capline pipeline,
however, differentials suggest LLS is still too expensive, at least compared to
Bakken. Platts assessed LLS at WTI plus $1.15/b Tuesday.
Considered by some to be the "champagne of crudes," it is unclear what appeal LLS
still has for a Midwest refiner as margins for LLS actually - and unusually - lag
those for Bakken.
S&P Global Platts data shows LLS cracking margins in the Midwest closed at $3.30/b
Monday, compared to Bakken cracking margins of $6.37/b. In fact, the advantage of
cracking Bakken has grown steadily since August.
Platts margin data reflects the difference between a crude's netback and its spot
price.
Netbacks are based on crude yields, which are calculated by applying Platts
product price assessments to yield formulas designed by Turner, Mason & Co.
What is clear however, is that the steeper discounts available for Bakken provide
the biggest incentive for a Midwest refiner.
The cost of getting Bakken to this market is around $3.48/b, according to Platts
netback calculations, compared to just $1.02/b for LLS.
These costs make up a significant portion of the Bakken discount.
Further, LLS moving up the Capline after many years of relative inactivity does
not necessarily suggest a new trend is in the making. However, recent pipeline
reversals between Texas and Louisiana mean more Permian crudes are capable of
reaching Louisiana refineries, and thus, if priced accordingly, could displace
incremental volumes of LLS from its home market.
With current pipeline capacity out of North Dakota typically full, the marginal
Bakken barrel often gets to market via rail, and this cost has traditionally sets the
floor to Bakken's discount to WTI. And part of the recent downturn in Bakken could be
chalked up to an increase in railed volumes to the US Atlantic Coast, as Bakken
cracking margins there are again in the black.
In fact, Association of American Railroad's latest monthly and weekly data shows
crude and refined product rail movements appear to have bottomed, having grown in
September from August.
Weekly data bears this out as well, showing increases in three of the last four
weeks.
It remains to be seen how long this will last, however, should Energy Transfer
Partners Dakota Access Pipeline go ahead as planned.
Linefill for the pipeline could boost Bakken differentials, potentially making the
grade too expensive to rail east. However, the devil is in the details.
Traders and analysts have pegged Dakota Access pipeline tariffs between
$4.50-$5.50/b for uncommitted shippers between North Dakota and Patoka, Illinois. A
further $6.50/b would be needed to bring the crude south from Patoka to Nederland,
Texas, sources have said.
If this $11-$12/b combined pipeline estimated cost were to pan out, it would be
more expensive than the $10.20/b Platts assumes in its Bakken USAC rail-based netback
calculation.
Oil rig count in the Permian is up 73.5% from this year's low – the biggest increase
among all US basins.
It is still only 41% of October 2014 peak, but this is much better than the Bakken and
especially the Eagle Ford where drilling activity remains depressed.
As of September 2016, 4 counties produced 90.1% of all the Bakken/Three
Forks oil production in North Dakota: McKenzie, Mountrail, Williams and Dunn.
Relative to December 2014, North Dakota Bakken/Three Forks oil production is off
243,098 b/d relative to December 2014 while the number of producing wells is up 1861
based upon data from the state.
Based upon state data, the number of producing wells/square mile is 1.29 in
Mountrail County, 1.22 in McKenzie County, 1.02 in Willams County, and 0.86 in Dunn
County. How high can the number of producing wells/square mile go?
Is there something more than reduced drilling to explain the drop in production?
This shows well density and production from last September. The distance is
concentric from a "production centre of gravity" – i.e. weighted average by
production for all wells. The core area ("sweet spot") is a circle of about 50 to
60 kms only (it's squashed out a bit to the west and missing a bite in the SW).
Maximum well density (and with the best wells is 120 to 160 acres, and falls off
quickly outside the core. The core is getting saturated.
"U.S. drilling activity is increasingly concentrated in
the Permian Basin . The Permian now holds nearly as many active oil rigs as the rest of
the United States combined, including both onshore and offshore rigs, and it is the only
region in EIA's Drilling Productivity Report where crude oil production is expected to
increase for the third consecutive month."
Permian Basin also dominates M&A activity in the US E&P sector.
From the same EIA
report:
"Several of the larger M&A deals involved Permian Basin assets, where drilling
and production is beginning to increase.
Based on data through November 10, the second half of 2016 already has more M&A spending
than the first half of 2016, but on fewer deals. The 93 M&A announcements in the third
quarter of 2016 totaled $16.6 billion, for an average of $179 million per deal, the
largest per deal average since the third quarter of 2014. Although only 11 of the 49
deals so far in the fourth quarter of 2016 are in the Permian Basin, they accounted for
more than half of total deal value."
"... The FED oil production number for October came out yesterday. In below chart the production decline (blue line) is the same as in the previous month, yet the trend is still a massive decline year over year. In my view year over year comparison can show the dynamic of a trend. And it shows clearly that in the current cycle the oil price recovery is – in contrast to the cycle in 2008/9 – very slow and tentative. ..."
"... This indicates that most Middle East producers still have high margins at the current oil price. [-- produced may be by states no] ..."
"... Middle East producers – and also Russia – can quite easily cope with an oil price of 40 +/- 10 USD per barrel. This is why I think that the oil price will bounce at the bottom of the barrel within above range for a few years. ..."
"... He who has the market share now, will cash in when the oil price rises. And it will rise, yet not until something breaks. This is how business works. This is how Microsoft crushed Apple in the nineties in the PC market – and Apple then crushed Nokia in the smart phone market . ..."
"... I do not think that Saudi Arabia has the freedom to compromise here – even if they want. If they blink they will be crushed by shale producers. So, the stand-off will go on for a while, at a loose-loose situation for both parties. However this is great luck for consumers as they can enjoy low energy prices for 2 to 3 years. ..."
The FED oil production number for October came out yesterday. In below chart the production decline
(blue line) is the same as in the previous month, yet the trend is still a massive decline year over
year. In my view year over year comparison can show the dynamic of a trend. And it shows clearly
that in the current cycle the oil price recovery is – in contrast to the cycle in 2008/9 – very slow
and tentative.
The year over year oil price (green line in below chart) actually decreased again year over year
and the risk of a double dip in the oil price is growing by the day. Drilling follows very cautiously
the oil price in a parallel line (red line in below chart). If there would be really a technological
advantage for shale, the red and the green line would not be paralell, but the red line for drilling
would rise much stronger. This is actually the case for Middle East drilling, which barely fell during
this cycle.
This indicates that most Middle East producers still have high margins at the current
oil price. [-- produced may be by states no]
Middle East producers – and also Russia – can quite easily cope with an oil price of 40 +/-
10 USD per barrel. This is why I think that the oil price will bounce at the bottom of the barrel
within above range for a few years.
There is also something interesting going on with the world economy. The shippers rose exponentionally
over the last few days (DRYS up over 1000%). Also the baltic Dry index is up 600% since the beginning
of this year. House prices here in London fell – mostly at the high end. Rents for expensive homes
are down by up to 36%. Donald Trump has clearly changed something already as it becomes increasingly
clear that the dollar hoarders are paying for the infrastructure spending. I am not sure if he understands
that he is doing a lot of harm to his own business empire as well.
I expect if that depressing old banker were here he would note that instability is dangerous,
and that all the moves in treasuries currency and possibly trade flow create changes of which
the results are difficult or impossible to predict
I can easily understand your assertion that Middle Eastern and Russian oil is profitable
at forty bucks. But if the price is to stay around forty, then it follows that you think that
between them, the producers in the Middle East and Russia will be able to supply all the oil
the world wants for the next few years. Am I correct in saying this?
Do you think western producers will continue to pump enough at a loss ( most of them are
apparently losing money at forty bucks ) to make up the difference?
The US has thrown the gauntlet to OPEC by claiming to becoming an oil net
exporter. This has brought OPEC in a very difficult situation. If they cut – and oil gets
to 70 USD per barrel – shale will pick up the slack and produce the amount OPEC has cut
within a short period of time. So, OPEC is forced to cut again, until it has lost a lot
of market share – and thus also a lot of revenue.
In my view OPEC has no other choice than to produce come hell and water – until something
breaks. This could be that many shale companies give up or that for instance Iran is not
allowed to export as much as they do, or there is a major conflict in the Middle East, or
Saudi Arabia is running out of cash ..
He who has the market share now, will cash in when the oil price rises. And it will
rise, yet not until something breaks. This is how business works. This is how Microsoft
crushed Apple in the nineties in the PC market – and Apple then crushed Nokia in the smart
phone market .
I do not think that Saudi Arabia has the freedom to compromise here – even if they
want. If they blink they will be crushed by shale producers. So, the stand-off will go on
for a while, at a loose-loose situation for both parties. However this is great luck for
consumers as they can enjoy low energy prices for 2 to 3 years.
"... Right now there are as many rigs running drilling this rock formation as there are in the rest of the country combined, so it is already baked in to the US production data. This is not like a Saudi Arabia field with a low drill and complete and development cost, it will take many billions of drilling capital to get a small percentage of the oil in place. The big deal is that the area is fairly resilient to low oil prices and will cushion the drop in US production due to lack of investment in other basins. ..."
"... The USGS lost all credibility with me as to estimating TRR in the Monterrey Shale in California. It baffles me, after five years of publically discussing unconventional shale oil resources, that modelers, internet analysts and predictors completely ignore economics, debt and finances. Extracting oil is a business; it must make money to succeed. If it does not succeed, all bets are off regarding predictions. ..."
I am a petroleum Geologist drilling wells in the Wolfcamp, the USGS report means
nothing. They periodically review basins to assess how much petroleum is there, we have
been drilling Horizontal wells in the Wolfcamp for almost a decade, and vertical wells
for many decades.
Right now there are as many rigs running drilling this rock
formation as there are in the rest of the country combined, so it is already baked in to
the US production data. This is not like a Saudi Arabia field with a low drill and
complete and development cost, it will take many billions of drilling capital to get a
small percentage of the oil in place. The big deal is that the area is fairly resilient
to low oil prices and will cushion the drop in US production due to lack of investment
in other basins.
Thank you, JG -- Straight from the horses mouth, respectfully.
The USGS lost all
credibility with me as to estimating TRR in the Monterrey Shale in California. It
baffles me, after five years of publically discussing unconventional shale oil
resources, that modelers, internet analysts and predictors completely ignore
economics, debt and finances. Extracting oil is a business; it must make money to
succeed. If it does not succeed, all bets are off regarding predictions.
The Monterrey shale estimate was by the EIA not the USGS. The EIA had a private
consultant do the analysis and it was mostly based on investor presentations, very little
geological analysis.
It would be better if the USGS did an economic analysis as they do with coal for the
Powder River Basin. They could develop a supply curve based on current costs, but they
don't.
Do you have any idea of the capital cost of the wells (ballpark guess) for a horizontal
multifracked well in the Wolfcamp? Would $7 million be about right (a WAG by me)?
On ignoring economics, I show my oil price assumptions. Other financial assumptions for
the Bakken are $8 million for capital cost of the well (2016$). OPEX=$9/b, other
costs=$5/b, royalty and taxes=29% of gross revenue, $10/b transport cost, and a real
discount rate of 7% (10% nominal discount rate assuming 3% inflation).
I do a DCF based on my assumed real oil price curve. Brent oil price rises to $77/b
(2016$) by June 2017 and continue to rise at 17% per year until Oct 2020 when the oil price
reaches $130/b, it is assumed that average oil prices remain at that level until Dec 2060.
The last well is drilled in Dec 2035 and stops producing 25 years later in Dec 2060.
EUR of wells today is assumed to be 321 kb and EUR falls to 160 kb by 2035. The last
well drilled only makes $243,000 over the 7% real rate of return, so the 9 Gb scenario is
probably too optimistic, it is assumed that any gas sales are used to offset OPEX and other
costs, though no natural gas price assumptions have been made to simplify the analysis.
This analysis is based on the analyses that Rune Likvern has done in the past, though
his analyses are far superior to my own.
Years of low interest rates and quantitative easing have not restored
growth to developed countries, and many observers lately have been calling on central banks to
inject stimulus into economies directly. But do the rewards of "helicopter money" outweigh the
risks?
ZURICH – The world has been on pins and needles since Donald Trump's upset victory over
Hillary Clinton in the United States' presidential election last week. No one – including,
perhaps, the president-elect himself – quite knows what shape the next US administration will
take, or what its policy priorities will be.
Compounding this uncertainty is the fact that, around the world, geopolitical tensions are
rising, with developed economies continuing to experience tepid growth, even after years of
record-low interest rates. For Trump to stimulate enough activity in the US economy to satisfy
his zealous base, he will have to find the right balance between fiscal measures and
monetary-policy tools.
Whether Trump continues the post-1945 US tradition of international leadership, or instead
chooses an "America first" approach, he will not be alone in his quest for growth: Japan and
eurozone countries are also struggling to bring about sustainable recoveries and meet central
banks' inflation targets. Project Syndicate commentators have been at the forefront of the
ongoing debate about what policymakers can do to achieve these goals. In particular, while Trump
and policymakers elsewhere are embracing fiscal activism, how far they are willing or able to go
remains uncertain, raising the question of what more central banks could do to stimulate demand
and boost growth.
Spinning in Circles
The recent shift toward fiscal expansion reflects widespread agreement that policymakers are
running out of stimulus options. Central banks can no longer rely on "forward guidance," such as
half-promises that interest rates will remain low indefinitely. And quantitative easing (QE) is
quickly losing its potency, perhaps because it is inherently more effective as a crisis-response
mechanism than as a long-term fix.
Iran opened three oilfields with a total production of more than 220,000 barrels per day (bpd)
on Sunday, as the country ramps up its production after the lifting of sanctions.
President Hassan Rouhani officially launched the first phases of the Yadavaran and North Azadegan
fields as well as the North Yaran field, which are shared with neighboring Iraq, the Iranian oil
ministry's news agency SHANA reported.
Yadavaran will have a production of up to 115,000 bpd in its first phase and North Azadegan's
output is 75,000 bpd, SHANA said.
North Yaran will initially produce 30,000 bpd, the news agency reported last week.
"... In February, this year, our basin's posted price went to $19 and change a couple different days, producers in the Bakken received in the teens many more days, and there was a negative posted price for North Dakota sour. ..."
"... Seems like Russian, OPEC and US producers have gone mad, trying to grow production in this price environment. Questionable senior management IMO, across all of them. ..."
"... Russian producers have been investing in new projects for the past several years and it simply does not make sense to postpone project start-ups with 90-100% readiness. This also applies to other large or relatively large conventional projects with long investment cycles (US GoM, Kashagan, Brazil, some projects in Norway, etc.). ..."
"... Iraq is more or less in the same situation, as its new projects have been developed for years. ..."
"... Iran is increasing production after embargo on its oil supplies was lifted, and it is keen to regain market share. ..."
"... Libya and Nigeria have increased production in October as they restarted capacity that was previously shut-in due to internal instability. ..."
"... My comments were somewhat in sarcasm. I do not know enough about the timelines or costs of projects outside of onshore US to make an intelligent comment. I hope that by the end of 2017, projects outside of the US will begin to slow. I have little hope the Permian will slow until the New York bankers leave Midland, TX. ..."
In February, this year, our basin's posted price went to $19 and change a couple different
days, producers in the Bakken received in the teens many more days, and there was a negative posted
price for North Dakota sour.
I thought that was nonsense too. So did Russia, as I recall, who began to talk to OPEC about
some production cuts around that time.
I don't agree w the Hills Group.
However, prices have been very low in 2016. Our average price thru 10 months has been $37,
and here we are today at $38.50. I think that likewise is nonsense.
Seems like Russian, OPEC and US producers have gone mad, trying to grow production in this
price environment. Questionable senior management IMO, across all of them.
I did not mean some specific cases of regional oil prices (like the Bakken crude), but international
benchmarks, Brent and WTI.
As regards Russian, OPEC and US producers, these are different cases.
Russian producers have been investing in new projects for the past several years and it simply
does not make sense to postpone project start-ups with 90-100% readiness. This also applies to
other large or relatively large conventional projects with long investment cycles (US GoM, Kashagan,
Brazil, some projects in Norway, etc.).
Iraq is more or less in the same situation, as its new projects have been developed for years.
Iran is increasing production after embargo on its oil supplies was lifted, and it is keen
to regain market share.
Libya and Nigeria have increased production in October as they restarted capacity that was
previously shut-in due to internal instability.
The U.S. LTO is a completely different case, as these are projects with a very short investment
cycle. And indeed it doesn't make sense for heavily indebted shale companies to increase capex
in the current market situation.
My comments were somewhat in sarcasm. I do not know enough about the timelines or costs of projects outside of onshore US to make
an intelligent comment. I hope that by the end of 2017, projects outside of the US will begin to slow. I have little
hope the Permian will slow until the New York bankers leave Midland, TX.
"... But it gets more apparent with each report they are concerned with a sudden drop in supply in the medium term (I think supply will decline gradually through 2017 but then accelerate in 2Q2018 and fall off a cliff in 2019 given current project planning. ..."
"... It is now becoming too late to do much that will impact supplies then and with the likelihood of low prices through next year and few attractive recent discoveries (and getting worse each quarter in that respect) there are unlikely to be many more FIDs next year than this – I think only 12 so far and more gas than oil – therefore that supply drought will probably extend through 2020. ..."
"... Decline rates could increase on existing fields at the same time as in-fill drilling marginal gains start to decline and the impact of reduced maintenance and brownfield spending during these low price years start to impact. ..."
"... People may point to US LTO fields to be able to quickly fill any gap, but I'd point out it took about 5 years for Bakken to ramp up to 1 mmbpd ..."
It looks like this month (Nov.) will probably be a new global oil supply record barring major
disruptions anywhere. But it gets more apparent with each report they are concerned with a sudden
drop in supply in the medium term (I think supply will decline gradually through 2017 but then
accelerate in 2Q2018 and fall off a cliff in 2019 given current project planning.
It is now becoming
too late to do much that will impact supplies then and with the likelihood of low prices through
next year and few attractive recent discoveries (and getting worse each quarter in that respect)
there are unlikely to be many more FIDs next year than this – I think only 12 so far and more
gas than oil – therefore that supply drought will probably extend through 2020.
Decline rates
could increase on existing fields at the same time as in-fill drilling marginal gains start to
decline and the impact of reduced maintenance and brownfield spending during these low price years
start to impact.
People may point to US LTO fields to be able to quickly fill any gap, but I'd point out it
took about 5 years for Bakken to ramp up to 1 mmbpd, and that was when the sweet spots were available
and with an industry not already loaded down with debt. That rate is not much better than a new
conventional basin with similar reserves would have achieved (as long as it wasn't in Kazahkstan
of course).
"It is not the role of the IEA to urge any oil industry player to take one course of
action rather than another, and we are not doing so now. Over time, market forces will do their
job and the oil price will respond to the signals provided by demand and supply. What the IEA
has argued for consistently is the need for investments necessary to meet rising oil demand.
Such investments ensure that the market remains close to balance and that prices are as stable
and as fair for both producers and consumers as can ever be possible in such a dynamic industry."
Related to ExxonMobil – they are the only major company so far this year to have had a couple
of good successes with exploration, that is a reverse previous history when they were known having
much more success "drilling on Wall Street" to boost their reserves – part of the reason for the
Mobil acquisition who always did pretty with with wildcatting.
It would be interesting to know how their reserves (and other companies as well) are broken
down between developed and undeveloped for oil and gas, before Liza in Guyana and the Owowo (Nigeria)
discovery this year they were pretty short of oil projects of any kind, irrespective of price,
except in support of some OPEC countries on buyback contracts, and I don't know how that oil is
counted against their reserves if at all.
Other majors might be in worse shape than them once
the current bubble of projects works through.
"... The approved projects coming on line are about 500 kbpd in 2019, 700 in 2020 and 200 in 2021. There will also be about 1 mmbpd still ramping up, but I think the supply will be slightly in deficit and any stock overhang will have largely gone by the end of 2018 (assuming demand stays as predicted). In terms of decline existing fields it is minimum 3.3% (based on Core labs) up to 5.5% by Rystad – but I think the cuts in maintenance and brownfield work, exhaustion of marginal in-fill drilling benefits and extended use of horizontal drilling over the last 15 years will mean this is likely to accelerate. ..."
"... I, like many, quote start-up date for end of project development but often it takes 12 to 18 months to ramp up to plateau, so all that lack of new supply in 2019 to 2021 can impact through to 2023. ..."
Price depends on supply and demand – I don't know what is going to happen in demand: it seems
to be predictable until suddenly it isn't. Recessions can have reasonably large impacts to demand
and these have proportionally larger impacts on price.
The approved projects coming on line are about 500 kbpd in 2019, 700 in 2020 and 200 in 2021.
There will also be about 1 mmbpd still ramping up, but I think the supply will be slightly in
deficit and any stock overhang will have largely gone by the end of 2018 (assuming demand stays
as predicted). In terms of decline existing fields it is minimum 3.3% (based on Core labs) up
to 5.5% by Rystad – but I think the cuts in maintenance and brownfield work, exhaustion of marginal
in-fill drilling benefits and extended use of horizontal drilling over the last 15 years will
mean this is likely to accelerate.
Note there will of course be other projects added, but another low price year in 2017 with
additional cuts (e.g. see CoP, Statoil, PetroBras, Pemex news over the last weeks) and there just
won't be enough time to get much online before 2021, especially as the service industries and
development groups in the E&Ps are still getting thinned out (see Weatherford, Heerema, Hess news
recently).
I, like many, quote start-up date for end of project development but often it takes
12 to 18 months to ramp up to plateau, so all that lack of new supply in 2019 to 2021 can impact
through to 2023.
"... It would appear that perhaps a lot of infill drilling is taking place in Saudi Arabia, Kuwait and UAE in order to achieve these recent oil production values. It'll be interesting to see how this infill drilling might one day impact the decline side of the curve. ..."
"... According to Bedford Hill and the oil engineers at the Hills Group, Saudi oil production will experience at SENECA CLIFF like decline. I agree. ..."
"... I'm no expert but from what I understand infill drilling causes what might have been a roughly Hubbert shaped production curve to flatten out at the top for a while and then in the future experience a steeper decline curve; basically representing future production on the Hubbert curve being brought forward to maintain a plateau at the peak. This does seem to move the curve profile from Hubbert to Seneca, so to speak. ..."
"... This image from Matt certainly represents a plateau at approx 72 million barrels a day taking place in all jurisdictions outside of Canada and USA. ..."
"... I'm very interested in the timing and the steepness of this impending decline. Figure 10 mentioned above shows the rig count in Kuwait, Saudi and UAE really taking of 'bigly' in 2010-2011 'ish. ..."
It would appear that perhaps a lot of infill drilling is taking place in Saudi Arabia,
Kuwait and UAE in order to achieve these recent oil production values. It'll be interesting to
see how this infill drilling might one day impact the decline side of the curve.
I'm no expert but from what I understand infill drilling causes what might have been a roughly
Hubbert shaped production curve to flatten out at the top for a while and then in the future experience
a steeper decline curve; basically representing future production on the Hubbert curve being brought
forward to maintain a plateau at the peak. This does seem to move the curve profile from Hubbert
to Seneca, so to speak.
This image from Matt certainly represents a plateau at approx 72 million barrels a day
taking place in all jurisdictions outside of Canada and USA.
I'm very interested in the timing and the steepness of this impending decline. Figure 10
mentioned above shows the rig count in Kuwait, Saudi and UAE really taking of 'bigly' in 2010-2011
'ish.
"... ""This analysis raises a host of questions: If the unsecured credit lines that make the payments system function smoothly are liquidity, then are these credit lines also money? Should they be money? If these credit lines that are so important to the operation of the payments system are not money, then what is the point of defining money at all? I am still puzzling over these questions so I only ask them and don't pretend to answer them here."" ..."
"... Sissoko acknowledges the role that sovereign governments play in establishing money systems but I think gives too much credit :) to private bank credit creation. ..."
"... If money grew on trees it would be worth very little (Wray 2004) ..."
"... Money is the result of the struggle between debtors' demand for money and creditors' belief that the state can service its debt, which in turn depends on tax revenues. And it is the need to work for a taxable income that gives it value. (Ingham) ..."
"... Taxes don't finance spending but are necessary for money to have state backed value. They are also an important way for the state to transfer resources whether for bank bailouts, wars, social security, health care or whatever the state deems important. ..."
Carolyn Sissoko has an interesting new paper out,
Financial Stability
, in which she takes on the nature of money problem.
I think her concluding paragraph is interesting
""This analysis raises a host of questions: If the unsecured credit lines that make the payments
system function smoothly are liquidity, then are these credit lines also money? Should they be money?
If these credit lines that are so important to the operation of the payments system are not money, then
what is the point of defining money at all? I am still puzzling over these questions so I only ask them
and don't pretend to answer them here.""
As a derivatives expert she takes on the interesting question of how these complex sources of credit
function, they provide credit but are they really money.
I think Ingham makes a great point relevant to this, "all money is credit but not all credit is money"
Sissoko acknowledges the role that sovereign governments play in establishing money systems but I
think gives too much credit :) to private bank credit creation.
If money grew on trees it would be worth very little (Wray 2004)
Money is the result of the struggle between debtors' demand for money and creditors' belief that
the state can service its debt, which in turn depends on tax revenues. And it is the need to work for
a taxable income that gives it value. (Ingham)
Taxes don't finance spending but are necessary for money to have state backed value. They are also
an important way for the state to transfer resources whether for bank bailouts, wars, social security,
health care or whatever the state deems important.
If money grew on trees it would be worth very little (Wray 2004)
That would depend on the rate of growth and, assuming every citizen had an equal number and quality
of such trees, be an ethical means to create fiat apart from normal deficit spending for the general
welfare.
Of course there are no such trees but equal fiat distributions to all adult citizens could have
the same effect.
"... If all those resources which some fear may be unleashed had been profitable to work, they would have been worked already. Regardless of what areas get released for exploitation, there has to be profit to be made, or it will not happen. ..."
"One thing is for sure: he will usher in one of the most deregulated eras for
oil and gas in recent memory. He will rescind regulations that affect methane emissions, hydraulic
fracturing, and greenhouse gas emissions. He will likely streamline or gut permitting requirements
for major infrastructure projects, clearing the way for pipelines. He will probably open up public
lands for expanded drilling opportunities, and in time, he could auction off drilling rights in the
Atlantic Ocean, Arctic Ocean, Alaskan wilderness, and even the Eastern Gulf of Mexico. He has also
promised to withdraw from the Paris Climate Accord. Some of that agenda will require acts of Congress,
but with Republican control of both the House and Senate, nearly all of that agenda is within reach.
It is hard to overstate what a revolution in energy policy this could be."
Why yes. Let's "drill, baby, drill." Have oil companies put more money into drilling, dump more
supplies on the market, and see what happens to prices.
Ah, commodity pricing. The best way to get higher prices is to increase supply, right?
Well, it's not the best way. It's just largely irrelevant.
But along these lines of Trump's
impact on oil - there is rather a lot of talk about a tsunami of money coming to fund his priorities,
which certainly include shale.
I say wait a minute. He's an independent who managed to get the GOP nomination. He isn't
afraid of borrowing money, but the tsunami to help shale and coal . . . the debt ceiling has
to be raised in the Feb time frame and Wall Street this week has conveniently forgotten this.
A totally GOP govt has to raise the debt ceiling.
The fiscal conservatives will RAGE. It will be a vicious fight. And when it's done and the
ceiling is raised, is it really rational to think that the very next thing that happens is
a tsunami of spending on infrastructure, coal and shale?
No way in hell. I smell budget neutral as the soon to be order of the day. Something will
get gutted to pay for something else.
If all those resources which some fear may be unleashed had been
profitable to work, they would have been worked already. Regardless of
what areas get released for exploitation, there has to be profit to be
made, or it will not happen.
So I think fears of an explosion of
exploitation, of solid and liquid fuel production and resulting carbon
emissions are founded on too narrow a view of what it takes to get those
resources up, out and into the market place.
There may be a few parts of those areas which may be viable in today's
economic climate, but I doubt that they will even make up the annual
decline rate.
At the same time tho, a few local companies may get to redeploy a few
unemployed workers from shale and tar sands work, and thus save a few
jobs for a while. Enough to look good on the books, without really
changing much either way.
Or they could buy all the bad investments and call it liquidity
support. Socializing the risks and privatizing the profits is
certainly a key feature of the American way. The true free market
is a kind of myth because it has never existed under industrial
capitalism. Governments, rather than markets, have always
determined the fortunes of corporations, through preferential
contracting, tax breaks and direct subsidies. Now we can add
bailouts and liquidity support to the list of measures. It's
interesting to note that USA is the only democracy without a left
wing party. The spectrum starts at centre right and then spans
further to the right where it eventually stops at approximately
crazy-insane right.
Direct subsidies and bailouts for the bankrupt frackers is going
to be one of the least popular policies *ever*. Also, Trump
doesn't owe those guys *anything*.
I would expect Trump to
funnel money to real estate developers, bluntly…
The group's 2016 World Oil Outlook released today estimates that crude demand will rise by a
further 16.4m barrels per day (b/d) to over 109m b/d by 2040, driven by economic booms in China,
India, and the emerging economies.
"... It would appear that perhaps a lot of infill drilling is taking place in Saudi Arabia, Kuwait and UAE in order to achieve these recent oil production values. It'll be interesting to see how this infill drilling might one day impact the decline side of the curve. ..."
It would appear that perhaps a lot of infill drilling is taking place
in Saudi Arabia, Kuwait and UAE in order to achieve these recent oil production
values. It'll be interesting to see how this infill drilling might one day
impact the decline side of the curve.
I'm no expert but from what I understand infill drilling causes what
might have been a roughly Hubbert shaped production curve to flatten
out at the top for a while and then in the future experience a steeper
decline curve; basically representing future production on the Hubbert
curve being brought forward to maintain a plateau at the peak. This
does seem to move the curve profile from Hubbert to Seneca, so to speak.
This image from Matt certainly represents a plateau at approx 72 million
barrels a day taking place in all jurisdictions outside of Canada and
USA.
I'm very interested in the timing and the steepness of this impending
decline. Figure 10 mentioned above shows the rig count in Kuwait, Saudi
and UAE really taking of 'bigly' in 2010-2011 'ish.
Sulphurman
4d ago
18
19
As any macro economist will demonstrate, working
lower/blue-collar men, predominantly white, born from the
1960s to 1980s have experienced virtually no prosperity,
no 'American dream'. Their incomes have not kept up with
the cost of living, their job sectors have crumbled in the
face of outsourcing and technology efficiencies, they are
usually debt laden and increasingly angry. Trump captured
all of that vote. His team actively targeted that
demographic in their state visits.
These voters have been labelled 'off the grid' by the
idiotic pollsters, because they dont engage in social
media particularly.
The most useful statistic about this victory comes
from the Federal Reserve survey in 2013 that found an
astonishing 47% of respondents would struggle to pay for a
$400 emergency car or heating repair. That breeds
disillusion, and gave Trump his majority.
The sexism, racism, misogyny and dark behaviour of
Trump made no difference to the fact his winning votes
came from people on the wrong end of the distribution of
wealth, millions and millions of them. They'll let him
continue that behaviour if theres a financial improvement
in their lives.
Here's the Jared Bernstein response to John Taylor that Roger Farmer is referring to:
Taylor v. Summers on Secular Stagnation: ... In a recent speech I've featured here in numerous
posts, Larry Summers raised the possibility that the economy is growing below its potential,
with all the ancillary problems that engenders (e.g., weak job and income growth), and not just
in recession, but in recovery. Stagnation is by definition expected in recession, but not in
an expansion...
Taylor argues, however, that secular stagnation is "hokem." His argument rest on two points,
both of which seem obviously wrong.
First, he claims that the current recovery has been weak is not due to any underlying problems
in the private sector or lousy fiscal policy, but due to "policy uncertainty, increased regulation,
including through the Dodd Frank and Affordable Care Act." But the recovery began in the second
half of 2009, well before either of those measures took effect. And, in fact, since they've
done so, if anything, growth and jobs have accelerated. Financial markets have done particularly
well...
Taylor's antipathy toward fiscal stimulus leads him to completely omit the fact of austerity
in the form of fiscal drag as a factor in the weak recovery. ...
His second argument is that if secular stagnation were a real problem, we would have seen it
in the 2000s expansion, yet instead we saw "boom-like conditions, especially in residential
investment." ...
Yes, there was a lot-too much-residential investment, but employment growth was terribly weak...,the
share of the population employed actually declined. Real GDP grew almost a point more slowly
per year over the 2000s business cycle relative to the prior two cycles. Business investment
grew less than half as fast in the 2000s than it did in the 1990s. In fact, after rising pretty
steeply in the 1990s, CBO's estimate of potential GDP fell sharply in the 2000s..., a serious
cost of the problem Summers is raising and Taylor is wrongly debunking.
It's also worth noting that middle-class incomes and poverty rates did much better in the 1990s,
thanks to full employment conditions in the latter half of that cycle, than in the 2000s, when
slack labor markets led to a flattening trend in real median income and increasing poverty rates.
I doubt any of this will convince Taylor and others who simply want to go after the ACA, the
Fed, stimulus measures, et al. But those of us interested in blazing the path back to full employment
should recognize these arguments as politically motivated distractions. ...
If one has been reading Taylor's blog - ECONOMICS ONE - none of his latest partisan garbage
in this oped would have come as a surprise. In the olden days - we would have to turn to Lawrence
Kudlow and those Jerry Bowyer Fuzzcharts for such insanity. I wonder if Stanford is proud of
its most famous macroeconomist. Cough, cough.
DeDude :
The thing that holds back businesses from deploying their stash of cash, is not "policy uncertainty"
or "increased regulation". It is lack of demand.
If the demand is there then the product/service will be produced. When demand is not there
then the cash will sit idle or be used non-productively for things like stock buybacks or takeover
of competitors. Any individual business owner who fail to meet demand (because of policy uncertainty
or regulation) will simply give up market share to those of his/her competitors that chose not
to be held back by those things.
DeDude -> Matt Young...
I am actually not talking about GDP. The issue is why do businesses not hire more people.
The explanation that right wing fools and smart business people love to give is that it's because
of regulations and policies that they don't like. However, as pointed out over on "calculated
risk" they always complain about regulations and there is no correlation between their complaining
(or not) and their actual hire of new employees. The only thing that determine whether a business
will hire more people is whether the demand for its products/services is in excess of what can
be delivered by its current workforce. And they will respond to such demand regardless of cumbersome
regulations - or they will lose market share to competitors that are more than happy to fill
the demand.
Fred C. Dobbs:
(Found out on the web.)
Definition of the term secular stagnation theory is presented. It refers to the protracted economic
depression characterized by a falling population growth, low aggregate demand and a tendency
to save rather than invest.
Dictionary of Theories;2002, p478
David:
I don't think the right word for Taylor's erroneous claims as chiefly "political". It's moral
prejudice. The absolute belief in totally unregulated markets is based on the belief that
1. The wealthy are more virtuous than the poor.
2. Only the strong should survive (see Abba's song "The winnner takes it all").
So it goes from a.Moral Prejudice to b. Political ideology to c. Economic chicanery.
Moral prejudices are the most deeply rooted in human beings because they don't only dictate
how the world is, but how it should be.
pgl -> David...
Aren't your comments better directed towards Greg Mankiw? Oh wait - they are both toadies
for Mitt Romney. Sorry about my question!
bakho:
Taylor isn't right or wrong. Taylor is simply irrelevant to the largest social ill of 2014-
Unemployment.
If one of the basic assumptions of your model is "Assume Full Employment" then employment doesn't
become a goal but a constant.
Under the Assumption of Full Employment, is secular stagnation even possible?
Taylor's model does not even look at Unemployment, and reducing unemployment is not his priority.
If as a policy maker, your goal is to reduce unemployment as quickly as possible, you should
find another model that addresses unemployment directly. Once unemployment is fixed, other models
may be more useful as new problems pop up.
On Nov. 22, Hoover welcomed Roosevelt to the White House. Throughout the meeting, he treated
his successor as though he were a thickheaded schoolboy who needed drilling on intransitive
verbs. He sought to bully the president-elect into endorsing the administration's policies at
home and abroad, especially sustaining the gold standard at whatever cost. Alert to Hoover's
intent, Roosevelt smiled, nodded, smiled again, but made no commitment. A frustrated Hoover
later vowed, "I'll have my way with Roosevelt yet."
Hoover returned to the attack in February. He sent the president-elect a hectoring 10-page handwritten
letter that misspelled Roosevelt's name (as "Roosvelt"). As a consequence of the flight of gold
and runs on banks, Hoover wrote, there was "steadily degenerating confidence in the future."
His wise policies, he claimed, had brought an upturn in the summer of 1932. Since then, though,
he said, there had been a sharp decline because the country was unnerved by Roosevelt's election,
for it feared that the new president would embark on radical experiments. Hoover concluded by
asking Roosevelt to restore confidence by stating publicly that there would be "no tampering"
with the currency and that "the budget will be unquestionably balanced, even if further taxation
is necessary."
Three days after writing this letter, Hoover told an archconservative senator that "if these
declarations be made by the president-elect, he will have ratified the whole major program of
the Republican administration; that is, it means the abandonment of 90 percent of the so-called
new deal." To another Republican senator, he spelled out what he demanded that his successor
renounce: aid to homeowners burdened with mortgages, public works projects and plans for a Tennessee
Valley Authority. He also wanted Roosevelt to raise tariff barriers and impose a national sales
tax.
Roosevelt, who regarded the letter as "cheeky," let days go by without replying, fibbing that
his response had miscarried. He would not let himself be trammeled by being identified with
an unpopular dying administration, so he refused to issue any statement. He would not permit
Hoover to rob him of the fruits of victory. On March 4, unfettered, he announced to the nation
a new beginning....
William E. Leuchtenburg is the William Rand Kenan, Jr. professor emeritus at the University
of North Carolina at Chapel Hill.
sherparick:
I wonder if Tyler Cowen, James Hamilton, and Steve Williamson will take John Taylor to task
for saying that Larry Summers and Ben Bernanke are just putting out a bunch of hokum to protect
the Obama administration from its policy errors? No, I don't think so, civility and treating
those who disagree with you with respect and deference is only something economists with liberal
political leanings, who kind of care what happens to the rest of the American people, and not
just the 1%, owe to their conservative, "scientific," betters.
It should not be forgotten that Professor Taylor was the Deputy Undersecretary of Treasury
for Economics and Financial Issues from 2001-2004. That economic growth was anemic during this
time is well documented.
Has he ever explained his policy errors? As to hokum, I do acknowledge that Professor Taylor
has a lot of experience peddling that for his political masters.
How can Mark Thoma, Noah Smith, or Brue Bartlett have an honest argument with the likes of
John Taylor. I hope he finds his bubble comfortable in side the right wing machine. I am sure
he finds it lucrative.
P.S. Again, the evidence is that economic growth is picking up, just as both Dodd-Frank and
the Affordable Care Act are coming into full effect. Correlation or causation? Are more likely
just co-incidence?
kievite said...
This is an interesting topic which sadly attracted very few comments.
I think there are two issues not covered in comments:
That is politics, not economics and, clearly, as for Taylor, it comes down to the usual
question: "are Republicans more stupid or more evil" (see Robert Waldmann comment to the
post from Brad DeLong ).
The level of debt and the price of energy are two important variables that should probably
be taken into account in any discussion of secular stagnation.
As for Taylor personal legacy, I would suggest that the underlying assumption that there
is an exogenous NIARU (non-inflation-accelerating rate of unemployment) imposing an unavoidable
constraint on macroeconomic possibilities is wrong on both historical and analytical grounds.
From a historical standpoint, a NIARU, if it exists at all, must be regarded as highly variable
over time and place.
To me it smells with the desire to enlist the fear of inflation to justify the maintenance
of a "reserve army of the unemployed" in the society (which is a Marxist term, but probably
is applicable here). In a way high level of unemployment is a precondition to the fast redistribution
of wealth that we observed under the current neoliberal regime.
Which is another way to say that Taylor is a stooge of financial oligarchy. A Trojan
horse which plays the role of an academic economist.
I am working (on and off) on something on world crude oil supplies that may end up as a post
on Fractionalflow.
I agree with Rystad Energy (ref Caelan's post further up. Disclosure, I have never had anything
to do with Rystad) that global oil extraction will decline towards the end of this decade.
I look at this through the lenses of discoveries (and their sizes) not FID, expected changes
to the oil companies' balance sheets at end 2016 (financial leverage will by default come up,
assets/equity come down due to lower oil price and lower reserves [of which some will be rebooked
at a higher price]), CAPEX constraints, their Reserves Replacement Ratios (RRR), likely near term
(oil) price and cost developments to name the most important ones.
The chart below [note scaling on the right axis] is now my conceptual understanding of global
crude oil supplies towards the end of 2018. We are soon entering November 2016 which makes me
now expect the period with decline to last longer.
I expect capacity of about 5 Mb/d of global crude oil capacities to vanish by end 2018. That
will have some implications. It took years with a high oil price ($100/b) to grow supplies with
5 Mb/d.
During the next upturn in the price things will be different, most of the "easy" oil was developed
during the last high price cycle.
I do not expect the decline to accurately follow my suggested span. Depletion induced declines
never sleeps and some portion of world crude oil supplies is now from sources (like LTO, "small"
offshore discoveries) that depletes fast and other legacy sources are also in general decline.
The decline is already baked into the cake. It does not matter if oil prices moved above $80/bo
as of next week. This would stimulate more drilling for tight oil, but for other developments,
it would take anywhere between 2-4 years from these are FIDed (Final Investment Decision) until
they flow.
The oil companies drew down their portfolios of discoveries being profitable at $80/bo during
the high oil price period that ended during the summer of 2014, and still there are some developments
in the pipeline that will start up during the next few years, but this portfolio is shrinking
fast. The tight oil companies have drilled most of their sweet spots and are now cash flow constrained
wrt drilling.
"... In 2015 Volve extracted a gross of about 36.5 PJ (PJ, Peta Joules (Peta; exp15), in other words, those involved in the operations of Volve consumed an estimated privately and directly 0.044% of the energy extracted from Volve in the form of petroleum. No matter how this is tweaked without consideration of the contribution from other energy sources the energy consumed by those involved in the operations will amount to something which borders insignificant. ..."
"... This should illustrate how preposterous Arnoux's claim is about the energy used by the oil companies in 2015 left the societies with only 8% of what was totally extracted. ..."
I will continue with Volve (by North Sea standards a small and marginal discovery/field) which
is an oil field that NPD now reports as shut down.
For 2015 Volve (discovered in 1993 and started in 2008) had an estimated operational EROEI of
close to 12 (at the consumer end!).
The full life cycle EROEI for Volve is at an estimated 9 at the consumer level.
So before anyone starts any discussions about boundaries this estimate includes everything
from those starting to prepare the documentation to apply for the license (akind like engaging
landmen), to shooting seismics and interpreting seismics, to planning and drilling wildcats and
appraisal wells, total 5, to development building of the production installation and drilling
producers, observer wells and water injectors (20) and all planning involved and operations, transport
to refineries, refining and distribution to consumers.
I would strongly argue that going beyond what it takes to get all those involved to and from
office, heliport or harbor is moving the boundaries to what is called society to further some
agenda (or to display pure incompetence). Those engaged in these activities (operating Volve)
have to purchase the end products at the same conditions as everyone else.
Assuming Volve in total and on average engages 400 persons (this includes several shifts offshore,
support and administrative functions onshore (which are less energy intensive).
If these 400 persons (representing roughly the same amount of households) annually used about
1,200 liter gasoline with a heating value about 35 MJ/liter this would amount to about 16 TJ (Tera
Joules (Tera; exp12) in a year.
In 2015 Volve extracted a gross of about 36.5 PJ (PJ, Peta Joules (Peta; exp15), in other
words, those involved in the operations of Volve consumed an estimated privately and directly
0.044% of the energy extracted from Volve in the form of petroleum. No matter how this is tweaked
without consideration of the contribution from other energy sources the energy consumed by those
involved in the operations will amount to something which borders insignificant.
This should illustrate how preposterous Arnoux's claim is about the energy used by the
oil companies in 2015 left the societies with only 8% of what was totally extracted.
(I got a lot more coming. Someone sent me the Hills Group report……. as a gift.)
Thanks Rune, look forward to your analysis. The wide boundary condition for the oil sector involves
close to 1.5 Billion people in the Hills Group Report from Steve's interview with Louis Arnoux.
So technically the whole of Norway could well be involved in the extraction of oil from Volve.
The boundary conditions are waaaay too wide.
VK, thanks.
I have pondered on responding to Steve's
"Rune,
Did the Norwegian oil industry employ any people? Did they buy any pipe? Did they buy other
supplies? Did they use any complex financial services? Did they use any large oil tankers?
How many people built, service or run large tankers? I could go on and on.
This increased cost of energy in the entire system you continue to ignore.
Steve"
Yup, that is the kind of knee jerk reply I would expect from someone who does not know what
he is talking about.
The oil industry (oil companies, petrochemical plants, oil refineries, oil service companies
[Halliburton, Schlumberger etc], exploration firms, mechanical industry like shipyards (that also
builds ships not directly involved in petroleum activities and exports products globally to other
oil/gas producing countries), seismic companies, engineering firms, various suppliers including
shipping, accommodation/cleaning and catering, transport and logistics employed about 300,000
people out of a population of 5.2 million of which about 2.6 million are employed. That is about
10% of the employed population are in some way engaged in the Norwegian petroleum activities.
Due to the collapse in the oil price about 30,000 jobs in the oil industry have been cut, and
most of these former oil employees have found other (non oil related) jobs.
In 2015 Norway produced 1.95 Mb/d (including NGLs) and consumed 0.23 Mb/d (which also includes
consumption for petroleum activities), a net export of 1.72 Mb/d.
In 2015 Norway produced 117.2 Gcm natural gas and consumed 4.8 Gcm (most in the petroleum sector),
a net export of 112.4 Gcm. (World's third biggest net exporter of natural gas).
Norway during a "normal" year is also a net exporter of electricity. Until recently,
Norway was also a net exporter of coal.
So apart from the oil industry, Norway has several aluminium plants (about 5% of global capacities),
steel plants [which does not run on oil!], ferrous alloys, fish farming, ocean fisheries, farming,
forestry (and derived industries like paper mills), shipping companies, airliners, telecom companies,
weapon industry, construction, retail sales, tourism and then there is the public sector with
health care, education, defense, railways, administrative functions of all kinds etc.
So out of about 10% of the employed population is somehow engaged along the logistics chain
to explore, develop, operate and increasingly decommission fields.
And yes, there is no doubt that the energy industry is energy intensive (it takes energy to
produce energy) and the energy intensive phase starts as a development is FIDed and not least
during the operational phase. During the exploration and development phase one may say that the
energy industry borrows energy from the society, but as demonstrated with Volve this energy is
paid back within a few months after start up and from there societies enjoys a flow of surplus
energy.
The oil companies surely would like the financial investment to be recovered this fast.
So let us say that about 25% of the Norwegian oil consumption in 2015 is used by 10% of those
employed in the petroleum sector, this would mean 0.06 Mb/d is used by the oil industry to operate
a flow of 1.95 Mb/d while exploring and developing discoveries. Then there are some energy consumption
(losses) downstream the production facilities, that is from oil is pumped into tankers and delivered
to refineries and further during refining and distribution to end consumers.
According to Arnoux just 0.16 Mb/d (8%) of this flow became useful (in 2015) for societies,
that makes one wonder where (1.95 – 0.16 – 0.06) Mb/d = 1.73 Mb/d went (Yes some for transport,
refining and distribution)?
"... "But last month, when the Census Bureau released its annual economic statistics, they showed that median household income had increased by 5.2 percent [$2,800] in 2015, the biggest rise on record. Furthermore, every part of the income distribution benefited, with the biggest percentage gains going to those in the bottom tier and the smallest gains going to those at the top. These are big changes and offer important confirmation that lower-income families are finally sharing in the economic recovery." ..."
"... "The flip side in this story is that because we have not been investing as much as we would in a fully employed economy, our potential level of output is lower today than if we had remained near full employment since the downturn in 2008. The Congressional Budget Office estimates that potential GDP in 2016 is down by 10.5 percent (almost $2.0 trillion) from the level it had projected for 2016 back in 2008, before the downturn. ..."
"... The Fed is overly afraid of inflation and tight labor markets. They did not provide the economy with enough help after the worst financial crisis since the Great Depression and with Congress forcing unprecedented austerity on the economy. ..."
"... Let's see...how much of the income gains since 2008 have the 1% captured? And how much of that has been due to the appreciation of stocks and other assets caused by low interest rates? Exactly in line with Bernanke's desire for a wealth effect. ..."
"... Problem is, the wealthy don't have a particularly high marginal propensity to consume, so it would have been better to tax them to fund stimulus and distribution to people who live hand to mouth and will spend the money. ..."
Jeffrey Frankel overestimates how good the recent recovery has been. No wonder, he was once on
Clinton's council of economics advisers.
"But last month, when the Census Bureau released its annual economic statistics,
they showed that median household income had increased by 5.2 percent [$2,800] in 2015, the
biggest rise on record. Furthermore, every part of the income distribution benefited, with
the biggest percentage gains going to those in the bottom tier and the smallest gains going
to those at the top. These are big changes and offer important confirmation that
lower-income families are finally sharing in the economic recovery."
Those numbers have been qualified.
"What about those who think that easy monetary policy is bad for income inequality? What are they
thinking? Not all of them are fringe populists. For example, British Prime Minister Theresa May said
earlier this month that low interest rates were hurting ordinary working class people while benefiting
the rich."
Yes and people like Senator Bob Corker or RGC and JohnH here.
As Dean Baker writes:
"The flip side in this story is that because we have not been investing as much as we would in
a fully employed economy, our potential level of output is lower today than if we had remained near
full employment since the downturn in 2008. The Congressional Budget Office estimates that potential
GDP in 2016 is down by 10.5 percent (almost $2.0 trillion) from the level it had projected for 2016
back in 2008, before the downturn.
This is real money, over $6,200 per person. But if we want to have a little fun, we can use a
tactic developed by the deficit hawks. We can calculate the cost of austerity over the infinite horizon.
This is a simple story. We just assume that we will never get back the potential GDP lost as a result
of the weak growth of the last eight years. Carrying this the lost 10.5 percent of GDP out to the
infinite future and using a 2.9 percent real discount rate gives us $172.94 trillion in lost output.
This is the size of the austerity tax for all future time. It comes to more than $500,000 for every
person in the country. "
The economy is not reaching it's potential b/c of bad macro (monetary + fiscal + trade) policy.
Frankel:
"In any case, the Fed and other central banks are not balancing rapid growth against equality,
but rather are balancing rapid growth against dangers of future overheating and financial instability."
The Fed is overly afraid of inflation and tight labor markets. They did not provide the economy
with enough help after the worst financial crisis since the Great Depression and with Congress forcing
unprecedented austerity on the economy.
"What about those who think that easy monetary policy is bad for income inequality?"
Let's see...how much of the income gains since 2008 have the 1% captured? And how much of that
has been due to the appreciation of stocks and other assets caused by low interest rates? Exactly
in line with Bernanke's desire for a wealth effect.
Problem is, the wealthy don't have a particularly high marginal propensity to consume, so it
would have been better to tax them to fund stimulus and distribution to people who live hand to
mouth and will spend the money.
"... Hello …According to Reuters , the European Union on Friday lifted limits on Gazprom's use of a link from its offshore Nord Stream pipeline to Germany, allowing Russia to pump more gas to Europe and bypass its usual routes via Ukraine. ..."
Hello …According to
Reuters , the European Union on Friday lifted limits on Gazprom's use of a link from its offshore
Nord Stream pipeline to Germany, allowing Russia to pump more gas to Europe and bypass its usual
routes via Ukraine.
"... By 2020, barrel prices will rise to an inflation-adjusted $68, which is $12 less than the agency's previous prediction. The government's 2040 projection fell by $17 from its January figure of $90. ..."
The Canadian National Energy Board
lowered its expectations for the oil price recovery on Wednesday due to the falling costs of
energy production and challenging environmental regulations.
By 2020, barrel prices will rise to an inflation-adjusted $68, which is $12 less than the agency's
previous prediction. The government's 2040 projection fell by $17 from its January figure of $90.
"A lot of it is the ability of oil production to be sustained at lower prices," Shelley
Milutinovic, chief economist of the energy board told The Star. "There's an expectation that somewhere
between 40 and 60 dollars a barrel, you can get a lot of oil production around the world."
Renewables are slated to increase their share of the Canadian energy market to 12 percent by 2040,
instead of the eight percent forecasted in the January edition of the report.
"Things are changing very, very quickly, particularly with respect to climate policy,"
Milutinovic said. "It's a very fast-moving target."
U.S. crude oil storage is filling up with unaccounted-for oil. There is a lot more oil in storage
than the amount that can be accounted for by domestic production and imports.
That's a big problem since oil prices move up or down based on the U.S. crude oil
storage report . Oil stocks
in inventory represent surplus supply. Increasing or decreasing inventory levels generally push prices
lower or higher because they indicate trends toward longer term over-supply or under-supply.
Why Inventories Matter
Inventory levels have reached record highs since the oil-price collapse in 2014. This surplus
supply is a major factor keeping oil prices low.
Current inventories are 45 million barrels higher than 2015 levels, which were more than 100 million
barrels higher than the average from 2010 through 2014 (Figure 1). Until the present surplus is reduced
by almost 150 million barrels down to the 2010-2014 average, there is little technical possibility
of a sustained oil-price recovery.
(Click to enlarge)
Figure 1. U.S. Crude Inventories Are ~150 Million Barrels Above Average Levels. Source: EIA,
Crude Oil Peak and Labyrinth Consulting Services, Inc.
U.S. inventories are critical because stock levels are published every week by the U.S. EIA (Energy
Information Administration). The IEA (International Energy Agency) publishes OECD inventories, but
that data is only published monthly and it measures liquids but not crude oil. It also largely parallels
U.S. stock levels that account for almost half of its volume. Inventories for the rest of the world
are more speculative.
Understanding U.S. Stock Levels
Understanding U.S. stock levels should be straight-forward. Every Wednesday, EIA publishes the
Weekly Petroleum Status Report
which includes a table similar to Figure 2.
Figure 2. EIA publishes adjustments and defines them as "Unaccounted-for Oil." Source: EIA
U.S. Petroleum Status Weekly (Week Ending September 16, 2016), Crude Oil Peak and Labyrinth Consulting
Services, Inc.
The calculation to determine the expected weekly stock change is fairly simple:
Stock Change = Domestic Production + Net Imports – Crude Oil Input to Refineries
Domestic production and net imports account for crude oil supply, and refinery inputs account
for the volume of oil that is refined into petroleum products. If there is a surplus, it should show
up as an addition to inventory and a deficit, as a withdrawal from inventory.
But that's not how it works because EIA uses an adjustment in order to balance the books (Table
1).
Table 1. Calculation of Crude Oil Stock Change. Source: EIA Petroleum Status Weekly, Crude
Oil Peak and Labyrinth Consulting Services, Inc.
The logic is that estimated stock levels in tank farms and underground storage are relatively
dependable and that any imbalance must be from less reliable production, net import or refinery intake
data.
There is nothing wrong with adjustment factors if they are small in comparison to what is to be
balanced. In the Table 1 example from September 2016, however, the adjustment is 60 percent of the
stock change–a bit too much.
A one-off perhaps? No, it's a permanent problem that has gotten worse during the last several
years.
Figure 3 shows that crude oil supply and refinery intake of oil vary considerably on a weekly
basis. The balance is cumulatively negative over time beginning with a zero balance in January 1983.
That suggests that crude oil stocks should be falling over time but instead, they have been rising.
(Click to enlarge)
Figure 3. Difference between U.S. crude oil supply and refinery intake. Source: EIA Petroleum
Status Weekly.
The vertical bars show the weekly crude supply from production and net imports either exceeding
the refinery input requirements (positive, green) or not reaching these requirements (negative, red).
The solid red line is the cumulative.
Between 1991 and 2002, the deficit increased to a whopping 1.3 billion barrels.
Looking at only recent history, an additional gap of nearly 200 million barrels developed as refinery
intake exceeded crude oil supply for most of 2010 through 2014 (Figure 4).
(Click to enlarge)
Adjustments were introduced in late 2001 so let's look at the period starting January 2002 (Figure
5).
(Click to enlarge)
Figure 5. EIA adjustments to supply to reconcile stock changes. Source: EIA Petroleum Status
Weekly, Crude Oil Peak and Labyrinth Consulting Services, Inc.
There are both upward (blue) and downward (red) adjustments. Upward adjustments resulted in a
420-million-barrel stock increase over the period January 2002 through September 2016.
All together now
Expected or implied stock changes calculated from weekly crude oil balance indicate falling inventories
from May 2009 through the present. Yet, EIA makes adjustments to that balance in order to match observed
inventory levels. Rising inventories result after those adjustments are added to the physical balance
or implied stock changes (Figure 6).
(Click to enlarge)
Figure 6. Unaccounted-for oil in U.S. storage: the result of adjustments to the supply balance.
Source: EIA Petroleum Status Weekly, Crude Oil Peak and Labyrinth Consulting Services, Inc.
The green area represents the physical balance (crude production plus net crude imports minus
crude refinery intake). The gray area shows the unaccounted-for (adjusted) stocks.
The adjustment for unaccounted-for oil averaged about 15 percent from 2002 through 2010. In 2016,
almost 80 percent of reported stocks are from unaccounted-for oil.
When You Have Eliminated The Impossible
There is no obvious solution for the mystery of unaccounted-for oil in U.S. inventories. Possible
explanations, however, include:
1. Crude field production is underestimated 2. Net crude oil imports are underestimated 3. Refinery inputs are over-reported 4. Crude oil stocks are over-reported
or any combination of those possibilities.
Production, imports and refinery inputs are taxable transactions. It is likely that reporting
errors are largely self-correcting over time because of the financial incentive for government to
collect its due.
State regulatory agencies are the source of production data. Their principal objective is to assess
production taxes. It is unlikely that states would consistently under-estimate production and forego
substantial tax revenue.
Also, producers must state crude oil production in their SEC (U.S. Securities and Exchange Commission)
filings and pay federal income tax on revenues from oil sales. It seems improbable that the SEC and
U.S. Treasury would consistently accept under-reported production and associated lower tax payments.
Crude oil imports are subject to both tariffs and excise taxes so it seems unlikely that the U.S.
government would consistently fail to identify under-payment of those revenues.
Similarly, taxes are involved when refiners buy crude oil and sell refined products. It seems
improbable that they would over-state those transactions and consistently over-pay associated taxes.
The principal components of supply balance-production, imports and refinery intake-are shown in
Figure 7. In a general way, increased production and decreased imports tend to cancel each other
out. Refinery intake has increased since about 2010.
Those trends determine the physical balance or implied stocks. The inescapable conclusion is that
implied stocks (in light blue) are substantially less than reported stocks (in gray).
Adjustments for unaccounted-for oil are unreasonable and out of proportion to the underlying factors
that determine crude oil stock levels.
(Click to enlarge)
Figure 7. Components of unaccounted-for oil in U.S. storage. Source: EIA Petroleum Status Weekly,
Crude Oil Peak and Labyrinth Consulting Services, Inc.
It would be speculation to blame anyone for this apparent statistical disaster. Nevertheless,
there is a problem that has major implications for oil price and the reliability of reported data.
In several of his Sherlock Holmes mystery stories, Arthur Conan-Doyle wrote, "When you have
eliminated the impossible, whatever remains, however improbable, must be the truth."
We have not eliminated any impossible explanations. We have, however, eliminated the three most
improbable explanations for unaccounted-for oil.
The truth-however improbable-is that inventories are probably much lower than what is reported.
By Art Berman for Oilprice.com
Lotanna on October
11 2016 said:
This does not appear good. Those reports have been driving oil price speculations for over a decade.
If this is true, then the US has been gradually influencing the oil price dynamics unethically.
I hope stock traders read this. The world would not be happy with the US. But then again, I expect
them to point the fingers at one individual, jail him and find a new strategy to play the same
game [I believe Strategic Petroleum Reserve was the last try].
JACK MA on October 12 2016 said:
In 2015, 800,000 BPD went missing. This was faked oversupply to drive down prices and collapse
Russia. The last time this much oil was missing was 22 years ago as a ploy to collapse Russia
on low oil prices and back then it worked. This time, Russia simply allied with China.
There is no oversupply of oil and any slight surplus that did exist in now in China's reserves
on the cheap. Kerry really goofed when trying a old play-book to collapse Russia by ordering SA
to flood the markets. What we will now see in 2 years is a 'absolute price shock up' on real billions
in cap x cuts due to the fake oversupply driving down real prices.
This is the oil super cycle driven by the petro-dollar collapse and Dedollarization by Russia
and the BRICS. Globalization is failing obviously as is the dollar. Problem is we cannot simply
bomb Russia and China so easily like the ME, as these two super powers will actually shoot back
and the Western war-hawks are not used to a real enemy that shoots back.
Warmest regards to all, and do your own homework and seek the truth.
Edwards on October 12 2016 said:
Must be the result of common core math, so confusing that even experts can't figure it out. What
about the 6.5 TRILLION bucks that is unaccounted for at the pentagon. The last time 2.3 TYRILLION
was unaccounted for we had 9/11 the next day. Is this an omen for something big to happen imminently?
Ward on October 13 2016 said:
What a conclusion - the 450MM barrels are not in inventory. Give me a break - ofc the physical
inventory is there. Physical inventory is most reliable and verifiable parameter n calculation.
You can stick a tank to know how much is in it.
EIA (aka Obama)started underestimating "reported" production around 2011 according to figure
6. That's when the big changes start.
Big assumption in article is that crude production as as estimated from taxes and EIA report
are in-sync. Seems like reasonable assumption but there's no evidence in article that is the case.
They can still get their taxes and EIA under reports the production because no one sync's up the
EIA data with tax data.
James Rose on October 17 2016 said:
Its more plausible to believe the SPR is being sold into the commercial storage than that the
EIA is faking reports. The reason is the if the EIA is faking reports, they've got to deputize
the API to fake their reports as well. They're different, but not this different.
"... Using data from an earlier year it was estimated that Varg used about 600 boe/d (primarily natural gas) to produce about 8,500 boe/d which results in a flow based EROEI of 14. The reason it is being shut down is that it has been running with a financial loss for about a year. ..."
"... For all production in 2015 on NCS (about 4 mboe/d) it was found the flow based EROEI was just above 30 for 2015. ..."
"... That is correct, but I was clear that this was about what is flowing and that is what matters in the near term. My point was also to show that a well/field is closed down long before its flowing EROEI reaches a level were it not delivers net energy. ..."
"... The portion that takes the biggest portion of energy inputs of field developments is operations. When a discovery is developed the energy input for that is sunk. And what is wrong with using natural gas (and occasionally diesel) for the operations? Varg is operated by a floating process and storage vessel, and the ship Petrojarl may be used for other developments. ..."
The Norwegian Petroleum Directorate (NPD) has a lot of excellent statistics. One of these is
annual CO2 emissions from combustion for power generation at the production installations. This
makes it possible to derive estimates on flowing EROEI, both for all petroleum activities on the
Norwegian shelf, but also for some individual fields.
Varg is an installation in the North Sea that is now being closed down and P&Aed and this happens
as it produced about 8,500 boe/d (of which about 4 500 bo/d was crude oil and condensates).
Using data from an earlier year it was estimated that Varg used about 600 boe/d (primarily
natural gas) to produce about 8,500 boe/d which results in a flow based EROEI of 14. The reason it is being shut down is that it has been running with a financial loss for about
a year.
For all production in 2015 on NCS (about 4 mboe/d) it was found the flow based EROEI was just
above 30 for 2015.
EROEI is a lot more than the natural gas used to pump the oil – it't the steel of the platform,
the special ships that towed it there, the pipes, the prospecting, the seismics, the driling,
the Porsche the CEO drives (in fact all the people working there) and lots I forgot.
the Porsche the CEO drives (in fact all the people working there)
Well, probably you don't want to include the cars driven by employees. The boundaries of EROEI
calculations are always difficult to draw, but…employees are people, and they're "ends", not "means".
If they're not driving to this job, they'll be driving to another, or to the unemployment office.
Here's another way to think of it: commuting isn't part of the job. Employees could walk, bike,
take the bus, live in an adjacent dorm (like in China) or drive an EV.
That is correct, but I was clear that this was about what is flowing and that is what matters
in the near term.
My point was also to show that a well/field is closed down long before its flowing EROEI reaches
a level were it not delivers net energy.
The portion that takes the biggest portion of energy inputs of field developments is operations.
When a discovery is developed the energy input for that is sunk.
And what is wrong with using natural gas (and occasionally diesel) for the operations?
Varg is operated by a floating process and storage vessel, and the ship Petrojarl may be used
for other developments.
If I include helicopter transport of operators that would add an estimated 1 bo/d, which is
well within the uncertainties. Transport of oil, the vessel has storage facilities for 470 000
barrels, which suggests the frequency of offloading. Recent production levels suggests offloading
every 100 days.
I am willing to include other energy inputs if you are able to come up with good data.
Do you have references to other estimates that are more comprehensive?
The cars of the employes add to EROEI – they could mine coal (perhaps with a better EROEI), or
create Holywood films (then they are on the consuming side).
All ships(building and operating), helicopters, 100.000 tons of steel needed for operating
and creating the wells + platforms + pipelines, the tanker fleet have to be added, if you want
to compare the oil complex with coal, natgas, nuclear or solar for energy creating.
Coal you need other ships, with nuclear you need mines and safety personal and almost no ships,
+ electric wires + lots of police – or with wind building the thing, not much for operating, but
hydro pump storage and wires. And all the people maintaining this.
So it's complex – I don't have numbers here, I think everyone can only guess.
I don't think oil has good numbers (besides Gulf oil), but is needed for transportation at
the moment.
Everyone guesses except the Hills group, which gives the time we are going to go phht to within
+/-4% apparently. If you are going to include the cars for the workers why not the trams used
by the nursemaids who look after the babies of the workers who provide the machines that grind
the flour that makes the bread that feeds the workers who build the cars for the workers on the
oil rigs. EROEI is meaningless at that level. If you include all externalities then it is surely
always going to be zero – all energy produced is used by the world: the end
The cars of the employes add to EROEI – they could mine coal (perhaps with a better EROEI),
or create Holywood films (then they are on the consuming side).
US tax law may be helpful here: it defines an employee expense as a business expense when it
is *mandated* by the employer. So, if an employer requires a uniform, then it's a business expense.
If the employer requires you to drive to work, perhaps so you can inspect distant locations during
work time, then it's a business expense.
Otherwise…it's your personal choice whether and how to commute, and it's not a business expense.
Like that Porsche mentioned above: that's a purely personal choice.
I think the Hills group deducts thermal losses when the oil is burned and also includes transport,
distribution and refining. So the 30 to 1 eroei would be reduced.
I don't have the data to estimate closely, but maybe 15 to one or less using a more comprehensive
eroei analysis.
In the estimates I presented the output is the ratio of gross produced on gross invested.
Yes, there are thermal losses as the producers and consumers spend their products so this ratio
could change depending on who uses the energy most efficient. If thermal losses are equal, the
EROEI remains.
As you point out there are other looses further downstream in the value chain, like (for the
North Sea) helicopters, supply and stand by ships, work done in workshops on land, facility modifications,
energy used for transport, refining, distribution to name some of the big ones
For transport (oil and gas, North Sea) the losses are about 1%, not sure for refineries (and
distribution), but when I started to add those that was easy to check I found it hard to get the
total losses above 10% (post the production installation), meaning that EROEI based on NPD emissions
data shall come down as we move down the value chain.
The point with the exercise is to demonstrate that wells/fields are shut down while they
still have a "high" EROEI.
We could take this further and also show how price moves the EROEI.
I think one puzzling question is why the Hill group thinks that falling EROEI would reduce
the sales price of oil. If EROEI falls, then producer costs rise. If producer costs rise, that
can only increase the price of oil.
To put it another way: producer costs are the business of producers, and are invisible to consumers.
They won't affect demand.
Now, if consumers aren't willing to pay enough for producers to make a profit, then eventually
oil production will fall. Falling supply is likely to raise the price.
Unless, of course, consumers have better and cheaper alternatives, like hybrids, EVs, car sharing,
etc. Then oil prices would stagnate, production would fall, and eventually the oil industry would
go away. Which would be a good thing assuming, again, that consumers have better alternatives.
Further up I said that a high price allows for a lower EROEI to become financially profitable.
In general costs for new oil (discoveries and developments) are on an upward trajectory. Growing
unit costs acts as a proxy for lower EROEI.
A declining EROEI decreases surplus energy available for society which and all things equal would
increase the price.
"If producer costs rise, that can only increase the price of oil."
Yes, if the pricing power is with the producer. The collapse of the oil price was supplies
running ahead of consumption temporarily shifting pricing power to the consumer. "Now, if consumers aren't willing to pay enough for producers to make a profit, then eventually
oil production will fall. Falling supply is likely to raise the price."
Your numbers are very helpful. I have difficultly finding all the wonderful details at the
NPD website. I assume you know far more about what is available there than I do. I was not sure
if other information such as the average CAPEX per barrel produced is known or other energy inputs
for electricity (although it may all be generated on site). If most of the C+C output is used
for land transportation and the average vehicle gets 33% of the energy as work turning a shaft,
the 30:1 EROEI is reduced to about 10:1. For natural gas some is used for heating (about 95% efficiency)
and some for producing electricity (maybe about 50% efficiency), if we assume for simplicity it
is split 50:50 for heat vs electric power, the EROEI would be about 20:1 for natural gas. Not
sure on NGLs, a lot of those may be used in the chemical industry so EROEI is not relevant for
that portion, the rest would probably be used for heating and might be close to 30:1.
I agree refining, distribution, and transport for North Sea oil probably doesn't change the
picture very much, and you would know much better than me what is happening in Norway.
The other point that the Hills Group seems to miss is that net energy has very little to do
with the price of oil. Even if net energy was zero or negative, if consumers need liquid fuel
to use their cars, there will be a demand for oil and the price will depend on both the cost (in
money) to produce the oil and the price that consumers are willing and able to pay.
What I have presented is gross energy output on gross energy input (no thermodynamic adjustments).
Should adjustments for thermal efficiencies be used to estimate EROEI that requires it is also
applied with the producers. The producers may obtain/suffer from efficiencies of scale as natural
gas/distillates can both be used for electricity generation and process heat from the exhaust
gases.
Further natural gas exported from the installations goes mostly to heating (90+% thermal efficiencies)
and power generation with thermal efficiencies as high as 60+%, depending on process/technology
used.
Not sure how the average vehicle is defined, but if that means a normal household ICE car it
gets a thermodynamic efficiency of about 25-30% when running at its best operational point, so
the average is much dependent on the driving conditions (idling the car get a thermodynamic efficiency
close to zero, but produces heat which may be useful when cold).
How the products are used by the end users (and their sizes) very much dictates how efficient
oil and natural gas is used.
Short story you need to find the average weighted thermodynamic efficiencies for all the products
used by the end users.
NPD lists nominal investments (CAPEX) for each field and by year. NPD also list production
numbers (for crude oil, natural gas, NGL and condensates) both monthly and annual.
What I presented is EROEI on gross returned on grossed invested.
With good data on annual CO2 emissions (in tons) it is possible to estimate gross (and net) input
at the field.
Assuming stochiometric combustion simply divide the CO2 emissions in weight by the specific
weight of CO2 and out comes the volume of natural gas (Sm3) or diesel (litres) used in that year
to power the production installation. It even includes gas flared as this is part of normal operations
to produce oil and gas.
In Norway there is a CO2 tax in place which makes it possible to keep account of CO2 emission
and SOX, NOX, methane etc.
It is in theory possible to financially profitable operate a system with no or negative energy
return due to price arbitrage simplistic illustrated below.
6 Mcf (1 boe) of natural gas is required to produce 1 bo (of some oil) and nat gas price is
very low relative to oil.
So assuming the nat gas (used in the process [supplying both electricity and process heat]) with
about 90% thermal efficiency, that is it gives 0.9 boe net energy.
The extracted barrel of oil (just assuming all of it becomes transport fuel) yields 0.25 boe of
net useful energy (the other 0.75 boe becomes waste heat not used).
Gross input 1 boe (6 Mcf gas), gross output 1 bo.
Net useful input 0.9 boe, net useful output 0.25 boe.
I don't think it makes sense to include the efficiencies of consumer applications. What matters
for EROEI analysis is the ratio of inputs to outputs, and the outputs are at the point of delivery
to the consumer. If the consumer wants to burn it, or bathe in it, it doesn't matter.
Here's another way to think about it: from the point of view of a physicist, the efficiency
of transportation is zero. Transportation moves (aka translates) an object from one point to another,
but all of the energy is turned into heat of friction. No energy remains, so efficiency is zero.
The output is the increased value to the user of having the object in a different place, but that
value is completely subjective. Physically, it's a complete waste.
I will continue with Varg, as this is a very god example supported with good data to illustrate
how wells/fields are shut down while they still have a "high" EROEI.
Using NPD data Varg had an EROEI (flowing) somewhere between 14 and 15 (ex the installation) as
it was shut down.
Having looked at some data for transport, refining and distribution (reaching end consumers)
I found that about 6% (look upon that as an average number as there will be differences due to
geography, modes of transport (trucking assumed with 5 mpg), distance from refinery to distributor
etc) of the energy leaving the platform became unavailable to the consumers due to downstream
"losses".
This results in an EROEI (based on flow) of about 8 (from the Varg reservoir to consumer; 7
boe of 8 boe is surplus energy). Higher oil/gas price could have kept Varg in operation at a lower
EROEI.
Chart below shows development in estimated EROEI ex installations in Norway and for consumers.
Note how slowly EROEI declines (I am not sure of the reason for the step down in 2007).
NOTES
1) NPD reports CO2 equivalents which also includes methane emissions (makes the EROEI slightly
lower) and for 2015, 95% of the emissions was CO2.
2) Some of the installations uses hydroelectricity (makes the EROEI estimates somewhat higher).
These effects will to some degree cancel out each other.
I have been saying and M.King Hubert has said that too that we should trade energy instead of
money. Money and debt is a completely outdated system.
For example, let's say one barrel of oil contain 10 BTU. Let's say that it takes 10 BTU to
produce one pound of potato. So one barrel of oil buy 1 pound of potato. You exchange energy credit
instead of money. Moving into an economical BTU based system of energy will also allow the see
where the energy goes and where to cut useless stuff. Net energy credit get deposit into country
central bank.
Something like that, just some thought I had thinking about how to change the trade system.
Anyway, I think it is too late now, the depletion is to advance to do that. It should have been
done during 1970.
Iraq up 105,000
Libya up 92,000
Nigeria up 95,000
Iran up 21,000
Kuwait up 16,000
Saudia down 87,000
Venezuela down 18,000
Angola down 14,000
Gabon down 10,000
Ecuador's 2008 Constitution explicitly states
that the government will promote the use of
clean and alternative energy sources, in
addition to energy efficiency, while providing
access to public services, preserving the
environment and maintaining food and water
security, among others.
…The regulatory framework for electricity is the
Electric Law of 2015, which explicitly states the
objective of promoting renewable energy
sources, including solid-waste biomass. This
law establishes that the Ministry of Electricity
and Renewable Energy (Ministerio de
Electricidad y Energía Renovable – MEER) is the
governmental entity in charge of the
regulation and planning of the entire power
sector of the country, and hence carries the
responsibility of renewable energy promotion.
The law provides for preferential regulations
for renewable energy, which are still under
development by the newly created electricity
agency (ARCONEL) and expected in the second
half of 2015.
Perhaps Correa has seen the writing on the wall and unlike Chavez and Maduro in Venezuela understands
that hitching the economy exclusively to oil is sure way to political turmoil and strife and not
conducive to his long term maintenance of personal power. I guess time will tell but I have a
hunch that diversifying Ecuador's energy portfolio will only give Ecuador and its people a better
chance at weathering the future storms of economic collapse due to 'Peak Oil'. If it works, the
people of Ecuador may look the other way as Correa continues to consolidate his personal political
power.
Really, all that matters is *economically recoverable* reserves, where *economically recoverable*
is determined by the price of alternatives. Which means all these numbers are way too high.
Reply
"... China and Mexico are in rapid decline at the moment but are supposed to have respectively, contingent 10 and 8 Gb and undiscovered 17 and 56 (!) – that has to be assuming a big shale resource for Mexico I'd guess. ..."
"... China has more rigs relative to its production than anywhere and this year is probably going to drill the most wells of any country. And yet they haven't found a new oil field for many years (quite a bit of gas though) and have only bought on a couple of small offshore fields recently. ..."
"... Norway and UK combined have developed a lot of their older contingent fields over the last few years, at very high cost and in some cases are now losing money on the investment. ..."
"... The biggest two confirmed finds are gas offshore Angola and Senegal (400+ and 800+ mmboe respectively), both probably need to be developed through LNG so might be years away given the current glut and normal schedules for such projects). ..."
"... In the North Sea reserves have been downgraded, not only because of price but also as some of the smaller finds no longer have options for tie backs because the possible hubs are coming to the end of their lives an new finds are in the 20 to 50 mmbbls range and heavy (also a number of dry wells there). I'd say it will likely be significantly worse than last year (which was the worst for 70 years) for both oil and gas discoveries. ..."
"... By coincidence, this morning: "BP dumps plans to drill for oil in the Great Australian Bight" ..."
"... I would imagine the reserve numbers by Rystad Energy are likely to be more FICTION than REALITY. I spent a few hours talking to Bedford Hill of the Hills Group on their "Thermodynamic Oil Collapse" model, and the more I find out about it, the more I am convinced the reserve numbers shown in the table above are completely out of touch with reality. ..."
"... According to the Hills Group Thermodynamic Oil Limit model, they took the total amount of energy in a barrel of oil and subtracted the waste heat. They then programmed into the software all the inputs from the oil industry. Bedford stated that according to the second law of Thermodynamics the amount of energy consumed in the production of oil continues to increase. Their model predicted the oil price collapse and forecasts that within a decade (+/- 4%) there will be no more net energy from a barrel of oil by the oil industry. ..."
"... There is this notion that SUPPLY & DEMAND or CREDIT & DEBT have distorted this thermodynamic oil limit. While these factors have changed the oil production graph, the Hills Group model suggests this has not changed the date. What has changed is that we have pulled future oil production forward which will make the Seneca Cliff much steeper. ..."
"... EROI is falling for new sources of oil but I don't know that it would count as "rapid" yet and it doesn't change much for already developed fields as they age – in fact if energy for the development stage is taken out then the EROI increases during operations. ..."
The numbers are even harder to understand looking at some of the other individual countries.
China and Mexico are in rapid decline at the moment but are supposed to have respectively,
contingent 10 and 8 Gb and undiscovered 17 and 56 (!) – that has to be assuming a big shale
resource for Mexico I'd guess.
China has more rigs relative to its production than anywhere
and this year is probably going to drill the most wells of any country. And yet they haven't
found a new oil field for many years (quite a bit of gas though) and have only bought on a
couple of small offshore fields recently. Mexico has decided they need help from outside IOCs
to find and develop all that resource.
Norway and UK combined have developed a lot of their older contingent fields over the last
few years, at very high cost and in some cases are now losing money on the investment.
Exploration
success is now very low, reserve are being downgraded and yet they are supposed to have 7 +
4 Gb contingent and 13 + 6 Gb undiscovered. The 13 Gb for Norway includes frontier territory
in the Barents Sea, but I think it's turning out that there is more gas there (TBC).
It will be interesting to see the final discovery number for this year from IHS, Richmond Energy
Partners, Rystad and Wood Mackenzie. I doubt if they will include the recent Alaska discovery
given that the test well wasn't flowed – the announcement looks to be more of a ploy to get
some tax break and/or outside money into the private company. The other supposed monster find
by Apache in Permian shale is 3 Gb equivalent oil in place, I'd expect it to be at the lower
end for shale recovery, say 3 to 5%, so that could be only around 75 to 125 mmbbbls oil.
In GoM Fort Sumter was 125 mmbbls (equivalent) but it cn only be developed through Appomatox
so might be many years away before there is processing capacity for it. Anadarko announced
Caisco, but with no numbers which is usually a bad sign. On the other hand Hopkins looks to
have been downgraded maybe 50%, so it is only a tie back option. Kaskida has gone quiet (HTHP
and high sand), Shenandoah/Coronado (very HTHP probably needing 20 ksi wellheads) looks like
it might be relatively smaller as a development than expected (or a series of smaller projects)
, Freeport MacMoran projects (such as Horn Mountain Deep) are all on hold while it tries to
sell up. Next year there is only Thunder Horse extension (27,000 bpd) and the year after Stampede
(75,000) and Big Foot (80,000) ramping up in late 2018 through 2019.
A couple of highly anticipated and expensive frontier wildcats have been dry (Total offshore
Uruguay and Shell offshore Nova Scotia – still drilling a second well there though). The Bight
Basin in Australia is delayed because of environmental concerns.
The biggest two confirmed finds are gas offshore Angola and Senegal (400+ and 800+ mmboe
respectively), both probably need to be developed through LNG so might be years away given
the current glut and normal schedules for such projects).
In the North Sea reserves have been downgraded, not only because of price but also as some
of the smaller finds no longer have options for tie backs because the possible hubs are coming
to the end of their lives an new finds are in the 20 to 50 mmbbls range and heavy (also a number
of dry wells there). I'd say it will likely be significantly worse than last year (which was
the worst for 70 years) for both oil and gas discoveries.
At some point soon there's surely going to be realisation, maybe starting with the investors,
that oil and gas industry BAU as it's been for the past 40 odd years is over and isn't going
to come back the same no matter what the oil price does. I don't know what comes in it's place
though.
Hi Matt, thanks for the interesting posts. I sent a comment to Art Berman to both his websites
(artberman.com and forbes.com) about the post dealing with the unaccounted oil storage and
I report it below (the comment is not yet visible there):
"Hi Art,
I agree with most of your article, but I would like to point out your attention to a possible
explanation which can account for part of the unaccounted oil storage.
In the last 4 years, I have developed a methodology to re-construct the "real" Texas oil
and gas production data using the data published by the Texas RRC: as it is well known, these
data are only preliminary and it may take up to 2 years to have the final estimates. My method
has proved to be reliable over time, providing estimates of Texas oil production very close
to the final data and much earlier than the latter are published. Moreover, these estimates
proved to be closer to the real data than the official EIA data for Texas: for example, on
the 31/08/2016, with more than a 1-year delay, the EIA revised its Texas data for 2014 and
2015 and aligned it to my corrected Texas RRC data.
Having said that, if we compare my corrected Texas RRC data with the EIA data, it is visible
that the EIA has started to increasingly underestimate Texas crudeoil production data since
July 2015, and the cumulative sum of this discrepancy is approximately 46 million barrels.
Of course, this does not explain all unaccounted oil storage, and I agree with you that
the real inventories are probably much lower than what is reported. However, one (minor) reason
is the underestimated EIA production data for Texas. Thanks"
I would imagine the reserve numbers by Rystad Energy are likely to be more FICTION than REALITY.
I spent a few hours talking to Bedford Hill of the Hills Group on their "Thermodynamic Oil
Collapse" model, and the more I find out about it, the more I am convinced the reserve numbers
shown in the table above are completely out of touch with reality.
The reason the Hills Group decided to design the software model to forecast the Thermodynamic
oil Limit was due to one of the members losing money when a shale oil company overstated reserves
by a wide margin. Thus, these engineers were tired of the crapola put out by either the EIA
or the companies themselves.
It took several years and about 10,000 hours to create this ETP Oil price model as well
as the Thermodynamic Oil Limit model. After they hit "ENTER", it took several hours before
the results came out. From what Bedford told me, the results were so shocking, that they decided
to sit on them for a few years before publishing.
From what I understand, a small team of oil engineers helped design the program. I asked
Bedford how many of the engineers DID NOT AGREE with the results. He replied by saying, "Not
one disagreed."
Furthermore, The Hills Group sent their report to dozens of professors in leading colleges
(mostly professors teaching Thermodynamics), and none of them disagreed with the results, even
though some had questions on the data or inputs used.
There is this notion that SUPPLY & DEMAND will continue to be the leading driver in controlling
the price of oil in the future. However, the rapidly falling EROI is destroying the remaining
net energy, thus leaving very little supply. Thus, Thermodynamics has been and will be the
leading economic driver of human economies, not supply and demand.
According to the Hills Group Thermodynamic Oil Limit model, they took the total amount of
energy in a barrel of oil and subtracted the waste heat. They then programmed into the software
all the inputs from the oil industry. Bedford stated that according to the second law of Thermodynamics the amount of energy consumed
in the production of oil continues to increase. Their model predicted the oil price collapse and forecasts that within a decade (+/- 4%)
there will be no more net energy from a barrel of oil by the oil industry.
There is this notion that SUPPLY & DEMAND or CREDIT & DEBT have distorted this thermodynamic
oil limit. While these factors have changed the oil production graph, the Hills Group model
suggests this has not changed the date. What has changed is that we have pulled future oil
production forward which will make the Seneca Cliff much steeper.
With Chevron, ConocoPhillips and ExxonMobil losing $18 billion in the first six months of
2016 after CAPEX and Dividends were paid reveals just how bad the situation has become in the
Major Oil Companies.
Furthermore, the U.S. Energy Sector interest on the debt consumed 86% of their operating
income in the first quarter of 2016. The situation is much worse than the market has realized.
Anyhow, I will be interviewing Bedford Hill and Louis Arnoux in a few weeks on their ETP
Oil Price Model and Thermodynamic Oil Collapse.
"According to the Hills Group Thermodynamic Oil Limit model, they took the total amount
of energy in a barrel of oil and subtracted the waste heat. They then programmed into the software
all the inputs from the oil industry."
And the explanation in English is? Burning oil will ultimately lead to some thermodynamic
losses.
Hint oil is about 30-33% the worlds total energy consumption.
"Their model predicted the oil price collapse and forecasts that within a decade (+/-
4%) there will be no more net energy from a barrel of oil by the oil industry."
Was the oil price collapse due to thermodynamic reasons?
If that is so [no net energy from a barrel of oil within a decade (2026)], then there should
already be several real world examples to support this with.
What portion of present global oil production (C+C) is consumed by the oil industry? Surely
the Hills Group must have the estimates for that as they have projected the development for
the next decade.
"With Chevron, ConocoPhillips and ExxonMobil losing $18 billion in the first six months
of 2016 after CAPEX and Dividends were paid reveals just how bad the situation has become in
the Major Oil Companies. "
Are you confusing losses/profits with cash flows? Using figures for only Q1 16 does not justify a trend and certainly not justify a conclusion
or projection.
Yes, I was referring to the companies Free Cash Flow minus Dividends. While one quarter
does not justify a trend, the Hills Group forecasts the price of oil to fall to $12 by 2020.
This is due to what a net barrel would be worth to the Global Industrialized World.
Rune, they have calculated the waste energy of a barrel of oil to be one-third. So, what
remains is net energy. However, the energy cost to produce this energy has continued to increase
since the world started producing oil.
The waste energy of a barrel of oil is missed by most economists or analysts when forecasting
price.
Rune, you are more than welcome to check out the Hills Group work at the site here:
http://thehillsgroup.org/
I am getting 40.7% for oil (in 2012?) and electricity is a secondary energy source, so I am
wondering if the 40.7% includes some oil for that.
Even so, how does that reflect the utility of oil, compared with the rest on that list? How
well can the projection of political/military power and control be run on them?
In any case, money/price, as a symbol, is a detachment from reality, along with too many
human detachments from reality to list, so whatever the price of oil is, once thermodynamic
reality and reality in general really start to kick in, the price of it, among a litany of
other human detachments, won't matter anymore. I guess that's when things will be considered
increasingly in the process of collapse or decline.
Steve, I am unsure about gold or silver by the way, since they are still mere symbols for
reality (that rely on some sort of 'trust' of some system that may be dubious). Maybe they
are more 'pegged' to it, but still symbols nonetheless, and so woefully-limited in their peg,
their 'visceral tangibility'.
Also, as gold and silver are hoardable, would those who have and hoard more of it, such
as governpimps and the elite, etc., be able to control it more, such as at the expense of those
who have less of it?
Electricity is NOT an energy source – it is an energy carrier like hydrogen.
BP SR 2016 has oil at about 33% of global energy consumption in 2015 which does not include
biofuels and biomass.
Electricity is considered a SECONDARY ENERGY SOURCE derived from whatever (nuclear power, wind,
etc.). Of course, strictly speaking, electricity is just an accumulation OR motion of electrons.
Therefore, a battery or a capacitor (accumulation of electrons) is a potential energy carrier.
I should have specified primary energy sources.
Lumping together primary and secondary sources confuses the issue.
Where in nature is there free electricity (apart from lightening)?
Follow the flow and all energy is solar.
:-)
To some degree costs acts as a proxy for EROI. The general trend is for costlier oil.
Low priced oil => Higher (composite) EROI (Unprofitable oil is shut down)
High priced oil => Lower (composite) EROI
This article by Ron is about stocks and flows.
Thermodynamics is about flows.
– If net energy from oil move towards zero during the next decade, this implies that
the oil companies would morph into giant heat engines and become bankrupt long before this
(net energy becomes zero) happens. Are there now any signs of this happening?
– If EROI declines at the rate referred and estimated by the Hills Group, net oil
(energy) would enter a steep decline and prices would move significantly and steadily up to
reflect this.
It could be useful to present estimates at what EROI (based on flow) a well or field becomes
shut in and later P&A ed.
'Cost', to me at least, is real and is different from 'price', which is symbolic, and 'Energy
Returned on Energy Invested' is different than 'Energy Return On Investment', but I suppose
it is treated the same to some.
Right now, from what has been read and understood at least, the 'money/finance/banking/BAU-cum-government-as-usual'
clusterfuck of 'establishments' are looking very strange/bizarre/weird/crazy/etc. to the clusterfuck
of many 'analysts/experts/pundits/etc.'. This seems indicative of an overlying symbolic/sociopolitical/socioeconomic
(denialistic/extend-and-pretend) 'formative' response to an underlying thermodynamic issue/problem
and maybe other problems as well, some as feedbacks/perturbations in/from the system.
Along with the ostensibly-increasing and increasingly perverted financial smoke-and-mirrors,
I wonder, in part, what the statistics are on company bankruptcies, takeovers and cannibalizations
these days, as well as investments in so-called alternative energies.
Where's this stuff going?
Steve apparently says 'gold and silver', yes?, but I don't buy it (pun intended too) from
a fundamental-problem-solving standpoint and neither should he.
Gold and silver seem just part of the same or similar scams, but just operate a little differently.
Steve, if you're reading this, I noticed, under one of your articles on Zero Hedge, you
arguing with some of the 'commentgentsia'…
Well, of coure, they know 'nothing', I know 'nothing', you know 'nothing' and Rune knows
'nothing'. Of course we know things, but we are all 'insignificant' cogs in this machined clusterfuck
with limited autonomy and spending too much of our industrially-derived/putrified food energy
and internet energy arguing about known unknowns and unknown knowns and what we and 'the others'
know, don't know, think they know and want everyone to know, even if it's not true– whatever
that means.
Alas, 'Leviathan', as Oldfarmermac has put it, will do what it has to to survive, come hell
or high water or the puny little humans that it squishes along the way– maybe in its death
throes. Why, there appear to be purveyors of Leviathan, or aspects thereof, right here on this
very blog.
I just wish that I was not on the same ship, as I really dislike being dragged along for the
ride.
This comment was brought to you this week by the word, clusterfuck .
"Where's this stuff going?"
That is something I observe a growing number of people wants to inform them about.
As we come to learn something we discover it is just a small piece of the BIG puzzle. We all
have blind spots and are delusional.
Sometime ago I watched some (BBC) documentaries about Keynes, Hayek and Marx and a very
interesting interview with Bank of England's former director Sir Mervyn King (this appears
to be a man of integrity and good moral compass).
There is one common message from all these;
"It is not possible to accurately predict human behavior."
Therein lies a very important bit of information.
I hear you, Rune.
(That BBC piece might be on You Tube.)
Alas, it is of course impossible to predict anything with 100% certainty. If we could, then
there would no consciousness, maybe no universe. And what fun would that be? 'u^
" … within a decade (+/- 4%) there will be no more net energy from a barrel of oil by the oil
industry."
EROI is falling for new sources of oil but I don't know that it would count as "rapid" yet
and it doesn't change much for already developed fields as they age – in fact if energy for
the development stage is taken out then the EROI increases during operations.
If no more wells were drilled starting today then world oil production would fall at around
5%. So in a decade there would be 60% of current supply. The EROI on that wouldn't have changed
much from today – there'd be proportionally a bit more water and gas to handle, but equally
it could all go to the most efficient refineries. Therefore for the overall net energy to be
zero would imply all new stuff bought on line is hugely negative. No such project would be
even considered at conceptual stage and it would stand out a mile. The closest anything gets
to that is Tar Sands where there is arbitrage from energy in natural gas converted to energy
in synthetic oil, but while energy in gas is cheap this still makes sense (or made sense rather
– as soon as the economics became bad, partly as a result of the net energy issues, the projects
were stopped). So if new projects are so bad don't do them – the world might be in a mess at
that point but the remaining oil would be a much sort after entity.
Also the shale reserve that initiated the study wasn't overstated because it's net energy
was incorrectly estimated, it was because someone in the E&P company lied, or rather let's
say 'dissimulated'.
The reason much of the damage of the rapidly falling EROI is not made its way into global
oil industry and the world financial-economic system is due to the massive amount of debt.
The Hills Group model calculates that the second law of Thermodynamics says that the amount
of energy to produce oil has continued to increase since we started producing the liquid over
150 years ago.
They have developed this model showing the average increase in energy cost in terms of a
barrel of oil. They remove the waste heat which is approximately one-third of the barrel. They
model shows that within a decade, the Thermodynamic limit for oil will be reached, thus no
net energy will be available.
Again, the massive amount of debt has distorted the global oil production curve, not the
ultimate date of the thermodynamic collapse. So, we experience a much higher on violent SENECA
CLIFF due to the massive amount of debt that has brought forward production.
"... Anybody notice the "stimulus" of low gasoline prices didn't improve GDP? ..."
"... Offset by the lack of oil field activity. The USA was becoming very tied into the oil field sector. ..."
"... Somewhat, but these things are global. A chart of global GDP has a similar look. No uptick, and QE globally has been about constant - with Japan and the EU taking over from the Fed. ..."
"... Expecting oil prices to affect overall GDP is a very US-centric point of view. And, in this case, Fernando is correct: the decline in oil spending was offset by the decline in oil-patch investment and employment. Of course, that's a short term effect. At some point after the oil patch stabilized at a lower level, continued low oil prices (admittedly, an unlikely thing) would help the US. ..."
Somewhat, but these things are global. A chart of global GDP has a similar look. No uptick, and
QE globally has been about constant - with Japan and the EU taking over from the Fed.
Which only makes sense for the whole world. Higher or lower prices: they just transfer income
from one country to another. If oil prices rise, oil exporters have more money, and importers
have less. If oil prices fall, then importers have more money, and exporters have less. It's a
zero sum game.
Expecting oil prices to affect overall GDP is a very US-centric point of view. And, in this
case, Fernando is correct: the decline in oil spending was offset by the decline in oil-patch
investment and employment. Of course, that's a short term effect. At some point after the oil
patch stabilized at a lower level, continued low oil prices (admittedly, an unlikely thing) would
help the US.
Oil and Gas costs are a smaller percentage of our budget and have been shrinking over the decades.
I am not surprised that shrinking prices have less impact.
Some are waking up to the Magnitude of the Challenge:
"At the same time, the engineer in me cannot be blinded by the physics of logistics underlying
the quintessential challenge posed by oil: how to replace the 560 exajoules of energy that is
required every year to keep the world turning.
That's 5.6 followed by 20 zeroes, whose magnitude was explored in my previous post hocus pocus.
80% of the world's energy requirements are supplied by hydrocarbon combustion."
You know that money that your bank lent you to
buy your new house? Well, I want to let you in on a little
secret: That wasn't the bank's money they lent you. And it
wasn't some billionaire's money either. It was some of your
own money, along with a little bit of mine and Tom's and
Susie's and everybody else in this country. Can you imagine
that?
It's a fact. It's why Henry Ford supposedly said that "if
people understood our banking and monetary system, I believe
there would be a revolution before tomorrow morning".(1)
When the bank lent you that money it took your promise to
pay them back (a promissory note and title to the house as
collateral) and in exchange it punched some numbers into a
computer, creating your deposit account and thereby creating
the money it lent to you.(2)
But how can that be, you say. How can the bank just invent
money like that? Well they do "just invent money" and they
can do it because our government agrees with them that they
can do it.
But don't they have to pay for that money, you say. No,
they don't. But they do have to be a depository institution (
a place you can keep your money on deposit) and there is some
expense for them to that.
But they are charging me interest on that money, you say.
Yes indeed, they are charging you interest on your own money,
and mine, and Tom's, and Susie's, etc.
But that bank is a private business, and banks make a lot
of profit, why should we pay them to loan us our own money,
you say. Good question.
"But don't they have to pay for that money, you say. No, they
don't. But they do have to be a depository institution ( a
place you can keep your money on deposit) and there is some
expense for them to that."
Again? Take a look at the income
statement of any bank. There is interest expense for them on
those deposits. OK, it is low but then there are those
subsidized services which is why noninterest expenses exceed
noninterest income. Again - no exactly a total expense of 5%
but mortgage rates today are not exactly 6% either.
We all do. But I see you waste no time doing actual financial
economics. If you did, you might realize how to capture
monopoly profits. Look at the average return to equity
compared to what you'd predict from a CAPM model. When I do
this for health insurance companies, their average return is
3 times what they would be from a competitive market. When I
do this for major banks, the average return to equity = the
CAPM prediction. Estimated monopoly profits = 0.
Of course
you have no idea what any of this means as all you know is
word salad.
Banks sell public
money as their product and they extract interest for doing
so. They thus act as a transfer agent of wealth from the real
economy to rentiers.
The return to equity for
banks is about what one would expect from a risk-adjusted
return perspective. Oh yes - the Capital Asset Pricing Model
properly applied would show what utter nonsense this is.
Banks will always exist. Of course proper regulation of
financial institutions can address this problem. But your
word salad has nothing to do with the real issues.
He does but what is the percentage of JPM's total assets? Do
you even know? You might need a microscope to see it. And no
- I am not defending banks. But your word salad is not
getting at the real issues. And yet you persist.
In finance, the capital asset pricing model (CAPM) is a model
used to determine a theoretically appropriate required rate
of return of an asset, to make decisions about adding assets
to a well-diversified portfolio.
Let's do this for a bank. Expected return to assets =
risk-free rate (1%) plus a 1% premium for bearing operational
risk. But then the equity to asset ratio for banks is only
10% so the expected return to equity includes a 10% premium
for bearing both operational risk and leverage risk. As such,
the expected return to equity = 11% for these highly levered
firms. And on average that is their actual return to equity.
For a great application of these thoughts - see that paper by
Sarin and Summers. You may not remember when I put it up
weeks ago but my internet stalker put up a link to it just
yesterday. Of course this was PeterK's childish way of
attacking someone who actually contributes to this blog. I
said he should read it. So should RGC. They might learn
something.
LOL! pgl assumes that banks' investors have a god-given right
to a risk premium of 10%.
Of course, risk premiums are more
in the range 4-5%, far below pgl's banker-coddling
assumption.
"Some economists argue that, although certain markets in
certain time periods may display a considerable equity risk
premium, it is not in fact a generalizable concept. They
argue that too much focus on specific cases – e.g. the U.S.
stock market in the last century – has made a statistical
peculiarity seem like an economic law."
http://www.investopedia.com/terms/e/equityriskpremium.asp#ixzz4OOLOzdqg
As for the economic concept of the time value of money,
whereby savers get rewarded for setting money aside...the
longer the time, the greater the reward, well, central banks
have pretty well destroyed that with negative interest rates.
Time value of money: RIP. Nonetheless investors are still
supposed to reap their extravagant risk premiums!!!
He can't figure out this aggregator thing. He cannot figure
out the investor thing. He certainly has no knowledge of the
secondary market.
He takes tiny little pieces of things,
ignores the rest and then comes to a conclusion. Of course
the conclusion is that MMT makes sense. Everyone knows it
doesn't make sense and cannot work world.
He ignores basic finance. But then so does PeterK as actual
thinking just gets him all angry. Which means you and I are
tagged "liar". This is the intellectual garbage that is
ruining this place.
RGC -> EMichael...
, -1
"Money creation in practice differs from some popular
misconceptions - banks do not act simply as intermediaries,
lending out deposits that savers place with them, and nor do
they 'multiply up' central bank money to create new loans and
deposits."
IMFDirect - "futures markets point to slight gains in oil
prices. But a glance at shifts in futures-price curves in the
past few months suggests that the prospects for higher prices
have been worsening (see Chart 3)."
Ten years ago, oil
prices were $60 a barrel. These charts are pointing at $60 a
barrel. Which would translate into $2.50 per gallon for
gasoline. Of course that assumes the current level of
gasoline taxes.
A carbon tax is sounding more and more like a good idea.
Greg Mankiw insist this should be "revenue neutral". Some of
his would spend some of the extra revenue on public
investments in green technology and infrastructure
investment.
Reply
Friday, October 28, 2016 at 01:44 AM
likbez -> pgl...
, -1
IMF is always predicting lower oil prices :-). That the
nature of the beast.
I am not a specialist, but I do see the picture
differently.
Outside the Middle East, there is not much oil left in the
world that can be extracted profitably for $60 a barrel. IMHO
spikes to $100 are now quite possible. Sustained oil price
over $100 per barrel means recession and reversal of
neoliberal globalization with its crazy and often useless
transport flows from one continent to another (salmon caught
in Europe processed in China, apples flown to NJ, etc).
The current period of low prices masks rapid depletion of
major oil reserves in non OPEC countries and decimation of
shale oil industry in the USA.
Capital investment is now slashed to the bone. And that
might have an outsize effect on oil production in non-OPEC
countries in 2018 - 2020 (such predictions always skip the
next year in a hope that people will forget about them, if
they do not materialize :-)
That means that while the crisis of supply is not
immediate it is looming on the horizon. And might well be
within less then a decade to reach.
Obama administration policy in this area was classic
"after me, the deluge". Low oil prices partially reversed the
replacement process for private transportation and made SUVs
the most popular class of personal cars in the USA. In other
words they reversed the trend to more economical cars in the
USA. So the USA might enter the crisis in worse shape then it
would be, if the energy saving policies were the focus of the
current administration. Obama focused on wars of neoliberal
expansion.
The USA pretty shrewdly used Saudis and Iran as two Trojan
horses able to keep prices low since late 2014. Saudi Arabia
is now issuing bonds left and right as they can't balance the
budget at prices below $100 or so. Iran in general behaves
pretty crazy in this respect as if it has unlimited reserves
and does not need to save them for future generations. They
are fighting for return of their pre-sanctions market share
in $40-$50 environment, as if this is the life and death
question for them. But if they managed to survive sanctions
for so long, why the rush ?
In any case my point is simple: if something can't run
forever it will eventually stop. That include both Saudis and
Iran. They have large reserves, but they are not unlimited
and the most profitable fields with high quality oil already
substantially depleted. Low quality high sulfur oil still is
more plentiful.
The problem is that high oil prices mean trouble for
Western economies. That's why Western MSM reacted so paranoid
on OPEC+Russia decision to freeze production starting Nov. 1.
Also it is not clear how the US oil stocks were/are kept
on such a high level (depressing oil prices): manipulation of
stats by EIA, hidden sale from the strategic reserve,
unaccounted by state oil production (black market oil ;-)
Art Bergman has an interesting article on the subject
"... The Russian-Turkish plan to pipe Russian gas through Turkey and then on to Macedonia and thence into southern Europe has long been opposed by the West, which is seeking to block the Russians at every turn. Now the Western powers have found an effective way to stop it: by overthrowing the pro-Russian government of Macedonian Prime Minister Nikola Gruevski . ..."
"... Speaking of which: the government of President Petro Poroshenko is leading the country into complete financial insolvency and veritable martial law. ..."
"... which makes it a crime to criticize the Organization of Ukrainian Nationalists and the Ukrainian Insurgent Army (UPA) that fought on the side of the Germans during World War II. ..."
The
Russian-Turkish plan to pipe Russian gas
through Turkey and then on to Macedonia and thence into southern Europe has long been opposed
by the West, which is
seeking
to block the Russians at every turn. Now the Western powers have found an effective way to stop
it: by overthrowing the pro-Russian government of Macedonian Prime Minister
Nikola Gruevski.
The original plan was for the pipeline to go through Bulgaria, but
Western pressure on the government there nixed that and so the
alternative was to pipe the gas through Macedonia and Greece. With the Greeks uninterested in
taking dictation from the EU – and relatively impervious, at the moment, to Western-sponsored regime
change – the Macedonians were deemed to be the weak link in the pro-Russian chain. That was the cue
for the perpetually aggrieved Albanians to play their historic role as the West's willing proxies.
After a long period of dormancy, suddenly the "National
Liberation Army" (NLA) of separatist Albanians rose up, commandeering police stations in Kumanovo
and a nearby village earlier this month. A 16-hour gun battle ensued, with 8 Macedonian police and
14 terrorists killed in the fighting. The NLA, which
reportedly received
vital assistance from Western powers during the 2001 insurgency, claimed responsibility for the
attacks.
Simultaneously, the opposition Social Democratic Union party (SDSM)
– formerly the ruling League of Communists under the Stalinist Tito regime – called for mass demonstrations
over a series of recent government scandals. SDSM has
lost the last three elections, deemed "fair" by the OCSE, with Gruevski's conservative VMRO-DPMNE
(Internal Macedonian Revolutionary Organization – Democratic Party for Macedonian National Unity)
enjoying a comfortable majority in parliament. But that doesn't matter to the "pro-democracy" regime-changers:
SDSM leader Zoran Zaev
declared "This will not be a protest where we gather, express discontent and go home. We will
stay until Gruevski quits."
Macedonia has a long history of manipulation at the hands of the NATO powers, who nurtured the
Muslim-Kosovar insurgency to impose their will on the components of the former Yugoslavia. As in
Kosovo, the Albanians of Macedonia were willing pawns of the West, carrying out terrorist attacks
on civilians in pursuit of their goal of a "Greater Albania."
During the 2001 Albanian insurgency, an outgrowth of the Kosovo war, the EU/US used the NLA as
a battering ram against the Slavic authorities. The NLA was never an authentic indigenous force,
but actually
an arm of the US-armed-and-trained "Kosovo Liberation Army," which now rules over the gangster
state of Kosovo, crime capital of Europe. A "peace accord," the Ohrid Agreement, was brokered by
the West, which kept the NLA essentially intact, albeit formally "dissolved," while the Macedonian
government was blackmailed into submission. I wrote about it at the time,
here
and here.
Follow that last link to read about the George Soros connection. Soros was originally a big booster
of Macedonia, handing them a
$25 million aid package and holding the country up as a model of multiculturalism. However, the
Macedonians soon turned against him when he sided with the Albanians in their demands for government-subsidized
Albanian-language universities and ethnic quotas for government jobs. When he told them to change
the name of the country to "Slavomakejonija," they told him to take a walk. Soros, a longtime promoter
of Albanian separatism – he played sugar daddy to a multitude of front groups that promoted the Kosovo
war – is now getting his revenge.
Prime Minister Gruevski, for his part, charges that the sudden uptick in ethnic violence and political
turmoil is the work of Western "NGOs" and intelligence agencies (or do I repeat myself?) with the
latter playing a key role in releasing
recordings of phone conversations incriminating several top government officials. A not-so-implausible
scenario, given what happened
in neighboring Ukraine.
Speaking of which: the government of President Petro Poroshenko is leading the country into
complete financial insolvency and veritable martial law. Aid money from the West is going into
the prosecution of the ongoing civil war, and the country has already
defaulted on its huge debt in all but the formal sense. Opposition politicians and journalists
are routinely murdered and their deaths reported as "suicides," while it is now illegal to describe
the ongoing conflict with the eastern provinces as anything but a "Russian invasion." Journalists
who contradict the official view are imprisoned: Ruslan Kotsaba, whose arrest I reported on in this
space, is still being held, his
"trial" a farce that no Western journalist has seen fit to report on. Kotsaba's "crime"? Making
a video in which he denounced the war and called on his fellow Ukrainians to resist being conscripted
into the military. Antiwar activists throughout the country have been rounded up and imprisoned.
Any journalist connected to a Russian media outlet has been arrested.
Yes, these are the "European values" Ukraine is now putting into practice. Adding ignominy to
outrage, a law was recently passed – in spite of
this Reuters piece urging Poroshenko to veto it – which makes it a crime to criticize the
Organization of Ukrainian Nationalists and the Ukrainian Insurgent Army (UPA) that fought on the
side of the Germans during World War II. As Ha'aretzreports, a group of 40 historians
from major Western academic institutions issued an open letter protesting this outrage:
"Not only would it be a crime to question the legitimacy of an organization (UPA) that slaughtered
tens of thousands of Poles in one of the most heinous acts of ethnic cleansing in the history
of Ukraine, but also it would exempt from criticism the OUN, one of the most extreme political
groups in Western Ukraine between the wars, and one which collaborated with Nazi Germany at the
outset of the Soviet invasion in 1941. It also took part in anti-Jewish pogroms in Ukraine and,
in the case of the Melnyk faction, remained allied with the occupation regime throughout the war."
Ukraine is showing its true colors, which I identified
last year, to the point where even the usually compliant Western media is forced to admit the
truth.
"... I'm increasingly interested in the metaphors around banking, which seem to still come out of early 19th c invention of engines, all of which used ' fuel ' as a central tenet: 'the money supply fuels the economy'. Economics seems drenched in outdated, antiquated metaphors where ' fuel ' is always and everywhere a good thing, with no polluting externalities, and no downside costs. ..."
"... Fuels don't lie, cheat, or steal - continuing to use fuel as a central metaphor enables banks, economists, and central bankers to put their fingers in their ears and howl "La! La! La! Using metaphors shaped by sail-powered whaling ships hunting for blubber is working just great for us!!" After all, calculus had been invented by the 1820s - so math + moneyAsEngineSpeak = economics. ..."
"... If money were more widely regarded as a social tool: recognized as a tool that requires communication, social networks, and flourishes within civil society, then Haldane's observations would be met with "Doh, you betcha!" ..."
"... Then, also, Bill Black's observations that crime actually does exist, and often looks exceptionally respectable, would be impossible to ignore. ..."
"... I interpreted Brexit as a 'tea leaf' that the banks could no longer be made fine-proof without triggering social unrest. ..."
"... The way that I read this, contemporary economics and finance leads to utter, unmanageable disaster from which there is absolutely no way out. The engine 'melts down', so to speak. I feel as if I have spent the past 8 years watching systems nearly implode, be saved by extraordinary (lunatic) measures, and in the end the systems of thinking that created these problems are precisely the mental pathways that keep people stuck in a labyrinth of dysfunction. ..."
"... It's hard to work out how "1. Implode, not too violently" could give rise to anything other than lethal shortages, especially in urban environments, and how this could lead to anything but "2. blow up, social unrest" anyway. ..."
"... Money is social relations, power relations, if Gold is law then the powerful will grab the gold. If not, they'll grab the money creating buttons in various spreadsheets, unless opposed by all. ..."
"... Maybe there is a way to make the vulnerability that the central banks and banksters and CorpoStates like GE and Cigna and Goldman Sux nd the rest impose on the vast rest of us into a mutual exposure? ..."
"... There is nothing wrong with interest, as long as the rate is reasonable. It is a service charge for someone handing you money now to buy what you want now instead of waiting to save up the money. Interest does not make an economic system unstable. It's the same as a massage or other service you buy. You just need enough income to cover it, and the principal payment of course. ..."
"... "As noted in the article [money is] a concept created by human beings and should be considered a very malleable tool that we can use to do pretty much whatever we as a society decide we want to with it. If we truly wanted to create a more equitable society there is nothing stopping us from doing so except the greed of the few." ..."
"... The Big Lie that the federal government needs tax revenue in order to operate, so we "can't afford" the social benefits that help the non-rich, must be constantly debunked and rejected. ..."
"... The terminology of finance is designed to hide predatory and extractive activities behind a curtain of beneficial-sounding words. These terms are deeply embedded, and serve both to put some friendly makeup on the business, and allow the "consumers" to feel better about their capitulation. The process is akin to the way politicians wrap themselves in the flag while they sell out the citizenry. We know deep down that they are lying, but we prefer the false patriotism because it serves the lies we prefer to tell ourselves. We bitch and moan, but we play our part, because not doing so leads to trouble. It is the way most of us live our lives. ..."
"... Most people go along the big lie because of hope. ..."
"... Money is nutrition, not a snack. It's food and fertilizer. It makes things grow. You have to share it with other life like bacteria and worms: without these organisms in your gut ecology, you get sick (autism, diabetes, obesity, M.S.). Idiots try to convince us these organisms are parasites instead of symbionts just like Monsanto thinks bees are disposable or Donald Trump likes to think of pregnant women as drags on business profits. ..."
"... If you think altruism is for suckers, your Ayn Rand economy collapses because you confuse parasites with symbionts and symbionts with parasites. You can't distinguish between compensation for earned and unearned income. What's a tax and what's theft? Try living without bacteria making butyrate in your gut. Wells Fargo can no more survive without little people like airport janitors to scrub out the TB and Ebola stains than our cells can breathe without mitochondria. Yet who gets their pay driven down in corporate America? ..."
Clive, FWIW, I'm increasingly interested in the metaphors around banking, which seem to still
come out of early 19th c invention of engines, all of which used ' fuel ' as a central tenet:
'the money supply fuels the economy'. Economics seems drenched in outdated, antiquated metaphors
where ' fuel ' is always and everywhere a good thing, with no polluting externalities, and
no downside costs.
Hence, what matters is 'efficiency': it's moneyAsEngineSpeak, so to speak.
Lordy, it's all petrochemical: from a time when chemical and mechanical engineering (and physics)
were in their relative infancies and whaling schooners were sailing out of Nantucket.
Fuels don't lie, cheat, or steal - continuing to use fuel as a central metaphor
enables banks, economists, and central bankers to put their fingers in their ears and howl "La! La!
La! Using metaphors shaped by sail-powered whaling ships hunting for blubber is working just great
for us!!" After all, calculus had been invented by the 1820s - so math + moneyAsEngineSpeak
= economics.
Egads.
In that paradigm, Bill Black is a mere scold, an oddball, a scruffy prophet in the wastelands,
so to speak.
If money were more widely regarded as a social tool: recognized as a tool that requires communication,
social networks, and flourishes within civil society, then Haldane's observations would be met with
"Doh, you betcha!"
Then, also, Bill Black's observations that crime actually does exist, and often looks exceptionally
respectable, would be impossible to ignore.
Timmy Geithner is probably not a fan of: (a) Bill Black or (b) the idea of money as inherently
social. Fuel is an emotionally sterile construct to work within; it enables one to avoid moral
qualms, or any sense of personal responsibility when ' engines blow up', or when they 'run
out of fuel '.
The fact that Haldane's observations and analysis are not more widely embraced suggests that somehow
the business schools, economics departments, and bankers all still use thought processes shaped in
the era of whalers seeking blubber for lanterns and lamps. Also, they probably still receive endowments
from the Kochs, Exxon, and other fuel obsessed interests.
Egads.
Until the metaphors move to biology, with a concomitant recognition that some kinds of ' fuel
' (aka Coke, Fritos, Doritos, donuts) work for short-term energy bursts, but carry extremely
negative longer term costs, I doubt that even the best attempts to muddle through will get us out
of this mess. Without amendment, this system is going to do one of two things: (1) implode (not too
violently) or else (2) blow up (social unrest).
I have no idea what the banker equivalent of 'chard, lettuce, and celery' would be, but some bright
mind ought to be thinking about it. (You distinguish yourself as such a mind; I hope that my metaphor
is not too offensive…)
I interpreted Brexit as a 'tea leaf' that the banks could no longer be made fine-proof without
triggering social unrest. Then I read your comment, esp:
the U.K. government is stuck with its vast holding in RBS. The only way it could ever be rid
of the RBS albatross is for RBS to have some vague hope of (eventually) earning its way back to
being something other than a complete basket case.
Apart from, ironically, the central banks' own ZIRP policy, the biggest threat to this is endless
redress for wrongdoing.
The way that I read this, contemporary economics and finance leads to utter, unmanageable
disaster from which there is absolutely no way out. The engine 'melts down', so to speak. I feel
as if I have spent the past 8 years watching systems nearly implode, be saved by extraordinary (lunatic)
measures, and in the end the systems of thinking that created these problems are precisely the mental
pathways that keep people stuck in a labyrinth of dysfunction.
Banking needs to be completely rethought, using the social sciences, which include the realities
of criminal conduct corroding the system to such a degree that it is threatening to implode. I'm
moving toward being agnostic as to whether this is a good thing, or not. Either way, the present
systems as I've read you describe them do not seem even remotely sustainable.
The metaphor I think applies is that we use money as both medium of exchange and store of value.
While the first is inherently dynamic, the second is static, so a good analogy is that in the
body, the medium is blood, while the store is fat. The trick has been how to store extreme amounts
of notional wealth and that is largely by having the government borrow it back out and spend in
ways which support the private sector, but don't compete with it in the hunt for profits. So are
all those pallets of money going to fund our wars really about war, or is it about keeping that
money flowing in one end and out the other? Consider all those super secure US savings bonds are
mostly just being poured down various rat holes, rather then building a sustainable society.
This probably goes back to Roosevelt, who borrowed a lot of unemployed capital to put a lot
of unemployed workers back to work.
Money is not a commodity to be mined or manufactured, whether gold or bitcoin, but a contract.
Every asset is the other side of an obligation. It allows a large economy to function, but it
also reduces community reciprocity, creating atomized societies.
Like blood, the economy needs very regulated amounts of money, as it functions as a voucher
system and storing lots of excess vouchers eventually causes the system to collapse, when everyone
tries to dump them at once. If government threatened to tax excess out, people would have to find
other ways to store value, like in stronger communities and healthier environments, aka the commons.
Most people save for the same general reasons, housing, healthcare, retirement, etc, which are
ultimately community functions anyway.
Finance as a public utility doesn't have to be subservient to government. Much as government
is analogous to the central nervous system, finance is to the circulatory system and the head
and heart are separate organs.
Government started out as a private business, institutionalized as monarchy, before becoming
a public utility. Now is the time to do the same with finance.
I'm leaning strongly to the idea that money is information . More specifically, it's
information about general claims on national commerce. That gold coin in your hand is a bidding
right . The obligation isn't to any one person, but your possession of it means that there's
one less gold coin's bidding power throughout the rest of the economy.
I'm still sorting out my thoughts on this, but Frederick Soddy, the Technocrats (a short-lived
1920s – 1930s US movement), and the ecological economists (Georgescu-Roegen, Daly, Boulding, etc.)
seem to make more sense to me.
The more I read of traditional / classical / neoclassical / post-Keynesian monetary theory
the more I suspect nobody has much of a clue.
Excellent and original points that make a tremendous amount of sense. Thank you.
One tiny quibble. It's hard to work out how "1. Implode, not too violently" could give
rise to anything other than lethal shortages, especially in urban environments, and how this could
lead to anything but "2. blow up, social unrest" anyway.
US Grant rode in a horse-drawn carriage from his inauguration to a White House lit with coal-gas,
while oil or candles. Medicine, sanitation, and agriculture was hardly different than it was in
Roman times. The railroad and the telegraph represented technological progress.
A little more than 30 years later McKinley rode in an automobile to a White House lit with
electric lamps, that had running water and sewage. Steel framed buildings could rise more the
3-4 stories off the ground. The causes of many diseases were known and somewhat preventable. The
first radio transmission was months away, and the first powered flight was 3 years away. The standard
of living of an average American doubled during that period. And it was all done under the gold
standard.
DGP per capita of the US peaked in 1973, the same time Bretton Woods formally ended. A dollar
today buys what 3 cents could buy when the Fed was formed. Do these FACTS escape the Krugmans
of the world or are they merely inconvenient and in conflict with what seems to be the true nature
of academic economics, to provide pseudo-science cover to political policy?
By all means let's go back to worshipping a dumb, shiny metal rather than, for instance, removing
all priviledges for the banks. And let's replace theft by inflation and deflation with theft by
deflation alone.
And let's confuse correlation with cause since the massive gold and silver strikes during that
period greatly increased the money supply and indeed, in some places, caused huge price inflation.
And let's forget that it is the government's authority to tax that gives value to fiat and give
gold owners a huge bonanza by making fiat needlessly expensive.
Setting aside your implied straw man, that it's a binary choice between unconstrained credit
creation, and "worshipping" gold, would you argue that today's society is better or worse than
that of 1970, just before the final (golden) constraint was broken?
Does the answer to this question answer the question? Money is social relations, power
relations, if Gold is law then the powerful will grab the gold. If not, they'll grab the money
creating buttons in various spreadsheets, unless opposed by all.
Or both. Hitler thought Chartalism (grandfather to MMT) was a great idea, then invaded France
and stole France's sizeable gold horde too! These greedy people want it all!
just before the final (golden) constraint was broken? Tinky
The central bank should not be allowed to create fiat for the private sector (e.g. Open Market
Purchases) AT ALL so no constraint is needed there other than absolute prohibition.
As for the monetary sovereign, price inflation is a restraint wrt fiat creation since the voters
hate it.
Also, please note that the demand for fiat is greatly reduced via other privileges for the
banks. Eliminate those and the demand for fiat shall greatly increase – greatly increasing the
amount of new fiat that can created without significant price inflation. This will be especially
the case when government provided deposit insurance is properly abolished since a huge amount
of new fiat should be required*.
*For the xfer of at least some currently insured deposits to inherently risk-free accounts
at a Postal Checking Service or equivalent.
Sounds good in theory, but how do you imagine that we might get to the point at which central
banks are prohibited from creating credit for the private sector?
How much of that fiat creation gets done via electronic means? Maybe there is a way to
make the vulnerability that the central banks and banksters and CorpoStates like GE and Cigna
and Goldman Sux nd the rest impose on the vast rest of us into a mutual exposure?
I mean, "they" can leverage and disappear and derivatize "capital" and ZIRP and NIRP with impunity,
and steal people's homes and garnish and change contract terms on personal accounts unilaterally.
Is there a turnabout, or are "we" so terrified of "instability" (where no "stability" really
exists, "disruption " and all that, not to act? As well demonstrated in many posts in this very
blog, it's not like the Fortress of FIRE's walls are any stronger than the foundations it is "coded"
on…
@scott 2 – "A dollar today buys what 3 cents could buy when the Fed was formed."
That something is true does not make it relevant; it can also be misleading. The real (domestic)
purchasing power of a dollar is determined by the amount of labor it takes to earn that dollar.
With the gains in labor productivity since 1913, it takes much less labor to earn today's dollar
than it took to earn that 3 cents 103 years ago. Comparing the nominal cost of a loaf of bread
in 1913 with its nominal cost today tells us nothing useful.
Yes isn't it awful when the prices of goods and services go down, I hate it when I have to
spend less money to eat and obtain shelter and all of the other necessaries of life.
Agricultural productivity rises so food costs less; industrial productivity rises so goods
cost less; and these are what is known as "progress". Increasing productivity is what raises our
standard of living.
But ah, there's a fly in the ointment, we have a debt-based money creation system. Problem
1.): Banks can print the principal but they can't print the interest. This leads to
Problem
2.): people borrow either because they think they can grow money faster than the debt service,
or because they are desperate and have no other choice.
Problem 2 (a) is that debt pulls demand from the future to the present, and when enough demand
is pulled forward people will no longer feel they should borrow for future growth because there
is none in sight. This leaves only desperate people borrowing to service existing outstanding
debt and that prophecy fulfills itself.
We are told this is somehow a "steady state" system but that is mathematically and obviously
incorrect. Even with unnatural acts like interest rates below zero (how can time preference be
below zero, and what does that say for the prospects for growth?) the system winds down and needs
to be completely reset.
The percentage of times that debt-based currency systems have failed in the past and gone to
zero = 100…leave it to alchemists economists to insist they can pull it off though.
Like the Soviet Union we now live in an era of centrally-planned price fixing for the most
important price of all in the economy: the price of money.
It's true that in eras where the price of money fluctuated wildly there were also wild fluctutaions
in the economy, booms and busts.
But someone made the statement: "The Fed makes the economy more stable. But I do not think
that word means what you think it does".
So no more busts…and no more booms, either. So put the periods of fastest economic growth and
fastest rises in the standard of living out of your mind, those are history. And given the mathematics
of "unlimited" debt creation, we'll get the bust anyway.
There is nothing wrong with interest, as long as the rate is reasonable. It is a service
charge for someone handing you money now to buy what you want now instead of waiting to save up
the money. Interest does not make an economic system unstable. It's the same as a massage or other
service you buy. You just need enough income to cover it, and the principal payment of course.
Some people seem to have this idea that x amount of money was created to buy a car, but none
was made to pay the interest. This causes the world to end. Not so. Money circulates and we know
that around a trillion or so in circulation seems to be enough to support our $18 T in annual
GDP. What is does mean is to pay off the 5 year car loan, you spent 4 years paying off the car
and another year paying the interest.
A benefit of interest is it may allow people to live past retirement age – but there there
is little economic focus on this phenomena.
There is nothing wrong with interest, as long as the rate is reasonable.
In principle this is true, but it leads to a paradox in an economy in which money is based
on debt. You start your second paragraph with an acknowledgement of this, but then you back down.
In such an economy, money is created when it is loaned - this money is the principal of the loan.
When the money is paid back, the money disappears.
But wait - the debtor must also pay back more than the principal of the loan; he or she must
also pay back the interest. How is the interest created? The same way as the principal, but it
is created by someone else's loan. So in a debt based economy, the amount of money in existence
is less than the total amount of people's debts.
If everyone is thrifty, and pays back their loans promptly, some people will never be able
to get the money to pay their interest. It's a game of musical chairs.
Pretty close, but consider this. The loan got paid back, the "money" disappeared, but the bank
gained it as new loan capacity. The bank makes a new loan. So far I think I'm repeating what you
stated. One minor problem is you say money is less than debt – it will be – debt is the contract
for the entire amount. But not everyone pays it all off at once – we just need the liquidity to
be there so the payor's personal bank account, or the one of their employer, doesn't run dry.
So at this point it's a matter of the banking system and the Fed managing liquidity. But the
size of the Fed balance sheet and reserves steadily increases over the years to account for growth
and any other liquidity needs the banks may have. It's either done directly with banks – buying
treasury bond assets or loans to banks, or they buy Treasuries in the market, the money goes somewhere,
then there is interbank lending to make it go where it's needed. (all in theory, of course. But
the theory seems sound, when uncorrupted.)
You make it sound like a steady state system, but it's not, debt is *always* issued in excess
of people's capacity to pay whether for political, psychological, or other reasons. The Fed knows
this. So they desperately want to reduce the total indebtedness by inflating it away, and this
puts everyone on a giant rat race treadmill, working two jobs trying to outrun the rise in prices.
Given the rise in productivity we're all supposed to be living like the Jetsons by now but Oh
No gatta keep running to stay in one place.
The Fed has forgotten that there is another way to reduce serial overindebtedness and that is
B-A-N-K-R-U-P-T-C-Y. It has the added advantage of being an actual capitalistic endeavor, and
not the inverted hyper-socialism we have today.The Fed keeps putting out brush fires so the dead
wood keeps building up, eventually there is an unholy crowning conflagration that takes the whole
forest with it.
Firstly, I said there is nothing wrong with interest . If you want to shift to "could
something go wrong with principal_plus_interest in a fractional reserve central banking system",
then, why yes! Plenty!
No, the system is by no means steady state – the economy has ups and downs and there are those
occasional "credit crunch" periods where banks get spooked over some such thing and stop lending
completely and then it seems like all the money disappeared. But that's why we have the Fed and
everyone furiously managing liquidity.
Since we're on a terminology thread (and my grandfather was a whaler), the whaling vessels
out of Nantucket tended to be square-rigged - barques, brigs, etc. Schooners were coastal vessels
used by fishermen more often than by whalers, who travelled long distances to launch their hunts.
Great post - I want to puke every time I hear Wall Street referred to as an "economic engine."
More like "social engineering" - of fraud schemes.
A couple of generations ago most people lived on farms. Many would trade grain to pay the miller.
In essence, hard cash was needed for goods at the general store.
Debt was used to finance big projects that were based on hard assets, land, commodities.
Fast forward to today…. banks still favour collateral based on hard assets yet services are
a much bigger part of our economy. I would venture to say that banks lend on soft collateral when
it is fed by sectors that have hard asset collateral or with a government guarantee.
IMO, get government out of everything and watch the economy drop to an economy of sustenance
based on hard asset collateral which will get increasingly constrained with world population going
from 7 to 9B. Exactly what rentiers LOVE!
Debt was used to finance increases in productivity. Unless you have a sweat shop in your basement,
a house is not a productive asset. It's a slowly appreciating consumer of capital, real and financial
(utilities, maintainance, and taxes). In distorted markets like California, it can make a lucky
few a lot of money while turning the area into a feudal system of land owners and serfs.
A side effect of financialization has been to turn the US economy into one that lives, temporarily,
on housing speculation. When people realize that spending $2 million on a bungalow that should
only cost $40K is the TRUE mis-allocation of capital, let's hope they don't realize that all at
once.
A couple generations ago land in many places was still relatively cheap. Asked my father once
how our family of dairy farmers managed to have as much land as we do and was told that my grandfather
often received land as payment. He'd give someone an animal or a side of beef and they'd give
him an acre they owned abutting his property that they weren't using for anything anyway. I've
seen some of the old ledgers found in his attic and as you noted, cash was not just in essence
but in fact used for goods at the general store. The barn itself was built with the help of the
community although I'm not sure how that was paid for but I'd wager that any financing was minimal.
The economy was a few steps above just sustenance but the population was a lot less and there
weren't nearly as many rich people from the city coming in looking for second (or 3rd or 4th)
homes in the country driving up the cost of real estate. Two generations later land is much more
dear to the point where our family likely wouldn't be able to afford to purchase property if they
needed extra acreage.
There are far too many economists who seem to think that money actually does grow on trees
in the sense that it's a naturally occurring resource that human beings can't control – it's all
determined by markets. In that sense I'd describe money not so much as a fuel but as a weapon.
I believe Jon Perkins had a similar description in his Confessions of an Economic Hitman. Weaponized
war is no longer the first option among advanced economies – first they'll try to bleed other
countries dry with economics. It's only when the victims won't cave that the bombs start dropping
now.
But money does not occur naturally and it should not be considered a fuel or a weapon. As noted
in the article it's a concept created by human beings and should be considered a very malleable
tool that we can use to do pretty much whatever we as a society decide we want to with it. If
we truly wanted to create a more equitable society there is nothing stopping us from doing so
except the greed of the few.
@lyman alpha bob – "As noted in the article [money is] a concept created by human beings
and should be considered a very malleable tool that we can use to do pretty much whatever we
as a society decide we want to with it. If we truly wanted to create a more equitable society
there is nothing stopping us from doing so except the greed of the few."
Adding: The Big Lie that the federal government needs tax revenue in order to operate,
so we "can't afford" the social benefits that help the non-rich, must be constantly debunked and
rejected.
Weaponizing money. That's a valuable concept. It reminds me of the end of David E. Martin's
(true-story-called-fiction-to-avoid-lawsuits) book "The Apostles of Power". And this was the reason
he wrote the book, actually–to fend off a major play to steal all the electronically-stored reserves
of the Fed into their own accounts, and destroy the evidence of their actions by triggering a
nuclear explosion of the precise nuclear power station that provided the power to the NYC/NJ computers
that stored the data. By telling enough about the plan in process (only the minor, human-created
fake "earthquake" at the Santa Ana reactor occurred, as the charges had been set before the book
was published; the book predicts the "earthquake"), a nuclear disaster and major financial theft
were averted.
Martin spoke about this, and the other real events described in the book, in a number of radio
interviews he gave in 2012, the year the book was published.
"Here's the [Machine] trick: Design the machine that will produce the result your analysis
indicates occurs routinely in the situation you have studied. Make sure you have included all
the parts – all the social gears, cranks, belts, buttons, and other widgets – and all the specifications
of materials and their qualities necessary to get the desired result."
Well, great! That part of the great discourse has been decoded and unpacked and all that, I
feel much better for the personal increase in awareness of how fokked things are.
Now, how are "we" going to get billions of other humans to the same state of awareness, to
stop talking about "fuel" when talking (using a gazillion other "terms of art" and memes and tropes
that are similarly opaque and whitewash and FUD-laden) about "the economy" and "economics" and
while generating ever more momentum for those same deadly (but profitable for the few) terms,
tropes, memes and shorthands? "Profitable" being one of them, "profit" being part of the disease
process, because after all, for the individual or the firm s/he belongs to, "profit" (ignoring
externalities, of course) is the summum bonum that lets you buy stuff and experiences galore?
Other Juggernaut words, just a very few: "bonus", "healthcare", "entitlement", "MArket", "free
trade," and a personal favorite, "donor" meaning very simply "BRIBER/corrupter" but hey, those
very few squillionaires who own everything including the "political process" are described millions
of times a DAY on the intertubes as "donors," "donors" to political candidates and PACs and "think
tanks" (??another fave). Giving a kidney to a person with terminal kidney failure, "donating"
one's corneas and body parts or those of deeply loved ones suddenly deceased, those are ""donations."
Not Koch or Adelman or Soros or Gates etc. billions to "Foundations" or operas or art museums.
"We," who are Aware, perceive some of this, often argue and debate and cavil over nitty bits
of those perceptions. That is so very effective, isn't it, the few hundreds or thousands of "us"
who participate in or observe the Flow in NCspace, in bringing about any kind of regression to
a mean that is hardly defined or maybe undefinable, a mean that might actually be "kind" and "decent"
and "fair" and "just" (whatever those terms are taken to mean)?
What is to be done about it? "We" ain't either powerful or certain enough to do something like
a "global search and replace" across the entire internet, with a burning of all the books and
papers, and a quarantine of all the GeithnerDimonGreenspanKrugmans and their myriad of citers
and followers and extenders, that carry the infection forward into the label minds of future "policy
makers" who like most humans who (I am assured by others) are wired to seek dominance and pleasure
and reproductive success? And who obviously are the dominant, successful vector and segment of
the "political economy?"
The plagues that Pandora was tricked into loosing on "humanity" have been out there probably
too long to be re-packaged. Nice effort for those who try, try and try again, but that effort
seems to me mostly pissing into the wind…
TINA. Sadly it's true, we appear somewhat stuck in this mode of what's working. I personally
appreciate the credit union / co-op model of accomplishing financial intermediation but that is
also a continuation of what we have.
Biggest problem in the US, no one competing with the FED.
"some of the recent coinages, like "sharing economy" are downright Orwellian". Yes, but that
phrase can be and is easily replaced in casual conversation with "the sharecropper economy".
(Be prepared to deliver a short explanation what a sharecropper is to the youg 'uns.)
Another valid word out of the past is "the man," as in the giver of overpriced credit to the
sharecropper who often ended up with zero profits and thus was kept in perpetual debt. Central
bankers?
Everybody talks about "thought leaders" but no one ever talks about "thought followers," much
less actually claims to be one. But without "thought followers" how can you have "thought leaders"?
I'm suspicious….
And anyway, wouldn't "thought leader" be applicable to anybody whose thinking ends up being
followed by others, for good or ill? Wouldn't Charles Manson be a "thought leader"? He certainly
was for the Manson Family….just a thought…
I always thought the exhortation to be thought leaders was a ruse for encouraging people to
speak up and try to act as thought leaders. That way those who worked us could identify the taller
daisies and thereby identify which flowers to top.
Seems like some combination of Frederick Soddy and Michael Hudson is called for here. Soddy
is apparently a tough slog even for otherwise intelligent people. So at the risk of over-simplification
here is my attempt to convey his ideas about money and wealth:
Money is not wealth. It is a claim on wealth, i.e. debt.
Wealth. Soddy provides both a practical and a more abstract definition of (the ingredients
of) wealth:
"But economics, in a national sense, is concerned with wealth as what is produced by human
beings to maintain their lives.
Discovery, Natural Energy and Diligence, the Three Ingredients of Wealth
For Discovery, think research and development (R&D) and of course education so R&D is even
possible. For Natural Energy, think, for most of the Industrial Revolution (IR), fossil fuels.
(Pretty obviously we need to do something different if we want to keep the machine the IR built
functioning, sustainably producing the wealth which sustains our civilization.)
One of my favorite passages from Soddy's "Wealth, Virtual Wealth and Debt" is:
"As Ruskin said, a logical definition of wealth is absolutely needed for the basis of economics
if it is to be a science."
But without a science-based definition of wealth, i.e. continuing to use profit and money as
a measure of 'productivity', just 'printing' more money (even Hudson's MMT) will solve nothing.
Put these observations together and you get an idea what should 'back' money – wealth not gold
or as Hudson puts it "Debts that can't be repaid (and) won't be."
Hudson's 'clean slate' provides the other part of the solution. As Hudson notes, the 'miracle
of compound interest' is not sustainable – particularly when the West's 'financial engineers'
are busy cranking out money (as debt) at rates well in excess of going interest rates. Just continuing
to use profit and money as a measure of 'productivity', 'printing' more money (even Hudson's MMT)
will solve nothing. Probably by the middle of the 20th century, the West had 'enough' wealth its
people could begin to find other purposes in life than creating ever more of it (to make ever
more money, i.e. acquire ever more debt to be paid by someone – the unborn?). Again from Soddy
/ Ruskin – real "Wealth rots." That's what's happening to the West's 'culture' as its ruling classes
mindlessly attempt to acquire ever more money.
It isn't just the 1% who are going to have to take their lumps, to stop playing games with
the world's future so they can, as candidate Trump put it, 'run up a bigger score' with money
for which they have no immediate need. It is those of us in the 99% who do not possess the skills
and aptitudes required for the genuine creation of wealth, wealth the world needs and can sustainably
afford. Those numbers are going to grow as the Industrial Revolution succeeds, with human labor
and rote intelligence replaced more and more by machines powered by "natural energy". But, even
if we can't find our niche, I take it as a given that we are all born with a right to life.
Wealth is hard to define because what we view as wealth might be a money pit that guarantees
our decline…
For example, instead of injecting money directly in the faculty of medicine, a university might
have decided to fund a football team to attract the capital and end up building a stadium… Instead
of just funding the faculty.
All these activities related to the sports team contribute to GDP. The bankers might have been
productive and efficient in raising capital, the coach might be productive and make a winning
team, the builders of the stadium might have been very productive building a fine structure but
all these activities sucked up resources and energy that could have been used by other sectors
to better serve the future of the country. Maybe these activities are totally unsustainable. They
might appear as wealth currently but will lead to poverty over time.
Since ou basic needs have been met, we have been investing in a forever greater number of non-essential
resource intensive activities which show how disconnected we have become from the earth supporting
us.
The terminology of finance is designed to hide predatory and extractive activities behind
a curtain of beneficial-sounding words. These terms are deeply embedded, and serve both to put
some friendly makeup on the business, and allow the "consumers" to feel better about their capitulation.
The process is akin to the way politicians wrap themselves in the flag while they sell out the
citizenry. We know deep down that they are lying, but we prefer the false patriotism because it
serves the lies we prefer to tell ourselves. We bitch and moan, but we play our part, because
not doing so leads to trouble. It is the way most of us live our lives.
One of the biggest problems people face in discussing matters financial, is that the very terminology
of the system undercuts the critiques. Just as criticizing the wars invokes in some the specter
of failing to support the troops and the specter of criticizing America, criticizing Wall Street's
predatory aspects invokes in many the specter of criticizing institutions we have been led to
believe represent the essence of American freedom. Doing so makes you at least a malcontent or
troublemaker, and maybe even some sort of subversive pinko. Either way, you're rocking a boat
many do not want rocked.
Using analogies and metaphors to discuss such matters can outflank the loaded-terminology question
to a significant degree. You can cut through a lot of the fog of jargon by describing the activities
in other terms. (E.g., Dave's "sharecropping" for "sharing economy.")
We are in an era in which the financial world is being downsized and consolidated, the giant
speculative bubble which dominated most of our lives is being deflated and wound down before our
eyes. There is still speculative activity, to be sure, but there is also a rise in the use of
rentier income. This downsizing process involves shifting losses wherever possible down the food
chain, including to institutions which previously were integral parts of the system. Insiders
are finding themselves outsiders, jettisoned by other insiders.
This reminds me of the situation of a pack of wolves, grown large in an era of plentiful food,
but now finding that food supply dwindling. The pack must shrink to survive, the excess members
culled in often brutal ways. The strongest eat the most, the rest are left with the scraps, or
nothing at all. The financial system is similar, a pack in which the herd is being culled. Individual
institutions, even important ones like Barings or Lehman, are ephemeral. They come and they go,
just like individual wolves in the pack. But the pack lives on, and so does the financial system.
To the wolves, the pecking order, who lives and who dies, is very important. But for the creatures
the pack eats, such concerns are irrelevant.
Either way, you're rocking a boat many do not want rocked.
Perhaps. Or perhaps the alternatives to our ruling narratives and power mechanisms have been
ruthlessly dismantled and extinguished. For example, I would love to join a union. But I live
in a right-to-work state.
I would love to have representation at my workplace and have some degree of bargaining power.
I guess there's always the complaint box. Or the "freedom" to hit the bricks.
Luckily, I went to school when it was affordable, so I don't have student loan debt. I rent,
and although rents continue to rise every year, I don't have a mortgage hanging over my head.
My younger colleagues are saddled with outrageous student loan debt that they will never likely
repay. Unfortunately many/most of them bought into the housing market. How likely are they to
even entertain the idea of speaking truth to power?
I'm past 50, and you know what that means to my prospects of finding another job. Young and
old, we just keep our mouths shut and do what we're told.
The US represents 5% of world population but consumes a much larger share of world energy and
resources. The 99% are concerned about fairness but if they truly cared, they'd understand that
the global economy needs to shrink their share of resources to 5%. And the leveling is getting
stronger by the day. Most people go along the big lie because of hope.
Question about your numbers - I think our share of resources needs to shrink but I'm not sure
5% is the right number. Are some of the resources in that 5% dedicated to our Industry? Is our
industry productive? and who gets the stuff? It may be we need to shrink our use of resources
to 4%. And what about the who uses how much of what resources? How do you count the resources
used to support our car, bus, and truck industries while deliberately stifling mass transit. I
only make these quibbles to avoid your logic of proportions. Clearly we must take/steal less from
the rest of the world and share what we have. I believe there is enough to go around - once a
few (quite a few) problems here and there are taken care of.
I'm not sure how much hope continues to hold up the big lie. I think the supports for the big
lie need a lot of maintenance to keep it from falling. Maybe we can simply stop using that road.
I don't know what the number is but from my vantage point , it looks like the western work
is heading for a world of pain. Americans want America to be great again but it's based on materialism.
To be great again would mean a different kind of greatness where the economy is based on a
reduction of it share of resources.
But the population is still very far away from the fact that its way of life depends on an
unfair distribution of world resources which will probably lead to a big world struggle meaning
a focus on the military.
This is not what I want by what I see in the horizon.
There's a reason money and fuel are in the same sentence. It's because the a nation's power
depends on energy.
It might seem trite, but if an American is patriotic, he or she will try to reduce the nation's
energy use by using energy efficiently. Whether it's transportation, home heating, home cooling,
or nighttime illumination, one should use the energy efficiently. Aside from the immorality of
using so much more than many other people in the world, it's a way to reduce pollution and to
avoid sending money to the Wahhabi nut jobs in Saudi Arabia. Plus, energy efficiency saves money!
Our country has the capacity to help the world get through the crises of Global Warming and
the end of oil. Our country has responsibility as one of the guilty parties - one of the most
most guilty in taking more than our share and sharing less than we are able or should share. The
meaning of riches is best enjoyed through the sharing of those riches. In ancient times - at least
in some places - that was the privilege and obligation of the rich.
I would feel deep shame for our country if it is to be remembered in the future for what it
has done so far.
Great comment, ROTL! Accords very well with my understanding of the power of metaphors, to
bring into being the world stage on which we strut our stuff.
Many here at NC often comment on the quasi-religious nature of economics. I'm always struck
by the conflation of the organic/natural world with mechanics. Wrongly conceiving of market forces
as natural forces and so on. I think you've struck a blow against this wrong-headed mythos at
its weakest point. If the metaphors that bring into being this world of pain we're living in themselves
are discredited, the whole edifice could come crashing down in no time.
If anyone's interested in a little exercise, trying paying attention to the metaphors one uses
for organic systems, and society at large. Even though I'm aware of their inappropriateness, it's
hard not to think in mechanistic terms. And not just mechanistic, but weaponized, at that. You
can't even listen to a baseball game without hearing metaphors of war all the damn time. Then
there are "Twitter wars" and "Facebook wars" ad nauseaum.
Money is nutrition, not a snack. It's food and fertilizer. It makes things grow. You have
to share it with other life like bacteria and worms: without these organisms in your gut ecology,
you get sick (autism, diabetes, obesity, M.S.). Idiots try to convince us these organisms are
parasites instead of symbionts just like Monsanto thinks bees are disposable or Donald Trump likes
to think of pregnant women as drags on business profits.
Where does he propose business find future workers if not in wombs? From where will his future
customers come?
Perhaps in sharing economy of future America, companies will have to share their dwindling
customers and make do with less?
If you think altruism is for suckers, your Ayn Rand economy collapses because you confuse
parasites with symbionts and symbionts with parasites. You can't distinguish between compensation
for earned and unearned income. What's a tax and what's theft? Try living without bacteria making
butyrate in your gut. Wells Fargo can no more survive without little people like airport janitors
to scrub out the TB and Ebola stains than our cells can breathe without mitochondria. Yet who
gets their pay driven down in corporate America?
Money weaves a supporting web of trust, a mutual network of obligations and payments – and
what happens biologically when that web inside us is broken and friends become enemies and we
treat enemies as friends? Is fraud any different than autoimmunity or cancer?
Well, I was gobsmacked to see this show up when I finally logged on to the Internet today.
Many heartfelt thanks to all who commented so thoughtfully and insightfully; and also to the remarkable
NC crew (Yves, Lambert, Jerri-Lynn, the IT folks), as well of course to Clive.
I think that we are all rooting for the time when Haldane's insights are met with 'Doh', and
when we celebrate Bill Black as a Nobel in Economics ;-)
Volcker and Peterson: Ignoring the Lack of Demand Problem
Former Federal Reserve Board Chair Paul Volcker and
private equity billionaire Peter Peterson had a New York
Times column * this morning complaining that not enough
attention is being paid to the national debt. The piece uses
wrong-headed economics and xenophobia to try to scare readers
into backing their austerity agenda.
On the economic side, it implies that the prospect of a
rising debt to GDP ratio implies an imminent crisis.
"Yes, this country can handle the nearly $600 billion
federal deficit estimated for 2016. But the deficit has grown
sharply this year, and will keep the national debt at about
75 percent of the gross domestic product, a ratio not seen
since 1950, after the budget ballooned during World War II.
"Long-term, that continued growth, driven by our tax and
spending policies, will create the most significant fiscal
challenge facing our country. The widely respected
Congressional Budget Office has estimated that by midcentury
our debt will rise to 140 percent of G.D.P., far above that
in any previous era, even in times of war."
There are several points to be made here. First the ratio
of debt service to GDP is currently just 0.8 percent. (This
is net of interest payments rebated by the Federal Reserve
Board.) This is near a post-war low. By comparison the ratio
was over 3.0 percent in the early and mid-1990s. In other
words, the reality is the exact opposite of what Volcker and
Peterson claim, the burden of the debt on the economy is
unusually low.
Second, if interest rates rise precipitously, which they
imply will happen for unexplained reasons, we can always buy
back the debt at large discounts, ** thereby reducing the
debt to GDP ratio. This would be an absolutely pointless
move, but if distinguished people who can get columns in the
NYT think the debt to GDP ratio is important, it can be done
to humor them.
Finally, the widely respected Congressional Budget Office
(CBO) has repeatedly been wrong in predicting that interest
rates will rise. (They also seriously over-estimated the cost
of the Affordable Care Act and health care more generally.)
Ever since 2010 CBO has projected that interest rates will
bounce back to pre-recession levels. Each time they have been
shown wrong as interest rates remained low. ***
The reason for the low rates is the weak level of demand
in the economy. In this context, the deficit is a good thing
and a bigger deficit would be better. It would generate more
demand, output, and employment. It would also make us richer
in the future since at higher levels of output firms invest
more. Also, many workers who are out of the workforce for
long periods of time can end up permanently unemployable.
As a result of the low deficits and weak demand in the
post-recession years the widely respected Congressional
Budget Office estimates that the economy's potential GDP in
2016 is almost 10 percent smaller **** (almost $2 trillion)
than the potential it had projected for 2016 before the crash
in 2008. This "austerity tax" is costing the country $6,200
per person in lost output. For some reason, Volcker and
Peterson would have us ignore this huge and growing burden
that the country now faces as a result of a sustained period
of weak demand and instead concern ourselves with the
improbable scenario they paint in their piece.
To push their Social Security and Medicare cutting agenda
(they seem to have not noticed that the rate of growth of
health care costs has slowed sharply) they then turn to
Trumpian xenophobia:
"The projected rise in federal deficits would compete for
funds in our capital markets and far outrun the private
sector's capacity to save, to finance industry and home
purchases, and to invest abroad. Instead, we'd be dependent
on foreign investors' acquiring most of our debt - making the
government dependent on the 'kindness of strangers' who may
not be so kind as the I.O.U.s mount up."
To make this evil foreigner case we have to turn economic
reality on its head. First, the country's problem for the
last decade and really for the whole century, has been a lack
of demand, not the lack of supply which they are implying.
While it might be nice to see the economy again operating
near its potential and be supply constrained, it is not a
situation we have seen for a long time.
Second, one of the reasons that we have a lack of demand
is that foreigners, and most importantly foreign central
banks, are buying our debt. (Yes, China is the biggest actor
here, but not the only one.) The large purchases of U.S.
government debt have driven up the value of the dollar
causing the trade deficit to explode. It was around 1.0 of
GDP in the mid-1990s. The run-up in the dollar following the
East Asian financial crisis pushed the trade deficit to
almost 4.0 percent of GDP by the end of 2000. It eventually
peaked at almost 6.0 percent of GDP in 2005 and 2006.
Since the recession the trade deficit has fallen back to
less than 3.0 percent of GDP (@ $500 billion in 2016), but
this trade deficit is creating the gap in demand that is
being in part filled by the budget deficit. If foreigners
would show less of the "kindness of strangers" we would have
a smaller trade deficit, more output, more jobs, and a
smaller budget deficit.
In other words, Volcker and Peterson have the story upside
down. We should not want foreigners to be buying our debt, at
least if the goal is a lower budget deficit.
There is one last point that is worth mentioning. Japan's
ratio of debt to GDP is close to 250 percent. Investors are
currently paying the Japanese government to borrow their
money. ***** In other words, the imminent debt crisis that
Volcker and Peterson want to scare us with exists only in
their heads.
Big oil companies are no longer able to replace all their
production through conventional exploration, the energy consulting company said in a report
published Tuesday.
We have been hearing a great deal about IMF concerns recently, after the release of its
October 2016 World Economic Outlook and its Annual Meeting October 7-9. The concerns mentioned
include the following:
Too much growth in debt, with China particularly mentioned as a problem
World economic growth seems to have slowed on a long-term basis
Central bank intervention required to produce artificially low interest rates, to produce even
this low growth
Global international trade is no longer growing rapidly
Economic stagnation could lead to protectionist calls
These issues are very much related to issues that I have been writing about:
It takes energy to make goods and services.
It takes an increasing amount of energy consumption to create a growing amount of goods and
services–in other words, growing GDP.
This energy must be inexpensive, if it is to operate in the historical way: the economy
produces good productivity growth; this productivity growth translates to wage growth; and debt
levels can stay within reasonable bounds as growth occurs.
We can't keep producing cheap energy because what "runs out" is cheap-to-extract energy. We
extract this cheap-to-extract energy first, forcing us to move on to expensive-to-extract energy.
Eventually, we run into the problem of energy prices falling below the cost of production
because of affordability issues. The wages of non-elite workers don't keep up with the rising
cost of extraction.
Governments can try to cover up the problem with more debt at ever-lower interest rates, but
eventually this doesn't work either.
Instead of producing higher commodity prices, the system tends to produce asset bubbles.
Eventually, the system must collapse due to growing inefficiencies of the system. The result
is likely to look much like a "Minsky Moment," with a collapse in asset prices.
The collapse in assets prices will lead to debt defaults, bank failures, and a lack of new
loans. With fewer new loans, there will be a further decrease in demand. As a result, energy and
other commodity prices can be expected to fall to new lows.
"... The EU and IMF have not delivered on what they promised, in the same way that traditional parties have not, from the US to UK to basically all of Europe. They promised growth, and growth is gone. They may have delivered for their pay masters, but they lost the rest of the world. ..."
"... Anything else is just hot air. But that doesn't mean they will hesitate to use their control of the military and police to hold on to what they got. In fact, that's guaranteed. But it would only be viable in a dictatorial society, and even then. ..."
"... We are transcending into an entirely different stage of our lives, our economies, our societies. Growth is gone, it went out the window long ago only to be replaced with debt. And that's going to take a lot of getting used to. But there's nothing that says we couldn't see it coming. ..."
"... There is very little social conscience when all the wealth goes to the extreme rich elite. Not content with this, they want all the wealth. There is a middle ground, but can politicians get an agreement, when performance is always measured, but an ever increasing quarterly profits expectations? ..."
"... "The Governor of the Bank of England became a frequent visitor. . . we had to listen night after night to demands that there should be immediate cuts in Government expenditure.. . Not for the first time, I said we had now reached the situation where a newly elected government with a mandate from the people was being told, nor so much by the Governor of the Bank of England but by international speculators, that the policies on which we had fought the election could not be implemented." ..."
"... "The proposal of any new law or regulation of commerce which comes from this order ought always to be listened to with great precaution, and ought never to be adopted till after having been long and carefully examined, not only with the most scrupulous, but with the most suspicious attention. It comes from an order of men whose interest is never exactly the same with that of the public, who have generally an interest to deceive and even to oppress the public, and who accordingly have, upon many occasions, both deceived and oppressed it." ..."
"... "The interest of the dealers, however, in any particular branch of trade or manufactures, is always in some respects different from, and even opposite to, that of the public." ..."
"... "The interest of the dealers, however, in any particular branch of trade or manufactures, is always in some respects different from, and even opposite to, that of the public. ..."
"... "The value of markets is always in some respects different from, and even opposite to, that of the public." ..."
Because it's the people that bear the brunt of the failure, not the leadership; even Greece's politicians
still pay themselves a comparatively lush salary.
As for Britain, it's the textbook example of utter blindness. Those who were/are well provided
for, be they politically left or right, missed out on what was happening around them so much they
had no idea Brexit was a real option. And in the 15 weeks since the Brexit vote, all anyone has done
in the UK is seeking to blame someone, anyone but themselves for what they all failed to see coming.
Perhaps the biggest beneficiary of free trade over the past generation, China, still restricts
access to many of its key industries, with economists worried about increasingly mercantilist
policies. It's also seeking a larger role in the existing global framework, with entry of the
yuan into the IMF's basket of reserve currencies on Oct. 1 the most recent example. An all-out
trade war would be a disaster for China's economy, with Trump's threatened tariff potentially
wiping off almost 5% of its GDP, according to a calculation by Daiwa Capital Markets.
John Williamson, whose Washington Consensus of open trade and deregulation was effectively
the governing ethos for the IMF and World Bank for decades, said the 2008-09 financial meltdown
had undercut support for economic integration. "There was agreement on globalization before
the crisis and that's one thing that's been lost since the financial crisis," said Williamson,
a former senior fellow at Peterson Institute for International Economics who is now retired.
The growing opposition to economic integration has been fueled by a sub-par global recovery.
"Perhaps the most striking macroeconomic fact about advanced economies today is how anemic demand
remains in the face of zero interest rates," former IMF chief economist Olivier Blanchard wrote
last week in a policy brief for the Peterson Institute.
These 'experts' seem to have an idea there's something amiss, but they don't have the answers.
Which is impossible to come and say out loud if you're an expert. Experts must pretend to know it
all, or at least know why they don't know. "There was agreement on globalization before the crisis",
and now it's no longer there. That they see.
That they ain't coming back, neither the agreement on it nor globalization itself, is a step too
far for them. To publicly acknowledge, at least. That Blanchard expresses surprise about 'anemic
demand' at the same time that interest rates are equally anemic is something else.
That both are two sides of the same coin, or at least may be, is something he should at least
mention. That is to say, low rates induce deflation, though they are allegedly supposed to induce
the opposite. Economists are mostly very misguided people.
The world economy is getting some lift after rising at an annual rate just shy of 3% in
the first half of this year, according to David Hensley, director of global economics for JPMorgan.
But much of the boost will come from a lessening of drags rather than from a big burst of fresh
growth, said Peter Hooper at Deutsche Bank Securities, a former Federal Reserve official.
Recessions in Brazil and Russia are set to come to an end, while in the U.S. cutbacks in inventories
and in oil and gas drilling will wane.
Please allow me to chip in here. 'Lessening of drags' in a nonsense term. And so is the idea that
"..recessions in Brazil and Russia are set to come to an end". That's all goal-seeked day-dreaming.
Smoke or drink something nice with it and you'll feel good for a few hours, but that doesn't make
it real.
"I'm characterizing the global economy as something akin to a driverless car that's stuck
in the slow lane," said David Stockton, a former Fed official and now chief economist at consultants
LH Meyer. "Everybody feels like they're being taken for a ride but they're pretty nervous because
they can't see anybody in control."
I really like this one, because off the bat I thought Stockton had it all wrong. What I think
is the appropriate metaphor, is not "a driverless car that's stuck in the slow lane" , but
one of those cars in a car ousel at a car nival, a merry-go-round, where you
can sit in it forever and you always end up in the same spot. And the only one who's in control in
the boss who hollers that you need to pay another quarter if you want to keep on riding.
Or, alternatively, and to stay at the carnival, it's a bumper car, which allows you to hit other
cars and get hit, but never to leave the rink. That's the global economy. Not getting anywhere, and
running out of quarters fast.
Still, for the first time in the past few years, Stockton said he sees a real upside
risk to his forecast of continued global growth of around 3% next year. And that's coming
from the possibility of looser fiscal policy in the U.S. and Europe. In the U.S., both Clinton
and Trump have pledged to boost infrastructure spending on roads, bridges and the like. In
Europe, rising populism provides a powerful incentive for governments to abandon austerity
ahead of the elections next year – and perhaps beyond. Whether such a shift will be enough to
mollify those who have been on the losing side of globalization for decades is debatable, however.
"The consensus in policy-making circles was that more trade meant better economic growth,"
said Standard Chartered head of Greater China economic research Ding Shuang, who worked at the
IMF from 1997 to 2010. "But the benefits weren't shared equitably, so now we see a round of anti-globalization,
anti-free trade. "Globalization will stall for the moment, until we can find a way to share
those benefits," he added.
Globalization is done. And while we can discuss whether that's of necessity or not, and I continue
to contend that the end of growth equals the end of all centralization including globalization, fact
is that globalization was never designed to share anything at all, other than perhaps wealth among
elites, and low wages among everyone else.
The EU and IMF have not delivered on what they promised, in the same way that traditional
parties have not, from the US to UK to basically all of Europe. They promised growth, and growth
is gone. They may have delivered for their pay masters, but they lost the rest of the world.
Anything else is just hot air. But that doesn't mean they will hesitate to use their control
of the military and police to hold on to what they got. In fact, that's guaranteed. But it would
only be viable in a dictatorial society, and even then.
We are transcending into an entirely different stage of our lives, our economies, our societies.
Growth is gone, it went out the window long ago only to be replaced with debt. And that's going to
take a lot of getting used to. But there's nothing that says we couldn't see it coming.
Yves, people have, or are loosing faith in all things financial/political as the policies have
mostly enhanced the professional politicians, corporations, and the few. It's no longer generally
possible to work hard and do well in life, coupled with all forms of QE had boosted asset prices
and put even accommodation, either buying, or renting ever more expensive. The cost of living
via many measures is increasing and the CPI is no longer a realistic measure. Ok you might be
able to buy a cheap flat screen relatively, but many now can't even find a "full time job". The
bogus employment metrics help the sense of stability, but try living on a part time wage.
There is very little social conscience when all the wealth goes to the extreme rich elite.
Not content with this, they want all the wealth. There is a middle ground, but can politicians
get an agreement, when performance is always measured, but an ever increasing quarterly profits
expectations?
I don't know what the answer is, but you need people to earn if you want GDP growth, and AI/robots
don't consume, so don't the elite get it?? Finally, we have our youth with low job prospects,
looking at an uncertain future, and probably a very big student loan and how are they supposed
to contribute to the economy.
When Nelson Mandela walked out of prison the South African Rand fell 10% and the South African
stock market collapsed.
The prospect of the masses getting a better standard of living was going to be bad for profit.
Economic liberalism is an idea that was first tried in Chile in the 1970s, it bought wide spread
poverty and vast wealth for a few.
Everywhere it has been tried the effects have been pretty much the same, the more economically
liberal the economy, the more profound the inequality and poverty.
The West and its strong democratic institutions posed a problem.
How do you enforce it without IMF "conditionalities" for loans?
Margaret Thatcher got the ball rolling in the UK, but she didn't think she could go as far
as Milton Freidman wanted.
A softly, softly approach was taken to gradually roll back the welfare state, privatise previously
public companies, remove regulations and cut taxes on the wealthy, but that bothersome democracy
was always going to be a problem.
There is now mass migration from the more economically liberal nations to the Western nations
that still have a welfare state and where life looks altogether more pleasant.
The hope for Eastern Europe when the Berlin Wall fell has gone and they can't wait to get away
from their economically liberal nations and get into Western Europe with the style of capitalism
they had always wanted.
Economic liberalism has progressed far enough in the West to now provoke a backlash.
With the UK ignoring business and thinking of looking after the people, it must be punished
by the markets.
What Harold Wilson experienced in the 1960s has been perfected into a global system through
the free flow of capital and freely floating currencies.
From Harold Wilson's memoirs:
"The Governor of the Bank of England became a frequent visitor. . . we had to listen night
after night to demands that there should be immediate cuts in Government expenditure.. . Not for
the first time, I said we had now reached the situation where a newly elected government with
a mandate from the people was being told, nor so much by the Governor of the Bank of England but
by international speculators, that the policies on which we had fought the election could not
be implemented."
Nelson Mandela is free from jail and will want to look after the people – we must slam their
currency.
The UK is thinking about looking after the people – we must slam their currency.
Do they have some little buttons to push at the BIS when nations step out of line?
In the early days of small state, raw capitalism slavery was found to be the ideal for maximising
profit.
Then those medalling politicians abolished it against the wishes of the business community.
Those medalling politicians also abolished child labour against the wishes of the business
community.
Adam Smith observed:
"The proposal of any new law or regulation of commerce which comes from this order ought
always to be listened to with great precaution, and ought never to be adopted till after having
been long and carefully examined, not only with the most scrupulous, but with the most suspicious
attention. It comes from an order of men whose interest is never exactly the same with that of
the public, who have generally an interest to deceive and even to oppress the public, and who
accordingly have, upon many occasions, both deceived and oppressed it."
NAFTA is going to be great for the US and jobs.
They should have listened to Adam Smith.
Adam Smith observed:
"The interest of the dealers, however, in any particular branch of trade or manufactures,
is always in some respects different from, and even opposite to, that of the public."
When the ideal for maximum profit is slavery, the public are always going to be in trouble.
"Western workers are so much trouble, where can we set up a nice sweatshop where there are
almost no regulations?"
"The interest of the dealers, however, in any particular branch of trade or manufactures,
is always in some respects different from, and even opposite to, that of the public.
In the 21st Century we might observe:
"The value of markets is always in some respects different from, and even opposite to,
that of the public."
Markets just being an aggregate of business interests and in no way influenced by the general
well-being of the public.
Yves has given you a platform for your comments and you have said something worthwhile.
How about tidy it up in a brief article and see if she will publish it?
I totally agree with you that democracy seems to have had its day but its still being avoided
in subtle and concealed ways. Are we ready to debate a new system?
"... The banking and corporate elites certainly have a problem. The agenda for many decades has been to steal and rape enough from the 99% to maintain positive balance sheets and earnings per share. ..."
"... Fewer and fewer of the 99% can now afford to pay for the promoted goods and services. It has reached a tipping point. Name one major bank that could afford to mark-to-mark its balance sheet assets. Name one S&P corporation that has shown solid earnings growth absent stock buybacks. And from here on, it only gets worse. ..."
Global debt has now reached about a hundred and fifty-two trillion dollars
. This includes government debt, household debt, non-financial firms' debt. What does
all this debt mean for the global financial system and for everyday people here, Michael?
That works out to only USD $20,540 for every man, woman and child on the planet. I'm sure the
debt serfs can take double or triple that.
Yup, barely over 2 million dollars per 1 percenter. You can barely buy a passable vacation
mansion for that, let alone staff it with peons. C'mon, guys, work harder for (and borrow more
from) your betters!
The banking and corporate elites certainly have a problem. The agenda for many decades
has been to steal and rape enough from the 99% to maintain positive balance sheets and earnings
per share.
It has worked too well, but pure math has a way of biting the 1% in the ass.
Fewer and fewer of the 99% can now afford to pay for the promoted goods and services. It
has reached a tipping point. Name one major bank that could afford to mark-to-mark its balance
sheet assets. Name one S&P corporation that has shown solid earnings growth absent stock buybacks.
And from here on, it only gets worse.
Again, I am especially struck by the rate of increase of the atmospheric concentration of carbon dioxide. The rate of increase
has been growing.
Looking to the data even casually points out the growing rate of increase of atmospheric concentrations of CO2. This year,
in this regard, looks as alarming as last, in which the rate of increase was at a record high. Why this should be, through a time
of relatively slow international economic growth and increasingly broad efforts to limit CO2 emissions, has to be an especially
important question.
Not to discourage you, but to talk intelligently about CO2 in atmosphere you as a minimum need a degree in geophysics.
This is mind-bogglingly complex porblem with many factors beyond ordinary human comprehension. For example "How do human CO2
emissions compare to natural CO2 emissions?"
Fractal Hurricane -> anne...
As the population increases the first derivative of CO2 concentration increases, roughly speaking. Even if all humans opt for
universal vasectomy, population expansion will not stop for another 9 months. Population shrinkage will be slow at first and will
take roughly 4 generations to bring CO2 expansion back to 1960 levels. Shrinkage of CO2 concentrations will take even longer.
Even with forest replanting and careful management of our energy choices, the humanity is probably doomed forever. Still, we
have to
pgl :
October 08, 2016 at 02:49 AM
Noah Smith links to this paper:
http://www.federalreserve.gov/econresdata/feds/2016/files/2016080pap.pdf
Since the Great Recession, the U.S. economy has experienced
low real GDP growth and low real interest rates, including
for long maturities. We show that these developments were
largely predictable by calibrating an overlapping-generation
model with a rich demographic structure to observed and
projected changes in U.S. population, family composition,
life expectancy, and labor market activity. The model
accounts for a 1¼–percentage-point decline in both real GDP
growth and the equilibrium real interest rate since
1980-essentially all of the permanent declines in those
variables according to some estimates. The model also implies
that these declines were especially pronounced over the past
decade or so because of demographic factors most-directly
associated with the post-war baby boom and the passing of the
information technology boom. Our results further suggest that
real GDP growth and real interest rates will remain low in
coming decades, consistent with the U.S. economy having
reached a "new normal."
David Petraeus is clearly incompetent in this subject matter
Notable quotes:
"... This idiot is short oil.. Trying to save his investment... Go lay down warmonger... ..."
"... Petraeus escalates the war with Russia by announcing the Saudi's will not stop flooding the market. EVERY American should note that it is OUR government who attacks US Domestic energy, not Saudi's as has been claimed. It's not an attack on shale oil, it's an attack on Russia where American energy is a victim. ..."
"... Well, my 35 plus years in the industry, including 15 years in crude and natural gas trading, tell me that OPEC will say they will cut then cheat like crazy. Don't look for much in the way of real cuts. ..."
"... Huh? Petraeus is one of the worlds most astute analysts? I thought he was a General? ..."
"... Russia isn't a member of OPEC Rick - and another tip, you might mention that the OPEC countries are mostly welfare states, and can't keep prices this low forever. ..."
"... Obama out-maneuvered OPEC every step of the way. Pump prices don't lie. Thank you, Obama! ..."
"... He must be short on oil stocks. The common man is stuck in the middle having to pay more at the pumps no matter what all these greedy leeches say. ..."
This idiot is short oil.. Trying to save his investment... Go lay down warmonger...
Zero
Get ready for high prices at the pump AGAIN! Same thing every four years... prices shoot up after
a presidential election and stay there for two to three years. Like magic, or better yet clockwork,
the prices drop just before the primaries begin. It is OPEC'S way of manipulating US elections.
And when the public begins to grumble at $4 to $5/per gal of gas, the oil companies send out the
talking-heads to convince you the world is running out of oil and the prices are warranted.
Think about $5/gal gas... 10-12 gals to fill your car... $50 to $60 per fill-up, two, three,
four times a month. That cuts into peoples overall living expense and devastates house hold budgets.
Also the vendors at the stores increase prices and inflation soars! People are pushed into foreclosure
and even bankruptcies. And those promises from car companies for cars that run on electricity
and alternative fuels wax and wane with the price of gas... never amounting to any real accomplishment.
We are being lead around by the oil countries like pigs with someone's finger in your nose.
whosunw 6 minutes ago
everyone breaks the rules and pump more than their production allocation anyway. In a month, it
will be evident that this time is no different. If I were the Chinese, I'll slow down the filling
of their Strategic Oil Reserve for the next couple of months. Coupled with shallers coming back
some, oil should again move back to below $45.
whynotwrite 1 hour ago
Cutting production by 2% leads to a 4% increase in cost. They can pump less oil and make more
money. I'll bet if they cut production by 5% the price will go up 10%.
Ron 30 minutes ago
Petraeus escalates the war with Russia by announcing the Saudi's will not stop flooding the market.
EVERY American should note that it is OUR government who attacks US Domestic energy, not Saudi's
as has been claimed. It's not an attack on shale oil, it's an attack on Russia where American
energy is a victim.
BWINKLEJMOOSE 32 minutes ago
Well, my 35 plus years in the industry, including 15 years in crude and natural gas trading, tell
me that OPEC will say they will cut then cheat like crazy. Don't look for much in the way of real
cuts.
Joe 40 minutes ago
One of the world's most astute analysts of the Middle East doubts OPEC nations will cut oil production
as they pledged to do on Sept. 28.
Huh? Petraeus is one of the worlds most astute analysts? I thought he was a General?
Jabberwocky 47 minutes ago
--The Clintons and the Bushes are much closer than they let on. Why? Because they are all highly
paid operatives for the Sunni Muslim Leaders in the Middle East Oil Countries.
--Don't believe it? Our government knew all along that Sunnis are all radical Islamists. Our
national leaders are never without factual information, especially when it is that obvious. It's
public record, Hillary received 100 million dollars from those Sunni Leaders. She called for more
"Arab Spring" while constantly labeling the Sunni Killer Mobs as "democracy loving protestors".
And how many millions in his secret Swiss bank account, would it take for Bush, our standing president
at that time, holding hands and to kiss the Saudi leader? How can that happen with a US President?
There are pictures. Search---GW kisses Saudi image
--Now....think about how much this bunch of US presidents have done for rich Sunni Muslim Middle
East Leaders over these many years. All those secular dictators across the Middle East were enemies
of these rich Sunni Muslim Leaders. Now ALL those secular dictators have been challenged and many
were killed by millions of Sunni Muslim thugs during "Arab Spring". Trying to establish Sharia
Law like that which is law in their rich benefactor, the Holy Saudi Arabian Kingdom. Also in Qatar,
Kuwait, Oman, Bahrain, and The United Arab Emirates (Dubai). All are in the same oil-rich vicinity
and neighbors to one another. EACH AND EVERY ONE of these Sunni Nations, I have listed, have donated
many millions to the Clinton Foundation.
Funding Pro 1 hour ago
Russia isn't a member of OPEC Rick - and another tip, you might mention that the OPEC countries
are mostly welfare states, and can't keep prices this low forever. Oh, and that from a supply
perspective, the U.S. is now energy-independent.
BobbyD 2 hours ago
Wasn't Obama getting Iran into the game brilliant in getting the price of oil down! I pay $2.50
a gallon for gasoline.
Alex 2 hours ago
Obama out-maneuvered OPEC every step of the way. Pump prices don't lie. Thank you, Obama!
J 4 hours ago
He must be short on oil stocks. The common man is stuck in the middle having to pay more at
the pumps no matter what all these greedy leeches say.
"... Of course the root cause is Baathists aligned with non Sunnis running a sector of land lusted after by the Saudis and GCC. ..."
"... That the US supported the Sunnis (since the Iranians ousted CIA puppets) against the Baathists did not start the civil war, it merely keeps it growing in lust for death and destruction. ..."
"... While that Sep 2012 skirmish in Benghazi included CIA ground troops otherwise there securing the sea lanes supporting Syrian Al Qaeda with Qaddafi's arms, less stingers. ..."
"... "Settle for the crooked, Wall St, war monger because real change is too hard and the other guy is insane, supported by racists and don't think Russia should praise American exceptionalism." ..."
"As for Syria, here too I'm not sure why you think this country caused its civil war, but it
did not."
Of course the root cause is Baathists aligned with non Sunnis running a sector of land lusted
after by the Saudis and GCC.
That the US supported the Sunnis (since the Iranians ousted CIA puppets) against the Baathists
did not start the civil war, it merely keeps it growing in lust for death and destruction.
While that Sep 2012 skirmish in Benghazi included CIA ground troops otherwise there securing
the sea lanes supporting Syrian Al Qaeda with Qaddafi's arms, less stingers.
ilsm August 31, 2016 9:44 pm
"Settle for the crooked, Wall St, war monger because real change is too hard and the other
guy is insane, supported by racists and don't think Russia should praise American exceptionalism."
Obama might as well have voted with Hillary for AUMF forever, he is running it.
"... If you're wondering why a large portion of American consumers are strung out and breathless and have trouble spending more and cranking up the economy, here's the New York Fed with an answer. And it's going to get worse. ..."
"... That the real median income of men has declined 4% since 1973 is an ugly tidbit that the Census Bureau hammered home in its Income and Poverty report two weeks ago, which I highlighted in this article – That 5.2% Jump in Household Income? Nope, People Aren't Suddenly Getting Big-Fat Paychecks – and it includes the interactive chart below that shows how the real median wage of women rose 36% from 1973 through 2015, while it fell 4% for men... ..."
"... Nominal wages are sticky downwards but not real wages. That is why the FED, the banks, the corporate sector and the economists support persistent inflation, i.e. it lowers real wages. The "study" correlating wage growth with aging is one of those empirical pieces by economists to obscure the role of inflation in lowering real wages. ..."
"... Real Wage Growth chart very interesting, crossing negative at about 55 for no college, and 43 for a Bachelor's degree. 43!! Not even halfway through a work-life, and none better since 2003 at best. ..."
By Wolf Richter, a San Francisco based executive, entrepreneur, start up specialist, and
author, with extensive international work experience. Originally published at
Wolf Street.
The New York Fed published an eye-opener of an article on its blog,
Liberty Street Economics , seemingly about the aging of the US labor force as one of the big
economic trends of our times with "implications for the behavior of real wage growth." Then it explained
why "negative growth" – the politically correct jargon for "decline" – in real wages is going to
be the new normal for an ever larger part of the labor force.
If you're wondering why a large portion of American consumers are strung out and breathless and
have trouble spending more and cranking up the economy, here's the New York Fed with an answer. And
it's going to get worse.
The authors looked at the wages of all employed people aged 16 and older in the Current Population
Survey (CPS), both monthly data from 1982 through May 2016 and annual data from 1969 through 1981.
They then restricted the sample to employed individuals with wages, which boiled it down to 7.6 million
statistical observations.
Then they adjusted the wages via the Consumer Price Index to 2014 dollars and divide the sample
into 140 different "demographic cohorts" by decade of birth, sex, race, and education. As an illustration
of the principles at work, they picked the cohort of white males born in the decade of the 1950s.
That the real median income of men has declined 4% since 1973 is an ugly tidbit that the Census
Bureau hammered home in its Income and Poverty report two weeks ago, which I highlighted in this
article –
That 5.2% Jump in Household Income? Nope, People Aren't Suddenly Getting Big-Fat Paychecks –
and it includes the interactive chart below that shows how the real median wage of women rose 36%
from 1973 through 2015, while it fell 4% for men...
The number of public companies have been cut in half in the last 20 years. Just for one metric.
So for those born in the 50's, reaching middle or senior management by the time they were in
their mid 40's (1999) was increasingly harder as the probability of getting squeezed out multiplied.
In the last ten years, the birth / death rate of startups / small business has reversed as well.
There is probably ten other examples of why age is not the mitigating criteria for the decline
in wages. It's not skill sets, not ambition, not flexibility. Pure number of chances for advancement
and therefore associated higher wages has declined precipitously.
Anti Trust Enforcement went out the window as Neo-Liberal policies converted to political donations
for promoting consolidation.
Now watch even those in their 20-30 age group will experience the same thing as H-1b unlimited
takes hold with the Obama / Clinton TTP burning those at younger demographics. Are you going to
say they are "too old" as well to write software?
Tell me where you want to go, and I will focus on selective facts and subjective interpretation
of those selective facts to yield the desired conclusions.
Barack Peddling Fiction Obama – BS at the B.L.S. – has a multiplicity of these metrics.
Nominal wages are sticky downwards but not real wages. That is why the FED, the banks, the
corporate sector and the economists support persistent inflation, i.e. it lowers real wages. The
"study" correlating wage growth with aging is one of those empirical pieces by economists to obscure
the role of inflation in lowering real wages.
Real Wage Growth chart very interesting, crossing negative at about 55 for no college, and
43 for a Bachelor's degree. 43!! Not even halfway through a work-life, and none better since 2003
at best.
Peter K. :
September 27, 2016 at 06:45 AM DeLong on helicopter money: "The swelling wave of argument and
discussion around "helicopter money" has two origins:
First, as Harvard's Robert Barro says: there has been no recovery since 2010.
The unemployment rate here in the U.S. has come down, yes. But the unemployment rate has come
down primarily because people who were unemployed have given up and dropped out of the labor force.
Shrinkage in the share of people unemployed has been a distinctly secondary factor. Moreover, the
small increase in the share of people with jobs has been neutralized, as far as its effects on how
prosperous we are, by much slower productivity growth since 2010 than America had previously seen,
had good reason to anticipate, and deserves.
The only bright spot is a relative one: things in other rich countries are even worse.
..."
I thought Krugman and Furman were bragging about Obama's tenure.
"Now note that back in 1936 [John Maynard Keynes had disagreed][]:
"The State will have to exercise a guiding influence... partly by fixing the rate of interest,
and partly, perhaps, in other ways.... It seems unlikely that the influence of banking policy on
the rate of interest will be sufficient by itself.... I conceive, therefore, that a somewhat comprehensive
socialisation of investment will prove the only means of securing an approximation to full employment;
though this need not exclude all manner of compromises and of devices by which public authority will
co-operate with private initiative..."
By the 1980s, however, for Keynes himself the long run had come, and he was dead. The Great Moderation
of the business cycle from 1984-2007 was a rich enough pudding to be proof, for the rough consensus
of mainstream economists at least, that Keynes had been wrong and Friedman had been right.
But in the aftermath of 2007 it became very clear that they-or, rather, we, for I am certainly
one of the mainstream economists in the roughly consensus-were very, tragically, dismally and grossly
wrong."
DeLong sounds very much left rather than center-left. His reasons for supporting Hillary over
Sanders eludes me.
Hillary's $275 billion over 5 years is substantially too small as center-leftist Krugman put it.
Now we face a choice:
Do we accept economic performance that all of our predecessors would have characterized as grossly
subpar-having assigned the Federal Reserve and other independent central banks a mission and then
kept from them the policy tools they need to successfully accomplish it?
Do we return the task of managing the business cycle to the political branches of government-so
that they don't just occasionally joggle the elbows of the technocratic professionals but actually
take on a co-leading or a leading role?
Or do we extend the Federal Reserve's toolkit in a structured way to give it the tools it needs?
Helicopter money is an attempt to choose door number (3). Our intellectual adversaries mostly
seek to choose door number (1)-and then to tell us that the "cold douche", as Schumpeter put it,
of unemployment will in the long run turn out to be good medicine, for some reason or other. And
our intellectual adversaries mostly seek to argue that in reality there is no door number (3)-that
attempts to go through it will rob central banks of their independence and wind up with us going
through door number (2), which we know ends badly..."
------------
Some commenters believe more fiscal policy via Congress is politically more realistic than helicopter
money.
I don't know, maybe they're right. I do know Hillary's proposals are too small. And her aversion
to government debt and deficit is wrong given the economic context and market demand for safe assets.
"Moreover, the small increase in the share of people with jobs has been neutralized, as far as
its effects on how prosperous we are, by much slower productivity growth since 2010 than America
had previously seen, had good reason to anticipate, and deserves."
?????? The rate of (measured) productivity growth is not all that important. What has happened
to real median income.
And why are quoting from Robert Barro who is basically a freshwater economist. Couldn't you
find somebody sensible?
Barro wants us to believe we have been at full employment all along. Of course that would mean
any increase in aggregate demand would only cause inflation. Of course many of us think Barro
lost it years ago.
These little distinctions are alas lost on PeterK.
[1] Do we accept economic performance that all of our predecessors would have characterized
as grossly subpar-having assigned the Federal Reserve and other independent central banks a mission
and then kept from them the policy tools they need to successfully accomplish it?
[2] Do we return the task of managing the business cycle to the political branches of government-so
that they don't just occasionally joggle the elbows of the technocratic professionals but actually
take on a co-leading or a leading role?
[3] Or do we extend the Federal Reserve's toolkit in a structured way to give it the tools
it needs?
Helicopter money is an attempt to choose door number (3). Our intellectual adversaries mostly
seek to choose door number (1)-and then to tell us that the "cold douche", as Schumpeter put it,
of unemployment will in the long run turn out to be good medicine, for some reason or other. And
our intellectual adversaries mostly seek to argue that in reality there is no door number (3)-that
attempts to go through it will rob central banks of their independence and wind up with us going
through door number (2), which we know ends badly...""
---------------------
Conservatives want 1 and 2 ends badly, so 3 is the only choice.
"... As General Smedley Butler, twice awarded the Medal of Honor, said: War is a racket . Wars will persist as long as people see them as a "core product," as a business opportunity. In capitalism, the profit motive is often amoral; greed is good, even when it feeds war. Meanwhile, the Pentagon is willing to play along. It always sees "vulnerabilities" and always wants more money. ..."
"... Wars are always profitable for a few, but they are ruining democracy in America. Sure, it's a business opportunity: one that ends in national (and moral) bankruptcy. ..."
A good friend passed along an
article at Forbes from a month ago with the pregnant title, "U.S. Army Fears Major War Likely
Within Five Years - But Lacks The Money To Prepare." Basically, the article argues that war is possible
- even likely - within five years with Russia or North Korea or Iran, or maybe all three, but that
America's army is short of money to prepare for these wars. This despite the fact that America spends
roughly $700 billion each and every year on defense and overseas wars.
Now, the author's agenda is quite clear, as he states at the end of his article: "Several of the
Army's equipment suppliers are contributors to my think tank and/or consulting clients." He's writing
an alarmist article about the probability of future wars at the same time as he's profiting from
the sales of weaponry to the army.
As General Smedley Butler, twice awarded the Medal of Honor, said:
War is a racket
. Wars will persist as long as people see them as a "core product," as a business opportunity.
In capitalism, the profit motive is often amoral; greed is good, even when it feeds war. Meanwhile,
the Pentagon is willing to play along. It always sees "vulnerabilities" and always wants more money.
But back to the Forbes article with its concerns about war(s) in five years with Russia or North
Korea or Iran (or all three). For what vital national interest should America fight against Russia?
North Korea? Iran? A few quick reminders:
#1: Don't get involved in a land war in Asia or with Russia (Charles XII, Napoleon, and Hitler
all learned that lesson the hard way).
#2: North Korea? It's a puppet regime that can't feed its own people. It might prefer war to distract
the people from their parlous existence.
#3: Iran? A regional power, already contained, with a young population that's sympathetic to America,
at least to our culture of relative openness and tolerance. If the US Army thinks tackling Iran would
be relatively easy, just consider all those recent "easy" wars and military interventions in Iraq,
Afghanistan, Libya, Syria
Of course, the business aspect of this is selling the idea the US Army isn't prepared and therefore
needs yet another new generation of expensive high-tech weaponry. It's like convincing high-end consumers
their three-year-old Audi or Lexus is obsolete so they must buy the latest model else lose face.
We see this all the time in the US military. It's a version of planned or
artificial obsolescence . Consider the Air Force. It could easily defeat its enemies with updated
versions of A-10s, F-15s, and F-16s, but instead the Pentagon plans to spend as much as $1.4 trillion
on the shiny new and
under-performing F-35 . The Army has an enormous surplus of tanks and other armored fighting
vehicles, but the call goes forth for a "new generation." No other navy comes close to the US Navy,
yet the call goes out for a new generation of ships.
The Pentagon mantra is always for more and better, which often turns out to be for less and much
more expensive, e.g. the F-35 fighter.
Wars are always profitable for a few, but they are
ruining democracy in America. Sure, it's a business opportunity: one that ends in national (and
moral) bankruptcy.
William J. Astore is a retired lieutenant colonel (USAF). He taught history for fifteen years
at military and civilian schools and blogs at
Bracing Views . He can be reached at [email protected]. Reprinted
from Bracing Views with the author's permission.
San Fran Fed president calls for fiscal policy as automatic
stabilizer:
.......................
Turning to policies that can help stabilize the economy
during a downturn, countercyclical fiscal policy should be
our equivalent of a first responder to recessions, working
hand-in-hand with monetary policy. Instead, it has too often
been stuck in a stop-and-go cycle, at times complementing
monetary policy, at times working against it. This is not
unique to the United States; Japan, and Europe have also
fallen victim to fiscal consolidation in the midst of an
economic downturn or incomplete recovery.
One solution to this problem is to design stronger, more
predictable, systematic adjustments of fiscal policy that
support the economy during recessions and recoveries
(Williams 2009, Elmendorf 2011, 2016). These already exist in
the form of programs such as unemployment insurance but are
limited in size and scope. Some possible ideas for the United
States include Social Security and income tax rates that move
up or down in relation to the national unemployment rate, or
federal grants to states that operate in the same way. Such
approaches could be designed to be revenue-neutral over the
business cycle; they also could avoid past debates over
fiscal stimulus by separating decisions on countercyclical
policy from longer-run decisions about the appropriate role
of the government and tax system. Indeed, economists across
the political spectrum have championed these ideas (Elmendorf
and Furman 2008, Taylor 2000, 2009).
.......................
http://www.frbsf.org/economic-research/publications/economic-letter/2016/august/monetary-policy-and-low-r-star-natural-rate-of-interest/
Are some people waking up a little bit? Will they totally
wake up?
"Turning to policies that can help stabilize the economy
during a downturn, countercyclical fiscal policy should be
our equivalent of a first responder to recessions".
Mother Agnes Mariam
, a nominee for the 2014 Nobel Peace Prize from Homs diocese, has some harsh
words
for the US war against Syria
: "Shame on a coalition who pretends fighting ISIS while in reality is helping ISIS killing innocent
soldiers whose mission is to protect civilians."
This is in response to the September 17 US airstrikes in Deir ez-Zor that massacred 62 Syrian
soldiers and injured 100 more who have been fighting ISIS.
[1] According to a June 2015
Time magazine
article, Deir ez-Zor with a population of 228,000 has been under
siege by ISIS
the past years, relying on the nightly arrival of a large Syrian air-force-operated cargo plane which
has a payload of more than 46 tons and transports munitions, food and medical supplies.
Starving babies in Deir ez-Zor
This much needed aid is flown out from the military air base southeast of the city, the target
of ISIS the past years and now bombed by US jet fighters. During the bombing, ISIS launched a simultaneous
attack and threatened to overrun the air base as well as slaughter the over 200,000 civilians. Deir
ez-Zor is also home to a large
Christian population protected by the Syrian government, similar to most other Christian inhabited
cities that are in government-controlled areas along the coast.
Map of Christian population in Syria
However, the Syrian army was able to repel the ISIS offensive and recover lost territory after
the US "mistaken" attacks, but the incident has again left many wondering whether US goal is really
to counter terrorism or to conduct
regime change
in Syria.
Meanwhile, the Syrian people continue to face prolonged agony and suffering as regional and great
powers use them as pawns for their geopolitical ambitions.
E
dward Dark , an activist in
Aleppo , noted back in 2013 that Syrians watched how their peaceful revolution was hijacked by
Turkey/Saudi and other Arab Gulf states, pouring in Salafists from over
100 countries
that morphed into ISIS, Al Nusra, and others that care nothing for the norms of human rights,
democracy, or justice for the Syrian nation. He admitted, "People here don't like the regime, but
they hate the rebels even more."
Now Dark sees Syria's only salvation is through reconciliation and a renunciation of violence,
but lamented "that is not a view shared by the warmongers and power brokers who still think that
more Syrian blood should be spilled to appease the insatiable appetites of their sordid aspirations."
A girl helping her dad with his shoe
Just as King Solomon determined the true mother of the baby is the one who refused to split her
son in half, the champion of the Syrian people and human rights is the power that would place the
Syrians' welfare above its own selfish ambitions.
Nonetheless, Dark lamented that "Whatever is left of Syria at the end will be carved out between
the wolves and vultures that fought over its bleeding and dying corpse, leaving us, the Syrian people
to pick up the shattered pieces of our nation and our futures."
Indeed, it seems US and its Salafist allies are bent on splitting the Syrian baby and cleansing
it of ethnic and religious minorities with a Taliban-like regime and Shaira Law, and Deir ez-Zor
is likely condemned to suffer the similar fate of Homs.
In Homs, the pre-conflict population was more than 1 million people of mostly Sunni Muslims with
substantial Christian and Alawite communities. Peter Crowley, senior foreign affairs correspondent
at Politico , in August 2015 tweeted an
extract from a 2008 Lonely Planet travel guide of Homs.
"These days, its Christian neighborhood is one of Syria's most welcoming and relaxed, and Homs'
citizens are some of the country's friendliest…That, combined with the city's myriad leafy parks
and gardens, sprawling al fresco coffee shop, outdoor corn-on-the-cob stands and restored souq where
artisans still work, make Homs a wonderful place to kick back for a couple of days."
In eight years, Homs has changed from a "wonderful place" to a ruinous heap. With the ceasefire
likely to break down as Salafist rebels rearm and regroup, US and Saudi/Qatar/Turkey are well on
the march towards turning Syria into another Afghanistan in the Mediterranean.
[1] Nancy A. Youssef, "Did the U.S. Just Slaughter Syrian Troops?
The Daily Beast , September 18, 2016.
Dr. Christina Lin is a Fellow at the Center for Transatlantic Relations
at SAIS-Johns Hopkins University where she specializes in China-Middle East/Mediterranean relations,
and a research consultant for Jane's Chemical, Biological, Radiological, and Nuclear Intelligence
Centre at IHS Jane's.
[Sep 16, 2016] There is no alternative to austerity under neoliberalism
likbez,
there is no alternative to austerity under neoliberalism. And thus
stagnation.
Ideology of neoliberalism does not permit state intervention and consider
it as a threat to neoliberal order.
In addition to that, in the USA military expenses prevent forming Reserve
fund during expansion that can be used during recessions.
As financial institutions are the "head" in neoliberal organism, warm
blood in the form of money should go to the head even if the other parts
of the organism are cold and freezing.
This is weak. The energy factor is completely missing from the discussion. Also
the crisis of neoliberalism due to redistribution of wealth up, which suppress the
growth is never mentioned. But what you can expect from a such a stalwart neoliberal
publication as Economist.
Notable quotes:
"... Either way, the trend is clear; nominal GDP growth has slowed below 4% a year, real GDP growth below 2% (in Italy, it is negative). ..."
"... Below are the numbers from the OECD for the old age support ratio, the number of workers aged 20-64 relative to those aged over 65. ..."
"... As you can see, things are going to get a lot worse, rather than better. Why is old age dependency a problem? After all, a lower birth rate means there are fewer dependent children. Yes, but the cost to society of old people is greater, once you factor in pensions, healthcare, nursing home care and increased longevity (a 65 year old can expect to live for 20 years or more). ..."
"... Crucially, the workforce is no longer growing; indeed it is expected to shrink in Italy, Germany and Japan. The EU is set to lose 40m workers over the next 40 years ; without immigration, that would be a 96m decline. ..."
"... Economic growth consists of having more workers and making them work more efficiently (productivity). Even if one is not as pessimistic as Robert Gordon about technological change, one can see that productivity will have to work very hard indeed to offset demography. ..."
"... Larry Summers noted that those periods which tended to have rapid economic growth were also marked by the build-up of debt and asset bubbles ..."
"... the record of industrial countries over the last 15 years is profoundly discouraging as to the prospect of maintaining substantial growth with financial stability ..."
"... Sometimes bubbles can have positive economic impacts; the railways and canals were built in a flurry of speculation in the 19th century. Many investors lost money but the economy gained from the increased capacity and lower transport costs. The economic benefits of property booms are not as great, especially if the effect is to create derelict apartments and houses (eg Ireland and Spain). ..."
here has been much talk in recent months of "secular stagnation" after the
former Treasury secretary Larry Summers
made a speech on the issue in February. As you can see the problem for the
developed world has not arisen overnight. The chart shows the rolling 10-year
growth rate for leading economies in both real and nominal terms. This smooths
out the effect of the economic cycle. Either way, the trend is clear; nominal
GDP growth has slowed below 4% a year, real GDP growth below 2% (in Italy, it
is negative).
There are many potential explanations for this shift, but the most plausible
relates to demography. Growth was rapid in the aftermath of the Second World
War, as Europe was reconstructed, and some of the benefits of pre-war technological
change filtered through to the economy; then from the mid-1960s onwards, the
baby boomers joined the workforce. But the birth rate fell and the baby boomers
are retiring. Below are the numbers from the OECD for the old age support ratio,
the number of workers aged 20-64 relative to those aged over 65.
1950 1980 2010 2050 (projected)
US 6.97 5.04 4.59 2.53
UK 5.58 3.74 3.59 2.14
Germany 6.26 3.68 2.91 1.54
France 5.13 3.96 3.50 2.04
Italy 6.99 4.21 3.00 1.46
Japan 9.98 6.67 2.57 1.27
As you can see, things are going to get a lot worse, rather than better.
Why is old age dependency a problem? After all, a lower birth rate means there
are fewer dependent children. Yes, but the cost to society of old people is
greater, once you factor in pensions, healthcare, nursing home care and increased
longevity (a 65 year old can expect to live for 20 years or more).
Crucially, the workforce is no longer growing; indeed it is expected to shrink
in Italy, Germany and Japan. The EU is
set to lose 40m workers over the next 40 years; without immigration, that
would be a 96m decline.
Economic growth consists of having more workers and making them work more
efficiently (productivity). Even if one is not as
pessimistic as Robert Gordon about technological change, one can see that
productivity will have to work very hard indeed to offset demography.
What about the other factors? Larry Summers noted that those periods which
tended to have rapid economic growth were also marked by the build-up of debt
and asset bubbles, or as he put it
the record of industrial countries over the last 15 years is profoundly
discouraging as to the prospect of maintaining substantial growth with financial
stability
Sometimes bubbles can have positive economic impacts; the railways and canals
were built in a flurry of speculation in the 19th century. Many investors lost
money but the economy gained from the increased capacity and lower transport
costs. The economic benefits of property booms are not as great, especially
if the effect is to create derelict apartments and houses (eg Ireland and Spain).
Why have so many bubbles built up recently? One key factor seems to be
the decline in the level of real interest rates (this is the focus of the Summers
essay); lower real rates have encouraged investment in financial assets for
all sorts of reasons.*
Summers argues that a number of factors have pushed down real rates: companies
have reduced demand for debt, in part because the new breed of tech companies
has less need for capital investment; slower population growth is associated
with lower real rates; wider inequality means more income in the hands of the
rich, who save more than the poor and central banks have also accumulated vast
reserves (a greater supply of savings means a lower real rate, other things
being equal).
John Jenkins conveniently forgot export of Islamic extremists from Saudi
Arabia during Soviet occupation of Afghanistan and the USA and GB role in creation
of political Islam. I can't see any neo-Westphalian pragmatism of the Saudi state
in its actions in Syria and support of Turkey slide into islamization. But his point
that Iran does not represent a secular state either is well taken. It's just Shias
fundamentalism instead of Sunni fundamentalism.
Notable quotes:
"... There is no clear link between economic deprivation and radicalization. But the former doesn't help if it leads to idle hands and claims of social injustice. ..."
"... Sheikh Nimr advocated the destruction of the rulers of Saudi Arabia and Bahrain and the secession of the Eastern Province. His version of a righteous Islamic state is not a thousand miles from that of Abu Bakr al-Baghdadi (and a long way from the non-takfiri, non-caliphal, neo-Westphalian pragmatism of the Saudi state). He called for wilayat al-faqih, the heterodox Guardianship of the Jurisprudent espoused by Khomeini. ..."
"... The vengeful early years of the Islamic Republic, when clerics who previously would not have hurt a fly enthusiastically participated in the judicial murder of thousands in the name of righteousness, show some of the consequences. So does the arrest and humiliating mistreatment in 1982 of the venerable Ayatollah Shariatmadari, who stood up to Khomeini and dared to object to the implementation of any Islamic hudud punishments in the absence of the Hidden Imam. So does the continued rate of executions in Iran (nearly 700 by July last year, according to Amnesty International) and the Islamic Republic's own treatment of dissidents – and, indeed, of the ordinary protesters of 1999, 2009 and 2011. ..."
"... To Iran it was: Saudi citizens owe loyalty in tribal fashion to their king, not to foreign religious leaders or to some ideal of transnational Islamism, and we shall not tolerate interference. To the rest of the world it was: we shall not bend in the face of the storms raging round the region, if necessary alone. ..."
Now the Saudis face a period of sustained low energy prices at a time when
the costs of a newly interventionist and expeditionary foreign policy are rising
dramatically and when the need to restructure the economy to create perhaps
an extra four million new jobs by 2020 has become urgent. At the same time they
know that a small but significant section of the Sunni population of the kingdom
is vulnerable to the dark seductions of Islamic State, because they regard it
as more legitimately Islamic, or as the only organized Sunni group pushing back
against Iran, the Shia, or both. There is no clear link between economic
deprivation and radicalization. But the former doesn't help if it leads to idle
hands and claims of social injustice.
To cap it all, the Iranian nuclear deal angered the Saudis not because it
was a nuclear deal but because it was simply a nuclear deal, failing in their
view to address malign and subversive non-nuclear Iranian activities in Bahrain,
Iraq, Syria, Lebanon and Yemen, and rewarding Iran prematurely. They have felt
very abandoned by the US and other Western states. And they believe the apparent
pragmatism of the Rowhani government is a façade, offering privileged access
in return for the suspension of any critical faculty. That makes the issue of
the Vienna peace talks on Syria secondary. There will certainly be an impact.
Yet it is not as if the Saudis had disguised their deep scepticism. They had
been pressured to sit with the Iranians, but they had also insisted on continuing
to support opposition forces in the field and have not wavered in their insistence
that Assad needs to go.
You might think this is all special pleading. But before you say that the
matter is a straightforward one of a benighted justice system administering
medieval punishments to dissidents, reflect on this. Sheikh Nimr advocated
the destruction of the rulers of Saudi Arabia and Bahrain and the secession
of the Eastern Province. His version of a righteous Islamic state is not a thousand
miles from that of Abu Bakr al-Baghdadi (and a long way from the non-takfiri,
non-caliphal, neo-Westphalian pragmatism of the Saudi state). He called for
wilayat al-faqih, the heterodox Guardianship of the Jurisprudent espoused by
Khomeini.
The vengeful early years of the Islamic Republic, when clerics who previously
would not have hurt a fly enthusiastically participated in the judicial murder
of thousands in the name of righteousness, show some of the consequences. So
does the arrest and humiliating mistreatment in 1982 of the venerable Ayatollah
Shariatmadari, who stood up to Khomeini and dared to object to the implementation
of any Islamic hudud punishments in the absence of the Hidden Imam. So does
the continued rate of executions in Iran (nearly 700 by July last year, according
to Amnesty International) and the Islamic Republic's own treatment of dissidents
– and, indeed, of the ordinary protesters of 1999, 2009 and 2011.
The signals the Saudi state sought to send by executing 43 Saudi Sunnis convicted
of terrorism at the same time as Sheikh Nimr and his three fellow Shias reflected
all of this.
To their own citizens the message was: we shall enforce the judgment
of the courts on all those who seek to undermine the stability of the kingdom
and the legitimacy of its government, irrespective of sect, and on your
behalf we shall resist Iranian expansionism and Islamic State predation
with equal vigour.
To Iran it was: Saudi citizens owe loyalty in tribal fashion to
their king, not to foreign religious leaders or to some ideal of transnational
Islamism, and we shall not tolerate interference. To the rest of the world
it was: we shall not bend in the face of the storms raging round the region,
if necessary alone.
John Jenkins is a former British ambassador to Saudi Arabia, Libya, Iraq,
Syria and Burma. He is now executive director (Middle East) of the International
Institute for Strategic Studies, and is based in Bahrain
"... The deficit obsession that governments have shown since 2010 has helped produce a recovery that has been far too slow, even in the US. ..."
"... The Zero Lower Bound (ZLB) raises an acute problem for what I call the consensus assignment (leaving macroeconomic stabilisation to an independent, inflation targeting central bank), but add in austerity and you get major macroeconomic costs. ICBs appear to rule out the one policy (money financed fiscal expansion) that could combat both the ZLB and deficit obsession. ..."
Simon Wren-Lewis has a follow-up to his recent post on central bank independence:
The 'strong case' critically examined : Perhaps it was too unconventional
setting out an argument (against independent central banks, ICBs) that
I did not agree with, even though I made it abundantly clear that was what
I was doing. It was too much for one blogger, who reacted by deciding that
I did agree with the argument, and sent a series of tweets that are best
forgotten. But my reason for doing it was also clear enough from the final
paragraph. The problem it addresses is real enough, and the problem appears
to be linked to the creation of ICBs.
The deficit obsession that governments have shown since 2010 has
helped produce a recovery that has been far too slow, even in the US.
It would be nice if we could treat that obsession as some kind of aberration,
never to be repeated, but unfortunately that looks way too optimistic.
The Zero Lower Bound (ZLB) raises an acute problem for what I call
the consensus assignment (leaving macroeconomic stabilisation to an independent,
inflation targeting central bank), but add in austerity and you get major
macroeconomic costs. ICBs appear to rule out the one policy (money financed
fiscal expansion) that could combat both the ZLB and deficit obsession.
I wanted to put that point as strongly as I could. Miles Kimball does
something similar
here , although without the fiscal policy perspective ...
Skipping ahead (and omitting quite a bit of the argument):
... The basic flaw with my strong argument against ICBs is that the ultimate
problem (in terms of not ending recessions quickly) lies with governments.
There would be no problem if governments could only wait until the recession
was over (and interest rates were safely above the ZLB) before tackling
their deficit, but the recession was not over in 2010. Given this failure
by governments, it seems odd to then suggest that the solution to this problem
is to give governments back some of the power they have lost. Or to put
the same point another way, imagine the Republican Congress in charge of
US monetary policy.
But if abolishing ICBs is not the answer to the very real problem I set
out, does that mean we have to be satisfied with the workarounds? One possibility
that a few economists
like Miles Kimball have argued for is to effectively abolish paper money
as we know it, so central banks can set negative interest rates. Another
possibility is that the government (in its saner moments) gives ICBs
the power to undertake helicopter money.
Both are complete solutions to
the ZLB problem rather than workarounds. Both can be accused of endangering
the value of money. But note also that both proposals gain strength from
the existence of ICBs: governments are highly unlikely to ever have the
courage to set negative rates, and ICBs stop the flight times of helicopters
being linked to elections.
These are big (important and complex) issues. There should be no taboos
that mean certain issues cannot be raised in polite company. I still think
blog posts are the best medium we have to discuss these issues, hopefully
free from distractions like partisan politics.
If, as the IEA believes, oil prices average about $55/bbl in 2015 and not reach
$73 until 2020, a lot of assumptions will have to be modified: Because, these
prices are clearly well below those needed to justify investment in and exploitation
of expensive-oil options like tar sands and Arctic oil.
It seems to me as if a new reality is being signaled by the many recently
stalled or cancelled mega-projects. For example, Shell has abandoned plans for
a huge petrochemical plant in Qatar; Chevron shelved its plan to drill in the
Beaufort; and, Statoil has turned its back on Greenland. If Majors are moving
away from expensive future projects it's probably because they doubt their viability,
not because they can't raise the cash.
And committing to mega-projects is committing to a predictable future. Could
it be that Big Oil has decided the next decade contains too many unknowns: AGW
issues, upsurge in renewables, a mega recession, you name it? Or, maybe they've
just discovered Ron's Blog?<
The EIA lies. Your posts comparing Texas oil production vs. the EIA's
report of Texas oil production highlights the growing lies from the EIA.
Each month the EIA adds roughly 50k/b/d for at least the last 12 months.
How can that be? Texas has been dropping rigs almost as fast as North Dakota.
Their production has surely been dropping now and quite probably since January.
The EIA and IEA work for banksters trying to destroy the oil industry
so they can buy it up cheap . Next month, Goldman Sacks is starting
a distressed energy bond fund. How convenient that they and the media and
the EIA and IEA paint a bearish picture of oil fundamentals now.
That's a good find. It looks like it adds up (among Goldman, Blackstone
and others) to about $25 Billion and the word is energy, not shale. The
Goldman offering is not all junk bonds, either.
This doesn't look like the required bailout, but it's definitely money
risked - maybe with people like Transocean.
A Bit off topic, but thought I would share the newest interview on the
Russia-Ukraine-USA-Europe situation by John Bachelor and Prof. Stephen Cohen.
Normally, Prof. Cohen does a weekly interview, but was off for 10 days as
he and another U.S. Professor, experts on Russia, spoke to a large group
of German Bankers last week on the subject of Russia & the Ukraine.
Listen to what a former joint chiefs of staff member, a major general-
a true and utter moron, really and actually- said a few days ago: https://www.youtube.com/watch?v=b6Nnn8S1XbE
Sadly, he and people akin to him lead this country now…
That is the real reason I commented (in response to Dennis and Mac) in an
earlier post that there will be no market for oil or anything in 2030-2050.
Oil is falling again and when, this time, what was drilled and put on line
BEFORE oil reached $50-$60 peaks and starts the 40%-80% per year decline
rate shale oil well "army", the morons like the general in the video will
gain ground…and then power….and then russians (or chinesse, or anybody)
and Putin shall be the "devil" that crushed our economy….and the false flag
type of events whe marines are floating drowned in blood killed by the "evil
Putin" soldiers are going to make the fat moronic masses "patriotic"…and
then, the 99.99% brainwashed, fat moronic herd who think that our soldiers
are fighting for our freedom will "volunteer" to go to war and defeat the
ennemy.
As alwayz, they shall be blissfully ignorant of the fact that "the ennemy"
this time has more nucelarweapons than us and we all shall lose.
It is an unwineable war!
And us few who say otherwise shall be the unpatriotic "spies" who must be
eleminated…because "generals" like the one in the video and crowds who dump
vodka on the streets (like they did with french wine in 2003 when french
refused to join bush-chenney in irak) will take over.
The everlasting historic lesson:
"when all fails, govt takes you to war!"
Even your beloved gold and silver shall not save us this time….pray.
The next few yoars seem to be very "interesting"
Be well and hedge accordingly!
Petro
P.S.: great article Ron! Thank you for updating us.
US real after-tax income less debt service ("rentier taxes") and "illth"
care (a.k.a. as "dis-ease" or "health" care) spending peaked YoY in Q1-Q2
'14 and rapidly decelerated and contracted YoY in Q3-Q4 '14.
Moreover, the oil and gas extraction and energy-related transport sectors
have heavily skewed higher capital goods orders, business sales, and industrial
production (IP) since 2011-12 to an unsustainable cyclical rate.
It's not surprising, therefore, that retail sales, business sales, orders,
nominal real hourly earnings, and IP/IP mfg. have been falling since last
summer-fall, the point at which the price of oil began crashing. This is
the stuff of cyclical business cycle contractions.
And the point, Mr. BC, one might ask? The powers that be (TPTB) are keenly
aware of the foregoing and know that the US economy is decelerating rapidly
in response to the deflating of the shale bubble, weather and port and refinery
labor strikes notwithstanding, along with the rest of the world economy.
The current cyclical trajectory is not unlike that which occurred in summer
2001 (prior to 9/11) and winter-spring 2008, both instances coinciding with
the US economy having already rolled over into recession.
Thus, the US is due yet another imperial war cycle in order to goose
the goods-producing sector (especially the "defense" sector) in response
to recession, which in turn will justify increasing fiscal deficits, maintenance
of ZIRP/NIRP, and a resumption of the Fed's QEternity/QEn+1 later in the
year.
IOW, economics is politics. Politics is war by other means. The business
of empire is war. War is good business for imperialists. Ergo, economics
is politics is war is the business of empire, and the owners and financial
facilitators, i.e., Wall St. and The City, of Anglo-American-Zionist empire
need another regional (or eventual world) war for business, geopolitical
(say again imperial business), and domestic social control purposes.
Wall St., DC, the Saudi royals, Bibi and his thugs, and the US-UK war
profiteers are maneuvering to release yet again the ravenous hounds of war
for profits and power against "Radical Islam", Putin's Russia, and, if history
and human nature are a guide, eventually a regional war (or Cold War- or
cyberwar) in the Pacific against China.
This begs the question of what kind of "Pearl Harbor-like" event will
be required this time to compel the unsuspecting American and western public
to support (tacitly acquiesce to) the next phase of the never-ending war
for Anglo-American-Zionist, rentier oil empire (in the post-growth, LTG
era)?
Along these lines, I found these words from Malcolm Fraser Ozzie PM '75-'83
interesting:
here's one paragraph snip:
As painful as a reassessment of relations may be for intellectual and policy
elites, there are four principal reasons why one is long overdue. First,
despite much blather about a supposed unanimity of national purpose, the
truth is that the United States and Australia have substantially different
values systems. The idea of American exceptionalism is contrary to Australia's
sense of egalitarianism. Second, we have seen the United States act in an
arbitrary, imprudent and capricious fashion. It has made a number of ill-advised
and ill-informed decisions concerning Eastern Europe, Russia and the Middle
East. Third, at the moment, because of U.S. military installations in Australia,
if America goes to war in the Pacific, it will take us to war as well-without
an independent decision by Australia. Finally, under current circumstances,
in any major contest in the Pacific, our relationship with America would
make us a strategic target for America's enemies. It is not in Australia's
interest to be in that position.
EIA production numbers include NGLs, Texas RRC numbers do not. Texas RRC
acknowledges as much on their website:
The production data in PDQ doesn't match the data I get from the federal
Energy Information Administration. Can you explain the difference?
The Railroad Commission of Texas' crude oil production data reflects
only crude oil produced from oil leases as reported by operators. The Commission's
data does not include condensate, which are liquid hydrocarbons produced
from a gas well. Our data comes directly from production reports filed by
operators.
Peak Oil NOT,
I agree that this web site reports only C+C unless otherwise noted. It is
Ron's site and that is what he wants to report. I appreciate the effort
he puts in especially the graphs.
But total liquids would seem to give a better picture of supply and production
changes. After all NGLs, refinery gain, and the other differences are part
of mix which make the economy produce.
One problem with total liquids is that it is not adjusted for energy
content. The typical barrel of NGL contains only 65% of the energy of crude,
same is true of ethanol. So total liquids adjusted to barrels of oil equivalent
is useful, also some NGL is not really used for energy (ethane is used mostly
as an industrial input in plastic and cryogenic processes, rather than burned
for energy). This is more work than just using C+C data. Also we can use
BP data in tonnes of oil to estimate barrels f oil equivalent.
a carryover thank you …
It read as a sort of age-targeted unemployed-wage-slave flyer/ad for the
unsustainable North Dakota shale/fracking industry, complete with age, income,
corrupted values, etc..
And much more in the crony-capitalist plutarchy global industrial uneconomic
monster– which farts in our general direction, Gerd– and that we just can't
help feeding… with our children, alive (like those two in question if they
are real or part of the monster, or both), as well as with our values, future,
and planet.
Future Economists Will Probably Call
This Decade the 'Longest Depression'
:
... Back before 2008, I used to teach my
students that during a disturbance in
the business cycle, we'd be 40 percent
of the way back to normal in a year. The
long-run trend of economic growth, I
would say, was barely affected by
short-run business cycle disturbances.
There would always be short-run bubbles
and panics and inflations and
recessions. They would press production
and employment away from its long-run
trend -- perhaps by as much as 5
percent. But they would be transitory.
After the shock hit, the economy would
rapidly head back to normal. The
equilibrium-restoring logic and magic of
supply and demand would push the economy
to close two-fifths of the gap to normal
each year. After four years, only a
seventh of the peak disturbance would
remain.
In the aftermath of 2008, Stiglitz was
indeed one of those warning that I and
economists like me were wrong. Without
extraordinary, sustained and aggressive
policies to rebalance the economy, he
said, we would never get back to what
before 2008 we had thought was normal.
"... "I find it curious that anybody would chose a peak oil blog to tout the merits of shale oil, or shale gas, particularly now, when it has its pants down around its knees, its hands overs its privates , but so be it… ..."
"... The real oil and gas business… is very difficult at the moment; we are all working 24/7, confused about the direction of prices, and having to watch every penny we spend, right down to washing poka dot gloves every evening to wear them again the next day… I have had 50 good men ask me for work the past 3 weeks , all coming out of the stinking shale business, with little hope for the future… As you can clearly (lol) tell, I am not a fan of the stinking shale business … I think [it] …has mismanaged my countries limited hydrocarbon resources in a very bad way. It took advantage of cheap money, little risk, absolutely no regard for conservation practices, and drilled itself into a 9 line bind, in my learned opinion. It lied to the American public, misled its work force , borrowed money it cannot pay back and helped drive the price of both oil and natural gas down to levels that will ultimately hurt, not help Americans. Now its all unraveling… Dickheads in the Bakken and Eagle Ford want to export condensate to stay on their drilling hamster wheels; how does selling American resources, cheap, to buy them back tomorrow, from people that hate our guts and want to kill us, help America? It doesn't. It is stupid… I am reminded of numerous times in the history of oil and gas in the United States where an unregulated industry drilled itself literally into oblivion… More recently, the shale gas industry imploded from over drilling and the corresponding collapse of gas prices. My industry cannot seem to keep from making the same mistakes again, over and over. It gets caught up in it own bullshit far too often… I have to lay off a couple of kids today that have been with me for 5 years, one just got married … Is shale oil extraction a resounding success story in America, a benchmark for free-market enterprise? Bullshit . The debt those guys has accumulated would choke a big horse; its begged, borrowed and essentially stole money from grandma's all around the county that bought their stock based on propaganda. It has not made a dime of profit yet. The wealth of retired people who invested in the shale oil business, even people that didn't, is now being decimated because of the shale oil industry. Every stinking shale well drilled uses sufficient fresh water for 168,000 humans to consume in one day and nearly 400 tons of steel. The crop and ranch land that is lost to shale well pads and roads is heart wrenching. All that for a couple of months of $ 2.00 gasoline? … The shale oil industry shot itself in the foot. Along the way it shot me, and thousands of other operators in America, in the back. It is helping to facilitate a train wreck around the world, actually . I have been to West Africa, the ME, all over S. America, everywhere in the world there is oil production and I am telling you straight away, there are now lots of very, very afraid people out there in the world. Hungry, thirsty, sick people whose countries cannot help them any longer. Why? In part because of stinkin' shale oil industry greed. I am mad at them sumbitches this morning… I gotta go let some good kids go . Damn, I hate that… The shale oil industry will not survive 50 dollar oil …Now oil prices are low, and getting lower, and the money tree is going to fall over. Anybody promoting the shale oil industry at this point must be getting paid to do so. …" ..."
"... ~ Mike @ The POB ..."
"... "So long story short don't believe all the negative people saying you should go home now because there are still plenty of jobs around you can get in the Bakken and be making six figures in no time ." ~ dn_girl ..."
"... "We had a proud young woman post yesterday about her… optimism about… future in the oilfields of North Dakota. It is a powerful message that we should have all embraced … She probably won't be back …" ~ Mike ..."
"... "Things are getting tough out here in the oilfield right now, its time for me to get tougher… But this is going to be my last post for awhile." [January 10, 2015 at 12:41 pm] ~ Mike ..."
"... "Mike, I hope my comments didn't tick you off and that's the reason your going to cut back on posting… If I did say something that ticked you off, I am sorry." ~ TechGuy ..."
"... "It is like attacking the soldiers in Iraq because you don't like the lies that caused them to be there." ~ shallow sand ..."
"... "…all forms of organization, regardless of how democratic they may be at the start, will eventually and inevitably develop oligarchic tendencies, thus making true democracy practically and theoretically impossible, especially in large groups and complex organizations. The relative structural fluidity in a small-scale democracy succumbs to 'social viscosity' in a large-scale organization. [Accordingly] …democracy and large-scale organization are incompatible." ~ Wikipedia ..."
"... "The shale oil industry shot itself in the foot. Along the way it shot me, and thousands of other operators in America, in the back. It is helping to facilitate a train wreck around the world, actually… ..."
"... I gotta go let some good kids go. Damn, I hate that… Anybody promoting the shale oil industry at this point must be getting paid to do so …" ~ Mike @ The POB -- "So long story short don't believe all the negative people saying you should go home now because there are still plenty of jobs around you can get in the Bakken and be making six figures in no time ." ~ dn_girl "We had a proud young woman post yesterday about her… optimism about… future in the oilfields of North Dakota. It is a powerful message that we should have all embraced … She probably won't be back …" ~ Mike ..."
"... "The culture as a whole and most of its members are insane." ~ Derrick Jensen ..."
"... embrace that powerful message ..."
"... female ..."
"... (Another fine on-the-fly comment crafted with the Patterson Press™ Comment Editor) ..."
"... I think we should reflect on this. ..."
"... "By the way, what did you make of my "The Mask of the Red Death" allegory post?" ~ Futilitist ..."
Ron, Is it possible the EIA is intentionally trying
to push oil prices down for political reasons? But
has to do some back-peddling in order to try to save
face and retain some credibility. EIA must fully
understand how oil prices react to what they are
saying. They are also a government agency there for
can be used for political purposes. Do you notice a
trend of misinformation coming from the EIA? Have
you ever in the past noticed a trend of
misinformation where maybe the incorrect numbers
coming from the EIA actually pushed prices up
instead of down over any given period of time?
The effects of the price collapse is beginning
to take a serious bite out of Canadian tar sands
exploration and extraction activity. Last week's
rig count in Canada dropped by 80, according to
the most recent Baker Hughes report. Imports
from Canada have declined slightly in the last
month, though they are still quite high. And
there's the news brief (Note link to original
article is broken).
Correct. Spring breakup = mud and road
restrictions up here. When Western
Canada thaws dirt roads/drill sites
become soupy messes, drill rigs stop.
Affects truck logging and mining
exploration as well.
Nevertheless the Canadian rig count
during this same week last year stood at
522. It now stands at 220, a drop of 302
rigs, season point last year to same
season point this year.
Sawdust, No, I don't think the EIA is being
dishonest for political reasons. Who's politics
would that favor? I think they are honest and
looking at their algorithm and just reporting
the data is spits out. Art Berman puts it this
way:
EIA and IEA ultimately get their U.S.
production data from the states. State reporting
on oil production is lagged by at least 3 months
and it takes another month or two for
adjustments to be included.
IEA and EIA use
sampling methods of certain large producers that
are then put into algorithms to approximate
recent production.
So, what we get from
these organizations is a pretty good guess that
will be revised later.
Their algorithm just gave them some bum
production numbers. That's really all I think
that happened. But when they saw those numbers
from North Dakota they realized they had really
screwed up and began to backtrack. They may very
well be backtracking further however.
Ya pretty much that. If you've spent time in
DC you've spent time on the Metro and it's
filled in the morning with guys who got up,
looked in the mirror, shaved, and went to
work. They don't do that every day to make
it their job to lie.
Errors can be
systemic. They can be using a source that no
longer is valid. The measurement itself may
no longer matter - like the newly famous
sales by refinery affiliated retail outlets.
Those outlets were sold off. The number
remaining is few. So retail sales of
gasoline appears to have crashed. Doesn't
measure the same thing anymore.
This sort of thing is likely underway
with Jeffrey's API focus, and there WAS that
article I posted here from the WSJ
announcing a redefinition of WTI.
Back when night baseball became prominent
in the late 1960s (first night game in the
30s, but prominence took time) to generate
ticket sales from people who could not take
off work, a recognition of pitched balls
being harder to see under lights than
natural sunlight led to a lowering of the
mound. Baseball's org watched as pitchers
became more and more dominant (1968 was "the
year of the pitcher") and so they made that
choice for 1969. All to make the game's
historical stats still comparable (and to
keep fans happy, who preferred home runs to
shutouts).
The redefinition of WTI will specifically
make historical stats NOT comparable, but
unlike with baseball, that is going to be
desirable. As will be an appearance of
steady growth, the home run of oil.
Just how much influence does a single
EIA report actually have on the direction of
oil markets? I find it difficult to believe
that a single report from them which might
be slightly over-optimistic, could start the
market in London dropping as well as New
York.
Then to top those three EIA reports
the IEA chimed in with an even more
bullish report for oil, (but bearish for
prices of course). The
IEA Oil Market Report
.
Global supply rose by 1.3 mb/d
year-on-year to an estimated 94 mb/d in
February, led by a 1.4 mb/d gain in
non-OPEC. Declines in the US rig count
have yet to dent North American output
growth.
Final December and
preliminary 1Q15 data show
higher-than-expected US crude supply,
raising the 2015 North American outlook.
Got that, non-OPEC up by 1.4 million
barrels per day in February and the
declining rig count is yet to dent North
American output growth. That was enough
to drive prices in the dirt.
Several people, Art
Berman, Steve Kopits, and Jeffrey
Brown are expecting that oil prices
should rebound by years end at
minimum. I agree with that
assessment.
Impossible to say with any
confidence when prices will rise or
by how much, but I still like $75/b
or more before Sept 30, 2015.
Looks like my guess that oil had
reached a bottom in Jan 2015 was not
right, it looked good for a month
and a half. It will be interesting
to see if it breaks through $40/b, I
doubt it, but some experts have
mentioned $38/b. If we adjust the
Dec 2008 bottom for inflation we get
$33.65/b for the lowest price since
2003. There would be some serious
resistance to oil prices less than
$33/b.
In 2008 the bottom was about
$30/b in nominal terms and the oil
price closed below $35/b for only 4
trading days, by March 2009 the oil
price was back to $45/b and by June
it was up to $70/b.
Hard to say what will happen this
time, but OPEC is predicting that
demand will be robust, so we may see
prices behave somewhat like 2009.
Even without cuts by OPEC, the World
economy is in much better shape in
2015, than it was in 2009, so oil
demand should be higher.
For the current oil price
decline, the monthly low (so
far) for Brent was $48 in
January. I don't think that
there's any real chance that
March will average below $48,
since the average for the first
half of March was in the high
50's.
Monthly price data for six
month after the $40 monthly
Brent low during the 2008/2009
decline:
On the Permian page, there
seems to be an extremely sharp
upturn in the Permian's
productively, Around about 20%
increase in a couple of months. Not
sure if it because they are saying
all the rigs that have shut down,
contributed very little to
production, or what? Maybe a little
fudge factor to catch up on past
errors?
Without that upturn, I believe their
minor increase in production would
be a negative number.
Then click on:
X Report
data (aggregated by region)
That will download the Excel
spreadsheet for all regions.
Then you can go to the Permian
page and get the data through
April. Of course the last four
months is just their guess as to
what the Permian will produce
but the data they do show shows
a very sharp downturn in the
last two months.
The data below is their
predicted barrels per day. The
chart below is the actual
increase in barrels per day they
are predicting.
Permian
Dec-14 1,845,634
Jan-15 1,888,536
Feb-15 1,929,450
Mar-15 1,960,259
Apr-15 1,981,512
Well there is no data to
support that. In fact
there is no data at all
for April because April
and in fact there is no
data for March. Why they
would make such a wild
speculation is beyond
me. But this is a
prediction
that is
beyond reason.
Productivity per well
could not possibly
change that fast.
It may be
that if a lot fewer
vertical wells are
completed that
productivity per rig
will increase. The
horizontal wells in
the Permian are far
more productive (on
a per well basis)
than the vertical
wells.
The EIA may be
accounting for the
rising percentage of
horizontal rigs
which will increase
the productivity per
rig.
I agree that this
change is unlikely
to happen as quickly
as shown in the DPR,
which was your main
point.
I think
you read the chart
wrong, the rig
productivity is on the
left vertical axis and
the rig count is on the
right. The increase was
from 202 b/d/rig in
March to 240 b/d/rig in
April.
This could easily be
explained by the higher
percentage of horizontal
rigs now running in the
Permian due to a lot of
the vertical rigs being
stacked there.
I stand
corrected, and
thanks for checking
it out, but the
change in slope is
the stand out thing.
What ever the
numbers you are
looking at approx
20% increase in
productivity in one
or two months.
It is either due to
a heap of low
productive vertical
rigs being stacked,
or a statistical
error.
I believe we will
just have to watch
out for it next
month, to see if
there is any change?
Though I believe
this little uptick
conveniently keeps
the oil supply
estimate in the
positive side of the
page. smiles
Yes
it is a 20% increase
either way, in the
Bakken it seems that
rig efficiency has
been increasing and
in the Permian the
rigs are being
stacked faster so
the percentage of
horizontal to
vertical rigs has
increased a lot.
Currently about 71%
of Permian rigs are
horizontal rigs, at
the rig high point
it was about 62%
horizontal rigs, so
we have fewer
vertical rigs which
would tend to
increase output per
rig and in this
price environment
they may be focusing
on sweet spots so
that the wells that
are fracked have a
better chance at
positive cash flow.
"Their algorithm just gave them
some bum production numbers."
That is because their algorithms don't
work any more. Not since the aggregate cost
of oil production overtook our
civilization's ability to pay the full cost
of that production. This occurred around
June of 2014. The EIA seems to be as
surprised as everyone else (except me). Here
is how they put it:
Steep drops in the US rig count have
been a key driver of the price rebound. Yet
US supply so far shows precious little sign
of slowing down. Quite to the contrary, it
continues to defy expectations.
Meaning that production is just not
falling fast enough to raise oil prices
sufficiently enough to ensure continuing oil
production. This is not a temporary
condition. There is simply no way to fix the
problem. We have experienced a paradigm
shift.
The oil industry has begun shutting
down
.
The cost of production continues to rise.
And we don't seem to be getting richer. If
the industry needs $100+ oil to maintain
current production and bring on future
production, then any price lower than $100
will result in the oil industry shrinking.
Coal industry has also started shutting
down. And coal is the second source of
energy for world economy. It will be
fast now. Party's over (Heinberg was 12
years early
).
I did some research on the
ETP model you pointed me to. It
turns out that I haven't been the
only person to point out what the
giant wedge pattern in the price of
oil meant:
"Oil prices are plunging.
According to my opinion (and it
seems that your theory says so),
this is because now
we cannot
afford a functioning economy at 100
USD per barrel of oil
. From now
on, any price collapse will lead to
the destruction of supply; and a
price hike will destroy the demand
(And I think that as time passes by,
the ceiling at which the demand
will be destroyed will only go
down). It seems that both factors
(supply destruction and demand
destruction) have met in the graph
and we just hit a collision point
…"
~ Observerbrb at peakoil.com
He even made a graph just like
mine!
And here is the answer to his
question from one of the originators
of the ETP model:
"You're right!"
~shortonoil
Wow. So my cute little
independently arrived at theory has
also occurred to many other people.
Well, of course it did! It is so
obvious, I think I could explain it
to a 6 year old! But for some
strange reason, I can't seem to be
able to explain it to anyone here,
except for a select few.
I thought that you were familiar
with the ETP model, because you
sounded like you are. If you
figured it out by yourself, then
congratulations!
Also look at this (link). This
chart was first made long time
ago (2 years?). This is the
updated version. I don't believe
that you didn't see this earlier
http://www.economic-undertow.com/wp-content/uploads/2015/03/Triangle-of-Doom-030315-1024×689.png
I just found that
"traingle of doom" chart the
other day, when I was
looking at the link you gave
me to the ETP model, and I
wanted to find out more. I
looked around and ended up
seeing the chart at a
discussion at peakoil.com.
It looks like charts I was
making before 2013.
I have been expecting a
collapse for quite a while,
so I started watching the
wedge form pretty early on.
I began to develop the idea
that there would be an oil
spike when the lines
crossed!!! Ha ha. I could
probably find where I posted
my big prediction for a
spike in June 2014!!! Right
timing, wrong direction.
I really had had the
wrong idea about the cost of
production. I thought that
would be the impossible line
to breach. But that doesn't
factor in heavy finance in
the oil industry. The
affordability line was the
real problem. Of course, as
soon as oil plummeted, I
began to get a clearer idea
of the dynamics. I started
to get the idea that the
price of oil would keep
falling. At Thanksgiving at
my moms house, I announced
that the collapse of
industrial civilization
began in June of 2014. It
was not a welcome topic. It
is not welcome here, either.
When seen relative to
interest rates, 2012 is the
highest price oil ever
reached (higher than 2008)!
The chart "squeeled"
(non-linear dynamics) at the
peak. The whole thing fits
together.
It shows how the FED used
QEx and operation twist to
extend the wedge by raising
the affordability line.
Especially twist in 2012.
Stick save.
Anyway, thanks for the
link, Kam. It really helped
me bring the whole thing
into sharper focus in my
mind. I understand collapse
much better now.
I have been debating
certain people on the site,
and they really don't get
it, or they are really
pretending hard not to get
it. I think I am explaining
it pretty well, but…
…Anyway, check out the
debate or better yet join
it. I could sure use some
help.
the
mazamascience.com/oilexport link puts it all on one
graph by country/region and is based on BP's data.
They also have a button to flip from tonnes to
barrels. My personal fave.
This from BP:
Oil production data includes crude oil, tight
oil, oil sands and NGLs (the liquid content of
natural gas where this is recovered separately).
Excludes liquid fuels from other sources such as
biomass and derivatives of coal and natural gas.
World oil production tables are in both
thousand barrels daily and million tonnes.
There is no mention of condensate in that. It
could be called NGL, one supposes. So it's not a
pure crude measure. We can't be happy about that,
but it IS all on one graph (with consumption).
Further, three cheers for BP, they adjust for leap
years to get the extra day out for annual quotes.
So their graph for China consumption is pointing
at 11+ mbpd. That includes all of the above.
This from China's official org:
China's implied oil demand will grow 3 percent
this year versus last year, the country's top energy
group forecast, little changed from the pace of
growth in 2014 as calculated by Reuters.
State-owned China National Petroleum Corporation
(CNPC) saw the nation's oil demand rising to 10.68
million barrels per day (bpd) in 2015, some 310,000
bpd higher than last year.
The forecast, in an annual report released by
CNPC's research institute on Wednesday, also put the
country's net crude imports up 5.4 percent at 6.49
million bpd for this year.
China, the world's second-largest oil consumer,
raised crude imports by nearly 10 percent last year,
or an additional 530,000 bpd, largely to boost
government and commercial reserves as oil companies
took advantage of the more than 50 percent fall in
global benchmark prices from mid-June.
The CNPC forecast was higher than a recent
report by the International Energy Agency (IEA) that
put China's oil demand growth for 2015 at 2.5
percent, down from 2.7 percent last year.
I'm looking ahead to tomorrows FOMC announcement
at 2:00-2:30pm ish. If Fed comes off hawkish i
think we will see oil below $40 very soon if
their statement is dovish we get a price rebound
though it might be a short lived one. I also
think if they come out hawkish the dollar will
initially strengthen but when stocks roll over
and bonds yields start collapsing towards zero
they are going to drag the dollar down with it.
Which in itself might support oil prices at
least in some small manner.
Beyond cars issues. A lot of the stuff
manufactured in China eventually will be
replaced by 3D printers. Combine that with
China's move to De-dollarize. Setting up a
alternative to SWIFT and selling US bonds.
How will they be able to keep their currency
pegged to the dollar? Which is what keeps
those Chinese factories humming. In the long
run how will they continue to keep hundreds
of millions of people working?
If the oil isn't there,
people go to war and die. It doesn't
matter who prints what piece of paper,
you can't print oil and you can't feed 7
billion without oil.
Scarcity begets tanker seizure. Japan
can't survive if the tankers going to
Tokyo go to Shanghai, and outbidding
doesn't matter if China HAS to have that
oil.
I totally embrace the theme of this
blog. But before scarcity sets in
and nations start taking other
nations oil supply by force. Some
economic tremors will be felt which
will lead nations to use force to
secure oil supplies. Economic
hardship is a prerequisite. We will
actual need more than economic
tremors. We will need some economic
earthquakes. Before bombs and
bullets start flying. I don't think
nations will attack each other the
minute oil starts get scarce. It
wont be until their economies can't
function properly anymore and
respective governments see no other
alternative. It will be when growth
ceases to exist and economies can do
nothing but contract. Chinese
tankers can very well be seized
themselves. China doesn't own the
seas.
Re systemic data issues. ZH just splashed one of
their strong points, noticing inconsistency. There
may be an explanation for it, but whoever is going
to make it better start cracking:
Gist is this morning's Housing Starts number was
down sharply for February. But the February Non Farm
Payrolls number showed a sharp increase in
residential construction employment. Naturally, any
time there is bad data this time of year it is
attributed to winter. But it's winter for hiring
too, and it didn't show there.
My opinion is the NFP measurement is taken the
3rd week of months. I suspect things have been done
to take advantage of that knowledge.
Watcher – we had a small back and forth a short
time ago, in which I think (do not shoot me if I
am wrong) your biggest complaint about today's
economics was lack of transparency. This article
seems to show what I believe. Do not look for
transparency, because you will never find it.
People/institutions can put forth as much data
and/or reasoning as anyone could possible want,
but in the end it is not transparent. You just
have to look at the information and decide for
yourself if it is reasonable and what it means.
I am big on analogies (in case no one noticed).
Everyone watches a football game and sees what
they perceive to be a stupid play call. The
sportswriters cannot wait to ask the coach about
it. He gives some reasoned answer. Pointless. He
went brain dead at the time, but he will never
give that as the reason.
So, I look at what the Fed does, and try to
figure out why I think that they did what they
did. I never accept their reasoning at face
value. Same with about most things. I read the
WSJ every day for 45 years, not necessarily to
gain information, but rather trying to figure
out if I agreed or not with whatever point
someone was trying to make.
With respect to investing, about the only time
you can make a lot of money is when almost
everyone else is wrong, but you are right.
Generally, pretty hard to do.
With respect to investing, about the only
time you can make a lot of money is when
almost everyone else is wrong, but you are
right.
If oil was the engine of all
things (and it was) throughout your
investing personal database, then being
right was just betting on an index and
letting increased BTUs assert themselves and
eventually appear in macro economics. This
was why "a problem delayed is a problem
solved" worked pre 2008. Oil's derived
growth would fix everything if you just
could buy time.
That's all gone away and it's never
coming back.
That sentence cannot be uttered or
embraced, so money will be printed to extend
and pretend and buy time for the mechanism
that no longer works.
How do you guys think about the current meme that
the nuclear deal with Iran (maybe even by month end)
is going to result in extra 800k to 1M bpd coming to
market soon? That is the reason being given for
price declines.
Bit off Topic for Hydrocarbons. but, another reason
to be prepared.
Of all our infrastructure, the electrical power
grid is the most fragile. In the 2013 Infrastructure
Report Card, prepared by the American Society of
Civil Engineers, Energy received a grade of D.
http://www.survivopedia.com/the-power-grid-could-collapse/
Competition in Li Pak's are getting interesting..
Capacity and features evolving every few months.
Take any ratings with a grain of salt. There are no
test standards. Would love to see reviews.
"Low oil prices and subsequent cutbacks in the field
by drilling companies could be contributing to a
rash of worker fatalities in North Dakota, according
to a report in the Wall Street Journal.
The state saw eight oilfield employee deaths
since October, a five-month total than exceeded the
number for the previous 12-month span. October also
coincided with the beginning of a decline in the
number of oil rigs operating in the state.
"
"If sanctions are lifted, we can raise our
exports by one million barrels per day within a few
months," Oil Minister Bijan Namdar Zanganeh said
Monday in Assaluyeh, Iran. The Persian Gulf nation
shipped 1.2 million barrels a day last month, the
International Energy Agency said in a March 13
report.
Industry group American Petroleum Institute
(API) said after the market's settlement that crude
stockpiles rose by 10.5 million barrels in the week
to March 13, far ahead of the 3.8 million forecast
by analysts polled by Reuters. If correct, the API
number would lift total U.S. inventories to 450
million barrels.
$42.xx following the report, which is post US
close pre Asia open. Some futures trading still
goes on.
Of more concern, for the 2nd time
this week I have seen "22 Trillion in oil
derivatives". No idea where that's coming from.
That's a lot of HY paper swaps plus options, one
supposes. It spells Apocalypse, actually.
I'm seeing talk
that at these price levels some number of wells will
get fracked that is a lower number than used to get
fracked.
Why? Why are these wells going to get fracked at
these price levels and who is going to pay for them
post March 31 when revaluation occurs? I thought the
plan was allegedly to frack nothing until you got a
better price. So . . . who is going to pay for it,
and why do it if you're not getting enough price and
are oh so very sure you're going to get better price
upcoming aka soon? Is this all about paying your
people? Are the lenders interested in paying your
people, or getting their money back?
Oh, and the big guys buying the small guys theory
. . . how does that work at a wellhead price of $25?
The for-sale company has $XXXX in revalued assets
and $YYYYYYYYYYYYYYY in debt. Who buys that company?
Someone should be paying someone to take that
company, not the reverse. So . . . maybe the
for-sale company says psssssst, maybe I'll just sell
you the assets so I can have cash to keep the doors
open. Well, didn't the lenders have those assets as
collateral? Can we spell fraud?
If the price stays in this ballpark for a while
(and note it was around this price for FIVE SOLID
YEARS 2000-2005 (which btw was in this century, not
last one) all of this is going to disintegrate.
As for who thinks it's going higher, which expert
says this or that, let's make this a pure
experience. Show me that expert taking out extra
mortgages on his house and levering up his 401K to
make the bet on higher soon. If he ain't betting,
then he's indulging in fantasy.
hmm never saw that before Ron. "You do not have
permission to edit that comment." The edit
button is there. That's the message that
appears. Plenty of time left.
Who thinks it is going higher?
Well, just looking at the numbers "somebody"
does. To my knowledge, importers of oil do not
have long term contracts obligating them to buy
oil and import it. So in less than a year, oil
inventories are up in the US by 100 million
barrels, over 9 million more last week per this
mornings EIA report. We have consistently been
importing over 1 million bbls/day more than we
need and putting it into storage. Imported oil
is probably closer to Brent in cost. So let's
guess that somebody has put 100 million barrels
into storage at an average cost of $55/bbl. That
cost somebody $5.5 billion plus monthly storage
fees, plus cost of money. I doubt that whoever
"somebody" is, is looking for an opportunity to
sell it all for $40 and lose close to $2 billion
on all in costs. So, if not, then they must
think that they will make money at some
reasonable time in the future.
This is also somewhat puzzling to me. I know
that the majors have access to that kind of
money, but after not seeing US oil imports back
off one bit since the plunge started, I have
concluded that it is above my pay grade to try
to figure it out.
Current oil future curve is in contango,
which means future price is higher than spot
price. If the spread between spot and future
prices is large enough to cover the storage
costs, many people will try to take
advantage of that "free" money by buying the
oil at spot price, putting them into storage
and then shorting the oil future 3 or 6
months out, which enables them to fix the
selling price in the future.
Many people are doing this kind of
arbitrage right now. Some are even leasing
the whole oil tanker as the storage and that
is why the tanker rate has been
skyrocketing.
It has nothing to do with biases but
everything to do with making
risk-free profits. The arbitragers
may not have a view as of where the
oil price will be in 3 or 6 months
time. They simply make money from
the spread.
Watcher, properties will be purchased by those
who have a price forecast high enough to deliver
a solid risk weighed return. The evaluation is
fairly straightforward. We look at the cash flow
from existing wells, perform an estimate for
wells being drilled, but consider delaying the
completion until prices increase. We also look
at undrilled well locations and prepare an
estimate for those as well. If it's an outright
company purchase we have to look at other
topics, for example environental liabilities,
pending lawsuits, and labor issues.
I can't go beyond this basic outline. But I
assume you do realize there are plenty of
players who have very large amounts of cash to
buy. If the sales don't go through is because
the seller has a really inflated view of what
the property is worth. Or is one of those ego
driven types who wants to be an oil tycoon and
just doesn't want to sell. I ran into one not
too long ago. He didn't want to discuss
business, was mostly interested in discussing
politics, so the sale fell through. I bet right
now he's a bit shook up.
Investors in US shale oil junk bonds take yet
another bath:
http://www.bloomberg.com/news/articles/2015-03-17/energy-junk-bond-revival-cut-short-as-7-billion-lost-in-10-days
"'Oil prices have fallen more than 15 percent since
March 4 to a six-year low of $43.5, wiping out $7
billion of market value of high-yield debt issued by
energy companies. Prices on $1.45 billion of notes
sold less than two weeks ago by Energy XXI Ltd., an
oil producer that was being squeezed by its lenders,
have fallen by as much as 10 percent. Comstock
Resources Inc.'s $700 million of securities have
declined by more than 7 percent since March 6.
The
latest slump in crude is rekindling concern that oil
companies will struggle to service the $120 billion
of high-yield, high-risk debt they took on in the
past three years amid the U.S. shale boom. That's a
sharp reversal from February when yield-starved bond
investors were loading up on the debt again, pushing
down borrowing costs to a two-month low. "'
"I find it curious that anybody would chose a
peak oil blog to tout the merits of shale oil, or
shale gas, particularly now, when
it has its
pants down around its knees, its hands overs its
privates
, but so be it…
The real
oil and gas business… is very difficult at the
moment; we are all working 24/7, confused about the
direction of prices, and having to watch every penny
we spend, right down to washing poka dot gloves
every evening to wear them again the next day…
I have had 50 good men ask me for work the
past 3 weeks
, all coming out of the
stinking shale business, with little hope for the
future…
As you can clearly (lol) tell,
I am not a
fan of the stinking shale business
… I think
[it] …has mismanaged my countries limited
hydrocarbon resources in a very bad way. It took
advantage of cheap money, little risk, absolutely no
regard for conservation practices, and drilled
itself into a 9 line bind, in my learned opinion.
It lied to the American public, misled its work
force
, borrowed money it cannot pay back
and helped drive the price of both oil and natural
gas down to levels that will ultimately hurt, not
help Americans. Now its all unraveling…
Dickheads in the Bakken and Eagle Ford
want to export condensate to stay on their drilling
hamster wheels; how does selling American resources,
cheap, to buy them back tomorrow, from people that
hate our guts and want to kill us, help America? It
doesn't. It is stupid…
I am reminded of numerous times in the history of
oil and gas in the United States where an
unregulated industry drilled itself literally into
oblivion… More recently, the shale gas industry
imploded from over drilling and the corresponding
collapse of gas prices.
My industry cannot
seem to keep from making the same mistakes again,
over and over. It gets caught up in it own bullshit
far too often…
I have to lay off a couple of kids today
that have been with me for 5 years, one just got
married
…
Is shale oil extraction a resounding
success story in America, a benchmark for
free-market enterprise? Bullshit
. The debt
those guys has accumulated would choke a big horse;
its begged, borrowed and essentially stole money
from grandma's all around the county that bought
their stock based on propaganda. It has not made a
dime of profit yet. The wealth of retired people who
invested in the shale oil business, even people that
didn't, is now being decimated because of the shale
oil industry.
Every stinking shale well
drilled uses sufficient fresh water for 168,000
humans to consume in one day and nearly 400 tons of
steel. The crop and ranch land that is lost to shale
well pads and roads is heart wrenching. All that for
a couple of months of $ 2.00 gasoline?
…
The shale oil industry shot itself in the
foot. Along the way it shot me, and thousands of
other operators in America, in the back. It is
helping to facilitate a train wreck around the
world, actually
. I have been to West
Africa, the ME, all over S. America, everywhere in
the world there is oil production and I am telling
you straight away, there are now lots of very, very
afraid people out there in the world. Hungry,
thirsty, sick people whose countries cannot help
them any longer. Why? In part because of stinkin'
shale oil industry greed. I am mad at them
sumbitches this morning…
I gotta go let some good kids go
.
Damn, I hate that…
The shale oil industry will not survive
50 dollar oil
…Now oil prices are low, and
getting lower, and the money tree is going to fall
over.
Anybody promoting the shale oil
industry at this point must be getting paid to do
so.
…"
~ Mike @ The POB
--
"So long story short
don't believe
all the negative people saying you should go home
now because there are still plenty of jobs around
you can get in the Bakken and be making six figures
in no time
." ~
dn_girl
"We had a proud young woman post yesterday
about her…
optimism about… future in the
oilfields of North Dakota. It is a powerful message
that we should have all embraced
…
She probably won't be back
…" ~
Mike
"Things are getting tough out here in the
oilfield right now, its time for me to get tougher…
But this is going to be my last post for awhile."
[January 10, 2015 at 12:41 pm] ~
Mike
"Mike,
I hope my comments didn't tick you off and that's
the reason your going to cut back on posting… If I
did say something that ticked you off, I am sorry."
~
TechGuy
I said I wasn't going to post awhile, and am
still going to limit my posts because I really
need to focus on much more important things than
the internet, no offense to Ron's blog, which I
appreciate very much.
Assuming the young lady
from ND is real, which we know is always an
issue on the net, I do not understand attacking
her. It is like attacking the soldiers in Iraq
because you don't like the lies that caused them
to be there.
Living in a place like ND is not easy.
Working outdoors in the winter there is not
easy. Working in the oilfield is not easy. I do
not understand why there would be lack of
respect for people who have little to nothing,
who move up there to bust their butt to make a
living.
While I'm here, I know us small producers are
upset with shale overproduction. However, I
think the real culprit is our unregulated
financial system. No good reason for oil to have
hit $147 in 2008, which contributed to crashing
the economy and putting millions out of work.
Now, no good reason for oil to fall below $40,
which means $20-30 at the well. It is so far
below the cost of developing new production, its
almost a joke. It is also below the cost of most
US production too, when you figure in all the
costs. Add in the bubble financing, and here we
are.
If you are going to attack people, at least
try to focus on those who are responsible for
this shale mess, not people who are trying to
avoid the destruction hitting our middle class
by going to work a thousand miles from home in
the elements to make a buck.
You're getting close on the 'unregulated
financial system' part.
At the heart of it all, there is no
financial system, it fell down years ago.
What is there is but a vestige of what it
really once was, it is now a shriveled
carcass. Probably by design and plan, but
that will probably never be known and
remains to be seen.
Still, somehow, it all trudges on through
the dreaded drudgery.
"It is like attacking the soldiers in
Iraq because you don't like the lies that
caused them to be there." ~ shallow sand
Which is precisely why you need to short
circuit those lies bloody fast, shallow
sand, and sometimes tell the kids what they
don't want to hear. My kid would not be on
here like that, singing the praises of ND,
etc., nor part of the bombing the tar out of
Iraq, that's for sure.
We don't like our children very much, nor
ourselves, nor our planet, nor the creatures
on it.
If you are in this industry– one of the
reprehensible attacks on the aforementioned–
your shallow sand seems to be turning to
quicksand. I hope so. May your work sink
hard and fast along with it.
And this is spot on topic too. If low
prices hurt the fracking, etc., industries,
you have my 'opinion piece' right here.
Oh, and ironically, as if you hadn't
noticed, Mike is, in a sense, with me all
the way on this and makes many of my points
for me. Have you read it?
And if dn_girl is real, save her and
girls and boys like her! Risk pissing them
off about their attitudes and choices if you
don't agree with them.
If an arm is gangrenous, sometimes you
have to hack it off, possibly to the protest
of someone you love. I love my planet and
some industries need to be hacked off fast.
By the way, Mike may not realize it, may
be grappling with it, but he is perched
on the precipice of anarchy:
He clearly despises his industry, but it
is merely a manifestation of the larger
crony-capitalist plutarchy; the
violence-based governance structure; the
parable of the violent tribe gone
large-scale, overcomplex, global, amok.
Push him off!
"…all forms of
organization, regardless of how
democratic they may be at the start,
will eventually and inevitably develop
oligarchic tendencies, thus making true
democracy practically and theoretically
impossible, especially in large groups
and complex organizations. The relative
structural fluidity in a small-scale
democracy succumbs to 'social viscosity'
in a large-scale organization.
[Accordingly] …democracy and large-scale
organization are incompatible." ~
Wikipedia
Nicely said, Shallow. I have always
subscribed to the theory that most folks are
doing the best that they can with what they
have. The villians are the manipulators of
finance and people who do so for their own
gain, not the workers who have limited
opportunities and influence.
Way to go, Father John B.
Show us how it's done. Give your
'hopeless misogynistic psychotics' a few
pointers. 'u^
"The shale oil
industry shot itself in the foot. Along
the way it shot me, and thousands of
other operators in America, in the back.
It is helping to facilitate a train
wreck around the world, actually…
I gotta go let some good kids go.
Damn, I hate that…
Anybody promoting the shale
oil industry at this point must be
getting paid to do so
…"
~ Mike @ The POB
--
"So long story short
don't
believe all the negative people saying
you should go home now because there are
still plenty of jobs around you can get
in the Bakken and be making six figures
in no time
." ~ dn_girl
"We had a proud young woman post
yesterday about her…
optimism
about… future in the oilfields of North
Dakota. It is a powerful message that we
should have all embraced
…
She probably won't be back
…"
~ Mike
"The culture as a whole and most
of its members are insane." ~ Derrick
Jensen
People, I call upon you today to
embrace that powerful message
…
Because, well,
assuming
it is,
it is a message that
appears
like it came from a
female
… and
one must
always
embrace
and never be
cheeky or sarcastic
with a message
that
might
come from a
female
. Good god no, because then…
then that is just plain
attacking
…
and
misogynistic
, no if and or
buts about it. And will land you in
hell. Or you will become blind if you do
it too much. ^u^
BTW, John B, I get along very well
with women (and men and even those
in-between); the willfully-ignorant
ones, less so. It's not about gender,
but about deliberate stupidity.
(Another fine on-the-fly comment
crafted with the Patterson Press™
Comment Editor)
Very well said. Those working in the oil
industry are not the ones to blame. They are
just earning their livings by honest work.
The biggest culprit, in my view, is the Fed,
whose QEs and ZIRP encourage over
risk-taking, which helped fuel the frenzy in
the shale business.
I didn't mean to seem harsh on your style
earlier (referencing the chicken and the dn_girl).
And I obviously spoke *WAY* too soon. Forgive
me. Now I think I understand. I had no idea you
were building up to this! Your post above is an
absolute work of art. The three posts together
now form a kind of tryptic masterpiece.
And I do now think you may have uncovered
something profoundly important, in terms of
elephants in rooms. Bravo.
By the way, what did you make of my "The Mask
of the Red Death" allegory post?
It's 'laughable' and kind of curious, the
hypocrisy and fairly misplaced
self-righteous net-nannyism of some.
I
think it had less to do with this dn_girl
and more that I stepped on Mike's tail,
maybe a few others'; the wish of $110 oil. I
mean, what if you lost ~50% of the value of
something overnight? Well that's what
happened of course. (Many in certain
situations might well come to this blog for
insights and answers; some in less than the
best of moods and frames of mind– and as
time goes on.
I think we should reflect
on this.
. This is the time of peak oil;
of the decline of global industrial
civilization. A New Era. How often do new
eras occur? In the middle of single
lifetimes?)
I hear many men, especially, more than
women, if we want to talk sex, are prone to
greater difficulty when it comes to work
issues. Like, work is 'everything' to some
of them.
The thought did occur that if dn_girl
is/was not a 'writeup', then maybe she is
related to someone on here, even Mike,
himself. In which case she might as well be
a writeup.
I mean, aside from the vitriol he laid down
about his own industry, he did seem
desperate in some of his comments. 'Stabbed
me in the back'?…
If your business is literally hemorrhaging,
would you want to, somewhat less mindfully
even, given your state, attempt to drum up
business in any way you can? I would.
In any case, if Mike read some of my
comments, he might have got a sense that I
am against wage-slavery ('the jobemployee')
and against certain forms of industry (like
Mike's), against hierarchy ('boss/employee')
and my comments with the girl, of course,
making fun of company-ownership (Mike has
one?). So I think it was less about the girl
and simply that, over time, Mike's head was
pumped and pumped by his work and my
commentary until it exploded.
"By the way, what did you make of my
"The Mask of the Red Death" allegory post?"
~ Futilitist
Oh ya, that one. And you
think my chicken was over the top?! 'u^
In these Times of Twitter Texts, it is a
long read, but I do like Poe who died way to
young for my taste.
I am heading out but will grab a nice warm
tea and read it over candlelight later
tonight. Maybe prop my laptop half on the
closed toilet seat and half on the bathtub
edge and read it and its original reference
in the bath after Russia Today.
It is pretty interesting and educational to read such articles one year after
they are published.
Notable quotes:
"... Russia is already in dire straits. The economy has contracted by 4.9pc over the past year and the downturn is certain to drag on as oil prices crumble after a tentative rally. Half of Russia's tax income comes from oil and gas. ..."
"... Core inflation is running at 16.7pc and real incomes have fallen by 8.4pc over the past year, a far deeper cut to living standards than occurred following the Lehman crisis. ..."
"... This man "forecasted" Russia's demise last year. He has to show that that forecast is still liable to happen ..."
"... What Colby said is palpably true. That is why we don't hear real news and instead we are bombarded with news about their "celebs" ..."
"... He should know. And certainly, Western media coverage of the Ukraine crisis demonstrated to many millions of people in the West that major Western media is almost all controlled by the US neocons. Anyone with half a brain can see that - but clearly not you. ..."
"... Russia is not interested in invading anyone. The US has tried to force Russia to invade Ukraine in an iraq style trap but it didn't work. So they had to invent an invasion, the first in living memory without a single satellite, video or photo image of any air campaign, heavy armour, uniformed soldiers, testimony from friends & family of servicemen they could pay to get a statement, not even a mobile photo of a Russian sitting on a tank. ..."
"... As the merkins tell us a devalued dollar is your problem.. the devalued rouble is the EUs problem! ..."
"... So the political sanctions are bankrupting Russia because they dared to challenge EU expansion. Result millions of poor Russians will start to flow West and the UK will have another flood of Eastern Europeans. But at least we showed them our politicians are tough. ..."
"... Spelling it out for Russia (or Britain) that would mean giving up Byzantine based ambitions and prospering through alliances with the Muslim Nation or Countries, including Turkey. In the short term such a move would quell internal dissent of the 11m immigrants in Russia, reduce unsustainable security expenditure with its central Asian neighbours, open and expand market for Russian goods in the Middle East, Far East and North Africa, and eventually form and provide a military-commercial -political alliance (like NATO) for the Muslim nations with Russia (with partner strength based upon what is mostly commercial placed on the table (see the gist in the Vienna Agreement between P5+1 and Iran). ..."
"... The formation of such an alliance would trump Russia's (or Britain's) opponents ambitions and bring prosperity. ..."
"... Propaganda. Laughable coming from the UK hack when the UK has un-payable debt and Russia has little external debt plus we have no Gold and Russia has probably 20,000 tonnes. NATO surrounds Russia yet they are the aggressors. ..."
"... In the end, Ambrose is too ideological to be credible on the issue. Sure, Russia has couple lean years ahead, but it will come out of this ordeal stronger, not weaker. There are already reports of mini boomlets gathering steam under the surface. ..."
Russia is already in dire straits. The economy has contracted by 4.9pc
over the past year and the downturn is certain to drag on as oil prices crumble
after a tentative rally. Half of Russia's tax income comes from oil and gas.
Core inflation is running at 16.7pc and real incomes have fallen by 8.4pc
over the past year, a far deeper cut to living standards than occurred following
the Lehman crisis. This time there is no recovery in sight as Western sanctions
remain in place and US shale production limits any rebound in global oil prices.
"We've seen the full impact of the crisis in the second quarter. It is
now hitting light industry and manufacturing," said Dmitri Petrov from Nomura.
"Russia is going to be in a very difficult fiscal situation by 2017," said
Lubomir Mitov from Unicredit. "By the end of next year there won't be any money
left in the oil reserve fund and there is a humongous deficit in the pension
fund. They are running a budget deficit of 3.7pc of GDP but without developed
capital markets Russia can't really afford to run a deficit at all."
A report by the Higher School of Economics in Moscow warned that a quarter
of Russia's 83 regions are effectively in default as they struggle to cope with
salary increases and welfare costs dumped on them by President Vladimir Putin
before his election in 2012. "The regions in the far east are basically bankrupt,"
said Mr Mitov.
Russian companies have to refinance $86bn in foreign currency debt in the
second half of this year. They cannot easily roll this over since the country
is still cut off from global capital markets, so they must rely on swap funding
from the central bank.
Dave Hanson
For once, Flimflambrose paints a fairly accurate picture. His formula
is to take a few facts and stretch them to their illogical conclusion to
create a story that sells subscriptions to the Telegraph. Sort of like the
National Enquirer. He does that well. He only mentions the other side of
the story in a sentence or two, usually at the end of his column. The scary
headline at the top comes true perhaps one in a thousand times, just enough
to keep readers from totally dismissing him as a fruitcake. Not yellow journalism.
Clever journalism.
steph borne •
jezzam steph borne •a day ago
''Under Putin Russia has progressed from a respectable rank 60 on the
transparency international corruption index to an appalling rank 140. It
is now one of the most corrupt countries in the world, entirely due to Putin.''
http://www.theguardian.com/wor...
.
jezzam is using the Corruption Perceptions Index as fact?
but it is ''Perceptions''???
''The CPI measures perception of corruption due to the difficulty of measuring
absolute levels of corruption.[8]'' Wiki
Just more nonsense from Jezzam
soton
my wife is russian, she speak's to her mother on the phone every day,
from what she tell's me nothing has changed economically for the "average
joe" no doubt some of the abramovich types have seen the value of their
properties plunge
Rosbif2
So if Russia is financially sinking below the waves, how come AEP in
other articles claimed that Russia could buy themselves into Greece and
menace Europe?
It seems like Greece & Russia are two drowning men who would grab onto each
other & drown even faster
AEP seems to lack "joined up thinking" in his articles
giltedged
This man "forecasted" Russia's demise last year. He has to show that
that forecast is still liable to happen
What Colby said is palpably true. That is why we don't hear real
news and instead we are bombarded with news about their "celebs"
Real news to show that a new world economy is being built totally outside
the control of US Neocons and Globalists, that the world is now multi-polar,
that for example this journalist's capital city, London, now has officially
a majority of the population not merely non-British in origin, but non-European,
that his own country survives because of London property sales
Richard N
And isn't AEP rubbing his hands with glee at this supposedly desperate
situation of Russia!
Colby, the ex-boss of the CIA, said in retirement that there is no journalist
of consequence or influence in the Western media that the CIA 'does not
own'.
I often find myself remembering that, when I read Ambrose pumping out
the US neocon / CIA propaganda standard lines about 'Russian aggression'
in Ukraine, and so on - choosing to ignore the fact that Russia's action
in Crimea was in direct response and reaction to the US Neocons' coup in
Ukraine, which overthrew an elected government in a sovereign state, to
replace it with the current US puppet regime in Kiev.
Of course, this collapse of oil and gas prices are no accident at all
- but are part of America's full-scale economic war against Russia, aiming
to get Putin overthrown, and replaced by someone controlled by the US Globalists,
leaving then
China as the only major power centre in the world outside the Globalists'
control.
Richard N > jezzam • a day ago
If you bothered to read what I wrote carefully, you would see that, with
reference to journalists, I was simply repeating what ex-head of the CIA
Mr. Colby said.
He should know. And certainly, Western media coverage of the Ukraine
crisis demonstrated to many millions of people in the West that major Western
media is almost all controlled by the US neocons. Anyone with half a brain
can see that - but clearly not you.
steph borne
''Russian bear will roar once more, says World Bank''
01 Jun 2015
''Russia economy forecast to grow by 0.7pc next year, reversing negative
growth
forecast''
Carried on to the absurd extreme at which all the dollars are held outside
of America, the US simply prints more money thus devaluing it's currency
and favoring exports (which are then cheaper to produce and cheaper buy)
people giving their currency to the US in return for goods and services
and restoring economic balance.
I can understand that Russia doesn't have much experience with the 'boom
and bust' cycles of market economies. They've had less than 20 years experience
at it.
Did you know that in the 19th century China's trade surplus with Europe
was so vast that Europe almost went bankrupt and ran out of precious metals
buying Chinese goods, surely by your thinking it was truly a golden age
of eastern supremacy, western failure. Ask any Chinese person what the 19th
century means to them, you might be surprised.
steph borne > Halou
Shame you can't provide a link or two to back up your thoughts on trade
surpluses.. altho I know amongst bankrupt countries they tell you that money/assets
leaving the country is a good thing....
Strange that the Germans don't agree --
''Germany recorded a trade surplus of 19600 EUR Million in May of 2015.
Balance ...reaching an all time high of 23468.80 EUR Million in July of
2014...'' http://www.tradingeconomics.co...
Obviously another country heading for financial self-destruction
steph borne
02 Oct 2014 http://www.telegraph.co.uk/new... 02 Oct 2014
Russias-economy-is-being-hit-hard-by-sanctions.html
01 Sept 2014 http://www.telegraph.co.uk/new... 01 Sept 2014 Cameron-we-will-permanently-damage-Russias-economy.html
cameron says.??? Aha ha ha ha ha ha ha ha ha ha ha ha ha ha ha ha ha ha
ha ha ha ha ha ha ha ha ha ha ha ha ha ha ha ha ha ha ha ha ha ha ha ha
ha ha ha ha ha ha ha ha ha ha ha ha ha ha ha ha ha ha ha ha ha ha ha ha
ha ha ha ha ha ha
ha ha ha ha ha ha ha ha ha ha ha ha ha ha ha ha ha ha ha ha ha ha ha ha
ha ha
ha ha ha ha ha ha ha ha ha ha ha ha ha ha ha ha ha ha ha ha ha ha ha ha
ha ha
ha ha ha ha ha ha ha ha ha ha ha ha ha ha ha ha ha ha ha ha ha ha ha ha
ha ha
29 Dec 2014 http://www.telegraph.co.uk/fin... 29 Dec 2014 /Recession-looms-for-Russia-as-economy-shrinks-for-first-time-since-2009.html
24 Nov 2014 http://www.telegraph.co.uk/fin... 24 Nov 2014 Russia-faces-recession-as-oil-crash-and-sanctions-cost-economy-90bn.html
22 Dec 2014 http://www.telegraph.co.uk/fin... 22 Dec 2014 Russia-starts-bailing-out-banks-as-economy-faces-full-blown-economic-crisis.html
http://www.telegraph.co.uk/fin... 29 Apr 2015
Ukraines-conflict-with-Russia-leaves-economy-in-ruins.htm
.
Still going!!!
Graham Milne
Russia has physical assets (oil, minerals and so on); we don't. It is
the UK which is toast, not Russia.
billsimpson > Graham Milne
Russia is way too big & resource rich to ever be total toast. And the
people are educated, even if they do drink a lot. But they could get a bit
hungry in another economic collapse. All the nukes they have is the real
problem. Those need to be kept secure, should another revolution occur,
or the country break apart after an economic collapse.
The US & Canada would never sit back and watch the UK melt down. Witness
the Five Eyes communal global spying system.
Electrify all the rail system that you can, so people can still get around
on less oil. Some oil is essential for growing and transporting food.
Sal20111
Russia can't just blame it on sanctions, or price wars in oil and gas.
They have not reinvested the proceeds of their prodigous fossil fuel sales
smartly and neither have they diversified quickly enough - the gas sales
to China was an afterthought after Ukraine.
Putin cracked down on some of the oligarchs but not all - national wealth
has clearly been sucked out by a few. Nepotism and favouritism seem to be
rife. They should have learnt the lesson from their communist history not
to concentrate power in state contriolled organisations. Not sure whether
there is much of a small to medium business culture.
With the amount of natural resources it has, and a well educated public,
particularly in math and technical skills, Russia should be doing much better.
rob22
Russia is not interested in invading anyone. The US has tried to
force Russia to invade Ukraine in an iraq style trap but it didn't work.
So they had to invent an invasion, the first in living memory without a
single satellite, video or photo image of any air campaign, heavy armour,
uniformed soldiers, testimony from friends & family of servicemen they could
pay to get a statement, not even a mobile photo of a Russian sitting on
a tank.
Russia is too busy building up an independent agriculture and import
substitution, not to mention creating economic and trade links with its
Eurasian neighbours like China & India via the silk road, BRICS, Eurasian
Ecconomic Union and the Shanghai Cooperation Organisation.
A total nightmare for the US which once hoped to divide & dominate the
region (see new American century doc)
Putin enjoys about 85% approval ratings (independent foreign stats) because
it knows to surrender to the US means a return to the 90`s where the nations
oil revenue went to wall st and everything else
If things get bad they`ll just devalue the ruble, get paid in dollars
and spend in rubles.
This is why most Russians are willing to dig in and play the long game.
Londonmaxwell
Over the top with Ambrose, as usual. Words like "depression", "crisis",
"plummet", and "shrivels"; and these only in the first two paragraphs! Moscow
looks absolutely normal to me: traffic jams, packed malls and restaurants,
crowded airports and train stations. Unemployment is low, inflation is tolerable.
Ambrose misses some key points.
First, if Gazprom's revenues fell from $146bn to $106bn, then this
implies (drumroll) a revenue increase from RUB 5.1 trillion to RUB 5.8
trillion. Since Gazprom/Lukoil/Rosneft et al have USD revenues but RUB
expenses, they are all doing quite nicely, as is the Russian treasury.
Second, while Russian companies do have foreign debt to pay back,
I suspect much of this "debt" is owed to (drumroll) Russian-controlled
companies in BVI, Cyprus, Luxie, Swissie, and the other usual suspects.
Third, if the oil price declines more in 2015, the Kremlin will simply
let the ruble slide, and the biggest losers will again be (drumroll)
European exporters.
Russia's present situation is not glorious, but it is not as precarious
as Ambrose portrays it to be. Be wary of writing off Russia. The great game
is just beginning.
energman58 > Londonmaxwell
Except that the slack has to be taken up by inflation and declining living
standards - Russia isn't unique; in Zimbabwe dollar terms almost every company
there did splendidly but the place is still bust. The problem is that most
of the debt is USD denominated and without the investment blocked by sanctions
they are looking at a declining production, low oil prices and an increasing
debt service burden. Presumably they could revert to the traditional model
of starving the peasants that has served them so well in the past but I
am not sure if the people with the real stroke will be quite so happy to
see their assets wither away...
Londonmaxwell > energman58
Comparing Russia with Mugabeland is a stretch, but I see your point.
If the sanctions stay and the oil price goes south permanently, then Moscow
has problems. But I question both assumptions. Merkel/Hollande/Renzi already
face huge pressure from their business leaders to resume normal relations
with Russia; i.e., drop the sanctions. As for oil prices, the USA's shale
sector is already in trouble. Russia's debt burden (both public and private)
is manageable and can scarcely worsen since it is cut off from the credit
markets. While the oil price slump certainly hurts Russia's economy, I don't
see the wheels falling off anytime soon.
AEP writes well and is always thought-provoking, but his view that Russia
is facing Armageddon because of oil prices and sanctions is way off the
mark.
steph borne
Here come the Ukrainian Nazis.. You lot must be very happy
http://www.bbc.co.uk/iplayer/e... 18 minutes in..
Maidan number 3 on the way as I predicted a year ago.
midnightrambler
Amazing how the narrative for military action is being fostered by articles
such as this one.
So many people eager for something they have no intention of getting
involved in themselves
snotcricket
It is rather odd the posts on this thread accusing any & all who question
the obvious US gov line in such articles.
Could it be that some have better memories ie the Ukrainian crisis was
in fact created by the support of the US & EU for but a few thousand sat
in Independence Sq just two years after the country had voted in the target
with a majority the likes of Cameron, Obama could only dream of.
Only an idiot could not have seen the Russki response to a situation
that could in but a very short timescale see NATO troops & kit but a literal
footstep from Russki soil....while the ports used by the Russki fleets would
be lost overnight usurped no doubt by a 'NATO' fleet of US proportions.....plainly
the US knew the likely outcome to the deposing of the elected leader & replaced
by the EU puppets....the Russki's had little option.....Putin or no Putin
this would have been the outcome.
With regard to the US led attack on the Russki economy with sanctions....well
those sanctions hurt the UK too...but of course not the US (they have lobbyist
for such matters) our farmers were hurting afore the sanctions....that became
a damn sight worse after the imposition.
The US attempts to turn off the oil/gas taps of Putin has done damage
to the Russkis, similarly its done damage to W. Europe thus ourselves as
oil prices are now held at a level by the sanctions reducing world supplies
(the US have lobbyists for such matters) thus the god of the US, the market
is skewed & forecourt prices too sighed Osborne as the overall taxation
gathers 67% of what goes through the retailers till.
This has been rumbling for over 3 years since the BRICS held their meeting
to create a currency that would challenge the $ in terms of the general
w.w economy but specifically oil. They did mistime the threat & should have
kept their powder dry as the US economy like our own lives on borrowed time
& money.....but they made the mistake the US was in such decline they couldn't
respond....of course the US have the biggest of all responses to any threat....its
armed forces & their technology that advances far more rapidly than any
economy.
Incidentally I write this sat at my laptop in the North of England in
between running my own business & contacting clients etc..........I suspect
my politics would make Putin wince.....however the chronology, actions/outcomes
& the general logic of the situation has now't to do with supporting one
or t'other.......& do remember the US grudgingly acknowledge without the
Russkis the er, er agreement with Iran & non-proliferation would still be
a can yet to be kicked down the road.
Personally I'd be more worried that Putin has made fools of the US/EU
leaders so many times thus wonder just what is the intent in assisting the
brokering of any deal? With the West & Iran.
steph borne
If Russia was worried about the oil price they would not have been so
helpful in getting the usa & Iran together on a deal which will put more
downward pressure on the oil price!
http://www.telegraph.co.uk/new... Barack Obama praises Putin for help
clinching Iran deal
oleteo
Reading this article I saw only one message to be sent to the Russians:"Russians,surrender!"
The rumours about the desease and the ongoing decease of the Russian economy
are greatly exaggerated.
steph borne
June 17, 2015 at 1:44 pm Boeing said it struck a $7.4 billion deal to
sell 20 of its 747-8 freighters to Russia's Volga-Dnepr Group, providing
a much-needed boost to the jumbo-jet program amid flagging demand for four-engine
aircraft. http://www.seattletimes.com/bu...
MOSCOW, Russia (May 26, 2015) – Bell Helicopter,
a Textron Inc. (NYSE: TXT) company, announced today an agreement with
JSC Ural Works of Civil Aviation (UWCA) for the development of final
assembly capabilities by UWCA for the Bell 407GXP in order to support
UWCA in obtaining Russian registry to facilitate their operations. http://www.bellhelicopter.com/...
.
Oh business as normal at Bell looks like sanctions only to be paid heed
by the useful idiots in the EU
snotcricket > steph borne
Yes the sanctions do seem to TTIP more in the US favour than their Western,
er, er partners
Sonduh
Just like Brown Osborne is reducing borrowing but encouraging consumer
debt which is close to 120% GDP. By the end of next year household debt
will be 172% of earnings.Once household debt reaches saturation point and
they start defaulting on their debt as they did in 2008 -- Game over. I
hear the Black Sea is nice this time of year.
steph borne
A report by Sberbank warned that Gazprom's revenues are likely to drop
by almost a third to $106bn this year from $146bn in 2014, seriously eroding
Russia's economic base.''
Last year $146 billion bought 4672 billion pybs this year $106 billion
will buy 6148 Billion pybs
Gazprom alone generates a tenth of Russian GDP and a fifth of all budget
revenues. the Pyb devaluation vs. $ has led to a 31% increase in revenues..
Something Salmond should take notice of should the SNP want to go for
independence again. Inflation at 16% may well be but its the price of imported
stuff pushing up the prices.. mainly EU goods for sale .. that won't be
bought!
As the merkins tell us a devalued dollar is your problem.. the devalued
rouble is the EUs problem!
Nikki Santoro
What is happening is the Anglo-Muricuns are actively provoking the Chinese
and Russkies into a war. However once it is all said and done, they are
going to need a cover story. People are going to ask why the Russkies attacked.
And then the Anglo-Muricuns are going to say that Putin put all his eggs
in one basket. Yeah that is what happened but really if Putin does attack,
it will be because of the endless Anglo-Muricun provocations. Just as they
provoked Hilter to no end and Imperial Japan as well.
steph borne
Russian companies have to refinance $86bn....''
So what are you going to do if they default.. go in and repossess..You
and who's army? They are struggling trying to get Greece to comply..
Russia's trade surplus is still in the Billions of Dollars while the
usa's & UKs is mired in deficit.. Russia recorded a trade surplus of 17.142
USD Billion in May of 2015 http://www.tradingeconomics.co....
Debt public/ external debt ratios
U. K..................92%........317%
usa...................74%......... 98%
And
Russia...............8%..........40%
''And while UK growth could reach 3pc this year, our expansion is far
too reliant on rising personal and government debt. ''
''The UK, with an external deficit now equal to 6pc of GDP, the second-largest
in half a century,''
http://www.telegraph.co.uk/fin...
As ever the west points to Russia and says Look over there (for God's sake
don't look here!)
Sonduh > steph borne
And don't forget all their gold reserves. And all their natural resources.
Skalla
Prosperous countries are usually benevolent (the US being the exception
to the rule). Hungry countries get to be greedy and aggressive. The US with
its economic and financial manipulations will turn a sleepy bear into a
very awake and ravenous one, and after hibernation, the first thing bears
do is FEED --
vandieman
A cynic could say that the US is driving the oil prices down to push
Russia into a war.
Anth2305 > vandieman
Wait until Iranian oil comes fully on stream, which I heard some pundit
on TV say could drive the cost down to < $30 a barrel, forcing the Saudis
into having to eat massively into their foreign reserves.
gardiner
When the old USSR 'collapsed', what we call the 'Oligarchs' ( a collection
of the most highly influential State officials who pocketed practically
all the old State assets) corruption was at the very highest level, and
society was at its weakest.
The economy became dependant on resource exports.
Because the country's capital was so concentrated, there was practically
no 'middle class' of entrepreneurs who could invest capital in job creating,
internationally competitive industry.
Although a lot further down this road than the UK - the warning is stark!
beatonthedonis > gardiner
Abramovich wasn't a state official, he was a rubber-duck salesman. Berezovsky
wasn't a state official, he was an academic. Khodorkovsky wasn't a state
official, he was a PC importer. Gusinsky wasn't a state official, he was
an unlicensed cab driver. Smolensky wasn't a state official, he was a blackmarketeer.
Fridman wasn't a state official, he was a ticket tout.
daddyseanicus
So the political sanctions are bankrupting Russia because they dared
to challenge EU expansion. Result millions of poor Russians will start to
flow West and the UK will have another flood of Eastern Europeans.
But at least we showed them our politicians are tough.
Busufi > Jonathan
In the East there is a saying: Why use poison when sugar delivers the
same result. Or say as Deng said, It doesn't matter whether the Cat is black
or white, so long it catches the mice.
Spelling it out for Russia (or Britain) that would mean giving up
Byzantine based ambitions and prospering through alliances with the Muslim
Nation or Countries, including Turkey. In the short term such a move would
quell internal dissent of the 11m immigrants in Russia, reduce unsustainable
security expenditure with its central Asian neighbours, open and expand
market for Russian goods in the Middle East, Far East and North Africa,
and eventually form and provide a military-commercial -political alliance
(like NATO) for the Muslim nations with Russia (with partner strength based
upon what is mostly commercial placed on the table (see the gist in the
Vienna Agreement between P5+1 and Iran).
The formation of such an alliance would trump Russia's (or Britain's)
opponents ambitions and bring prosperity.
Sonduh
" They are running a budget deficit of 3.7pc of GDP but without developed
capital markets Russia can't really afford to run a deficit at all."
We are able to have a budget deficit of 4.8% and 90% national debt, 115%
non financial corporate debt , 200% financial corporate debt and 120% household
debt due to voodoo economics ie. countries can print money to buy your debt.
PS we also have unfunded liabilities like pensions which amounts to many
hundred pc of GDP.
The results showed the extraordinary sums that Britain has committed to
pay its future retirees. In total, the UK is committed to paying £7.1 trillion
in pensions to people who are currently either already retired or still
in the workforce.
This is equivalent to nearly five times the UK's total economic output.
Such a figure may be hard to put into proportion, as a trillion – a thousand
billion – is obviously a huge number.
And we think Russia is in a bad state.
georgesilver
Propaganda. Laughable coming from the UK hack when the UK has un-payable
debt and Russia has little external debt plus we have no Gold and Russia
has probably 20,000 tonnes. NATO surrounds Russia yet they are the aggressors.
Laughable but idiots still believe the propaganda.
tarentius > georgesilver
The entire world combined has 32,000 tonnes of gold reserves. Russia
has 1,200 tonnes.
Russia has government debt of 18% to GDP, a contracting GDP. It is forced
to pay interest of 15% on any newly issued bonds, and that's rising. And
it has a refinancing crisis on existing debt on the horizon.
Russia's regions are heavily in debt and about 25% of them are already
bankrupt. The number is rising.
And we haven't even gotten into the problem with Russian business loans.
Turn out the lights, the party's over for Russia.
Bendu Be Praised > mrsgkhan •
The issue is the medias portrayal of Putin .. If the UK media was straight
up with the people and just said .. "our friends in the US hate the Russians
.. The Russians are growing too big and scary therefore we are going to
join in destroying the Russian economy before they become uncatchable "
the people would back them ..
Lets be honest .. The Russians don't do anything that we don't .. Apart
from stand up to the US that is
Jim0341
Yesterday, AEP spread the gloom about China, today it is Russia. As ever,
he uses quotes from leading figures in banks and finance houses, which are
generally bemoaning low returns on investments, rather than the wellbeing,
or otherwise, of the national economy..
Whose turn is it tomorrow, AEP? My bet is Taiwan.
Bendu Be Praised > FreddieTCapitalist
I think you will find that the UK are just pretending the sanctions and
wars are not hurting us ..
Just look at the budget .. 40% cuts to public services .. America tried
to destroy the Russian economy by flooding the market with cheap oil but
it will come back to bite them ..
The UK should just back off .. lift sanctions against Russia and let
the US squabble with them by themselves ..
I sick of paying taxes for the US governments "War on the terror and
the rest of the world"
alec bell
This article makes no sense. First of all, there is no way that Gazprom
is responsible for 1/10th of Russia's GDP. That is mathematically impossible.
1/20th is more like it. Second, if push comes to shove, Russians are perfectly
capable of developing their own vitally-important technologies. Drilling
holes in the ground cannot be more complicated than conquering space.
Whatever problems Russia has, engineering impotence is not one of them.
And third, if Russians' reliance on resourses' exports has led to "the
atrophy of their industry" as AEP rightly points out, then it must logically
follow that disappearance of that revenue will inevitably result in their
industrial and agricultural renaissance.
In the end, Ambrose is too ideological to be credible on the issue.
Sure, Russia has couple lean years ahead, but it will come out of this ordeal
stronger, not weaker. There are already reports of mini boomlets gathering
steam under the surface.
alec bell > vlad
vlad, JFYI: According to research conducted by the World Economic Forum
(which excludes China and India due to lack of data), Russia leads the way,
producing an annual total of 454,000 graduates in engineering, manufacturing
and construction. The United States is in second position with 237,826 while
Iran rounds off the top three with 233,695. Developing economies including
Indonesia and Vietnam have also made it into the top 10, producing 140,000
and 100,000 engineering graduates each year respectively.
Nikki Santoro
Don't mess with the Anglo-Muricuns. They will jack you up bad. Unless
you are thousands of miles away and posting anonymously. But even still
they can lens you out and cleanse you out should you take it too far. However
their dominance is not some much because of their brilliance. They don't
have any despite their propaganda. But rather the depths they are willing
to stoop to in order to secure victory. Like blowing up an airliner and
then pinning it on you for instance. Or poisoning their own farmland.
steve_from_virginia
Futures' traders got burned earlier this year betting that oil prices
would rise right back to where they were a year previously. Now they have
'gotten smart'. They know now the problem isn't Saudi Arabia but billions
of bankrupt consumers the world around.
Customers are bankrupt b/c of QE and other easing which shifts purchasing
power claims from customers to drillers -- and to the banks. As the customers
go broke so do the banks: instead of gas lines there are ATM lines.
At the same time, ongoing 'success' at resource stripping is cannibalizing
the purchasing power faster than ever before. Soon enough, the claims will
be worthless! When the resource capital is inaccessible, so is the purchasing
power -- which is the ability to obtain that resource capital.
Business has caught itself in the net of its own propaganda; that there
is such a thing as material progress out of waste ... that a better future
will arrive the day after tomorrow.
Turns out tomorrow arrives and things get worse. Who could have thunk
it?
Brabantian
If AEP is as right about Russia as he was about the Yank shale gas 'boom'
- now collapsing into a pile of toxic bad debt -
Then our Russian friends have nothing to worry about
midnightrambler > Guest
The largest military spend - the US - bigger than the next 20 countries
combined
The most bases - the US with 800, including many in Germany
Nobody wants war - but the US needs it as their largest industry is defence
- apart from manipulative banking.
We are heading for a point of rupture between those who are peaceful and
those whose main aim is control and conflict.
Take your pick
A few leaders choose war - most people (who will fight those wars) choose
peace.
And of course all wars are bankers' wars - it is only they who profit
Timothy D. Naegele
Both Putin and Russia are in a spiral, from which they will not recover.
See https://naegeleblog.wordpress.... ("Putin Meets Economic Collapse
With Purges, Broken Promises")
Tony Cocks > Timothy D. Naegele
"Both Putin and Russia are in a spiral, from which they will not recover."
This from someone whose former President and gang of criminal henchmen
lied to the world on a monumental scale about WMD in Iraq , and waged an
illegal war on that country killing hundreds of thousands in the process
. Following that it was Libyas turn , then Syrias . Now its Russia the US
neo con warmongers are hounding, the difference being that Russia holds
the worlds biggest nuclear arsenal.
The US forces had their kicked out of Vietnam and were thoroughly beaten
despite throwing everything they had at the conflict save the nuclear option.
Imagine what will happen if it eventually comes to armed conflict with Russia.
midnightrambler > Timothy D. Naegele
A yank lawyer advocating killing.
From the land of citizen killers
What a surprise
Stay away
stephenmarchant
Instead of demonising Putin and banging on about the problems of the
Russian economy the MSM should be worried about indebted Western economies
including the UK and US. Russian Govt finances are not burdened with nearly
£2trn of debt that has funded unsustainable nominal growth. Here in the
UK the real GDP growth per capita is declining at over 3% per anum so as
a nation the UK is continuing its decline:-
Govt deficit at 5% per anum
Govt debt at about 80% GDP
Private debt and corporate debt each of a similar order
Record current account deficit of about 5% per anum
A deteriorating NIIP (Net International Investment Position)
Uncontrolled immigration
Our whole debt based fiat system is on the brink but few can see it whilst
they party with asset and property bubbles. A few of us foresaw the first
crash of 2007/8 but we now face a systemic collapse of our fiat system because
of the resulting 'extend and pretend' policy of Govts and central bankers.
In the final analysis the true prosperity of a nation will depend upon
its natural resources, infrastructure, skills of its workforce and social
cohesion.
Graham Milne > JabbaTheCat
The scale of Russian kleptocracy pales into vanishing insignificance
beside the criminality of western banks (and the government who 'regulate'
them). Europe and the USA are regimes run by criminals; worse than that,
they are run by traitors. At least Putin isn't a traitor to his country.
Busufi
The best way for Russia to beat the downturn in it's oil and gas is to
invest in down-stream strategic production of petroleum products that would
give Russia a competitive advantage on a global scale.
Selling raw natural resources is the Third World way of exports. Not
smart.
"... I think this *might* be true if one disregards the fact that China has already negotiated major energy deals, including oil, that are settled in yuan and not dollars. ..."
Because Oil Is Priced in Euros, China Will Buy Less Oil Now That the
Value of the Yuan Has Fallen
Yes, I know, oil is priced in dollars, not euros, but it doesn't make
one iota of difference. In an article on the meaning of the drop in the
value of the yuan on people in the United States, USA Today told readers:
*
"China, the world's second largest economy, consumes a lot of oil, second
only to the U.S. However, oil prices are denominated in dollars, so a gutted
yuan means China's purchasing power is reduced, which could prompt the Chinese
to spend less on oil-based products. That reduction in demand could lower
prices, an upside for American drivers."
Everything in this paragraph would be equally true if oil was priced
in euros. The Chinese currency is now worth less measured in dollars, euros,
yen, or oil. The loss of purchasing power will lead China to buy less of
everything that is produced abroad, including oil. The fact that oil is
priced in dollars matters not at all.
As a practical matter, anyone hoping to get super cheap gas due to less
demand from China is likely to be disappointed. If we assume that the 2
percent drop in the value of the yuan leads to 2 percent higher gas prices
in China, and we assume an elasticity of demand of 0.3, then China's gas
consumption will fall by roughly 0.6 percent as a result of the devaluation.
This almost certainly has less impact on the demand for gas than even a
one-year reduction in China's growth rate by 2 percentage points. If the
devaluation and other stimulatory policies speed growth in China, then we
may see increased rather than decreased demand for oil from China.
The piece also gets the story of U.S. companies manufacturing in China
somewhat confused. It tells readers:
"Many U.S. companies do a considerable amount of their business abroad,
either selling directly to Chinese consumers, manufacturing or via overseas
units that produce income in the local currency. Apple, for example, relies
on China to make its iPhone and iPad. A stronger dollar compared to the
yuan means any income generated in China loses value as it is repatriated
back to America."
Actually the impact is the opposite. The lower valued yuan increases
the profits from manufacturing in China rather than the United States. Apple
will likely still sell its iPhones and iPads at the same price in the United
States and other countries, even though it now costs them less money to
manufacture them because of the lower price of the yuan. This means greater
profits.
This is an important point because the issue of currency values is often
presented as one pitting the United States against China. That is not accurate.
Many companies that manufacture in China or rely on importing low cost goods
produced in China, like Walmart, have a real stake in keeping down the value
of the yuan against the dollar. These powerful interests are a main reason
that the United States has not made raising the value of the yuan a top
priority in trade negotiations with China.
If it really was the case that the United States government considered
it a top priority to raise the value of the yuan against the dollar, and
was prepared to make concessions in other areas, like enforcement of Microsoft's
copyrights and Pfizer's patents, then China would almost certainly have
agreed to raise the value of the yuan by more than it has.
I think this *might* be true if one disregards the fact that China has
already negotiated major energy deals, including oil, that are settled in
yuan and not dollars.
I posted this same comment at Dean's site when he first wrote this.
Am I the only one who is watching China closely? There are some very
big changes in the world economy underway, particularly with regard to the
long standing Bretton Woods II agreement as some have called it, and few
are noticing them.
anne said in reply to Jesse...
I think this *might* be true if one disregards the fact that China has
already negotiated major energy deals, including oil, that are settled in
yuan and not dollars.
[ Right, right, China has negotiated a range of important long term oil
and gas, and delivery, agreements this year. ]
In Overland Park, our house shook pretty hard. … In that classic way,
vibrating pressure on my back though the couch… Then the whole house shook.
Even sound. We've had all the pictures suddenly go wonky but this was the
first rattling quake in all the years I've lived here. (My first thought was
that my tempromental sister in law was pounding up the stairs to throw a
fit)
Looks like Israel count of IS to serve as a counterbalancing force able to weaken Hezbollah
Notable quotes:
"... A weak IS is, counterintuitively, preferable to a destroyed IS. IS is a magnet for radicalized Muslims in countries throughout the world. These volunteers are easier targets to identify, saving intelligence work. They acquire destructive skills in the fields of Syria and Iraq that are of undoubted concern if they return home, but some of them acquire shaheed ..."
"... Furthermore, Hizballah – a radical Shiite anti-Western organization subservient to Iran – is being seriously taxed by the fight against IS, a state of affairs that suits Western interests. A Hizballah no longer involved in the Syrian civil war might engage once again in the taking of western hostages and other terrorist acts in Europe. ..."
"... The West yearns for stability, and holds out a naive hope that the military defeat of IS will be instrumental in reaching that goal. But stability is not a value in and of itself. It is desirable only if it serves our interests. The defeat of IS would encourage Iranian hegemony in the region, buttress Russia's role, and prolong Assad's tyranny. Tehran, Moscow, and Damascus do not share our democratic values and have little inclination to help America and the West. ..."
"... Efraim Inbar, director of the Begin-Sadat Center for Strategic Studies, is professor emeritus of political studies at Bar-Ilan University and a fellow at the Middle East Forum. ..."
The Destruction of Islamic State is a Strategic Mistake
EXECUTIVE SUMMARY: The West should seek the further weakening of Islamic State, but not
its destruction. A weak but functioning IS can undermine the appeal of the caliphate among radical
Muslims; keep bad actors focused on one another rather than on Western targets; and hamper Iran's
quest for regional hegemony.
US Defense Secretary Ashton Carter recently gathered defense ministers from allied nations to
plan what officials hope will be the decisive stage in the campaign to eradicate the Islamic State
(IS) organization. This is a strategic mistake.
IS, a radical Islamist group, has killed thousands of people since it declared an Islamic caliphate
in June 2014, with the Syrian city of Raqqa as its de facto capital. It captured tremendous international
attention by swiftly conquering large swaths of land and by releasing gruesome pictures of beheadings
and other means of execution.
But IS is primarily successful where there is a political void. Although the offensives in Syria
and Iraq showed IS's tactical capabilities, they were directed against failed states with weakened
militaries. On occasions when the poorly trained IS troops have met well-organized opposition, even
that of non-state entities like the Kurdish militias, the group's performance has been less convincing.
When greater military pressure was applied and Turkish support dwindled, IS went into retreat.
It is true that IS has ignited immense passion among many young and frustrated Muslims all over
the world, and the caliphate idea holds great appeal among believers. But the relevant question is
what can IS do, particularly in its current situation? The terrorist activities for which it recently
took responsibility were perpetrated mostly by lone wolves who declared their allegiance to IS; they
were not directed from Raqqa. On its own, IS is capable of only limited damage.
A weak IS is, counterintuitively, preferable to a destroyed IS. IS is a magnet for radicalized
Muslims in countries throughout the world. These volunteers are easier targets to identify, saving
intelligence work. They acquire destructive skills in the fields of Syria and Iraq that are of undoubted
concern if they return home, but some of them acquire shaheed status while still away –
a blessing for their home countries. If IS is fully defeated, more of these people are likely to
come home and cause trouble.
If IS loses control over its territory, the energies that went into protecting and governing a
state will be directed toward organizing more terrorist attacks beyond its borders. The collapse
of IS will produce a terrorist diaspora that might further radicalize Muslim immigrants in the West.
Most counter-terrorism agencies understand this danger. Prolonging the life of IS probably assures
the deaths of more Muslim extremists at the hands of other bad guys in the Middle East, and is likely
to spare the West several terrorist attacks.
Moreover, a weak and lingering IS could undermine the attraction of the caliphate idea. A dysfunctional
and embattled political entity is more conducive to the disillusionment of Muslim adherents of a
caliphate in our times than an IS destroyed by a mighty America-led coalition. The latter scenario
perfectly fits the narrative of continuous and perfidious efforts on the part of the West to destroy
Islam, which feeds radical Muslim hatred for everything the West stands for.
The continuing existence of IS serves a strategic purpose. Why help the brutal Assad regime win
the Syrian civil war? Many radical Islamists in the opposition forces, i.e., Al Nusra and its offshoots,
might find other arenas in which to operate closer to Paris and Berlin. Is it in the West's interests
to strengthen the Russian grip on Syria and bolster its influence in the Middle East? Is enhancing
Iranian control of Iraq congruent with American objectives in that country? Only the strategic folly
that currently prevails in Washington can consider it a positive to enhance the power of the Moscow-Tehran-Damascus
axis by cooperating with Russia against IS.
Furthermore, Hizballah – a radical Shiite anti-Western organization subservient to Iran –
is being seriously taxed by the fight against IS, a state of affairs that suits Western interests.
A Hizballah no longer involved in the Syrian civil war might engage once again in the taking of western
hostages and other terrorist acts in Europe.
The Western distaste for IS brutality and immorality should not obfuscate strategic clarity. IS
are truly bad guys, but few of their opponents are much better. Allowing bad guys to kill bad guys
sounds very cynical, but it is useful and even moral to do so if it keeps the bad guys busy and less
able to harm the good guys. The Hobbesian reality of the Middle East does not always present a neat
moral choice.
The West yearns for stability, and holds out a naive hope that the military defeat of IS will
be instrumental in reaching that goal. But stability is not a value in and of itself. It is desirable
only if it serves our interests. The defeat of IS would encourage Iranian hegemony in the region,
buttress Russia's role, and prolong Assad's tyranny. Tehran, Moscow, and Damascus do not share our
democratic values and have little inclination to help America and the West.
Moreover, instability and crises sometimes contain portents of positive change. Unfortunately,
the Obama administration fails to see that its main enemy is Iran. The Obama administration has inflated
the threat from IS in order to legitimize Iran as a "responsible" actor that will, supposedly, fight
IS in the Middle East. This was part of the Obama administration's rationale for its nuclear deal
with Iran and central to its "legacy," which is likely to be ill-remembered.
The American administration does not appear capable of recognizing the fact that IS can be a useful
tool in undermining Tehran's ambitious plan for domination of the Middle East.
Efraim Inbar, director of the Begin-Sadat Center for Strategic Studies, is professor emeritus
of political studies at Bar-Ilan University and a fellow at the Middle East Forum.
BESA Center Perspectives Papers are published through the generosity of the Greg Rosshandler Family
Oil exports from Iraq's southern
ports have averaged 3.205 million barrels per day (bpd) so far in August, exceeding the
average level seen in July, two officials from state-run South Oil Company said on
Friday.
Exports in July averaged 3.202 million
bpd. With five days of exports remaining this month, the average for August could change,
the officials said.
The southern region produces most of the OPEC member's crude oil, with an output of
4.6 million bpd last month.
Independent of the central government in Baghdad, Iraq's northern Kurdish regional
government exports about 500,000 bpd through a pipeline to the Turkish port of Ceyhan on
the Mediterranean. Baghdad oversees crude production from the south and from parts of the Kirkuk region
in the north that is shared with the Kurds.
(Reporting by Aref Mohammed in Basra; writing by Maher Chmaytelli; editing by Jason
Neely)
The Kingdom of Saudi Arabia (KSA) is expected to increase their defense spending from $48 billion
last year to $52 billion by 2019, IHS Janes Defense analysts reported
"... its current Islamist King, Salman, has been more mired in political and economic turmoil than at any time in the desert kingdom's history. Domestically, the country is suffering from royal discord and economic hardships, due to the drastic decline in oil prices, which constitute more than 90% of the state's revenues. Regionally, Saudi Arabia is stuck in a consuming and costly war in Yemen, the continued occupation of Bahrain and dangerous events which the Saudis cannot control or stop, such as the recent superpowers' rapprochement with Iran, the destabilizing conflicts in Iraq and Syria and the loss of like-minded dictatorial allies in other Arab and Muslim countries. ..."
"... The West recognized that the fast and widely- spreading extremism and terrorism are inspired by the globally detested Saudi/ Wahhabi Sunni doctrine; therefore, continuing to rely on and to protect the Saudi rulers unconditionally are no longer in the best interest of Western societies. ..."
"... In reality, the West is playing Iran off against Saudi Arabia to protect Western interests. ..."
E Tavares: Dr. Alyami, thank you for your being with us today.
Last October we spoke about the socio-political situation in the Kingdom of Saudi Arabia ("KSA"),
a hugely important country, and implications for the wider region. It seems very little has changed
as far as policies and governance are concerned, other than perhaps the current rulers becoming more
entrenched in power. Do you agree?
AA: Thank you for this opportunity and more so for your patriotism and understanding of the unprecedented
Islamist ideological threats facing us and the international community, including the majority of
Muslims. This is a fact that cannot be denied, ignored or belittled as the action of a few perverted
groups.
Since our interview, Saudi Arabia under its current
Islamist King, Salman, has been more mired in political and economic turmoil than at any time
in the desert kingdom's history. Domestically, the country is suffering from royal discord and economic
hardships, due to the drastic decline in oil prices, which constitute more than
90% of the state's revenues. Regionally, Saudi Arabia is stuck in a consuming and costly war
in Yemen, the continued occupation of Bahrain and dangerous events which the Saudis cannot control
or stop, such as the recent superpowers' rapprochement with Iran, the destabilizing conflicts in
Iraq and Syria and the loss of like-minded dictatorial allies in other Arab and Muslim countries.
ET: Indeed, Iran is consolidating its influence across the region, much to the detriment of the
KSA. Their alliance with Russia seems to be paying off in Syria, with the Islamic State ("ISIS")
in retreat, arguably in Iraq as well. The Houthis, their allies in Yemen, are giving the Saudis a
run for their money. The Iranian regime recently got a lot of money back as a result of the nuclear
deal with the US, and quick on the heels of that
it has
been testing ballistic missiles and related defense systems.
AA: As mentioned above, the superpowers' reconciliation with the Persian theocracy in Tehran has
given Iran more leverage regionally and globally, which the Iranians are using to strengthen their
influence in the region, slowly stripping the Saudi oligarchs of their domination over US and western
policies and economic interests in the Middle East. Notably, Western interest in reaching a nuclear
deal with Iran is not limited to concerns about nuclear weapons.
The West recognized that the fast and widely- spreading extremism and terrorism are inspired by
the globally detested Saudi/ Wahhabi Sunni doctrine; therefore, continuing to rely on and to protect
the Saudi rulers unconditionally are no longer in the best interest of Western societies. Furthermore,
the US and its Western allies may have concluded that it's only a matter of time before the Saudi
autocratic ruling family faces the same fate as its counterparts in other Arab countries. This does
not mean that the West is bolstering the Persian theocrats in Tehran to become the guardians of the
Gulf's economic and strategic resources. In reality, the West is playing Iran off against Saudi Arabia
to protect Western interests.
ET: However, that alliance of Iran and Russia is gaining prominence and effectively undermining
US interests in the region. The latest "casualty" appears to be the once close relationship between
the US and Turkey, with President Erdogan publicly courting Russia – quite an achievement after the
two countries almost came to blows last year because of the downing of a Russian jet. In your opinion,
is the US making the right moves in the region and how is this being perceived within the KSA?
AA: The recent rift between the US and Turkey is not the result of changes in US policy toward
Turkey as much as it is due to the unpredictability and sudden turns by President Erdogan, who has
been veering Turkey toward Islamist authoritarianism since his party acquired power in 2002. It's
worth mentioning here that the US/Turkey relationship began to erode more rapidly after King Abdullah
of Saudi Arabia visited Turkey in 2006 and committed to investing
$400 billion in the Turkish economy, a commitment that was finalized in 2010. President Erdogan's
recent visit to Russia to cultivate the goodwill of like-minded President Putin has very little to
do with US policy moves and more to do with Erdogan's unpredictability and blackmailing habits, especially
since the failed military coup against him and his unsuccessful demands that the US extradite the
Turkish cleric who Erdogan blames for the coup.
In my opinion, continuing to support absolute dictators whose policies are posing imminent threats
to our democracy and national security is neither feasible nor prudent, especially when the future
of the Middle East is being determined by its diverse peoples. Our government's "hands off" policy
in the region is based on two factors: one, very little can be done by outside military interventions
and two, the American people will not tolerate sending hundreds of thousands of young men and women
into an unwinnable war in a region most Americans loathe. The Saudi regime views the lack of deep
US involvement in the Middle East as a betrayal of an historical relationship, especially the protection
of the ruling family from external and internal threats.
ET: We often talk about the UK having a "special relationship" with the US. But some commentators
argue that the world's only special relationship today is the one between the KSA and the US. For
one, Obama would never dare to propose a domestic course of action (with an "or else" attached to
it) in Saudi soil like he did in the UK regarding the BREXIT vote. In light of what you detailed
above, what is the status of that relationship today and how critical is the forthcoming US election
in that regard? It appears that the two main candidates have very different views on how that relationship
should look like.
AA: I am not so sure that US/Saudi relations are that special. For one, it's based on a tit for
tat arrangement, US access to oil in return for defending an absolute and reactionary system whose
values are totally antithetical to everything America was founded on and stands for. The US/UK relationship
is based on strategic, cultural, religious, ethnic, transparency and above all, democratic values,
rule of law and freedom of all forms of expression. Due to this fact, US presidents can express their
views publicly without fear of inciting British citizens to overthrow their government by force.
I know for a fact that our presidents demand actions by the Saudis in private in order not to give
the impression that the US is abandoning its commitment to protect the Saudi regime, especially from
its oppressed population.
US/Saudi relations have been deteriorating since the September 2001 terrorist attacks on the US
by mostly Saudi nationals on the watch of President George Bush, who responded forcefully both politically
and militarily. However, Bush's rhetoric and actions wound down during his second term. President
Obama's first term started with an apologetic and appeasing (humiliating, even) approach to the Saudis
and the Muslim World in general. Conversely, Obama's second term can be characterized as the period
in US/Saudi relations when the US has the upper hand economically, politically and strategically.
Empowered by a recovering economy, falling oil prices (thanks to fracking) and shifting alliances,
while the Saudis are weakened by domestic, regional and global events, Obama used America's strengthened
position to put the Saudis in their place.
Given the current state of affairs in the Middle East, continued Saudi support for extremism and
terrorism and increasing Islamic terror attacks on Europe and the US, US/Saudi relations will continue
to deteriorate or remain in flux, regardless who wins the US Presidency in November 2016.
ET: As ISIS retreats in Syria and Iraq it is spreading into Afghanistan and many African countries,
as well as increasingly resorting to terrorism across much of the West. There have been persistent
rumors of Saudi and Turkish support to ISIS,
a fact that has been confirmed
by US Vice President Biden . Moreover, Christian and Yazidi women who were fortunate enough to
escape their enslavement at the hands of ISIS
reported being brutalized by Saudis . So the ties are there and at various levels. However, ISIS
is now behind terrorist attacks in both those countries. Is this another example of "
blowback
"?
AA: It's no secret that ISIS is inspired by and based on the Saudi/Wahhabi doctrine and practices
employed by the Saudi/Wahhabi allies, especially in the 18th to the 20th centuries. ISIS's objective
is identical to that held by most Muslims, including former Saudi King Abdullah:
spread Islam and the Shariah worldwide. Although the Saudis and the Turks have supported and
used ISIS, especially in Syria and Iraq, ISIS is turning against the governments of Saudi Arabia
and Turkey for two reasons: one, ISIS felt betrayed by the Saudis and Turks, whom ISIS considers
proxies for the West, which is waging a war against the Caliphate State; and two, ISIS's immediate
goal is to establish a Caliphate that includes all Muslims, headquartered in Islam's holiest site
of Mecca, Saudi Arabia.
Those familiar with the perfidious practices and mindset of Arab and Muslim despots understand
that by supporting ISIS, the Saudis and Turks expect the terrorist group to turn against them. This
is a tactic these regimes use to empower themselves, suppress their populations and convince the
West that they are likewise victims of terrorism when, in fact, they continue to support and use
extremists and terrorists against each other and to extract concessions from the international community.
ET: What's happening around the KSA provides some context for what is happening internally. As
far as human rights are concerned, it appears that things are getting worse, as recently evidenced
by a courageous – and shocking –
documentary by ITV in the UK
. What do you make of this?
AA: After King Salman inherited the Saudi Crown in January 2015, my organization, the Center for
Democracy and Human Rights in Saudi Arabia, wrote an analysis predicting human rights would suffer
under the new King reign. Of all his predecessors (6 Saudi kings), Salman is notorious for his
support of extremists in and outside the country and for his belief that the extremist Wahhabi
interpretation of Islam and its arbitrary Shariah law is the
true Islam . He considers the country his family's private property and opposes any political
reforms including his predecessor's cosmetic gestures. Given these documented facts, it's not surprising
that King Salman
purged the government of all less rigid members of his family and replace them with his like-minded
sons and nephews. Given the Saudi's economic hardships and the costly war engagement in Yemen, deteriorating
situation in Syria, Iraq, continued occupation of Bahrain, frequent terrorist attacks in different
parts of the country, human rights abuses in Saudi Arabia are likely to worsen.
ET: Another surprising fact is the abject poverty that many Saudis are living under. How is this
possible given all the petrodollars floating around the country?
AA: All state revenues are controlled and treated as property of the royal family. Only the king
and a few high-ranking royals have direct access to the state's income. Since there is no accountability,
transparency or public scrutiny, this small clique of royals decides on the distribution of funds.
The top spending priorities are internal security, namely the safety of the ruling family, stipends
for the thousands of members of the extended royal family, the armed forces and maintaining the institutions
of the religious establishment (universities, mosques, religious police and thousands of clerics.)
Given this arrangement, little of the national revenues is spent on citizens.
It's estimated that between 30-40% of Saudis live at or below the UN designated poverty level.
This is due to high unemployment, where it is estimated that between 70-80% of Saudi women and about
20-30% of Saudi men are unemployed. Given these numbers, it's culturally customary that those who
work support those who don't.
ET: There are over
9 million immigrants living in the KSA , representing more than a third of the population. Those
are not small figures. Yet many complain of abuse and violation of human rights. Why is this so?
AA: It's ironic that millions of Saudi men and women are unemployed, yet the public and private
sectors import millions of expatriates to do jobs that the Saudi people need and could do if women
were allowed to work and if the Saudis were paid decent salaries to feed their families. By importing
poverty stricken laborers who are willing to live in appalling conditions, accept subsistence wages
and have no benefits or rights under the Saudi judicial system, the Saudi employers make huge profits.
The
maltreatment of migrant workers by their Saudi employers has been compared to modern slavery
by Amnesty International, Human Rights Watch and many governments' agencies, including our Department
of State, have decried abuses of migrant workers in Saudi Arabia.
ET: Last time we spoke you mentioned that Saudi women are the most marginalized people on the
planet. The KSA has contributed between
$10-25m to the Clinton Foundation , possibly more. While we may never find out how much of that
can actually influence US politics, as suggested by
emails recently disclosed , if Hillary Clinton is elected US President can she do anything to
truly help Saudi women as a result? There could be a conflict there, it seems (not that the men who
preceded her have done much about it anyway).
AA: Despite her pronouncement that "women's rights are human rights," it's unlikely that
Saudi women will fare any better under Hillary Clinton if she were elected President of the United
States. Given the Saudis' generous gifts of
$41 million to the Clinton Foundation and millions to various universities, including the
University of Arkansas when Bill Clinton was President, Hillary Clinton is unlikely to deviate
from the Saudi appeasing policies she pursued as a Secretary of State.
Although promoting Saudi women's rights is unlikely to occur under a President Hillary Clinton,
empowering Saudi women not only promotes human rights, but would represent a major victory over extremism
and terrorism. Even under their current oppressive and inhumane conditions, Saudi women are intensely
engaged in fighting the zealot Saudi religious establishment. Empowering and liberating Saudi women
from the constricting chains of religio-male guardian systems would resonate throughout the Muslim
world, given Saudi Arabia's status as the birthplace of Islam and home to its holy shrines toward
which 1.5 billion Muslims pray 5 times a day.
Paul Kersey
SmedleyButlersGhost
Aug 27, 2016 7:22 PM Just wait until all those Saudi Salafis get control of tens of millions
of dollars worth of weapons the US war profiteering contractors sold the Saudi Royals.
"Salafis are fundamentalists who believe in a return to the original ways of Islam. The word 'Salafi'
comes from the Arabic phrase, 'as-salaf as-saliheen', which refers to the first three generations
of Muslims (starting with the Companions of the Prophet), otherwise known as the Pious Predecessors."
The Salafis are not our good friends.
Mustafa Kemal
Aug 27, 2016 8:00 PM There was no discussion of the fall of SA, especially its main bank, and
the petrodollar in relation to the improving relations between Russian, China and Iran, along with
their gold purchasing and de-petrodollarization.
Its a bit of a double bind I think. dogismycopilot
Aug 27, 2016 9:14 PM When ISIS took over Mosul, the place was full of White Toyotas with Saudi
License plates. Saudi is the mother ship. It must be destroyed.
"... My personal prejudice is that with the removal of sanctions that much of Iran's production increase eventually will be gobbled up by domestic use – their population seems to be too large for it to be otherwise. ..."
Nick , "KSA, for instance, is already using more per capita than almost
anyone."
Is that really true? Does that include all the amounts that run through
its refineries and chemical plants for export? I casually observe that Iran,
with many more people, uses much less. Iran has no substantial refineries,
etc. But, they appear to have much more military/industrial capability.
Maybe someone here knows of a reference that discusses the uses of oil
by KSA viz-a-viz the uses by Iran. My personal prejudice is that with
the removal of sanctions that much of Iran's production increase eventually
will be gobbled up by domestic use – their population seems to be too large
for it to be otherwise.
Does that include all the amounts that run through its refineries and
chemical plants for export?
It just includes domestic consumption. Iran prices gasoline somewhere
near it's market price, while KSA greatly underprices it for domestic consumers.
Iran uses a lot of CNG for personal transportation, I believe.
KSA uses oil for electrical generation, which is ridiculous – it's far
more expensive. But, that's the political power of legacy industries…
"Capital and exploration expenditure declined by 42% to US$6.4 billion and is expected to decrease
further to US$5.0 billion in the 2017 financial year (BHP Billiton share)(5)."
I don't know if there is enough detail to say how much came from oil and gas operations. The
Samarco dam accident seems to be budgeted at $1.2 billion so far.
Petrobras made a small profit but less than expected:
"In 2Q16, Petrobras's earnings attributable to its shareholders stood at $106 million compared
to $171 million in 2Q15. This was on account of a fall in crude oil and natural gas prices, which
impacted upstream earnings. Plus, crude oil and natural gas production volumes fell by 6.3% over
2Q15 to 2.1 billion barrels of oil equivalent per day in 2Q16."
Production has picked up recently though and there is more to come with several FPSOs in the
pipeline, as long as they can avoid major unplanned outages.
=== quote ===
Societies have a really hard time understanding what they're doing, articulating the problems
that they face and coming up with a coherent consensus about what's happening, and coming up with
a coherent consensus about what to do about it. Combine that with another quandary, the relationships
between energy and the dead racket for concealing real capital formation. I like to reduce it
to one particular formula that is pretty easy for people to understand.
It's a classic quandary: that oil priced at over $75 a barrel in today's dollars tends to crush
economies, and oil priced under $75 a barrel in today's dollars tends to crush oil companies.
There is no real sweet spot between those two places. We're ratcheting between them and each one
of them entails a lot of destruction.
That's a terrible quandary that we're in and it's being expressed in banking and finance…and
the people in charge of those things don't really know what else to do except continue the deformation
of institutions and instruments.
"... The USA has no business at all in Syria, was not invited in, and if it is allowed to get its way in this it will progressively control more and more Syrian territory until it succeeds in its objective of unseating and replacing Assad. Once more, it has no right to be there, and I'm sure Russia will pursue that angle at the seat of international law. ..."
"... The USA also has no right to impose no-fly zones arbitrarily on its own recognition in another sovereign nation. That's a UN decision, and they will never get that through the Security Council. If they try the R2P approach, who are they exercising their right to protect? ISIL? ..."
"... The problem is that once the US sets a military foothold in Syria there is nothing – outside of using military power – that Russia can do to oust the US from Syria. The international law does not apply to the US because it can break the international law without sanctions being used against it. If there is no punishment there is no incentive for adhering the law either. ..."
"... American Special Forces have already been caught wearing parts of Kurdish uniforms and badges ..."
"... On second reading, it's beginning to sound more like American bluster to me. The press tried to pin him down to no-fly zones or not, and he didn't want to back down but he didn't want to go quite that far so he said "Call it what you want". The USA has no authority to unilaterally impose no-fly zones in a sovereign country. It has to go through the UN, and Russia and China will veto it. The USA is not in Syria with the Syrian government's permission, and it has had what must be called very questionable success so far with 'fighting ISIS'. If it wants to 'protect its forces', it can leave, and the Syrian government will not miss it a bit. ..."
This is all about securing that pipeline route that the West hopes that it can some day build
from Qatar through Syria to Turkey. The US now claims that part of Syrian territory is their own
and it will be used to build that pipeline.
There is one accurate statement in there. The last one in the article. It's endgame time.
The USA has no business at all in Syria, was not invited in, and if it is allowed to get
its way in this it will progressively control more and more Syrian territory until it succeeds
in its objective of unseating and replacing Assad. Once more, it has no right to be there, and
I'm sure Russia will pursue that angle at the seat of international law.
But at the same time, Russia is legally in Syria, and I am sure it is not going to allow the
USA to tell it where it can and cannot fly in Syria. If the USA is really ready to go to war in
Syria, it is going to get it. And I don't think I have to point out to you the kind of logistic
nightmare it would be, especially if it can no longer count on Turkey. And I find it hard to believe
Erdogan will come on board with the USA carving out a Kurdish homeland right next door. Washington
is getting desperate, and that's making it act crazy. Let's see what China says about it.
The USA also has no right to impose no-fly zones arbitrarily on its own recognition in
another sovereign nation. That's a UN decision, and they will never get that through the Security
Council. If they try the R2P approach, who are they exercising their right to protect? ISIL?
What's the USA got in Syria for anti-air systems? Russia has the S-400, and can cover most
of Syria without even putting one of its own planes in the air.
The problem is that once the US sets a military foothold in Syria there is nothing – outside
of using military power – that Russia can do to oust the US from Syria. The international law
does not apply to the US because it can break the international law without sanctions being used
against it. If there is no punishment there is no incentive for adhering the law either.
Well, I guess we'll just have to see how it shakes out, won't we? I can tell you that if Syrian
forces come knocking to drive out ISIS from other towns after Aleppo falls, and the USAF says
it is going to stop them because its forces are mixed with ISIS in the town (remember, American
Special Forces have already been caught wearing parts of Kurdish uniforms and badges) it
is going to cut no ice with the Syrians – it's their country.
On second reading, it's beginning to sound more like American bluster to me. The press
tried to pin him down to no-fly zones or not, and he didn't want to back down but he didn't want
to go quite that far so he said "Call it what you want". The USA has no authority to unilaterally
impose no-fly zones in a sovereign country. It has to go through the UN, and Russia and China
will veto it. The USA is not in Syria with the Syrian government's permission, and it has had
what must be called very questionable success so far with 'fighting ISIS'. If it wants to 'protect
its forces', it can leave, and the Syrian government will not miss it a bit.
"... A recent MIT-Argonne report concluded deployment of short-term battery
storage could be economical at certain scales in the near future if prices continue
to fall, but that's a far cry from making extremely deep penetration of renewables
imminently possible. Their conclusion, as I understood it, was that zero-carbon
energy in the next decade or so would probably require a flexible zero-carbon source
as a large part of the mix. Flexible nuclear is really the only possibility in that
regard at present. ..."
"... I've become kind of jaded about breathless pronouncements about advanced
battery technologies by new startups. Those articles seem to appear right next to
the ones about the startups from a couple of years ago going tits up. I'm no expert,
though. They could be advancing faster than I realize. ..."
"... We can't fix the bridges. We can't get basic healthcare to all our citizens,
but somehow we have to update the entire grid in the next 15 years while drastically
reducing storage costs. I'm sorry, but I'm pessimistic about that happening that
quickly. Meanwhile, in the next 10, 20, 30 years we have to be concerned about where
we get the remaining 75%, 50%, etc. of our power. We are so far away from the last
10% being an issue that it is pointless to talk about. Steven Chu has been quoted
as saying that 50% by 2050 is probably a realistic goal. There is no technological
solution if it isn't financially viable. ..."
"... Krugman is way out of his depth when discussing any specifics regarding
climate change and related technologies, but he persists in overstepping his knowledge.
He probably couldn't tell you the difference between kilowatt-hour and a kilowatt.
He gets the big picture and the talking points, but I wish he'd stay away from things
he really doesn't understand. ..."
"... There is lots of profit in wars. The connected make a lot of money at war
and prepping for it forever. ..."
"... There are lots of money to be made fighting terror with first world weapons.
Terrorism could get in the way of the Saudi royals taking your money at the gas
pump. ..."
I'd be interested on what Krugman bases the claim "that progress in energy
storage looks increasingly likely to resolve the problem of intermittency."
As an avid reader of publications like Technology Review I've yet to read
any such optimism from engineers who should know that economical, utility-scale
energy storage is anywhere near solved. The price of wind and solar is no
longer the bottleneck in renewable pricing. Storage, batteries, and installation
costs are an increasingly high percentage of total costs, and those prices
are not rapidly decreasing.
Our current grid literally cannot handle a high percentage of renewable
power. Germany is running into problems at levels of 25% renewables. In
fact, their neighbors are complaining that the Germans are dumping excess
power that they can't use immediately or store on foreign grids, causing
blackouts in those countries. A breakthrough could happen at any time, of
course, but we could possibly be decades away from renewables being able
to technologically provide more than 50% of our energy with even concerted
effort. As an engineer, I tend to find pessimistic assessments more accurate.
In determining the cost and time for developing a new engineering solution,
whether it be code or widgets, do due diligence to analyze the challenges,
come up with an estimate, and then multiply everything by three.
My reading of the technology, and I could be wrong, is that many environmentalists
are probably living in a fantasy world if they believe that we could switch
to 100% renewables any time soon if only we had the will.
I don't claim to understand all or even most of the nuances myself, but
I'm not sure that these non-power engineers who just look at price curves
truly understand the scope of the challenge. It's not just right-wing oil
shills that point out the current hurdles for economical storage. Germany
has had as little as 5% of renewable capacity available for as long as at
least a week. An incredible amount of long-term storage has to be available
to guarantee power with no flexible source.
A recent MIT-Argonne report concluded deployment of short-term battery
storage could be economical at certain scales in the near future if prices
continue to fall, but that's a far cry from making extremely deep penetration
of renewables imminently possible. Their conclusion, as I understood it,
was that zero-carbon energy in the next decade or so would probably require
a flexible zero-carbon source as a large part of the mix. Flexible nuclear
is really the only possibility in that regard at present.
Naam like a lot of folks doesn't seem to believe that lithium-ion is
the ultimate solution, but flow batteries are even more speculative at industrial
scales. I've become kind of jaded about breathless pronouncements about
advanced battery technologies by new startups. Those articles seem to appear
right next to the ones about the startups from a couple of years ago going
tits up. I'm no expert, though. They could be advancing faster than I realize.
No you are not an expert, yet you have these unspecified concerns that things
may not work out. The question is not whether there will be unforeseen hurdles
that delay things, we know that to be very likely. The question is whether:
"that progress in energy storage looks increasingly likely to resolve the
problem of intermittency.". There is nothing in the current reality that
would contradict that statement. There are currently working storage technologies
that could be deployed locally to obtain the grid level storage capacity
needed. That would be less efficient than what they are working on for the
future, but if all else fails it would be good enough. So the issues is
financial not technological. You are putting up a straw man when you talk
about carbon free grid or a grid "without a flexible source" and "imminently
possible".
Neither Krugman nor anybody else here have set the bar that
high. The last 10% of getting there would be very expensive - and not make
much difference for global warming.
We're talking time scales here. There are enough people working on cancer
that I'm confident in saying that "a cancer cure is likely to be resolved",
unfortunately just not likely in my lifetime despite a lot of impressive
advances. Likewise, I'm quite confident that energy storage will be resolved
eventually, but policy decisions have to be based on what time scales those
solutions are likely to arrive. Those are my concerns, which I have specified
in detail.
There is no technology that is anywhere near proven at present that could
provide the "grid level storage capacity needed" at any but low levels of
renewable penetration. Naam's prices, if I interpreted his meaning correctly,
were looking at economical one-day storage at 2015 demand by like 2040.
However, that's not near enough storage for 90% renewables to even be on
the horizon by that late date.
We can't fix the bridges. We can't get basic healthcare to all our
citizens, but somehow we have to update the entire grid in the next 15 years
while drastically reducing storage costs. I'm sorry, but I'm pessimistic
about that happening that quickly. Meanwhile, in the next 10, 20, 30 years
we have to be concerned about where we get the remaining 75%, 50%, etc.
of our power. We are so far away from the last 10% being an issue that it
is pointless to talk about. Steven Chu has been quoted as saying that 50%
by 2050 is probably a realistic goal. There is no technological solution
if it isn't financially viable.
Okay, I went back and read Naam's article very carefully. If you want specific
concerns, here they are:
1. His "potential" solutions happen to be two technologies in which he
is invested and which, by his own admission, don't have enough of a track
record on which to base even his relatively simple price-volume analysis.
He's a bright guy, and I doubt he's being deliberately deceitful. However,
I also assume that he is not the one person on the planet that is immune
to confirmation bias when his self-interest is at stake. If I'm not going
to take the word of Chevron's CEO that his natural gas doesn't need to be
regulated for methane, I'm not going to assume Naam is completely objective
in making projections about technologies in which he is invested. It's a
good bet that he is overly optimistic.
2. You rake me over the coals for bringing up a total zero-carbon energy
portfolio, but that's exactly what Naam appears to be implying in his conclusion
that "the world is very much on path to achieving cheap enough storage to
allow 24/7 clean energy, and doing so in the next 15-20 years." That's in
a section entitled "Cheap, Zero-Carbon Power, 24/7." If you think that standard
is silly, ....
Moreover, his highly speculative projection doesn't have enough capacity
for one full day of storage being economical until after 2036. As I have
explained, that's not near enough storage to depend on variable sources.
Actual data on the dependability of renewable generation argues against
that. Power engineers can't keep their jobs providing energy 99% of the
time. That 1 day in a 100 will get them fired.
3. His analysis on how cheap batteries must get to be viable is confusing
to me. The advantages that he claims batteries have so that they don't have
to compete with base generation include:
a) reduction in peaker plants.
b) reduction in transmission and distribution lines.
c) utilities can keep their transmission lines full even during low-demand
hours, using them to charge batteries.
d) batteries reduce outages
That analysis seems to ignore the barrier to entry costs in making the
grid smarter so that it can handle a higher percentage of distributed renewables.
Determining how to evolve the grid is going to require some time-delaying
trial-and-error research as well.
Also, his own graph shows that low demand is at night. How do solar panels
charge batteries in the dark when demand is low? That would seem to imply
that source capacity would have to greatly exceed peak demand during the
day, which would make advantage 'a' unlikely as well. Wind might be viable
at night, depending on the location, the time of year, and daily weather.
The extreme variability of when charging is possible goes back to the scope
of storage needed to accommodate an extra watt of renewable energy on the
grid. For 'd' to be true you better have more than one day in storage.
None of these problems are technically infeasible at any cost or any
time frame, but solving them all and implementing them in an economical
manner is quite possibly, likely in my view, a project with much longer
time scales than he envisions. As such, the "OMG, we're all gonna burn up"
crowd probably needs to start making hard choices between promoting natural
gas or nuclear. For the next few decades none of the above probably isn't
an option.
Well, the solution is to return to slavery to reduce the costs of storage.
But, we should return to slavery to make everything cheaper.
Just think how high the labor force employment rate will be with broad
slavery, and by slashing labor costs, profits will soar, and with soaring
profits, gdp will grow at 10-20%!
So, let's make you a slave in a lithium production operation or in a
Gigafactory making battery Packs!
After all, as a worker, you are purely a drag on the economy, taking
money and burning it, or eating and pooping it, but never spending it.
We need to eliminate workers and have government put tax cuts in the
pockets of consumers so consumers will drive demand for robot production.
Krugman is way out of his depth when discussing any specifics regarding
climate change and related technologies, but he persists in overstepping
his knowledge. He probably couldn't tell you the difference between kilowatt-hour
and a kilowatt. He gets the big picture and the talking points, but I wish
he'd stay away from things he really doesn't understand.
I'd add that "magic bullet" thinking is a common enemy. Let's not forget
about the demand side. Demand response and efficiency have great potential
to accommodate higher renewables grid penetration and reduce total energy
requirements, respectively.
There are probably plenty of pragmatic "environmentalists", but I agree
that the most visible "environmentalists" are often either clueless are
so deep into their dogma that they cannot accept the complexities of implementation
and change. It's all "the corporations" and such.
We are using energy more efficiently, and that helps. However, I'm skeptical
that demand response is going to be a very large part of the solution. I
just don't see American customers, private or corporate, being willing to
go out of their way to modulate their energy usage, but perhaps I underestimate
their willingness.
Again, the data suggest that Paul Krugman is not correctly assessing the
relation being economic growth as such and greenhouse gas producing energy
consumption.
We can go to war for a perceived slight, go neurosis over global terrorism,
jump and down and scream oover a couple ebola cases, ... but we're going
to watch: the waters rise, the people be displaced and die trying to immigrate,
people by the millions die over global warming; and do almost nothing.
There is lots of profit in wars. The connected make a lot of money at
war and prepping for it forever.
There are lots of money to be made fighting terror with first world
weapons. Terrorism could get in the way of the Saudi royals taking your
money at the gas pump.
Ebola is a human interest story........ Lots of TV ad time sold.
Fighting wars, terror and Ebola makes money for suppliers.
Fighting climate disaster takes money from suppliers like the Kochs and
Saudi royals.
There is no money for most of the .1% in fighting climate change.
And the hatred on the right of Elon Musk is probably higher than for
Obama and only exceeded by hatred for Clinton.
Of course, enough of the .1% are giving Elon billions to change the world,
so much so that money losing Tesla keeps going up in market cap and whenever
SpaceX needs money, plenty of people happily give him money even as he makes
even crazier promises like a colony on Mars before he dies. Elon is not
claiming to be the saviour like Trump does, but he is working like hell
to save mankind from the disaster that Trump might create.
"... This suggests a civil war between factions that are fighting on a roughly level playing field with civilians caught in the middle, sometimes deliberately killed and sometimes dying because of indiscriminate fire. American politicians including Clinton sometimes talk as though Assad's forces are doing all the killing. It also seems odd that we are told the rebels need outside help so they can stand to Assad. Obviously they have had plenty of outside help– the death toll is what it is because the war keeps dragging on, but to hear Americans talk you'd think it was outgunned rebels along with civilians being massacred year after year, yet it seems 50,000 regular Syrian military along with tens of thousands of pro regime militia have been killed by the poorly armed rebels. ..."
I already answered your question RNB– the mainstream press, HRW, Amnesty, and various blogs. But
if you look at the numbers released, they don't quite fit the narrative. For example
Note a couple of things from the Syrian Observatory figures. First, civilians are about a third
of the total. The number of Syrian military dead plus associated militia is comparable to the
number of civilian dead ( not counting the estimated group) and the rebel dead, adding up the
different categories including outside forces, are smaller than the dead on Theproud government
side.
This suggests a civil war between factions that are fighting on a roughly level playing field
with civilians caught in the middle, sometimes deliberately killed and sometimes dying because
of indiscriminate fire. American politicians including Clinton sometimes talk as though Assad's
forces are doing all the killing. It also seems odd that we are told the rebels need outside help
so they can stand to Assad. Obviously they have had plenty of outside help– the death toll is
what it is because the war keeps dragging on, but to hear Americans talk you'd think it was outgunned
rebels along with civilians being massacred year after year, yet it seems 50,000 regular Syrian
military along with tens of thousands of pro regime militia have been killed by the poorly armed
rebels.
In the much smaller scale Gaza War the bulk of the deaths were Palestinian civilians– maybe
1500. Hundreds of Hamas fighters were killed and dozens of Israeli soldiers. That's more the kind
of ratio I would expect if the Syrian civil war fit into the framework given by American politicians
and pundits.
"... BHP went from $8 billion profit to $6 billion loss based on latest results ..."
"... This is a typical Wall Street racket. In this case oil producers are victims. ..."
"... It's a classic quandary: that oil priced at over $75 a barrel in today's dollars tends to crush economies, and oil priced under $75 a barrel in today's dollars tends to crush oil companies. There is no real sweet spot between those two places. We're ratcheting between them and each one of them entails a lot of destruction. ..."
"... That's a terrible quandary that we're in and it's being expressed in banking and finance…and the people in charge of those things don't really know what else to do except continue the deformation of institutions and instruments. ..."
"... "U.S. shale oil production is expected to fall for a tenth consecutive month in September, according to a U.S. government forecast released on Monday, as low oil prices continue to weigh on production. ..."
"Capital and exploration expenditure declined by 42% to US$6.4 billion
and is expected to decrease further to US$5.0 billion in the 2017 financial
year (BHP Billiton share)(5)."
I don't know if there is enough detail to say how much came from oil
and gas operations. The Samarco dam accident seems to be budgeted at $1.2
billion so far.
Petrobras made a small profit but less than expected:
"In 2Q16, Petrobras's earnings attributable to its shareholders stood
at $106 million compared to $171 million in 2Q15. This was on account of
a fall in crude oil and natural gas prices, which impacted upstream earnings.
Plus, crude oil and natural gas production volumes fell by 6.3% over 2Q15
to 2.1 billion barrels of oil equivalent per day in 2Q16."
Production has picked up recently though and there is more to come with
several FPSOs in the pipeline, as long as they can avoid major unplanned
outages.
=== quote ===
Societies have a really hard time understanding what they're doing, articulating
the problems that they face and coming up with a coherent consensus about
what's happening, and coming up with a coherent consensus about what to
do about it. Combine that with another quandary, the relationships between
energy and the dead racket for concealing real capital formation. I like
to reduce it to one particular formula that is pretty easy for people to
understand.
It's a classic quandary: that oil priced at over $75 a barrel in
today's dollars tends to crush economies, and oil priced under $75 a barrel
in today's dollars tends to crush oil companies. There is no real sweet
spot between those two places. We're ratcheting between them and each one
of them entails a lot of destruction.
That's a terrible quandary that we're in and it's being expressed
in banking and finance…and the people in charge of those things don't really
know what else to do except continue the deformation of institutions and
instruments.
"U.S. shale oil production is expected to fall for a tenth consecutive
month in September, according to a U.S. government forecast released on
Monday, as low oil prices continue to weigh on production.
"Total output is expected to drop 85,000 bpd to 4.47 million bpd, according
to the U.S. Energy Information Administration's drilling productivity report.
That is the lowest output number since April 2014.
"The EIA's previous forecast calling for an output decline in August
of 99,000 bpd was revised up to nearly 112,000 bpd, data shows.
"Bakken production from North Dakota is expected to fall 26,000 bpd,
while production from the Eagle Ford formation is expected to drop 53,000
bpd. Production from the Permian Basin in West Texas is expected to rise
3,000 bpd, according to the data."
Ron's graphs summarised this better but I don't have the previous history
to show it. Has anybody here explained why Eagle Ford drops are so much
more than Bakken?
Author, commentator and longtime friend-of-the-site James Howard Kunstler
returns to our podcast this week to discuss the importance of accurate diagnosis
-- in this case, of the scourge he sees as accelerating America's downslide
into economic and social decline: Racketeering.
More associated with the organized crime bosses of a century ago, it's not
a word used often these days. But that doesn't diminish in any way its relevance
to and impact on our lives today:
The disorders in politics that we're seeing now are really expressions
of the larger disorders in our economic life and our financial life.
That just happens to be the avenue that the expression is coming
out of. Another point I'd like to make is that the reason that people are
against Hillary or dumping on Hillary or don't like her, is because she's
a poster child for racketeering. I encourage people who are talking about
our circumstances and people who are interested in the news and election,
to use the word racketeering to describe what's going on in this country.
You really need the right vocabulary to understand exactly what's going
on.
Racketeering is just pervasive in all of our activities.
Not just in politics but in things even like medicine and education.
Obviously the college loan scheme is an example of racketeering. Anybody
who has to go to an emergency room with a child whose broken their finger
or something, is going to end up with a bill for $20,000. You know why?
Because of medical racketeering. And so, these are really efforts to money-grub
by any means necessary, often in ways that are unethical and probably illegal.
Let's use that word racketeering to describe our national situation.
And let's remember by the way, the activities of the central
banks is just another form of racketeering. Using debt issuance
and attempting to control interest rates in order to conceal our inability
to generate the kind of real wealth that we need to continue as a techno-industrial
society.
Societies have a really hard time understanding what they're
doing, articulating the problems that they face and coming up with a coherent
consensus about what's happening, and coming up with a coherent
consensus about what to do about it. Combine that with another quandary,
the relationships between energy and the dead racket for concealing real
capital formation. I like to reduce it to one particular formula that is
pretty easy for people to understand. It's a classic quandary: that
oil priced at over $75 a barrel in today's dollars tends to crush economies,
and oil priced under $75 a barrel in today's dollars tends to crush oil
companies. There is no real sweet spot between those two places.
We're ratcheting between them and each one of them entails a lot
of destruction . That's a terrible quandary that we're in and it's
being expressed in banking and finance...and the people in charge of those
things don't really know what else to do except continue the deformation
of institutions and instruments.
Click the play button below to listen to Chris' interview with James Howard
Kunstler (58m:21s).
"U.S. shale oil production is expected to fall for a tenth consecutive month
in September, according to a U.S. government forecast released on Monday, as
low oil prices continue to weigh on production.
"Total output is expected to drop 85,000 bpd to 4.47 million bpd, according
to the U.S. Energy Information Administration's drilling productivity report.
That is the lowest output number since April 2014.
"The EIA's previous forecast calling for an output decline in August of 99,000
bpd was revised up to nearly 112,000 bpd, data shows.
"Bakken production from North Dakota is expected to fall 26,000 bpd, while
production from the Eagle Ford formation is expected to drop 53,000 bpd. Production
from the Permian Basin in West Texas is expected to rise 3,000 bpd, according
to the data."
Ron's graphs summarised this better but I don't have the previous history
to show it. Has anybody here explained why Eagle Ford drops are so much more
than Bakken?
The DPR tends to overestimate the decline in the Eagle Ford.
Enno Peters uses Texas RRC data to estimate Eagle Ford output and that also
underestimates output for the same reason that Texas data in general is too
low because it is incomplete.
I have estimated Eagle Ford output by finding the percentage of total Texas
C+C output from the Eagle Ford for each of the most recent 24 reported months
and than multiplied this percentage by Dean Fantazzini's estimate of Texas C+C
output (which is better than any other estimate in my opinion).
The Chart below compares this method using Dean's estimate (DC estimate)
and the EIA estimate for Texas C+C output, to find Eagle Ford output through
June 2016.
The reason Eagle Ford output has decreased more rapidly is because the wells
decline more rapidly and because the ramp up in the Eagle Ford was more rapid
than in the Bakken/Three Forks so that a lot more wells are declining at once.
It shows the number of new wells completed in the Eagle Ford (he calls these
wells "first flow" as in the month that the well started producing oil). Compare
this chart to the Bakken chart in the post.
I don't know if they might have reached saturation in the sweet spots in
the Eagle Ford, they seem to have an advantage in Texas with infrastructure
and pipeline capacity, but a lot of that has now been established in North Dakota
so going forward the main advantage for Texas is lower transportation costs
to refineries.
> Has anybody here explained why Eagle Ford drops are so much more than Bakken?
Although the number of new wells producing dropped very similarly (relatively)
in these two basins, Eagle Ford wells decline faster after initial production.
You can see this most clearly by:
1. Going to my latest US presentation
here .
2. Go to the "Well quality" tab.
3. Group wells by "Basin".
=> You can see the profiles of the average well in each of the basins, and
that Bakken wells in general have a longer production life. Note that there
is some distortion as especially the early 2007-2008 Bakken wells (Sanish &
Parshall) were exceptionally good.
You can play with the "first flow" filter to see this for wells starting
in different years.
Thanks. Using your link above I created the following chart from your website.
I compare only wells with first flow from 2012 to 2016 because the Eagle
Ford play did not really start being developed as an oil basin until late 2010
and they probably hadn't really figured out optimal well spacing and frack setup
until 2012.
This demonstrates the steeper decline for the Eagle Ford that you refer to.
No, the "other" represents other horizontal wells that were drilled in Texas
in the last couple of years, outside the Eagle Ford & Permian area, e.g. in
the Barnett, Granite Wash, etc.
These charts from the EIA confirm your conclusions.
They show that, while IP rates in the Bakken and the Eagle Ford are similar,
EFS production rates are declining much faster.
Would be interesting to know if this is due to more rapidly falling reservoir
pressures, different completion techniques, or something else.
New-well oil production per rig is higher in the Eagle Ford.
Apparently, this is because EFS is shallower and it takes less time to drill
a well than in the Bakken.
As a result, more wells can be drilled by 1 rig in the same period of time.
To put Enno's "relatively" into perspective: Peak output of Eagle Ford used
to be bigger than peak output of Bakken. The more you have, the more you can
lose.
The number of drilled but uncompleted wells is bigger in the Eagle Ford.
According to Rystad Energy, it was 1000 as of May 2016 in EFS vs. 850 in the
Bakken.
The intentionally postponed (abnormal) part of the DUC inventory has been growing
much faster in the Eagle Ford than in the Bakken since mid-2015.
That could also explain steeper declines in EFS oil production vs. the Bakken.
Bloomberg shows a different trend in DUCs inventory: a decline in the Eagle
Ford vs. continued growth in the Bakken. That would suggest more resilient production
volumes in EFS.
But I think that Rystad's estimate is more reliable.
"... The Norwegian Petroleum Directorate reported that Norway's oil production in July reached its highest level in 5 years because many fields were "producing above prognosis ..."
"... Oil output of 1.728 million b/d was 10% above July 2015 and about 18% above this past June, which had 1.449 million b/d. [June production was low due to maintenance ..."
"The Norwegian Petroleum Directorate reported that Norway's oil production in July reached its
highest level in 5 years because many fields were "producing above prognosis."
Oil output of 1.728 million b/d was 10% above July 2015 and about 18% above this past June, which
had 1.449 million b/d. [June production was low due to maintenance – AlexS].
The July liquids total averaged 2.136 million b/d after combining the oil number with 375,000
b/d of natural gas liquids and 33,000 b/d of condensate."
"... The CIA agents running the Deraa operation from their office in Jordan had already provided the weapons and cash needed to fuel the flames of revolution in Syria. With enough money and weapons, you can start a revolution anywhere in the world. ..."
"... In reality, the uprising in Deraa in March 2011 was not fueled by graffiti written by teenagers, and there were no disgruntled parents demanding their children to be freed. This was part of the Hollywood style script written by skilled CIA agents, who had been given a mission: to destroy Syria for the purpose of regime change. Deraa was only Act 1: Scene 1. ..."
"... The Libyans stockpiled weapons at the Omari Mosque well before any rumor spread about teenagers arrested for graffiti. The cleric, visually impaired and elderly, was unaware of the situation inside his Mosque, or of the foreign infiltrators in his midst. ..."
"... The weapons came into Deraa from the CIA office in Jordan. The US government has close ties to the King of Jordan. Jordan is 98% Palestinian, and yet has a long lasting peace treaty with Israel, despite the fact that 5 million of the Jordanian citizen's relatives next door in Occupied Palestine are denied any form of human rights. ..."
"... However, the US strategy was to create a "New Middle East", which would do away with safety in Syria; through the ensuing tornado, aka 'winds of change'. ..."
"... Tunisia, Libya, Egypt and then Syria were the stepping stones in the garden of the "Arab Spring". But, the scenario in the Syrian mission did not stay on script. It went over deadline and over budget. The final credits have yet to be rolled, and the curtain has yet to fall on the stage. ..."
"... Syrians were wondering how Western writers could take the side of the terrorists who were foreigners, following Radical Islam and attacking any unarmed civilian who tried to defend their home and family. The media was portraying the terrorists as freedom fighters and heroes of democracy, while they were raping, looting, maiming, kidnapping for ransom and murdering unarmed civilians who had not read the script before the shooting began in Deraa. ..."
"... Deraa was the opening act of tragic epic which has yet to conclude. The cleric who was a key character in the beginning scenes, Sheikh Sayasneh, was first put under house arrest, and then he was smuggled out to Amman, Jordan in January 2012. He now gives lectures in America near Washington, DC. Just like aspiring actors usually find their way to Hollywood, which is the Mecca of the film industry, Sheikh Sayasneh found his way to the Mecca of all regime change projects. ..."
The day before September 11, 2001 was like any normal day in New York City. September 10, 2001
was unaware of the earthshaking events which would happen the next day.
Similarly, one might think the day before the violence broke out in Deraa, Syria in March 2011
would have been an uneventful day, unaware of the uprising about to begin.
But, that was not the case. Deraa was teaming with activity and foreign visitors to Syria
well before the staged uprising began its opening act.
The Omari Mosque was the scene of backstage preparations, costume changes and rehearsals. The
Libyan terrorists, fresh from the battlefield of the US-NATO regime change attack on Libya, were
in Deraa well ahead of the March 2011 uprising violence. The cleric of the Omari Mosque was Sheikh
Ahmad al Sayasneh . He was an older man with a severe eye problem, which caused him to wear special
dark glasses, and severely hampered his vision. He was not only visually impaired, but light sensitive
as well, which caused him to be indoors as much as possible and often isolated. He was accustomed
to judging the people he talked with by their accent and voice. The Deraa accent is distinctive.
All of the men attending the Omari Mosque were local men, all with the common Deraa accent. However,
the visitors from Libya did not make themselves known to the cleric, as that would blow their cover.
Instead, they worked with local men; a few key players who they worked to make their partners and
confidants. The participation of local Muslim Brotherhood followers, who would assist the foreign
Libyan mercenaries/terrorists, was an essential part of the CIA plan, which was well scripted and
directed from Jordan.
Enlisting the aid and cooperation of local followers of Salafism allowed the Libyans to move in
Deraa without attracting any suspicion. The local men were the 'front' for the operation.
The CIA agents running the Deraa operation from their office in Jordan had already provided
the weapons and cash needed to fuel the flames of revolution in Syria. With enough money
and weapons, you can start a revolution anywhere in the world.
In reality, the uprising in Deraa in March 2011 was not fueled by graffiti written by
teenagers, and there were no disgruntled parents demanding their children to be freed. This
was part of the Hollywood style script written by skilled CIA agents, who had been given a mission:
to destroy Syria for the purpose of regime change. Deraa was only Act 1: Scene 1.
The fact that those so-called teenaged graffiti artists and their parents have never been found,
never named, and never pictured is the first clue that their identity is cloaked in darkness.
In any uprising there needs to be grassroots support. Usually, there is a situation
which arises, and protesters take to the streets. The security teams step in to keep the peace and
clear the streets and if there is a 'brutal crackdown' the otherwise 'peaceful protesters' will react
with indignation, and feeling oppressed and wronged, the numbers in the streets will swell.
This is the point where the street protests can take two directions: the protesters
will back down and go home, or the protesters can react with violence, which then will be met with
violence from the security teams, and this sets the stage for a full blown uprising.
The staged uprising in Deraa had some locals in the street who were unaware of their participation
in a CIA-Hollywood production. They were the unpaid extras in the scene about to be shot.
These unaware extras had grievances, perhaps lasting a generation or more, and perhaps rooted in
Wahhabism, which is a political ideology exported globally by the Kingdom of Saudi Arabia and the
Royal family and their paid officials.
The Libyans stockpiled weapons at the Omari Mosque well before any rumor spread about
teenagers arrested for graffiti. The cleric, visually impaired and elderly, was unaware
of the situation inside his Mosque, or of the foreign infiltrators in his midst.
The weapons came into Deraa from the CIA office in Jordan. The US government
has close ties to the King of Jordan. Jordan is 98% Palestinian, and yet has a long lasting peace
treaty with Israel, despite the fact that 5 million of the Jordanian citizen's relatives next door
in Occupied Palestine are denied any form of human rights. The King of Jordan has to do a daily high-wire
balancing act between his citizens, the peace and safety in his country and America's interests and
projects in the Middle East. King Abdullah is not only a tight-rope walker, but a juggler at the
same time, and all of this pressure on him must be enormous for him, and Queen Rania, who is herself
Palestinian. These facts must be viewed in the forefront of the background painted scenery of The
Syrian Arab Republic, which has for the last 40 years had a cornerstone of domestic and foreign policy
carved and set in the principle of Palestinian human rights and Palestinian freedom and justice.
The US policy to attack Syria for the purpose of regime change was not just about the
gas lines, the oil wells, the strategic location and the gold: but it was about crushing that cornerstone
of Palestinian rights into dust. To get rid of President Bashar al Assad was to get rid of one of
the few Arab leaders who are an unwavering voice of Palestinian rights.
Deraa's location directly on the Jordanian border is the sole reason it was picked for the location-shoot
of the opening act of the Syrian uprising. If you were to ask most Syrians, if they had ever been
to Derra, or ever plan to go, they will answer, "No." It is a small and insignificant agricultural
town. It is a very unlikely place to begin a nationwide revolution. Deraa has a historical importance
because of archeological ruins, but that is lost on anyone other than history professors or archeologists.
The access to the weapons from Jordan made Deraa the perfect place to stage the uprising which has
turned into an international war. Any person with common sense would assume an uprising or revolution
in Syria would begin in Damascus or Aleppo, the two biggest cities. Even after 2 ½ years
of violence around the country, Aleppo's population never participated in the uprising, or call for
regime change.
Aleppo: the large industrial powerhouse of Syria wanted nothing to do with the CIA mission, and
felt that by staying clear of any participation they could be spared and eventually the violence
would die out, a natural death due to lack of participation of the civilians. However, this was not
to play out for Aleppo. Instead, the US supported Free Syrian Army, who were mainly from Idlib and
the surrounding areas, invited in their foreign partners, and they came pouring into Aleppo from
Turkey, where they had taken Turkish Airlines flights from Afghanistan, Europe, Australia and North
Africa landing in Istanbul, and then transported by buses owned by the Turkish government to the
Turkey-Aleppo border. The airline tickets, buses, paychecks, supplies, food, and medical
needs were all supplied in Turkey by an official from Saudi Arabia. The weapons were all
supplied by the United States of America, from their warehouse at the dock of Benghazi, Libya. The
US-NATO regime change mission had ended in success in Libya, with America having taken possession
of all the weapons and stockpiles formerly the property of the Libyan government, including tons
of gold bullion taken by the US government from the Central Bank of Libya.
Enter the Libyans stage right. Mehdi al Harati, the Libyan with an Irish passport, was put in
charge of a Brigade of terrorists working under the pay and direction of the CIA in Libya. Once his
fighting subsided there, he was moved to Northern Syria, in the Idlib area, which was the base of
operation for the American backed Free Syrian Army, who Republican Senator John McCain lobbied for
in the US Congress, and personally visited, illegally entering Syria without any passport or border
controls. In Arizona, Sen. McCain is in favor of deporting any illegal alien entering USA,
but he himself broke international law by entering Syria as an illegal and undocumented alien.
However, he was in the company of trusted friends and associates, the Free Syrian Army:
the same men who beheaded Christians and Muslims, raped females and children of both sexes, sold
girls as sex slaves in Turkey, and ate the raw liver of a man, which they proudly videoed and uploaded.
Previously, Syria did not have any Al Qaeda terrorists, and had passed through the war in neighboring
Iraq none the worse for wear, except having accepted 2 million Iraqis as refugee guests. Shortly
before the Deraa staged uprising began, Brad Pitt and Angelina Jolie were in Damascus and being driven
around by the President and First Lady. Pitt and Jolie had come to visit and support the Iraqi war
refugees in Damascus. Brad Pitt was amazed that the Syrian President would drive him around personally,
and without any body guards or security detail. Pitt and Jolie were used to their own heavy security
team in USA. Pres. Assad explained that he and his wife were comfortable in Damascus, knowing that
it was a safe place. Indeed, the association of French travel agents had deemed Syria as the safest
tourist destination in the entire Mediterranean region, meaning even safer than France itself.
However, the US strategy was to create a "New Middle East", which would do away with safety
in Syria; through the ensuing tornado, aka 'winds of change'.
Tunisia, Libya, Egypt and then Syria were the stepping stones in the garden of the "Arab
Spring". But, the scenario in the Syrian mission did not stay on script. It went over deadline
and over budget. The final credits have yet to be rolled, and the curtain has yet to fall on the
stage.
We can't under estimate the role that mainstream media had to play in the destruction
of Syria. For example, Al Jazeera's Rula Amin was in Deraa and personally interviewed the
cleric Sayasneh at the Omari Mosque. Al Jazeera is the state owned and operated media for the Prince
of Qatar. The Prince of Qatar was one of the key funders of the terrorists attacking Syria. The USA
was sending the weapons, supplies and providing military satellite imagery, however the cash to make
payroll, to pay out bribes in Turkey, and all other expenses which needed cold cash in hand was being
paid out by the Prince of Qatar and the King of Saudi Arabia, who were playing their roles as closest
Middle East allies of the United States of America. This was a production team between USA, EU, NATO,
Turkey, Jordan, Israel and the Persian Gulf Arab monarchies of Saudi Arabia and Qatar primarily.
The CIA has no problem with covert operations in foreign countries, and even full scale attacks,
but the matter of funding needs to come from a foreign country, because the American voters don't
care about killing people in Syria, but they would never agree to pay for it. As long as
the Arabs were paying for the project, that was OK by Mr. John Q. Public, who probably was not able
to find Syria on a map anyway.
Rula Amin and others of the Al Jazeera staff, and including the American CNN, the British BBC
and the French France24 all began deliberate political propaganda campaign against the Syrian government
and the Syrian people who were suffering from the death and destruction brought on by the terrorists
who were pretending to be players in a local uprising. Some days, the scripts were so similar that
you would have guessed they were all written in the same hotel room in Beirut. Onto the stage stepped
the online media personalities of Robert Fisk, from his vantage point in Beirut and Joshua Landis
from his perch in Oklahoma. These 2 men, sitting so far removed from the actual events, pretended
to know everything going on in Syria. British and American readers were swayed by their deliberate
one-sided explanations, while the actual Syrians living inside Syria, who read in English online,
were baffled.
Syrians were wondering how Western writers could take the side of the terrorists
who were foreigners, following Radical Islam and attacking any unarmed civilian who tried to defend
their home and family. The media was portraying the terrorists as freedom fighters and heroes of
democracy, while they were raping, looting, maiming, kidnapping for ransom and murdering unarmed
civilians who had not read the script before the shooting began in Deraa.
There was one
global movie trailer, and it was a low budget cell phone video which went viral around the world,
and it sold the viewers on the idea of Syria being in the beginning of a dramatic fight for freedom,
justice and the American way. From the very beginning, Al Jazeera and all the rest of the media were
paying $100.00 to any amateur video shot in Syria. A whole new cottage industry sprang up in Syria,
with directors and actors all hungry for the spotlight and fame. Authenticity was not questioned;
the media just wanted content which supported their propaganda campaign in Syria.
Deraa was the opening act of tragic epic which has yet to conclude. The cleric
who was a key character in the beginning scenes, Sheikh Sayasneh, was first put under house arrest,
and then he was smuggled out to Amman, Jordan in January 2012. He now gives lectures in America near
Washington, DC. Just like aspiring actors usually find their way to Hollywood, which is the
Mecca of the film industry, Sheikh Sayasneh found his way to the Mecca of all regime change projects.
PERIES: Ok. And, John, give us a sense of what Russia's interests are in this meeting. I mean, although
it was downplayed, they did have the meeting with Erdogan, and they were the first to acknowledge
and provide some support to Erdogan after the coup. We know that–
HELMER: –No support. No, no, that's not quite right. Russian policy is for stability on its borders,
its neighbors. Russia does not consider its national interests, its security interests, its border
stability, to be advanced if there are coups and revolutions in countries around the neighborhood,
whether that's Ukraine, the US did sponsor a coup in Kiev in February 2014, whether it's in Iran,
whether it's in North Korea, whether it's in China, or whether it's in Turkey. So the Russian position
was, stability in the neighborhood. The Russian position was Mr. Erdogan is the elected, constitutional
leader of that country, and what was happening was an attempt to kill him, overthrow him, so Russia's
position was stability in the neighborhood. That was the Russian position. It was stated rather quicker
than Mr. Kerry was capable of stating it when he was trying to put some money on whoever was the
winner and wasn't sure who would be the winner.
But the Russian position is really simple. It's good neighbor policy if you like, but let me try
and make it quick and short for you. First, Turkey should stop supporting and fueling and providing
safe haven and supplies for groups that threaten Russia to the North, threaten Syria to the south.
Threaten Iraq to the east. That means and end to support for ISIS, an end to support for the Chechen
Rebellion in the Russian Caucasus. It means an end to support for Crimean Tatar opposition to Russia.
It means an end Turkish support for the war against Armenia. That's number one. Number two, Russia
has always for the last several hundred years, as long as there are ships, and as long as there's
the sea, Russia wants free passage through the so-called Turkish straits, between the Black Sea,
the Aegean Sea, and the Mediterranean. The Turks claim that it's a territorial war, they often claim
that they lost several wars over this. Russia wants to see no expansion of NATO or enemy operations,
naval operations, in the Black Sea, facilitated through the Bosphorus, through the Dardanelles, through
the Turkish straits, at the behest and at the permission and the encouragement of the Turkish government.
Those are security issues, right? No response from Erdogan. In fact, he said at the press conference,
we didn't even talk about Syria, we'll talk about that a bit later in the afternoon. But as for that
meeting, there is no record that anything was said, because as I said before the Russian Foreign
Ministry has yet to acknowledge there was such a meeting. More important, on the [crosstalk] morning
on the day Erdogan– HELMER: Well, let me go back a minute. On the morning of Erdogan's arrival in
Saint Petersburg, there is a 30 minute interview that he gave to Russian state television, to the
Tass News Agency, which he made a number of statements which he didn't repeat in his press conference.
He called again for the overthrow of Bashar al-Assad. He again explicitly referred to support for
the Crimean Tatars and their opposition to Crimea's accession, to the Russian Federation.
Those are two very big no-no's, negatives. Aggressive remarks to make on the eve of your arrival
in Russia, so that there was nothing left to discuss when he got there. Instead there's a lot of
talk about talking.
A lot of talk about talking about the future economic relations between the two countries. The
revival of the two gas pipeline projects, the Turkish Stream and South Stream for Gazprom. The revival
of the nuclear reactor project, which is Russia's building at Akkuyu. Talk about reviving investment,
talk about improving visa conditions for Turkish workers in Russia.
On none of those things, none of those things was any agreement announced. All the sides did,
all the presidents said at their press conference was that they agreed to continue talking. And for
all Mr. Erdogan's dear friend Putin remark he kept making roughly, I timed him, every three to four
minutes of the time he's in front of the camera, nobody believes it. And he didn't offer anything
on which the Russian side could say we've reached a new stage.
He did, yes he apologized for the shoot down of the SU24, but he did not offer Turkish compensation
for the murdered pilot, Captain Peshkov. It was very clear Russian policy that Turkey should pay
compensation, just as it's been Turkish policy that Israel should pay compensation for the killing
of Turkish citizens in the famous vessel incident off the Gaza coast several years ago. Turkey insisted
on compensation from Israel. It took years, it's been achieved. Yet Turkey offers no compensation
when Russia has insisted, on little issues, on big issues, Erdogan offered nothing.
PERIES: And John, what now? In terms of moving forward with these two countries who are very pivotal
and very strategically located in terms of the Syrian conflict.
HELMER: Well, I wouldn't say that the direction is forward. From a Greek point of view, there
is increasing chaos. From a Greek and Cyprian point of view, there is increasing chaos in Turkey,
and around Turkey. And from one point of view, that's a small positive because it makes the Turkish
army less capable of expanding aggressively east, south, or west.
There is not improvement on Turkey's readiness to reach a solution for the withdrawal of troops
from Northern Cyprus, illegally there since the invasion of '74. There is no sign that Turkey will
relent in its support for the overthrow of Syria. There is no sign that Turkey will do anything to
remove the Chechen threat to Russia inside Turkey, so we're going to move sideways.
We're going to move, we will simply watch and see if Mr. Erdogan himself can survive. But the
way he describes his survival is that he's the democratic leader of Turkey, well that's true.
He produces these street displays of public support, and at the same time he distrusts his own
military forces so much that he not only purges the general, generals staff, he couldn't bring a
military officer in his delegation to Moscow yesterday. Not one military officer does Mr. Erdogan
trust enough to bring to the party in Moscow. Sorry, in St. Petersburg. The chief of the Russian
General Staff was there but no Turkish counterpart officer. Steve H. ,
August 14, 2016 at 10:27 am
Instability seems to be the best description. Erdogan has so many horses attached to his cart
it's hard to see what he wants. Beyond the billions stashed in the walls of his estates; I think
it was Russia that released the phone calls with his son talking about moving the cash.
We know he wants the cash, but is he an Islamic sultan first, or is his main horse the Turkic
language group, which pushes into the X-istans to the east? Or is he a Euro, or a Russian lackey?
Easier to see the view from Russia. No Islamic fundamentalism is a foundation stone. The Kurds
have been better friends to Russia on this, and Russia
reinforces success . That's close to a deal-killer for Erdogan. But he has to deal with the
strategic fact that Russia can control the Black Sea by closing the Bosphorus unilaterally. Assad
has managed to keep the same deal with Russia as the Kurds, so far. Erdogan has a lot of enemies
to keep close. Does he have any friends?
Funny, it's all speculation but I had the opposite thought.
Erdogan, allegedly in a position of weakness, runs to Mother Russia for help in his time of
need. But as Helmer notes, he brought bupkis to the table: no concessions on Syria, on Chechen
seperatist groups, on trade, or even bones of lesser contention like Nato troops in Cyprus or
fruit trade. The most obvious conclusion should be that his "failed" trip to Moscow was more signalling
than a desperate appeal for help. And at whom is Erdogan's signalling aimed? Well Helmer again
tells us: the only ones who think it was a salient rapprochment are the Western Press: yes the
same Western Press that are currently hyperventillating that the Russians Are Coming! To wit,
if you are Erdogan and you thought Victoria Nuland was going to be the next US Secretary of State,
what would be the best way to get the stuff you wanted? Especially when it comes to Cyprus, arms
to kill kurds, the overthrow of Assad, leverage with the EU, escalation vs. Iran….
And on top of this, Erdogan has priors: he used the European press paranoia about immigrants
to blackmail Merkl. He shot down a Russian fighter jet to ingratiate himself to Nato. And he's
actively re-courting Israel. None of this indicates a realignment toward Russia– in fact his lack
of concessions indicates the opposite.
Like I said, at this point we can only speculate, and I personally lean more to the possibility
that Erdogan saw the possibility of the coup happening and realised it could be to his advantage.
But if you look at his position before the coup: weak domestically, not fully accepted by the
West… and compare that to what he gets from the coup: elimination of enemies in a purge and the
ability to use the threat of a Putin-alignment to blackmail the US, I don't see how the self-coup
theory has been knocked on the head.
I think your theory is as likely as any. Its very hard to see what Erdogan is doing. I suspects
its a situation where he has been too clever by half and has wrapped himself up in knots in his
various schemes. But its also possible he is actively trying to create as much ambiguity and uncertainty
as possible in order to extract as much as possible from his 'allies'.
Seems Erdogan is playing hard ball negotiations. Hopes Russia needs him more than Turkey needs
Russia. And certainly he is doing the same with the EU. Undoubtedly he is playing both sides against
each other for the best deal he can get. Wonder if he is competent enough to play those sort of
games with someone like Putin.
Although an alternative possibility is that Erdogan is completely out of his depth and burning
bridges with everyone by making irrational demands on the EU, the US and Russia.
Putin seems to be the most rational statesman in all this.
One of the best things about Trump, I think, is that he realizes this and wants to work with
him rather than demonize him in support of imperialistic type goals.
If Erdogan can pretend to change his Syria policy while not doing so, he can also pretend to
not change this policy while doing so. When is he deceitful and when is he honest? We may need
more time for Turkey's new policies to become apparent. Does anyone know what policy Gulen or
the coup plotters wants toward Syria?
Does anyone know what policy Gulen or the coup plotters wants toward Syria?
Seems to be about as confused as Erdogan's.
This article on his website from 2011 is supportive of regime change, but this article from
2014 suggests that Gülenists within the media and the miltary/police/security organizations are
against intervention in Syria.
Interestingly,
this article from 2014 says almost the exact same things as we're seeing today about a Turkish
rapprochement with Russia and Iran.
Erodgan wants to be the caliph of the new Ottoman Empire, with the support of the Salafis in
Turkey, ISIS (or whatever) and Saudi Arabia.
As a supplier to ISIS for these reasons, he has no common ground with Russia, who wants an
end to Muslim Unrest, because it fuels problems for the Russian like Chechnya, and the other Muslim
states along the silk road.
Russia wants to ensure the Black Sea is no blockaded, because Sevastopol is their warm water
port, and has been both very important and controlled by Russia for over 400 years.
Erdogan, one expects,is hoping for "approval" from the United States to invade Syria to "keep
the peace," which would be a great step towards a unified Salafi empire.
The Middle East was, is, and will be the cockpit of the world for the foreseeable future.
Before considering events in the Middle East:
1. Know you history
2. Know your geography – look at the maps of borders for the last 1,000 years
3. Analyze ambitions in,and for, the Middle East
This opens the door for others, about a month ago the Russians, Iran's, Syrians meet in Russia.
They need to put aside their differences because Hillary coming back onto the world stage with
every bat-shit-crazy neo-conn at her command. Turkey sees that also. They are all stronger together
and throw in China in the back ground and who knows.
Erdogan awaits the results of America's election. He hopes that Clinton gets elected because
Clinton shares Ergogan's goal of toppling Assad in order to install a Jihadi Cannibal Terrorist
LiverEater government over all of Syria.
If Trump defeats Clinton ( unlikely I know), and if Trump then purges hundreds or thousands
of pieces of radioactive Clintonite Filth out of the relevant parts of the Administrative Branch
of Government ( even unlikelier) such that he can forcibly and semi-violently impose a "peace
with Russia" policy upon an unwilling DC FedRegime Government; then Erdogan may eventually give
up on getting Trump's support to topple Assad and install a Jihadi Terrorist government. What
would Ergogan do then? Where would he turn?
I think that some of the other commentators here are overly disparaging of Erdogan.
Erdogan is a skilful and gutsy politician, with a large body of support in his country.
I mean, for God's sake, we just saw that man totally punk the old-line Kemalists in
Turkish officer corps!
Late last year, despite the Syrian imbroglio and mounting tension with the Kurds, Erdogan won
a convincing electoral victory. His party formed an outright parliamentary majority.
When Erdogan meets Putin, that is a meeting of peers.
I'll repeat the prediction I have already made a couple of times on this site: Erdogan is stringing
Putin along until after the US election.
By the time Clinton is inaugurated in 2017, Erdogan will have finished purging the suspect
elements in the Turkish officer corps. Turkey will then be ready to play an important role in
the US-led escalation of the conflict against Syria and Russia.
But for the next 5-6 months, Erdogan wants to keep relations with Russia from going foul. That
way the Russians might not want to make a more intense effort to help the Syrians recapture all
of Aleppo.
It's a tough situation for Putin. If Russia steps up the offensive at Aleppo, it would be easy
for Erdogan and Clinton to use that as a pretext for their own escalation. If Putin waits for
2017, Erdogan and Clinton are likely to escalate anyhow–they'll make whatever pretext they need.æ
A reasonable argument, but if Putin knows anything, it's that he can't trust Erdogan, no matter
what the truth vis a vis US involvement in the coup or who may have tipped off or otherwise saved
Erdogan's regime. Erdogan was an utter fool to become involved in Syria, and like the Saudis and
Saddam before him, allow his ego to be captured by dreams of wider regional power and influence
under US auspices – in exchange, as always, for going to war against a US enemy. Anyone as encumbered
as Erdogan is an ally to be kept close enough to be useful, but not within striking distance.
I think the meeting was likely very serious, and I expect Erdogan and Putin both were looking
for something from the other indicating where there might be wiggle room vis a vis what everyone
expects is coming under Clinton, but which may already be underway – a major influx of new rebels/ISIS
into the fray in Syria amidst escalating calls for direct US intervention as per Libyan version
of a 'no-fly zone'.
Too bad for Turkey. Had they not become involved in this disastrous regime-change operation,
Erdogan could've maintained his balancing act with relative ease. The focus of his Government
would've been the continued development of what has become a large, dynamic economy capable of
playing the role of Bridge from the West to an East that included Russia.
I don't know how many rabbits can be left in Putin's hat. The US really wants its 30 years
of war to transform all the regions attacked back into desert and I really don't expect Putin
to go all the way to the wall to stop them. But he does want the world to know what's happening.
That's a fair assessment. What I wonder is how much Erdogan's Islamic beliefs effect his judgement
and how much his wanting to revive the Ottoman Empire effects it. Seems to me that betraying ISIS
would have been an easy concession for him to make to Russia. Yet he's still determined to get
rid of Assad and anyone who says that supports ISIS because ISIS is the only means of achieving
that result. Does Erdogan continue as an ISIS ally because of: 1) ideologically they are two sides
of the same coin? 2) The Saudis are sending him money he doesn't want to give up? 3) he wants
continued chaos to have the opportunity to take advantage at Syria's or the Kurds expense? 4)
he fears the US more than Russia? After all, America destroys countries, Russia uses diplomacy,
which is less threatening.
Could go on endlessly with all these questions. I suspect the easiest conclusion to reach is
that Erdogan is biding his time until the US election results. After all, you couldn't have a
more starker choice: Clinton and full support for anything anti-Russian or Trump and a healing
of relations, in which case being Russia's would be a good thing. I guess the fly in the ointment
is a NeoCon Presidency producing another neocon disaster, meaning Russia kicks NATO's butt, including
Turkey.
I can't help but note that what Erodgan offers to each party – Russia, the US and Europe –
is negative. Doesn't that make it inevitable he ends up with no friends? For goodness sake, he
only runs Turkey – and a divided Turkey! He's a few centuries too late for that to strike any
existential fear into his adversaries. Overplaying his hand perhaps?
likbez
> I guess the fly in the ointment is a NeoCon Presidency producing another neocon disaster,
meaning Russia kicks NATO's butt, including Turkey.
The next "neocon disaster" is the most probable outcome, but there one a countervailing factor
to "new American militarism" (Bacevich) type of adventurism. The idea that the establishing and
maintaining the global neoliberal empire by direct interventions is worth the price we pay as
it will take the USA into the period of unprecedented peace and prosperity is now discredited.
Prosperity is reserved to top one or ten percent and that factor can't be hidden any longer.
I think the US elite became split and a smaller part of Washington establishment started to
understand that the US neocons overextended the country in permanent wars for permanent peace.
In wars for extension of the global neoliberal empire. Much like Britain became exhausted from
British empire project before.
It well might be that soon the impoverishment of the population and, especially, lack of job
and shirking middle class, become an internal political instability factor that will force some
changes.
With the total surveillance in place the elite has probably pretty decent picture of the mood
of the population. And it is definitely not too encouraging for another reckless neocon experiment.
Also the power of MSM brainwashing started to wear down and neoliberalism as an ideology that
keeps the current Washington elite in power is in crisis.
The USSR crushed approximately in 20 years after the communist ideology became discredited
by the inability to raise the standard of living of the population. The same is happening with
neoliberalism. If we count from 2008, neoliberalism probably still has another 12 years or three
presidential terms. That means that if "this Trump" fails to be elected, the "next Trump" might
be much more dangerous for Washington neocons.
In a way, emergence of Trump is a sign that the elite can't govern the old way and population
does not want to live the old way. Degeneration of the US neoliberal elite is another factor.
Looks at quality of presidential candidates - Hillary and the bunch of narrow minded fanatics
they produced for Republican nomination as well as the level of Washington detachment from reality
- "let them eat cakes" stance , Those factors will only increase internal political tension that
already demonstrated itself in recent riots.
Situation with oil is also dangerous. Artificial suppression of oil prices destroys the US
oil producers. They probably will manage to keep the prices low in 2016. Then what?
The reasons for slow growth should be fairly clear by now
--
(1) With labor costs held in check by the combination of a
global surplus of labor, businesses' ability to offshore
production, and the suppression of unions, there's little
reason for businesses to invest to enhance productivity.
(2) With demand no longer artificially boosted by
consumers taking on excessive debt, and with their wages
suppressed -- there's little reason for businesses to expand
production.
(3) With profits boosted by increasing rents, there's
little reason for businesses to invest in expanding
production or improving or introducing new products/services.
(4) With distorted equity markets and stock-based
compensation rewarding profit extraction and punishing
investment, there's actual disincentive for businesses to
invest in enhanced technology and increased productivity.
(5) With the taxation of business/capital income near
historic lows, there's little incentive to divert profits to
investment rather than to distribution and wealth
accumulation.
Combine all of these factors and we've got an economy that
is consuming its seed corn and failing to share the wealth
and invest for the future. Welcome to the real World of John
Galt!
consuming its seed corn and failing to share the wealth and
invest
"
Second the motion! There are about 600 billionaires
within the billionaire caste of this nation. There are about
44 million of millionaire families in the millionaire caste
of this nation. There are over 222 million hapless poor folks
of this nation.
After each election the regressive taxation against the
poor folks rises. Sure!
Federal tax is progressive, but the hooker is the state
income tax and state sales tax plus regressive licensing fees
and the list goes on. Look!
We don't know what kind of taxes the Krugmann class pays.
Only know what they hint at, but we know what we pay and it
gets bigger after each election, each election chock full of
pK promises from the political insider establishment that
rules over the poor folks. And we're getting
'tard of
it --
Paine :
, -1
Center left
Okay I see the center and I guess she's facing left or should
I say forward
But she's one of two possible faces of Janus
The god of the status quo
Ie the god of the center looking right or left as the ind
blows
And going as close to no where as is practical
It's hard to imagine what PK thinks he's accomplishing
here
He's like these old men I see on road bikes peddling like
crazy and moving forward like a slug
He's more liberal academic
I guess
then academic progressive
DrDick -> Paine...
, -1
Have to agree in general. I think the "left" bit is that she
wants to make some small tweaks to mitigate (though not
significantly lessen) inequality. Only baby steps are
allowed, no great leaps forward can even be considered
(though, as Reagan demonstrated, great leaps backward are
perfectly possible).
Peter K. -> Paine...
, -1
"For while the U.S. has done reasonably well at recovering
from the 2007-2009 financial crisis, longer-term economic
growth is looking very disappointing."
Wage earners and the
job class haven't done reasonably well. Krugman is just
wrong. The center-left want citizens to be thankful they just
have a job.
Economic growth is the worst on record. But yes let's
blame it on structural factors.
JohnH -> Paine...
, -1
"Center-left"...the new posture for the sales pitch...what
gets delivered will be far different...just like Obama, who
invested the most political capital into TPP.
JohnH -> anne...
, -1
Far be it for PK to acknowledge what actually happened at the
end of Clinton42's term that might have depressed long term
growth--granting China access to the WTO (ushering in the
great sucking sound of jobs going to China;) end of
Glass-Steagall, and deregulation of commodities trading.
A
good start for the presumptuous Clinton45 would be to disavow
some of the damage her husband did. Otherwise her promises
ring hollow.
Disavowing Clinton42's bad economic policies at the end of
his presidency would also make Krugman more credible.
Paine :
, -1
"When centrists urge us to
look away from questions of
distribution and fairness
and focus on growth instead,
all too often they're
basically running away from
the real issues that divide
us politically."
Now that is a truth we can
hold to be self evident
But worth a whole column
Here it's merely the
background motivator
To a st hill valentine
Made of melting fudge
I'm pretty sure all they do is average the actual trends over
the previous full business cycle to smooth away the booms and
busts, then adjust for things like changes in the projected
population or labor pool size, and extrapolate into the
future.
It's all based on the idea that, despite downturns,
over the *long run* the country's actual ouptut equals its
potential output.
"... CBS can go shove itself in its own collective anus: http://rudaw.net/english/middleeast/syria/120820162 Daesh retreats from Manbij with 2000 civilian hostages. Some humanitarians. ..."
"... Good catch. I hope Assad knows better than to give any legroom to these monkeys, because the SDF is just a rebranded Free Syrian Army. Most are not even Syrian, but Libyan and other mercenaries. Washington keeps changing their acronyms, but the aim remains unchanged – the overthrow and replacement of Assad. ..."
Watching CBS news as I write :
– Rebels rescuing women and children and taking to hospitals (looking staged for cameras)
– Air strikes destroy only remaining hospitals (videos showing piles of medical equipment which
did not appear to have been damaged by fire or blast)
– Syrian government would not respond to inquiries from CBS news about air strikes on hospitals
in Aleppo. The reporter inferred that since the government did not deny the air strikes, they
must be the perpetrators.
Amazing. Child beheaders are portrayed as rescuers of women and children and the forces trying
to defeat them are labeled as murderers.
Remarkable. But a time-tested technique frequently used in the past to portray Palestinian violence
against Israelis. And Hezbollah has been frequently accused as well of faking damage and deaths
in order to cultivate sympathy. I guess everybody does it. But it is in western interests to portray
'rebels', especially pet 'rebels' like the White Helmets, as closet humanitarians and the Syrian
government as the liver-eaters. I think a lot of observers just expect it now and automatically
discount about half of what is said.
Good catch. I hope Assad knows better than to give any legroom to these monkeys, because the
SDF is just a rebranded Free Syrian Army. Most are not even Syrian, but Libyan and other mercenaries.
Washington keeps changing their acronyms, but the aim remains unchanged – the overthrow and replacement
of Assad. After that, things will go one of two ways; Assad will be replaced by a compliant
western toady who will let Washington have a free hand to dabble, or he will be replaced by someone
ineffective who will lead the country to collapse, at which time the west will have to step in
to save it.
With about 1900 megawatt output, this was once the largest power plant in the world according
to a news story. The plant will likely be out of service for many months if not a few years assuming
that there is sufficient economic justification to undertake the repairs.
Downing Street-controlled BBC disapproves the thawing of relations between Russia and Turkey.
Russia and Turkey: An 'alliance of misfits'?
It was a gesture that ended a crisis. The leaders of Russia and Turkey met on Tuesday to
shake hands and declare a formal end to an eight-month long war of words and economic sanctions.
Iran July crude output 3.63 mill b/d, flat from June, according to PlattsOil
OPEC survey. 1st time this year no month-on-month increase
Last month: Iran oil output 3.66 mln bpd in June, up 50,000 bpd on May and
up 750,000 bpd since sanctions were lifted.
Iran says, oil exports over 2.5 million bpd, near pre sanctions level
Iran: VP Jahangiri on Sunday: IPCs soon to be signed. $220 billion worth
of projects are ready for investment in the oil sector.
Iran are just finalising the petroleum contract details and will start engaging
foreign companies for JVs, although the coming Presidential elections might
mean they have to start all over again. I can't see there is that much difference
now to what was happening before the sanctions, but the important point
will be how much per barrel the outside companies can negotiate.
The oil is mostly in mature, carbonate reservoirs; often originally developed
without pressure support but now with gas and some water injection. I think
they are only getting around 20 to 25% recovery. They are looking for more
of the same to support increased production but also EOR (e.g. maybe miscible
gas?) to increase recovery. Gas injection is not cheap – the gas has to
be bought (might be 10 to 15% of the oil price if natural gas is used –
even if you get it back during end of life blow down it doesn't help current
NPV much), and the compressors, treatment plants and pipelines needed are
capitally and operationally intensive, and take some time to design and
install. So Iran will be asking the foreign majors to take on even more
debt and risk to increase production some years in the future, based on
probably flat rate per barrel payments. It will be interesting to see how
the negotiations turn out (e.g. what price per barrel the companies are
looking for, their appetite to take all the debt burden and how much they
get to know about the reservoirs), especially as the similar Iraq efforts
may be looking a bit disappointing to some at the moment.
With South Pars still ramping up they should be around 18 to 20% condensate
in their overall production mix, so maybe they took condensate out of the
export's while their were sanctions. Alternatively they have a strong petrochemical
industry and use LPG for domestic car fuel as well so maybe the export mix
is different.
Iran's refinery expansion program includes construction of five new refineries
and expansion of existing plants.
At least three of the new processing plants should accommodate the country's
rising condensate supplies:
• Already under construction in Bandar Abbas, the Persian Gulf Star Refinery,
due for startup in 2017, will have capacity to process 360,000 b/d of condensate
from South Pars field
• Also under construction is 480,000-b/d gas condensate refinery in Siraf,
which should process stabilized gas condensate feedstock from different
phases of South Pars.
• 120,000-b/d Pars condensate refinery in Shiraz, scheduled for startup
in 2025.
"... Interesting that now we have multi billion dollar companies doing the same. Just listening to Harold Hamm talk, he seems little concerned about the price of oil and gas. He seems most concerned about regulation of the industry. The catch phrase now is every well not drilled in the US is funding terrorism. Hamm claims we can be completely oil independent. Interesting he doesn't mention what oil price he thinks is needed to accomplish that goal. ..."
SS says, "We have guys in the industry who make their money, not off the oil, but off the promotion
of new wells. It has been that way for decades." it has been that way since the very start of our industry :-)
Interesting that now we have multi billion dollar companies doing the same. Just listening to Harold Hamm talk, he seems little concerned about the price of oil and gas.
He seems most concerned about regulation of the industry. The catch phrase now is every well not drilled in the US is funding terrorism. Hamm claims we can be completely oil independent. Interesting he doesn't mention what oil price
he thinks is needed to accomplish that goal.
EOG lost 4.5 billion dollars in 2015 and 747 million thus far in 2016. CLR and MRO are also
net losers in 2016. In fact, of the 17 public shale oil companies I've looked post 2Q 2016, total
losses are over 7.5 billion dollars. NONE of them made money in 2015 and none have thus far made
money in 2016.
I have run a 12M pound frac described above using pre-pads, spacers and increasing sand concentrations
per incremental stage commonly used in shale wells thru my computer programs and indeed a frac
like that would require every bit of 600,000 bbls of fresh, potable water suitable for human consumption.
That's 25 million gallons, not 1.6 gallons (my bad), enough water for 335,000 people to consume…one
well. Fresh water is a big deal, particularly in the arid West, and for all the bullshit about
use of wastewater, or brackish water in the Permian, for instance, very little of that has actually
been done yet. The shale industry, after all, is not well known for telling the truth.
For those "open minded oil men with actual experience in the oilfield, capable of critical
thinking skills," its possible, it seems, to ignore lack of profitability, debt and the complete
failure of the shale oil business model. That's all fine and dandy; you can't be helped much by
way of thinking. But forsaking fresh water to cram more sand in a stinking shale well that is
STILL not going to pay out at any oil price less than 80 dollars a barrel… is pretty stupid. Oil
prices remain low, primarily because of an oversupply of light, tight condensate we cannot get
rid of (imports are up, not down) and drilling any shale oil well right now makes no sense whatsoever.
Its keeping prices low and people out of work. It may be entertaining to surf the internet for
techno-dribble about the shale industry but the US LTO industry is now foolishly drilling wells
that are unnecessary and unprofitable. That is NOT good for America's energy future.
I don't think you "hate to be dismissive of anyone views," you do it all the time and in a
rude, condescending manner, Tea. The only way you can make a point appears to be at others expense.
We're all close minded, or incapable of intellectual process, it seems, if we don't agree with
you.
How about changing that handle to Kansas Tea? As a Texan, I am offended.
Till the LTO companies release payout statements, I call bull sh#%.
If I was getting wells to payout at current prices, I'd be advertising it to the world, were
I a public company.
But no one is, so therefore I assume they are all losing their a$@es.
XTO has lost a fortune in the shale basins since Q1 2015. So has Statoil. I'd think given the
brain power these companies have, if anyone could figure a way not to lose money at LTO, they
could. But they haven't. Why? LTO is high cost.
Schlumberger's CEO says little new tech has been unleashed, that most of the cost savings is
the result of service companies slashing costs to the bone. He says that cannot continue, is not
sustainable.
Hang in there Mike. When I hear the LTO guys say it is possible that US can be oil independent,
if only the gubment would stay out of the way, I know they are full of it.
What price would we need to get US oil production to 17 million barrels per day?
"... As worldwide net exports capacity barely changed over the last ten years, the fall of net imports from 2008 to 2015 created a gap of surplus export capacity of 4 mill b/d in 2015. Even higher Chinese and Indian net oil imports could not compensate for the fall in worldwide net imports. Should US producers really increase production (and reduce US net imports further) over the coming years, this gap will not vanish and oil prices will be low. If US oil producers go as far as oil independence over the next ten years, it will take ten years until the oil price can go up again as this will bring out another 6 mill b/d of net imports which gives a total gap of 10 mill b/d. This gap can only be filled by China and India (together roughly 1 mill/d per year) over the next ten years. ..."
"... It would make much more sense for US producers to cut production another 2 mill b/d, which will bring up the oil price with the help of higher Chinese and Indian net imports over the next two years ( net imports would then surpass net exports of 40 mill b/d again), and then reduce net imports at a slower rate than Chinese and Indian growth. This could be done at much higher oil prices and much less pain for shareholders and investors. ..."
"... With hindsight this is what US oil producers should have done over the last five years. It was just unnecessary greed, which has led to the current disaster. It is unrealistic to expect low cost oil producers to cut net export capacity. As long this capacity is there, it will be used. It is however another question how much oil net exporter can increase their capacity. This is in my view another unlikely scenario. ..."
"... That shows nothing, of course. The price of oil in Argentina is now over $67/barrel. ..."
"... Oil price won't be low for long – deep see oil will see no investments if prices keep low for longer, 3rd world states with low production costs but high deficit will go into political unrest – and won't invest in infill drilling, gas injection to keep up performance, but in weapons and bribing important people. ..."
"... No one except the US shale producers can keep producing red ink permanently – so if there will be cheap oil, it will be much less than now. It's like filling a car in the socialistic countries in the 80s – you will pay only cheap money, but will have to wait to get some gas. ..."
As oil moved down during the last few days, the question arises about where oil prices are
heading for the next few years. Wall Street and friends have advertised for the x-th time that
oil prices will be at 70 by year end , by the summer, by fall …
…some people are not so sure about higher oil prices in the future.
My personal view is that it is in the hands of Wall Street and US oil producers, where oil
prices are heading. Below chart shows that US oil producers triggered themselves the fall in oil
prices by rapidly reducing US net imports since 2008. From 1991 wordlwide increasing net imports
– up a staggering 15 mill b/d – drove the oil price to record highs when net imports went over
available net exports of 40 mill b/d.
As worldwide net exports capacity barely changed over the last ten years, the fall of net
imports from 2008 to 2015 created a gap of surplus export capacity of 4 mill b/d in 2015. Even
higher Chinese and Indian net oil imports could not compensate for the fall in worldwide net imports.
Should US producers really increase production (and reduce US net imports further) over the coming
years, this gap will not vanish and oil prices will be low. If US oil producers go as far as oil
independence over the next ten years, it will take ten years until the oil price can go up again
as this will bring out another 6 mill b/d of net imports which gives a total gap of 10 mill b/d.
This gap can only be filled by China and India (together roughly 1 mill/d per year) over the next
ten years.
It would make much more sense for US producers to cut production another 2 mill b/d, which
will bring up the oil price with the help of higher Chinese and Indian net imports over the next
two years ( net imports would then surpass net exports of 40 mill b/d again), and then reduce
net imports at a slower rate than Chinese and Indian growth. This could be done at much higher
oil prices and much less pain for shareholders and investors.
With hindsight this is what US oil producers should have done over the last five years.
It was just unnecessary greed, which has led to the current disaster. It is unrealistic to expect
low cost oil producers to cut net export capacity. As long this capacity is there, it will be
used. It is however another question how much oil net exporter can increase their capacity. This
is in my view another unlikely scenario.
Oil price won't be low for long – deep see oil will see no investments if prices keep low
for longer, 3rd world states with low production costs but high deficit will go into political
unrest – and won't invest in infill drilling, gas injection to keep up performance, but in weapons
and bribing important people.
North sea oil will die, it's already in decline and if a few producers stop the common infrastructure
will be too expensive for the rest to maintain.
No one except the US shale producers can keep producing red ink permanently – so if there
will be cheap oil, it will be much less than now. It's like filling a car in the socialistic countries
in the 80s – you will pay only cheap money, but will have to wait to get some gas.
"... As worldwide net exports capacity barely changed over the last ten years, the fall of net imports from 2008 to 2015 created a gap of surplus export capacity of 4 mill b/d in 2015. Even higher Chinese and Indian net oil imports could not compensate for the fall in worldwide net imports. Should US producers really increase production (and reduce US net imports further) over the coming years, this gap will not vanish and oil prices will be low. If US oil producers go as far as oil independence over the next ten years, it will take ten years until the oil price can go up again as this will bring out another 6 mill b/d of net imports which gives a total gap of 10 mill b/d. This gap can only be filled by China and India (together roughly 1 mill/d per year) over the next ten years. ..."
"... It would make much more sense for US producers to cut production another 2 mill b/d, which will bring up the oil price with the help of higher Chinese and Indian net imports over the next two years ( net imports would then surpass net exports of 40 mill b/d again), and then reduce net imports at a slower rate than Chinese and Indian growth. This could be done at much higher oil prices and much less pain for shareholders and investors. ..."
"... With hindsight this is what US oil producers should have done over the last five years. It was just unnecessary greed, which has led to the current disaster. It is unrealistic to expect low cost oil producers to cut net export capacity. As long this capacity is there, it will be used. It is however another question how much oil net exporter can increase their capacity. This is in my view another unlikely scenario. ..."
"... That shows nothing, of course. The price of oil in Argentina is now over $67/barrel. ..."
As oil moved down during the last few days, the question arises about where oil prices are
heading for the next few years. Wall Street and friends have advertised for the x-th time that
oil prices will be at 70 by year end , by the summer, by fall …
…some people are not so sure about higher oil prices in the future.
My personal view is that it is in the hands of Wall Street and US oil producers, where oil
prices are heading. Below chart shows that US oil producers triggered themselves the fall in oil
prices by rapidly reducing US net imports since 2008. From 1991 wordlwide increasing net imports
– up a staggering 15 mill b/d – drove the oil price to record highs when net imports went over
available net exports of 40 mill b/d.
As worldwide net exports capacity barely changed over the last ten years, the fall of net imports
from 2008 to 2015 created a gap of surplus export capacity of 4 mill b/d in 2015. Even higher
Chinese and Indian net oil imports could not compensate for the fall in worldwide net imports.
Should US producers really increase production (and reduce US net imports further) over the coming
years, this gap will not vanish and oil prices will be low. If US oil producers go as far as oil
independence over the next ten years, it will take ten years until the oil price can go up again
as this will bring out another 6 mill b/d of net imports which gives a total gap of 10 mill b/d.
This gap can only be filled by China and India (together roughly 1 mill/d per year) over the next
ten years.
It would make much more sense for US producers to cut production another 2 mill b/d, which
will bring up the oil price with the help of higher Chinese and Indian net imports over the next
two years ( net imports would then surpass net exports of 40 mill b/d again), and then reduce
net imports at a slower rate than Chinese and Indian growth. This could be done at much higher
oil prices and much less pain for shareholders and investors.
With hindsight this is what US oil producers should have done over the last five years. It
was just unnecessary greed, which has led to the current disaster. It is unrealistic to expect
low cost oil producers to cut net export capacity. As long this capacity is there, it will be
used. It is however another question how much oil net exporter can increase their capacity. This
is in my view another unlikely scenario.
That shows nothing, of course. The price of oil in Argentina is now over $67/barrel.
http://oilprice.com/Energy/Crude-Oil/Would-Regulated-Oil-Prices-Argentine-Style-Help-US-Shale.html
Eulenspiegel ,
08/10/2016 at 10:51 am
Oil price won't be low for long – deep see oil will see no investments if prices keep low for
longer, 3rd world states with low production costs but high deficit will go into political
unrest – and won't invest in infill drilling, gas injection to keep up performance, but in
weapons and bribing important people.
North sea oil will die, it's already in decline and if a few producers stop the common infrastructure
will be too expensive for the rest to maintain.
No one except the US shale producers can keep producing red ink permanently – so if there
will be cheap oil, it will be much less than now.
It's like filling a car in the socialistic countries in the 80s – you will pay only cheap
money, but will have to wait to get some gas.
GAZPROM wins. Gas will flow thru Turkey to Europe. The amounts will
increase. Ukraine will soon no longer be a conduit, and lose all clout when
they try to dodge paying the bill for their own.
Probably back in the
Russian sphere of influence in a few years, assuming the EU won't pay their
gas bill, and the present leadership will be wards of the EU somewhere in
Germany. Actually, were Russia wise, they would just refuse gas to the
Ukraine at any price. Surrender or freeze. Maybe needlessly heavy handed.
Just impose increasingly crushing conditions. With a smile.
Europe Nat Gas consumption:
1.132 billion cubic meters/day (from mazama and converted to m^3)
minus Europe Nat Gas production
–> about 570 million cubic meters/day imported (9.5% increase in 2015) X 365 = 208 billion cubic
meters/yr
Nordstream pipeline 55 billion cubic meters/yr plans to double by 2019 to 110 billion m^3/yr.
That's Gazprom thru Germany.
Ukraine pipeline(s) into Europe presently: 142 billion cubic meters/year.
Belarus pipeline(s) into Europe presently: 38 billion cubic meters/year
Adds to 235 billion cubic meters/yr which is 20 some billion more than the Euro number above
because some is going to Macedonia, Serbia and other none EU countries. Relatively inconsequential.
Note that the popular phrasing that Russia only provides 31% of Europe's gas is almost certainly
bogus. More like 45-50%.
Now then, Nordstream 2 (that's all GAZPROM gas) will be chopped from Ukraine's flow. Because
GAZPROM can just force Belarus gas to be used by not flowing enough thru Ukraine.
The TANAP pipeline is to flow only 16 billion cubic meters/yr of gas from a non Russia source
thru Turkey.
The agreement just reached between Putin and Erdogan is for a pipeline carrying Russian gas
at 63 billion cubic meters/yr. Turkey will burn 14 of that (they burn 45 billion m^3 /yr) leaving
49 to flow to Europe.
The EU is already trying to interfere, saying there is insufficient capacity in pipelines north
thru Greece and other countries, but clearly Greece will burn it and that reduces what's left
going north.
Bottom line. Nordstream 2 will be a new 55 billion m^3/yr of GAZPROM gas. TurkeyStream will
flow another 49 billion m^3/yr. This will be new from present flows. And Ukraine's flow is 142.
They'll be reduced to under 40.
Ukraine gets almost $3 billion/yr in transit fees.
They have demanded just about a double
of that 5 mos ago. GAZPROM has not agreed. The Ukraine transit pipeline system apparently
also needs $19B in maintenance work GAZPROM had planned to pay for before Ukraine broke
relations with Russia. No longer.
Ukraine GDP 90B in 2015 and is falling this year.
So either the EU picks up the $19B plus the $3B/yr in transit fees Ukraine will lose
starting late next year (plus cost of Ukraine's consumption itself(they are 5th largest
in Europe)), or the fat lady sings.
BTW Poland just completed an LNG import terminal. Look at those flow numbers above in
the thread. Now . . . understand Poland is talking about sending Qatari gas from the LNG
terminal to Lithuania and the rest of Europe, to reduce horrible dependence on Russian gas,
even if LNG gas is priced 3X higher than piped GAZPROM gas. But yes, Poland is going to
send gas to other countries from their LNG terminal.
Oh, and the new LNG terminal has a capacity of 5 billion m^3/yr. Repeat. 5 billion m^3/year.
That's max in its final form.
Reports that US General John F. Campbell was the organizer of a coup d'etat in Turkey surprised
no one. Recall that the July 25th edition of the Turkish Yeni Safak, close to President Recep Erdogan's
AKP party,
reported
that General John F. Campbell, former U.S. commander of the International Security Assistance
Force (ISAF), a NATO-led security mission in Afghanistan, was the organizer of the July 15th military
coup attempt in Turkey. The sources stated that he was also involved in the financing of the coup
participants and the reshuffling of air base personnel while visiting the base on the eve of the
coup attempt. After an unsuccessful coup attempt the Turkish generals
Cahit Bakır and Şener Topçu were detained in Dubai airport. Both worked with Campbell in Afghanistan,
where they commanded the Turkish contingent within the NATO forces.
However, these are not the only clues in the Turkish coup plot which directly points to NATO as
the mastermind of the coup. There are some other information regarding this issue:
1. The same coup participants stationed at the Turkish Air Force, were the most NATO-integrated
structures of the Turkish Military, and this gave to the observers the first evidence of NATO involvement
in the military putsch. The Incirlik Air Base, where the US military was based was used by the putschists
to launch air strikes on the Turkish parliament. The base is jointly used by the US and Turkish Air
Forces. After the coup attempt, it was suppressed by the Turkish commander of the base. General Bekir
Ercan Van was arrested by the troops loyal to Erdogan. General Van sought asylum from the United
States but was denied. In the aftermath of the coup, external electrical power from Turkey was cut
to the base and a Turkish no fly order had been put into effect for US military aircraft in the area.
On July 30th the base was blocked by Turkish troops on information about a second coup attempt.
2. From the very beginning Western media spread disinformation, that President Erdogan flee the
country. American NBS mentioned high ranking US military, proving the information. Thus the US military
was directly involved in the disinformation during the most critical early hours of the failed coup
operation.
The US alternative media Newsbud
has identified Former NATO Commander-Retired US Army General John F. Campbell as the 'likely'
NBC News' source.
3. The majority of those arrested after the coup attempt were people related to the NATO structure.
The the Director of National Intelligence, James Clapper, speaking at a forum on security organized
by the Aspen Institute in Colorado last week, declared that after the coup "many of our interlocutors
have been purged or arrested".
Curtis Scaparrotti, NATO Supreme Allied Commander Europe confirmed this information,
stating that:
"Some of the officers that we have our relationships with in Turkey are now either detained, in
some cases retired as a result of the coup"
Thus, NATO de-facto recognized, that their people were in the ranks on the presumptive putschists
4. It was revealed that NATO aggressively promoted their agents, who then actively participated
in the coup:
According to Erdogan's supporters, thousands of Turkish officers recruited to Gulen's network
went up the ladder in their military career on "on high speed" , reaching ranks of generals and
colonels in key positions. In sharp contrast, in the Kemalist army base, their former fellows remained
captains or majors.
5. The three most important regiments which participated in the coup were part of Turkey's 'NATO
Rapid Deployable Corps'. The registration plates on military vehicles of the putschists, show that
they belonged to the 2nd Armoured Brigade, stationed in the Istanbul district of Kartal, and the
66th Mechanised Infantry Brigade, which is based in Hasdal together with the 6th Regiment. The transcript
of WhatsApp messagess of the plotters,
provided by Bellingcat showed that the group in communications also used the emblem and slogan
used by NATO's Rapid Deployable Corps (a quote of Ataturk) : "Peace at home, peace in the world.".
6. And finally, once again the news from Yeni Safak. It revealed information that the Guvercinlik
First Army Aviation Regiment's Maintenance Battalion Commander Lieutenant Colonel Murat Bolat told
prosecutors that the US was ready to help them to assassinate Erdogan during the coup.
"Americans were to provide the exact coordinates of Erdoğan, if the team was unable to find him
in the hotel. They also said that up to four persons with civil dress have been tracking Erdoğan
", – the Turkish newspaper quotes the rebel.
The same fact, that Erdogan's newspaper attacks the US and NATO so fiercely corroborates that
Turkish authorities are preparing for harsh anti-US moves, including leaving NATO. And they have
a lot of the evidence of NATO's involvement in the coup.
"... German parliamentarians are preparing to ask for sanctions against the USA, Britain and France also. According to those parliamentarians, by implementing the Chaos Strategy in the Middle East, in order to "promote democracy", as they kept saying, Washington, London and Paris are directly responsible for the refugee crisis, the terror attacks and the whole pattern of instability which has now engulfed Turkey as well. ..."
"... Mr. Erdogan, President of one of the most important NATO countries, did not meet any of his Western counterparts, but he is going to Russia to meet President Putin, and his closest advisors are proposing that he should institute an alliance with Russia, like Kemal, and wage war against "the Crusaders". ..."
"... The perspective of a strategic alliance between Ankara and Moscow is the definition of a nightmare for US and Israeli planners. They certainly did not start all those wars just to see a bloc of Russia, Turkey, Iran and Syria being formed in the Middle East, not to mention, potentially, a huge crisis in NATO. ..."
According to our information this is only the first step. German parliamentarians are preparing
to ask for sanctions against the USA, Britain and France also. According to those parliamentarians,
by implementing the Chaos Strategy in the Middle East, in order to "promote democracy", as they kept
saying, Washington, London and Paris are directly responsible for the refugee crisis, the terror
attacks and the whole pattern of instability which has now engulfed Turkey as well.
According also to our information, top US and Israeli officials are outraged at what is happening.
They now have to cancel all family vacation planning and concentrate on how to handle an unbelievable
new situation. Mr. Erdogan, President of one of the most important NATO countries, did not meet
any of his Western counterparts, but he is going to Russia to meet President Putin, and his closest
advisors are proposing that he should institute an alliance with Russia, like Kemal, and wage war
against "the Crusaders".
The perspective of a strategic alliance between Ankara and Moscow is the definition of a nightmare
for US and Israeli planners. They certainly did not start all those wars just to see a bloc of Russia,
Turkey, Iran and Syria being formed in the Middle East, not to mention, potentially, a huge crisis
in NATO.
We are still not there and nobody knows if we will reach that point. Russia and Turkey, as history
proves, have seriously conflicting interests. As for Erdogan himself, he cannot win over the Kurds
by military means and neither can the Kurds win what they want by war. All that is certain is that
we are heading straight for very serious conflicts.
Fortunately for them, and probably for us also, European politicians do not consider any alteration
of their vacation programs. They are continuing their enjoyment of their holidays, waiting for Washington
to take its decisions.
American Special Forces within Nusra? If true that's rich...
Notable quotes:
"... Has al Nusra proven to be a capable fighting force on its own? Or has it proven capable at using the weapons gifted it by its regime-change uncle and with the support of the USAF and American Special Forces? ..."
"... Natalya Nougayrède hits all the familiar high points in this typical hagiography – Putin is in Syria because he wants to show everyone his penis, and avenge the catastrophic defeat of Soviet forces in Afghanistan while restoring Russia's image as a serious military power. ..."
"... But despite her love-letter to western imperialism, Nougayrède seems quite clear that Assad is not losing ..."
Has al Nusra proven to be a capable fighting force on its own? Or has it proven capable at
using the weapons gifted it by its regime-change uncle and with the support of the USAF and American
Special Forces?
Natalya Nougayrède hits all the familiar high points in
this typical hagiography – Putin is in Syria because he wants to show everyone his penis,
and avenge the catastrophic defeat of Soviet forces in Afghanistan while restoring Russia's image
as a serious military power. Putin was in the KGB. It has absolutely fuck-all to do with
the article, but Putin was in the KGB, just to be sure you know. It was terribly embarrassing
for the Soviet Union to be defeated by a ragtag army of Afghan Mujaheddin, but apparently it is
not embarrassing at all for America to experience the
profound failure of its military policy in Afghanistan . Or perhaps it is embarrassing,
since it dares not leave.
But despite her love-letter to western imperialism, Nougayrède seems quite clear that Assad
is not losing, although she plainly would be delighted if that were the case. She also points
out that Aleppo is the last remaining significant opposition stronghold. If al Nusra is such an
awesome fighting force, why are they surrounded in the last significant objective they hold? Why
are they not spreading out and taking more territory?
Chairman Xi Jinping is making Russia an offer that
Russia can't refuse?
Notable quotes:
"... "We are now seeing the aggressive actions on the part of the United States, regarding both Russia and China. I believe that Russia and China could create an alliance toward which NATO will be powerless and which will put an end to the imperialist desires of the West." ..."
"The world is on the verge of radical change. We see how the European Union is gradually collapsing,
as is the US economy -- it is all over for the new world order. So, it will never again be as
it was before, in 10 years we will have a new world order in which the key will be the union of
China and Russia."
"We are now seeing the aggressive actions on the part of the United States,
regarding both Russia and China. I believe that Russia and China could create an alliance toward
which NATO will be powerless and which will put an end to the imperialist desires of the West."
Great link, thanks.
Given the real world politic, I don't see that Russia has much choice. The lack of pressure by
the PRC is an important note; Russia isn't being coerced but rather romanced.
My fear has been, and remains, the bat shit crazy neo-cons and their inability to let go of the
imperialist dream of world hegemon.
Bloomberg – Crude Slump Sees Oil Majors' Debt Burden Double to $138 Billion – August 5, 2016
As crude trades well below $50 a barrel, Exxon Mobil Corp., Royal Dutch Shell Plc and other
oil giants have seen their debt double to a combined $138 billion, spurring concerns they'll need
to keep slashing capital spending and that dividend cuts may eventually be necessary.
The first-half results indicate that oil companies "are likely to generate large negative free
cash flows for the full year," said Dmitry Marinchenko, an associate director at Fitch Ratings
in London.
"... I think you need 12 months minimum to get an idea of what wells will produce long term. That is where I am getting criticized by the believers, they say I am ignoring recent well improvements. ..."
"... The bottom line is the companies have found US land based oil. They know it is there, and as long as they are given the money to drill for it, they will, regardless of ultimate profitability. The CEO's are more in the position of promoter than business owner. Promoters talk about IP and exaggerated ultimate recoveries. It is interesting how much similarity there is between company presentations and the promotion materials I have read seeking to sell 1/16 non-operated WI to doctors and other unsophisticated investors. ..."
Toolpush. I recall reading in PXD's presentation that they are choking back new wells
The reason for this is they do not want to overbuild facilities.
Acreage in the Permian many times comprises of thousands of acres in one lease, so many wells'
production can be ran into the same facility.
So, say a total of 50 wells were going into one facility. They have to plan this out, because
the 50 wells at their peak production might produce a combined 50,000 barrels of oil and 150,000
barrels of water per day plus 100,000 mcf of gas per day.
However, in three years, those wells will be producing in the neighboorhood of 2,500 barrels
of oil and 5,000 barrels of water per day, plus maybe another 1,000 mcf of gas.
My numbers are hypothetical, but imagine how much less equipment will be required after 3 years
in that scenario.
There has been a lot of discussion about facility over build in the Bakken and Permian, where
large facilities are, 5 years later, handling a fraction of the production.
I think you need 12 months minimum to get an idea of what wells will produce long term.
That is where I am getting criticized by the believers, they say I am ignoring recent well improvements.
The bottom line is the companies have found US land based oil. They know it is there, and
as long as they are given the money to drill for it, they will, regardless of ultimate profitability.
The CEO's are more in the position of promoter than business owner. Promoters talk about IP and
exaggerated ultimate recoveries. It is interesting how much similarity there is between company
presentations and the promotion materials I have read seeking to sell 1/16 non-operated WI to
doctors and other unsophisticated investors.
We have guys in the industry who make their money, not off the oil, but off the promotion of
new wells. It has been that way for decades.
I assume few CEO's have taken a pay cut during this downturn. If they suspend drilling, they
have nothing to promote at investor forums and quarterly conference calls. So they will drill.
Heck, Halcon is still running rigs even though they are bankrupt.
It is going to take action by Russia and OPEC to drive prices higher in the next few years,
at it appears there are still a lot of locations left to drill in the US shale basins.
In fact, several of the leases we own were originally promotion projects. That was extremely
hot in our area in the early 1980s. Then, the price crashed and about all of the dumb money gave
their interests back to the operator, as the operator billed hard for overhead, and they were
paying $15+ per barrel in expense while selling oil for $10 in 1986.
Interesting that now we have multi billion dollar companies doing the same.
Just listening to Harold Hamm talk, he seems little concerned about the price of oil and gas.
He seems most concerned about regulation of the industry.
The catch phrase now is every well not drilled in the US is funding terrorism.
Hamm claims we can be completely oil independent. Interesting he doesn't mention what oil price
he thinks is needed to accomplish that goal.
You know why Aubrey started paying $10,000/acre in the Haynesville? After spending 2+ years putting
together his acreage block at an average of $500-1000/acre?
So he could flip 20% to Plains at $15,000/acre and a huge carry on the front end. That deal
paid for all his bonuses paid to that point and he pocketed a nice chunk of change.
Aubrey was a world class promoter. Here is a link to the Reuters article
It is funny looking back at what they have for estimated reserves. Significantly more than what
has played out.
[Aug 07, 2016] Neocon from Foreign Policy magazine are still dreaming about dismembering and colonizing Russi
Notable quotes:
"... No kidding; Kiev's ability to interrupt gas flows to Europe – which the west previously would not even discuss, since it was obviously Russia using energy as a weapon – is presented as just kittenish playfulness, and such an interruption is not a big problem because it's so amusing to watch the clever Ukrainians tweak Moscow's nose. All in good fun, of course, and transit fees are a right. There's just nothing about going around Ukraine to prevent that from happening which could be described as good fun, or tweaking Kiev's nose. Because the Ukrainians are cute, and the Russians are savages. ..."
"This summer hasn't seen a lot of setbacks for Russia, not even for its Olympic hopefuls.
Crimea has been annexed and fully absorbed, with the blessing of Republican presidential front-runner
Donald Trump, who also calls NATO "obsolete." Russian intelligence services have allegedly
been pawing through the emails of U.S. political parties, and releasing them at their leisure.
Turkey, in the wake of a failed coup attempt, is rushing to mend fences with Moscow."
Couple of things, my unfellow whiner. First, Crimea has been annexed and absorbed prior to
Trump's statement. Ergo it could not have happened with his blessing, since his blessing could
only come after the events took place, but what's temporal physics to a "journalist" from FP?
Second, at this point I think it's safe to conclude that every intelligence service of any powerful
countries studied those e-mails, no need for allegedly. And we don't know if it's the Russians
that are releasing them. Third, Turkey rushed to mend ties with Moscow before the coup, not after,
but then again, what's temporal physics to a "journalist" from FP? This article promises to deliver
mirth, let's read on!
"All of which makes last month's decision by the Polish antitrust regulator to file a formal
objection against Russia's proposed "Nord Stream 2" gas pipeline more noteworthy. That regulatory
spanner could be Europe's last and best chance to halt construction of a pipeline that critics
say will divide Europe, beggar Ukraine, and reinforce Moscow's energy dominance for another generation."
That's a big deal? Poland's opposition to Nord Stream 2 has been well document throughout the
ages. Ukraine is already beggared, but let's all blame that on Russia. Moscow's energy dominance
comes from the EU being a voracious money swallowing pit, and not enough solar/wind/nuclear powerplants
being built, due to, wait for it… lack of funding! Those funds are in places like Syria and Iraq.
Oh, and won't the lack of construction divide Europe? Cause I doubt that Russia's going to prop
up Ukraine, so if Southern Europe has no gas and Northern Europe has some, won't that be divisive?
"For years, Russia has sought to keep Europe dependent on its exports of energy, especially
through natural gas pipelines. But Moscow is also desperate to cut out potentially meddlesome
middlemen, like Ukraine, which sits smack between Russia's natural gas fields and millions of
European consumers. That gives Kiev the ability to interrupt Russian gas flows headed to Europe,
infuriating Moscow, but also earns Ukraine billions of dollars in much-needed transit fees."
Oh really? So Kaliningrad's border with EU member states are somehow attached to Ukraine? Intriguing,
very intriguing, did someone skip his geography class?
"A decade ago, Russia enlisted former German Chancellor Gerhard Schröder to help it build a
pipe across the Baltic from Russia to Germany, sidestepping Ukraine: Nord Stream. Then Russia
tried to build another pipeline, "South Stream," across the Black Sea from Russia to Bulgaria,
also bypassing Ukraine, but that was quashed by the European Union in 2014. Then, Moscow invented
the idea of a "Turkish Stream," another proposed Black Sea pipe, one landing in Turkey, outside
of Brussels's reach. But last fall, Turkish F-16s shot down a Russian jet, and with it hopes of
any immediate Russo-Turkish energy cooperation."
Really? Because in the beginning, the article claimed that "Turkey…is rushing to mend fences
with Moscow." So they're rushing to cooperate, ergo there won't be cooperation? Stellar "journalism"
absolutely stellar.
'… But the Polish Office of Competition and Consumer Protection last month determined that
Nord Stream 2 - which wouldn't even touch Polish territory - could harm consumers. "The Office
found that the concentration might lead to restriction of competition," it tentatively concluded,
adding that the project could "further strengthen" Gazprom's "dominant position." …'
Looks as if the Poles and the FP writer have a strange idea of what free market competition
is. Their idea seems to be that the more middlemen there are, taking their cut, oops, share of
the transit fees, and passing the costs down the pipeline, the more competition there is. Plus
the journalist fails to see what's wrong with Ukraine interrupting the flow of gas from Russia
to the EU to get transit fee income, unless of course he thinks extortion is a legitimate way
of doing business.
That gives Kiev the ability to interrupt Russian gas flows headed to Europe, infuriating
Moscow, but also earns Ukraine billions of dollars in much-needed transit fees.
So, when Ukraine interrupts gas flow to Europe to "infuriate" Moscow, Europe is not infuriated
to contend with a crippling gas shortage? And how long is Russia expected to rely on a transit
country that likes to infuriate its customer? Gawd, this guy is stupid.
No kidding; Kiev's ability to interrupt gas flows to Europe – which the west previously would
not even discuss, since it was obviously Russia using energy as a weapon – is presented as just
kittenish playfulness, and such an interruption is not a big problem because it's so amusing to
watch the clever Ukrainians tweak Moscow's nose. All in good fun, of course, and transit fees
are a right. There's just nothing about going around Ukraine to prevent that from happening which
could be described as good fun, or tweaking Kiev's nose. Because the Ukrainians are cute, and
the Russians are savages.
It looks like Russia is not going to be told that it must continue transiting gas through Ukraine,
although Ukraine has been on its best behavior where transit is concerned over the last little
while (to show how reliable it can be), and transit through Ukraine has actually increased, a
fact they lose no opportunity to point out (as if to say, you need us now more than ever). But
Kiev reserves the right to hike the transit fees whenever it needs a little more struttin' money,
and while the obstructive talk is on hold for now, the Ukrainians love to shoot their mouths off
and have made it clear they will simply take gas intended for Europe if Russia restricts Ukraine's
supply (although they have brought their Russia supplies way, way down by buying Russian gas from
other European countries, bought with gas money given it by the IMF.
Russia would very likely agree to continue supplying Ukraine through its own pipeline network,
probably even at a quite attractive price – but if Ukraine started any of its special-needs antics,
Russia would not have to worry about Europe's supply going through Ukraine's decrepit pipeline
system. Ukraine could be cut off without a second thought, as any reasonable supplier would do
if it is not getting paid or is otherwise abused by its customer – and as Europe would do in a
second if it were the other way round and Russia was spending billions for European gas transited
through Ukraine, which the Ukrainians poached at their leisure.
"... Expect this issue to take center stage in the coming months, because northwest Europe, with declining production of its own gas, is going to need a reliable solution, and should be getting pretty tired of propping up Ukraine, Romania and Poland the perennial malcontents. At the present time Poland's regulatory commission is holding up Nord Stream II just because it can – but don't expect that to last. The EU is soon going to be faced with the choice of a Russian gas pipeline in whose operation they will at least have input and in whose construction European companies will share some of the lolly – or a Russo-Turkic pipeline in which they have no say at all and the gas delivery point is at the border. ..."
"... Expect Brussels to accuse Russia of 'dumping' gas on the EU market, regardless of any truth. Russia could still reduce price and make a profit, ergo not 'dumping' in any sense. I would then expect all those new gas reservoirs being built by Germany, Gasprom and others to fill up on cheap Russian gas. ..."
Why does Nord Stream operate at less than 100% capacity? Because of
capacity restrictions imposed by Brussels – just remember that the next time that poxy twat
Sefcovic starts blabbering on about why do we need Nord Stream II when the original pipeline only
operates at half-capacity? And he will, be sure of it. If Nord Stream could operate at 100% capacity,
it would be half the cost of transiting through Ukraine. Just how much charity is Russia expected
to offer, especially considering Ukraine imposed a transit rate hike last year for the privilege
of using its leaky, whistling, rotting pipeline network?
Expect this issue to take center stage in the coming months, because northwest Europe, with
declining production of its own gas, is going to need a reliable solution, and should be getting
pretty tired of propping up Ukraine, Romania and Poland the perennial malcontents. At the present
time Poland's regulatory commission is holding up Nord Stream II just because it can – but don't
expect that to last. The EU is soon going to be faced with the choice of a Russian gas pipeline
in whose operation they will at least have input and in whose construction European companies
will share some of the lolly – or a Russo-Turkic pipeline in which they have no say at all and
the gas delivery point is at the border.
And really, the
EU's arguments make it look like it was dropped on its head as an infant. If Turkish Stream
goes ahead, the story goes, it will increase dependency on Russian gas, but block Caspian supplies.
How? Caspian supplies (Azerbaijan) are supposed to come via the Southern Gas Corridor, which the
EU keeps saying it is pressing on with but has yet to lay a foot of. Remind you of the talking-shop
that Nabucco became? How much money was pissed away on that, and they didn't build any of it.
But the argument seems to be that if Turkish Stream is built, the Southern Gas Corridor cannot
be. Why not? What's stopping you?
Price. The EU is scared it cannot do it as cheaply as Russia. And it probably can't. How does
that bear on the consumer? Sefcovic already told you – it's not all about price. What price freedom,
my friends? Aren't you willing to pay more for your gas so you can say it is Azerbaijani gas instead
of Putin's gas? What do you say, European consumer? But it keeps going on about how Turkey and
everybody else will get cheap gas, but is still trying to frighten Europeans that if they depend
on Russian gas it will go up. Why would it, if it's costing Russia less to ship it?
Kiev should be getting scared. Because there is an increased chance Brussels will cave on the
Nord Stream II issue, considering the factors I've already laid out. Or else Putin will build
Turkish Stream, and the EU will have to build its own infrastructure to hook up at the border,
and either solution will bypass Ukraine – through which, incidentally, transit was up 21% in the
first months of 2016, as the Ukrainians try to showcase what reliable partners they are. But that
route fails on price. Wah wah wahhhhhh….sorry, Kiev.
But even if the price of gas did rise due to EU dithering, Russia could still undercut American
LNG price. It comes down to how much are you willing to pay to proudly say "No thank you, Mr.
Putin"? It's like Sikorski and his Polish LNG terminal, where he said it costs more, but at least
it flies the Polish flag, or like how you could probably sleep with the starlet of your dreams…if
you were willing to do anything to get her. Prostitute yourself, sell drugs, move to another country,
completely change your lifestyle, whatever it took. A lot of things that are attainable in the
abstract are simply not worth it. the UK might be able to get by with no gas imports at all –
it still has a little, and they could go back to coal and wood-burning fireplaces like on "Upstairs,
Downstairs" (my ex loved that program", and theoretically they could do it, with just a little
of that famed British pluck and a stiff upper lip. But nobody wants to do it, because the illusion
of independence is not worth behaving so stupidly. It has become a game to see who can get their
people deeper in self-denial so that their leader can thumb his nose at Putin.
It is a bit like Hinckley Point – the UK can't be reliant on Chinese involvement for security
reasons (although the French suffered too when the agreement was frozen). Our elites try to get
away with it by keeping the population in a state of fear. But they also reward their own chums
with contracts, no matter what the cost.
So, yes, I do think they'll try to get away with it, whatever the cost (they'll just blame
the utility companies).
There would be the entry of an opposition political figure, telling the populace as much as it
would listen to about how an alternate source which is cheaper is available but our political
masters make us pay more in order to score political points with their master and perhaps
advance themselves and their positions…if the situation were reversed and Russia were dependent
on European gas, and Putin was trying to wean the Russians off of it in favour of a more-expensive
but more exclusionary alternative.
In my opinion, Russia needs to do that more. Sponsor opposition politicians in enemy countries,
I mean. It's a go-to western tactic.
Expect Brussels to accuse Russia of 'dumping' gas on the EU market, regardless of any truth. Russia
could still reduce price and make a profit, ergo not 'dumping' in any sense. I would then expect
all those new gas reservoirs being built by Germany, Gasprom and others to fill up on cheap Russian
gas.
I have a question though. If gazprom fills up its CEEC/Balkan reservoirs when gas is X price
at X time, is that the fixed price of the gas or if the world price drops, it can sell it for
less without it technically being 'dumping'? Does anyone know what the mechanism is?
Here's those good ole western values again on display here, this time directed at the peons in
Europe. You wouldn't know it from our posturing politicians but fuel poverty is a massive problem
in Europe affecting between 50 to 125 million people. The health consequences are dire from thousands
of excess deaths in winter's maw to increases in chronic lung and respiratory diseases. And would
you believe it but the Baltic chihuahuas, ever-reliably yapping at all things Russian, have large
numbers of their populations living in fuel poverty. Ever read anything by Edward Lucas on this?
No, me neither. So, I couldn't really do justice to how angry the behaviour of these morons makes
me….people die before their time every year because they can't afford to properly heat their homes
and these geniuses in Brussels paid for by us are totally OK with rocketing fuel prices as long
as they can say they poked a finger in Vladimir Putin's eye.
Reply
"... Output was 79,784 kb/d in April 2016, I believe the decline rate will decrease by Oct and output will be around 78.5 +/- 0.5 Mb/d in Nov 2016, decline will continue into 2017 and the rate of decline may reach zero some time in 2017. ..."
World C+C using EIA data, but substituting the Russian Ministry of Energy Data for Russia
shown in the chart below. The monthly peak was 81, 047 kb/d in Nov 2015. The centered 12 month running
average is also shown with a peak at 80,642 kb/d in Sept 2015. The annual decline rate since the
Nov 2015 peak has been 4.2% per year or about 3.4 Mb/d over a 12 month period if the rate does not
change before Nov 2016. That would imply 77.6 Mb/d by Nov 2016.
Output was 79,784 kb/d in April 2016, I believe the decline rate will decrease by Oct and output
will be around 78.5 +/- 0.5 Mb/d in Nov 2016, decline will continue into 2017 and the rate of decline
may reach zero some time in 2017.
No matter what central banks do, their actions will not be able to create the same level of economic
growth that we have become used to over the past seven decades.
Economic growth does not come from the central banks; if government sought to provide the basics
for all its citizens, including health care, education, a home, and proper food and all the infrastructure
needed to give people the basics, then you could have something akin to "growth" while at the
same time making life more pleasant for the less fortunate. There seems to be no definition of
economic growth that includes everyone.
This seems a very elaborate way of stating a simple problem, that can be summarised in three
points.
The living standards of most people have fallen over the last thirty years or so because of the
impact of neoliberal economic policies.
Conventional politicians are promising only more of the same.
Therefore people are increasingly voting for non-conventional politicians.
And that's about it.
Neoliberalism has only exacerbated falling living standards. Living standards would be falling
even without it, albeit more gradually.
Neoliberalism itself may even be nothing more than a standard type response of species that
have expanded beyond the capacity of their environment to support them. What we see as an evil
ideology is only the expression of a mechanism that apportions declining resources to the elites,
like shutting shutting down the periphery so the core can survive as in hypothermia.
I really don't have problem with this. Let the financial sector run the world into the ground
and get it over with.
In defference to a great many knowledgable commentors here that work in the FIRE sector, I don't
want to create a damning screed on the cost of servicing money, but at some point even the most
considered opinions have to acknowledge that that finance is flooded with *talent* which creates
a number of problems; one being a waste of intellect and education in a field that doesn't offer
much of a return when viewed in an egalitarian sense, secondly; as the field grows due to, the
technical advances, the rise in globilization, and the security a financial occuptaion offers
in an advanced first world country nowadays, it requires substantially more income to be devoted
to it's function.
This income has to be derived somewhere, and the required sacrifices on every facet of a global
economy to bolster positions and maintain asset prices has precipitated this decline in the well
being of peoples not plugged-in to the consumer capitalist regime and dogma.
Someting has to give here, and I honestly couldn't care about your 401k or home resale value,
you did this to yourself as much as those day-traders who got clobbered in the dot-com crash.
Let the financial sector run the world into the ground and get it over with.
In defference to a great many knowledgable commentors here that work in the FIRE sector, I don't
want to create a damning screed on the cost of servicing money, but at some point even the most
considered opinions have to acknowledge that that finance is flooded with *talent* which creates
a number of problems; one being a waste of intellect and education in a field that doesn't offer
much of a return when viewed in an egalitarian sense, secondly; as the field grows due to, the
technical advances, the rise in globilization, and the security a financial occuptaion offers
in an advanced first world country nowadays, it requires substantially more income to be devoted
to it's function.
This income has to be derived somewhere, and the required sacrifices on every facet of a global
economy to bolster positions and maintain asset prices has precipitated this decline in the well
being of peoples not plugged-in to the consumer capitalist regime and dogma.
Someting has to give here, and I honestly couldn't care about your 401k or home resale value,
you did this to yourself as much as those day-traders who got clobbered in the dot-com crash.
the capitalist economy is more and more an asset driven one.
this article does not even begin to address the issue of asset valuations, the explicit CB
support for asset inflation and the effect on inequality, and especially generational plunder.
the problem of living standards is obviously a malthusian one. despite all the progress of
social media tricks, we cannot fool nature. the rate of ecological degradation is alarming, and
now irreversible. "the market" is now moving rapidly to real assets. This will eventually lead
to war as all war is eventually for resources.
My comment never made it to the site. It trust it was a technical error rather than censorship.
The basic content argued that income levels have little to do with economic well being unless
you factor in consumer debt. That accounts for the fact that "wealthy" Americans fall just below
poor Greeks on the scale of median net personal worth.
Toolpush. I recall reading in PXD's presentation that they are choking back new wells
The reason
for this is they do not want to overbuild facilities.
Acreage in the Permian many times comprises of thousands of acres in one lease, so many wells'
production can be ran into the same facility.
So, say a total of 50 wells were
going into one facility. They have to plan this out, because the 50 wells at their peak production
might produce a combined 50,000 barrels of oil and 150,000 barrels of water per day plus 100,000
mcf of gas per day.
However, in three years, those wells will be producing in the neighboorhood of 2,500 barrels of
oil and 5,000 barrels of water per day, plus maybe another 1,000 mcf of gas.
My numbers are hypothetical, but imagine how much less equipment will be required after 3 years
in that scenario.
There has been a lot of discussion about facility over build in the Bakken and Permian, where
large facilities are, 5 years later, handling a
fraction of the production.
I think you need 12 months minimum to get an idea of what wells will produce long term. That is
where I am getting criticized by the believers, they say I am ignoring recent well improvements.
The bottom line is the companies have found US land based oil. They know it is there, and as long
as they are given the money to drill for it, they will, regardless of ultimate profitability. The
CEO's are more in the position of promoter than business owner. Promoters talk about IP and exaggerated
ultimate recoveries. It is interesting how much similarity there is between company presentations
and the promotion materials I have read seeking to sell 1/16 non-operated WI to doctors and other
unsophisticated investors.
We have guys in the industry who make their money, not off the oil, but off the promotion of new
wells. It has been that way for decades.
I assume few CEO's have taken a pay cut during this downturn. If they suspend drilling, they have
nothing to promote at investor forums and quarterly conference calls. So they will drill. Heck, Halcon
is still running rigs even though they are bankrupt.
It is going to take action by Russia and OPEC to drive prices higher in the next few years, at
it appears there are still a lot of locations left to drill in the US shale basins.
In fact, several of the leases we own were originally promotion projects. That was extremely hot
in our area in the early 1980s. Then, the price crashed and about all of the dumb money gave their
interests back to the operator, as the operator billed hard for overhead, and they were paying $15+
per barrel in expense while selling oil for $10 in 1986.
"... Whatever the character of America's involvement in the Middle East before 1980, when Bacevich's account begins, it was not a war, at least not in terms of American casualties. "From the end of World War II to 1980, virtually no American soldiers were killed in action while serving in that region," he notes. "Within a decade," however, "a great shift occurred. Since 1990, virtually no American soldiers have been killed in action anywhere except in the Greater Middle East." ..."
"... The sequence of events, lucidly related by Bacevich, would be a dark absurdist comedy if it weren't tragically real. To check Iran, the U.S. supported Saddam Hussein's Iraq in the Iran-Iraq War of 1980–88, whose final phase, the so-called "Tanker War," involved direct U.S. military engagement with Iranian naval forces. (Bacevich calls this the real first Persian Gulf War.) ..."
"... Finally, George W. Bush decided to risk what his father had dared not: invading Iraq with the objective of "regime change," he launched a third Gulf War in 2003. The notion his neoconservative advisers put into Bush's head was that, with only a little help from American occupation and reconstruction, the void left by Saddam Hussein's removal would be filled by a model democracy. ..."
"... Yet the first Bush had been right: Iran, as well as ISIS, reaped the rewards of regime change in Baghdad. And so America is now being drawn into a fourth Gulf War, reintroducing troops-styled as advisors-into Iraq to counter the effects of the previous Gulf War, which was itself an answer to the unfinished business of the wars of 1991 and the late 1980s. Our military interventions in the Persian Gulf have been a self-perpetuating chain reaction for over three decades. ..."
"... "Wolfowitz adhered to an expansive definition of the Persian Gulf," notes Bacevich, which in that young defense intellectual's words extended from "the region between Pakistan and Iran in the northeast to the Yemens in the southwest." Wolfowitz identified two prospective menaces to U.S. interests in the region: the Soviet Union-this was still the Cold War era, after all-and "the emerging Iraqi threat"; to counter these Wolfowitz called for "advisors and counterinsurgency specialists, token combat forces, or a major commitment" of U.S. forces to the Middle East. ..."
"... The military bureaucracy took advantage of the removal of one enemy from the map-Soviet Communism-to redirect resources toward a new region and new threats. As Bacevich observes, "What some at the time were calling a 'peace dividend' offered CENTCOM a way of expanding its portfolio of assets." Operation Desert Storm, and all that came afterward, became possible. ..."
"... The final lesson of this one is simple: "Perpetuating the War for the Greater Middle East is not enhancing American freedom, abundance, and security. If anything, it is having the opposite effect." ..."
Bacevich's latest book, America's War for the Greater Middle East: A Military History,
is a bookend of sorts to American Empire. The earlier work was heavy on theory and institutional
development, the groundwork for the wars of the early 21st century. The new book covers the history
itself-and argues persuasively that the Afghanistan, Iraq, and other, smaller wars since 9/11 are
parts of a larger conflict that began much earlier, back in the Carter administration.
Whatever the character of America's involvement in the Middle East before 1980, when Bacevich's
account begins, it was not a war, at least not in terms of American casualties. "From the end of
World War II to 1980, virtually no American soldiers were killed in action while serving in that
region," he notes. "Within a decade," however, "a great shift occurred. Since 1990, virtually no
American soldiers have been killed in action anywhere except in the Greater Middle East."
Operation Eagle Claw, Carter's ill-fated mission to rescue Americans held hostage in Iran, was
the first combat engagement in the war. Iran would continue to tempt Washington to military action
throughout the next 36 years-though paradoxically, attempts to contain Iran more often brought the
U.S. into war with the Islamic Republic's hostile neighbor, Iraq.
The sequence of events, lucidly related by Bacevich, would be a dark absurdist comedy if it
weren't tragically real. To check Iran, the U.S. supported Saddam Hussein's Iraq in the Iran-Iraq
War of 1980–88, whose final phase, the so-called "Tanker War," involved direct U.S. military engagement
with Iranian naval forces. (Bacevich calls this the real first Persian Gulf War.)
Weakened and indebted by that war, and thinking the U.S. tolerant of his ambitions, Saddam then
invaded Kuwait, leading to full-scale U.S. military intervention against him: Operation Desert Storm
in 1991. (By Bacevich's count, the second Gulf War.) President George H.W. Bush stopped American
forces from pushing on to Baghdad after liberating Kuwait, however, because-among other things-toppling
Saddam would have created a dangerous vacuum that Iran might fill.
A decade of sanctions, no-fly zones, and intermittent bombing then ensued, as Washington, under
Bush and Clinton, would neither depose Saddam Hussein nor permit him to reassert himself. Finally,
George W. Bush decided to risk what his father had dared not: invading Iraq with the objective of
"regime change," he launched a third Gulf War in 2003. The notion his neoconservative advisers put
into Bush's head was that, with only a little help from American occupation and reconstruction, the
void left by Saddam Hussein's removal would be filled by a model democracy. This would set a
precedent for America to democratize every trouble-making state in the region, including Iran.
Yet the first Bush had been right: Iran, as well as ISIS, reaped the rewards of regime change
in Baghdad. And so America is now being drawn into a fourth Gulf War, reintroducing troops-styled
as advisors-into Iraq to counter the effects of the previous Gulf War, which was itself an answer
to the unfinished business of the wars of 1991 and the late 1980s. Our military interventions in
the Persian Gulf have been a self-perpetuating chain reaction for over three decades.
Iran released its American hostages the day Ronald Reagan was sworn in as president: January 20,
1981. So what accounts for another 35 years of conflict with Iran and Iraq? The answer begins with
oil.
Bacevich takes us back to the Carter years. "By June 1979, a just-completed study by a then-obscure
Defense Department official named Paul Wolfowitz was attracting notice throughout the national security
bureaucracy." This "Limited Contingency Study" described America's "vital and growing stake in the
Persian Gulf," arising from "our need for Persian-Gulf oil and because events in the Persian Gulf
affect the Arab-Israeli conflict."
"Wolfowitz adhered to an expansive definition of the Persian Gulf," notes Bacevich, which
in that young defense intellectual's words extended from "the region between Pakistan and Iran in
the northeast to the Yemens in the southwest." Wolfowitz identified two prospective menaces to U.S.
interests in the region: the Soviet Union-this was still the Cold War era, after all-and "the emerging
Iraqi threat"; to counter these Wolfowitz called for "advisors and counterinsurgency specialists,
token combat forces, or a major commitment" of U.S. forces to the Middle East.
(Bacevich is fair to Wolfowitz, acknowledging that Saddam Hussein was indeed an expansionist,
as the Iraqi dictator would demonstrate by invading Iran in 1980 and seizing Kuwait a decade later.
Whether this meant that Iraq was ever a threat to U.S. interests is, of course, a different question-as
is whether the Soviet Union could really have cut America off from Gulf oil.)
Wolfowitz was not alone in calling for the U.S. to become the guarantor of Middle East security-and
Saudi Arabia's security in particular-and President Carter heeded the advice. In March 1980 he created
the Rapid Deployment Joint Task Force (RDJTF), predecessor to what we now know as the U.S. Central
Command (CENTCOM), which has military oversight for the region. The RDJTF's second head, Lt. Gen.
Robert Kingston, described its mission, in admirably frank language, as simply "to ensure the unimpeded
flow of oil from the Arabian Gulf."
Iraq and Iran both posed dangers to the flow of oil and its control by Saudi Arabia and other
Arab allies-to use the term loosely-of the United States. And just as the U.S. was drawn into wars
with Iran and Iraq when it tried to play one against the other, America's defense of Saudi Arabia
would have grave unintended consequences-such as the creation of al-Qaeda. Osama bin Laden was outraged
when, in 1990, Saudi Arabia's King Fahd declined his offer to wage holy war against Saddam Hussein
and instead turned to American protection, even permitting the stationing of American military personnel
in Islam's sacred lands. "To liberate Kuwait," writes Bacevich, bin Laden had "offered to raise an
army of mujahedin. Rejecting his offer and his protest, Saudi authorities sought to silence the impertinent
bin Laden. Not long thereafter, he fled into exile, determined to lead a holy war that would overthrow
the corrupt Saudi royals." The instrument bin Laden forged to accomplish that task, al-Qaeda, would
target Americans as well, seeking to push the U.S. out of Muslim lands.
Bin Laden had reason to hope for success: in the 1980s he had helped mujahedin defeat another
superpower, the Soviet Union, in Afghanistan. That struggle, of course, was supported by the U.S.,
through the CIA's "Operation Cyclone," which funneled arms and money to the Soviets' Muslim opponents.
Bacevich offers a verdict on this program:
Operation Cyclone illustrates one of the central ironies of America's War for the Greater Middle
East-the unwitting tendency, while intently focusing on solving one problem, to exacerbate a second
and plant the seeds of a third. In Afghanistan, this meant fostering the rise of Islamic radicalism
and underwriting Pakistan's transformation into a nuclear-armed quasi-rogue state while attempting
to subvert the Soviet Union.
America's support for the mujahedin succeeded in inflicting defeat on the USSR-but left Afghanistan
a haven and magnet for Islamist radicals, including bin Laden.
Another irony of Bacevich's tale is the way in which the end of the Cold War made escalation of
the War for the Greater Middle East possible. The Carter and Reagan administrations never considered
the Middle East the centerpiece of their foreign policy: Western Europe and the Cold War took precedence.
Carter and Reagan were unsystematic about their engagement with the Middle East and, even as they
expanded America's military presence, remained wary of strategic overcommitment. Operation Eagle
Claw, Reagan's deployment of troops to Lebanon in 1983 and bombing of Libya in 1986, and even the
meddling in Iran and Iraq were all small-scale projects compared to what would be unleashed after
the fall of the Berlin Wall.
The military bureaucracy took advantage of the removal of one enemy from the map-Soviet Communism-to
redirect resources toward a new region and new threats. As Bacevich observes, "What some at the time
were calling a 'peace dividend' offered CENTCOM a way of expanding its portfolio of assets." Operation
Desert Storm, and all that came afterward, became possible.
The
Greater Middle East of Bacevich's title centers strategically, if not geographically, upon Saudi
Arabia, Iraq, and Iran. But its strategic implications and cultural reach are wide, encompassing
Libya, Somalia, and other African states with significant Muslim populations; Afghanistan and Pakistan
(or "AfPak," in the Obama administration's parlance); and even, on the periphery, the Balkans, where
the U.S. intervened militarily in support of Muslims in Bosnia and Kosovo in the 1990s. That Clinton-era
intervention is examined in detail by Bacevich: "Today, years after NATO came to their rescue," he
writes, "a steady stream of Bosnians and Kosovars leave their homeland and head off toward Syria
and Iraq, where they enlist as fighters in the ongoing anti-American, anti-Western jihad."
Much as George W. Bush believed that liberal democracy would spring up in Saddam Hussein's wake,
the humanitarian interventionists who demanded that Bill Clinton send peacekeepers to Bosnia and
bomb Serbia on behalf of the Kosovars thought that they were making the world safe for their own
liberal, multicultural values. But as Bacevich notes, the Balkan Muslims joining ISIS today are "waging
war on behalf of an entirely different set of universal values."
Bacevich's many books confront readers with painful but necessary truths. The final lesson
of this one is simple: "Perpetuating the War for the Greater Middle East is not enhancing American
freedom, abundance, and security. If anything, it is having the opposite effect."
Daniel McCarthy is the editor of The American Conservative.
"... The type curves these guys are coming up with are way off. Exaggerated by more than double. ..."
"... Seems SEC should be involved, but who wants to stop the flow of cheap oil, which today translates to $1.77 per gallon at the pump just down the street from me? ..."
"... "As Bloomberg reports, despite what Hall called a "miserable month" for oil in July, supplies are still shrinking, he said in his letter, setting up prices to reverse themselves. "Prices are now back at levels that would ensure the eventual bankruptcy of most of the oil industry", hammering both private oil companies and producing countries like Iraq, Nigeria and Venezuela, Hall said. "Prices at current levels are just not sustainable."" ..."
Watcher. 200 bopd in months 13+. The best wells produce 125-200K barrels in first 12 And that
is gross oil, before deducting the part which goes to the royalty owners, which is 25% typically
in the Permian. But, they never disclose that either. So the type curves, are gross oil, which
is also deceiving.
It is very hard to find payout statements for LTO wells. But I have seen some.
What is see is a lot of oil in year one, with the well being about 1/2 paid out, followed by
not nearly enough in years 2 and 3 to make a big enough dent. By year 4, the well is generating
low to mid five figures per month, with $2-4 million still owed, depending on how good the well
is.
Until I hear the companies' management talk about well payout in real (not projected) numbers,
I assume that most wells are like the one's I have seen. In fact, I just looked at four of PXD's
on the Sale Ranch, which is their best Martin Co. lease by far. One of the wells, the best out
of 53, will payout. One will not, the other two will need production to hold up at around 200
bopd IMO. Very few wells have been producing 200 bopd after month 12. But maybe they have figured
something out?
It is also interesting on the few payout statements I have seen, that CAPEX seems to continue
on for months after the well's first production month. Only when the well is down to low volume,
do we see the CAPEX stop. Not sure why that is.
So, if we have a well producing 50 bopd gross oil, with a 25% royalty, the monthly gross income
at $40 oil (we are now below that BTW) is $45,000. Figure $10,000 of LOE, we are at $35,000. Knock
of taxes, down to about $31,000.
Will take a long time to pay the remaining $2-$4 million left at $30,000 per month. Then, if
we have a down hole failure, look at another $25-100K of expense.
The type curves these guys are coming up with are way off. Exaggerated by more than double.
Seems SEC should be involved, but who wants to stop the flow of cheap oil, which today translates
to $1.77 per gallon at the pump just down the street from me?
There has been a lot of well economics analysis over the past X yrs. Usually they end with presumptions
of higher oil price just in time to save the day.
What they don't usually have is an assessment of not only high yield paper burden (annual interest
expense on the loan PLUS principal repayment per year), nor anything about compliance with loan
covenants which . . . pre Fed involvement one could presume would force some sort of ongoing production
requirements lest there be LOCs (Lines of Credit) shut off, preventing more completions.
Really hard to see how the loans still flow, unless the lenders have been assured backstop.
On most sites. SEeking alpha, oilpro, etc, the shale believers all share one common thread. Lack
of any concern with making a profit.
They discuss reserves, IP rates, decline rates, rig efficiencies, but never discuss how these
companies are all losing money every day they operate and with every well they drill.
it seems that some industry observers agree with my post above:
"As Bloomberg reports, despite what Hall called a "miserable month" for oil in July, supplies
are still shrinking, he said in his letter, setting up prices to reverse themselves. "Prices are
now back at levels that would ensure the eventual bankruptcy of most of the oil industry", hammering
both private oil companies and producing countries like Iraq, Nigeria and Venezuela, Hall said.
"Prices at current levels are just not sustainable.""
I am just going by what I am reading on a subscription site that I pay for. Maybe it is wrong?
Every one of the leases I own an interest in is always correct. The data always matches ND,
which has good data. It matches TX when TX reports individual wells. It matches WY, CO, KS, NM.
I guess when CLR states their average well will cumulative 806,000 BO, I would think I would
see some evidence of that showing up, instead of what I posted above.
I think you also have to understand why those of us who own working interests question you.
We have seen our income fall from a lot to practically nothing, I talk to many producers, all
the same. Worst time since 1998-1999. Some think worst they have ever been through.
I look at Energynet auction quite often. There are a lot of WI for sale. The collapse of income
since 2014, not just from the price crash, but from LTO well decline, takes your breath away.
Saw an EFS package on there this week. 3/15 income was $1.1 million from 9 wells. 12/15 income
was $240K from same 9 wells. I figure they have $45 million plus sunk into those.
I'm just repeating $$ and cents and production info I see.
For example, all we hear about PXD is Permian. Yet they operate more EFS wells than Permian,
70 of which have cumulative oil of 300K, v 1 Permian well with cumulative of 300K. Yet, somehow
Permian is more economic, even though EFS wells generally cost less than Permian to D & C.
Just stating facts I pull off the net. If you think I'm wrong, let me know. I don't want to
be putting out wrong info.
Something very strange is happening. The great majority of the mainstream western media are "under-reporting"
the quite monumental events affecting one of the most important NATO allies.
In the same time more and more accusations and more concrete ones are coming out of Turkey about
the West supporting the failed coup! Still western media and capitals behave like it is just normal
for leaders and officials of a NATO country to accuse the United States of supporting a coup in their
country!
It is true that Erdogan is not a popular politician in the West and he is considered rather authoritarian.
He made a lot of things to justify this accusation. But the question is they don't like because he
is authoritarian or because he became too "uncontrollable"?
Anyway there is a distance between criticizing a leader (elected by the way) for his authoritarianism
and supporting military coups against him. To impose a military dictatorship in Turkey is hardly
a way to promote "democracy", as it was hardly the repeated wars in the Middle East (USA and France
have just begun a new one against Libya!)
President Erdogan has again accused the West for its attitude towards his country, just one day
after the visit to Turkey of the chief of the US Armed Forces
Ukraine has managed to get rid of its gas dependence
on Russia, thus destroying the "energy weapon" of the Kremlin, U.S. Ambassador to Ukraine Geoffrey
Pyatt has said.
The Ukrainian authorities over the past few years have in fact destroyed Moscow's energy weapon,
which used gas in this way, Pyatt said during a meeting of the discussion club "Open World" on
the transformations in Ukraine, progress and tasks for the future in Kyiv on Tuesday.
The diplomat said that Ukraine's national gas company Naftogaz Ukrainy currently purchases
gas only if it finds the price acceptable, but the natural gas has ceased to be the instrument
of manipulation. Ukrainians are no longer in the situation when the Kremlin uses energy resources
as a weapon, as an instrument of manipulating Ukrainian politicians, so that they should take
certain decisions, he said.
Pyatt also said that the Ukrainian energy sector is undergoing serious transformations and
this is very important to bring these changes to completion.
What? Buying the cheapest gas on the market is more economical than not paying for it at all,
which is what they did as regards gas directly supplied by Russia?
And where does this cheaper alternative supply come from - originally, not through an intermediary?
Украина не должна возвращать России $3 млрд, которые были получены во времена Виктора
Януковича. Об этом в программе "О политике" с Сергеем Руденко в эфире Еспресо [sic].TV
заявил министр финансов Александр Данилюк. "Это был политический кредит, который нас
заставили взять",- пояснил министр.
По словам господина Данилюка, эти средства в то время могли пойти на различные
выплаты в государстве. "Наша позиция заключается в том, что мы не должны возвращать эти
деньги",- сказал Александр Данилюк.
In the Ukraine they see no reason for paying back their $3 billion debt to Russia
The Ukraine is not obliged to return to Russia the $3 billion debt that was
accrued during Victor Yanukovych's
presidency.This
is what Finance Minister Alexander Danyluk said live on air to Sergei Rudenko during the
Espresso TV programme "On Politics". "Our position was that we were politically forced
to accept this credit. Therefore, our position is that we do not have to return this
money", explained the minister.
According to Mr. Danyluk, at the time they were able to use the money for the
payment of various state benefits. "Our position is that we should not return the
money", said Alexander Danyluk.
On December 16 last year, the IMF Executive Board recognized the official status of
the $3 billion Russian loan to the Ukraine. In response, the Ukraine announced a
moratorium on the payment of any debts to the Russian Federation.
Which is good business practice, according to Pyatt Twat, I presume.
They evidently believe Daddy Pyatt's muck that they are getting off the Gazprom tit
just because they are buying Gazprom gas from someone else. I would have a quiet word
with those people to warn them of the possibility that they might have to suddenly
find 45% to 90% of their gas supplies somewhere else if they did not put pressure on
Ukraine to pay its debts. Because it has evidently not occurred to Ukraine where they
would get their gas if their brotherly suppliers did not have any to sell, and were
scrambling to find enough for themselves. America would crow that Russia was using
energy as a weapon, of course, but Russia should be past caring what America thinks
or says because they are never going to be anything like friends no matter what
Russia says or does.
Meanwhile, Daddy Pyatt is going to have some 'splainin' to do
when Gazprom refuses to sell Ukraine any more gas until they pay. Because they're
still getting more than 10% directly. Russia is being nice, and usually sells them
gas as soon as they pay in advance for that amount. But maybe they should say, "You
know what? I think you should pay all your past dues before you get any more". And
they wouldn't have a leg to stand on, because it doesn't matter what 'their position'
is; the debt has been recognized as legal and binding.
He would take any criticism from Russia as an accolade, an indicator that he is
doing something right, because getting up Russia's nose is his stock in trade and
the reason he's posted in there. He's there to provoke confrontation between
Russia and Ukraine, the more the better, and he could not care less what will
happen to Ukrainians after he's gone.
As usual, Pyatt is trumpeting nonsense, although I would love for some intrepid journalist
to ask him why the USA is so resistant to Nord Stream II and preserving Ukraine's transit
fees for Russian gas. If it's so easy to cut your imports of Russian gas by more than half
that the poorest country in Europe can do it, why couldn't anyone do it?
Such as
the countries from whom Ukraine now buys its gas
– Slovakia, Hungary and Poland. Of the
three Slovakia is 90% dependent on Russian gas, Hungary 44%, and Poland 45%. These are the
countries that scream Nord Stream II must not be built – what would happen if Russia
stopped supplying them with gas? Where would Ukraine get its gas then? Where would its
suppliers make up their shortfall? American LNG? Ah ha, ha, ha!! Yes, I'm sure; forgive me
for laughing, I couldn't help it.
Russia is not making as much money, that's certainly true and will remain true for as
long as the west can force the price down through oversupply. Who will run out first? I
guess we'll see. But although profits are undeniably lower, Gazprom's exports to Europe
increased by approximately 16%
between January and May of this year. I think Europeans
should be asking themselves how important Ukraine really is in their gas-distribution
network. But bravo to Ukraine! See if you can reduce your Gazprom imports to zero! Now,
there's a worthy target. Just ask Daddy Pyatt from time to time how you're doing.
Back in the day contracts were "consensus in idem" or, my version =
"agreement in all essentials".
The "partners" ought to be aware that the RF (and its "emanations of the State" (c)
EU Law) appears to be relying on that, hmmm, understanding of "the rule of Law".
Chihuahua yelps and Banderastan yowls and EU poodle elite yips aside, the rest of the
wide world sees reality as the RF does.
Warning: Bellingcat is a disinformation outpost probably created by some intelligence agency. It
lied about MH17 extensively.
Notable quotes:
"... Beware Bellingcat; he's been busted more than once publishing fraudulent information; especially re: Putin and Ukraine ..."
"... This is an interesting article that explores possibilities (if only partially) of an extremely murky event: the recent coup in Turkey. One very keen observation is that this coup has one extraordinary aspect: nobody seems to blame Putin! The second observation is that it is not typical for a coup that it is not possible to trace who was running it, while indisputably, someone activated a bunch of conspirators to action. In the past, even failed coup had an identified leader. ..."
3 Turkish specialized NATO regiments (20,000+ troops?} led coup attempt. Using Bellingcat translated
records of coup communications, Sybil Edmonds explains:
This is an interesting article that explores possibilities (if only partially) of an extremely
murky event: the recent coup in Turkey. One very keen observation is that this coup has one extraordinary
aspect: nobody seems to blame Putin! The second observation is that it is not typical for a coup
that it is not possible to trace who was running it, while indisputably, someone activated a bunch
of conspirators to action. In the past, even failed coup had an identified leader.
[Tinfoil hat on] This points to a masterful hand behind the plot, perhaps a bit deficient in
purely military details but very capable in conspiratorial techniques. [delete]Gulen[end delete]
Putin! Putin theory could have a weak spot, namely that he is competent in purely military details,
but it can be elegantly rescued by the fact that he had no interest in actually replacing Erdogan,
but merely in rendering him ineffective against Russia. As Russians know only too well, the most
effective way of disabling a military organization is to imbue the national leader with total
paranoia. [Tinfoil hat off, malignant waves enter brain again]
Clearly, Erdogan is another person who benefits from the coup, and who has much simpler means
to assure that the leadership of the coup remains unclear: his devoted stooges run the investigation
after all! Moreover, Akira correctly observed that the past actions attributed to Gulen's movement
lacked outright violence. In my opinion, this stems from religious principles of Gulen himself,
his own interpretation of Islam (which clearly allows for intrigue and subterfuge). Gulen did
not create his movement in vacuum, he became a leader of followers of Said Nursi who died in 1960.
The way those movements (Nur of Nursi, Hizmet of Gulen) operated is compared to Sufi brotherhoods
which may be loosely hierarchical and highly conspiratorial. Some Sufi movements may be violent,
by calling to armed Jihad etc. However, Nursi was a pacifist. As I said, unlike some other Muslim
movements in Turkey. Erdogan has a somewhat murky religious movement of his own, and he clearly
accepts the concept of violent Jihad.
One can dwell more of it, but pretty safe conclusion is that we have two likely possibilities:
Erdogan pulling the strings (in that case, using Hakan Fidan, his spy master) and going to some
lengths to make the appearance that Guelen does it, or the reverse. Because of that, no single
piece of evidence is conclusive, any single person can be a double/multiple agent etc. And because
those possibilities are both so compelling, the true guiding master hand remains hidden (Putin!!!!).
Great stuff pb. I think that Erdo's 'genius' lies in his ability to react rather than act.
He just waits to see his chances then takes 'em. Having plans opens one up to having one's plans
divined by others and so defeated. His strength lies in his nihilism, the g-forces alone of his
about faces would so distort the physique of any ordinary man that he could never survive. But
Erdo is focused exclusively on his own ends - and possesses the magical ability of convincing
his followers of his invincibility and hence, of theirs. His survival of his seemingly endless
stream of volte faces proves this in the eyes of his followers and so confounds his more or less
principled opposition that their very bones melt and they puddle.
So the CIA, who have kept Gulen bottled up in their Pennsylvania super-fortress all these years,
perhaps their secret, kryptonite-like antidote to al-CIAduh, sprang him to avail Erdogan of yet
another of his nine-times-nine-lives, in order to keep his ego-driven presence alive and disruptive
on their geostrategic gameboard.
The terrifying thing from the CIA's/USA's point of view would be any kind of coherent coincidence
of aims among Russia, Turkey, Syria, Iraq, Iran, the Caucasus, and the stans of Central Asia.
They feel that they can rely upon Erdo to keep the Caucasus and Central Asia high on its own version
of the Ottoman dream, and in competition with the Sunni/IS, the Shia, and Kurdish Axes.
If the Turkmen and the Shia were to cohere rather than contend, or, worse, the Turkmen-Shia-Kurds
were to do so, there would be far too much constructive activity in the Middle East for the empire
of chaos to survive there let alone prevail. The opposite hand of Putin did it! is ... the CIA
did it! I say the CIA did it. That's my story and I'm stickin' to it.
The real story will become apparent in the fullness of time.
"... Speaking at the White House today, President Obama denied unequivocally that the US had any prior knowledge of last week's failed military coup in Turkey, calling on Turkish President Recep Tayyip Erdogan to make sure everyone in Turkey knows the US wasn't involved. ..."
"... The early US reaction to the coup has raised a lot of speculation, as Secretary of State John Kerry, during the coup, issued a tepid comment just urging "stability." The US only condemned the coup when it became clear, later that evening, that it was going to fail. ..."
Obama Denies Advance Knowledge of Turkish Coup; Insists US Had No Involvement in Failed Coup
Speaking at the White House today, President Obama denied unequivocally that the US had any
prior knowledge of last week's failed military coup in Turkey, calling on Turkish President Recep
Tayyip Erdogan to make sure everyone in Turkey knows the US wasn't involved.
The early US reaction to the coup has raised a lot of speculation, as Secretary of State John
Kerry, during the coup, issued a tepid comment just urging "stability." The US only condemned the
coup when it became clear, later that evening, that it was going to fail.
Turkey cut power to the Incirlik Air Base, where many US warplanes and dozens of US nuclear weapons
are based, and jailed the commander as a co-conspirator to the coup. That, and Turkey's blaming of
cleric Fethullah Gulen, exiled to the US, as being behind the plot, are likely the source of a lot
of the speculation.
The US has been keen to keep its ties close to Turkey, whoever ends up running it, and the Obama
Administration is understandably eager to distance itself from any suspicion. This is a key part
of why the US has been so reluctant to seriously criticize Turkey's post-coup purge, and why Turkey
feels comfortable pressuring them to extradite Gulen without any evidence.
TEHRAN (FNA)- Arab media outlets quoted diplomats in Ankara as disclosing that Turkey's President
Erdogan was alerted by Russia against an imminent army coup hours before it was initiated on Friday,
while a western media outlet said Erdogan asked his supporters to remain in the streets after receiving
advice from Tehran.
Several Arab media outlets, including Rai Alyoum, quoted diplomatic sources
in Ankara as saying that Turkey's National Intelligence Organization, known locally as the MIT, received
intel from its Russian counterpart that warned of an impending coup in the Muslim state.
The unnamed diplomats said the Russian army in the region had intercepted highly sensitive army
exchanges and encoded radio messages showing that the Turkish army was readying to stage a coup against
the administration in Ankara.
The exchanges included dispatch of several army choppers to President Erdogan's resort hotel to
arrest or kill the president.
The diplomats were not sure of the Russian station that had intercepted the exchanges, but said
the Russian army intelligence unit deployed in Khmeimim (also called Hmeimim) in Syria's Northern
province of Lattakia is reportedly equipped with state-of-the-art electronic and eavesdropping systems
to gather highly sensitive information for the Russian squadrons that are on an anti-terrorism mission
in Syria.
Khmeimim in Northwestern Syria is the only Russian air force base in the war-ravaged country that
provides cover for Syrian army and popular forces in multiple fronts across the country, in addition
to bombing missions against terrorist targets. The Russian naval fleet, including its only aircraft
carrier, are deployed along the coasts of Lattakia border province to provide logistical aid to the
air base in a short time. Meantime, Russia has deployed its highly sophisticated S-400 air defense
shield at Khmeimim and announced that it covers the entire Syrian skies with the same air defense
system.
Last year, Turkey shot down a Russian Sukhoi bomber over Syrian skies and President Erdogan who
was then a staunch enemy of Syrian President Bashar Al-Assad rejected extending an apology to Moscow
for about a year, although economic sanctions by Russia as well as growing victories by the Syrian
army, popular forces, Hezbollah fighters, Iranian advisors and Russian air force that cornered the
terrorists in Syria and similar victories against ISIL in Iraq convinced the Turkish president to
not just apologize for the Sukhoi incident, but also show signs of a U-turn in foreign policy, saying
that he is dropping his opposition to President Assad.
Four days after the coup, officials in Ankara announced that the two Turkish pilots who played
a role in the downing of the Russian plane in November were in custody over the recent failed coup.
"Two pilots who were part of the operation to down the Russian Su-24 in November 2015 are in custody,"
a Turkish official told journalists on Tuesday, adding that they were detained over links to the
coup bid.
Russian President Vladimir Putin called his Turkish counterpart Recep Tayyip Erdogan on Sunday,
describing the attempted coup as unacceptable and voicing hope for a speedy return to stability.
The diplomatic sources said the shift in Erdogan's foreign policy stated only a week before the
coup has been "a major cause pushing several foreign states to provoke and promise support for the
army to stage the coup, and the same shift also saved him" as it was not clear if the Russians would
provide Ankara with their intel, otherwise.
Officials of neither country have made any comment on the report yet. In Ankara, official sources,
including the Army itself, confirmed that the Turkish army's top generals had been informed of last
week's coup by the MIT hours before the plot came into action.
A statement issued by the army on July 19 described the events that took place on July 15, saying
a majority within the military managed to suppress the coup attempt due to information provided by
the MIT some five hours before the coup plot became public, national newspaper Hurriyet reported.
"The information given by the National Intelligence Organization on July 15, 2016, at around 4:00
p.m. was evaluated at the General Staff headquarters with the attendance of Chief of Staff General
Hulusi Akar, Chief of the Army General Salih Zeki Colak and Deputy Chief of Staff General Yasar Guler."
In order to counter the coup, high ranking officials within the Turkish army gave orders for all
air and ground forces around the country to immediately cease operations including military vehicles
such as tanks, planes and helicopters.
A report by Al-Jazeera Arabic suggests the coup plotters initiated the operation six hours ahead
of time as they had previously planned to launch the coup at 3:00 a.m. local time on July 16.
While the report does not indicate the reason for the coup being initiated ahead of time, the
revelation by the military suggests the coup plotters understood their plans had been compromised
and decided to act. 1
Reports also suggest the coup plotters had orders to kidnap or kill President Recep Tayyip Erdogan
as helicopters headed toward the hotel he was staying in at the holiday resort of Marmaris. But Erdogan
had left 44 minutes before they arrived, according to Al-Jazeera's report.
The official statements coming out from Ankara are in full compliance with the Arab media reports
quoting the diplomatic sources on the Russian intel.
Only four days after the coup, Erdogan appeared on the media saying that he plans to declare a
crucial turn in foreign policy that would "end differences with Turkey's neighboring states".
Less than a day later, Kremlin Spokesman Dmitry Peskov announced that President Erdogan would
visit Russia early in August to meet with his Russian counterpart Vladimir Putin.
Meantime, Iran rushed to condemn the Turkish army coup only two hours after it started. Several
top security and foreign policy officials in Tehran were in constant contact with President Erdogan
and his cabinet ministers all throughout Friday.
As July 15 was coming to an end in Tehran, Iranian Foreign Minister Mohammad Javad Zarif was on
the phone with his Turkish counterpart Mevlut Cavusoglu, whose government was under the threat of
being overthrown by a military coup. Meanwhile, Ali Shamkhani, the secretary of Iran's Supreme National
Security Council (SNSC), was on another line with security officials in Ankara. All the while, Qassem
Soleimani, the commander of the Islamic Revolutionary Guard Corps' Quds Force, Iran's regional military
arm, was busy pursuing and reviewing various scenarios that might emerge.
"It's not a secret anymore," an Iranian official told Al-Monitor on condition of anonymity. "Zarif,
Shamkhani and Soleimani were executing higher orders. The whole establishment was too concerned.
Turkey is a neighboring state. President Erdogan and his government are strong partners of Iran.
Our nations enjoy strong brotherly ties, so it's the least we can do to show solidarity and try to
offer any help they might need in such critical times."
"Another Iranian official saw parallels between the successful coup against Iranian Prime Minister
Mohammad Mosaddegh in 1953 and this year's coup attempt in Turkey," Al-Monitor said.
The official told Al-Monitor on condition of anonymity, "What we know is that this move was triggered
by foreign hands. We went through the same in the past, and because Mr. Erdogan is today looking
forward to playing a better role in the region, they want him down." The Iranian official said, "There
was a message that was conveyed to Turkish security officials: Don't leave the streets. This coup
might be made up of several waves; it happened in Iran in 1953. When the first coup failed, they
had another one ready - and they succeeded."
In Ankara, the government claims the coup and the generals behind it are loyal followers of US-based
Islamic cleric Fethullah Gulen, who was once Erdogan's key ally before a major fallout in 2012. Many
believe that Gulen is the main cause of why Ankara officials have repeatedly accused the US of masterminding
the plot.
Gulen is running a multi-billion dollar enterprise in Saudi Arabia and has grown into a serious
bone of contention in Ankara-Riyadh ties. Saudi Arabia reserved condemnation of the coup in a suspicious
move. Later, reports surfaced the media that the top brass in Riyadh and Abu Dhabi – two strong allies
of the US with unbreakably intimate ties with each other in the Persian Gulf – were involved in the
coup.
Saudi whistle-blower Mujtahid, who is believed to be a member of or have a well-connected source
in the royal family, dislosed that senior government officials in Riyadh and Abu Dhabi had been informed
of the coup in Turkey long before it took place.
Mujtahid wrote on his twitter page on Monday that the UAE leaders had played a role in the coup
and the Turkish spy agencies have come to decode this involvement, adding that the UAE leaders had
also alerted the Saudis about the impending coup.
"Saudi Deputy Crown Prince and Defense Minister Mohammad bin Salman had been informed of the military
coup in Turkey," Mujtahid wrote on his twitter page on Monday.
"There are reasons to prove that given his intimate relations with Mohammad bin Zayed bin Sultan
Al-Nahyan (the Crown Prince of Abu Dhabi and Deputy Supreme Commander of the UAE Armed Forces), Mohammad
bin Salman had been filled with information about this coup," he added.
According to Mujtahid, Turkish intelligence agencies had received information about some negative
collaboration between bin Salman and bin Zayed, but the Saudis managed to convince the Justice and
Development party to rest assured and be optimistic about Riyadh's actions.
He revealed that bin Salman has been trying to convince the Turks to conceal the UAE's role in
the coup and has promised a large amount of cash in retribution.
The last week coup in Turkey is now growing into a major regional confrontation over Turkey's
shift in its Syria policy now. If confirmed, the Russian and Iranian aid to Erdogan would mean the
power balance and equations in the region ought to be redefined.
I like Art and now he thinks and writes but I also think that he as some Dennis Gartman blood
in him, he holds many ideas at the same time and he can argue any of them very well. These articles
seem to contradict each other a bit, but they are at least thoughtful..
"Two years into the global oil-price collapse, it seems unlikely that prices will return to sustained
levels above $70 per barrel any time soon or perhaps, ever. That is because the global economy
is exhausted" ~A.Berman ca. July. 2016
"But from 2008 to 2015, oil production actually fell in 27 of 54 countries despite record high
price. Thus, while peak oil critics have been proven right in North America they have been proven
wrong in half of the World's producing countries" ~ E. Mearns ca. July, 2016
It looks like my posts at this fine blog for the past 2 – 2.5 years are finally being read
and understood …..
Maybe one day even Dennis will get the message…….
……one can only hope…..
"…while indeed initiated by geology, this time "PEAK" shall be by the way – and in the form
of low prices…" ~ Petro's main theme for the past 2 years on POB
Be well,
Petro
P.S.: a little hubris and arrogance is healthy now and then….
I totally agree with you. I see the oil price rising well over 100 bucks per barrel before the
end of the decade.
As for the persistent fantasies that Russian oil output will decline. The exact opposite will
happen in the long-term. Russian oil reserves easily dwarf anybody else's.
The concluding paragraph on the oil reserves of the Bazhenov formation in SW Siberia reaches
an unequivocal conclusion:
"Giant recoverable oil reserves contained in the fractures suggest that the Jurassic reservoir
is a primary oil accumulation which has no analog all over the world. Therefore, we believe that
Russia has the largest hydrocarbon reserves in the world."
It is fine and dandy that you show some arrogance when the data is starting to support your
hypothesis, however I must point out that a lot of people have been coming to the same conclusions
at about the same time. There are a lot of clever people in the world.
Ron Patterson has been onto oil decline for a very long time from studying oil production data.
He was about the first to realized that LTO was not a solution to the Peak Oil conundrum. He probably
realized about the 2015 Peak long before he put it on writing. He can tell us. I seem to recall
reading his prediction within the first half of 2015.
Euan Mearns seems to be reaching the same conclusion from the same background, his geological
expertise, but only now have I read him put it on writing.
Art Berman has come to the same conclusion from a very different background, the energy investment
field. This is also the first time I read him say it so clearly, but he probably reached his conclusion
some time ago and only now he dares to write something so strong in his influential blog.
Myself I reached the conclusion that Peak Oil was imminent in September 2014, from economic
insight after I clearly saw that the oil price crash was really bad news for the consumer long
term, while most people thought (think) that is great news for the consumer. I studied oil production
data and saw my fears confirmed. That is when I started my oil (and climate) blog, and my first
prediction on writing of a 2015 Peak Oil is from November 2014, and again February 2015.
My understanding of macroeconomy is not as good as yours, but is good enough to understand
that we are facing the end of the road and the can kicking will not continue much longer. Central
Banks are buying some time through desperate measures that will make the fall harder while the
elites hasten their preparations. We are contemplating the Peak of our civilization (in my opinion
Peak Civilization took place in the early 70's) and its unraveling is going to be a very long
stressful one.
You might be right and I might be wrong. What it is clear is that we see more or less the same
situation but a completely different outcome.
Two things separate completely my analysis from yours:
The first is that I see a monetary crisis as unavoidable in the not too distant future. Most
of the planet's wealth is in the form of electronic money (derivatives and financial instruments).
The folly of Central Banks is hugely increasing those that are in the hands of the financial elite
so there is less and less real wealth (land, resources, and productive industries) to support
that virtual wealth. At some point the bubble is going to be so big and the leverage so high that
there is going to be a run of that virtual wealth to become real at any cost and that is going
to destroy every currency you can buy something of value with. Over here in Europe I am already
seeing some worrying signs of what is coming, as payments in cash are being limited to ridiculously
low amounts and governments are trying to force everybody to have their money in the banks. With
a monetary crisis the price of oil in dollars has no point of reference and predictions have little
value. The US has no experience for generations on monetary crisis, so that is going to be a real
shock.
The second thing is that during economic crisis wealth gets distributed more unequally. The
middle classes and low classes lose their savings and everything of value they have while some
elite class fare quite well even if they lose part of their nominal wealth. This has several dire
consequences. It can lead to bloody revolutions like the French or Russian revolutions. And in
any way it leads to most people not being able to consume much. There won't be enough customers
for oil, making your price predictions useless.
My own personal thought is that the current pricing system for oil based on margin pricing
will have to be abolished once the shit hits the fan. It will simply not work. They'll think of
something to avoid total collapse of oil production.
Yeah, this is a very good article. Art understands how the world works.
Energy is the economy. Energy resources are the reserve account behind currency. The economy
can grow as long as there is surplus affordable energy in that account. The economy stops growing
when the cost of energy production becomes unaffordable. It is irrelevant that oil companies can
make a profit at unaffordable prices.
"Worldwide, average oil production costs have fallen by $19 a barrel to $51 a barrel. At least
for now, the oil industry has squeezed its production costs down to 2009 levels, and drillers
could make a profit extracting 9 million barrels a day over the next decade, a 20 percent increase
from the days of $100 oil.
In West Texas, oil companies could make money in the Bone Spring and Wolfcamp tight oil plays
with $37 a barrel oil, while their rivals in the Eagle Ford Shale in South Texas could turn a
profit at $48 a barrel. The average break-even price in North Dakota's Bakken Shale is $58 a barrel.
In Oklahoma's Scoop region, it's $35 a barrel, Wood Mackenzie estimates."
I think I have mentioned here before, OKLA is happening, and "appears" to be the lost cost
LTO play in US. Now that does not mean I know a damn thing about the oil business but it does
mean you boys should keep a eye out in the future for considerable production coming out of this
area as "development" gets underway.
"... it seem that the IP's out of the Bakken in the Daily reports are trending towards the "less spectacular"? Lots of sub 1,000, and more than a few sub 500 BO IP. ..."
"... I always thought that EOG was the "darling" of the group. But, they having the lowest % of remaining – 36% (64% produced). In that regard, with respect to the production remaining, can you advise "about" how many years of production is represented for an average producer that you note? ..."
This comment is without me doing any analysis, but does it seem that the IP's out of the Bakken
in the Daily reports are trending towards the "less spectacular"? Lots of sub 1,000, and more
than a few sub 500 BO IP.
I created a presentation where I show where
oil production from existing shale US wells is heading in the coming years. It only includes
the actual & projected production of horizontal wells that started production before 2016.
Enno – Excellent information! I always thought that EOG was the "darling" of the group. But, they
having the lowest % of remaining – 36% (64% produced). In that regard, with respect to the production
remaining, can you advise "about" how many years of production is represented for an average producer
that you note?
I don't get your question exactly, can you rephrase? The remaining production is all the production
that is still expected from the legacy wells, in the coming 20 years, although most of it will
of course be produced early on.
"... Actually the opposite is true, they carefully manage water injection so as not to bypass any oil and, for example, in the past would rest Al Abqaiq field without production to allow the water contact to level out (that field might now be close to exhaustion). They have the best reservoir models in the world and will drill wells just to allow monitoring of the reservoir if needed. ..."
I have no idea what you are talking about. I don't remember any such discussion and I have followed
KSA production since about 2001. KSA has used water injection for way over half a century. That
is the only way they can keep the pressure up. It does not damage their fields other than normal
depletion.
From the wiki page on Saudi oil reserves- "Simmons also argued that the Saudis may have irretrievably
damaged their large oil fields by over-pumping salt water into the fields in an effort to maintain
the fields' pressure and boost short-term oil extraction". It was a theory that I saw regurgitated
when KSA was threatening to pump xx millions last year. Thought I saw it here; apologies if not.
Actually the opposite is true, they carefully manage water injection so as not to bypass any oil
and, for example, in the past would rest Al Abqaiq field without production to allow the water
contact to level out (that field might now be close to exhaustion). They have the best reservoir
models in the world and will drill wells just to allow monitoring of the reservoir if needed.
We usually inject salt water. I assume water being injected in Saudi Fields is mostly sea water.
As long as the waters are compatible and the water is oxygen and bacteria free then there's no
problem on the "chemistry" side.
Not knowing the detailed well layout and rock description it's hard for me to speculate with
authority. The key in these fields is to pump water to sustain reservoir pressure slightly above
the bubble point. Thus it's possible that an operator could inject too much, in the sense that
pressure would be kept a bit too high. This in turn reduces recovery factor a small amount.
By the way, I've seen countries where regulations don't allow fine tuning pressure, and we
are forced to operate at a pressure higher than optimum. The guys who wrote those regulations
simply didn't understand the way Mother Nature works.
It's not just Russia. It's KSA, too. Ron's numbers lay it out.
It's Been Two Full Years of price decline. There is no more . . . oh it's just some transitory
effects and we should just wait. Hell, if you wait for anything you'll eventually see it, and
declare that moment verification.
It's not about some "when". It's the area under the curve. All this time it's not happening,
because it's all gone away since 2009. And it's never coming back.
It makes sense to me that in the areas where production costs more, production is declining, while
where production costs less (Middle East and Russia) production is holding steady to rising.
Why should price matter when it's defined in what has been exposed as whimsically defined pieces
of printed paper?
Only a tiny fraction of all money is in paper printed form. The vast majority of all money
is just an electronic entry in a bank somewhere. The form money is in, either in paper notes or
as an electronic entry in a bank account, does not change the value of that money. Lots of things
can change the value of money, but the fact that it is either printed or in entry form changes
nothing.
Russia is seriously hurting because of the low price of oil and Venezuela is dying because
of the low price of oil. How can anyone on earth possibly believe that price does not matter?
The low price of oil has a different effect on different producers. In many places the cost
of production is still below the price of production. So these folks are producing every barrel
possible just to try to stay afloat. But in places where new production cost more than the current
price, production is dropping drastically.
You cannot measure every barrel produced with the same ruler. Production costs differ and this
difference has a corresponding difference in production.
Russian oil companies are largely shielded from negative effects of low oil prices by:
1) the depreciation of the ruble, which makes oil prices higher in ruble terms and costs lower
in dollar terms;
2) the Russian oil tax system, which imposes much higher taxes when oil prices are high and much
lower when prices are low.
But Russia is not typical.
In most other countries producers are much more exposed to the price effects
Production cost differential was true in mid 2014 as well as now.
The price is less than half what it was and two full years have passed. Production is up in
the two countries that represent what, a full 25% of the global output.
You guys are contorting yourselves to make an overwhelming reality fit your preconception.
These central banks don't have any idea what trillions upon trillions have done. Hell, Fed governors
have explicitly said they don't.
The "Financial System" is nothing but a bunch of Ponzi Systems.
How else does a small default trigger the collapse (Japan 1997, USA 2008) of the entire interbank
market?
Shadow Banks
"Money" Markets
Goldman Sachs appointed central banks
Does that come across as legitimate? And that Shadow Banks are somehow disconnected from the
regulated banks? Nonsense.
Short term debt in these "Money" markets is Private Money. Fake Money. Ponzi Money. The Ponzi
Operators control the central banks, not the respective governments. Read the new legislation
after 2008 where government was cut out of the loop.
Isn't it funny when their is a run in the Shadow system by the default of a small firm that
it PERMANENTLY impairs the ENTIRE real economy.
The definition of Money is More Transactions (Bigger Ponzi) than anybody else. There is nothing
real about it because relationship banking disappeared long ago.
Originate a loan, package it, get rid of it, and collect a fee. More loans (transactions),
more fees to collect, more power. More subprime = Greater power.
"... There seems to be a general assumption that the larger conventional producers can choose to significantly ramp up production when they like, but I doubt that is true. Saudi have just bought on line the Shaybah extension which was a pretty big job to extend production facilities for 'just' 250,000 bpd. ..."
"... Usually in mature fields the wells become limiting. For example as water cut increases not only does the water displace the oil but also, as it is significantly heavier than the oil/gas mix in the wellbore, the overall flow rate declines rapidly. ..."
There seems to be a general assumption that the larger conventional producers can choose to
significantly ramp up production when they like, but I doubt that is true. Saudi have just bought
on line the Shaybah extension which was a pretty big job to extend production facilities for 'just'
250,000 bpd.
Production from a given field may be limited by different parts of the facilities at different
times. Typically the limit will be the lowest nameplate capacity between each of: the reservoir
/ wells; oil processing; produced water handling; associated gas compression; total liquids flow;
water (or gas) injection capacity. Overall power availability may also be limiting at some combination
of oil/water/gas flow below each one of their individual limits.
Usually in mature fields the wells become limiting. For example as water cut increases
not only does the water displace the oil but also, as it is significantly heavier than the oil/gas
mix in the wellbore, the overall flow rate declines rapidly. However this need not always
be the case. In Saudi I think they design and manage their facilities to keep the production at
the oil flow design capacity, which is nominally set to give 2% depletion of the original estimated
ultimate reserves per year. To maintain this they maintain excess capacity in the other key facilities.
In particular they need to control the water cut by using intelligent wells, expandable liners,
and recompletions, or when needed drill new wells higher in the formation. If they lose control
of the water cut, which must happen one day (ideally for them it would be the day they flow the
last barrel of oil and shut in but that is not going to happen) then the likely limit will be
water injection capacity. Water has to be pumped in to maintain pressure to exactly balance the
volume pumped out. For the produced water in the oil that is about one for one, for a stock tank
barrel of oil it is higher because the oil shrinks as it cools, but mainly because of the gas
that is lost. This is ratio is called the formation volume factor and typically is 1.1 to 1.8.
Say for a field the water cut is 50% and the FVF is 1.5, this means 2.5 bbls of injection water
are needed to give one bbl of oil. I don't know the Saudi figures but something like that for
them means 25 mmbwpd injection (that represents a huge amount of large pipes and pumps, and power
– the water isn't like domestic supply, it has to be at high pressure). It's not normally economic
to build in much spare capacity for the piping systems (but who knows with Saudi). Once water
can't be controlled in horizontal wells the cut increases quickly, if it can't be handled within
the facilities and enough pressure maintenance from injected water supplied then the oil production
has to fall (i.e. wells choked back) accordingly.
If at a capacity limit (or limits) increasing production may need new wells, but more than
that completely new topsides facilities, anything more than a few tweaks would need at least 2
to 3 years engineering, procurement and construction effort.
Very good overview. I worked with a field set up to handle extra water, but they forgot the water
heat capacity requires more heaters. So as water cut climbed we had to use lots of chemicals to
get clean oil, until we could install more heaters and heat exchangers. These bottlenecks can
be really subtle, so I took to asking for full surface system simulation runs at 90 % field water
cut to see where the troubles were bound to pop up.
I think Survivalist and Petro have nailed a very good analysis of the situation. When prices crashed
most National Oil Companies and many independent producers tried (and are trying) to produce more
to maintain income. The real tragedy comes when prices remain low and production falls like in
Venezuela. Lack of investments guarantees that this will happen eventually to most producers,
and then once production falls enough we will get very destructive price spikes.
Petro, we see eye to eye on much these issues, but I do think that the world economy will be able
to pay much more for oil than 60$ without crashing. Probably more than $100.
The stuff is too useful, and money will be diverted from other uses to keep buying it.
We'll see, one way or another….
You cannot simply look at the oil price between 2010 and 2014 and deduce that those prices
are sustainable for the World economy. You need to understand the situation under which those
prices were made possible at the time. The period 2009-2014 was a time when Chinese debt was growing
at unsustainable levels to fuel an oil demand that compensated the demand contraction from an
overindebted Europe that could not accept those high oil prices and went into recession and debt
crisis. The period 2009-2014 was also a time when central banks engaged in exceptional ZIRP and
quantitative easing policies with most countries significantly increasing their public debt.
But there is only one China and all significant economies have now a high level of indebtment
so a very rapid growth of debt has become a lot less likely. At the same time ZIRP and quantitative
easing policies are a one way avenue of increasing risk, decreasing effect, and extremely difficult
return.
The oil price crash has probably delayed the next economic crisis. However the world economy
is in no position to assume the oil prices required to guarantee the level of investment required
to increase oil production above 2015 levels.
Oil depletion, debt, and low economic growth, will all work to make 2015 the year of Peak Oil.
If we enter a period of high oil price volatility due to mismatches between production and demand
that will be very destructive both to the economy and to oil production.
Possibly $100/b is a problem, but there is a lot of room between $50/b and $100/b. When oil
supply decreases, oil price will increase. How much oil prices can increase without damaging the
World economy is far from clear.
One can arbitrarily claim $75/b is the magic number that will make the economy crash,
nobody knows. There might be a sweet spot between $75/b and $95/b where oil supply can
either be maintained or possibly increase slightly and not cause World output to decline. World
debt to GDP has been relatively stable since 2010 based on BIS data.
Javier- you (and Petro etc) may be right, and the civil difficulties of Venez and poverty of Moldova
may be coming to places far and wide.
I'm thinking that most commerce will still churn on, even if oil is 100$. Maybe just wishful thinking.
I agree. There is very little evidence that oil over $75/b kills the economy, what it has done
recently is result in too much oil production relative to demand.
What has changed is that there is no one willing to cut back on output. From 1930-1970, Texas
was the World's swing producer and from 1985-2014 Saudi Arabia fulfilled that role. Now we will
see volatility in oil prices unless some new cartel is formed, maybe OPPC (Organization of Petroleum
Producing Countries).
US, Norway, UK, Russia, Brazil, and Canada could join the OPEC nations and have a production agreement
to control oil prices.
This would never happen, but maybe each nation should regulate output as the RRC once did for
Texas, it would help with oil price volatility.
Reply
"... Survey of international spending reveals a 19% decline compared with an initial estimate of 14% in January. The Middle East remains an area of stability while the largest negative revisions come from large IOCs, Latin America, and the Asia Pacific region, excluding China. Latin America is still the weakest region, where spending is expected to decline 30%. ..."
"... IOCs and independents are projected to have spending declines of 24% this year, while other independents are expected to spend 45% less. This compares with prior decline estimates of 10% and 17%, respectively." ..."
E&P spending is much lower this year than was expected even after the big cuts initially announced.
US independents and Canada in particular are hurting. Middle East is the only place holding up.
"In its midyear E&P spending update, Cowen & Co. now estimates global expenditures to fall
24% compared with a 16% decline in its January survey. The downward revisions were primarily driven
by larger spending cuts from North America-focused E&Ps and major international oil companies.
In this update, Cowen & Co. expects US spending to decline 45%, reflecting oil prices of $40/bbl
and natural gas prices of $2.50/MMbtu. This was down from a 22% estimate at the time of January's
survey, which was based on $48.5/bbl oil and $2.50/MMbtu gas. Canada spending is expected to fall
33% compared with an earlier estimate of an 18% falloff.
Survey of international spending reveals a 19% decline compared with an initial estimate of 14%
in January. The Middle East remains an area of stability while the largest negative revisions
come from large IOCs, Latin America, and the Asia Pacific region, excluding China. Latin America
is still the weakest region, where spending is expected to decline 30%.
IOCs and independents are projected to have spending declines of 24% this year, while other independents
are expected to spend 45% less. This compares with prior decline estimates of 10% and 17%, respectively."
"... It took a while, but Exxon has decreed force majeure on Qua Iboe. That's the export terminal they have repeatedly said was not attacked first of this week. 300,000 bpd that will not be exported, for a while ..."
Maybe my imagination has become to active, but I believe the story of the NDA attacking Mobile's
Qua Iboe terminal should be getting more interest. Monday night the NDA announced they had blown
up the 300,000 bpd export line. Exxon was quick to deny that an attack had taken place. Someone
is lying and it is not clear who.
http://footprint2africa.com/nigeria-militants-exxonmobil-tug-words/
Although it seems almost inconcievable that Exxon would lie about this, there are a couple
of things that make you consider the possibility. One is that in May there were reports of a militant
strike on the facility, which was denied by Exxon. Shortly after that Exxon reported that a malfunctioning
rig had caused damage to the facility, and it was shut down for a short while.
Another is that after the latest attack claimed, Shell reportedly shut in the trans-Niger pipeline,
and there have been reports of oil companies evacuating 700 staff.
It took a while, but Exxon has decreed force majeure on Qua Iboe. That's the export terminal
they have repeatedly said was not attacked first of this week. 300,000 bpd that will not be exported,
for a while
"... That break-even bullshit is just nonsense. What is happening in oil industry is debt deflation aka "you have to eat less". That debt deflation is direct result of debt infused shale development by Wall Street in order to prevent debt deflation in the rest of economy. Wall Street kicked the can of debt deflation in economy for about 10 years with 3 major shale plays in US. That' all. ..."
"... Why do I need Wood Mackenzie's interpretation? Reality does not need any interpretation. US oil production is down 1 mil within a year from the peak and folding like cheap wall mart chair, oil price is still in the basement at $46, and shale has outstanding credit card debt of 300 billion. And you are dialling 1 – 800 VISA to finance more drilling of shale in OKLA hoping for different outcome. Priceless, as VISA would say. ..."
"... Their only purpose is to keep you in a dream. You are dreaming. If you are in oil business today the present is almost a hell. You can endure it only because of the hopes that you have projected into the future. You can live today because of the tomorrow. You are hoping something is going to happen tomorrow, some doors to paradise will open tomorrow. They never open today. And when tomorrow comes, it will not come as tomorrow, it will come as today – but by that time your hope have moved again. ..."
"... I again wish all would realize that OK resource plays are generally wet gas plays, not oil plays. Just did a quick search. Found 539 hz wells with first production in OK since 1/1/15. ..."
"... Again, another quick search, looks like over 1/3 of the OK Woodford wells with first production 1/13 or later have hit 1 million mcf. Also looks like most are producing over 30K mcf per month. ..."
Production costs dropped because the industry hit the fan and today there's contractors, subcontractors,
and individuals willing to give bargain prices to survive as long as possible, hoping demand will
rise and they can return to being profitable.
Yes, a trillion $ old economy industry can't cut prices by 50% by "innovation" in a few years.
It's all about subcontractors working for just cashflow to pay interrest on their loans.
When they all resume drillig to these low prices (and in shale all drill in the same few sweatspots
with the low $ oil), prices will crash up since there are few workers left to do all this additional
work.
No kidding. Back in the 1980's I was a junior supervisor, but I was asked to cut budgets to the
bone during the 1985-86 crash. The whole process was incredibly stressful, but we managed to achieve
significant cuts by having rather forceful talks with service providers to get cuts. In some cases
they had to sit down with unions and their subcontractors, but it seemed to work pretty well after
we cancelled a platform painting contract on the spot after they refused to reduce their charges.
I don't know any oil business here, since I sit in Germany, but we have lot's of industry.
And in the last crisis 2007 you could produce for lots less than break even, just to maintain
a cashflow. Workers have been on short labor here (It's a thing from the state to prevent firing,
it paid out big time later).
But when the economy picked up prices got higher again. So – you get only the low prices when
few people buy – if everyone and his dog would run out drilling new wells these low prices would
be history again.
That break-even bullshit is just nonsense. What is happening in oil industry is debt deflation
aka "you have to eat less". That debt deflation is direct result of debt infused shale development
by Wall Street in order to prevent debt deflation in the rest of economy. Wall Street kicked the
can of debt deflation in economy for about 10 years with 3 major shale plays in US. That' all.
OKLA plays maybe will get drilled but they will not make a dime like the rest of shale did
not make dime by extracting oil, other than by doing the ponzi type of reselling of leases, companies
to a greater fool.
you are ignorant, I personally have wells in this trend that will make money, that is working
interest that I pay out of pocket money for and get a real after tax return. You should take a
little time to learn and then think before you write, or you can continue to show the cyber world
just how little you really know about the subjects you write about. decisions decisions…:-) I
have not ask because i do not care but your understanding of the real world seems rather limited,
do you profess to know more or have equal or better credentials, education and information, or
more access to objective worldwide data within the oil and gas business than Wood Mackenzie? Thats
what I thought
texas said: "Wood Mackenzie?… made of credentials, education and information…."
That is scary.
Why do I need Wood Mackenzie's interpretation? Reality does not need any interpretation. US oil
production is down 1 mil within a year from the peak and folding like cheap wall mart chair, oil
price is still in the basement at $46, and shale has outstanding credit card debt of 300 billion.
And you are dialling 1 – 800 VISA to finance more drilling of shale in OKLA hoping for different
outcome. Priceless, as VISA would say.
I now must assume you may have graduated high school, and were in the bottom 1/4 of your class
and you may have taken remedial reading. So here is a little help for someone who is just so special.
From the report:
"In West Texas, oil companies could make money in the Bone Spring and Wolfcamp tight oil plays
with $37 a barrel oil, while their rivals in the Eagle Ford Shale in South Texas could turn a
profit at $48 a barrel. The average break-even price in North Dakota's Bakken Shale is $58 a barrel.
In Oklahoma's Scoop region, it's $35 a barrel, Wood Mackenzie estimates."
Do you see where it said Bakken @$58? This is in North Dakota, not OKLA.
Do you see where it said Eagle Ford @ $48. That is in South Texas. again not in OKLA, Those $$$
numbers were far higher last year.
Now can we name the two biggest LTO fields in the US, stay with me, I know this is hard for you.
It is the Bakken and the Eagleford, both on a field wide basis are currently uneconomic and have
been for well over 20 months. Most all LTO and conventional production world wide was uneconomic
for the 4th 1/4 2015 and the first 1/4 2016, perhaps that explains why production has dropped.
With regard to the economics of my personal business, it will not matter what I say, because
you are just plain to ignorant to understand our business. But I will again share, if at such
time we see $4.00 nat gas and $75 oil, this play will have risk weighted returns that exceed most
of any projects I have been associated with in my 30 years. That includes a number of very prolific
trends within the lower 48
You really don't understand numbers. So let's leave at that. I will tell you the secret about
these reports you religiously read by Wood Mackenzie, Citi, Bloomberg whatever.
Their only purpose is to keep you in a dream. You are dreaming. If you are in oil business
today the present is almost a hell. You can endure it only because of the hopes that you have
projected into the future. You can live today because of the tomorrow. You are hoping something
is going to happen tomorrow, some doors to paradise will open tomorrow. They never open today.
And when tomorrow comes, it will not come as tomorrow, it will come as today – but by that time
your hope have moved again.
You go on moving ahead of yourself – this is what dreaming means. You are not one with the
real, you are somewhere else ( like $4.00 nat gas and $75 oil), moving ahead, jumping ahead. You
are dreaming.
I have asked texas the same question few weeks ago and no answer so maybe he is still calculating
ROI :-)
True story: Once I was standing in line for some Korean fast food and guy next to me start
talking. "How yu duing?" , "What do yuo do"….. so the guy says "I am investor" for a living .
I said "Cool". So he starts talking about his investments in real estate, abraka-dabra …so he
, "profit 200% in 2 years, so you can make 100% annually"
And my antennas start beeping right away. The guy was adding the percentages to calculate the
profit after 2 years!!! Catastrophe. So he did not even know how to calculate a profit and he
was "investor"!!!
If he was making 100% annually then 2*2=4, so he had 4 times more money than in the beginning.
4 times more is 300% and not 200% as he claimed. That was in 2005-6 when RE was "hot" and anyone
was RE "investors", so maybe he is shale investor today :-)
I doubt those quoted costs are full cycle costs in those plays for the average well. They may
be based on the fantasy type curves found in investor presentations. When one takes a close look
at actual average well output data, the well profiles in investor presentations are usually about
a factor of 2 higher than real world results. So the real world full cycle (vs point forward)
cost per barrel would be roughly double what you quoted above.
I again wish all would realize that OK resource plays are generally wet gas plays, not oil plays.
Just did a quick search. Found 539 hz wells with first production in OK since 1/1/15.
13 have hit 100,000 cumulative BO or more.
248 have hit 300,000 cumulative mcf gas or more.
It is a wet gas play, just like the Woodford has been for decades. Springer is the only one
I would call an oil resource play, I think it is generally agreed to be uneconomic at present
prices.
Woodford wells will produce a lot of gas, obtain a premium gas price due to high BTU, and produce
little water, so LOE per mcf is low.
I cannot comment on the economics of these wells, but do believe the data, thus far, shows
these to be gas. Yes, many have initial high % of liquids, but the liquids disappear quickly.
I think TT has generally agreed with me on these observations.
Again, another quick search, looks like over 1/3 of the OK Woodford wells with first production
1/13 or later have hit 1 million mcf. Also looks like most are producing over 30K mcf per month.
OTOH, most did not produce any oil in the most recent month. The big oil producers currently
are for wells less than 12 months old.
Safe to say these wells generally will produce a lot of gas. I am not able to discuss economics,
do not have enough data.
Hope I'm not annoying anyone as I have typed this numerous times. My beef is the wells are
advertised as oil wells, in an "oil window" with IP and cumulative production measured in BOE.
Kind of like calling driver assist function " Auto pilot".
Your posts are always solid information and useful. Anyone who might be annoyed is no-one you
need even think about. I bet a lot of us here count on you.
For all:
Can we please see an end–an END–to the snotty tone in far too many of the comments here? There
is no call for any comment of the "I see that you have no understanding of (fill in the blank)"
type, or of anything like it.
Content and accuracy of post are important. Clarity of presentation is important. Civility
and courtesy are important. What anyone posting here thinks of anyone else posting here is not
important for the public discussion.
"... Therefore overall the undiscovered resources might now be zero for maximum, median and minimum cases, which would be quite a bit different from USGS numbers of 4, 7 and 11 Gb respectively, with a mean of 7.4 Gb. ..."
The USGS should revisit their earlier estimate for undiscovered resources in Bakken / Three Forks
now that about four times as many wells have been drilled since the first release.
The way USGS estimated the undiscovered resources was quite simple. Split the region into 6
production zones (which may be stacked); for each zone split into core (sweet spots) and non core
areas to give twelve assessment units. For each unit estimate total area (A), drainage area for
each well (a), EUR per well (U), the proportion of the area unexplored (p) and the chance of not
getting a dry well when drilling (r). Then resource is (A/a)*U*p*r. The values are different for
each zone and they actually give three alternatives: maximum, median, minimum. Then they add up
all twelve (or 36) estimates to give the total (or 3 different totals). The values for A, a and
U might have some reasonable chance of being correct but p and, especially, r are just best guesses;
for the maximum cases r is greater than 80% for all areas and for some minimum cases 90% and higher
is used.
In reality the E&Ps stopped wild cat permitting when they got to 50% success rate (and
falling fast) in 2013/2014. Therefore, in the core areas p might be zero – the lease holders know
what is there and have already included it in 'proven undeveloped', they don't need to drill to
be confident – and in the non core areas p * r is zero – the lease holders drilled wildcats out
from the core until they started hitting dry holes, and then they stopped because there is nothing
else to find (r is zero for all the remaining p). Therefore overall the undiscovered resources
might now be zero for maximum, median and minimum cases, which would be quite a bit different
from USGS numbers of 4, 7 and 11 Gb respectively, with a mean of 7.4 Gb.
"... Steve Kopits at Princeton energy advisors has shown that between 1998-2005 $1.5 Trillion was spent on oil CapEX to increase oil output by 8.4 Mbpd and that from 2005-2013, $4.0 Trillion was spent on CapEx to increase output by just 2.4 Mbpd. ..."
The price of oil seems pretty darn important. Art Berman had an interview with Chris Martenson
on peak prosperity that projects with some 20 Billion barrels of oil have been deferred due to
the current low price. That's a pretty large amount of oil that's not coming online when required
as a result of price.
Not to mention that oil is becoming much harder to find, Steve Kopits at Princeton energy advisors
has shown that between 1998-2005 $1.5 Trillion was spent on oil CapEX to increase oil output by
8.4 Mbpd and that from 2005-2013, $4.0 Trillion was spent on CapEx to increase output by just
2.4 Mbpd.
Society is energy constrained and it's showing up in the economy with crazy effects like NIRP,
where $13 Trillion worth of global bonds now yield negative returns from Zero just a few years
ago, think about that, paying someone to borrow your money!! Also an economy where young people
aren't getting decent jobs to pay for incredibly overpriced house prices as evidenced by affordability
ratios, where populism and extremism is on the rise globally as well as large swathes of society
are left out of prosperity. Energy is the ability to do work, without increasing energy supplies
society has to fundamentally change.
"... There are still a lot of projects due this year and next and even into 2018, but not quite enough to make up for the declines. ..."
"... Probably 2.5 to 3.5 mmbpd fall over the three years barring big, unexpected outages. In 2019, 2020 and 2021 there will be dramatic and accelerating falls unless a lot of expensive, and currently delayed, oil developments are fast tracked soon, or a lot of very cheap oil is found somewhere, or in fill drilling ramps up quickly on the big reservoirs. ..."
"... It's time lag. Simply said, when prices where at 100$+, everyone had lot's of money to invest and drilled like mad to get even more oil, explored, developed new fields. These operations have normally completion times of a few years, so they come alltogether online now. A typically pork circle. Price does matter – now new projects are delayed or canceled, ready to go into the next round. ..."
"... How can anyone possibly deny the effect the price of oil has on the production of oil? The very high price of oil brought on the shale revolution. Oil prices above $80 a barrel caused shale oil production to boom. However shale oil production is just uneconomical at prices below $60 a barrel, or somewhere in that neighborhood. ..."
"... Almost every barrel being produced cost a different amount to produce. There is a thing called "the margin". That is what it cost to produce the most expensive barrel of oil being produced. As the price of oil drops, barrels being produced "at the margin" starts to drop off. More expensive oil stops being produced, less expensive oil continues to be produced. Of course there is a delay between the price dropping below the margin and that marginal barrel dropping from production. ..."
Has depletion finally gained the upper hand? My back of the envelope calculation:
Conventional: 78 million barrels at 4% = 3.1 million barrels.
All other: 19 million barrels at 10% = 1.9 million barrels.
Total: 5 million barrels per year
2015 was a year where a lot of projects came online that were developed in previous years. There
is less of that this year. So 2 million for this year seem reasonable. Next year will be interesting.
If demand keeps growing, there should be a substantial shortfall, draining storage. The only way
to close the fast growing gap is a miraculous recovery of Libya and others that are currently
hampered by political unrest.
There are still a lot of projects due this year and next and even into 2018, but not quite enough
to make up for the declines.
Probably 2.5 to 3.5 mmbpd fall over the three years barring big,
unexpected outages. In 2019, 2020 and 2021 there will be dramatic and accelerating falls unless
a lot of expensive, and currently delayed, oil developments are fast tracked soon, or a lot of
very cheap oil is found somewhere, or in fill drilling ramps up quickly on the big reservoirs.
We'll get to see the truth behind LTO sustainability and flexibility; that and depending on how
demand goes, plus the real storage numbers will determine prices and therefore future supply developments.
Overall though I agree, I think we will suddenly find ourselves short at some point in the next
5 years, and without many options.
Watcher – I think that Ron "almost" has you pegged. Basically he notes that no one can be that
Fu–ing stupid. But, he may be wrong. What in the hell are you talking about when you say "you
can kill competing consumption with weapons?" Why would anyone in the supply chain want to kill
"CONSUMPTION?"
It's time lag. Simply said, when prices where at 100$+, everyone had lot's of money to invest
and drilled like mad to get even more oil, explored, developed new fields.
These operations have normally completion times of a few years, so they come alltogether online
now. A typically pork circle. Price does matter – now new projects are delayed or canceled, ready to go into the next round.
How can anyone possibly deny the effect the price of oil has on the production of oil? The very
high price of oil brought on the shale revolution. Oil prices above $80 a barrel caused shale
oil production to boom. However shale oil production is just uneconomical at prices below $60
a barrel, or somewhere in that neighborhood.
Dammit, it is as plain as the nose on your face. Price determines production. Does Watcher
really deny that simple fact? No, Dennis, you are simply mistaken. Watcher is not so dumb as to
deny that simple fact…. Is he???
Watcher has BEEN denying it, as steadily as if somebody were paying him by the word, for as far
back as I can remember.
Some people, quite a few actually, believe God looks after their lives for them on an every
day basis, and no amount of evidence, good or bad, is enough to shake this conviction.
Watcher apparently believes in some UNIDENTIFIED POWER that keeps oil coming regardless of
the price, or perhaps more accurately, keeps it coming even while controlling the price and forcing
it down by half or three quarters.
Of course there might be another explanation. Maybe he just enjoys rubbing everybody nose in
the apparent failure of the market system in the case of oil.
The explanation is simple enough, in principle. The oil industry is the biggest and slowest
moving of all industries, when it comes to NECESSARILY operating on a five to ten year time scale
in terms of making production decisions.
Being an orchardist, I am personally quite comfortable with such planning time scales, because
my kind of work is planned on a very similar time scale. If I miscalculate , meaning guess, really,
what the price of apples will be ten years down the road, and plant too many new trees, I am not
just going to take a chainsaw or bulldozer to my orchard because the price collapses. I wait it
out, and hopefully OTHER orchardists go broke first. Old trees will be dying, there is depletion
in apples, lol.
The production decision making process is triply compounded in difficulty by what we usually
forget , because in a forum such as this one, the discussion is centered around BUSINESSMEN out
to make a living, folks such as Mike, Shallow Sand, Texas Tea, etc. They make rational decisions,
as best they can.
What we forget is that the oil industry is an industry dominated by governments, and governments
are notoriously clumsy in managing their business affairs when circumstances demand action.
Politicians, be they Saudi kings or socialist Venezuelans, or right wing dictators or more
middle of the road types, are NOT going to do anything to upset their citizens, or piss them off,
if it can be avoided. Laying off a few tens of thousands of people is just not DONE until there
is NO OTHER choice.
Nobody would notice if we laid off half the people who work in the post office here in the
USA. Every body I know , excepting my cousin who is a carrier, and the post master, thinks we
could get along JUST FINE delivering the mail three days a week instead of six.
Politicians at the top of the heap are mostly interested in one thing, that thing being to
stay in power, and to do that, they play an incredibly complicated, fluid game maintaining the
network of supporters who ENABLE them to STAY in power.
Expecting them to act like BUSINESSMEN running a business is naive. As a rule, they will never
do anything proactive in order to solve a problem that might just go away by itself. When they
DO do something , it is to be expected that the doing will be undertaken much later than it ought
to be, and that it will be inadequate to deal with the problem until the problem becomes an existential
emergency.
ONCE all the chips are on the table, and it's literally do or die, or be sent home, out of
office and out of power, governments can do some pretty spectacular things, such as mobilize to
fight a flat out war.
Things aren't that bad yet, in the countries dependent on oil revenues,excepting Venezuela.
Maduro is actively constructing a police state in hopes of staying in power.
The industry has excess capacity. It took years to build that capacity, and the economy couldn't
absorb the amount of oil coming to market at a hundred bucks, so the price collapsed. The economy
IS absorbing the oil coming to market, about the same amount , at about forty bucks.
It will take a WHILE for the excess capacity to dry up.Maybe another year or two, maybe less,
maybe longer. If the economy turns sour, it will take longer.If the electric car revolution really
comes to pass, on the GRAND SCALE, and very quickly, demand destruction will mean there is so
much excess capacity that the price will stay low for a long time.
There is nothing involved in understanding the oil price question that requires more than a
basic understanding of supply and demand, plus an additional understanding of the relevant time
scales and the nature of GOVERNMENTS as opposed to BUSINESSMEN making decisions.
If businessmen were running the post office, we would have half as many postal employees, lol.
Maybe even less.
Farmers have generally done the same thing, collectively, when the price of whichever crop they
produced crashed.
As an individual guy growing corn, or wheat, or rice, or apples, I cannot produce enough, or
cut back far enough, to influence the market price. What I CAN do, is go flat out to produce every
possible last bushel, going for the all important marginal dollar that might enable me to survive
short term. This is what the SMALLER oil producers are doing, by and large.
While producing flat out individually, and collectively, we make the price crash even lower,
and stay in the pits longer, but then this is what drowning men who cannot swim do in the water-
try to survive by pushing themselves up by pushing another man under.
The game changes when one (or more) supplier is big enough and rich enough to have pricing
power and staying power running at a loss. In that case, the big boy can "sweat" the little fellow
, in the words of John D Rockefeller, running him out of business, deliberately.
Now this didn't take long at all while Rockefeller was running a small local company out back
in the early days of big oil, but it can take a hell of a long time when the little guy is a sovereign
government, or a giant corporation. I should say that SA and Russia are engaged in BOTH ways,
producing flat out to maximize revenues, plus hoping to run some competitors out of the market,
at least temporarily.
Folks who aren't TOO simple minded to think a little also realize there is such a thing as
war and politics, and that war can be fought in markets as well as with guns. The USA basically
broke the old USSR by making it impossible for that now dead empire to compete with us on building
guns, never mind butter, plus encouraging the Saudis to flood the market and deprive the Soviets
of oil revenue. Hard core D types will never admit that this is true however, because it is grounds
for being kicked out of the party to admit that a Republican has ever succeeded at doing anything
at all except creating more and bigger problems.
There is an element of WAR being played out in the oil markets now, and for the last year or
two, and it will continue to be important for a while.
Anybody who thinks anybody in DC, excepting oil state congress critters and oil lobbyists,
gives a flying fuck about the oil industries problems has a near zero understanding of economic
politics. Cheap gasoline is an elixer that is damned good for the OVERALL economy, and as good
as a zanax for soothing the nerves of consumers. To expect the Obama administration to do anything
to raise the price of oil, when raising it would cost D 's elections, is tantamount to insanity.
Who can remember this quote? "It's the economy, stupid"?
Hells bells, the R party rakes the D 's over the coals for LOWERING the price of oil by insisting
on higher fuel economy standards, lol.
And one last little bit of ranting, and I will lay off for an hour or two , at least, so help
me Jesus. This is history we are talking about, not a goddamned thirty minute tv show.
Looking at what Ron has said that the threshold for LTO production is $60, what I find important
is that just a few years ago that threshold was in the $80 to $100 range.
Even at today's prices, $45 to $50 range, we have seen the oil directed rig count, increase
over the past few weeks.
This indicates that some of the better plays have a lower threshold.
As we go out in time I would not be surprised that the $60 threshold will move down again.
R DesRoches,
absence of some new technology, I expect we are at the lows of what LTO break-even cost will be
for the best LTO plays. As oil prices pick up and balance sheets get better the drilling companies,
Fracking co will begin to have some better pricing power and I expect they will use it. So for
a time expect break even to stay low but begin to rise "somewhat" as prices move up. I still think
$75 WTI is what the best companies in the best plays really need to MAKE MONEY not just break-even
in a normal business environment. (lets says 1200 rigs running lower 48 ) I know I would be drilling
in the areas I am active at that price, $50 not so much and only with a gun to my head :-)
RDR – I am never sure of what anybody said about breakeven, unless it is accompanied by a complete
financial statement.
If an oil company has undrilled land in an LTO area, that (1) needs production to "hold" the
lease, and/or (2) has bank debt related to its lease acquisition, then: Their breakeven point
and perspective is totally different (lower) than if you or I tried to determine our breakeven
point if we went someplace, bought acreage and drilled a well.
OTOH, I notice 2 yrs later KSA is producing 600K bpd more oil at less than half the price.
And what is Russia producing now at less than half the price?
Watcher, you cannot measure every barrel produced with the same yard stick.
It cost KSA about $20 a barrel to produce oil, more in some places less in others. Therefore
they want to produce every barrel possible in order to meet their budget.
It cost Russia pretty much the same to produce oil from their old fields. But it cost them
much more to find new oil and produce it. The price of oil is hitting Russia very hard but will
hit them much harder unless the price rises soon.
The low price of oil is killing Venezuela. Their production is dropping. It will drop much
further unless the price starts to rise soon.
Almost every barrel being produced cost a different amount to produce. There is a thing
called "the margin". That is what it cost to produce the most expensive barrel of oil being produced.
As the price of oil drops, barrels being produced "at the margin" starts to drop off. More
expensive oil stops being produced, less expensive oil continues to be produced. Of course
there is a delay between the price dropping below the margin and that marginal barrel dropping
from production.
Watcher, it is just fucking insane to claim that price has no effect on production. You have
to know better than that. Why on earth do you think the number of oil rigs working in North Dakota
dropped fro 215 rigs four years ago today, to 30 today? It was because the price of oil dropped
and for no other reason. And that decline in the number of rigs is currently having a dramatic
effect on oil production in North Dakota.
Dennis, I was just being sarcastic. I know that Watcher really does believe that the price of
oil makes no difference. Imagine that! He also believes that money is just a piece of paper.
If you go to any of the big LTO independent oil companies web sites and look at their investor
presentations you will find two trends.
First the day to drill wells have come down in the last couple of years, in many cases by over
30%.
Second with bigger fracs and changes in the mix, IPs and EURs have gone up, in many cases above
25%.
What this means is that the break even price of oil has been coming down.
We are starting to see rigs coming back to the patch at oil prices below $50. IMO as the oil
prices moves up towards the $60 level the rate of increase in rig counts will also increase.
Well costs went down and then back up as more esoteric well designs have become common. Note
that supd costs may have gone down and LOE might also have gone down, but you are leaving out
completion costs which is about 2/3 of the capital cost of the well, the decrease in spud cost
has been more than offset by increases in completion costs (this includes the fracking). On balance
total well cost has probably not decreased much and for the newer designs with more stages (up
to 40 or so in the Bakken) and higher amounts of proppant, total well cost has probably increased.
The "lower well cost" presented in the investor presentations is for an older "standard well
design". The newer well designs that have increased the output per well cost an extra 1 or 2 million
per well (in the ND Bakken/Three Forks).
What does frac water cost per barrel, or at least a range? How many barrels of water are needed
to drill and complete a hz well? How much does trucking the water cost.
I know all this can vary, so just some ranges will do.
I took a look at oil rigs operating in the Permian, Bakken and Eagle Ford.
For those 3 plays we have:
Total oil rigs- 213
Horizontal-191
Vertical- 22
Bakken – 28T, 27H
EF- 27T, 26H
Permian-158T, 138H, 74% of oil rigs in the big 3 LTO plays.
Of the 28 oil rigs added since May 27, 2016, 22 were added to the Permian and all were horizontal
rigs. The Bakken added 5 horizontal rigs and 1 vertical and the EF 1 vertical rig.
Based on this, Eagle Ford is probably the high cost play, then Bakken, with the Permian perceived
as best at the moment of the LTO plays.
-Not only price does matter, but It is PRECISELY due to the low prices that everybody is producing
in a " …the last big party…" mode, … last oomph, if you will!
All in!
All they can!
….and has little to do with the "delayed effect"…. if there is such a thing.
"... "Today, because of improvements in horizontal drilling technology, you've got a play that could be the largest onshore play in the country, not only in size of potential reserves but also in a real extent." ..."
When energy costs are low, the costs of doing business are correspondingly low. When energy prices
are high, it is difficult to make a profit because the underlying costs of manufacture and distribution
are high. This is particularly true in a global economy that requires substantial transport of raw
materials, goods and services.
The global economy expanded in the mid-1980s through 1990s when
oil prices averaged $33 per barrel. Then, oil prices nearly doubled to an average of $68 per barrel
from 1998 to 2008, and subsequently increased after 2008 to 2.5 times more than in the 1990s. When
oil prices exceed $90 per barrel, the global economy is no longer profitable.
... ... ...
America's Golden Age
The United States
experienced a golden age of economic growth and prosperity
during the 25 years following World War II. This period
forms the basis for U.S. and indeed global expectations
that growth is the norm and that recessions and slow
growth are aberrations that result from mis-management of
the economy. This is the America that today's populists
want to return to.
The Golden Age, however, was a singular phenomenon that
is unlikely to recur. After 1945, the economies and
militaries of Europe and Japan were in ruins. The U.S. was
the only major economy that survived the war intact.
Having no competition is a huge competitive advantage.
The U.S. was the first country to fully convert to
petroleum, another competitive advantage. A barrel of oil
contains about the same amount of energy as a human would
expend in calories in
11
years of manual labor
. Crude oil contains more
than twice as much energy as
coal
and two-and-a-half times more than
wood
. And
it's a liquid that can be moved easily around the world
and put in vehicles for transport.
In 1950, the U.S. produced 52% of the crude
oil in the world
and was largely
self-sufficient. Texas was the largest U.S. producing
state and the Texas Railroad Commission (TXRRC) controlled
the world price of oil through a system of allowable
production that also ensured spare capacity.
... ... ...
Tight oil used the same horizontal drilling and hydraulic
fracturing technology that had been pioneered in earlier
shale gas plays. The technology was expensive but once oil
price topped $90 per barrel in late 2010 and stayed high
for the next 4 years, the plays were deemed successful by
producers and credit markets.
U.S. tight oil and
deep-water production resulted in a second coming of sorts
with monthly crude oil output reaching 9.69 million
barrels per day in April 2015. That was 350,000 bopd less
than the 1970 peak of 10.04 million bopd.
The difference of course was cost. In 1970, the market
price of a barrel of oil in 2016 dollars was $20 per
barrel versus $100 from 2011 to 2014, and $55 per barrel
in 2015.
And this is precisely the problem with the almost
universally held belief that technology will make all
things possible, including making a finite resource like
oil infinite. Technology has a cost that its evangelists
forget to mention.
The reality is that technology allows us to extract
tight oil from non-reservoir rock at almost 3 times the
cost of high-quality reservoirs in the past. The truth is
that we have no high-quality reservoirs left with
sufficient reserves to move the needle on the high global
appetite for oil. The consequence is that to keep
consuming and producing as we always have will inevitably
cost a lot more money. This is basic thermodynamics and
not a pessimistic opinion about technology.
... ... ...
Nevertheless, in a zero-interest rate world, there was
great enthusiasm for yields greater than conventional
investments like U.S. Treasury bonds and savings accounts
that continue to pay less than 2%. Bank and
mezzanine debt, high-yield corporate ("junk") bonds and
share offerings promised yields in the 6 to 10% range. As
long as prices were high and the plays were marginally
profitable, risks were downplayed and capital was almost
unlimited. Two years into the oil-price collapse, capital
is more limited because banks and investors have been
burned.
Producers continue the mantra that costs keep
going down and well performance keeps getting better.
Those with some history and perspective, however, know and
remember that they always say that but the balance sheets
never reflect the claims.
In 1996, the late Aubrey McClendon made the
following statement
about the Louisiana Austin Chalk
play:
"Today, because of improvements in horizontal
drilling technology, you've got a play that could be the
largest onshore play in the country, not only in size of
potential reserves but also in a real extent."
That play was a total failure for McClendon's
Chesapeake Energy Corporation and today Chesapeake is on
the verge of bankruptcy for the second time.
People want to believe that things keep getting better
and that they won't have to change their behavior-even if
these beliefs defy common sense and the laws of nature.
... ... ...
Post-Financial Collapse monetary policies, the cumulative
cost of nearly four decades of debt-financed growth, and
the return of higher oil prices have exhausted the
economy. Most debt is non-productive, interest rates
cannot be increased, and 2016′s low oil prices are still
one-third higher than in the 1990s (in 2016 dollars).
Producers and oil-field service companies are on life
support. One-third of U.S. oil companies are
in default
. Yet some analysts who have no experience
working in the oil industry proclaim break-even prices
below $40 per barrel and breathlessly predict that the
business will come roaring back when prices exceed $50.
Producers don't help with outrageous claims of
profitability at or below current oil prices that exclude
costs and are not generally applicable to their
portfolios.
As a result, the public and many policy makers believe
that tight oil is a triumph of American ingenuity and that
energy will be cheap and abundant going forward. The
EIA forecasts
that U.S. crude oil production will
exceed the 1970 annual peak of 9.6 mmbpd by 2027 and that
tight oil will account for almost 6 million barrels per
day. Although I have great respect for EIA, these
forecasts reflect a magical optimism based on what is
technically possible rather than what is economically
feasible.
Renewable energy will be increasingly part of the
landscape but its enthusiasts are also magical thinkers.
In 2015, renewables accounted for only
3%
of U.S. primary energy consumption. No matter the
costs nor determination to convert from fossil to
renewable energy, a transition of this magnitude is
unlikely in less than decades.
Solar PV and wind provide much lower
net energy
than fossil fuels and have limited
application for transport–the primary use of energy–
without lengthy and costly equipment replacement. The
daunting investment cost becomes critically problematic in
a deteriorating economy. Although proponents of renewable
energy point to falling costs,
more
than half
of all solar panels used in the U.S. are
from China where cheap manufacturing is financed by
unsustainable debt.
It is telling that energy and its cost can hardly be
found among the endless discussions about the economy and
its failure to grow. Technology optimists have
disparaged the existence of an energy problem
since at
least the 1950s. Neither unconventional oil nor renewable
energy offer satisfactory, reasonably priced, timely
solutions to the dilemma.
As political leaders and economic experts debate
peripheral issues, the public understands that there is
something horribly wrong in the world. It is increasingly
difficult for most people to get by in a failing global
economy. That is why there are political upheavals going
on in Britain, the United States and elsewhere.
The oil industry is damaged and higher prices won't fix
it because the economy cannot bear them. It is
unlikely that sustained prices will reach $70 in the next
few years and possibly, ever.
The British exit from the European Union adds another
element of risk for investors. Lack of investment will
inevitably lead to lower production, supply deficits and
price spikes. These will further damage the economy.
The future for oil prices and the global economy is
frightening. I don't know what beast slouches toward
Bethlehem but I am willing to bet that it does not include
growth. The best path forward is to face the beast.
Acknowledge the problem, stop looking for improbable
solutions that allow us live like energy is still
cheap, and find ways to live better with less.
--------------------------
*J.K. Galbraith, 2014,
The
End of Normal
, p.54. Much of the economic
interpretation in this post is based on Galbraith's work.
**J.K. Galbraith, 2014,
The End of Normal
,
p.57.
Art Berman
Petroleum Geologist and Professional Speaker
Visit my website for more information: artberman.com
Some 20 carmakers have committed to making automatic emergency braking systems a standard feature
on virtually all new cars sold in the U.S. by 2022, according to a new plan from the
National Highway Traffic Safety Administration and the Insurance Institute for Highway Safety.
Automatic brakes are designed to stop a vehicle before it collides with a car or another object.
Experts say that making them standard could prevent as much as 20 percent of accidents.
NPR's Sonari Glinton reports for our Newscast unit:
"Many cars on the road now have automated brakes. And when you're new to them, it's pretty scary
when the car stops on its own. But experts say automatic brakes could make the fender bender a
thing of the past.
...
"It's part of a push to fight the growing problem of driver distraction and a step closer to
driverless cars. Now carmakers have to figure out by 2022 how they'll integrate the systems."
NHTSA released a list of the car companies that have committed to the system:
"Audi, BMW, FCA US LLC, Ford, General Motors, Honda, Hyundai, Jaguar Land Rover, Kia, Maserati,
Mazda, Mercedes-Benz, Mitsubishi Motors, Nissan, Porsche, Subaru, Tesla Motors Inc., Toyota, Volkswagen
and Volvo."
"In 2012, one-third of all police-reported crashes involved a rear-end collision with another
vehicle as the first harmful event in the crash," according to the government's information page
on Automatic Emergency Braking systems.
It adds that AEB systems can either avoid or reduce the severity of some of those rear-end crashes.
In a statement about the plan, NHTSA says the "unprecedented commitment" from the automakers will
bring the safety technology to "more consumers more quickly than would be possible through the regulatory
process."
"... It looks like the increase in GOR has finally stopped, at least for wells earlier than 2015. GOR for 2015 is still increasing fast. 2008 and 2009 are on the other hand decreasing. ..."
"... Here we can see that for 2009 there is a huge drop, about 6%. As a comparison it would translate into more than 50% in one year. ..."
"... This graph looks like a mess, I know. I hope you can make something out if though. It shows the percentage of wells that are producing in a certain month. There is a downward trend over time, but the oil price is not affecting it much at all. ..."
Hello guys. Here is my updated Bakken GOR graph. It looks like the increase in GOR has finally
stopped, at least for wells earlier than 2015. GOR for 2015 is still increasing fast. 2008 and
2009 are on the other hand decreasing. So what does this mean for production? Lets see in
my next graph bellow.
Here we can see that for 2009 there is a huge drop, about 6%. As a comparison it would translate
into more than 50% in one year. But of course you should not extrapolate from a (cherry picked)
single month like that. For 2008 there is instead a slight increase. At least some of that can
be explained by that some wells that were previously not producing, are now back online. I don´t
know how much of an effect that has though. I´ll show more about that in my next graph. 2013 has
slowed down the decline since last month, but is still bellow 2012. So overall nothing dramatic
except for 2009.
This graph looks like a mess, I know. I hope you can make something out if though. It shows the
percentage of wells that are producing in a certain month. There is a downward trend over time,
but the oil price is not affecting it much at all. It´s only this spring when the oil price was
in the 30s that you can notice some decline. But it´s not more than 1-2% of the wells that were
put offline. Never the less, there were some wells that were put back on production in May which
should have a positive effect on production. Also ,the total producing "days" for all wells combined
has increased by about 5% since last month (which I don´t show in any graph here).
Looking at Art Berman's chart below. World oil production since 2005, less US and Canada, has
been pretty much flat. This is despite the fact that prices have risen dramatically in that period
of time. So lets look at the other huge gainers since 2005.
Russia: See the EIA's take above. Even if they are wrong, Russia's huge gains are gone forever.
Angola, Brazil, China and Colombia: China and Colombia have definitely peaked. Angola peaked
in 2010 and has declined slightly and been flat since then. Only Brazil has any hope of increasing
production, and tat not by very much.
Iraq: I believe Iraq has peaked. Some may disagree but there is no doubt that their best days
are behind them. They have far more downside potential than upside potential.
There is little doubt that all those countries will decline in the next few years regardless
of what the price of oil is. After all, if oil above $100 a barrel in the past did not sent them
producing massive amounts of oil, there is no reason to believe it will do so in the future.
That leaves the USA and Canada. To those massive high prices in the past few years, only
the USA and Canada responded. So… will higher prices bring on enough US and Canadian production,
to make up for the decline in the rest of the world… plus increase production enough to push production
above the 2015 peak?
Sobering, as Euan writes. Alarming I'd say.
In a possible future's retrospect, it may turn out to have come as a surprise how fast things
unraveled sociogeopolitically so close after the peak.
Fossil fuel, within a certain EROEI range is, of course, power. It powers pseudoeconomies,
governpimps, and their militaries. And now China and Russia, for two examples, are not nearly
as 'backwoods' as they may have been, historically. They have become, 'Westernized'…
After a year of trying to increase their production they have been unable to do so. Now things
are likely to get worse. Iraq depends almost entirely on outside contractors. Also there has been
a steady stream of skeptical news coming out of Iraq.
Iraq is Opec's second-largest producer after Saudi Arabia and has ambitious plans to increase
production capacity to between 5.5m b/d and 6m b/d by 2020.
This target, which has been revised downward in recent months, has been viewed with scepticism
as a budget crisis is limiting the federal government's ability to pay companies that are producing
oil in Iraq. These include from BP, Royal Dutch Shell and Russia's Lukoil.
Although they are developing some of the lowest cost easy-to-access deposits of oil in the
world, the fields need more investment to maintain production at current levels and increase future
capacity. At the same time, the government in Baghdad is requesting companies reduce spending.
"We're taking more risk to keep production the same, while not getting paid. We can't
continue to produce for 2-3 years like this, it's not possible," said one executive at an oil
company operating in Iraq. "Maybe they can achieve 6m b/d by 2030."
These numbers are through June. As you can see they still have not matched January's numbers.
And their contractors are not getting paid. Now what would you think would be the likely effect
on Iraqi oil production?
My guess is that Iraq oil production will struggle to maintain current levels over the next
couple of years and then drop rapidly as their ongoing religious civil war makes the situation
too dangerous for continued foreign investment.
Another guess is that the global economy will be in recession by 2020, reducing demand, lowering
world oil prices, and pushing many national economies into bankruptcy. The impact for countries
highly dependent on oil revenue to maintain social services and stability will be devastating
and we'll see the breakdown of societies and the rise of dictatorship.
All wags of course. But it seems to me, generally, that geopolitics and social/economic problems
will begin to overtake any geologic and technological limitations in world oil production. Venezuela
is a current example, and now Iraq, starting with their "budget crisis" and workers "not getting
paid", as your article describes. In other words, above ground factors are determining production
and not the lack of oil in place.
Thanks for your reply, always appreciate your clear-headed thinking.
Probably Art is basing his incremental graph in Matt's ones.
Also very noteworthy is Matt's graph on "Conventional Oil Plateau" from his May 2015 update on
that link.
"... China, the world's fourth-largest oil producer, pumped 5.6% less crude year-on-year in April ..."
"... The Asian nation reduced oil output in May by 7.3% from a year ago ..."
"... In June alone, China pumped 8.9 percent less crude than a year earlier ..."
"... 8,9% in June and the decline just continue to increase!! Lets see what happens in the future, but right now it certainly looks like its collapsing. ..."
"... Some Chinese production is very expensive and they will get their oil from the least costly source. I know this because I've worked there with their senior resource people and had the discussion. Of course, China is facing serious oil depletion as well. ..."
"... In fact, China's production increased 62 kb/d in June vs. May to 4.03 mb/d. But y-o-y decline accelerated to 8.5% in June 2016 (not 8.9% as says Reuters article quoted by oilprice.com). June 2015 was the peak month for China's oil production (4.41 mb/d). ..."
"... China has seen in the past significant drops in monthly oil production, most likely related with maintenance. But this time is different. I agree with Ron that China has peaked. ..."
"... Ok good to know. But 8,5% is still huge. Looking at the graph I see that the number will continue to increase untill end of year unless production levels out or start to increase. ..."
Some Chinese production is very expensive and they will get their oil from the least costly source.
I know this because I've worked there with their senior resource people and had the discussion.
Of course, China is facing serious oil depletion as well.
In fact, China's production increased 62 kb/d in June vs. May to 4.03 mb/d.
But y-o-y decline accelerated to 8.5% in June 2016 (not 8.9% as says Reuters article quoted by
oilprice.com).
June 2015 was the peak month for China's oil production (4.41 mb/d).
I am using original data from the National Bureau of Statistics and conversion factor of 7.3
barrels/ton
China oil production (kb/d) and year-on-year change
China has seen in the past significant drops in monthly oil production, most likely related with
maintenance.
But this time is different. I agree with Ron that China has peaked.
What's makes this time different for China? I'm curious to hear what you base your thoughts on
(as you seem to have a good understanding of what's going on).
Ok good to know. But 8,5% is still huge. Looking at the graph I see that the number will continue
to increase untill end of year unless production levels out or start to increase.
Paul Krugman interpreted the recent decline of 10 year safe interest rates from extremely
low to astonishingly low as a capitulation to stagnation. He argued (convincingly) that
investors have decided that short term safe interest rates will remain extremely low for a
long time (evidently at least 10 years) and that the post 2008 pattern of slack demand, low
inflation and extremely low interest rates is the new normal. It is probably best to just
read his
op-ed, but he considered and rejected the arguments that the low safe interest rates
are the result of a flight to quality.
I want to compare the recent sharp decline in
interest rates to the sharp increase in 2013 which is called the "taper tantrum". I can't
manage an alliteration however, stagnation capitulation rhymes and is (arguably) the mirror
image of the taper tantrum.
I make the comparison for two reasons. The first is that the conventional term "taper
tantrum" asserts that the cause of the 2013 increase is an announcement by the Federal
Reserve Open Market Committee (FOMC) that they were considering tapering the monthly pace
of quantitative easing (not reducing their assets but reducing the rate of increase). This
interpretation would imply that I have been wrong for years as I argue that quantitative
easing has only small effects. This is a silly personal reason for continuing to discuss
the taper tantrum, so I will move that discussion after the jump.
The second reason is that there is an alternative interpretation of the 2013 increase
which is the exact mirror image of Krugman's stagnation capitulation hypothesis. I tried to
present it here. I
expressed the idea even worse than usual so I will try again now (and ask the reader to
trust me that this is what I had in mind then)
The story is that investors assumed back in 2012 and 2013 that the economy and interest
rates would return to normal some time fairly soon. Then in Spring 2013, they decided that
this time had come so they all demanded higher returns on bonds. This (not successfully
written) story is the exact mirror image of Krugman's op-ed. He argues that what just
happened is that investors suddenly decided that economies were not going to return to
normal any time soon.
This is relevant to the old debate about QE, because if markets can shift one way
without FOMC action, they could have shifted the other way for reasons other than a bland
FOMC announcement. More grinding old axes after the jump.
If we had a whole century ahead of
us to transition, it would be
comparatively easy.
Unfortunately, we no longer have
that leisure since the second key
challenge is the remaining
timeframe for whole system
replacement. What most people
miss is that the rapid end of the
Oil Age began in 2012 and will be
over within some 10 years. To the
best of my knowledge, the most
advanced material in this matter
is the thermodynamic analysis of
the oil industry taken as a whole
system (OI) produced by The Hill's
Group (THG) over the last two
years or so (
http://www.thehillsgroup.org
).
THG are seasoned US oil industry
engineers led by B.W. Hill. I
find its analysis elegant and rock
hard. For example, one of its
outputs concerns oil prices. Over
a 56 year time period, its
correlation factor with historical
data is 0.995. In consequence,
they began to warn in 2013 about
the oil price crash that began
late 2014 (see:
http://www.thehillsgroup.org/depletion2_022.htm
).
In what follows I rely on THG's
report and my own work.
Three figures summarise the
situation we are in rather well,
in my view.
Figure
SEQ Figure \* ARABIC 1
– End Game
For purely thermodynamic reasons
net energy delivered to the
globalised industrial world (GIW)
per barrel by the oil industry (OI)
is rapidly trending to zero. By
net energy we mean here what the
OI delivers to the GIW,
essentially in the form of
transport fuels, after the energy
used by the OI for exploration,
production, transport, refining
and end products delivery have
been deducted.
However, things break down well
before reaching
"ground zero"
;
i.e. within 10 years the OI as we
know it will have disintegrated.
Actually, a number of analysts
from entities like Deloitte or
Chatham House, reading financial
tealeaves, are progressively
reaching the same kind of
conclusions.
[1]
The Oil Age is finishing now, not
in a slow, smooth, long slide down
from
"Peak Oil"
, but in a
rapid fizzling out of net energy.
This is now combining with things
like climate change and the global
debt issues to generate what I
call a
"Perfect Storm"
big
enough to bring the GIW to its
knees.
In an Alice world
At present, under the prevailing
paradigm, there is no known way to
exit from the
Perfect Storm
within the emerging time
constraint (available time
has shrunk by one order of
magnitude, from 100 to 10 years).
This is where I think that
Doomstead Diner's
readers are
guessing right. Many readers are
no doubt familiar with the
so-called
"Red Queen"
effect illustrated in REF
_Ref329530846 \h Figure 2
08D0C9EA79F9BACE118C8200AA004BA90B02000000080000000E0000005F005200650066003300320039003500330030003800340036000000
– to have to run fast to stay put, and even faster to be able to move forward.
The OI is fully caught in it.
I find in this article
too many crass claims
and too few simple
facts, and even those
questionable.
Take graph 1. It
suggests, that in
2015, i.e. a year ago,
the EROI of oil were
1.17. In fact it was
always more than 5, in
most cases even more
then 10, afaik, even
for the "new sources",
i.e. tar sands &c.
Concerning the
energetic cost of the
transition: In a first
approximation, energy
investment in
renewables and saving
has paid for itself
within a year. This
means, that if we
transform 10 % of our
energy infrastructure
to renewables and
saving per year, we
have to use 10 % of
our available power
for it. This is
certainly a lot. But
it is certainly
doable, if we want.
The latter, of course,
is the nub of the
matter.
I have the feeling i
have to wade through a
rhetoric jungle to
search for valuable
information. May be a
matter of taste, i
admit.
It is
important
to not
confuse
EROi or
EROEI at
the well
head and
for the
whole
system up
to the
end-users.
The Hill's
Group
people
have shown
that the
EROIE as
defined by
them
passed
below the
critical
viability
level of
10:1
around
2010 and
that along
current
dynamics
by circa
2030 it
will be
about
6.89:1, by
which time
no net
energy per
barrel
will reach
end-users
(assuming
there is
still an
oil
industry
at this
point,
which a
number of
us
consider
most
unlikely,
at least
not the
oil
industry
as we
presently
know it).
Net energy
here means
what is
available
to
end-users
typically
to go from
A to B,
the energy
lost as
waste heat
(2nd
principle)
and the
energy
used by
the oil
industry
having
been fully
deducted -
as such it
cannot be
directly
linked in
reverse to
evaluate
an EROI.
Re the
necessary
energy
investments
to
build-up a
renewable
capacity,
Parts 2
and 3 will
elaborate
on the
matter.
Let's just
say for
now that
we are
talking
here of
whole
system
replacement,
globally,
and not
just
considering
the energy
embodied
in the
implementation
of this or
that bit
of
renewable
technology
- the
pictures
look very
different
at the
micro and
macro
levels.
"... In June alone, China pumped 8.9 percent less crude than a year earlier, with state-owned giants such as PetroChina and CNOOC shuttering unprofitable fields ..."
"... Crude oil imports in January-June jumped 14 percent, China's national Bureau of Statistics said ..."
China's crude oil output over the first half of the year stood at 101.59 million metric tons,
down 4.6 percent and the lowest six-month figure since 2012, Bloomberg
reports. The decline reflects China's stated shift from an industry-focused economic model
to a more service-oriented one. It is also related to a drive by the government to cut the country's
environmental footprint, struggling with a reputation of China as one of the most polluted places
on earth. Low oil prices were also a factor in the production trend.
In June alone, China pumped 8.9 percent less crude than a year earlier, with state-owned giants
such as PetroChina and CNOOC shuttering unprofitable fields and turning to low-cost imports instead.
Crude oil imports in January-June jumped 14 percent, China's national Bureau of Statistics said,
with June recording the weakest growth.
This week -- as thousands of Americans urge
awareness to the destruction caused by oil
bomb trains -- an oil field in San Juan County, New Mexico erupted in
flames Monday night, highlighting the continued and increasing dangers of the
fossil fuel industry.
The fire broke out around 10:15 p.m. Monday at a fracking site
owned and operated by WPX
Energy, setting off several explosions and temporarily closing the nearby
Highway 550. Fifty-five local residents were forced out of their homes.
The site -- located in the Mancos shale deposit area and known as the 550
Corridor and a part of Greater Chaco Canyon -- contains six new oil wells and
30 temporary oil storage tanks holding either oil or produced water. All 36
storage tanks caught fire and burned, the Tulsa, Oklahoma-based energy company said.
The site was still smoldering last night and, now, "only 7 of 36 tanks at
production site on fire this morning," the company tweeted.
"The fire is being allowed to burn itself out due to the intensity of the heat,
the number of oil tanks involved and to contain petroleum fluids on WPX's
five-acre site, predominantly in the storage tankage," WPX said.
"The fire is being allowed to burn itself out due to the intensity of the heat,
the number of oil tanks involved and to contain petroleum fluids on WPX's
five-acre site, predominantly in the storage tankage," WPX said.
According to
Albuquerque news station KOAT,
WPX stopped drilling for natural gas and oil in the area last May. The company
had been producing for about a week before the fire broke out.
The cause of the fire is currently unclear. "We think that in the next
couple of weeks to months, we will have that information and will be able to
share that with the public," WPX San Juan Asset Team manager, Heather Riley,
told the news station.
There were no reported injuries or damage to nearby property. Most of the
evacuees have returned home but 10 families are still lodged in a hotel, The
Farmington Daily Times reported.
Citigroup is "especially bullish" on commodities in 2017, the bank says.
"The oil market is treading water for now, but the oil price overshot to the downside earlier
this year and this is clearly setting the stage for a bullish end to the decade," Citi analysts,
led by Ed Morse, wrote in a research note published on July 11.
There is a quite a bit of volatility in commodity markets, especially for oil, but global demand
continues to grow at a steady pace. Prices have crashed on oversupply, but with oil production
going offline, particularly in the U.S., the markets could over-correct, creating the conditions
for higher prices next year.
Perhaps the true purpose of financial austerity is to reduce oil consumption world wide.
tegnost
indeed perhaps, as our financial overlords have such clear benevolent foresight and care about
people, not profits or perhaps demand has never recovered from $4/gal gas in 2007 and it's much
simpier than that but perhaps the $4/gal gas was done on purpose in order to kill demand and reduce
oil consumption, first by high price and then by austerity, perhaps they just wanted to find out
what price of gas (apparently $4/gal) would crash the economy so they could save the world through
austerity, but first they wanted to get some money in the bank so they could survive his "austerity
period" because their kids can't take out student loans because they create an austerity rich
environment that the children of the world benefit from but their kids were brought up right so
they don't need austerity to be good global citizens, or perhaps crows communicate through quantum
vibration and that's why we can't understand the meanings in their throaty calls .
Robert Hahl
If peak oil is a problem, austerity is a solution.
rjs
it's not a demand side problem; it's supply, which built up as refinery margins were near record
highs and contango made it profitable to store products
ambrit
Local fuel prices show a more 'nuanced,' which is business speak for rent extraction oriented,
situation. Sunday, we went to Laurel, a town some twenty miles north of Hattiesburg. The cheapest
gasoline in Hattiesburg cost $1.99 per gallon. Laurel had gasoline selling for $1.76 per gallon,
all over town, not in isolated pockets. This price disparity was consistent across brands and
types of location. Laurel does not have it's own refineries.
The Oil business has a few rules of it's own, which lowly consumers are not privy to.
Isotope_C14
Seeing as Hattiesburg is in the northern part of Forrest County, and Laurel is in Jones County,
could the price disparity be a component of county taxes?
Also, EPA requirements include a variety of fuel formulations depending on desired pollutant
reduction in a given air-space. Some formulations are for reduced volatile organics and they may
have varying prices.
MLS
day-to-day fuel prices are heavily influenced by all sorts of factors like local tax rates,
the cost of operating any convenience store or auto service on premises (local ordinances regarding
wages, for example), the volume of business they do, whether a particular city or county has a
specific ordinance relating to gasoline formulations, the cost of transporting the fuel from refinery
to the station (generally speaking farther = more expensive), and so on. That you're seeing different
prices 20 miles apart is not necessarily evidence of rent extraction.
Chauncey Gardiner
Puzzling that the price of ethanol, a lower btu and more corrosive fuel that is added to and
blended with petroleum-based gasoline by refineries, has been maintained in a tight price range
since late 2015 and is currently priced near its all-time highs. This while the price of gasoline
has fallen. Why?
NeqNeq
Wasn't there a post a few days ago which showed the US EIA' weekly data was not lining up with
actual monthly numbers? Meaning that there were large revisions being made to prior (2) month
volumes?
Why should last weeks EIA inventory numbers be considered as anything but a noisy estimate
subject to lots of revisions?
ambrit
The more cynical among us wonder in what direction the 'revisions' should really go.
NeqNeq
I get that. And I am sympathetic. That doesn't change the fact that any prognostication (on
the supplied info) is mood affiliation. Using your gut is fine. Hell, it might be instrumentally
better than reasoned argument in certain situations. No need to claim its something other than
your gut though. Unless, you are trying to sell something. Then its probably useful to engage
in post-hoc rationalization.
Pwelder
Two points to remember about "glut" chatter in the Oil and Gas space:
1) The IEA – and to a lesser extent, the EIA – work for governments of nations which are net
importers of crude and products. These governments prefer low prices. This doesn't mean that their
published data is deliberately bad. It does mean that if there's a number that lends itself to
a bearish interpretation, they'll make sure you know about it.
2) One way to generate such numbers is to shift inventories from jurisdictions with low transparency
on storage levels (e.g. the Persian Gulf) to jurisdictions where reporting is somewhat better
(US, Western Europe.) The Saudis have been doing quite a bit of this, as part of their war on
Iranian/Russian oil revenues. This will be coming to an end within a year or so, as realities
of supply and demand overwhelm operations aimed at "painting the tape".
a different chris
>The Saudis have been doing quite a bit of this
Funny how oil has gotten so messed up – the major producers want to broadcast the
fact that there is a glut. Ah Capitalism in all its contradictions
Something to point out to the goldish bugs – the people who just have to have currency attached
to something physical, since gold is a hilarious currency anchor in this day and age* they have
been switching to recommending oil as the baseline. Wonder how they will spin this?
*think about explaining to an intelligent and even sympathetic-to-backed-currency alien, without
any historical reference, why you would pick gold
And this article. Interesting point that Saudi Arabia will have a dilemma when they attempt
to represent the interests of future shareholders in Saudi Aramco as well as be a cartel member
and cooperate with OPEC interests.
The developed proved and probable is 655 Gb, which would equate to about 4.5% natural decay
rate.
There is supposed to be about 900 Gb undiscovered, which at last years rates would take about
300 years to find (and my guess is that if there is that much hydrocarbon it has a significant
amount of gas).
And there are 500 Gb discovered and undeveloped, I don't follow that much but there is a country
break down to check out, but the IOCs stopped development with prices at $110 per barrel so it's
probably going to cost more than $8 trillion to put that much on line.
"... So he's covered. I'm about to publish something here maybe today and the sub title of this section is called "It's not a lie if we tell you it's a lie." That's the name of the game. As long as the investor presentation or the news release says somewhere that we're using language here that we would never ever use in an SEC filing because they'd put us in jail. And so you guys need to know that. In other words, "we're lying," then it's technically not a lie. It's not fraud because we told you it was a lie. ..."
"... Well we started this conversation with your important observation that we're only talking about a million or million and a half barrels a day of oversupply. So we could go from over supply to deficit pretty quickly ..."
"... So just the capital cuts in US companies have effectively deferred $20 billion-or maybe the world, I'm sorry-$20 billion barrels of development of known proven reserves. ..."
"... Well there's a big lag. There's a huge time lag between when the price responds and people actually get around to drilling and they actually start bringing the oil onto the market and it becomes available as supply, because they've been asleep at the wheel for how many months or years. You don't just turn a valve and all of a sudden everything is okay again. ..."
"... There's this tremendous gap between "okay we know there's a reserve," but what's it take to turn it into supply? Well it takes time and it takes money and it doesn't happen overnight. ..."
"... EIA says average price in 2016 will be $53 a barrel. They're not always right and in fact they're often wrong but they're not stupid either. They're doing the best they can. They have got some good people there. ..."
"... Well just turn the clock back to 2012-2013 when oil prices were sky high, were $100 a barrel or more, and what we saw was consistent negative cash flow from virtually all of the major players. So what that says is they weren't making money when oil prices were high, so is it a big shock that they're hemorrhaging when oil prices are lower? So oil prices go back up-the bottom line Chris is the only way that they were able to stay looking fairly good back then to somebody, not me, was that people were giving them money. They had infinite access to capital at almost no cost, and so they were spending it. But their income statements and balance sheets look like crap and the investment community I guess was willing to look past that or didn't want to look at it or whatever. ..."
Chris Martenson: ... And still when I look at the operators in those plays they're claiming that they're going to get
twice that, sometimes even more than twice that out of each well. When I've calculated the economics
in that play myself-I got a little spreadsheet, I did my level best. And then I found that you had
calculated what's going on in that play as well. So let's cut right to that. In the Bakken, how many
wells that get drilled out here right now would be economic in today's prices?
Arthur Berman:
Almost none at today's prices. The latest from the North Dakota Department of Mineral Resources
says that wellhead prices are in the 20's so… I published a report not very long ago that said that
1% of the Bakken was breaking even at $30 oil prices. So now we're below that and I don't remember
exactly what percentage of wells but it was something like maybe 5 or 6%. But so right now let's
face it Chris, let's just get it right out there in the open: Everybody is losing their ass at current
oil prices. I don't care what they say. I'm in this business, okay? I just drilled two discoveries
in the last month or two at the bottom of the cycle and we can make a weak profit off of what we
found-first of all they're conventional reservoirs so they didn't cost us $6-$10 million to drill.
And we don't have to drill them horizontally. We don't have to frack them. And we have got no overhead
and we have got no debt; so that puts us in kind of a really different situation for most public
companies.
The truth is that everybody-the best positions in the best plays in the United States, the core
of the core, if you will-nobody can break even at less than about $45 a barrel and that's just reality.
That's not sticking them with their land costs that they sunk and wrote off long ago; that's just
basic operating expenses and severance taxes and stuff that I publish in all of my reports and nobody
ever argues with me about that. They may disagree with a lot of my conclusions or etc. but they never
say "Oh no, your economic assumptions were way off base." No they're not off base.
So take that to the bank and let's just get that whole silly conversation off the table. Everybody
is losing their ass at $20 or $30 oil, everybody. And that includes Saudi Arabia, Kuwait and everybody
in the world is. But certainly US producers, very best of the best, they got to have $45 or $50,
and that's a small subset of their wells in a play. And realistically $60-$65 is bare bones for the
average well positioned company, all of their better wells or current wells in play. That's just
the way it works. And if you hear something else, ask a lot of questions, like: "Tell me what costs
you're excluding," because that's the only way to get there is just be excluding costs.
Chris Martenson:
... When I look at it that way, just sort of high level, I'm looking at 10 billion barrels, what are the reserves? Total reserves? Across all the plays that these operators are in? It can't be a whole heck of a lot more than that, can it?
Arthur Berman:
Proven reserves in the United States as of EIA's latest report a couple weeks ago are 40 billion barrels of oil. Now there is a Proven Undeveloped which is another category that is also proven, which you can add another 40 or 50% but the number you're talking about there is a huge proportion of the total United States' proven reserves, any way you cut it. And so yeah, be scared. That's the message.
.
... ... ...
Arthur Berman:
There is no difference between what EIA is saying and the companies are
saying, okay? So there's two realities here. There is the reality of truth, like go to jail
truth-that's what the companies actually report in their quarterly and annual filings to the
Securities and Exchange Commission. That's where EIA gets its data. That's where EIA's proven
reserves come from; so there's that reality and that truth, and I think it's reasonably close to
the truth. And then there's what companies tell investors, who believe almost anything and don't
understand-again like Yergin's lifting cost. They don't understand, nor should they be required to
understand that he's not actually talking about total cost. He's talking about a subset of costs.
So your question: The proven reserves of the Bakken, according to the latest EIA, which comes from
companies, is 6 billion barrels. The Eagle Ford is a little more than 5, and the Permian is about
700 million. You add up all the rest of them, the Niobrara and the whatever, the Mississippi Lime
and you name it, and the total is about 13.5 billion barrels. That's the truth. And there's
probably an almost – there's a slightly smaller but large proven undeveloped reserve category as
well.
Chris Martenson:
Art I was just reading an investor presentation where one company
claimed to have access to almost that same number just in the Spraberry play.
Arthur Berman:
Well yeah, Pioneer Natural Resources, that truthfully is not a bad company,
if you just look at their financials. But their CEO, Scott Sheffield, has been making just
absolutely preposterous claims for several years now about this Spraberry resource that they have
out in the Permian Basin. The Spraberry was discovered in 1946 for God's sake. In the industry, we
talk about and have talked about the Spraberry as being the largest non-commercial field in the
world. And we've talked about that for 50 years because nobody can figure out how to make money
off of that deal. So Sheffield says that they've got 10 billion barrels in the Spraberry. But
listen to his words; what is he really saying? He's got himself protected. He says that they've
got 10 billion net recoverable, resource potential. That's not a reserve.
Okay so what is a resource? Well a resource-and I'm going to the Society of Petroleum Engineers
here. The definition is a known and yet-to-be-discovered accumulation. It's vapor. We kind of know
it's there but we haven't found it yet. And so that's a resource, and now he's talking about a
resource potential. So it's not even a resource; it's a potential resource. So what he's saying is
that it's some vague number that we kind of think may be out there. And of course a resource has
nothing whatever to do with price. It's absolutely not – it doesn't have anything – it's any
price. It just says it's technically recoverable. So it means nothing, zero, zip. It means
nothing.
So he's covered. I'm about to publish something here maybe today and the sub title of this
section is called "It's not a lie if we tell you it's a lie." That's the name of the game. As long
as the investor presentation or the news release says somewhere that we're using language here
that we would never ever use in an SEC filing because they'd put us in jail. And so you guys need
to know that. In other words, "we're lying," then it's technically not a lie. It's not fraud
because we told you it was a lie.
... ... ...
Chris Martenson:
Well yes with over
200 trillion dollars of debt
outstanding of course you
have to service that debt and
high oil prices just don't
help that. The model I've
been working with for a long
time is there's a price of
oil at which the world
economy chokes and there's a
floor at which the energy
company's don't want to
pursue oil anymore and that
ceiling and that floor have
been coming closer and closer
together. So here we are,
we're clearly at a price
below which oil and natural
gas-in America here, I'm
staring at natural gas at
$1.83 is the quote I've got
on my screen right now,
yikes. That's way below the
all-in costs for most
companies that I've been
looking at.
But let's dial
this back a bit. Globally
we've see this astonishing
pull back in CAPEX spending
by the oil majors, by the
mids, the minors, national
oil companies, all of
them-over a trillion dollars,
by a bunch of estimates. Talk
to us about what's the impact
on future oil supplies with
this just absolute
destruction of CAPEX spending
globally?
Arthur Berman:
Somewhere between
profound and extreme
[laughter]. We've got to be
constantly discovering
several million barrels of
oil per day to make up for
our consumption. It's easy to
get confused and to say well
geez, we've got such an
oversupply right now, we
don't have to worry about
that.
Well we started
this conversation with your
important observation that
we're only talking about a
million or million and a half
barrels a day of oversupply.
So we could go from over
supply to deficit pretty
quickly
because we're
not investing in finding that
additional couple of million
barrels a day that we need to
be discovering. So we're
deferring major, major
investments and we're not
just deferring exploration,
we're deferring development
of proven reserves.
So
just the capital cuts in US
companies have effectively
deferred $20 billion-or maybe
the world, I'm sorry-$20
billion barrels of
development of known proven
reserves.
And so if we get to a
point- and we will, we almost
certainly will-where suddenly
everybody wakes up and says
"Oh my God we don't have
enough oil." We're now half a
million barrels a day low,
and what happens? The price
shoots up, okay? That's the
way commodity markets work.
And everybody says "Whoopee,
let's get back to drilling
big time."
Well there's a
big lag. There's a huge time
lag between when the price
responds and people actually
get around to drilling and
they actually start bringing
the oil onto the market and
it becomes available as
supply, because they've been
asleep at the wheel for how
many months or years. You
don't just turn a valve and
all of a sudden everything is
okay again.
We saw this during the
Libyan Civil War. Saudi
Arabia said "Don't worry
guys, we've got all this
spare capacity. We'll just
turn it on and produce it and
the world won't see a
shortage." It never happened
because they had to actually
drill wells. Their spare
capacity means they have got
to drill wells to produce it
and that takes time. They
have got to drill it, they
have to test it, they have to
build pipelines, and by the
time they actually got any of
that work done, the Libyan
conflict was over. We've now
seen low production because
the Civil War continues, but
that's another story.
There's this
tremendous gap between "okay
we know there's a reserve,"
but what's it take to turn it
into supply? Well it takes
time and it takes money and
it doesn't happen overnight.
Chris Martenson:
Well no and as you
mentioned it hasn't just been
the exploration but the more
pedestrian stuff like infill
drilling-that's pretty much
come to a complete halt in
the North Sea as far as I can
tell. And it looks like
Mexico is not doing a lot
with their investment down in
their plays at this point in
time, and Brazil doesn't even
begin to know how to get
started with their whole
Petrobras scandal and
drilling through those
really, really expensive deep
water finds they've got. Just
don't make any sense at this
price. So when I look across
really where the oil supply
growth is coming from, Art,
I'm pretty much-like it's
really down to the Middle
East and this hope that the
United States could rapidly
ramp up its shale "miracle"
if prices spike back up.
But I'm with you. I think
that as much as people are
focused on the oversupply
right now-and in two or three
years I'll be really
surprised, unless the world
economy crashes and demand
goes down, with that caveat
attached-I think the world
will be equally surprised by
the shortages that are
coming, because you can't
just… Here's what I see: I
look at this chart and I talk
about this in talks and I say
"Hey look from 2005 to 2012
the world spent about three
trillion dollars on upstream
oil and gas exploration and
production and basically got
the same amount of crude and
condensate out of ground for
its trouble," right? We
doubled our investment on a
yearly basis from $300 to
$600 billion and basically
held production flat. I can
only imagine what happens to
production once you take a
trillion in spend off of the
top of that.
Obviously it looks like to
me we're going to be facing a
multi-million barrel a day
shortfall, as long as things
don't fall apart on the world
economy stage.
Arthur Berman:
And I think even if
things do fall apart on the
world economy stage. I
haven't done this, because
the records aren't there, but
you go back to a period like
the Great Depression in the
world and it's not as if
people stopped buying and
selling goods or transporting
themselves or materials. It
was a big – it was a
depression, and there were a
lot of people out of work,
but the world moves along and
consumption of oil and
natural gas isn't going to go
to zero. I think the forecast
that we've just recently seen
from the International Energy
Agency just last week,
they're saying "okay so
demand is probably going to
be down from 1.8 million
barrels a day of growth to
1.2 million barrels a day of
growth," and that's awful.
But wait a minute, 1.2
million barrels a day of
growth is – you're still
growing at a fairly high
rate. So you have got to be
replenishing your supply or
else you reach this zero
point where you're in deep
trouble.
So I'm with you Chris.
Even in my darkest view of
where the economy could go, I
find myself on a very
different page than most of
the forecasters who think
that we're in for a decade or
decades of low oil prices. I
think we're going to be
struggling under the yolk of
much higher oil prices,
probably beginning next year.
I'm not a price forecaster
but it's hard for me to see-I
am a supply/demand kind of
guy and I would be very
surprised if by this time
next year we're not seeing
oil prices moving toward
something like $60 a barrel.
And you look at the forecast-
EIA
says average price in 2016
will be $53 a barrel. They're
not always right and in fact
they're often wrong but
they're not stupid either.
They're doing the best they
can. They have got some good
people there.
So I think
this notion that we're
somehow stuck in $30 or $40
oil forever and ever, it just
doesn't square with the
reality.
Chris Martenson:
Well it would mean
that we're anticipating that
oil is going to stay below
its marginal cost of
production for a very long
time. It's very difficult for
any commodity to stay there
for long but oil in
particular because of its
stock versus flows. Yes
there's 3 billion barrels
above ground right now but
hey, that's only so many days
of consumption if you decided
to stop producing. So yes,
I'm with you. I think that
obviously oil has to go up in
price at some point and
that's even exclusive of any
geopolitical accidents that
might happen in the Middle
East; just simple
supply/demand and all of
that.
If oil does go back up,
last question, you study the
companies that are involved
in this very carefully and I
think a lot of investors,
especially the banks who have
put the lines of credit out
there, are really double
fingers crossed hoping that
the price of oil moves back
up and all these problems
that these companies are
facing economically will sort
of be in the rear view
mirror. Would you share that
view or do you think that
even if oil rebounds there's
a number of companies here
that have gotten themselves
in over their heads with
respect to debt versus
assets?
Arthur Berman:
Well just turn the
clock back to 2012-2013 when
oil prices were sky high,
were $100 a barrel or more,
and what we saw was
consistent negative cash flow
from virtually all of the
major players. So what that
says is they weren't making
money when oil prices were
high, so is it a big shock
that they're hemorrhaging
when oil prices are lower? So
oil prices go back up-the
bottom line Chris is the only
way that they were able to
stay looking fairly good back
then to somebody, not me, was
that people were giving them
money. They had infinite
access to capital at almost
no cost, and so they were
spending it. But their income
statements and balance sheets
look like crap and the
investment community I guess
was willing to look past that
or didn't want to look at it
or whatever.
So rearview mirror? No,
these are companies that are
highly leveraged and unless
and until that changes-maybe
that's one of the positive
outcomes of this. Maybe we
see a turnover of players.
There are better companies
whose balance sheets look
better and they're the ones
who can afford to say "Okay,
we're going to slow down
production right now because
we don't have the same debt
service that the guy next
door does." So my hope is
that like all crises this is
going to flush out a lot of
the bad players, or at least
some of them. But will higher
oil prices solve the problem
and save the day for the
people that hold the debt?
No. It won't hurt, but if
they couldn't make a profit
at higher prices, going back
to higher prices doesn't fix
the problem.
Chris Martenson:
So for many of these
investors and players, in
many cases, the best that
they can hope for if oil
prices rise is a higher
recovery of cents on the
dollar, but they're probably
not going to get back to
whole on this?
Arthur Berman:
No. Unless somebody
is willing to forgive debt.
If we get that bad, then
there's the solution of last
recourse, right?
"... "The world is seeing ever-stronger competition for resources, and some players try to disregard all the rules, Russian President Vladimir Putin has said , adding that potential for conflict is growing worldwide. " ..."
"... If there was any doubt what Putin was thinking, I don't think there should be any more. ..."
"... "…If production falls under consumption (as opposed to demand) then the result is not a shrug and the price goes up. The result is someone doesn't get the oil they ordered…" ..."
If Ron's 2015 prediction is correct ( I think it is, and I never get this kind of stuff wrong
… lol)
These are the types of articles we should be seeing.
"The world is seeing ever-stronger competition for resources, and some players try to disregard
all the rules, Russian President Vladimir Putin has said , adding that potential for conflict
is growing worldwide. "
If there was any doubt what Putin was thinking, I don't think there should be any more.
The new release of BPs data on oil statistics is getting too little focus.
Consumption globally was UP last year. 1.9%. 1.9ish million bpd.
Lotsa talk about global reductions in production . . . sometimes. Other times we hear about
new records from someone.
But pay heed here. THERE IS NO DELAY IN THIS. If production falls under consumption (as opposed
to demand) then the result is not a shrug and the price goes up. The result is someone doesn't
get the oil they ordered.
Cushing has about 100 million barrels of capacity. If there were 1 million bpd shortfall on
US imports, you got basically 3 months before . . . someone . . . some truck driver at a gas station
. . . doesn't get the diesel he ordered. The SPR would be another few months, but tapping it for
such an emergency would pretty much announce to the world . . . there ain't enough.
"…If production falls under consumption (as opposed to demand) then the result is not a shrug
and the price goes up. The result is someone doesn't get the oil they ordered…" ~Watcher
"... As I pointed out above, Q1 2016 wells were significantly more productive than Q1 2015 wells, in the wells' first 90 days or less. As time goes by, we will get a clearer picture of how much more oil they will produce during the critical 36-60 months when the wells need to payout. ..."
This is interesting and I realize goes against many here who view LTO as a plague, I think the
industry has it right, not the naysayers -- this is not to say the economies are like the East
Texas field, but it is to say given the alternatives best of class LTO played will be the focus
of activity/development coming out of this depression.
TT
That article (the referenced Reuters story describing a lessening of the decline curve) is only
the tip of the iceberg.
Many of the operators are catching on to what EOG has been doing with their fracs, namely scouring/sandblasting
the heck out of the near wellbore area with 100 mesh and then following up with larger proppant
to maintain conductivity.
In addition, the increased formation pressure induced by new fracs is increasing output in
nearby, older wells. This process has been repeated over and over again in numerous older wells
in the core of the Bakken now that the drilling has contracted to a fairly small, highly productive
area full of the older wells.
LTO is not a plague. The plague is development of same out of primarily debt, as opposed to primarily
out of cash flow.
As I pointed out above, Q1 2016 wells were significantly more productive than Q1 2015 wells,
in the wells' first 90 days or less. As time goes by, we will get a clearer picture of how much
more oil they will produce during the critical 36-60 months when the wells need to payout.
$50 WTI looks to be a very hard ceiling last couple of months.
More important is the money made available to drill, complete and equip them. The banks appear
to be wary. Equity investors like the Permian and SCOOP/STACK.
"... In a business as usual demand case (linear trends), Asia needs an additional 11 mb/d of oil imports (crude and products) by 2031. That oil would have to come from following sources ..."
In a business as usual demand case (linear trends), Asia needs an additional 11 mb/d of
oil imports (crude and products) by 2031. That oil would have to come from following sources
8.4 mb/d or 76% would have to come from taking away market share of other importing countries.
That's what the Asian Century will be all about.
"... The STEO has Colombia production holding at around 1 mmbpd for the next two years, but in fact they are declining at about 12% y-o-y ..."
"... Their internal consumption is rising fast as well and at this decline rate they could need to import within three or four years (Figures in chart from Reuters and Energy Ministry, one value for March 2015 looked a bit off so I interpolated). ..."
"... Note also for Norway May figures are down 87,000 bpd and a bigger drop expected for June, mainly for maintenance but overall they are now expected to be in decline again following a small secondary peak until Johan Sverdrup starts up in 2020. ..."
The STEO has Colombia production holding at around 1 mmbpd for the next two years, but in
fact they are declining at about 12% y-o-y (903 kbpd for May). Some might be due to sabotage,
but they have a low R/P ratio (2.2 Gb of reserves so only about 6 years) and rig counts have dropped
by 90% over the year.
I think they were using some EOR methods to boost production as well. Therefore a rapid decline
might not be unexpected. They might have some offshore oil, but only two exploration wells so
far, and both dry, and some shale potential (either way any production is at least 5 years away).
Their internal consumption is rising fast as well and at this decline rate they could need
to import within three or four years (Figures in chart from Reuters and Energy Ministry, one value
for March 2015 looked a bit off so I interpolated).
Note also for Norway May figures are down 87,000 bpd and a bigger drop expected for June,
mainly for maintenance but overall they are now expected to be in decline again following a small
secondary peak until Johan Sverdrup starts up in 2020.
The EIA's
Petroleum Supply Monthly is out with US and individual states production data through April,
2016.
The Petroleum Supply Monthly now agrees almost exactly with the Monthly Energy Review.
The Petroleum Supply Monthly has US production dropping 222,000 barrels per day in April. The
Monthly Energy Review has US production dropping 212,000 bpd in April and 148,000 bpd in May.
Texas production fell 47,000 barrels per day in April. Texas production is down 414,000 barrels
per day since peaking in March 2015.
Ron, are you able to post a graph comparing this peak to the 1970s and 1980s peaks?
I looked at the one on EIA website from 1920 to date, really shows how the shale boom rose
much more steeply, and looks poised to likewise fall much more steeply than in early 1970s or
mid 1980s.
This EIA site, Monthly
Crude Oil and Natural Gas Production , gives us the percentage change for the last month and
the last 12 months for the US and all states and other producing areas. The US was down 2.4%
in April and 7.9% since April of 2015. Texas was down 1.4% in April and down 10% since April
2015. North Dakota was down 6% in April and down 10.6% since April 2015. It looks like April was
just a catch up month for North Dakota.
"... China produced 7.4 percent less domestic crude oil in May compared to a year ago, settling at 16.76 million tonnes. This was due to plans by state-owned oil companies to slash output that is weighed down by languishing oil prices, official data showed. ..."
"... All the Chinese decline is not due to the price drop. China had peaked and would be in decline even if the price had stayed high. The price drop just made it a bit worse. ..."
China produced 7.4 percent less domestic crude oil in May compared to a year ago, settling
at 16.76 million tonnes. This was due to plans by state-owned oil companies to slash output that
is weighed down by languishing oil prices, official data showed.
Time for a special post on rate of decay from peak oil? I am not liking what I am seeing because
it matches quite well my [bad] outlook. Perhaps there is hope that prices will increase to a level
that will reduce the rate of fall. It is going to be very difficult to recover production.
All the Chinese decline is not due to the price drop. China had peaked and would be in decline
even if the price had stayed high. The price drop just made it a bit worse.
"... Higher declines were observed for several of the major non-OPEC countries such as Russia, United States, Canada and Norway in 2014 and 2015. For 2016, the decline is expected to continue increasing and in terms of barrels, this represents a 700 kbbl/d increase in the yearly decline from the mature oil fields. ..."
"... The 2016 report will be more interesting but it might not be issued and/or available for free for some time. For oil they give 168 Gb reserves and 12 Gb production – without any discovery, extension or purchase that would give 7.5% natural decline. ..."
Rystad Energy's latest analysis shows that, for the first time since the 1980s, we will have
two consecutive years of decreased global E&P investments. A lot of the investment cuts have been
related to new projects and shale drilling, but we have also observed lower activity on mature
producing fields. This decreased activity is starting to show on the production side, with the
decline rates starting to increase. Higher declines were observed for several of the major
non-OPEC countries such as Russia, United States, Canada and Norway in 2014 and 2015. For 2016,
the decline is expected to continue increasing and in terms of barrels, this represents a 700
kbbl/d increase in the yearly decline from the mature oil fields.
The 2016 report will be more interesting but it might not be issued and/or available for
free for some time. For oil they give 168 Gb reserves and 12 Gb production – without any discovery,
extension or purchase that would give 7.5% natural decline. I think that might be what's
coming in 2018 at current discovery and development levels (only covering 35% of production though,
NOCs should still be holding up better overall).
"... Imports are definitely rising. The three month NET imports of crude oil and petroleum products bottomed out last November at 4,661,000 barrels per day and last week stood at 5,890,000 bpd for an increase of 1,229,000 bpd. ..."
"... The fact that imports are rising even faster than production is declining is a sure sign that production is actually falling and not just an anomaly of the EIA's measuring algorithm. This decline is real people. ..."
Imports are definitely rising. The three month NET imports of crude oil and petroleum products
bottomed out last November at 4,661,000 barrels per day and last week stood at 5,890,000 bpd for
an increase of 1,229,000 bpd.
The fact that imports are rising even faster than production is declining is a sure sign that
production is actually falling and not just an anomaly of the EIA's measuring algorithm. This
decline is real people.
"... I've always believed the high reported IP's were used to wow investors and possible goose the EURs. As has been commented on many times here by others, the bill eventually comes due. Here one take on the increasing declines seen in the Bakken: ..."
"... But Petrologica's analysts believed that the supply picture could be more dismal than initial state data led many to believe. By using new technology and a variety of innovative drilling and completion techniques, these analysts said, North Dakota producers may have been boosting near term production to the detriment of long term supply. ..."
"... Petrologica analysts believe their theory proved true last week when the North Dakota's Department of Mineral Resources announced that just over 1.04 million b/d of oil was produced in North Dakota in April, a drop of more than 70,400 b/d from March, the largest supply drop in state history. ..."
John Keller
says:
06/28/2016 at 4:48 pm
I've always believed the high reported IP's were used to wow investors and
possible goose the EURs. As has been commented on many times here by others,
the bill eventually comes due. Here one take on the increasing declines seen in
the Bakken:
But Petrologica's analysts believed that the supply picture could
be more dismal than initial state data led many to believe. By using new
technology and a variety of innovative drilling and completion techniques,
these analysts said, North Dakota producers may have been boosting near term
production to the detriment of long term supply.
"On the one hand, forcing a high [initial production rate] by, for example,
using more proppant may be a risk/reward play-when done correctly it leads to
gains in the first year, but risks clogging the fractures made during the
fracking process that allow the oil to flow," Petrologica wrote in a note in
October. "On the other, increasing IP merely front-loads production at the
expense of later output."
Petrologica analysts believe their theory proved true last week when the
North Dakota's Department of Mineral Resources announced that just over 1.04
million b/d of oil was produced in North Dakota in April, a drop of more than
70,400 b/d from March, the largest supply drop in state history.
Unconventional wonders of raising Capital for Unconventional s.
"Faulkner, Breitling's founder and chief executive officer, and other executives told investors
their money would be used to drill oil wells, but instead spent it on cars, jewelry and gentleman's
clubs, according to the SEC. The regulator suspended trading in Breitling's shares."
Anyone read Faulkner book " T h e F r a c k i n g T r u t h " ?
"... Looking at the drop in iranian export of 20% you would have to assume that the story is similar….which makes their approach/policy even more idiotic ..."
"... Ron, the Monthly energy review also gave an estimate for May natural gas plant liquids of 3,256,000 bpd. A decline of 258,000 bpd (7.3%) from April's estimate of 3,514,000 bpd. So, thats a decline of 406,000 bpd crude and ngpl. ..."
"... It is starting to look worrisome. US has lost almost 1 mbpd from peak and almost 0.5 mbpd in the last 5 months. It is looking as if US loses might constitute the bulk of the world oil production loses in 2016. ..."
The EIA's Monthly
Energy Review is out with US production numbers for May 2016. US production down 148,000 barrels
per day. US Lower 48 down 161,000 bpd, Alaska up 13,000 bpd.
Ron, the Monthly energy review also gave an estimate for May natural gas plant liquids of
3,256,000 bpd. A decline of 258,000 bpd (7.3%) from April's estimate of 3,514,000 bpd. So, thats
a decline of 406,000 bpd crude and ngpl.
Even if it is an estimate, thats a huge decline.
It is starting to look worrisome. US has lost almost 1 mbpd from peak and almost 0.5 mbpd
in the last 5 months. It is looking as if US loses might constitute the bulk of the world oil
production loses in 2016.
"... The June trailing 12-month (TTM) U.S. high yield bond default rate is closing inon 5%, reaching 4.7% after another $3 billion of defaults thus far this month, The $46.4 billion of recorded defaults this year is just $2 billion less than the total for the entire 2015. ..."
"... Through mid-June, energy and metals/mining accounted for 84% of defaults ($38.9 billion). The May energy TTM rate stood at 14.6% following $12.7 billion of sector defaults last month while the E&P rate is at 28.6%. The average high yield bid levels are at 92.9, up from 91.1 last month and from 83.7 in February when crude oil prices were at their low point ..."
It should have been posted on the earlier post ,but now since this is up ,I am going to post it
here . This is for Denise (appreciate your work) who is far too optimistic . This is also for
shallow sands who does all those fantastic analysis on the shale guys . SS I hope you outlast
the punks , but frankly I am in Petro's camp "The music is playing but the party is over " . So
here goes, a copy paste job from Fitch :
Addendum: Fitch Blurb
We just noticed this small blurb from Fitch in our mail, summarizing the latest developments
in junk land:
U.S. HY Energy Defaults Tally $13 Billion in May; June TTM Default Rate Approaching 5%
The June trailing 12-month (TTM) U.S. high yield bond default rate is closing inon 5%,
reaching 4.7% after another $3 billion of defaults thus far this month, The $46.4 billion of recorded
defaults this year is just $2 billion less than the total for the entire 2015.
Through mid-June, energy and metals/mining accounted for 84% of defaults ($38.9 billion).
The May energy TTM rate stood at 14.6% following $12.7 billion of sector defaults last month while
the E&P rate is at 28.6%. The average high yield bid levels are at 92.9, up from 91.1 last month
and from 83.7 in February when crude oil prices were at their low point
"... What we will see over the next year is how fast and deep shale production will fall compared to conventional production. We will see in my opinion a new dimension. ..."
"... yep. I had a discussion with some investment bankers in London and it is unbelievable in what dream-dimensions they live (they still beleive the shale oil propaganda). I feel like we are digging ourselves a deeper and deeper hole. ..."
"... I really cannot understand this disconnect, assuming it is an honest disconnect. Clearly, just a cursory review of EPS for all US upstream companies for 2015 and 2016 should be able to clue these guys in? ..."
"... Further, it would seem the financial guys would have some knowledge of reserve based finance of E & P's and would see there is a problem when long term debt greatly exceeds 65% of PDP PV10 for practically every company in the space at $50 WTI and $2.60 HH. ..."
"... This stuff is not financial rocket science. So, therefore, I assume these guys either are modeling much, much higher commodity prices, or they have nefarious motives. ..."
"... Have you had the "pleasure" to deal with those guys before? They are neither qualified nor interested in doing the proper research (their eyes start to glaze over when I mention some of the discussions that go on here). ..."
"... I tend to stereotype most of those financial guys as cocaine-snorting party animals, which is probably unfair. ..."
"... They are a mix. I've consulted for a couple of them. They ask the wrong questions, don't listen very well, don't do nuances, are always in a rush. ..."
I am eagerly awaiting the official post, but from a first look oil production dropped slightly
as well (20 kbp/day when comparing initial may vs. june numbers) – obviously significant revisions
will take place, but initeresing to see that the decline has resumed after last months anomaly.
The World has seen many slowdowns, yet this one is particularly interesting regarding the role
of shale oil and gas. Economically shale has shown clearly weakness below USD 50 boe/barrel.
What we will see over the next year is how fast and deep shale production will fall compared
to conventional production. We will see in my opinion a new dimension.
yep. I had a discussion with some investment bankers in London and it is unbelievable in what
dream-dimensions they live (they still beleive the shale oil propaganda). I feel like we are digging
ourselves a deeper and deeper hole. And I am starting to wonder how we we can ever get out
of this
Why do you think the financial community is having such a difficult time figuring out shale
economics given access to production data, as well as detailed information in company 10K and
10Q?
I really cannot understand this disconnect, assuming it is an honest disconnect. Clearly,
just a cursory review of EPS for all US upstream companies for 2015 and 2016 should be able to
clue these guys in?
Further, it would seem the financial guys would have some knowledge of reserve based finance
of E & P's and would see there is a problem when long term debt greatly exceeds 65% of PDP PV10
for practically every company in the space at $50 WTI and $2.60 HH.
Finally, have none of these guys ever thought of just doing the simple payout calculations
that simple energy investors do (i.e. – what does payout look like in 36, 48 and/or 60 months?).
This stuff is not financial rocket science. So, therefore, I assume these guys either are
modeling much, much higher commodity prices, or they have nefarious motives.
Have you had the "pleasure" to deal with those guys before? They are neither qualified nor
interested in doing the proper research (their eyes start to glaze over when I mention some of
the discussions that go on here).
It is much easier for them to do the work based on the
companies presentation material (there are obviously some smart and good ones out there, I haven't
met them yet though).
I think it would be dangerous to overestimate those guys (i.e. think they have some deeper
knowledge, etc.)
They are a mix. I've consulted for a couple of them. They ask the wrong questions, don't listen
very well, don't do nuances, are always in a rush.
About 20 years ago I had a meeting with a senior type with a uk based investment fund. He wanted
to make a commitment to buy several hundred million $ in another company's shares, was pressing
us to announce a field development so he could convince his management to go ahead and make the
purchase. I explained we didn't think the field development was viable, but we were willing to
see what material he had available to show it could be done. He answered he had nothing, his company
simply allocated a fraction of their cash to high risk investment, and this deal was indeed risky.
So he had nothing to go on.
Eventually we withdrew from the acreage, they bought a chunk of the other company, lost their
shirts. I seem to remember that individual was eventually killed in Moscow trying to make deals
with an oligarch.
"... LTO development in rocks similar to the Bakken and Eagle Ford has a physical boundary, the recovery per well appears to be linked to fluid properties (the oil has to be low viscosity, a fairly high gas to oil ratio, and have above normal gradient pressure). The reservoir geometry has to allow drilling long horizontal wells, the zone can't be interbedded with water bearing sands, etc. ..."
"... When we screen reservoirs to account for these limits, add cost environment and economics, we see that outside the USA the prospective resources are slim. ..."
"... Where would these massive quantities of oil come from. There must be some huge hidden fields where nobody's looked! ..."
"... I'm still having trouble with the EIA estimate of 160 billion tons of US URR versus 32 billion tons produced to date. This would imply that US oil reserves are only 20% depleted after something like 150 years of intense extraction. Is this reasonable? ..."
The EIA doesnt know what its talking about. Rather than quoting the EIA you should try to look
up the prospective targets they include in their estimate, mention them, and then we can discuss
them individually.
LTO development in rocks similar to the Bakken and Eagle Ford has a physical boundary, the
recovery per well appears to be linked to fluid properties (the oil has to be low viscosity, a
fairly high gas to oil ratio, and have above normal gradient pressure). The reservoir geometry
has to allow drilling long horizontal wells, the zone can't be interbedded with water bearing
sands, etc.
When we screen reservoirs to account for these limits, add cost environment and economics,
we see that outside the USA the prospective resources are slim.
Test yourself with a simple exercise: why is LTO so anemic in Australia? It's a whole continent.
What about Canada? It has a very dynamic oil industry. Venezuela? It needs light oil desperately
to dilute the heavy oil. Mexico? Why can't it even develop Chicontepec? Colombia? It has a very
active oil industry…so what's wrong with them?
I can see viable developments in some high graded spots in Russia, Argentina, and a few other
locations. But the critical combination of properties just isn't that common.
The "oil" is C+C+NGL. Hubbert linearization results in an estimate of 2500 Gb (or 341 Gtoe)
of C+C less extra heavy (XH) oil. Jean Laherrrere estimates 500 Gb of XH oil so that's 2900 Gboe,
NGL URR will be about 400 Gboe, which brings the total to 3300 Gboe. Finally, there has been a
tendency for the HL method to underestimate URR (in 2005 the estimate was 2000 Gb) so I have added
300 Gb to account for this, bringing the total C+C+NGL URR to 3600 Gboe (or 490 Gtoe). Political
Economist's estimate for World C+C+NGL URR is about 500 Gtoe, fairly close to my "medium" scenario.
That does not mean Political Economist is correct, but Fernando thinks my medium scenario is
reasonable and he knows a thing or 2 about how oil is produced. I know far less than he does about
the practical ins and outs of the oil industry.
I'm still having trouble with the EIA estimate of 160 billion tons of US URR versus 32 billion
tons produced to date. This would imply that US oil reserves are only 20% depleted after something
like 150 years of intense extraction. Is this reasonable?
The US URR estimate is too high by about 100 Gtoe, but the rest of the World is too low by
about the same amount, the two errors cancel.
Political economist is interested in the World total
and that estimate is approximately correct. Remember that his estimate for "oil" includes NGL,
just like the BP production data.
The World C+C+NGL URR is expected to be about 500 Gtoe or about
3670 Gboe (assuming 7.33 boe per metric tonne of oil equivalent).
"... This new drop in oil price has to do with extreme financial instability and not with supply and demand. Everybody is pumping with full force regardless of price for various reasons. Price does not matter at this point. When Total went to buy Iranian oil it brought with them Airbus people to pay for the oil. ..."
"... you have to keep dancing even if you don't like the music. Look at the drop in US production in the last 1 year and that is still with 400-600 rigs running in the last year with all extra printed money (aka "new investors") being available to them. It's very bleak. ..."
"... At some point there can be shortages. That would be a game changer. Before that this is just kicking the can down the road. ..."
"... In a short term shortages will be avoided by removing credit to certain countries and certain segments of population in synchronized effort by major Central Banks so it will appear that there are no shortages. ..."
"... There is no shortage of oil in Greece but there is a shortage of credit. But if Greece wants independent policy they get threatened with a shutting down of their banking system. ..."
"... The Brexit marks the end of the ideological domination of this neoliberal economy. How long the disintegration process will last it is very hard to predict but it could be very short like in the case of Soviet system. ..."
Is there already a reaction in the oil countries, this should demotivate companies to pick
up drilling again, or creditors to hand out new billions to be buried in the rocks?
This new drop in oil price has to do with extreme financial instability and not with supply
and demand. Everybody is pumping with full force regardless of price for various reasons. Price
does not matter at this point. When Total went to buy Iranian oil it brought with them Airbus
people to pay for the oil.
NA producers are taking paper for oil because there is no other option and with negative interest
rates approaching it is a losing option even if the oil goes somehow to unimaginable price at
this point of $70-80. But if you stop drilling the game is over. So you have to keep dancing
even if you don't like the music. Look at the drop in US production in the last 1 year and that
is still with 400-600 rigs running in the last year with all extra printed money (aka "new investors")
being available to them. It's very bleak.
At some point there can be shortages. That would be a game changer. Before that this is
just kicking the can down the road.
Ves, 06/27/2016 at 10:14 pm
likbez,
In a short term shortages will be avoided by removing credit to certain countries and certain
segments of population in synchronized effort by major Central Banks so it will appear that there
are no shortages. That is why you see all the effort in creating big currency blocks that
could control emission of the currency. One of the reasons is to control oil consumption by the
center through credit emission. Then you depend on the center for credit emission.
There is no shortage of oil in Greece but there is a shortage of credit. But if Greece
wants independent policy they get threatened with a shutting down of their banking system.
So they are allocated certain amount of credit and that is their available oil foot print.
But it is the same in so called "rich" G7 countries where large segments of population live below
poverty line and that is because they don't have access to credit. That's why it was so easy to
pull Brexit stunt because elite already had very fertile ground to work with. Majority felt less
well off then 20 years ago. That is the main reason; all other reasons like EU bureaucracy, refugees
are just nonsense. Bureaucracy, refugees of course exist but these are just borrowed reasons that
they have been told to adopt on TV to frame the debate.
likbez, 06/28/2016 at 7:37 pm
Ves,
Allocation of credit works while there are growing economies. In this case this is a regular neoliberal
redistribution of wealth by other name. So countries with "exorbitant privilege" can just print
money while everyone else are the second class citizens who were robbed at daylight. Debt slaves
by other name.
But after conversion of most countries into debt slaves, in order for the system to work you need
positive GDP growth. Otherwise there is nothing to rob. Even if the GDP "growth" is fake and is
just an accounting trick based of underestimating of inflation or including in the total vices
like prostitution and gambling, the system can work. Get negative GDP for a substantial period
of time (secular negative growth) and all bets are off. Capitalism was not designed for such an
environment, and neoliberalism, which is just a modern flavor of corporatism, can't work either.
In shrinking economies allocation of the credit is like pushing on the string. You just can't
pay credit lines back in shrinking economies. That means financial collapse. Now what ?
Barter?
Ves, 06/28/2016 at 10:31 pm
" That means financial collapse.Now what ? Barter?"
Well, it looks to me we are watching collapse "LIVE". Look, the magnitude of Brexit is hardly
even understood or no-one seems comprehend the consequences. This is on the scale of fall of Berlin
wall in 1989 and shortly after the dissolution of the USSR in 1991.
The Brexit marks the end of the ideological domination of this neoliberal economy. How
long the disintegration process will last it is very hard to predict but it could be very short
like in the case of Soviet system.
Brexit is more response and break with Wall Street then EU in order to save what can be saved
and that is mainly finance of the City of London for probable Yuan trade in near future. So this
pretty much tells you where this is all going in terms of global trade.
In terms of debt that is straightforward "Debt that cannot be paid will not be paid".
In terms of trade it will be much smaller world for trade then in the past and with new sets
of rules.
I don't think it will be barter but it will start with clean slate and with a new currency
in the indebted countries.
"... Shallow, when analyzing the economics of a well, or field, or entire "play," of course it matters
how oil and or natural gas production is reported. You are 100 % correct for being perturbed by this
SCOOP/STACK stuff. Reporting a well whose revenue stream is 75-80% gas, as oil or liquids, by gas to
oil "equivalents" is absurd. ..."
"... That stuff up there is no different that any other unconventional resource play. It declines
like an anchor being dropped from VLCC in the open ocean and is hugely unprofitable. ..."
"... The key strategy for long term survival has been and will be, during boom times set money aside:
during frenzy's, go to the beach: during bust allocate reserved capital for future growth. ..."
"... What on earth does the BTU content of gas have to do with reporting gas as though it were oil?
This makes no sense to me whatsoever. ..."
"... Personally, if I believed we would be in a $2.50mm/btu and $60/BBoil environment for the foreseeable
future, I would not be drilling anywhere. ..."
"... I believe that to keep production steady we need at least $4mm/btu and $70Bo, may be even higher.
..."
Shallow, when analyzing the economics of a well, or field, or entire "play," of course it
matters how oil and or natural gas production is reported. You are 100 % correct for being perturbed
by this SCOOP/STACK stuff. Reporting a well whose revenue stream is 75-80% gas, as oil or liquids,
by gas to oil "equivalents" is absurd. It is a distortion of the facts and meant to be misleading.
Until three years ago even the most prominent of distorters would report BOE as a percentage of
liquids, now most of them have quit doing that. Wonder why? For one reason, to get 1.2 MBOE EUR's -- For another reason, 58 degree condensate prices take a big negative hit to actual oil prices.
I don't know what the price of natgas is in OK. If it's like Texas, it sucks. Its discounted
value at the moment is less than zilch. If at $ 1.50 net per MCF (and I am being very liberal)
the gas to oil conversion should be 25-30:1, NOT 6:1. Therefore the notion that this OK stuff
has some secret oil leg that has yet to be developed, awaiting higher oil prices, is a little
wonky.
With regard to RI and ORRI, I can sometimes be guilty of irrational exuberance myself. Then
the operator in me takes over and reality sets in. That stuff up there is no different that
any other unconventional resource play. It declines like an anchor being dropped from VLCC in
the open ocean and is hugely unprofitable.
Mike,
goodness, I have been drilling wells with my own money for over 30 years. We made money in each
of the last 3 quarters on our mix of properties across several states and our mix of product and
our mix of interest, ORRI, WI,RI . I know first hand about some of the production in scoop. You
may not be open to the facts and that is fine, leaves more room for those with opens mind to exploit.
NO skin off my nose. By the way the Btu content of scoop gas is 135o. This is not investment advice
but you have a couple of contributors to this blog that have been right with regard to the market
fundamentals and exploiting the unrealistically low prices we have seen of late.
They have made money, just satin one last quick point, based on interest in a couple of dozen
wells in scoop, I can say at $4nat gas and $80oil, the roi will be as good or better, risk weighted,
than most anything I have participated in, over the entirety of my career. I am not all wells
in scoop, but in the core areas.
All our production in onshore US, its the mix of assets. My only point SS is I do know how to
run a business and economically evaluate an oil prospect. That is what keeps me between the lines
so to speak, I can't constantly be wrong like climate change scientist and still make a living
:-). The key strategy for long term survival has been and will be, during boom times set money
aside: during frenzy's, go to the beach: during bust allocate reserved capital for future growth.
What on earth does the BTU content of gas have to do with reporting gas as though it were
oil? This makes no sense to me whatsoever. I am very open to facts, I deal with them every
day. Production data does not lie. It takes time to sort the BS out but ultimately it can be done,
as Shallow has proven. Tell your SCOOP/STACK boys to quit the BOE BS and start being transparent.
Here is what is going on in the SCOOP, because the same thing is happening in the PB: The word
is out on the Bakken, Eagle Ford and Niobrara. UR is not going to fall in line with the EUR bunk
and the economics are bleak. Money is getting scarce. So now everyone is running to new territory
where there is little data to support the same old shale oil propaganda machine. Accordingly,
some shale oil companies are getting good mileage out of being the first in the new subdivision
and even raising some more money, believe it or not. Lenders, for the most part, have ADD. Lets
talk in three years when there is more data. That stuff will suck just as bad as any other shale
play, betcha.
you ask about the price of gas in okla. I gave you the information to help determine what the
price was/is
we do not have WI in the Bakken, hayneseville, Barnett or Eagle ford. We do have WI in scoop,
we do have RI in a number of those plays. All shale is not created equal, as an oil man you should
know that.
As for betting, i do that every time I drill a well and I'll let the drill bit keep score :-)
texas tea: Can you educate me a bit about the Scoop Play. I haven't worked the area much since
my Gulf Oil days working Hunton in the area. In your opinion, how many months would bring payout
(at $2.50mm/BTU, and $60/BB oil, 75% NRI lease, to a WI owner in the top 20% of wells.
It is really to big of question because of the number of variables. What I can say is that
in the gas/condensate window, with the parameters you mentioned, most wells will provide a real
rate of return based on the wells we have interests in. Personally, if I believed we would
be in a $2.50mm/btu and $60/BBoil environment for the foreseeable future, I would not be drilling
anywhere.
I believe that to keep production steady we need at least $4mm/btu and $70Bo, may be even
higher. I can add for SS that i have the updated production on the Good martin unit oil window
Woodford Scoop (46 API) the production across the 8 wells in the unit over the last 4 months,
and if the number are correct they are not impressive. As say said, i do not draw conclusion until
i have all facts.
Mike: Glad to see you still fighting the good fight of putting some real world oilfield sense
in the discussions.
Question: 1.
We in US have we are told we have a huge stockpile hangover. If the oil in pipelines is counted
as storage, how many long huge cross country pipelines have been built during the boom through
your area? We have one through us that goes from west Texas through central to Houston. If those
pipe volumes are counted as storage, they will probably never be drawn down after the initial
volume is added.
2. Do you believe that the promoters of LTO will have money shoved to them fast enough to bring
about another price collapse as the market seems to believe.?
Hope you are finding some good purchases to take some pain out of this downturn.
Hi, Doodle; I hope this finds you well. I can make money at 45 dollars but I still get a burr
under my saddle over the shale oil industry's bullshit. Which seems to be getting worse.
Question 1 is a good point, sir. I side with our old friend Jeffrey Brown on this issue of
supply overhang and the quality of the oil in storage and not in very good favor with end users.
When Mexico stops being a net exporter, and Venezuela implodes, LTO is going to take some big
price whacks simply because there won't be anything left to blend it with. I look for it to take
a long time for Cushing to drain. I produce a lot of low gravity sweet stuff and its getting a
premium price now for the first time in four years.
Question 2: LTO reserve inventory is not being replaced and the discounted value of those PDP
reserves is dropping like a rock. Some companies are now in a bind with the SEC over EUR's and
the IRS is bearing down on PUD reserves. The bottom line is the debt to asset ratios of all but
2 to 3 public shale oil companies is abysmal and new OCC regulations imply most of those guys
can't legally borrow more money; they have 2-3 mortgages on their homes already, and their MasterCards
are maxed out. The shale oil industry is dead in the water if it cannot borrow more money and
that gets harder every day, IMO. I think the shale boom is over, thankfully, and we should not
worry too much about another 70% price collapse, no.
Thanks man: We're shaking off the dust and starting to "think" of getting busy again.There's still
good oil out there under the right rock and we are determined to find it! We had a good little
discovery that has pulled us through this Depression, though it was a shame to give the oil away
to hold on.
Shallow,
I think at this point it does not matter if they are oil or gas fields or how the fields are classified.
With Fed announcing that would not have legal problem pursuing negative rates it is completely
clear that main goal is to keep broke debtors alive and prevent the gigantic debt bubble from
imploding. With negative rates being essentially tax on the savings Fed is basically saying to
investors to keep sinking money in anything that resemblance of hard assets in some distant hope
that prices will recover before they run out of oil or gas. Good luck with that in the case of
high depleting shale. So with negative rates boxes of brass fixtures could be more attractive
than cash tomorrow. Markets are broken.
"... It is also interesting to see how year over year % declines are leading the actual production data and indicate that the drop will march on much further. Even if drilling resumes, natgas production will not rise before year end due to the drilling time lag. ..."
Texas RRC data for April 2016 are out. As others will probably elaborate more on the data, I cannot
resist to show the interesting situation of Texan natgas production (see below chart), which is
in a stage of freefall and in complete contradiction to above scenarios for US natgas production.
It is also interesting to see how year over year % declines are leading the actual production
data and indicate that the drop will march on much further. Even if drilling resumes, natgas production
will not rise before year end due to the drilling time lag.
In the meantime, natgas prices continue to soar, smashing through USD 2.70. A heat wave in
the SouthWest helps as power burn will reach very likely 5.5 bcf/d over the next few days. Natgas
consumption soars despite – and in my view because of – high solar capacity in California. The
high solar capacity does not reduce natgas demand yet drives it to record highs.
Rebounding after a two-year collapse, it's only this month that oil prices have pushed up past
$50 a barrel, but Raymond James & Associates says this is just the beginning for higher prices.
In a note to clients, analysts led by J. Marshall Adkins say West Texas Intermediate will average
$80 per barrel by the end of next year - that's higher than all but one of the 31 analysts surveyed
by Bloomberg.
"Over the past few months, we've gained even more confidence that tightening global oil supply/demand
dynamics will support a much higher level of oil prices in 2017. We continue to
believe that 2017 WTI oil prices will average about $30/barrel higher than current futures strip
prices would indicate."
The team went on to lay out three reasons for their bullish call, all of which are tied to global
supply - the primary factor that precipitated crude's massive decline.
Here's how the rebalancing of the global oil market will be expedited from the supply side, according
to the analysts:
First, the analysts see production outside the US being curbed by more than they had previously
anticipated, which constitutes 400,000 fewer barrels of oil per day being produced in 2017 relative
to their January estimate. In particular, they cite organic declines in China, Columbia, Angola,
and Mexico as prompting this downward revision. "When oil drilling activity collapses, oil supply goes down too!," writes Raymond James. "Amazing,
huh?"
Adkins and his fellow analysts also note that the
unusually large slew of unplanned supply outages
will, in some cases, persist throughout 2017,
taking a further 300,000 barrels per day out of global supply.
Finally, U.S. shale producers
won't be able to get their DUCs in a row
to respond to higher prices by ramping up output, the
team reasons, citing bottlenecks that include a limited available pool of labor and equipment.
Combine this supply curtailment with firmer than expected global demand tied to gasoline consumption,
and Adkins has a recipe for $80 crude in relatively short order.
"These newer oil supply/demand estimates are meaningfully more bullish than at the beginning
of the year. Our previous price forecast was considerably more bullish than current
Street consensus, and our new forecast is even more so."
The only analyst with a higher price forecast for 2017, among those surveyed by Bloomberg, is
Incrementum AG Partner Ronald Stoeferle. He sees West Texas Intermediate at $82 per barrel next year.
The consensus estimate is for this grade of crude to average $54 per barrel in 2017.
Over the long haul, however, Raymond James' team sees WTI prices moderating to about $70 per barrel.
"... You and SS (and others) have quite the inaccurate idea about shale company financing and the role of oil price on that. This type of linear/classical thinking (i.e.: "…price rose, so the banks must lent to the drillers now…") does not represent the reality today when loans to the drillers are used as futures' derivatives' bets and far, far, far exceed the ability of some of these companies to pay back their debt even if oil was to be $1.000/brl for the next 20 years. ..."
"... Much higher oil prices would give the shale folks the ABILITY to pay debt. Question is, wouldn't they drill more wells instead, and roll over the debt? So, what would happen if US, Europe and Japan just coordinated .25 rate hikes each quarter for the next three years? Would that result in a catastrophe? Rune Likvern , 06/16/2016 at 10:07 pm Shallow, What most oil companies [other companies/entities as well] did as they assumed more debt was in reality to enter into a bet that consumers would be able to access more credit/go deeper into debt to enable the oil companies to retire their debts which was assumed to pay for development of costlier oil. [Rollovers are not retirement.] ..."
"... Debt is borrowing from the future. ..."
"... "Some describes this process as transforming wealth into income." Or perhaps it's just transforming billionaires into trillionaires and leaving the rest where they are (or worse). ..."
"... If oil went to $100 WTI, and stayed there for 5 years, and gas went to $6 per mcf, and stayed there for five years, and if the shale companies determined to only spend enough CAPEX to maintain flat production, I think they could generally pay off, or at least substantially pay down debt, in that 5 year period. Some are better off than others. ..."
you get entangled so much in numbers, data and lines that you miss and/or
confuse the logical big picture.
-Before we enter price/brl/oil and financing of drillers into the equation
and, well before we then discuss if your's or somebodyelse's (i.e.: virwimp's)
are the more plausible scenarios and more likely to materialize, we have
to see if your chart stands logically and mathematically.
And looking at it, that can be only if the following conditions are met:
The "sweet spot/s" of Bakken has not yet been found and it will
be in 2019-2020.
The "i-gadgets" of fracking technology have gotten so advanced by
2019-2020 that we can expects wells then to have 30-50-70% more output/day
than the comparable well of 2014-2015 (% are for illustration only,
I have not crunched the numbers to be precise).
Judging by that almost plateau-ish curb top you have on your production
line 2020-2025, the decline rates of wells in 2020-2025 are far, far.
far less than those of comparable wells of 2014-2015.
All of the above
Now, can you (or anyone who knows a thing, or two about oil and mathematics
for that matter) explain and defend the above scenario logically and scientifically?
Don't you see to much magic and wishful thinking?
If you can do that (explain logically and scientifically), then and only
then I will engage in the price/financing debate with you and after that,
in the one that discusses which is the most plausible to represent reality
10-20-30 years in the future.
Be well,
Petro
P.S.: You and SS (and others) have quite the inaccurate idea about
shale company financing and the role of oil price on that.
This type of linear/classical thinking (i.e.: "…price rose, so the banks
must lent to the drillers now…") does not represent the reality today when
loans to the drillers are used as futures' derivatives' bets and far, far,
far exceed the ability of some of these companies to pay back their debt
even if oil was to be $1.000/brl for the next 20 years.
But that is a very complex matter which you (and I am not being offensive
here…believe me!) and almost all here cannot understand easily, so I will
leave that for another day.
Much higher oil prices would give the shale folks the ABILITY to pay
debt. Question is, wouldn't they drill more wells instead, and roll over
the debt?
So, what would happen if US, Europe and Japan just coordinated .25
rate hikes each quarter for the next three years?
What most oil companies [other companies/entities as well] did as
they assumed more debt was in reality to enter into a bet that consumers
would be able to access more credit/go deeper into debt to enable the oil
companies to retire their debts which was assumed to pay for development
of costlier oil. [Rollovers are not retirement.]
Central banks lowering the interest rate [described as interest suppression
by many] served several purposes like easing services of existing debt overhang
and allow for further debt expansion in an effort to bring our economies
back on the [economic] growth trajectory.
Debt is borrowing from the future.
Increasing the interest rate as described by a quarter percent over 3
years would introduce severe strain on the system as it becomes harder to
service the present huge debt overhang and make it hard for anyone to assume
more debt [it would likely blow out many balance sheets].
The Fed now keeps deferring further increases to the feds funds rate.
The Fed is worried about what an increase could entail.
In short a higher interest rate would bring the oil price down as more income
becomes diverted to servicing debts and thus less available to pay for amongst
other things higher priced oil.
First you described the interest rate with raising it a quarter percent
each quarter over 3 years. (Something became omitted in my reply, but it
looks like the objective of the discussion was sustained.)
What you describe about those who live on income from their own savings
or pension funds I agree with, lower interest rates now wreaks havoc with
many pension plans and also the insurance industry.
I also agree that ultra low rates have caused misallocation of capital.
Yield starved investors started chasing riskier projects/investments.
To me this illustrates that there is no easy fix to the interest dilemma.
Damned if interest rates are raised and damned if they are not.
Low rates have led to capital destruction, I agree.
Some describes this process as transforming wealth into income.
"Some describes this process as transforming wealth into income." Or
perhaps it's just transforming billionaires into trillionaires and leaving
the rest where they are (or worse).
"Much higher oil prices would give the shale folks the ABILITY to pay debt."
-NO.
Debt is at unsustainable levels. You seem to have missed the P.S. section
of the comment of mine you replied to. I suggest you revisit it.
"Question is, wouldn't they drill more wells instead, and roll over the
debt?"
-That is NOT the question. That is the ONLY thing they can do with higher
oil prices at this point.
"So, what would happen if US, Europe and Japan just coordinated .25 rate
hikes each quarter for the next three years?
Would that result in a catastrophe?"
Folks who say: "ahh, what's a .25% increase to our economy? Nothing…let
the FED do that…" know nothing about the economy and finance. Do not waste
your time listening to them.
As I said this is a very complex matter, but for now let me tell you that
the economy and finance work NOT on nominal rates (the famous FED rate,
or BOJ rate or ECB rate you hear about on TV and how they manipulate it…ha,
ha, ha…), but on REAL interest rates …which are totally a different beast.
If the FED, BOJ and ECB did what you suggest and in a coordinated matter
increased the nominal rate .25% every quarter we would literally plunge
into the dark ages in short, very short order!!!!
Who tells you otherwise is an idiot.
Forget about the "PONZI FIAT money scheme" and the "FED MANIPULATION" you
hear from obviously "experts" on the matter here and elsewhere….
FED, BOJ and ECB have NO choice but to lower the rates and print digits/money.
Again, I cannot stress this enough:
who tells you otherwise, and who tells you that (at this point in time)
we can go to a gold standard, or some kind responsible debt reduction economy
knows nothing of today's economy and finance and is an idiot.
And NO, this has nothing to do with some kind of Marxist redistribution
of wealth.
Even if we somehow did that, we would still be in the same place in the
near future.
It is human nature and the behavior of our inner human animal.
That is why a while back – when everybody was saying that FED is increasing
rates and rates will go up – I told you: " 10year note is going to 1% BEFORE
going to 3% like everybody says…."
….and perhaps is going to 0% soon.
Expect no more rate increases and going back to QE (with other names perhaps)
– NOT because the FED is evil (as you hear here all the time) but because
there is NO other choice!
Rates shall spike up in the future, but when they do is time to go underground
with our loved ones, a loaf of bread, a gun and pray….if you believe that
is'
Pay, pray, pray that Yellen, Kuroda and Draghi go each month on TV and
bullshit us some more, for if they do not …..well let's just say that we
will not have computers to reply to each other anymore…..
"Rates shall spike up in the future, but when they do is time to go underground
with our loved ones, a loaf of bread, a gun and pray….if you believe that
is'"
Petro ….'a' gun come now. all things being equal i think I will have
a couple of semi auto, as well as revolvers, pump action and double barrels.
Ironic so many here can make a reasoned case for civil breakdown and at
the same time want to restrict guns of law abiding citizens. I suspect your
analysis posted here is more realistic than many others, the timing issue
is the real question. Next up more QE and then helicopter money!
If oil went to $100 WTI, and stayed there for 5 years, and gas went
to $6 per mcf, and stayed there for five years, and if the shale companies
determined to only spend enough CAPEX to maintain flat production, I think
they could generally pay off, or at least substantially pay down debt, in
that 5 year period. Some are better off than others.
I suspect costs would rise, both LOE and CAPEX, but I will do an example.
Shale R Us has 200,000 BOE per day, 80% oil 20% gas. So, lets say after
well head discounts, they get $85 per BOE. LOE is $8. G & A is $3. They
have to spend $20 per BOE in CAPEX to keep production at 200,000 BOE per
day ($1.46 billion per year). Severance tax is 10%. They have $3 billion
of debt, interest rate is 6%.
By my calculations, over five years, Shale R Us generates $16.6075 billion
of pre-tax and pre-interest cash flow in this scenario. There is $900 million
of interest that has to be paid, plus the $3 billion of principal. Assuming
income tax of 35%, subtract about $5.5 billion for income tax.
I come up with Shale R Us having $7.2 billion left in this scenario,
at the end of five years after payment of income tax, principal and interest.
I did this quickly, so if there are computational errors, let me know
and I will correct them.
Now, my example is of a strong company. Most wont work out that well,
but they can pay the debt off at $100 WTI plus $6 gas.
Petro, you are either talking over my head and/or we are talking past
each other. I am not considering what those prices do to the world economy,
demand, etc., only whether Shale R Us can eliminate their debt.
Sorry if I am too dense to follow how $1,000 oil for 20 years would not
cause all the LTO companies to mint money. Again, not talking about the
economy, etc. Just doing math, really.
you are falling in the same trap as Dennis: getting entangled in too
much data.
Yes indeed, as you say, I am talking way above your head here.
Now before you hate me, trust me I mean no disrespect.
But the subject is such….so please stay with me.
What you are asking me is another difficult and long answer.
I either have to do that post I mentioned about debt and money, or stop
answering and replying.
First of, you have the wrong idea as to how the financing of shale drillers
happens.
The way you think it happens (i.e.: they go to bank, present their business
model and oil price expectations and blah, blah , blah and bingo….Goldman
gives them the money!) does not exist anymore.
It indeed happened that way (more or less, of course I am simplifying) PRIOR
to 2000 – not today.
Goldman (or any bank…put the name you like here) uses the oil price and
business model of the sale player ONLY to bullshit the shareholders into
voting it…..it does not give a crap what the company does and how it does
it and at what price.
Here where the "beauty" starts:
that loan then, which on bank's balance sheet is considered an asset, is
re-hypothecated dozens, upon dozens, upon dozens of times as a futures'
OTC derivatives' bet with businesses that have nothing to do with shale
players and are half a world away – china let's say.
So, if one too many of them fail, driven out of business by responsible
guys like you – even though their combined debt size is nothing compared
to….oh, lets say JP Morgans' assets, the avalanche it starts buries us all.
You are thinking in terms of only one good company – that my friend is
linear/classical thinking.
Is like this: the risk increased by 2 times so the outcome shall be 2 times
worse or maybe 4.
That to you (and most) is manageable if you tighten your belt and plan well.
-But our economy and our energy/finance system is a COMPLEX INTERCONNECTED
SYSTEM.
That means that small stimuli, bring about exponentially worse and uncontrollable
outcomes.
Its like Lehman Bros. in 2008.
Their assets and liabilities were nothing compared to the whole economy…..but
the cascade they would have started would have plunged the entire global
finance/economy into dark ages within hours…literally.
So, contrary to what you have learned by "experts" here that: "…the Evil
FED helped their crony bodies and destroyed the economy…ha, ha , ha…", if
the 1st QE aka TARP did not happened, we literally would have eaten each
other as food by now (walking dead type thing….ish).
DEBT cannot be eliminated.
It has to increase more and more if you would like to continue the life
you have.
If we eliminate debt, we eliminate money including that $100 that you like
to get per barrel of your own oil…………it cannot be!
Stick that in your head.
Petro. I'd like to see a post from you. I doubt you'd get blasted, and if
you do, so what? If anything, I kind of enjoy debating this stuff with someone
on the other side.
Couple of questions.
First, you talk about shareholders approving loans. I am assuming you
just misspoke, as shareholders of banks do not approve of anything, except
voting on directors, some compensation issues, and sometimes stuff put on
proxy cards by activists (i.e. divest of fossil fuel loans LOL!)
Second, I did not think that reserve based energy loans were being packaged
and sold in derivative markets, at least not like home mortgages were. I
also was unaware banks were insuring them to a large extent with CDS's.
My understanding is there is a consortium of banks on most of these,
with one bank as lead, the others each taking a participating percentage.
The note is secured by a first lien on the shale company assets. The size
of the loan is based on the PV10 (or PV9) of the assets, with PDP valued
at 100% and with PDNP, PDBP and PUD possibly being given some collateral
value, but being greatly discounted, say for PUD, maybe assigned only 20-30%
of PV10.
The maximum amount that may be extended should be no more than 65% of
PV10 or PV9. If the value of the reserves drops, the borrowing base is cut.
Petro, you probably know all this stuff, maybe more in depth than me.
I'm posting this for other's benefit.
The game the shale guys played in 2010-2014 was to fill up the first
lien bank line, then float an unsecured bond to pay it off. Most shale guys
did this several times. I assume it is on these unsecured bonds, where credit
default swaps (insurance) was likely sold, where you think there will be
a black swan event? My understanding is this junk is a small fraction of
what the mortgage derivative market was and still is. Many of these bonds
have defaulted, or are at extreme stress levels already.
Would seem to me, given oil cratered to the $20s in early 2016, we would
have seen signs of the black swan, maybe we did, as the markets fell, almost
perfect correlation with oil, which has now, somewhat broken.
However, if we take my hypothetical $100 WTI and $6 HH per mcf, how do
those CDS on shale bonds cause any problems?
Also, back to the horse and pony show with regard to bank loans, I am
not so sure how much puffery there has been. It really depends on how the
engineering firm did the reserve report, and if the bank's price deck utilized
was realistic.
I will say, unlike the mortgage meltdown, where there were fraudulent
appraisals all over the place, there are not a lot of petroleum engineering
firms, and they are not fly by night outfits.
I will also say, it seems to me energy lending is pretty specialized,
there weren't energy loan brokers setting up shop on every street corner
and advertising on late night cable TV. Mostly big banks, or large regionals,
in this market.
Finally, these loans are not of the $150K mortgage variety. When the
bank examiners come, they look into the big loans much more closely. Easier
for OCC to examine 10 billion $ worth of 10 reserve backed energy loans
than $10 billion $ of home mortgages, of which there would be 50-100K individual
loan files, appraisals, etc.
Where the OCC screwed up was by not figuring in the junior debt when
they examined the bank loans. But, they finally are now, and that is a big
deal IMO.
The way I see it, if WTI hits $100 2017-2021, and gas is $6 during the
same time, and the shale knuckleheads have learned something from the most
recent Arab OPEC "good sweating" and don't overdo it, they mostly pay down
substantially/payoff debt.
I'm talking Newfield, QEP, OXY, PXD, EGN, EOG, COP, MRO, WPX, SM, HES,
APA, APC, XEC, FANG, MTDR, DVN and a few others. CLR and WLL would pay down,
but not off. Same with OAS. CHK too. The few MLP that have survived thus
far, would also at least pay down, but think they are required to distribute
most cash flow.
Oil at $125 for five years, they about all get out of debt IMO.
And, in the event this happens, these guys would be well advised to just
issue equity to grow, going forward. Where price wont help them is when
the locations run out. Especially the good ones. Better to have little to
no debt when that happens, which is probably by 2021, even if these dudes
are more sane about development.
Keep in mind, in my example, the pre-tax, pre-interest profit margin
is $45.5 per BOE. Right now, and pretty much since Thanksgiving, 2014 unhedged
profit margin has been less than zero.
I agree, the world economy is screwed up. But, I think I am going to
need some more detail to figure out what you are saying. I also do not think
TARP was bad. Clueless described TARP very well recently.
Don't worry about offending me, I'm called a lot of stuff and don't care.
Know who I am pretty well. Would really like a post, but understand if you
don't. Its kind of daunting.
I am just going to touch a couple of points only.
First, as far as offending you:
yeah, you might have been called names and have a thick skin, but I do not
want to go that route to begin with.
Not because you don't care, but because I do not offend people…intentionally
that is.
So, I said that to warn you that if it comes out that way, it is not my
intention.
Second, I did not misspeak.
I already spent too much time comenting and I went short, obviously way
short.
I meant they'd have it on the books in order in case something happened,
or somebody inquired, or to present their "strategy" at their shareholders
or their newsletters for investors (i.e.: Goldmans' outlook on the oil market….and
BS like that)
Most of the big guys repackaged and resold those loand to greater fools
way, way before oil price rout started.
They own very little directly……
However – and this is the important part – they are affected by them indirectly
by other companies derivatives which have direct exposure to the loans presently.
Think of it as: you fire a gun at a target in front of you, but it makes
10 ricochets at the walls and trees and what not around and comes back and
kills you.
Third, as the result of the repeal of Glass_Stegal in 1999 – thank you
very much R. Rubin, L. Summers and most importantly our dear B.Clinton who
signed it into law
(don't fuss democrats. For me there is NO difference between republicrats
and democlicans. Reagan and Bush were as bad, or worse!) – commercial and
investment banking became one and all and turned to what's called TRANSACTIONAL
banking.
Meaning: everything, without exception is repackaged and resold multiple
times to grater fools.
Forth, the task of a post is not daunting!
heck, I have posted here in the last 2-3 years to last me for 3 posts.
It is first that, even knowledgeable, well meaning people have preset concepts
that they are not willing to change.
I mean, look at the amount of time I am spending replying to you and you
ask me the same things…..does "linear/classical" thinking ring a bell?
You wrote it yourself: "Hard to change long held views".
and second, some people act as experts in things they know nothing about….and
they are going to reply to me with stupid: "evil FED" , "Real Gold Money
vs. Fiat" and " Rockefeller- Rothchild cospiracy" bull shit…………………………………….
and I am not sure I can handle that politely…………………..
…and then you have Nik Gs and the rest who think that oil and energy are
just like any other commodity and we somehow can do without them and so
on and so on…..
You get my point….
" repeal of Glass_Stegal in 1999 – thank you very much R. Rubin, L. Summers
and most importantly our dear B.Clinton who signed it into law
(don't fuss democrats. For me there is NO difference between republicrats
and democlicans."
Petro, you are one heap big smart fella, or else I am a mental midget.
I just can't see any way you are wrong.
The key problem with our current two party political set up is that both
parties were long ago captured by Wall Street type interests.
Political reform on the grand scale would help immensely, but political
reform is not enough to solve the overshoot problem.
Also, I should point out my banking experience is with a small, local
bank, privately traded shares, less than 500 shareholders. The stock price
barely moves, however it has slowly ground upward over time. Has always
paid a dividend which has been 4-5% of share price.
The bank makes fixed rate mortgages, which it sells off to Fannie or
Freddie, but retains all servicing. It retains all other loans in house,
such as auto, Ag, small business, rental real estate. It has a few larger
customers where it has to participate with others, and occasional will participate
with other banks on loans the others originate.
The 2008 financial crisis did not affect it. No one sold their shares
anymore than usual, the stock price didn't drop.
The only real thing they do which was prohibited by Glass Stegal is they
have an in house stock broker, where customers hold brokerage accounts.
I don't see that as a problem, and that service ties in well with the primary
duty of being a trust officer.
The primary problem in the aftermath of 2008 is the banks cost of compliance
went up.
So, you can see, my background in this area is very foreign. I am coming
from a totally different view, so yours, or any other serious and on topic
views are appreciated. My views are very 1980s, I remember when a bank in
one town could not open a branch in the next town over.
I continue to be surprised that interest rates "have not risen on their
own".
Petro,
Thanks for your interesting contributions and viewpoints to this debate.
I believe we are headed for some non linear events and the thing is the
human brains are NOT evolved/trained to think in non linear terms. We tend
to extrapolate past experiences into the future with some noise around a
constructed [wished for] trend line.
Looking forward to your future elaborations on this subject.
"... As for damage, that will be the final proof of what has been happening. I will be watching Rune's graphs to see if the recent years start to drop below previous years totals. ..."
"... There was a great summary by somebody else a few posts back. The big issue is that you have condensate get into gasphase inside the reservoir. This in turn will result in more "stranded" oil. I fear we will only see the results later this year/2017. I would expect the production rates to drop of steeper than before and result in lower ultimate recoveries (but i know conventional plays much better). Maybe somebody with more knowledge can chime in? ..."
"... As for damaged wells. We will just have to wait for the data to come in. April's decreasing GOR has given me confidence in my original suspicions of over producing wells. Not sure how keen Shallow will be pumping dead oil from 10,000 ft TVD and 20,000 ft MD. At least there will be plenty of wells to experiment with, until you can make it work! ..."
"... Although it intrigues me, don't worry, we will leave the deep stuff to someone else. Low volume wells that produce little to no water can work even in a low price environment. ..."
"... Besides the costs in the event of a down hole failure being down right frightening, it has not been determined where these wells will settle out in years 10-30+ ..."
I believe you are in the patch? Do you have any on the ground experience
you can relate? As for damage, that will be the final proof of what
has been happening. I will be watching Rune's graphs to see if the recent
years start to drop below previous years totals.
There was a great summary by somebody else a few posts back. The big
issue is that you have condensate get into gasphase inside the reservoir.
This in turn will result in more "stranded" oil. I fear we will only see
the results later this year/2017. I would expect the production rates to
drop of steeper than before and result in lower ultimate recoveries (but
i know conventional plays much better). Maybe somebody with more knowledge
can chime in?
You raised an interesting point. Everybody that bothers to write on these
blogs, that have any hands on experience, all seem to be from the conventional
oil field. Either the shale players, are not interested, or are keeping
a big secret. Smiles.
I would really love to hear some real inside info. I am sure a lot of
speculation could be put to rest very quickly.
As for damaged wells. We will just have to wait for the data to come
in. April's decreasing GOR has given me confidence in my original suspicions
of over producing wells. Not sure how keen Shallow will be pumping dead
oil from 10,000 ft TVD and 20,000 ft MD. At least there will be plenty of
wells to experiment with, until you can make it work! lol
Although it intrigues me, don't worry, we will leave the deep stuff
to someone else. Low volume wells that produce little to no water can work
even in a low price environment.
Besides the costs in the event of a down hole failure being down
right frightening, it has not been determined where these wells will settle
out in years 10-30+.
"... as to GS public statements relating to oil and gold, the money has been by taking the other side of the trade, I have little doubt that what their trading desk does. ..."
Goldman Sachs has dismissed what's been described by some analysts as a recovery in the global
oil markets.
The uber bear said it expects a "modest" deficit in the coming months due to current prices, before
the market returns to surplus early next year.
Rising demand, falling US oil output as well as supply disruptions have helped the black stuff
recover from below $28 per barrel in January to just under $50 today.
Read more: North Sea to warn MPs subsea sector risks losing world-leading position
But Damien Courvalin, an analyst at Goldman Sachs, said that this was, at best, the first signs
of a turnaround.
"Canadian production is finally restarting, production from other Organisation of Petroleum Exporting
Countries' members continues to beat our expectations."
Courvalin continued: "The recent recovery in prices risks that non-Opec production declines
less than we expect, especially in the US."
What is it they say? A sucker is born every day? This should be illegal!
as to GS public statements relating to oil and gold, the money has been by taking the other side
of the trade, I have little doubt that what their trading desk does.
"... Furthermore, the U.S. Energy Sector is paying at least 50% of its operating profit now to just pay the interest on the debt. Q1 2016, it was 86% of their operation income just to pay the interest on the debt. ..."
"... Unless Uncle Sam comes in and BAILS OUT the U.S. Energy Sector, it's in serious trouble. ..."
I find it interesting that the U.S. Energy Sector now has twice as much debt as it did ten
years ago at $370 billion… as production declines.
Furthermore, the U.S. Energy Sector is paying at least 50% of its operating profit now to just
pay the interest on the debt. Q1 2016, it was 86% of their operation income just to pay the interest
on the debt.
Unless Uncle Sam comes in and BAILS OUT the U.S. Energy Sector, it's in serious trouble.
"... Slight aside, but just a comment on the public understanding of energy issues- I engaged with a senate candidate recently regarding a comment she made at a public debate. She exclaimed that one way the USA should work to contain Putin was to export energy to Europe so they are not hostage to Russian energy supply. I later pointed put to her that she ought to study up on energy some more, since we are big importers of energy. She said she had been hearing that we are approaching independence on energy. I was very surprised by her lack of understanding of this critical issue, since in other respects I found her to be very smart and well studied. Goes to show that people generally hear what they want to hear, or they simply swallow the most convenient truth. And this includes our policy makers, our voters, and ourselves. ..."
"... Look at the second to last slide "Resilience of the three American gas plays (UFDsim)" decline around 15% during the first four years for shale gas. We live in interesting times. ..."
Slight aside, but just a comment on the public understanding of energy issues-
I engaged with a senate candidate recently regarding a comment she made at a public debate.
She exclaimed that one way the USA should work to contain Putin was to export energy to Europe
so they are not hostage to Russian energy supply. I later pointed put to her that she ought to study up on energy some more, since we are big
importers of energy. She said she had been hearing that we are approaching independence on energy.
I was very surprised by her lack of understanding of this critical issue, since in other respects
I found her to be very smart and well studied.
Goes to show that people generally hear what they want to hear, or they simply swallow the
most convenient truth. And this includes our policy makers, our voters, and ourselves.
[Hi Petro- this also explains my wooden nickel vote, wrong though it may be]
When 180 new wells per month were being added output was increasing, when new wells added fell
the output flattened. New well EUR has been going up in 2014 and 2015, the current wells have
been performing better over the first 12 months of output than earlier wells so fewer wells are
needed to increase output. With current average wells about 105 new wells per month is enough
to increase output.
The EUR of the average well increased from 2013 to 2015, especially over the first 24 months
of output, the well profile was adjusted upwards to reflect this (and to get the model to match
actual output), it had been running "low" for several months. A steady 150 new wells per month
using the 400 kb well profile I had constructed would result in 1300 kb/d.
The well profile could be too high, an alternative scenario uses a 366 kb well profile (which
matches pretty well the 12 month increase in output we see with recent wells compared to the 2008
to 2015 average well with EUR of 350 kb). That alternative is up thread. When oil prices go up,
financing will be available.
The average 12 month completion rate was 177 new wells per month (centered average) in Dec
2014 when ND Bakken/TF output peaked at 1163 kb/d. This was enough to raise output by 300 kb/d
from Dec 2013 to Dec 2014, if fewer wells had been completed (for example and average of 150 new
wells per month), the rate of increase in output would have been smaller. By July 2015 the centered
12 month average completion rate had fallen to 148 new wells per month, but output had only fallen
by 13 kb/d (1150 kb/d).
Only 105 new wells per month after July 2015 would have been enough to keep output rising.
A scenario with 105 wells added after 2017 shown below. You won't believe this, but only 105 wells
per month are needed to increase output, at least for a time.
The difference is simply the number of wells added per month. There is no a priori reason that
the number of new wells will be limited to 105 new wells per month, perhaps there will be no financing
available, but I doubt this would be a problem for Statoil or Exxon Mobil, they can do this out
of cash flow if needed.
I also doubt that oil prices will remain under $80/b long term (more than 5 years). I expect
by 2021, oil at $80/b(2016$) will be considered cheap.
A different view from a Total engineer, looks to be using proprietary modeling software. Seems
to capture the possibility of a fatter tail than the logistic curve does, but has already missed
the flat peak area:
Look at the second to last slide "Resilience of the three American gas plays (UFDsim)" decline
around 15% during the first four years for shale gas. We live in interesting times.
"... the U.S. Energy Sector is paying at least 50% of its operating profit now to just pay the interest on the debt. Q1 2016, it was 86% of their operation income just to pay the interest on the debt. ..."
"... Unless Uncle Sam comes in and BAILS OUT the U.S. Energy Sector, it's in serious trouble. ..."
I find it interesting that the U.S. Energy Sector now has twice as much debt as it did ten
years ago at $370 billion… as production declines.
Furthermore, the U.S. Energy Sector is paying at least 50% of its operating profit now to just
pay the interest on the debt. Q1 2016, it was 86% of their operation income just to pay the interest
on the debt.
Unless Uncle Sam comes in and BAILS OUT the U.S. Energy Sector, it's in serious trouble.
"... I also doubt that oil prices will remain under $80/b long term (more than 5 years). I expect by 2021, oil at $80/b(2016$) will be considered cheap. ..."
"... Look at the second to last slide "Resilience of the three American gas plays (UFDsim)" decline around 15% during the first four years for shale gas. We live in interesting times. ..."
The difference is simply the number of wells added per month. There is no a priori reason that
the number of new wells will be limited to 105 new wells per month, perhaps there will be no financing
available, but I doubt this would be a problem for Statoil or Exxon Mobil, they can do this out
of cash flow if needed.
I also doubt that oil prices will remain under $80/b long term (more than 5 years). I expect
by 2021, oil at $80/b(2016$) will be considered cheap.
A different view from a Total engineer, looks to be using proprietary modeling software. Seems
to capture the possibility of a fatter tail than the logistic curve does, but has already missed
the flat peak area:
Look at the second to last slide "Resilience of the three American gas plays (UFDsim)" decline
around 15% during the first four years for shale gas. We live in interesting times.
"... Shale guys are not borrowing at negative rates. They were borrowing at 4-12% and have accumulated debt that most of them will never be able to repay. ..."
"... Now they are issuing new equity and diluting existing shareholders. That's another way to get free money in order to be able to drill new wells. ..."
"... AlexS. Only the Permian guys seem to be able to issue shares, mostly at least. ..."
"... One of them, Pioneer, is planning to offer 5.25 million new shares at about $827 million. Part of the proceeds will be used to buy Devon's upstream assets in the Permian. Pioneer Goes 'Bold' as Devon Retreats in Top U.S. Oil Field ..."
"Only the Permian guys seem to be able to issue shares"
One of them, Pioneer, is planning to offer 5.25 million new shares at about $827 million. Part
of the proceeds will be used to buy Devon's upstream assets in the Permian. Pioneer Goes 'Bold' as Devon Retreats in Top U.S. Oil Field
"... Crude traders following Fibonacci rules. That's all. They took out the stops around 51, made their profits then went short. Pretty soon they'll go the other way again. Third quarter they'll go long and stay there. Guys already taking options on 100 a barrel. WTI will probably retest a 42 handle before it starts a steady climb. In the sixties in three months or so. Better dollars next year. ..."
"... 3/4 or more of the well bores will be abandoned and thrown on the backs of state governments if WTI and nat gas prices persist or go lower. ..."
"... At some point, there will be a rapid reversal, commodities become scarce, prices rocket up? One thing for sure, 1980s university finance professors never envisioned the kind of stuff going on. Crazy times. Hard to change long held views. ..."
Not too happy to see prices are headed back down in the face of what appears to be strong demand
and falling production. Strong dollar, negative rates. Ouch.
Petro. Are all commodities doomed, or just energy? How about grain?
I am going out on a limb here and say food and energy and precious metals will see money flow
and the government will print money to make sure we have food and energy. Folks can do with out
a lot but the streets will fill without food and energy. With respect to who will be right about
US seeing past highs in C+C production, I have my doubts under normal business conditions, but
i can envision that it could happen, but it would be under a "emergency" type all hands on deck
scenario. Unlikely but possible, our industry has surprised doubters in the past in our ability
to get the job done for the American people. lets make america great again
Crude traders following Fibonacci rules. That's all. They took out the stops around 51, made their
profits then went short. Pretty soon they'll go the other way again. Third quarter they'll go
long and stay there. Guys already taking options on 100 a barrel. WTI will probably retest a 42
handle before it starts a steady climb. In the sixties in three months or so. Better dollars next
year.
We just have to keep starving for a few more months. Oil in storage isn't helping much either.
By the end of the year, we should have a couple of reasons to smile for a change.
One other thought. I take it you see major deflation on the horizon? So, if both crude price AND operating costs deflate, what is the difference, unless one has
debt?
If one only has plugging liabilities, in a highly deflationary scenario, those liabilities
also deflate (cost of labor and cement) in relation to cash on hand. Further, those with plugging
liabilities and cash with no debt will, in my view, at least, have high leverage with state agencies
as to negotiating a long term P & A agreement.
The US has over 1 million wellbores, if there is a "royal flush" of E & P's, due to massive
deflation + high long term debts, I'd say anyone who agrees to P & A a few wells per year will
be looked on favorably. 3/4 or more of the well bores will be abandoned and thrown on the backs
of state governments if WTI and nat gas prices persist or go lower.
At some point, there will be a rapid reversal, commodities become scarce, prices rocket up?
One thing for sure, 1980s university finance professors never envisioned the kind of stuff
going on. Crazy times. Hard to change long held views.
Shallow Sand – Here is the clueless take on things.
In general: Low interest rates are deflationary; High interest rates are inflationary. But,
they are used to fight the opposite problem. Inflation rising: raise interest rates. Deflation
on the horizon: print money and lower interest rates to cause inflation. However, at the extremes,
eventually the desired result is obtained.
In the 1970's they kept raising interest rates to fight inflation. Result, more inflation –
until we got to 14% annual inflation and 18% interest on a home mortgage. Then a recessionary
collapse, and inflation was killed. Now we are in the reverse position – including negative rates
in Europe, and everyone printing money. Result, deflation becoming more of a worry. At some future
breaking point, likely a SURGE in inflation.
Why is this? Because if you have debt, when interest rates rise, you have NO choice. You must
raise prices to pay it . There are no productivity gains; better way of doing things; more efficiency,
etc. to solve the problem. If you have debt and interest rates rise, generally you HAVE to raise
prices to pay the interest.
Now the reverse. Suppose long-term interest rates go to zero. You want to build a restaurant.
You borrow the total cost of $2 million for 20 years. No interest, just a balloon payment at the
end of 20 years. Okay, you can build your restaurant for zero cost of capital. For 20 years, you
just have to cover the variable costs – food, labor, utilities and insurance. So, for 20 years,
you can undercut the price of anybody that does have a cost of capital. Your restaurant is a booming
success for 20 years, until you declare bankruptcy, since you have taken all of the profits as
your salary and have no money to pay back the debt. Meanwhile you have lowered the cost of eating
out in your market area for 20 years.
A mini model illustrating how the simple oil model works in chart below.
Basically well profile times number of wells added and add it all up.
Note that the well profile changes over time it is not fixed. Before 2008 there was a lower
well profile, it increased and remained relatively stable from 2008 to 2013, the well profile
increased in 2014 and 2015.
All of the well profiles and number of wells added each month from 2005 to 2016 (April), we don't
know what the future well profile will be. All of this information is in the spreadsheet I linked
earlier.
The minimodel is in the link below and illustrated in the diagram below.
Chart that goes with spreadsheet above is below, shows a dual peak scenario, it is all about
the number of wells completed, the peak only occurred because the number of completions fell from
200 per month to 45 per month in the ND Bakken/Three Forks.
An open truly clueless question. For many years, much of the gas in the Bakken was flared. During
that time, was measurement of gas as accurate and complete as when flaring no longer allowed and
it is now being sold?
The reason that I ask, is to assess if historical gas/oil ratios are meaningful.
If you read the ND govt reports, you will see oil and gas figures per well each month. Yes
gas produced has been counted all the way though. Gas captured and sold, is a separate number.
"... "I think the world is going to need Permian Basin oil production, and it's not going to grow until you get to $60 long term," he said. "When oil moves toward $60 per barrel, I believe a good $10 of it for a lot of companies will go toward paying off debt, or they'll start selling assets at decreased divesture prices. That extra $10 will be a huge difference for companies that have great balance sheets today. That's why I'm a firm believer we're in a $60 long term oil price environment." ..."
"I think the world is going to need Permian Basin oil production, and it's not going to grow until
you get to $60 long term," he said. "When oil moves toward $60 per barrel, I believe a good $10
of it for a lot of companies will go toward paying off debt, or they'll start selling assets at
decreased divesture prices. That extra $10 will be a huge difference for companies that have great
balance sheets today. That's why I'm a firm believer we're in a $60 long term oil price environment."
Seems to have changed his tune somewhat. But $60 does not get in done in most LTO plays. PDX's
production may be able to grow in the $60(60-69) but elsewhere not so much. But of course I will
take 69 over $48 anyday
Higher borrowing costs and tighter lending standards will act to restrain growth in the Bakken
going forward and along with continued advances in alternatives may well make it unlikely to
peak higher. Prices however can go substantially higher before restraining U.S. growth
than they could in 2008 since the economy has changed.
New vehicle efficiency alone increased 25 percent:
http://www.umich.edu/~umtriswt/img/EDI_mpg_May-2016.png
"... Saudi Arabia is curtailing renewable-power targets as the world's biggest oil exporter plans to use more natural gas, backing away from goals set when crude prices were about triple their current level, according to Energy Minister Khalid Al-Falih. ..."
"... "Our energy mix has shifted more toward gas, so the need for high targets from renewable sources isn't there any more," Al-Falih said. "The previous target of 50 percent from renewable sources was an initial target and it was built on high oil prices" near $150 a barrel, he said. ..."
"... Saudi Arabian Oil Co., the state-run producer, set up several ventures with international partners to explore for gas, but results were disappointing and most of the companies withdrew from their ventures. Production of dry gas, or fuel for use in power plants or factories, will rise to 17.8 billion cubic feet per day from 12 billion, according to the plan. ..."
"... "Gas currently makes up around 50 percent of the energy mix in Saudi Arabia, and we have an ambition to see this grow to 70 percent in the future, either from local sources or from abroad," Al-Falih said. ..."
"... The Persian Gulf nation has previously scaled back its ambitions for renewables. In January 2015, it delayed by nearly a decade the deadline for meeting its solar-capacity goal, saying it needed more time to assess technologies. The kingdom's earlier solar program forecast more than $100 billion of investment in projects aimed at generating 41 gigawatts of power by 2040. ..."
Kingdom cuts renewables target to 10% of energy mix from 50%
Gas and renewables to free up more Saudi crude for export
Saudi Arabia is curtailing renewable-power targets as the world's biggest oil exporter
plans to use more natural gas, backing away from goals set when crude prices were about triple
their current level, according to Energy Minister Khalid Al-Falih.
The kingdom aims to have power generation from renewable resources like the sun make up 10
percent of the energy mix, a reduction from an earlier target of 50 percent.
"Our energy mix has shifted more toward gas, so the need for high targets from renewable
sources isn't there any more," Al-Falih said. "The previous target of 50 percent from renewable
sources was an initial target and it was built on high oil prices" near $150 a barrel, he said.
Saudi Arabia, which holds the world's second-largest crude reserves, will double natural gas
production, according to Al-Falih, and the government will expand the distribution network to
the western part of the nation. Generating more power from gas and renewables should make more
crude available for export, which would otherwise be burned for electricity for domestic use.
Saudi Arabia has for years sought to develop gas resources to provide fuel for power plants
and industries and to free up more oil to sell overseas. Saudi Arabian Oil Co., the state-run
producer, set up several ventures with international partners to explore for gas, but results
were disappointing and most of the companies withdrew from their ventures. Production of dry gas,
or fuel for use in power plants or factories, will rise to 17.8 billion cubic feet per day from
12 billion, according to the plan.
"Gas currently makes up around 50 percent of the energy mix in Saudi Arabia, and we have
an ambition to see this grow to 70 percent in the future, either from local sources or from abroad,"
Al-Falih said.
Achieving the targets will be a challenge, said Robin Mills, chief executive officer at consultant
Qamar Energy in Dubai. Gas projects usually require a lead time of at least three to four years
before production begins, said Mills, a fellow at the Brookings Institution in Doha.
Saudi Arabia is seeking to increase renewable-energy production to 9.5 gigawatts, according
to a plan announced in April. Saudi Aramco has a 10-megawatt solar installation on the roof of
a parking lot at its headquarters in Dhahran.
The Persian Gulf nation has previously scaled back its ambitions for renewables. In January
2015, it delayed by nearly a decade the deadline for meeting its solar-capacity goal, saying it
needed more time to assess technologies. The kingdom's earlier solar program forecast more than
$100 billion of investment in projects aimed at generating 41 gigawatts of power by 2040.
"... While the growth in new renewables looks spectacular (Figure 6) they remain insignificant in the global energy mix amounting to 2.8% of the total in 2015 compared with 2.4% the year before ..."
"Figure 9 While the growth in new renewables looks spectacular (Figure 6) they remain insignificant
in the global energy mix amounting to 2.8% of the total in 2015 compared with 2.4% the year before."
Power burn stands at an all time high and up over 20% from last year. In addition, huge
write downs of the industry of 40 Tcf for 2015, which – including oil – brought overall impairments
to over 10 bn boe (or USD 500 bn loss for investors in 2015) reduced investors appetite for
new investments. How many investors are left ready to lose another 500 bn on write downs alone?
On the other hand, the growing market share for wind and solar triggered massively demand
for natural gas which reached an all time high market share of 35%.
If there is a hot summer this year, power burn could go over 40 bcf/d and maybe even
reach 50bcf/d for some days.
The consequence would be the first significant stock draw over the summer, which for
sure will have an impact on prices.
This is only a little surprise. This decline takes away the surplus that was built up during the
last two months (Fabruari and March) compared to the Season Effect Model. I was rather surprised
by the modest declines those last two months.
I try to attach the graph once more to this comment (or I will ask Ron for support).
You can clearly see the dataset crosses the modelled line for the sixth time now. The first
derivative of the model and the change of the data are still within the same error range as prior
to the moment the model was built.
Difference between the model and the data is -2.4% now. The age of the model is 29 months now.
Excellent chart. Just wanted to let you know that you were one of the few who presented the
CORRECT Bakken chart in this blog. There may have been others, but well done. Jean Laherrere and
Tad Patzek both have the same Bakken production profile as yours.
By 2025, the United States will be pumping 75% less oil than it is today. It will be interesting
to see how we run the LEECH & SPEND SERVICE ECONOMY on that little amount of oil. Americans who
think we will be able to exchange worthless paper dollars or Treasuries for oil at that time,
better stop sniffing the glue.
"... Some commentators have asserted that the 2008 financial crises was due to high fuel costs, and not necessarily due to the cascading collapse of Wall Street financial legerdemain (although this undoubtedly helped fan the flames). ..."
"... Social Security is a big part of the "unfunded liabilities". That's a transfer. It's not available to the working person who gets it deducted from their paycheck, but it's available to the retiree who gets it. And, the retiree is more likely to spend it. ..."
Thank you for your excellent reply, and as Cracker says the extensive work you've done provide
a constructive counter to the less optimistic among us, of which I am one.
I am with Cracker in that I think your charts are chronically optimistically lopsided, but
held my opinion on this for a long time until now.
The resources amounting to URR 8-9.2GB of oil as you surmise may indeed be there, however I
remain highly skeptical of this reported volume for a variety of reasons.
At the end of the day, whether the URR of 8-9.2GB is there or not, I am of the opinion that
only a fraction of it will ever be recovered and the true amount never realized. The reason is
that the condition of the world economy won't support anything higher than $50 based on what I've
seen this year. To wit;
1. Student and consumer debt is at an all-time high, compounded with the problem that most
highly paid jobs are disappearing for the middle class . The June 2016 jobs report was pretty
lackluster, with a +38,000 nonfarm payroll jobs increase reported. It is to be noted that the
civilian long term unemployed has changed little at about 7.4 million.
2. Most driving is of itself for non-productive activities, and includes travel to jobs
that are generally non-productive. If fuel gets more expensive, I expect that much of this
non-essential travel will drop off. Some commentators have asserted that the 2008 financial
crises was due to high fuel costs, and not necessarily due to the cascading collapse of Wall Street
financial legerdemain (although this undoubtedly helped fan the flames).
3. The FED has pumped over $4 trillion of cash into the US economy, but the net benefit
is estimated to be less than $1 trillion to GDP. It is unknown how the FED is going to unload
this pure dreck on its books, and I suspect that it will not comport with higher oil prices in
the cogs and wheels of the economy;
4. US debt is at a fantastic level of $19.3 trillion, with another $67 trillion of unfunded
liabilities on the books. It's hard to see how this debt will be reduced to manageable levels
with higher oil prices.
5. An Internet 2.0, or some other economically transformative technology, doesn't appear
to be on the horizon. Currently, all we know how to do is burn fuel, heat a working fluid,
and use it to drive a piston or turbine. The alternatives, such as solar and wind, will only come
on as oil heads into it's retirement party.
6. Related to point #1; if the current trend to transfer jobs over to automation continues,
it's hard to see how there will be people driving to their (former) employment, and for that matter
afford things that are (of course) produced by petroleum;
7. For what it's worth, I think that the 2008 crises hasn't gone away despite massive money
printing efforts. They're trying to keep demand artificially supported with easy money and
the incurring of unrepayable debt, which is terrifyingly criminal as it is simply passed unto
the very young and the unborn. How can we expect them to pay our debts and then go out and buy
fuel, when their jobs have been outsourced and/or automated? The whole thing has gone far over
the top and is way beyond the point of no return. As mentioned previously, I see no significant
industrial (i.e inventive) development or for that matter, improvements in demographics that will
turn this around.
So at the end of all this, I think that baring hyperinflation the prospects for oil over $50-$55
for the next couple of years is looking fairly dim. Hence, that claimed 8-9.2 GB UR is not going
to be realized in real production.
There are many that are very pessimistic about the economy. Unfunded liabilities are not the
same as debt, so I don't count those.
The retirement age can be raised and eventually the US will follow the rest of the advanced
economies and reform the health care system to control costs.
(First we need to exhaust all other possibilities, before doing the right thing.)
Note that my scenario has oil prices rising very gradually. Also oil prices were over $100/b
for 3 years with the World economy continuing to grow.
All that money printing has had very little positive or negative effect, mostly the velocity
of money has slowed because most of that money is just sitting in bank accounts. Inflation is
not high, if it were the Fed would simply reduce the money supply.
A debt of $19 trillion for an economy with an income of $18.2 trillion is not really a problem.
A debt free consumer with a good credit rating and a 20% down payment in savings can typically
borrow up to 3 times their income for a mortgage. The US government debt is at 104% based on fred
data.
According to BIS for the US total non-financial sector debt is about 250% of GDP.
For all counties that report to the Bank for International Settlements (BIS) the total non-financial
sector debt to GDP was 235% in the fourth quarter of 2015 (most recent data point) at market weighted
exchange rates. (220% using PPP weighted exchange rates.) See
"Unfunded liabilities are not the same as debt, so I don't count those."
I'd like to point out that both of these things act as a dead weight on a chain that must be
carried by those who are working and generating income, as we go forward in time.
And income, or savings derived from it, must then be used to service the debt and pay for the
liabilities/entitlements.
This is money that then cannot go towards buying fuel, or funding innovation and transition- things
like EV, solar, etc.
A dead weight is a dead weight.
And going into a crisis you have a better chance of surviving it if you are lean and mean, not
if you have this ugly balance sheet. It doesn't help that most of the worlds countries are in
poor shape in this regard as well.
I have to agree with Mike Sutherlands view that these factors could very well decrease the URR
significantly.
On the other hand, the other 7 Billion people of the world will keep increasing their demand
and, along with depletion, this will leave less cheap oil for the USA to import. This will tend
to raise the price here.
These are conflicting forces, and I think we will end up with a scenario with both lower URR
of these domestic sources, and yet also higher prices. Good for solar/wind I suppose- if we can
afford it.
Very tough on the average family and local businesses.
Social Security is a big part of the "unfunded liabilities". That's a transfer. It's not available
to the working person who gets it deducted from their paycheck, but it's available to the retiree
who gets it. And, the retiree is more likely to spend it.
So, SS doesn't slow down the economy, it helps it.
Transferring money from a working family to a retired one doesn't help the economy, it helps the
elderly person, and hurts the working family (in the here and now).
Its overall pretty neutral, but it surely takes resources that could go towards energy infrastructure
and development and shifts it towards the pharma industry, for example.
I'm not trying to make a value judgement here, just pointing out that in the scope of our prior
discussion, this is fairly neutral and doesn't change the conclusions.
Currently, all we know how to do is burn fuel, heat a working fluid, and use it to drive a
piston or turbine. The alternatives, such as solar and wind, will only come on as oil heads into
it's retirement party.
Well, no, we know a lot more than that. We have superior alternatives for most of the uses
for oil, and adequate ones for the rest.
The single biggest use is personal transportation, and EVs will work fine for that. We don't
need turbines for that, electric motors will do just fine.
And…we don't need wind or solar to get rid off oil. Not at the moment. All we need is electricity,
and we have plenty of that, right now.
My humble apologies, Dennis, just too funny, and appropriate. I do appreciate your charts,
but I wish you would occasionally plug is some other values to provide a contrast to your ever-optimistic
assumptions. My reaction to your chart was the same as Ron's.
Make your chart reflect lower and fluctuating oil prices, instead of coynecopian, steady-state
high prices and it might make more sense. Add a factor for debt restraining new wells at higher
oil prices (see SS's comment about $75 without debt below). Your assumptions just seem too optimistic
to be realistic. Maybe I just underestimate BAU's ability to fund stupidity and you don't:-)
It will be interesting to see what really happens.
Thanks to all for your comments. Always educational.
"... April 13,050 (preliminary)(all-time high was Oct 2015 13,190) ..."
"... March 56 drilling and 4 seismic ..."
"... April 66 drilling and 0 seismic ..."
"... May 42 drilling and 0 seismic (all time high was 370 in 10/2012) ..."
"... ND Sweet Crude Price ..."
"... March $26.62/barrel ..."
"... April $30.75/barrel ..."
"... May $33.74/barrel ..."
"... Today $38.25/barrel (all-time high was $136.29 7/3/2008) ..."
"... Today's rig count is 28 (lowest since July 2005 when it was 27)(all-time high was 218 on 5/29/2012) ..."
"... The drilling rig count fell 3 from March to April, 2 from April to May, and increased 1 from May to today. Operators remain committed to running the minimum number of rigs while oil prices remain below $60/barrel WTI. The number of well completions fell from 66 (final) in March to 41 (preliminary) in April. Oil price weakness is the primary reason for the slow-down and is now anticipated to last into at least the third quarter of this year and perhaps into the second quarter of 2017. There was 1 significant precipitation event, 15 days with wind speeds in excess of 35 mph (too high for completion work), and no days with temperatures below -10F. ..."
"... Over 98% of drilling now targets the Bakken and Three Forks formations. ..."
"... Estimated wells waiting on completion services is 892, down 28 from the end of March to the end of April. Estimated inactive well count is 1,590, up 67 from the end of March to the end of April. ..."
"... Crude oil take away capacity remains dependent on rail deliveries to coastal refineries to remain adequate. ..."
"... Low oil price associated with lifting of sanctions on Iran and a weaker economy in China are expected to lead to continued low drilling rig count. Utilization rate for rigs capable of 20,000+ feet is 25-30% and for shallow well rigs (7,000 feet or less) 15-20%. ..."
"... Drilling permit activity increased from March to April then fell back in May as operators continue to position themselves for low 2016 price scenarios. Operators have a significant permit inventory should a return to the drilling price point occur in the next 12 months. ..."
by
Ron Patterson
Posted on
06/15/2016
The
Bakken
and
North
Dakota
production data is out. Big surprise. The Bakken was down 69,420 barrels per
day in April while all North Dakota was down 70,414 bpd.
Largest drop ever in North
Dakota production. The Bakken is now under one million barrels per day.
This gives you some idea of the erratic nature of North Dakota production.
But as you can see, the decline is accelerating.
The EIA's Drilling Productivity Report gives past Bakken production numbers, which includes the
Montana portion, and future estimates for the next couple of months. The average difference between
North Dakota production and total Bakken production has been about 27,500 bpd. However for April the
difference is almost 63,000 barrels. So it looks like for once the DPR estimate is way too
conservative. The DPR estimate is through July while the north Dakota data is only through April.
In April Bakken barrels per day per well fell by 7 to 94, North Dakota bpd per well fell by 5 to
82.
March 13,052
April 13,050 (preliminary)(all-time high was Oct 2015 13,190)
Permitting
March 56 drilling and 4 seismic
April 66 drilling and 0 seismic
May 42 drilling and 0 seismic (all time high was 370 in 10/2012)
ND Sweet Crude Price
March $26.62/barrel
April $30.75/barrel
May $33.74/barrel
Today $38.25/barrel (all-time high was $136.29 7/3/2008)
Rig Count
March 32
April 29
May 27
Today's rig count is 28 (lowest since July 2005 when it was 27)(all-time high was
218 on 5/29/2012)
Comments:
The drilling rig count fell 3 from March to April, 2 from April to May, and
increased 1 from May to today. Operators remain committed to running the minimum number
of rigs while oil prices remain below $60/barrel WTI. The number of well completions
fell from 66 (final) in March to 41 (preliminary) in April. Oil price weakness is the
primary reason for the slow-down and is now anticipated to last into at least the third
quarter of this year and perhaps into the second quarter of 2017. There was 1
significant precipitation event, 15 days with wind speeds in excess of 35 mph (too high
for completion work), and no days with temperatures below -10F.
Over 98% of drilling now targets the Bakken and Three Forks formations.
Estimated wells waiting on completion services is 892, down 28 from the end of
March to the end of April. Estimated inactive well count is 1,590, up 67 from the end of
March to the end of April.
Crude oil take away capacity remains dependent on rail deliveries to coastal
refineries to remain adequate.
Low oil price associated with lifting of sanctions on Iran and a weaker economy in
China are expected to lead to continued low drilling rig count. Utilization rate for
rigs capable of 20,000+ feet is 25-30% and for shallow well rigs (7,000 feet or less)
15-20%.
Drilling permit activity increased from March to April then fell back in May as
operators continue to position themselves for low 2016 price scenarios. Operators have a
significant permit inventory should a return to the drilling price point occur in the
next 12 months.
... ... ...
New wells added in the Bakken/Three Forks are assumed to drop to 25 new wells in April and remain
at that level until Jan 2017. Last month about 64 new wells were added.
Depletion never sleeps, so I wonder how much cocaine analysts at IHS snorted before cutting cut
their price forecast,
The collapse in crude prices is turning into a trillion-dollar retrenchment for the global oil
industry.
That's the latest tally from energy researchers at Wood MacKenzie, which tracks capital
investment by oil and gas producers around the world.
... ... ...
Lower prices and spending cuts have naturally trimmed worldwide production. Wood Mackenzie
forecasts that global crude oil output thorough the rest of the decade will be some seven billion
barrels lower than was expected before the oil price drop, or about 3 percent lower this year and
4 percent lower next year.
... ... ...
In a separate report, analysts at IHS recently cut their price forecast, noting that U.S.
production has held up better than expected despite the drilling cuts. They also cited continued
high OPEC production and weakening growth in global demand.
IHS expects U.S. oil and gas producers to continue to cut investment by another 35 percent this
year, with those cuts bottoming later this year. But any recovery will be "long and drawn out,"
they said, with spending by the end of the decade still 28 percent below the 2014 peak.
51 neocons warmongers, who need to be send to Afghanistan for some on site learning. Nuland's birds
of feather try to get worm places in Hillary new administration, playing on her war hawk tendencies...
Those "diplomats" forgot about the existence of Saudis and other theocracies which are much more brutal
and less democratic, viewing woman as domestic animals. These are dark times for American foreign
policy. the easy part is to depose Assad. But what might happen after Assad is disposed of? You
know, the hard part, what follows?
Notable quotes:
"... These Diplomats should be fired as idiots. Did they not just live through the Iraqi occupation, destruction and disaster? ..."
"... Are you a bit confused as to who these neocon dissenters at State support in the Syrian civil war? ..."
"... This is simply a roll call of neocon diplomats making a case for another non-strategic war that would badly hurt US interests. It does not represent State Department policy. The neocons have been very persistent in securing career appointments at State for decades now. ..."
"... You are pushing the world closer to war. ..."
"... what is intolerable about the position of the 51 "diplomats" in the memo is that it is their (failed) efforts to dislodge Assad by proxy, facilitating and organizing the flow of arms that more often than ended up in the hands of hard-line jihadists, that has led to almost 400,000 deaths (not to mention wounded) and the flight of over a million refugees. ..."
"... Wow, sounds like some housecleaning is needed at State. Whatever happened to jaw-jaw being better than war-war? If they are so keen on military action, they're in the wrong building. I'm sure some of the overworked troops and officers in the armed forces would be happy to let these guys take a few of the chances of getting shot or blown up that they deal with daily. ..."
"... It is troubling that the State Department, long a bulwark of common sense against America's foreign adventurism, has become as hawkish as its former head, Hillary Clinton. ..."
"... The Middle East Institute is financed, primarily, by the petroleum and arms industries. The Washington Institute for Near Eastern Policy has HRC's close ally, Dennis Ross; who, with Martin Indyk, founded AIPAC in the mid-80's. ..."
"... This group's contention that direct confrontation with Russia could be avoided echoes their 2002 claim that Operation Iraqi Freedom would be a three month cake walk. ..."
"... Since WWII, U.S. foreign policy has been rooted in the projection and use of force (covert and overt) as the primary means to achieve whatever goals the executive office seeks. It placed the world on notice that the U.S. was ready and willing to use violence to back its foreign policy objectives. Just as in Vietnam and before the disastrous decision to escalate the use of ground forces, President Johnson's national security advisors (all holdovers from Kennedy's Presidency) pressed Johnson to use aerial bombardment against N. Vietnam to induce them to seek a negotiated peace that would allow the U.S. to withdraw from the conflict and save face while preserving the policy of projecting force as a means to maintain world order in accordance with U.S. designs. ..."
"... My oldest son is now completing his sixth Afghan/Iraq tour.I don't want him in Syria. Let these 51 diplomats volunteer their sons/daughters for Syria.That'll demonstrate their commitment.I'll bet not one of these 51 "geniuses" has a child on active military duty in Iraq/Afghan. ..."
"... These folks are, it appears, mid-level foreign service officers like I was. They are utterly unqualified to make these judgements as the Department of State is a failed organization culturally and functionally. Like HRC, who is still advocating for forced regime change if she wins, they have learned nothing from the past and again have no answer for what follows Asad being deposed. A majority Sunni regime in Syria will tear Iraq apart and there is no likelihood of it avoiding the trajectory of other "pluralistic" Arab state attempts. The fact that State has no culture of strategic analysis informing operational design and operational planning which, in turn, spawn series of tactical events, comes clear in situations like this. Doing nothing is the best case here. Tragic but still the best case. President Obama has seen this. Asad needs to regain control of Syria's territory, all of it. Feeding the hopes of the Ahmed Chalabi equivalents in Syria is perpetuating the violence. And, there is no room for an independent Kurdistan in the region, nor is it in the United States' interest for there to be one. ..."
"... That's the same class of people who figured that invading in Iraq in 2003 would turn out all right. ..."
"... Exhibit A being Samantha Power, the latest in a long line of militaristic, European-born white Americans (see Albright, Kissinger, Brzezinski) who believe that American firepower can bring order to the world. ..."
"... Sorry hawkish diplomats, but you're living in a fantasyland where the invasion of Iraq in 2003 did not permanently tarnish the image of the USA and wreck its credibility as an honest arbiter. That is the reality all US presidents will have to face in the post-Bush 43 era. ..."
"... Are those 51 U.S. Diplomats responsible for advising the Obama Administration to bomb Libya back in 2011? Apparently they have not learned from their mistakes. Or maybe they should just go work for their true Employer, The Military Industrial Complex. ..."
"... This is reckless and irresponsible. US backed "moderates" are fighting elbow to elbow with the Nusra Front and other radicals groups; that is why the cease-fire is collapsing. ..."
"... If we weaken Assad, Islamists will take over Damascus and if Damascus falls, soon Beirut will follow. These folk at State are neo cons, as usual shooting from the hip. ..."
"... Vietnam, 212,000 dead and countless north and south Vietnamese and citizens. Unjust and unwarranted war on Iraq with 4,491 and counting dead and countess Iraqi citizens. Now, Syria? Are you wanting the draft returned? You asking for boots on the ground? How about you 50 join up. I will willingly pay for taxes just arm you and send you in. Along with every other know it all who wants us 'TO DO MORE'!! Spare me. You have learned NOTHING in your past failures, have you? 1956, Iran. Cause the over throw of a duly elected government for the Shahs which led to 1980 revolution to fear of them acquiring nuclear weapons. Vietnam led to 'WHAT'? Now Iraq. ..."
"... The worse destabilization in that area I can remember. Not even during their many attacks on Israel when Egypt got a clue. Fire Saddam Hussein's soldiers and they become ISIS by 2006, yet one bright senator lied and said Obama caused them when we left which was President Bush's treaty Maliki. They did not want us there. Leave per the Iraqi people, also. When ISIS showed up they ran and left the weaponry we gave them and the money in the banks for them to grab. Now, you want us steeped into Syria. It's been said, hindsight is 20/20, ..."
"... In these so called diplomats cases, it is totally and legally blind. Stevie Wonder and Ray Charles has a better perception and one of them is dead. ..."
"... The war hawks, so comfortably away from the battle, are banging those drums of war again. Easy to do when your life and the lives of your fellow military are not at risk. ..."
"... We all know now that the invasion of Iraq by Mr. Bush junior was a) a mistake, and b) a War Crime - there were no threatening WMDs nor did Saddam hold hads with Al Quaeda (he was, actually, their worst enemy - and our security!), so, Iraq was c) total stupidity. It was an aggressive war without any cause - for the USA! ..."
"... This is much more about what Mark Landler thinks than about what those generic diplomats think. The Times's principal hawk, Landler has book and a series of articles pushing his neocon view. I guess we should assume the Times agrees. ..."
"... Having spent substantial time as a private consultant at the US Embassy in Kabul I was shocked by the lack of feelings of midlevel officials there with regard to the dead and injuries of American Troops. The Embassy shared a wall with the ISAF/NATO Main Quarters and every single day the US Flag there was half-mast to acknowledge the dead of our troops on that day in that country. The Embassy never shared this sadness and all midlevel officials there were only concerned about their paycheck, quality of meals served, having a drink, going for a swim, and their frequent trips back to the US; for such people wanting to have a say in when to fight in Syria is a sad state of affair. ..."
"... Perhaps we should figure out one take-down before we move on to the next. After 13 years, we still haven't figured out life in Iraq without Saddam. Any thoughts, neocons, on what might happen after Assad is disposed of? You know, the hard part, what follows? ..."
"... Get Rid of Assad, make relations with Russia worse (they back Assad) and allow ISIS to effectively take over Syria. Sounds like a great plan. I guess our military-industrial complex is getting itchy for a new war. And, of course, doing what these diplomats want will also result in putting boots on the ground. This will be a great legacy for Ms. Clinton (under her watch ISIS came into being), Mr. Kerry (who continued Clinton's failed legacy) and Mr. Obama (the Nobel Peace Prize president; who wasn't). ..."
"... The signers of the dissent letter are militarist neocons (of the Victoria Nuland ilk). More than any other, these people and their CIA collaborators are responsible for the death and destruction in Syria and the ensuing refugee crisis. They can't even give a cogent reason for deposing Assad other than point to the carnage of the civil war they fomented-as if Assad were solely responsible. Assad is acting no differently than the US did during it's own Civil War. ..."
"... The value of the memo can be summed up in one sentence as described in the article itself "what would happen in the event that Mr. Assad was forced from power - a scenario that the draft memo does not address." ..."
"... I wonder about the arrogance of these mid-level State Department foreign service officers. ..."
"... Sure -- a few well-placed cruise missiles will make it all good. Yeah, right. ..."
"... Absolutely amazing. My first question is who released this memo? Having a back channel does not permit anyone to unilaterally decide to release information that could cost lives and ruin negotiations that the releasing person knows nothing about. If you do not like the chain of command, then leave. We cannot continue to be involved in sectarian conflicts that cannot be resolved except by the combatants. Haven't we learned anything from Iraq, Afghanistan, Lebanon, and Vietnam? No neocon insanity. We have lost enough lives and treasure in the ME. ..."
"... Are these the same ingrates who urged Bush to attack Iraq - his legacy - ISIS! ..."
"... As a 26 year Marine Corps combat veteran I have a hard time trying to figure out what is going on here, and a harder time not becoming totally disgusted with our State Department. ..."
"... My suggestion would be that we arm these 51 individuals, given them a week's worth of ammunition and rations, and drop them into Syria, I am sure they can lead the way in showing us how to solve the mess in the ME. ..."
"... It's the fact that these are not "widely known names" which scares me most. However, Western-instituted regime change in that region has proven disastrous in every single country it has been tried. If possible, I would investigate these diplomats' ties to defense contractors. ..."
"... US intervention created the rubble and hell that is now Syria. When Assad had full control of Syria, the human rights of the people of Syria suffered under him but many if not most people led a civilised life. They had water and electricity. Past US interventions created Afghanistan, Iraq, and Libya. To puy it simply, life expectancy in all these countries dropped by 20 to 30 years after the US intervened, each time with the highest utopian ideals, and increased the power of Sunni supremacists after each act. ..."
"... Let's not forget that Bush's hasty appointment of Paul Bremer as the hapless Governor of Iraq following the defeat of Hussein's military regime led immediately to the disbanding of the entire Iraqi military, an incredibly short-sighted and reckless move that essentially unleashed 400,000 young trained fighters (including a honed officers corps) absent support programs to assimilate back into Iraqi society, only to have them emerge as readily available fodder essential for ISIS's marshalling a strong military force almost overnight. A huge price is now being exacted for this astounding stupidity. ..."
"... This is conveniently laying grounds for Hillary's grand comeback to the theatre of "humanitarian interventionism" in the Middle East. God help us all, as this is a prelude to the WW3. ..."
"... Wow the neo-cons are beating the war drums yet again! They have already created a huge mess throughout the Middle East with wars and revolutions directly attributable to the United States in invading Afghanistan and Iraq under false pretenses, helping overthrow the government in Libya, and arming rebels in Syria and Yemen. ..."
"... Unfortunately if Hillary Clinton wins, she is a neo-con puppet and we will be at war in Syria and/or Iran within a year or two. God help us! ..."
"... First of all, if this was a channel for employees to share "candidly and privately" about policy concerns, why is it on the front page of the NY Times? Additionally, as usual, it seems the war hawks are hawking war without thought for what comes next. We've done this most recently in Iraq, Afghanistan, and Libya, all of which are now failed states and havens for terrorists. Because this seems rather obvious, either we are pathologically incapable of learning from past mistakes, or there are people who have an agenda different from the publicly stated one. ..."
"... The U.S. has a lengthy, very sordid history of leaping into the fray in areas such as the Middle East, Southeast Asia, Central America and Afghanistan, among others - all with catastrophic results, for which we never seemed to have a credible, well- crafted plan, nor have we ever comprehended the millennia of internecine tribal hatred and sectarian warfare. ..."
"... I am more scared of US diplomats and politicians than terrorists! Have they learned nothing from the US efforts to create western style democracy in Afghanistan, Iraq, Libya and Syria (by supporting separatists att an early stage). The US diplomats proposal would ensure more chaos, death and prolonged wR. 38 % of the population are Alewits. They will be killed, Christians will be killed. ..."
ScottW, is a trusted commenter Chapel Hill, NC 16 hours ago
These Diplomats should be fired as idiots. Did they not just live through the Iraqi occupation,
destruction and disaster?
A few years ago, a diplomat who quit was complaining about Syria at a conference I attended.
When I asked who would fill the void if Assad was deposed he said, "That is a difficult question
to answer." What he really meant to say is, "I don't have a clue."
We have already disrupted Syria by supporting rebels/terrorists. The region cannot tolerate
another Iraq.
Dan Stewart, NYC 16 hours ago
Are you a bit confused as to who these neocon dissenters at State support in the Syrian
civil war?
Here's a helpful hint:
If they have beards down to their belt buckles and seem to be hollering something about Allah,
those are the guys the neocons support.
If they're recently shaved and wearing Western attire, in other words, if they look like anyone
you might bump into on a US city street, those are the people the neocons call the enemy.
Retroatavist, DC 10 hours ago
This is simply a roll call of neocon diplomats making a case for another non-strategic
war that would badly hurt US interests. It does not represent State Department policy. The neocons
have been very persistent in securing career appointments at State for decades now. It's
as if we hadn't forgotten the endless horrible mess they got us and the rest of the world into
by breaking Iraq and destroying all its institutions with the insane de-baathification policy.
And it all started with a similar steady drumbeat for war throughout the mid and late '90s and
up to the 2003 disastrous invasion. Did we not learn anything? Really: Whose interest would
an open US war against Assad really serve, and what predictable outcome would be in the US's strategic
favor?
Robert Sawyer, New York, New York 14 hours ago
How many among the 51 are members of "Hillary's Legions, " the same geniuses responsible for
the unqualified success we achieved in Libya?
Gennady, Rhinebeck 16 hours ago
Stop this irresponsible reporting. You are pushing the world closer to war. Humanitarian
support is all we should bring to the Syrian people, regardless of which side they are on.
ScottW, is a trusted commenter Chapel Hill, NC
These Diplomats should be fired as idiots. Did they not just live through the Iraqi occupation,
destruction and disaster?
A few years ago, a diplomat who quit was complaining about Syria at a conference I attended.
When I asked who would fill the void if Assad was deposed he said, "That is a difficult question
to answer." What he really meant to say is, "I don't have a clue."
We have already disrupted Syria by supporting rebels/terrorists. The region cannot tolerate
another Iraq.
Alyoshak, Durant, OK
Isn't Congress supposed to declare war, and the President command our armed forces when such
declarations occur? But what is intolerable about the position of the 51 "diplomats" in the
memo is that it is their (failed) efforts to dislodge Assad by proxy, facilitating and organizing
the flow of arms that more often than ended up in the hands of hard-line jihadists, that has led
to almost 400,000 deaths (not to mention wounded) and the flight of over a million refugees.
But no, these casualties have nothing to do with our attempts at regime change, No!, the blame
for them lies squarely upon Assad for not scooting out of town immediately and submissively when
the U.S. decided it was time for him to go. So now we're supposed to double-down on a deeply immoral
and flawed strategy? How many more Syrians' lives must be ruined to "save" them from Assad?
Everyman, USA 16 hours ago
Wow, sounds like some housecleaning is needed at State. Whatever happened to jaw-jaw being
better than war-war? If they are so keen on military action, they're in the wrong building. I'm
sure some of the overworked troops and officers in the armed forces would be happy to let these
guys take a few of the chances of getting shot or blown up that they deal with daily.
Dan, Alexandria 16 hours ago
It is troubling that the State Department, long a bulwark of common sense against America's
foreign adventurism, has become as hawkish as its former head, Hillary Clinton.
I am grateful to President Obama for resisting this foolishness, but make no mistake, no matter
who gets into office in January, the kind of farcical, counterproductive, unrealistic "limited
engagement" advocated by these so-called diplomats will be our future. Clinton is champing at
the bit for it, and Trump is too weak to do anything but go along with it.
Clark M. Shanahan, Oak Park, Illinois 16 hours ago
Sadly, they'll most likely have a more accommodating commander and chief with HRC.
The Middle East Institute is financed, primarily, by the petroleum and arms industries.
The Washington Institute for Near Eastern Policy has HRC's close ally, Dennis Ross; who, with
Martin Indyk, founded AIPAC in the mid-80's.
This group's contention that direct confrontation with Russia could be avoided echoes their
2002 claim that Operation Iraqi Freedom would be a three month cake walk.
Paul Cohen, is a trusted commenter Hartford CT 15 hours ago
Since WWII, U.S. foreign policy has been rooted in the projection and use of force (covert
and overt) as the primary means to achieve whatever goals the executive office seeks. It placed
the world on notice that the U.S. was ready and willing to use violence to back its foreign policy
objectives. Just as in Vietnam and before the disastrous decision to escalate the use of ground
forces, President Johnson's national security advisors (all holdovers from Kennedy's Presidency)
pressed Johnson to use aerial bombardment against N. Vietnam to induce them to seek a negotiated
peace that would allow the U.S. to withdraw from the conflict and save face while preserving the
policy of projecting force as a means to maintain world order in accordance with U.S. designs.
Nixon carried on this bombing for peace strategy to insane war crime level. This heavy reliance
on military force over a diplomatic solution has never worked. It didn't work for our knee-jerk
response to 9/11 by immediately resorting to military force without first thinking through the
consequences. We are now into our 15th year of aggression against the Muslim World. The time is
long past due to question our failed policy and seek an alternative solution.
Bud, McKinney, Texas 16 hours ago
My oldest son is now completing his sixth Afghan/Iraq tour.I don't want him in Syria. Let
these 51 diplomats volunteer their sons/daughters for Syria.That'll demonstrate their commitment.I'll
bet not one of these 51 "geniuses" has a child on active military duty in Iraq/Afghan.
Abu Charlie, Toronto, Ontario 14 hours ago
These folks are, it appears, mid-level foreign service officers like I was. They are utterly
unqualified to make these judgements as the Department of State is a failed organization culturally
and functionally. Like HRC, who is still advocating for forced regime change if she wins, they
have learned nothing from the past and again have no answer for what follows Asad being deposed.
A majority Sunni regime in Syria will tear Iraq apart and there is no likelihood of it avoiding
the trajectory of other "pluralistic" Arab state attempts. The fact that State has no culture
of strategic analysis informing operational design and operational planning which, in turn, spawn
series of tactical events, comes clear in situations like this. Doing nothing is the best case
here. Tragic but still the best case. President Obama has seen this. Asad needs to regain control
of Syria's territory, all of it. Feeding the hopes of the Ahmed Chalabi equivalents in Syria is
perpetuating the violence. And, there is no room for an independent Kurdistan in the region, nor
is it in the United States' interest for there to be one.
AR, is a trusted commenter Virginia 15 hours ago
How undiplomatic. I don't care that these people are diplomats and that many of them probably
have impeccable academic pedigrees with degrees from the usual suspects such as the Ivy League
schools, SAIS, the Fletcher School of Law and Diplomacy, and Kennedy. That's the same class
of people who figured that invading in Iraq in 2003 would turn out all right. Obama is correct
to ignore these people, who more often than not are possessed by the notion of American Exceptionalism.
Exhibit A being Samantha Power, the latest in a long line of militaristic, European-born white
Americans (see Albright, Kissinger, Brzezinski) who believe that American firepower can bring
order to the world.
Let this be made clear: Any escalation of American involvement in Syria will be interpreted
as 1) an attempt to enhance the national security of Israel, 2) a means of benefiting the revenue
stream of the American military industrial complex, or 3) both. Only the most naive and foolish
people, since the absolutely disastrous events of 2003, would be inclined to believe that American
military intervention in Syria is motivated mainly by humanitarian impulses.
Sorry hawkish diplomats, but you're living in a fantasyland where the invasion of Iraq
in 2003 did not permanently tarnish the image of the USA and wreck its credibility as an honest
arbiter. That is the reality all US presidents will have to face in the post-Bush 43 era.
Robert Roth, NYC 14 hours ago
Everyone closes their eyes and imagines all the bloodshed they will prevent by all the bloodshed
they will cause.
Samsara, The West 16 hours ago
Have Iraq and Libya taught these State Department officials NOTHING??
Simon, Tampa 15 hours ago
The neo-cons who love regime change that never works. Let us examine their track record:
Iraq - a mess and infested with ISIS and Al Qaeda.
Libya - now an anarchist state infested with ISIS and Al Qaeda.
Yemen - bombing and murdering thousands of innocents and Al Qaeda.
Syria, the only secular Arab state, destroyed and infested with ISIS and Al Qaeda. The only
reason Syria hasn't completely fallen apart is thanks to Assad and his Sunni dominated army, Iran,
and the Russians. So of course, these neo-cons want to complete the job at the behest of the money
they will be getting from the Saudis and the other Gulf States.
Don't worry you warmongering greedy neocon, Hillary Clinton is one of you and will be president
soon enough.
Title Holder, Fl 15 hours ago
Are those 51 U.S. Diplomats responsible for advising the Obama Administration to bomb Libya
back in 2011? Apparently they have not learned from their mistakes. Or maybe they should just
go work for their true Employer, The Military Industrial Complex.
Andrea, New Jersey 15 hours ago
This is reckless and irresponsible. US backed "moderates" are fighting elbow to elbow with
the Nusra Front and other radicals groups; that is why the cease-fire is collapsing. Syrians
and Russians can not split hairs on the battlefield.
If we weaken Assad, Islamists will take over Damascus and if Damascus falls, soon Beirut
will follow. These folk at State are neo cons, as usual shooting from the hip.
Jett Rink, lafayette, la 15 hours ago
Here's the thing most people don't get about ISIS. They thrive on us being involved in the
Middle East. They are willing to kill other Muslims in order to keep us involved. As long as we
are there, terrorism will persist, over there and here too. They are playing us like chumps. They
use our tendency to knee-jerk reactions against us. They're out smarting us at every juncture.
Of course it's human nature to want to help people in such dire straights. But that's exactly
what ISIS wants, and correctly predict, that we'll do. So as long as they out-think us, they'll
continue to win.
If you want to help the innocent people caught in the cross-hairs of ISIS, the best thing we
could possibly do is pack up and leave. There'll be some more carnage, but eventually the backlash
from within will force them to stop the wrecking and killing. Many people will die, but in the
end, the tally would be far fewer.
Their goal is to keep us engaged. Ours should be to get out! As long as we stay, they win.
And that's how they're able to convince long-wolf's to strike us here, even when here is home
to them too.
Joane Johnson, Cleveland, Ohio 15 hours ago
Vietnam, 212,000 dead and countless north and south Vietnamese and citizens. Unjust and
unwarranted war on Iraq with 4,491 and counting dead and countess Iraqi citizens. Now, Syria?
Are you wanting the draft returned? You asking for boots on the ground? How about you 50 join
up. I will willingly pay for taxes just arm you and send you in. Along with every other know it
all who wants us 'TO DO MORE'!! Spare me. You have learned NOTHING in your past failures, have
you? 1956, Iran. Cause the over throw of a duly elected government for the Shahs which led to
1980 revolution to fear of them acquiring nuclear weapons. Vietnam led to 'WHAT'? Now Iraq.
The worse destabilization in that area I can remember. Not even during their many attacks
on Israel when Egypt got a clue. Fire Saddam Hussein's soldiers and they become ISIS by 2006,
yet one bright senator lied and said Obama caused them when we left which was President Bush's
treaty Maliki. They did not want us there. Leave per the Iraqi people, also. When ISIS showed
up they ran and left the weaponry we gave them and the money in the banks for them to grab. Now,
you want us steeped into Syria. It's been said, hindsight is 20/20,
In these so called diplomats cases, it is totally and legally blind. Stevie Wonder and
Ray Charles has a better perception and one of them is dead.
Bev, New York 16 hours ago
Yes the war machine wants more wars. Who will take the place of the evil Assad? We have removed
a number of evil dictators in that area of the world and all it has done is sap our resources,
killed hundreds of thousands of innocents, made millions hate us, and created vacuums of power
which are then filled with Saudi-assisted ISIS - AND profited our war machine (that's the important
part!) We need less involvement in the Mideast, not more. Bring them all home and start transitioning
from a war economy to an economy that serves the American citizens here.
ME, Toronto 13 hours ago
Thank goodness Obama kept his head and didn't (and hopefully won't) listen to such crazy advice.
To call the signers "diplomats" is a real stretch. It seems that somewhere back in time various
U.S. "diplomats" decided that they have the right to decide who and what the government should
be in various jurisdictions throughout the world. Of course this is motivated by purely humanitarian
concerns and love of democracy and not the self-interest of the U.S., as in having a friendly
government in place. As despicable as some governments are, the lessons over many years now should
be that military strikes are just as (maybe more) likely to produce something bad as anything
good. Better to talk and try to influence the development of nations through positive reinforcement
(as Obama has done in Iran). Undoubtedly this is a slow and somewhat frustrating process but that
is something real "diplomats" should be good at. If this process had been pursued in Syria we
would all be better off today and especially the Syrian people.
Mitchell, New York 16 hours ago
I assume these people at State also believe in the Tooth Fairy. The fantasy of "moderate" rebels
who will be grateful to us after they depose a tyrant and put in a fair democratic government
that takes into account all of our Western ideals and freedoms is so unrealistic that these people
at State need to find a job where their last words are, "Can I supersize that for you?" Our involvement
in the Middle East displacing despots and replacing them with chaos has been the biggest disaster
in foreign policy in many decades. Egypt, Iraq, Libya, and even Syria (remember the line in the
sand?). We should join with Russia in destroying ISIS and use our leverage to push Assad to make
some level of concessions.
Dan, Sandy, UT 15 hours ago
Here we go again. The war hawks, so comfortably away from the battle, are banging those
drums of war again. Easy to do when your life and the lives of your fellow military are not at
risk.
Second thought, as stated by a political comedian/satirist, let the Middle East take its own
trash out.
I couldn't agree more.
blackmamba, IL 16 hours ago
Since 9/11/01 only 0.75% of Americans have volunteered to put on the military of any American
armed force. They have been ground to emotional, mental and physical dust by repeated deployments.
Getting rid of Arab dictators has unleashed foreign ethnic sectarian socioeconomic political educational
civil wars that cannot be resolved by American military power.
Assad is an Arab civil secular dictator. Just like many of Americas Arab allies and unlike
those American Arab allies who are Islamic royal fossil fuel tyrants. But Assad is an Alawite
Shia Muslim allied with Russia. The alternatives to Assad are al Qaeda, ISIL and al Nusra. Diplomats
need to stick to diplomacy.
Jo Boost, Midlands 16 hours ago
This situation is not that simple.
There is not -as people in Washington who know better have told for years now- one big bad
wolf called Assad preying and devouring all poor little peaceful lambs (who, accidentally, have
been armed to their teeth by a certain Ms. Clinton and her Saudi friends - even with poison gas
which was, then, blamed on the said Assad).
We have here a follow-up civil war to the (also US started) one in Libya.
Let us just look at International Law, as understood since the Nuremberg Trials:
We all know now that the invasion of Iraq by Mr. Bush junior was a) a mistake, and b) a
War Crime - there were no threatening WMDs nor did Saddam hold hads with Al Quaeda (he was, actually,
their worst enemy - and our security!), so, Iraq was c) total stupidity. It was an aggressive
war without any cause - for the USA!
But a great cause for Saudi "Royals" whose cousins had been thrown out of Iraq, which is good
enough cause, in Arab customs, for a bloody feud and revenge.
The same applies to Syria, and could one, therefore, still wonder why ISIL was so well equipped
for the follow-up (envisaged) invasion?
Libya was a danger for Saudi Autocrates, because a secular Arab country with such a living
standard from fair distribution of oil wealth would be a dangerous advertisement for a Mother
of All Arab Springs in the desert.
So, we have one side with interest - and one without any - but the latter does the dirty work.
Is there more than one tail that wags the US dog?
Bonnie Rothman, NYC 13 hours ago
How brilliant---not! And what do these 50 people expect to happen if and when Assad falls,
chaos prevails and ISIS rushes in? Not to mention the immediate nasty confrontation with Putin.
This isn't 1941 and big Armies and big bombs are useless, USELESS against ISIS which operates
like cancer cells in the human body. And the last time we toppled a tyrant we midwived the ISIS
group which is funded by the Saudis which is funded by our own use of oil. Don't you dopes ever
read history and see the "whole" problem? Sheesh.
Prof. Jai Prakash Sharma, is a trusted commenter Jaipur, India. 16 hours ago
Given the complexity of the Syrian crisis and the multipower stakes involved in Syria, it would
be foolish for the US to direct its unilateral military fury at toppling the Assad regime ignoring
its fall out and the military financial cost to the US itself, specially when except for meeting
the common challenge and threat of the ISIS no direct national interests are at stake for the
US in Syria. The state department's dissenting memo to the President seems an attempt by the vested
interests to further complicate President Obama's Middle East policy that's on the right track
following the Iran deal.
Dennis Sullivan, NYC 16 hours ago
This is much more about what Mark Landler thinks than about what those generic diplomats
think. The Times's principal hawk, Landler has book and a series of articles pushing his neocon
view. I guess we should assume the Times agrees.
Rudolf, New York 7 hours ago
Having spent substantial time as a private consultant at the US Embassy in Kabul I was
shocked by the lack of feelings of midlevel officials there with regard to the dead and injuries
of American Troops. The Embassy shared a wall with the ISAF/NATO Main Quarters and every single
day the US Flag there was half-mast to acknowledge the dead of our troops on that day in that
country. The Embassy never shared this sadness and all midlevel officials there were only concerned
about their paycheck, quality of meals served, having a drink, going for a swim, and their frequent
trips back to the US; for such people wanting to have a say in when to fight in Syria is a sad
state of affair.
pat knapp, milwaukee 16 hours ago
Perhaps we should figure out one take-down before we move on to the next. After 13 years,
we still haven't figured out life in Iraq without Saddam. Any thoughts, neocons, on what might
happen after Assad is disposed of? You know, the hard part, what follows?
Mike Edwards, Providence, RI 16 hours ago
In what way do the views of the State Department officials in ISIS differ from those in the
US State Department who signed this memo?
Recent terrorist attacks in France and the US have been inspired by ISIS, not Mr. Assad. ISIS
is our enemy right now. Let Mr. Assad do what he can to eliminate them.
And haven't we learnt that the removal of a head of State, be it in Iraq, Afghanistan or Libya
does not lead to an improvement; it actually causes an outright deterioration.
Finally, please let's also do away with this twaddle about "moderate" forces being present
in the Middle East, ready to enact our fantasy of what a peaceful Middle East should be like.
They don't exist in the Middle East. Ask the Israelis. Those moderates that do exist seem to serve
one purpose, which is to hand over the weapons supplied to them by the West to the terrorists.
I wish the signatories would have had the guts to spell it out. The Middle East is home to
a number of weal nations, a situation the stronger ones don't wish to correct. The only solution
would be for the West to take over the running of those countries and provide for their policing
and defense, as once the West leaves, a vacuum is created allowing terrorist groups to proliferate.
I doubt there is any appetite in the West for such a cause.
Donald, Yonkers 16 hours ago
Interesting how these " moderate" Syrian rebels so often fight alongside al Nusra.
The death toll in Syria is as high as it is because the rebels have outside help, Somehow no
one in the American mainstream, including the NYT, ever points this out. Incidently, note how
the NYT always uses the largest estimates for the death toll-- quite different from what they
did in Iraq.
Nick Metrowsky, is a trusted commenter Longmont, Colorado 17 hours ago
Get Rid of Assad, make relations with Russia worse (they back Assad) and allow ISIS to
effectively take over Syria. Sounds like a great plan. I guess our military-industrial complex
is getting itchy for a new war. And, of course, doing what these diplomats want will also result
in putting boots on the ground. This will be a great legacy for Ms. Clinton (under her watch ISIS
came into being), Mr. Kerry (who continued Clinton's failed legacy) and Mr. Obama (the Nobel Peace
Prize president; who wasn't).
So, guess what? The US starts bombing Syria, Assad will use human shields. ISIS is already
using human shields. So, the US will have more innocent blood on their hands. Of course, the US
follows through with these diplomats idea, ISIS, and their allies, will increase the risk of terrorism
attacks in the US. More mass shootings and bombings.
Of course, in an election year, the political rhetoric will be pushed up a notch between the
two wonderful people now running for president. Both who are more than willing to love the diplomat's
idea to show they are "strong". Mr. Obama may or may not follow through, but he hand may be forced.
Clinton or Trump will go after him, as both would pull the trigger first and ask questions later.
But, rest assured,. if you feel that a terrorist is lurking around each corner now, just wait
until the US decides that getting in the middle of the Syrian civil war is some warped good idea.
Diplomacy can be messy, as can politics.
Dan Stewart, NYC 16 hours ago
The signers of the dissent letter are militarist neocons (of the Victoria Nuland ilk).
More than any other, these people and their CIA collaborators are responsible for the death and
destruction in Syria and the ensuing refugee crisis. They can't even give a cogent reason for
deposing Assad other than point to the carnage of the civil war they fomented-as if Assad were
solely responsible. Assad is acting no differently than the US did during it's own Civil War.
For five years the US has been promoting Muslim extremists in Syria that move with fluidity
between the ranks of ISIL, al Nusra, al Qeada, etc. There are no reliable "moderates" in Syria.
The best hope for a stable Syria lies only with Bashar Assad, the secular Western-trained optometrist
(and his J.P. Morgan investment banker wife, Asma), who has kept Syria stable and free of terrorists
for decades.
To end the killing in Syria, and to defeat ISIL, the US should immediately stop arming and
funding the Islamic jihadists trying to overthrow the Assad government and join with Russia to
support Assad's military in regaining control over all Syrian territory and borders.
CT View, CT 17 hours ago
The value of the memo can be summed up in one sentence as described in the article itself
"what would happen in the event that Mr. Assad was forced from power - a scenario that the draft
memo does not address."
Why on earth would we support deposing a secular dictator who has multi-ethnic multi-religious
support in favor of a non-secular/ie religious leadership that has no moderates...remember we
tried to train vetted moderates, we found about 2 dozen and gave up on the program after half
were killed and the rest defected to the radicals WITH THE WEAPONS WE SUPPLIED. Perhaps, since
the military is anti-intervention and these diplomats are pro-intervention, the diplomats can
take the front line...would that change their opinion?
Gimme Shelter, 123 Happy Street 17 hours ago
I wonder about the arrogance of these mid-level State Department foreign service officers.
Do they think the National Security Council hasn't considered all options with respect to the
use of air power to affect the political situation in Syria? Do they think the President is unaware
of the what is required to stem the humanitarian crisis? How certain are they that their recommendations
will lead to their desired outcome? Do they not realize their actions undermine the commander
in chief in effectively addressing these issues?
Sure -- a few well-placed cruise missiles will make it all good. Yeah, right.
Wayne, Lake Conroe, Tx 7 hours ago
Absolutely amazing. My first question is who released this memo? Having a back channel
does not permit anyone to unilaterally decide to release information that could cost lives and
ruin negotiations that the releasing person knows nothing about. If you do not like the chain
of command, then leave. We cannot continue to be involved in sectarian conflicts that cannot be
resolved except by the combatants. Haven't we learned anything from Iraq, Afghanistan, Lebanon,
and Vietnam? No neocon insanity. We have lost enough lives and treasure in the ME.
Chagrined, La Jolla, CA 10 hours ago
Are these the same ingrates who urged Bush to attack Iraq - his legacy - ISIS!
Real Americans don't want any more squandered blood and treasure in wars in the Middle East!
It is sad that our tax dollars pay the salaries for these insidious State Department war mongering
fools. How many neocons are among them?
The war in Syria is tragic as was the war in Iraq. Even more tragic would be more squandered
American blood and treasure.
Fifteen hundred American Jews joined the IDF terrorists to commit the "Gaza Genocide." Perhaps
they will volunteer to go to Syria.??
President Obama has the intellect, sophistication and morals not to repeat the mistakes of
the Bush administration. These State Department rank and file are obviously attempting to undermine
him just as many members of congress attempted to undermine him by supporting Netanyahu and Israel
during the Iran Diplomacy debate. Betraying America has become sport for so many insidious ingrates.
America deserves better!
xtian, Tallahassee 11 hours ago
As a 26 year Marine Corps combat veteran I have a hard time trying to figure out what is
going on here, and a harder time not becoming totally disgusted with our State Department.
So these 51 mid-level diplomates want to bomb a bit more, and that is going to do what?????
And how will that bring peace to that region of the world? Oh, and by the way, the Department
of Defense is not in agreement with that course of action. How wonderful.
My suggestion would be that we arm these 51 individuals, given them a week's worth of ammunition
and rations, and drop them into Syria, I am sure they can lead the way in showing us how to solve
the mess in the ME.
David Henry, Concord 17 hours ago
War is easy to do. Ask "W."
Lives matter! These "diplomats" should be fired.
Yinka Martins, New York, NY 17 hours ago
It's the fact that these are not "widely known names" which scares me most. However, Western-instituted
regime change in that region has proven disastrous in every single country it has been tried.
If possible, I would investigate these diplomats' ties to defense contractors.
PKJharkhand, Australia 7 hours ago
US intervention created the rubble and hell that is now Syria. When Assad had full control
of Syria, the human rights of the people of Syria suffered under him but many if not most people
led a civilised life. They had water and electricity. Past US interventions created Afghanistan,
Iraq, and Libya. To puy it simply, life expectancy in all these countries dropped by 20 to 30
years after the US intervened, each time with the highest utopian ideals, and increased the power
of Sunni supremacists after each act.
Jai Goodman, SF Bay Area 7 hours ago
These "diplomats" should instead be urging US to pressure Turkey and Saudi to stop supporting
terrorists in the region. Both Al Nusra and ISIS. That'll be the right step.
Thank you.
cml, pittsburgh, pa 10 hours ago
How many of these are the same (or same sort) of "wise" men that advised ignoring our weapon's
inspectors and invading Iraq? They're living inside an echo chamber. In a world of imperfect choices
I would prefer Assad to the Nusra Front or ISIL, as apparently our president does as well.
Lawrence, Washington D.C. 15 hours ago
How many of those 51 diplomats haves served in front line units and seen combat? How many have
their children in uniform? They wouldn't allow it.
Each bombing mission costs more than a million dollars, and we live in a nation of Chiraq and
Orlando.
We have more pressing needs at home, and you can't fix stupid mixed with superstition, topped
with hatred.
These diplomats want to continue to strap suicide vests on the rest of us, while they sip champagne.
Out now, no more of our children wasted for corporate profits.
John, San Francisco 15 hours ago
50 employees? There are approximately 24,000 employees in the state department. That's 0.002833%.
Not really a significant voice. Don't listen.
Vanessa Hall, is a trusted commenter Millersburg MO 13 hours ago
Reminds me of those 47 idiots in the House who signed on to the warmonger Tom Cotton's treasonous
letter.
John Townsend, Mexico 15 hours ago
Let's not forget that Bush's hasty appointment of Paul Bremer as the hapless Governor of
Iraq following the defeat of Hussein's military regime led immediately to the disbanding of the
entire Iraqi military, an incredibly short-sighted and reckless move that essentially unleashed
400,000 young trained fighters (including a honed officers corps) absent support programs to assimilate
back into Iraqi society, only to have them emerge as readily available fodder essential for ISIS's
marshalling a strong military force almost overnight. A huge price is now being exacted for this
astounding stupidity.
Hobart, Los Angeles, CA 7 hours ago
This is conveniently laying grounds for Hillary's grand comeback to the theatre of "humanitarian
interventionism" in the Middle East. God help us all, as this is a prelude to the WW3.
rice pritchard, nashville, tennessee 12 hours ago
Wow the neo-cons are beating the war drums yet again! They have already created a huge
mess throughout the Middle East with wars and revolutions directly attributable to the United
States in invading Afghanistan and Iraq under false pretenses, helping overthrow the government
in Libya, and arming rebels in Syria and Yemen. Apparently no regime that does not knuckle
under to the U.S. war machine is "fair game". This turmoil is sending millions of refugees fleeing
their homeland, many trying to swamp Europe, but the arm chair warriors in the diplomatic corps,
Congress, Wall Street, and the military contractors still cry for more intervention, more bombing,
more blockades, more invasions, etc.! Sheer madness! The more America meddle in the Middle East
the worse things become and unrest and fighting spread. Unfortunately if Hillary Clinton wins,
she is a neo-con puppet and we will be at war in Syria and/or Iran within a year or two. God help
us!
xmas, Delaware 13 hours ago
HOW MUCH WILL THIS COST????? When people demand an invasion of a foreign country, can they
please add the total cost of the bill to their request? Instead of saying "we need to invade,"
can they say, "I want your support to spend $1.7 trillion for invading this other country for
humanitarian reasons. Oh, by the way, sorry, about all the cuts to domestic spending. We just
don't have the money." We spent $1.7 TRILLION on Iraq. $1.7 TRILLION. I can think of several things
I would have preferred to spend a fraction of that on. I'm sure you can too.
Robert G. McKee, Lindenhurst, NY 12 hours ago
This is a very interesting development within the walls of the State Department. There seems
to be much enthusiasm for escalating war in the Middle East. My only question is does this enthusiasm
extend to the deaths and maiming of these same State Department officials' children and grandchildren?
Or do they propose that other people's children should die pursuing their high ideals in this
endless and fruitless religious civil war in Syria?
Kathy, Flemington, NJ 13 hours ago
First of all, if this was a channel for employees to share "candidly and privately" about
policy concerns, why is it on the front page of the NY Times? Additionally, as usual, it seems
the war hawks are hawking war without thought for what comes next. We've done this most recently
in Iraq, Afghanistan, and Libya, all of which are now failed states and havens for terrorists.
Because this seems rather obvious, either we are pathologically incapable of learning from past
mistakes, or there are people who have an agenda different from the publicly stated one.
Rebecca Rabinowitz, . 13 hours ago
The U.S. has a lengthy, very sordid history of leaping into the fray in areas such as the
Middle East, Southeast Asia, Central America and Afghanistan, among others - all with catastrophic
results, for which we never seemed to have a credible, well- crafted plan, nor have we ever comprehended
the millennia of internecine tribal hatred and sectarian warfare. We have "been there, done
that" countless times, at the cost of our precious military blood and treasure, and incurring
the enmity of hundreds of millions of people. I empathize with the frustration of these State
Department employees - but apparently, they do not recall our overthrow of the Shah of Iran when
it suited our "cause du jour," or our fraudulent "domino theory" in Vietnam, or the hard reality
that no one has ever successfully invaded or "governed" Afghanistan, not to mention being able
to battle ideology with weapons. The President has already presided over significant mission creep
in the Iraq cesspool left by the Cheney-Bush neo-con crowd. His judicious caution is to be lauded
when it comes to Syria. Are these mid-level State Department employees advocating a war against
Vladimir Putin?
Yngve Frey, Sweden 12 hours ago
I am more scared of US diplomats and politicians than terrorists! Have they learned nothing
from the US efforts to create western style democracy in Afghanistan, Iraq, Libya and Syria (by
supporting separatists att an early stage). The US diplomats proposal would ensure more chaos,
death and prolonged wR. 38 % of the population are Alewits. They will be killed, Christians will
be killed.
The only way will probably be to work with Russia and force other opposition groups to sign
a peace agreement. Then we should arrange an intensive training course for US diplomats as well
as Syrian leaders: "There is no final truth: we have to learn the art of tolerance and accept
to live in a society where people you don't agree with also can live."
"... Note that at $90/b at the wellhead, the average 2014-2015 Bakken well pays out in 27 months. ..."
"... Note that 10,000 wells were drilled over an 8 year period from 2008 to 2016. ..."
"... My scenario has another 14,000 wells drilled over 11 years, possibly too optimistic, but similar to past history. ..."
"... 'Rationing' the remaining affordable oil supply will ONLY work as intended if the entire world does it together and the same time simultaneously and harmoniously.. . Not a snowballs chance of that is there. ..."
"... Usually rationing causes more problems than it solves, it usually is best to let the market handle it, high prices will reduce the quantity that people are able to purchase and behaviors will change. More efficient vehicles, car pooling, use of public transportation where available, etc. ..."
"... In june 2010 the average well production was 145 barrels per day, with a total of 1663 wells. Now the average well production is 94 barrels per day with a total of ten thousand five hundred and six wells. That's a lot of wells. All of them declining from day one. There is an enormous amount of inertia built in into the system now. It will take another ten-, twenty- of even fiftythousand wells to make the red queen recover. She will not. In the mean time companies go broke and the whole thing comes to a grinding halt. ..."
"... Dennis. $75 [is Ok to drill shale well] using cash. How many in the Bakken shale are using cash? Also, $75 assumes service companies continue to agree to low to no profit from services provided. Bakken wells were north of $10 million per in 2011-14. Again, CLR $11 million cash, $7.3 billion debt. WLL over $5 billion debt. HRC is bankrupt. From memory QEP, SM, HES, EOG, MRO, etc. All have billions of debt. PDP PV10 is less than long term debt at current prices. ..."
"... One thing, it appears that only equity markets are open to shale drillers. That, of course, is the best approach IMO. Promoters usually make money if investors pay for the well, regardless of whether the well pays out. Issuing gobs of debt turned out to be a big mistake. Think how much $$ shale could have gotten 2011-14 by just issuing shares. Break even would certainly be less. ..."
"... You think perhaps they drilled the worst spots first, saving the sweet spots for last? No, the sweet spots have already been drilled. Future wells will, almost certainly, produce less oil than those already drilled. Drillers just don't think that way Dennis. They would never save the sweet spots for last. ..."
"... Dennis, in the early days of Bakken fracking the wells had short laterals and fewer fracking stages. They got better with much longer laterals. They also got better at locating the sweet spots. But now the laterals and number of stages has maxed out. And the sweet spots are all drilled up. ..."
"... There is no doubt whatsoever that the very best and most productive wells have already been drilled. ..."
"... Low oil prices are forcing operators to focus drilling activity only in the core areas of the Bakken where wells have the greatest production. As oil prices recover and drilling expands to other areas of the Bakken, those high-producing wells will be declining, Helms said. "It's really kind of doubtful that we're going to make that (2 million barrels per day) because we're drilling everything in the core where the best wells are," he said. ..."
The E&P companies stopped drilling wildcats starting in 2013, and haven't
applied for such a permit for months, I'd suggest that means there are no
undiscovered reserves, all wells are in known areas now.
What do you think will happen to oil prices when oil output decreases?
The scenario is optimistic and assumes high oil prices, note that output
does not start to increase until 2019 in this scenario, when oil prices
have risen to $88/b (2015$).
The high oil price for this model is $116/b in 2016$ which is reached
in late 2020, does that seem unreasonable? The number of wells added is
1800 per year starting in 2021 with a gradual ramp up to that level over
a 2.5 year period from mid 2018 to the end of 2020.
I think it likely that if oil prices rise and remain over $100/b for
a few years that oil output will expand rapidly.
Note that at $90/b at the wellhead, the average 2014-2015 Bakken
well pays out in 27 months.
The net discounted cash flow for that well, a 10% annual discount rate
is $12.6 million with a well cost of about $8.5 million that leaves $4.1
million for profit or to be used to pay interest and debt.
I doubt we will be seeing more oil surpluses in the near future. Perhaps
if people start to move to EVs in 20 years or so we might see demand fall
faster than supply, but it will probably be 30 years or more before we get
there so 2045, beyond the scope of my scenario.
At some point there could be a financial crisis, but I will leave it
to others to predict when that will occur. In that case demand for oil will
fall along with oil prices and supply.
You asked "What do you think will happen to oil prices when oil output
decreases?"
I agree the initial reaction will be higher oil prices, but I don't expect
the stability in high prices, oil markets, and free money that existed in
the last cycle will ever be repeated. And you need those conditions to ramp
up shale again to production levels that can overcome the inertia of decline.
I think the stability expected is the root of our separate views. You
foresee (and hope) for it while I don't see it (but hope for it).
I think the only reason the global economy seemed to be able to afford
$100 oil is because abundant cheap money (from central banks) reduced interest
costs, which were able to help pay for higher energy costs. It bought time,
but I'm still seeing its effects, in the form of activities and businesses
that just aren't productive enough to continue, and shut down, without being
replaced. The effects of the last round of high oil prices are still slowly
but surely creeping around in the US economy.
Sure, oil prices will go back up soon enough. But can they go up and
stay stable at high enough levels to overcome the memories of shale ponzi
financials? And can the rest of the world avoid instability that affects
oil demand and supply for that same period?
Seems unlikely from here.
I'm glad I'm not making your models because I would go nuts trying to
figure out how to build in some of my variables of instability. It can't
be easy or you would have done because I (and others) have suggested it
in recent past.
Thanks for putting some numbers and graphics on these things. We may
not all agree with you, but you sure make us think. Thank you for that.
I don't expect the price will be stable, I don't know how the instability
will manifest.
When you look at my models just imagine the real values will wiggle above
and below the trend line, prices are very hard to predict. Also if we look
at the 36 month centered running average of monthly WTI prices since 1986,
prices look somewhat less volatile. I expect prices will rise to the 80
to 90 dollar range and perhaps stabilize (if we looked at future 36 month
running average). I also don't predict oil prices well so perhaps it will
be $60 to $70/b, in that case there will be less LTO wells drilled, or perhaps
none.
Wouldn't it be a lot more prudent to just ration oil and move to EV's and
renewables as fast as possible?
Putting in another 15,000 wells that are mostly not in sweet spots will
make most of the players even more vulnerable to a downturn in oil prices
than they were the last time.
At high oil prices wells will be drilled. If oil prices stay low because
we move quickly to EVs, the scenario will be incorrect. I would love to
be wrong, unfortunately this is fairly likely to occur. Note that 10,000
wells were drilled over an 8 year period from 2008 to 2016.
My scenario has another 14,000 wells drilled over 11 years, possibly
too optimistic, but similar to past history.
Dennis, I don't see any way that low oil prices can occur again for any
period of time. We are entering the final descent phase of LTO, exports
will be falling worldwide and prices will stay high.
Rationing is just around the corner anyway, so why not be sensible about
it and start it sooner. People can put up with being transport limited or
they can switch to EV's.
15.000 more wells in the Bakken saturate it and there is no more room. End
of story. Probably stop drilling long before that as they will be far off
the sweet spots and profits will not be there, even at high oil prices.
'Rationing' the remaining affordable oil supply will ONLY work as intended
if the entire world does it together and the same time simultaneously and
harmoniously.. . Not a snowballs chance of that is there.
So if say UK and USA ration, all it will do is reduce the price (due
to reduced demand) which will encourage other unconstrained users to increase
their consumption.
In the absence of a One World Govt and its associated Inspired Benevolent
Dictator we are screwed either way. The yeast is running our of sugar, we
are heading down the back of the resource supply curve, and everybody here
knows what a bumpy horrid ride it is going to be.
(That's my cheerful appreciation of our predicament for today! Carry
on!)
When you have a shortfall, rationing what you do have has no effect on world
demand or use. It is merely a way of controlling distribution of product
in hand and product you can get hold of. If you can't get more, how does
that change anything.
Demand reduction will occur as alternatives and lifestyle changes take
over. That is going to happen anyway. Let the ROTFW fight over the last
dribbles if they are stupid.
Usually rationing causes more problems than it solves, it usually
is best to let the market handle it, high prices will reduce the quantity
that people are able to purchase and behaviors will change. More efficient
vehicles, car pooling, use of public transportation where available, etc.
Still, I stick to my model as I have been doing for 29 months now. Especially
because price is not a parameter in the model. In june 2010 the average well production was 145 barrels per day, with
a total of 1663 wells. Now the average well production is 94 barrels per
day with a total of ten thousand five hundred and six wells. That's a lot
of wells. All of them declining from day one. There is an enormous amount
of inertia built in into the system now. It will take another ten-, twenty-
of even fiftythousand wells to make the red queen recover. She will not.
In the mean time companies go broke and the whole thing comes to a grinding
halt.
That's my take on it.
I like your analyses and, subject to unexpected crises, suspect you've
pretty well nailed it. Of course, expired (and expiring) hedges will serve
to exacerbate decline as well.
The average Bakken well pays back drilling and completion costs in 60
months at about $75/b. The resources are there, if oil prices are high enough
the oil will be recovered. the F50 technically recoverable resources are
about 11 Gb based on USGS estimates and the F95 estimate is about 8 Gb.
I will go with the USGS and the likelihood that as oil output decreases
oil prices will increase.
"The average Bakken well pays back drilling and completion costs in 60 months
at about $75/b."
That is impossible to happen in short term because business cycle (real
economy) has to grow at least the same rate or higher then finance cycle
of shale drillers (money that shale borrowed) and that went exponential
in the last 8 years.
-We can say that about your chart, but for Dennis' there is nothing to
tell!
The curbs on that chart cannot coexist together mathematically.
Whether one believes that projections for 2020, 2030 or 2040 and beyond
shall materialize, or not is besides the point – we can argue that forever
(as we have been).
-Dennis' chart cannot be, both logically and mathematically.
Unless one believes that they used the wrong narrow pipes from 2010 to
2015 and the large correct ones from 2020-2025 to get the oil out of the
ground (I am joking, of course!), for that chart to make sense, either production
curb 2020-2025 has to come down below the level of that 2014-2015, or the
line representing wells during 2020-2025 has to be way above the level of
that representing wells from 2012-2015…or both.
Or, here's a third " bright" scenario for you:
one has to believe that some very advanced (not known today) way of fracking
will exist by 2020 in order to "squeeze" far more oil than we do today from
a, by then – for all practical intents and purposes – totally exhausted
oil field (i.e.: Bakken, circa 2025).
I am surprised some of you "well versed on charts guys" did not see that.
The output has decreased because fewer wells have been added each month,
if the number of wells completed per month increases, output also increases.
Do you see a logical reason that the number of wells completed per month
cannot increase if oil prices increase to a level which makes wells profitable?
Shallow sand has shown very clearly that $75/b is enough to make an average
Bakken well profitable.
Also my scenario has 8 Gb from 24,000 wells, and average EUR per well
of about 330 kb. The average well from 2008 to 2015 gas a well profile with
a URR of about 350 kb.
The model is very straightforward, but could overestimate the well profile
for recent wells.
We do not know what the wells will produce in the future,
I have estimated future well output on the performance of past wells,
future well could be worse (or better than I have estimated). The scenario
below assumes higher oil prices ($154/b) and fewer wells added per month
(a maximum of 130 new wells per month), a more conservative well profile
for 2015 and later is used (EUR=369 kb), ERR is 8.5 Gb with 33,000 total
wells completed. That is fairly close to the USGS F95 estimate.
Dennis. $75 [is Ok to drill shale well] using cash. How many in the
Bakken shale are using cash? Also, $75 assumes service companies continue
to agree to low to no profit from services provided. Bakken wells were north
of $10 million per in 2011-14. Again, CLR $11 million cash, $7.3 billion
debt. WLL over $5 billion debt. HRC is bankrupt. From memory QEP, SM, HES,
EOG, MRO, etc. All have billions of debt. PDP PV10 is less than long term
debt at current prices.
One thing, it appears that only equity markets are open to shale
drillers. That, of course, is the best approach IMO. Promoters usually make
money if investors pay for the well, regardless of whether the well pays
out. Issuing gobs of debt turned out to be a big mistake. Think how much
$$ shale could have gotten 2011-14 by just issuing shares. Break even would
certainly be less.
I have estimated future well output on the performance of past wells,
future well could be worse (or better than I have estimated).
They could be better? Really? You think perhaps they drilled the
worst spots first, saving the sweet spots for last? No, the sweet spots
have already been drilled. Future wells will, almost certainly, produce
less oil than those already drilled. Drillers just don't think that way
Dennis. They would never save the sweet spots for last.
My projection of future output from recent wells has much steeper decline
than older wells, so I could have overestimated or underestimated what the
future output will be from a well that was drilled in 2015.
In 2005 to 2007 the EUR of the average well was much lower than 2008
to 2013, so it is possible that improved techniques might increase output,
the first 12 months of output was higher in 2013 wells and 2014 wells than
the earlier 2008 to 2012 average well. At some point this will reverse and
my model has new well EUR decreasing after June 2018, this guess could be
too early or too late.
So basically I am not assuming anyone is saving the sweet spots, just
that my estimate could be low or high, we won't know until we have more
data.
Dennis, in the early days of Bakken fracking the wells had short laterals
and fewer fracking stages. They got better with much longer laterals. They
also got better at locating the sweet spots. But now the laterals and number
of stages has maxed out. And the sweet spots are all drilled up.
There is no doubt whatsoever that the very best and most productive
wells have already been drilled.
I will wait for the data that confirms you are correct. So far the productivity
of the average well for the first 12 months of output has been increasing,
later months we can only guess at for the wells that were recently drilled
(wells starting production after May 2015 we don't have data for production
beyond month 12).
I thought we would see new well EUR decreasing by 2014, so far the data
shows little evidence of that.
Low oil prices are forcing operators to focus drilling activity only
in the core areas of the Bakken where wells have the greatest production.
As oil prices recover and drilling expands to other areas of the Bakken,
those high-producing wells will be declining, Helms said.
"It's really kind of doubtful that we're going to make that (2 million
barrels per day) because we're drilling everything in the core where the
best wells are," he said.
He said he thinks North Dakota production will eventually reach 1.8 million
barrels per day. I wonder if he said that with a straight face, especially
after just admitting that all the good spots will soon be gone.
I repeat, I do not expect the well profile will increase. When I said
it may be better or worse than my estimate of the well profile, it
simply means that we do not know what the well profile is, we have to estimate
and sometimes the "best guess" is too high and other times it is too low,
just like any other guess.
When you make an estimate is it always too high? My estimates may be
different, about half the time they are too high, and the other half they
are too low. :)
That is all that I meant.
Also, my "funny model" uses exactly the same well profile that I have
been using since Enno suggested I should correct my model because it consistently
was under predicting Bakken output.
Maybe new well EUR will start to decrease sooner than I have predicted
(June 2018), but with only 980 new wells completed in the model over a 28
month period and that for the past 2 years the well profile has been increasing,
I think the June 2018 guess is reasonable.
The eventual number of wells was 150 per month which is 21% less than
the high 12 month rate of 186 wells per month, only 80 wells per month are
needed for 1000 kb/d with the current well profile.
If i understand Verwimp's chart correctly, he started it when the price
of oil was over 100. So Verwimp, did you know something the rest of us didn't
or was this just a good educated guess.
At any rate your chart has nailed it to date. Congrats.
You do understand correctly. The model was built before the price collapse.
It's a Hubbert analysis basically. The dataset prior to the moment the model
was built was a Hubbert poster child and it still is. When linearised according
to Hubbert Linearisation, the data is still a straight line. There is no
drop in that line. A sudden policy change coinciding with lower prices would
have generated a drop in that line. That would also be visible in the change
in daily oil shifting away from the first derivative of the model. Both
are not occuring. So the only resulting conclusion is: ND Bakken is running
out of oil, despite the high USGS EUR estimate.
I may stand corrected in the future. If prices rise and production rises
again, I missed something. Until now (today's WTI prices are almost double
the WTI price in Februari -- ) that is not the case, as you can see.
A Hubbert analysis only makes sense when a lot of data on the upgoing side
of the curve already exists. 10 years ago there was virtually no LTO. So
no Hubbert analysis could have been made.
No, it wasn't a guess. It's just the nature of things that what goes up
must come down. The Hubbert analysis provides a tool to calculate the altitude
and the timing of the top, as well as the steepness of the decline. These
calculations are more accurate when the top is closer by (or past). Apparently
29 months after the calculations were done, the reality is still in line
with the modelled curve.
(I also added a seasonal correction to the Hubbert Curve, that as proven
to be pretty accurate, but that is a minor feature of the curve compared
to the underlying Hybbert Curve.)
The only guess was that ND Bakken would stay being the Hubbert poster
child it was prior to the calculations. Apparently it still is. That guess
was based on the fact Lower48 and Alaska production are also pretty Hubbert-like
curves, just like earlier smaller booms in North Dakota. It's in the 'genes'
of Americans, I presume, to go for it as soon as possible, as hard as possible
and as fast as possible when it comes to earn money extracting a resource,
until the show is over. A Hubbert curve is the result then…
"... The current cycle lasts roughly two times longer than the cycle in 2008/9. As the oil price recovers much slower this time (green line in below chart), drilling (red line in below chart) responds accordingly much slower. ..."
"... This article suggests in a review of the main US producers a reduction of natgas (-40 Tcf) and oil (-4 bn barrels) reserves at a gigantic proportion. Reserve replacement stands at up to – 200% which results in a significant reserve reduction and reserve life stands at a little bit more than 10 years for gas and oil. As companies have reduced drilling furthermore this year, more reserve and production reductions are likely in 2016. ..."
"... The good news is that in mid 2017 oil prices are very likely to increase substantially. So, if investors are patient, this patience will be rewarded. ..."
FED total US production data for May are out, basically confirming the trend for Bakken.
The current cycle lasts roughly two times longer than the cycle in 2008/9. As the oil price
recovers much slower this time (green line in below chart), drilling (red line in below chart)
responds accordingly much slower. As a consequence the production decline is much steeper than
in previous cycles (blue line in below chart) and stands currently at – 8% year over year and
-2% per month. Given the slow drilling and price recovery, US total production will very likely
not recover until mid 2017. At a monthly decline rate of – 2%, my goal of -30% US total oil production
decline looks more and more realistic.
This article suggests in a review of the main US producers a reduction of natgas (-40 Tcf)
and oil (-4 bn barrels) reserves at a gigantic proportion. Reserve replacement stands at up to
– 200% which results in a significant reserve reduction and reserve life stands at a little bit
more than 10 years for gas and oil. As companies have reduced drilling furthermore this year,
more reserve and production reductions are likely in 2016.
The good news is that in mid 2017 oil prices are very likely to increase substantially. So,
if investors are patient, this patience will be rewarded.
US oil production in 2020 to 2025 will depend in my opinion on how much oil prices will recover
in 2017/2018. Lower US production in 2016/2017 will result in a lower US dollar and speed up oil
demand. This is a catapult effect which can drive oil prices and the USD to extreme levels in
2018.
This could increase US production again in a very short time. However, it will very likely
not reach the level of last year.
"... So, if one says such well's EUR is 750,000 BO, shouldn't they also be required to disclose that will take around 75 years to achieve? What is the PV10 of oil produced in years 20-75? ..."
"... Wonder how much reserves will have to be written down? This is such a joke. ..."
"... Dennis. You note that you guess the 10K estimates differ from the investor presentation estimates. Seems like if companies would provide us with the reserves reports themselves, it might help see if your guess is correct? Also seems claiming roughly double is a little too much to take care of with a mere disclaimer? I wish the SEC letters to companies requesting them to restate reserves would be made public immediately. We are just now finding out about many of these, after the companies have already BK. ..."
"... We do a regular chart showing gains in average cumulative production month by month benchmarked to 2010. It clearly shows steeper decline rates for wells with higher early production. 2013 wells were 10% or more above 2010's cumulative production in month 6 – by month 33 they are just 2.5% above 2010's cumulative production. 2015 wells were 31% above 2010's cumulative production in month 7 – they are now in month 17 and are 20% above, and falling. ..."
Wonder if the SEC should take this data and analyze company EUR projections?
It seems 2008 had strong wells. After 100 months, average well has produced 260,210 BO per
Enno's data.
So, if one says such well's EUR is 750,000 BO, shouldn't they also be required to disclose
that will take around 75 years to achieve? What is the PV10 of oil produced in years 20-75?
Wonder how much reserves will have to be written down? This is such a joke.
My guess is that the reserves in the 10K are very different from investor presentations where
there are disclaimers that say, essentially, that they stretch the truth.
So a "typical well" in an investor presentation is not an "average well".
In North Dakota at the end of 2014 proved reserves were 6 Gb in the Bakken Three/Forks and
1.2 Gb of C+C had been produced to that date.
A very conservative URR projection would be 7.2 Gb, if probable reserves were included (another
3 Gb would be a conservative estimate), then URR might be as high as 10.2 Gb if oil prices rise
to 2014 levels or higher in the future.
I use a well profile with 400 kb of C+C output, 266.6 kb are produced in the first 5 years,
output falls to 10 b/d in 19.4 years. I also assume the sweet spots get saturated with wells by
June 2018 and EUR starts to decrease. The rate of decrease in new well EUR gradually increases
over 12 months reaching a maximum rate of 7% per year by June 2019, by June 2025 the new well
EUR falls to 250 kb (166 kb at 5 years), and to 127 kb by August 2036 when wells are no longer
added to the ND Bakken/TF (at a total of 36,250 wells). Thus model assumes oil prices rise to
$154/b in 2016$ and remain at that level until 2033.
Dennis. You note that you guess the 10K estimates differ from the investor presentation estimates.
Seems like if companies would provide us with the reserves reports themselves, it might help
see if your guess is correct? Also seems claiming roughly double is a little too much to take care of with a mere disclaimer?
I wish the SEC letters to companies requesting them to restate reserves would be made public
immediately. We are just now finding out about many of these, after the companies have already
BK.
Aren't the reserves reported in the 10K checked by outside accounting firms? You are no doubt
correct that some reserves will no longer be profitable to developed at current oil price levels.
I imagine this will change when oil prices increase.
The oil is there, but it requires higher prices.
Eventually the debt will be paid, or companies will go under.
We do a regular chart showing gains in average cumulative production month by month benchmarked
to 2010. It clearly shows steeper decline rates for wells with higher early production. 2013 wells
were 10% or more above 2010's cumulative production in month 6 – by month 33 they are just 2.5%
above 2010's cumulative production. 2015 wells were 31% above 2010's cumulative production in
month 7 – they are now in month 17 and are 20% above, and falling.
"... While oil prices will definitely reach $60 at some point and shale is still doomed at the current price range, there are some contrarian tendencies visible now. If the world economy slows down considerably the rise of oil prices will slow down even more. Let's hope for the best and prepare for the worst. ..."
I remember Lynn Helms predicting a sharp drop in production for March.
In fact, in March Bakken output declined only 8 kb/d, but was down 69 kb/d in April.
April number for ND Bakken is down 6.6% vs. March, 10.9% vs. April 2015 and 15.2% (176 kb/d)
from the peak reached in December 2014.
Average output for January-April 2016 is 1044 kb/d, down 6.9% year-on-year.
As CLR's Harold Hamm and several other E&P CEOs are saying, $50 is a trigger for increased
completion of the DUCs.
Rig count has also bottomed, but significant increase in drilling activity is unlikely until WTI
reaches $60.
Nonetheless, it seems that we will see further declines in LTO output in the next several months
due to delayed impact of low oil prices.
While oil prices will definitely reach $60 at some point and shale is still doomed at the current
price range, there are some contrarian tendencies visible now. If the world economy slows down
considerably the rise of oil prices will slow down even more. Let's hope for the best and prepare
for the worst.
Goldman Sachs has dismissed what's
been described by some analysts as a recovery in the global oil markets.
The uber bear said it expects a "modest" deficit in the coming months due to current prices,
before the market returns to surplus early next year.
Rising demand, falling US oil output as well as supply disruptions have helped the black
stuff recover from below $28 per barrel in January to just under $50 today.
Read more: North Sea to warn MPs subsea sector risks losing world-leading position
But Damien Courvalin, an analyst at Goldman Sachs, said that this was, at best, the first
signs of a turnaround.
"Canadian production is finally restarting, production from other Organisation of Petroleum
Exporting Countries' members continues to beat our expectations."
Courvalin continued: "The recent recovery in prices risks that non-Opec production declines
less than we expect, especially in the US."
What is it they say? A sucker is born every day? This should be illegal!
texas tea, 06/15/2016 at 3:16 pm
as to GS public statements relating to oil and gold, the money has been by taking the other
side of the trade, I have little doubt that what their trading desk does.
Until the capital markets open up and allow U.S. oil companies to spend outside of their cash flow,
production will not increase and crude prices will continue to rise, Tapstone Energy CEO Tom Ward
said Thursday.
"There's no increase in the capital spending, the debt side of the business is closed, and so
until we have something fairly dramatic happen like maybe a doubling of the rig count, I don't think
we can grow production in the U.S.," he said in an interview with CNBC's "Power
Lunch."
Therefore, "I wouldn't be surprised at all if we saw above $60 or even $70 [a barrel] by the end
of the year," added Ward, the co-founder of
Chesapeake Energy.
Tapstone Energy currently has three rigs online, down from four, and Ward said there are no plans
to add more rigs. It's the same across the industry, he said, because of
the lack of access to capital markets.
"I think prices will have to move up even higher than we're talking about for there to be a big
change in the rig count," said Ward. "We can't change the decline of the oil production in the United
States without more capital, and right now that's just not available."
That said, as soon as funds open up, Ward plans to start spending.
"We will spend whatever you give us. As long as there is money to be had through the capital markets,
then we'll use that to grow production, because that's what we're paid for."
"... The production drop is 100% DEPLETION of existing wells. This is a critical distinction because if wells were shut, they could be turned back on. If wells deplete, generally, new ones must be drilled to replacement them, ..."
"... The reality is that the only way this production comes back (or stops decreasing) is the application of massive amounts of new capital, the redeployment of tens of thousands of service workers laid off during the crash, and billions of dollars of equipment. This is even more true internationally. As large mature projects deplete, of which there are thousands in decline, new large projects must be developed to replace them. ..."
"... The typical approach would be to shut in low rate high water cut producers, and any other wells that have been experiencing high costs. When prices rise and wells have been shut in for months they will have built up some pressure. And some of them will come in at 100 % water due to self injection. It can be a real crap shoot. ..."
Just a note to correct a popular misconception; production DID NOT drop in Bakken due to SHUT
IN wells. The production drop is 100% DEPLETION of existing wells. This is a critical distinction
because if wells were shut, they could be turned back on. If wells deplete, generally, new ones
must be drilled to replacement them, implying radically different time, service intensity and
capital requirements. The popular press is ate up with the concept that when prices rise, all
this production will magically reappear, once again swamping the market with excess supplies.
The reality is that the only way this production comes back (or stops decreasing) is the application
of massive amounts of new capital, the redeployment of tens of thousands of service workers laid
off during the crash, and billions of dollars of equipment. This is even more true internationally.
As large mature projects deplete, of which there are thousands in decline, new large projects
must be developed to replace them.
"The production drop is 100% DEPLETION of existing wells. This is a critical distinction because
if wells were shut, they could be turned back on."
Brad,
Yes. So essentially oil price does not matter at this point at the end of the game for these marginal
and high depletion plays. Price could go even higher but drop in production will just continue.
I think it's a mix. I've been in these circumstances before. The typical approach would be to
shut in low rate high water cut producers, and any other wells that have been experiencing high
costs. When prices rise and wells have been shut in for months they will have built up some pressure.
And some of them will come in at 100 % water due to self injection. It can be a real crap shoot.
Looks like State Department became a paradise for neocons. Protest of diplomats is typical trick
used by State Departement during color revolution. That actually means this "color revolution" trick
came to the USA. Our presidents come and go, Republican or Democrat, but our Strangeloves remain permanent
employees of State Department. .
Notable quotes:
"... The State Department and the CIA's 'Plan C' (or are they on 'Plan D' yet?) is an independent Syrian Kurdistan. ..."
"... A desperate attempt to save the rebels, who now hate them and completely understand how they have been thrown under the bus by the State Department neocons. I really don't think the rebels will be the least bit impressed by the phony theatrics of a internal memo by mid-level bureaucrats. ..."
"... The Pentagram is in a bit of a different pickle. They have to do something to stop the Wahhabi head-choppers, but its a bit like herding cats. The best they've come up with is ginning up the SDF to take/hold ISIS territory. But they can't arm the Kurds or Arab members with any REAL weapons because that would anger Turkey. So they give them a bunch of eastern European AKs and a few pickup trucks with anti-aircraft guns, promise air support and toss in a few SF guys ..."
"... The MSM (as CIA lapdogs are paid to do) constantly try to reinforce the message that the independent YPG/YPJ militias are somehow 'the PYD's army'. Nothing is further from the truth - it's all MSM spin to create the impression that the Syrian Kurds uniformly desire the usurped PYD vision of an independent Kurdistan. In reality, the U.S. State Department neocons and the CIA are the ones that want an independent Syrian Kurdistan for their own scheming (and to deny Assad the land/water/oil). The MSM is constantly on message with this to set the narrative to the American public for Syrian partition - most people have no clue. ..."
"... For what it's worth, Assad is keenly aware of his history with the Kurds. Even by Kurdish media reports , he is willing to work with the Syrian Kurds as part of a unified Syrian state. He does not object to Kurdish rights or autonomy, just the U.S. meddling to goad the PYD into creating a separate Kurdish state. ..."
"... The whole Syria nightmare was planned from the US Embassy in Damascus in 2006 because Assad was so broadly popular in the country and "the region." Can't have that so a strategy was drummed up: http://www.globalresearch.ca/syria-and-conspiracy-theories-it-is-a-conspiracy/29596 ..."
"... I'm sure the US will throw the Syrian Kurds "under the bus" when their usefulness is finished. I'm sure also that a lot of Syrian Kurds know this, and are hedging their bets. ..."
"... http://www.globalresearch.ca/france-building-military-bases-in-syria-report/5531259 "The use of proxy forces to destroy the secular government of Syria is now starting to give way to stealth methods of direct ground deployment of Western Special Forces and ground troops under the guise of assistance and coordination with "moderate" terrorists. "With a wide variety of Western-backed terrorist groups ranging from "extremist" terrorists like ISIS, al-Qaeda, and al-Nusra to the "moderate" terrorists of the FSA and the loose collection of terrorists, Kurds, and Arabs like the SDF, the West has a kaleidoscope of proxy forces on the ground already. ..."
"... So Russian peace talks with US evil empire in Syria were a disaster, which makes Putin look like an idiot, as well as the supporters of this idiocy. As well as Russian invitations for the US to join it in Syria makes it one of the most stupidest invitations ever. ..."
"... A preview on America's future strategies? http://www.cnas.org/sites/default/files/publications-pdf/CNASReport-EAP-FINAL.pdf ..."
"... The Iranians have been warring with Kurds by the border with Turkey. Neither the Turks nor the Iranians - nor the Syrians, but they do need the Kurds now - want a Kurdistan. The Kurds must know by now - must have been betrayed enough by now - to know that the US will tell them anything, promise them anything, and deliver nothing but betrayal in the end. ..."
"... As regards the State Department, the Pentagon, the US government ... what's required is a neo-con purge, top to bottom. They are all working against American interests and against the American people. and have been for the past two decades. The likelihood of such a purge is about zero. Neither Trump nor Hillary has the will or the backbone to stand up to anyone. Trump's all mouth and looking out for number one, and Hillary's plugged in to the money-mosaic as well. Obama's getting ready to cash in his chips. ..."
"... I am amazed at your unflagging obsession with holding Putin responsible for the US/UK/EU/NATO/GCC destruction of Syria. You've set him up as your omnipotent god and he's failed you, somehow. Putin, Rusia, is not responsible for the death, devastation, and destruction of Iraq, Syria, Libya or the rest of the middle east or north africa. You're throwing your stones at the wrong guy, at the only guy who's done anything at all to help the Syrians and to forestall the monstrous neo-con plan. ..."
"... Israeli bombed military base in Homs province with impunity from S400 http://www.haaretz.com/israel-news/1.723701 ..."
"... There is more about Russian de-facto acquiescence for Syrian partition and pivot to Israel: STRANGE DAYS: Did Israelis Pivoted to Russia? Or the other way around. https://syrianwarupdate.wordpress.com/ ..."
"... On the bright side, maybe the 50 signatures are just trying to get noticed by the Clinton transition crew. ..."
"... The document you posted is a typical wet dream written by utterly incompetent neocons (Kagan's and Zoellik names are a tell), people who can not and must not be allowed to operate with serious strategic and operational categories in any "advisory" role. ..."
"... i read about 30 of 160 or so comments on this article at NYT. given who the audience of that shit rag is & that comments are vetted, overwhelmingly commenters stated increased military involvement is retarded. ..."
"... How can Russia, which dwarfs Israel in every meaningful category -- from economy to military -- and who does remember her history well can "pivot" to largely regional player -- I don't know. Russian "neocons" are a dramatically different breed than US ones, for starters they are much more educated and, actually, support Assad. Israel's pivot to Russia in some sense is inevitable, albeit it could be fairly protracted, with Russia being observed as honest broker. They are not completely stupid in Israel and are very aware of real situation in American politics, economy and military. ..."
"... I note that the 'moderate' Hillary Clinton is a blood-soaked queen of chaos, who if elected is certain to embroil us in pointless wars and spread death and devastation across even more of the world. ..."
"... Donald Trump is admittedly a gamble, but depute his over-the-top stage persona, his track record is of actually getting along with people and brokering stable working relationships. ..."
"... At this point I wish I could vote for Richard Nixon (!), but we have the choice that we have... ..."
"... This piece out of the NYT is pure propaganda. Period. Here's the big clue - where's the memo? It's not embedded in the article. It can't be found anywhere on the web. It's b/c it doesn't exist. The reader is 'TOLD' by a third party journalist few follow who writes for a MIC/Political/Policy corporate mouthpiece. ..."
"... We see the point of all the saber-rattling by NATO on Russia's borders: to get Putin tied up in a diversionary direct threat to Russia, thereby mitigating or eliminating his efforts in behalf of Assad. And you know what? Americans on the street couldn't care one way or the other what Obama or CIA or DoS does or says about Syria. 280,000 dead, millions displaced and Americans are more concerned by a factor of 1000 about 4 dozen gays in Orlando. ..."
"... Saudi Arabia rejoining Turkey: http://en.farsnews.com/newstext.aspx?nn=13950326000441 ..."
"... These 51 useful idiots are IMO auditioning for the Clinton team while also providing cover for the neo-cons above them like Nuland, Powers, etc. And directionless Kerry says he'll rush home to confer with these idiots rather than dismissing them out of hand. Kerry could only be useful to anyone if Lavrov was in the room with him at all times to keep him in line -- otherwise he reverts to his normal mindless servant of US empire viewpoint, which is to follow whichever way the winds of power are blowing through Washington, DC. ..."
"... Hillary is the neocon's neocon. Pravy Sektor's honorary storm trooper Vicky Nuland is a Hillary protege. NYT has been positioning its readers to embrace Kerry's Plan B for the last month-plus. ..."
"... How many of these diplomats were bribed by Saudi Arabia? ..."
"... This clown Kagan is also the husband of the infamous Victoria Nuland who somehow, defying all logic, still has her job post imbroglio that is the Ukraine today. Hell, she's probably being hailed for that and is an inspiration for lowly State employees. ..."
"... Thank you Victoria, for giving Crimea back to the Russian Federation where it belongs. ..."
"... There are almost exactly 7 months until either Trump or Clinton takes office (presuming that the elites manage to completely control any bad news prior to the Dem nominating convention in late July; if the email dam breaks after that I have no idea what the Dem elites will do, but I figure they won't choose the obviously best candidate against Trump, Bernie). ..."
"... might the West actually directly take on Russia/Syrian government forces? Claiming, of course, some version of R2P ..."
"... State Department Diplomats who have captained failure after failure? If these people were Russian or Chinese they would have been executed for their serial failures in the ME and Afghanistan. The main problem with being 'exceptional' is that the 'exceptional' ones never make a mistake. "War is Peace, Freedom is Slavery, Ignorance is Strength" ..."
"... So I was kind of wondering what psychopathic qualities the U.S. War... er, State Department is looking for in potential parasitic career bureaucrats, and came across this self-promotion page on their site. ..."
"... Counterpunch had a great article: http://www.counterpunch.org/2016/06/17/the-case-for-not-voting-in-defense-of-the-lazy-ungrateful-and-uniformed/ ..."
"... And though the content of the review by Army Gen. John W. Nicholson is secret, the U.S. strategy in Afghanistan received a major incentive this month when President Obama decided to expand America's involvement with more airstrikes against insurgents, giving the U.S. military wider latitude to support Afghan forces, both in the air and on the ground." ..."
"... No respect for R2P warriors at the State Department, nor for HRC, Susan Rice and Samantha Power. ..."
"... For Israel to bomb the Syrian military right under the nose of Russian s-400s? Russia, supposedly so dedicated to defending sovereignty, smiles and yawns benignly? A dirty deal has been made... ..."
"... Saudi Arabia desperately needs battlefield success, or there will be a prince, I mean price, to pay http://www.nbcnews.com/news/world/u-s-officials-fear-saudi-collapse-if-new-prince-fails-n593996 ..."
"... "Earlier this week as America was trying to make sense of the deadliest case of Islamic terrorism on US soil since 9/11, I wrote a detailed article here at Breitbart News that laid out the clear factual case about Hillary Clinton's top assistant Huma Abedin. I showed how she has deep, clear, and inarguable connections to a Saudi Arabian official named Abdul Omar Naseef, a powerful Kingdom insider who has helped lead a group called the Muslim World League. The Muslim World League is the huge "charity" whose goal is to spread Islam throughout the world and which has been connected to terror groups like Al Qaeda. ..."
"... What is Huma's relationship with a Saudi Arabian official named Abdullah Omar Naseef? ..."
"... Was he the founder of a Saudi charity called the Rabita Trust? ..."
"... Right after 9/11, was the Rabita Trust put on a list by the U.S. government of groups that were funding terrorism? ..."
"... the State Department official obviously has an agenda by providing it to the NYT. The NYT has its own agenda filled as well by prominently posting the article on the top of the front page . ..."
"... One senior official said that the test for whether these proposals for more aggressive action are given high-level consideration will be whether they "fall in line with our contention that there is no military solution to the conflict in Syria." ..."
"... It's important for Russia to ensure that the remains of the first "Israeli" jet it shoots down falls to earth inside Syria. If you've seen a story about the IAF doing something courageous it's bullshit. ..."
"... Wonder how many of these 51 war mongers were appointed by Hillary. ..."
"... The EU-Turkey deal's financial package includes one billion euros in humanitarian aid. There are undoubtedly needs in Turkey, a country which currently hosts close to three million Syrian refugees, but this aid has been negotiated as a reward for border control promises, rather than being based solely on needs. This instrumentalisation of humanitarian aid is unacceptable. ..."
"... kreepy kerry is "running out of patience" since his most desired regime change isn't happening fast enough. ..."
"... The difference between Hillary and ISIS: the latter "takes" the head of enemies, Hillary "gives" head to donors. Forgive the graphic. ..."
"... 50 diplomats petition president for war. Was that written by Orwell? ..."
"... Allow me to further my argument against American Exceptionalism. It is not merely the fact that the U.S. is far from exceptional. From education to infant mortality, the U.S. is woefully behind much of the world. ..."
"... So Hillary, the bloodthirsty Goddess of War, is longing for a second Libya, i.e., a Syria smashed to smithereens, in ashes and ruins, ruled by a chaotic bunch of mad Takfiri extremists, at war all against all. ..."
"... The FBI is stonewalling, keeping the contents of Mateen's 911 call unavailable - though it's part of the public record - presumably because it undermines the "ISIS did it" meme poured over the Orlando mass murder. Apparently Mateen may have mentioned ISIS not quite in the same light as has been portrayed. ..."
"... Now the NYTimes/WSJ are doing the same thing with the 50 dancing diplomats. Releasing what they want us to know and redacting what we want to know : the names of those 50 dancing diplomats. ..."
"... I suppose it comes under the CIA's blanket excuse for secrecy? "Methods and means", or whatever their boilerplate. ..."
"... No doubt the State Department dwarves were ginned up by "Cookies" Nuland and Count Kagan by visions of "x memorandum" of 1946 immortality by attacking the resistance to an unipolar hegemony. Mixing it up in Syria with the Russian presence seems civilization limiting at the outer limits of challenge/ response in a military confrontation. ..."
WASHINGTON - More than 50 State Department diplomats have signed an internal memo sharply critical
of the Obama administration's policy in Syria, urging the United States to carry out military
strikes against the government of President Bashar al-Assad to stop its persistent violations
of a cease-fire in the country's five-year-old civil war.
Note that it was Ahrar al Sham, Jabhat al-Nusra and other U.S. paid and supported "moderates"
who on April 9
broke the ceasefire in Syria by attacking government troops south of Aleppo. They have since
continuously bombarded the government held parts of Aleppo which house over 1.5 million civilians
with improvised artillery.
Back to the piece:
The memo, a draft of which was provided to The New York Times by a State Department official
, says American policy has been "overwhelmed" by the unrelenting violence in Syria. It
calls for "a judicious use of stand-off and air weapons, which would undergird
and drive a more focused and hard-nosed U.S.-led diplomatic process."
...
The names on the memo are almost all midlevel officials - many of them career diplomats - who
have been involved in the administration's Syria policy over the last five years, at home or abroad.
They range from a Syria desk officer in the Bureau of Near Eastern Affairs to a former deputy
to the American ambassador in Damascus.
While there are no widely recognized names, higher-level State Department officials are known
to share their concerns. Mr. Kerry himself has pushed for stronger American action
against Syria, in part to force a diplomatic solution on Mr. Assad.
...
The State Department officials insisted in their memo that they were not "advocating for a
slippery slope that ends in a military confrontation with Russia," but rather a credible threat
of military action to keep Mr. Assad in line.
These State Department loons have their ass covered by Secretary of State Kerry. Otherwise they
would (and should) be fired for obvious ignorance. What "judicious" military threat against Russian
S-400 air defense in Syria is credible? Nukes on Moscow (and New York)?
In the memo, the State Department officials argued that military action against Mr. Assad would
help the fight against the Islamic State because it would bolster moderate Sunnis
, who are necessary allies against the group, also known as ISIS or ISIL.
Would these "diplomats" be able to name even one group of "moderate Sunnis" in Syria that is not
on the side of the Syrian government? Are Ahrar al-Sahm and the other U.S. supported groups, who
recently killed
50 civilians out of purely sectarian motives when they stormed the town of Zara, such "moderate
Sunnis"?
These 50 State Department non-diplomats, and the stinking fish head above them, have obviously
failed in their duty:
"Diplomats" urging military action do nothing but confirm that they do not know their job
which is diplomacy, not bombing. They failed.
These "diplomats" do not know or do not want to follow international law. On what legal basis
would the U.S. bomb the Syrian government and its people? They do not name any. There is none.
To what purpose would the Syrian government and the millions of its followers be bombed? Who
but al-Qaeda would follow if the Assad-led government falls? The "diplomats" ignore that obvious
question.
The NYT writer of the piece on the memo demonstrates that he is just as stupid or dishonest as
the State Department dupes by adding this paragraph:
[T]he memo mainly confirms what has been clear for some time: The State Department's rank and
file have chafed at the White House's refusal to be drawn into the conflict in Syria
.
How is spending
over $1 billion a year to hire, train, arm and support "moderate rebels" against the Syrian government
consistent with the claim of a U.S. "refusal to be drawn into the conflict"?
It is obvious and widely documented that the U.S. has been fueling the conflict from the very
beginning throughout five years and continues up to today to
deliver thousands of tons of weapons to the "moderate rebels".
All the above, the "diplomats" letter and the NYT writer lying, is in preparation of an open U.S.
war on Syria under a possible president Hillary Clinton. (Jo Cox, the "humanitarian" British MP who
was murdered yesterday by some neo-nazi, spoke
in support of such a crime.)
The U.S. military
continues to reject an escalation against the Syrian government. Its reasonable question "what
follows after Assad" has never been seriously answered by the war supporters in the CIA and the State
Department.
Unexpected support of the U.S. military's position now
seems to come from the Turkish side. The Erdogan regime finally acknowledges that a Syria under
Assad is more convenient to it than a Kurdish state in north-Syria which the U.S. is currently helping
to establish:
"Assad is, at the end of the day, a killer. He is torturing his own people. We're not going to
change our stance on that," a senior official from the ruling AK Party told Reuters, requesting
anonymity so as to speak more freely.
"But he does not support Kurdish autonomy. We may not like each other, but on that
we're backing the same policy ," he said.
Ankara fears that territorial gains by Kurdish YPG fighters in northern Syria will fuel an
insurgency by the Kurdistan Workers Party (PKK), which has waged an armed struggle in Turkey's
southeast for three decades.
The Turks have suddenly removed their support for their "Turkmen" proxies fighting the Syrian
government in Latakia in north west Syria. Over the last few days the "Turkmen" retreated and the
Syrian army
advanced . It may soon reach the Turkish border. Should the Latakia front calm down the Syrian
army will be able to move several thousand troops from Latakia towards other critical sectors. The
Turkish government, under the new Prime Minister Binali Yildirim, is now also
sending peace signals towards Russia.
The situation in Syria could rapidly change in favor of the Syrian government should Turkey
change its bifurcating policies and continue these moves. Without their Turkish bases and support
the "moderate rebels" would soon be out of supplies and would lack the ability to continue their
fighting. The Russians and their allies should further emphasize the "Kurdish threat" to advance
this Turkish change of mind.
The race to preempt a Hillary administration war on Syria, which the "diplomats" memo prepares
for, is now on. May the not-warmongering side win.
This is the Yankees trying to pretend that they're still exceptionally invincible, in order to
conceal the fact that they never were. One only need look at all the tentative tiptoeing around
China & Russia to see that they're trying to convince themselves that Russia and China are run
by people as loony and disconnected as the self-seducers in charge of AmeriKKKan Foreign Policy.
SmoothieX got it 100% right in the previous thread..
"The names on the memo are almost all medeival offiCIAls ..."
There, fixed it for you. Enjoying the calm before the Goldman Sturm, the takeover of the US
Executive in 2017 for the Final Solution on liberating the Fifth Quintile's Last Free Life Savings,
and plunging the globe into a New Dark Ages: Trump or Clinton, allatime same-same.
The State Department and the CIA's 'Plan C' (or are they on 'Plan D' yet?) is an independent
Syrian Kurdistan.
The FSA Sunnistan plan has been going down the tubes for months. With the imminent fall of
the last few FSA strongholds, the State Department has gone berserk with their latest standoff
bombing memo 'leak' nonsense. A desperate attempt to save the rebels, who now hate them and
completely understand how they have been thrown under the bus by the State Department neocons.
I really don't think the rebels will be the least bit impressed by the phony theatrics of a internal
memo by mid-level bureaucrats.
The Pentagram is in a bit of a different pickle. They have to do something to stop the
Wahhabi head-choppers, but its a bit like herding cats. The best they've come up with is ginning
up the SDF to take/hold ISIS territory. But they can't arm the Kurds or Arab members with any
REAL weapons because that would anger Turkey. So they give them a bunch of eastern European AKs
and a few pickup trucks with anti-aircraft guns, promise air support and toss in a few SF guys.
This almost works, but not completely. For what it's worth, I don't think the Pentagram cares
at all about an independent Syrian Kurdistan, unifying the cantons or who gets what land/resources,
as long as it's taken from ISIS. When ISIS is wiped out, the SDF will cease to exist and
the SF guys will leave. The SDF and especially the YPG/YPJ will NOT ever be incented to provoke
or go to war with Assad after ISIS is gone. That's a problem for the State Department and CIA
The neocon State Department and CIA - normally at odds with the Pentagon's increasing reluctance
to get involved at all - are taking this opportunity to agitate for an independent Kurdistan.
This is done by funding the Kurdish PYD political party which purports to speak for all Kurds.
The State Department and CIA also fund the PYD's growing Asayish thug secret police 'enforcers'.
The PYD took control of Rojava by throwing out all the other political parties last year and crowning
itself the King of all Syrian Kurds. But most Kurds don't trust the PYD, figuring that either
Assad or the U.S. is really pulling the strings. The Kurds agree with the original PYD ideology,
but not its current land/resource-grabbing frenzy NOR the kind of independent Kurdistan the PYD
is suggesting. They want more rights and control of their affairs, but they do not want an actual
or de facto independent Syrian Kurdistan.
The MSM (as CIA lapdogs are paid to do) constantly try to reinforce the message that the
independent YPG/YPJ militias are somehow 'the PYD's army'. Nothing is further from the truth -
it's all MSM spin to create the impression that the Syrian Kurds uniformly desire the usurped
PYD vision of an independent Kurdistan. In reality, the U.S. State Department neocons and the
CIA are the ones that want an independent Syrian Kurdistan for their own scheming (and to deny
Assad the land/water/oil). The MSM is constantly on message with this to set the narrative to
the American public for Syrian partition - most people have no clue.
For what it's worth, Assad is keenly aware of his history with the Kurds. Even by
Kurdish media reports
, he is willing to work with the Syrian Kurds as part of a unified Syrian state. He does not
object to Kurdish rights or autonomy, just the U.S. meddling to goad the PYD into creating a separate
Kurdish state. The U.S. State Department does NOT want Rojava to be part of Syria or the
Syrian State and spins the Assad/Kurd relation as antagonistic in the MSM. This is the 'Plan C'
Syrian partition scheme. Hopefully, the average Kurd can see through their scheming and will not
follow the dictates of a usurped PYD to go to war with Syria for their independence. They would
be better off dumping and outlawing the PYD completely and working with the new Syrian government
on the future AFTER ISIS (and hopefully without any U.S. State Department and CIA).
Your assessment above is a supremely eloquent assessment and a scream for sanity to return.
Thank you so very much for your always illuminating writings.
I think you're quite right. That corresponds with what I've thought for some time. I'm
sure the US will throw the Syrian Kurds "under the bus" when their usefulness is finished. I'm
sure also that a lot of Syrian Kurds know this, and are hedging their bets.
http://www.globalresearch.ca/france-building-military-bases-in-syria-report/5531259 "The
use of proxy forces to destroy the secular government of Syria is now starting to give way to
stealth methods of direct ground deployment of Western Special Forces and ground troops under
the guise of assistance and coordination with "moderate" terrorists. "With a wide variety of Western-backed
terrorist groups ranging from "extremist" terrorists like ISIS, al-Qaeda, and al-Nusra to the
"moderate" terrorists of the FSA and the loose collection of terrorists, Kurds, and Arabs like
the SDF, the West has a kaleidoscope of proxy forces on the ground already.
"Yet, even as Syria's military clashes with the West's proxies, the United States, Britain,
and France have begun moving in Special Forces soldiers to assist in the mission of destroying
the Syrian government, a mission that Israeli, Jordanian, and Turkish officers have joined in
as well. That is, of course, despite the fact that Russian Special Forces are on the ground fighting
on the side of the Syrian military.
"Likewise, both the United States and Russia are busy building military bases in the northern
regions of Syria to use as staging grounds for new operations."
So Russian peace talks with US evil empire in Syria were a disaster, which makes Putin look
like an idiot, as well as the supporters of this idiocy. As well as Russian invitations for the
US to join it in Syria makes it one of the most stupidest invitations ever.
Since B is not mentioning it, he might as well not mention that the French terrorist invaders
along with the already US terrorists, and possibly German invaders will be occupying parts of
Syria.
Oh, but that's alright because Putin invited the evil minions of the Us empire into Syria,
you know, because the bad PR opportunity is a much better outcome then world War three.
The Iranians have been warring with Kurds by the border with Turkey. Neither the Turks nor
the Iranians - nor the Syrians, but they do need the Kurds now - want a Kurdistan. The Kurds must
know by now - must have been betrayed enough by now - to know that the US will tell them anything,
promise them anything, and deliver nothing but betrayal in the end.
As regards the State Department, the Pentagon, the US government ... what's required is
a neo-con purge, top to bottom. They are all working against American interests and against the
American people. and have been for the past two decades. The likelihood of such a purge is about
zero. Neither Trump nor Hillary has the will or the backbone to stand up to anyone. Trump's all
mouth and looking out for number one, and Hillary's plugged in to the money-mosaic as well. Obama's
getting ready to cash in his chips.
It looks to be more of the same, until they really do go after Russia, when it will be all
over for all of us. I can't imagine that they really believe they can get away with this, but
this bunch is all 'mid-level', 'just following orders', it won't be 'their fault' and that's the
level they're working at. The people calling the tune think they can play the real world as they
do their fake financial world, making up new rules as they go along, as they redefine success
after each of their serial failures.
Talk about boiled frogs. How in the hell have we let it get this far?
I am amazed at your unflagging obsession with holding Putin responsible for the US/UK/EU/NATO/GCC
destruction of Syria. You've set him up as your omnipotent god and he's failed you, somehow. Putin,
Rusia, is not responsible for the death, devastation, and destruction of Iraq, Syria, Libya or
the rest of the middle east or north africa. You're throwing your stones at the wrong guy, at
the only guy who's done anything at all to help the Syrians and to forestall the monstrous neo-con
plan. This letter may be, as b says, a measure of theneo-cons' fear that it will all be over
for 'their guys' in Syria by 21 January. If that were to come to pass, Vladimir Putin will have
had a big hand in it.
Nicola @10 from your link 'Extending American power' I had to laugh at this... 4. "All of which
provides the basis for our strong belief
that the United States still has the military, economic,
and political power to play the leading role in pro
-tecting a stable rules-based international order". 'Rules based',ha, the US is the leading regime
change state, acting always contrary to International law to benefit its hegemonic ambitions.
All five veto wielding powers and their friends are above International law for all time. Thankfully,
Russia and China cannot be threatened militarily and will confront the monstrous US designs in
Syria, once the head choppers are defeated the victors should move against the real source of
terrorism in the region, Saudi Arabia and the various GCC satraps. b's article above is excellent
and is echoed in this piece in Antiwar.com
http://original.antiwar.com/justin/2016/06/16/something-going-worse-thought/
There are other worrying development in Syroi a namely changing of Riusssian attitude to Assaad.
First Lavrov said that Russia is not Syrian government ally, they just fight terrorists together.
An obvious nonsense.
And now this.
Israel, following several similar air raids in previous months just bombed SAA installation
in Homs province, in the middle of Syria just 45 second flight of S400 rockets located in latakia,
while Netanyahu was smiling with Putin in Moscow.
Can you explain WTF? All of that while IDF artillery provides cover for ANF commanded by formed
ISIL commander in Golan Heights foothills,
There is more about Russian de-facto acquiescence for Syrian partition and pivot to Israel:
STRANGE DAYS: Did Israelis Pivoted to Russia? Or the other way around.
https://syrianwarupdate.wordpress.com/
This is not preview nor is it a strategy, since strategies are based on more or less professional
and realistic, I may add, assessments of the outside world. I do not have any recollection of
any serious US doctrinal (policy or military wise) document in the last 20 years written from
the position of comprehensive situational awareness--this is a non existent condition among most
of US current "power elites". The document you posted is a typical wet dream written by utterly
incompetent neocons (Kagan's and Zoellik names are a tell), people who can not and must not be
allowed to operate with serious strategic and operational categories in any "advisory" role.
They simply have no qualifications for that and are nothing more than a bunch of ideologues and
propagandists from Ivy League humanities degree mill. Back to "preview"--it is a dominant ideology
of "exceptionalism" which afflicted US "elites" today, this document is just another iteration
of this ideology.
i read about 30 of 160 or so comments on this article at NYT. given who the audience of that
shit rag is & that comments are vetted, overwhelmingly commenters stated increased military involvement
is retarded. Of course, many of those speak from ignorance of what's really going on, but
the knee-jerk suspicion of US Syria policy & these FSO dickheads seems a good sign.
There is more about Russian de-facto acquiescence for Syrian partition and pivot to Israel:
It is exactly the other way around. How can Russia, which dwarfs Israel in every meaningful
category -- from economy to military -- and who does remember her history well can "pivot" to
largely regional player -- I don't know. Russian "neocons" are a dramatically different breed
than US ones, for starters they are much more educated and, actually, support Assad. Israel's
pivot to Russia in some sense is inevitable, albeit it could be fairly protracted, with Russia
being observed as honest broker. They are not completely stupid in Israel and are very aware of
real situation in American politics, economy and military. In other words -- they know how
to count and see who pulls the strings. And then there is another "little tiny" factor--Israelis
know damn well who won WW II in Europe. It matters, a great deal.
I note that the 'moderate' Hillary Clinton is a blood-soaked queen of chaos, who if elected
is certain to embroil us in pointless wars and spread death and devastation across even more of
the world. I say this not because I am psychic, but because that is her unambiguous record.
Donald Trump is admittedly a gamble, but depute his over-the-top stage persona, his track
record is of actually getting along with people and brokering stable working relationships.
This November I'm going for the wild-card who at least sounds rational (if you listen to what
he actually proposes, and not his style) and has a track record of actually being pragmatic, over
certain doom.
At this point I wish I could vote for Richard Nixon (!), but we have the choice that we
have...
This piece out of the NYT is pure propaganda. Period. Here's the big clue - where's the memo?
It's not embedded in the article. It can't be found anywhere on the web. It's b/c it doesn't exist.
The reader is 'TOLD' by a third party journalist few follow who writes for a MIC/Political/Policy
corporate mouthpiece.
If an article does not link to an original source OR quotes only 'anon sources' be skeptical.
Journalism, especially alt news journalists, site original sources AND try like hell to get sources
to go on the record.
My apologies in advance if I'm being offensive to our generous host. That is not my intent.
Rather, it's venting a long held frustration I've had with the division within corporate newsrooms
who are there solely to sell the readers the news, even if it's made up out of thin air.
Yeah . . .agree 90%. Here are some minor details that need to be tidied up, and a couple thoughts.
1.
b: it was Ahrar al Sham, Jabhat al-Nusra and other U.S. paid and supported "moderates"
who on April 9 broke the ceasefire in Syria.
This is not quite accurate. Resolution 2254 exempted al Nusra from the cease-fire, not sure
about al Sham and whatever others you are referring to. If they were excluded from the cease-fire,
then they couldn't break it.
2.
The NYT writer is Mark Landler, not Lander. If you're going to accuse him of being stupid or dishonest,
you want to get the name right. Mark Lander, whoever he is, might have a pack of bulldog lawyers.
3.
I don't see in Landler's article a link to the memo or a list of the people who signed it. Someone
needs to publish that list of signatories to preserve the record of who the DOS idiots are.
4. We see the point of all the saber-rattling by NATO on Russia's borders: to get Putin tied
up in a diversionary direct threat to Russia, thereby mitigating or eliminating his efforts in
behalf of Assad. And you know what? Americans on the street couldn't care one way or the other
what Obama or CIA or DoS does or says about Syria. 280,000 dead, millions displaced and Americans
are more concerned by a factor of 1000 about 4 dozen gays in Orlando.
Thanks for sharing your outrage, b. I completely agree. I have been ranting about this all morning
and it's good to see someone else stating the case so the rest of us don't feel isolated in our
anger at this vicious and dangerous stupidity. These 51 useful idiots are IMO auditioning
for the Clinton team while also providing cover for the neo-cons above them like Nuland, Powers,
etc. And directionless Kerry says he'll rush home to confer with these idiots rather than dismissing
them out of hand. Kerry could only be useful to anyone if Lavrov was in the room with him at all
times to keep him in line -- otherwise he reverts to his normal mindless servant of US empire
viewpoint, which is to follow whichever way the winds of power are blowing through Washington,
DC.
CIA .... YPG .... ALNUSRA.... FSL , all these acronyms are so confusing , how about considering
the level of sanity and intelligence of these groups ( which is probably below that of a wounded
flea .... ) why not call them Scoobidoos vs the Syrian Army
so the article would go something like this :
In the memo, the Scoobidoos State Department officials argued that military action against
Mr. Assad would help the fight against the Scoobidoos because it would bolster moderate Scoobidoos,
who are necessary allies against the group, also known as Scoobidoos .
I thought it was a "cessation of hostilities" not a case fire. The difference is not trivial,
and State Department employees should know the difference. The signers are either incompetent
or evil (not mutually exclusive, of course).
dont think landler is stupid. dishonest and deceiving would be my say. he is a nyt's jew writing,
maybe lying, regarding syria. NYT: only news acceptable to jews. sometimes, many times we have
to make up stories and facts to (maybe) fit.
cant find any of the dissenting names.
like to know how many are jew if story not total fake
then there is the political hatchet job on the russian track/field olym team.
I think the key takeaway is b's last two sentences: "The race to preempt a Hillary administration
war on Syria, which the 'diplomats' memo prepares for, is now on. May the not-warmongering side
win."
Hillary is the neocon's neocon. Pravy Sektor's honorary storm trooper Vicky Nuland is a
Hillary protege. NYT has been positioning its readers to embrace Kerry's Plan B for the last month-plus.
Whether during or shortly after Hillary's first 100 days in office, U.S. military engagement
with Libya and Syria will likely be significantly greater than it is now.
This is the exact reason the Ministers of Defense of Syria, Russia and Iran held meeting in Teheran
just recently. My assumption is they are planning on rolling up the acres, so to speak in Syria.
All before the new POTUS comes to office. Also, Hezbollah just announced it's sending in reinforcements
to the battlefield. All this while the Chinese continue to sleep. Sigh.
The Kurds are the last great hope for the oil and especially natural gas pipelines dream from
the GCC to Europe, but still, Israel is not happy. They wanted a branch-off pipeline for themselves.
Also Jordan was to get a small branch-off too. Israel is no more than a parasite, look up the
definition. It's exact. Turkey would benefit economically due to transit fees. That's why the
Turks are so heavily involved. Turkey, who's economy is done for due to Chinese cheap products
swamping the M.E; is crashed. Jordan is broke (hence they allow the head choppers to be trained
on their territory). The U.S is the overlord who wants this project to be implemented so as to
deny Russia the European market (see Saudia too).
Netanyahu has visited Russia 3-4 times (not sure)to dissuade Putin on his support for Bashar
( who said yes to the Friendship pipeline- Running from Russia, Iran, Iraq, Syria..to the Mediterranean
thru to Greece, Europe). No other World leader makes that many visits is such a short time to
another capital. Netanyahu obviously failed in his endeavor, as the Russians are familiar with
these Zionist snakes very well. All they have to look at is the genocide perpetrated by said Zionists
in their very own 20th Century history. I even read that Putin irked Netanyahu when Putin offered
him back the Pale of Settlement if they wanted to make the smart choice. Beautiful if true. Probably
wishful thinking tho.
Anyways, Israel runs the U.S State Department(see, the Crazies in the Basement). They don't
call it Foggy Bottom for nothing. Must be foggy now due to too many employess smoking bongs in
the downstairs cafeteria, hence the ridiculous memo. Also the writer of the memo is most certainly
another member of the chosen tribe.
Yes, a 'Night of the Broken Glass' or 'Night of the Long Knives' is much needed to save Humanity
essentially. But don't hope for it. Congress, Capital Hill leaders , MSM heads and head anchors,
most everybody in the Whit house(except the kitchen staff) would have to be rounded up.
The only hope would have been the U.S Military Officer Corp. before the great purges post 9-11.
Now it's I'm possible. God help the American people and the World.
This clown Kagan is also the husband of the infamous Victoria Nuland who somehow, defying
all logic, still has her job post imbroglio that is the Ukraine today. Hell, she's probably being
hailed for that and is an inspiration for lowly State employees.
Thank you Victoria, for giving Crimea back to the Russian Federation where it belongs.
There are almost exactly 7 months until either Trump or Clinton takes office (presuming
that the elites manage to completely control any bad news prior to the Dem nominating convention
in late July; if the email dam breaks after that I have no idea what the Dem elites will do, but
I figure they won't choose the obviously best candidate against Trump, Bernie).
Seven months. If Russia lends more of its strength, is it possible to gain the territory and
hold it to the point that, oh, the West's illegal bases will have to close down? Or might
the West actually directly take on Russia/Syrian government forces? Claiming, of course, some
version of
R2P
State Department Diplomats who have captained failure after failure? If these people were
Russian or Chinese they would have been executed for their serial failures in the ME and Afghanistan.
The main problem with being 'exceptional' is that the 'exceptional' ones never make a mistake.
"War is Peace, Freedom is Slavery, Ignorance is Strength"
So I was kind of wondering what psychopathic qualities the U.S. War... er, State Department
is looking for in potential parasitic career bureaucrats, and came across this self-promotion
page on their site. They seem to feel that working for them immerses you in a 'Culture of
Leadership'. I guess the 'Culture of Chaos and Death' theme, although more neocon-appropriate,
was shot down in favor of tempting potential employees with the possibility of more power and
control.
There are times the depressing mood on MoA is mitigated by some of the rather classic spelling
errors. I sometimes wonder if they might be intentional in order to lighten the mood?
In the inner halls of Pentagramagon nothing succeeds financially like serial designed failure
...
KABUL, Afghanistan - "The new U.S. commander in Afghanistan has submitted his first three-month
assessment of the situation in the war-torn country and what it's going to take to defeat the
Taliban, a U.S. military official has told The Associated Press.
And though the content of the review by Army Gen. John W. Nicholson is secret, the U.S.
strategy in Afghanistan received a major incentive this month when President Obama decided to
expand America's involvement with more airstrikes against insurgents, giving the U.S. military
wider latitude to support Afghan forces, both in the air and on the ground."
No respect for
R2P warriors
at the State Department, nor for HRC, Susan Rice and Samantha Power. Jo Cox as former
Oxfam executive was moved by the same massacres of Rwanda, Yugoslavia and Darfur.
Unwittingly (?) the R2P argument was used by the Obama White House to intervene in Libya and
Syria. The US took R2P a step further to force regime change which is illegal by International
law. See George Bush and
Tony Blair
to white-wash the cruelty of torture, rendition, Abu Ghraib, extrajudicial assassinations,
etc, etc.
Former US Ambassador to Syria Robert S. Ford was an apprentice of John Negroponte in Baghdad,
Iraq.
If I were Assad, I would be shaking in my boots right now and having Gaddafi dreams. Russia has
clearly allied itself closely to Israel and Nato in Syria. Some kind of sanctions relief deal
must be in the works. Syria will be split up soon. Assad is a dead man.
For Israel to bomb the Syrian military right under the nose of Russian s-400s? Russia,
supposedly so dedicated to defending sovereignty, smiles and yawns benignly? A dirty deal has
been made...
"Earlier this week as America was trying to make sense of the deadliest case of Islamic terrorism
on US soil since 9/11, I wrote a detailed article here at Breitbart News that laid out the clear
factual case about Hillary Clinton's top assistant Huma Abedin. I showed how she has deep, clear,
and inarguable connections to a Saudi Arabian official named Abdul Omar Naseef, a powerful Kingdom
insider who has helped lead a group called the Muslim World League. The Muslim World League is
the huge "charity" whose goal is to spread Islam throughout the world and which has been connected
to terror groups like Al Qaeda. If that sounds like a serious accusation, you're damn right
it is."
"The three questions are very simple, very straightforward, and, frankly, anybody can research
the answers themselves. They are:
1) What is Huma's relationship with a Saudi Arabian official named Abdullah Omar Naseef?
2) Was he the founder of a Saudi charity called the Rabita Trust?
3) Right after 9/11, was the Rabita Trust put on a list by the U.S. government of groups
that were funding terrorism?"
"If I were Assad, I would be shaking in my boots right now and having Gaddafi dreams."
Interesting opinion? If you made a list of democratically elected Presidents and National Leaders
the US/GB/ISR axis have terminated you will fill a book. From Patrice Lumumba to Hugo Chavez the
list goes on and on. Could you supply me with a list of National Leaders that Russia under Putin
has terminated?
WASHINGTON (Sputnik) - US Department of State has no plans to make public an internal memo
calling for the United States to take military action against Syrian President Bashar Assad's
government, US Department of State spokesperson John Kirby said in a briefing on Friday. "There's
no plans to make it public," Kirby stated when asked when the State Department would release
the dissent letter.
Furthermore, Kirby said there will be no investigation as to how the letter ended up in
the public domain.
By 'public domain', Kirby means on some writer's desk at the NYT, never to be seen by the unwashed
masses. To be fair, the State Department's "Dissent Memo" program is supposed to be confidential
even within the State Department itself to encourage its use. Mark Landler said in his article
that a draft of it was leaked by 'a State Department official' to the NYT. So some skepticism
of the existence or eventual submission of the actual memo is warranted. Not that Landry is lying
or hasn't verified it, but the State Department official obviously has an agenda by providing
it to the NYT. The NYT has its own agenda filled as well by prominently posting the article
on
the top of the front page .
Nyt participating in these pressures is coordinated with medecins sans frontiere announcing
today that they ll refuse eu money to protest on the treatment of refugees and with recent surge
in french and uk msm of so called white helmets exclusive pictured
Obama, despite dissent on Syria, not shifting toward strikes on Assad
The U.S. administration sought on Friday to contain fallout from a leaked internal memo critical
of its Syria policy, but showed no sign it was willing to consider military strikes against Syrian
President Bashar al-Assad's forces called for in the letter signed by dozens of U.S. diplomats.
Several U.S. officials said that while the White House is prepared to hear the diplomats' dissenting
viewpoint, it is not expected to spur any changes in President Barack Obama's approach to Syria
in his final seven months in office.
One senior official said that the test for whether these proposals for more aggressive
action are given high-level consideration will be whether they "fall in line with our contention
that there is no military solution to the conflict in Syria."
It's important for Russia to ensure that the remains of the first "Israeli" jet it shoots
down falls to earth inside Syria. If you've seen a story about the IAF doing something courageous
it's bullshit.
The EU-Turkey deal's financial package includes one billion euros in humanitarian aid.
There are undoubtedly needs in Turkey, a country which currently hosts close to three million
Syrian refugees, but this aid has been negotiated as a reward for border control promises,
rather than being based solely on needs. This instrumentalisation of humanitarian aid is unacceptable.
Last week the European Commission unveiled a new proposal to replicate the EU-Turkey logic
across more than 16 countries in Africa and the Middle East.
These deals would impose trade and development aid sanctions on countries that do not stem
migration to Europe or facilitate forcible returns, rewarding those that do. Among these potential
partners are
Somalia ,
Eritrea , Sudan and Afghanistan – four of the top ten* refugee generating countries.
kreepy kerry is "running out of patience" since his most desired regime change isn't happening
fast enough. How many others are in the works? I'm running-out-of-patience waiting for the
regime change anyone with 1/2 a brain wants, right here in the U.S. Regime Change US. It's our
turn. I just read Putin's speech at the St. Petersburg Int'l Forum. He must have used the word
"cooperation" at least 20 times. We need such a great leader. Terroristic turds like kerry and
co. belong in jail.
50 diplomats petition president for war. Was that written by Orwell? Isn't it enough
that this "peaceful" nation arms the world and places economic "pressure" on those nations that
displease her to the point of causing millions to die - do we really have to "kill the village
to save it?" Yes, I agree, each and every one of those "career diplomats" should be looking for
other work. They have not merely lost their way, they have lost their minds. My contempt for them
is manifest, as is my contempt for the entire MIC. That those trained in diplomacy should send
such a despicable petition illuminates the deep corrupting influence of American Exceptionalism
- a force for the kind of nationalism Germany endured 1933-45. Idiots.
Allow me to further my argument against American Exceptionalism. It is not merely the fact
that the U.S. is far from exceptional. From education to infant mortality, the U.S. is woefully
behind much of the world. My objection is that belief in exceptionalism leads to moral decay.
It is the functional equivalent of the 19th Century preachers who endorsed slavery, who preached
that negroes carried the mark of Cain, etc. Whites were God's chosen. The pseudo-righteousness
that preaching created in believers was largely responsible for America's Civil War. Americans
will be better people, with a better society, if we dispel this myth immediately. We're OK, you're
OK. Then we could have peace. Wouldn't that be nice?
So Hillary, the bloodthirsty Goddess of War, is longing for a second Libya, i.e., a Syria
smashed to smithereens, in ashes and ruins, ruled by a chaotic bunch of mad Takfiri extremists,
at war all against all. The Queen of Chaos, indeed, loves these scenarios. Especially because
her quick attack as first thing should she win the White House would shut the mouths of her critics
wanting her prosecuted for her crooked political and business corruption. But she and her State
Department surrogates would be in for a surprise: Russian and Syrian defences would not remain
silent. And afterwards, what would be left? How would the Exceptionalist who "gets things done"
proceed?
The FBI is stonewalling, keeping the contents of Mateen's 911 call unavailable - though it's
part of the public record - presumably because it undermines the "ISIS did it" meme poured over
the Orlando mass murder. Apparently Mateen may have mentioned ISIS not quite in the same light
as has been portrayed.
Now the NYTimes/WSJ are doing the same thing with the 50 dancing diplomats. Releasing what
they want us to know and redacting what we want to know : the names of those 50 dancing diplomats.
I suppose it comes under the CIA's blanket excuse for secrecy? "Methods and means", or
whatever their boilerplate.
Releasing their names might give us the means to track the 5th column as it winds its way through
'our' government, and that must be prevented at all costs. Think it might lead through Hillary?
Seems no doubt here.
No doubt the State Department dwarves were ginned up by "Cookies" Nuland and Count Kagan by
visions of "x memorandum" of 1946 immortality by attacking the resistance to an unipolar hegemony.
Mixing it up in Syria with the Russian presence seems civilization limiting at the outer limits
of challenge/ response in a military confrontation.
"... No mention of decline in China's aging oil fields, or that EOR and infill drilling are what is not affordable at current oil prices, resulting in higher decline rates ..."
"... And the angle that Saudi Arabia flooded the market by keeping their production relatively flat (not cutting production) is a bit ridiculous, to me. US LTO and Canadian tar sands increased production to cause an abundance of oil and condensate. ..."
"... I think China's decline is due to geology and, secondarily, to price realities. It is not caused by stable production in Saudi Arabia. ..."
"... Bloomberg is trying to manipulate markets, as usual. ..."
Interesting article from Bloomberg. I note their take is that it is all
about prices. Geology and resources are not factors in their thinking.
No mention of decline in China's aging oil fields, or that EOR and
infill drilling are what is not affordable at current oil prices, resulting
in higher decline rates , or that some of China's biggest, aging fields
are probably at the end of their producing lives. The intimation is that
production can jump right back up with higher prices – uh, not that simple.
And the angle that Saudi Arabia flooded the market by keeping their
production relatively flat (not cutting production) is a bit ridiculous,
to me. US LTO and Canadian tar sands increased production to cause an abundance
of oil and condensate.
I think China's decline is due to geology and, secondarily, to price
realities. It is not caused by stable production in Saudi Arabia. Bloomberg
is trying to manipulate markets, as usual.
"... A Conoco-Phillips pipeline in Alberta, Canada has been leaking condensate since the 9th of June, spewing out approximately 2400 barrels of condensate into a wildlife area that had been set aside for elk and grizzly bears. ..."
"... According to the Alberta Energy Regulator, there is a dead patch of vegetation the near the pipeline and a sheen on the water of nearby Webb Creek, which stretched for approximately 2.8 miles both upstream and downstream of a beaver pond. About 1.2 miles downstream of the affected area of the stream is the Simonette River. Although nothing was visible on the water, tests on the river have shown elevated levels of hydrocarbons, which are found in condensate. ..."
A Conoco-Phillips pipeline in Alberta, Canada has been leaking condensate since the 9th of June,
spewing out approximately 2400 barrels of condensate into a wildlife area that had been set aside
for elk and grizzly bears.
The leak occurred in the Little Smoky Caribou Range near the company's gas Resthaven plant, north
of Grand Cache, Alberta. Other key wildlife zones, including a zone designated for grizzly bears,
are just to the south of the spill area.
According to the Alberta Energy Regulator, there is a dead patch of vegetation the near the pipeline
and a sheen on the water of nearby Webb Creek, which stretched for approximately 2.8 miles both upstream
and downstream of a beaver pond. About 1.2 miles downstream of the affected area of the stream is
the Simonette River. Although nothing was visible on the water, tests on the river have shown elevated
levels of hydrocarbons, which are found in condensate.
The Alberta Energy Regulator has issued an environmental protection order to Conoco-Phillips. In
its statement regarding the incident, the agency noted that "Much of the required work has already
begun. Environmental protection orders are not enforcement; they are remedial orders directing the
company to provide a plan to ensure that the environment is remediated."
For its part, the company has shut down the line and is formulating a plan to investigate the cause
of the leak. With regards to the waterway, the company has erected a boom. It has also begun using
soaker pads, sending 150 people to the site as of Wednesday morning.
"... Yes it is the normal cycle pattern, but going into Q3, we have been seeing draws over the last few weeks, and world S/D has been close to being balanced. ..."
"... It is normal for Q2 to have storage builds, and this year the builds were on the low side. ..."
"... The market is not expecting to see higher demand than supply, and the next step in prices may be soon than expected. ..."
I know that this presentation is about production, but on the other side
of production, that is demand, according to the IEA demand tables, going
from Q2 to Q3 increases demand by about 1.5 million barrels a day.
There is also a additional small increase going from Q3 to Q4.
With supply decreasing and demand increasing looks like oil prices may
be headed higher over the next six months.
The Alberta fires along with Nigeras problems came at the right time
yo tighten things up a bit.
Yes it is the normal cycle pattern, but going into Q3, we have been
seeing draws over the last few weeks, and world S/D has been close to being
balanced.
It is normal for Q2 to have storage builds, and this year the builds
were on the low side.
The market is not expecting to see higher demand than supply, and
the next step in prices may be soon than expected.
"... Global demand is indeed strong. All key forecasting agencies are still projecting annual demand growth of 1.2mb/d, but it may surprise on the upside (~1.4mb/d). But supply/demand rebalancing is mainly due to declining non-OPEC output and supply outages. ..."
Global demand is indeed strong. All key forecasting agencies are still projecting annual demand
growth of 1.2mb/d, but it may surprise on the upside (~1.4mb/d).
But supply/demand rebalancing is mainly due to declining non-OPEC output and supply outages.
Quarterly global oil demand (mb/d)
source: IEA Oil Market Report, May 2016
"... Penn Virginia Corp., a company in which billionaire George Soros had a stake, booked paper wells in natural gas prospects where it hadn't drilled in years, according to letters from the SEC. ..."
"... Penn Virginia erased most of its undeveloped reserves this year. The company filed for bankruptcy May 12 with $1.2 billion in debt. Records show Soros sold his six million shares in the first quarter. ..."
Penn Virginia Corp., a company in which billionaire George Soros had a stake, booked paper
wells in natural gas prospects where it hadn't drilled in years, according to letters from the SEC.
"Your actual drilling has consistently failed to follow schedules," the SEC wrote in an April
2015 letter. Penn Virginia responded that it had intended to get to the wells within five years but
its plans changed when prices fell.
That's not what company executives told investors, according to conference call transcripts. H.
Baird Whitehead, Penn Virginia's chief executive officer, said in a November 2012 call that "under
almost no scenario" would the company resume gas drilling. Yet, when Penn Virginia filed its report
with the SEC three months later, the prospects accounted for more than 40 percent of its reserves.
During an April 2013 call, Whitehead said, "We don't plan on drilling natural gas wells." Still,
the undeveloped natural gas wells comprised 19 percent of the company's reserves at the end of that
year. Patrick Scanlan, a spokesman for Penn Virginia, declined to comment.
The company intended to follow the SEC's five-year rule, according to a person familiar with Whitehead's
thinking.
Penn Virginia erased most of its undeveloped reserves this year. The company filed for bankruptcy
May 12 with $1.2 billion in debt. Records show Soros sold his six million shares in the first quarter.
"... Ultra Petroleum Corp. was a shale success story. A former penny stock that made the big leagues, it was worth almost $15 billion at its 2012 peak. ..."
"... Then came the bust. Almost half of Ultra's reserves were erased from its books this year. The company filed for bankruptcy on April 29 owing $3.9 billion. ..."
Ultra Petroleum Corp. was a shale success story. A former penny stock that made the big leagues,
it was worth almost $15 billion at its 2012 peak.
Then came the bust. Almost half of Ultra's reserves were erased from its books this year. The
company filed for bankruptcy on April 29 owing $3.9 billion.
Ultra's rise and fall isn't unique. Proven reserves -- gas and oil resources that are among the
best measures of a company's ability to reward its shareholders and repay its debts -- are disappearing
across the shale patch. This year, 59 U.S. oil and gas companies deleted the equivalent of 9.2 billion
barrels, more than 20 percent of their inventories, according to data compiled by Bloomberg. It's
by far the largest amount since 2009, when the Securities and Exchange Commission tweaked a rule
to make it easier for producers to claim wells that wouldn't be drilled for years.
"... In July 2014 Saudi Arabia used 900,000 bpd of oil JUST for electricity, which was 63% higher than the previous year. In a weird twist a 2006 Royal Decree forced electricity generation from natural gas to oil. In 2007 nat gas accounted for 52% of electricity production, in 2012 it was down to 39% – all the rest is crude oil, fuel oil, and diesel. This change was the opposite of what I expected, and is a baffling policy decision… but it is Saudi Arabia, so maybe I shouldn't be surprised. ..."
"... Saudi uses a lot more oil to generate electricity than they used to because they simply do not have enough natural gas to run their power plants and desal plants on gas alone. When I was there in the early 80s natural gas was used almost exclusively to produce electricity and water. ..."
"... Rising Saudi electricity consumption and direct oil burn at power plants is mainly due to air conditioning during the Summer season ..."
I was curious how Ramadan impacts oil production and demand in the Middle East, so I did some
loose research. As everyone here probably knows the Islamic calendar is based on the 29.5 day
Lunar Cycle, so Ramadan is a few weeks "earlier" every year.
According to several articles I read electricity demand jumps by 50-60% during Ramadan especially
when it occurs during the summer. A combination of higher A/C demand as people rest inside during
the day-time fast and the lighting demand from nightly fast-breaking festivities drives this surge.
However Saudi Arabia is the only country that uses meaningful amounts of oil to produce electricity,
so we can just focus on Saudi Arabia.
In July 2014 Saudi Arabia used 900,000 bpd of oil JUST for electricity, which was 63% higher
than the previous year. In a weird twist a 2006 Royal Decree forced electricity generation from
natural gas to oil. In 2007 nat gas accounted for 52% of electricity production, in 2012 it was
down to 39% – all the rest is crude oil, fuel oil, and diesel. This change was the opposite of
what I expected, and is a baffling policy decision… but it is Saudi Arabia, so maybe I shouldn't
be surprised.
Saudi oil demand always spikes during the summer months, and Ramadan will combine with that
to cause a huge spike in domestic oil demand for June.
I tried digging into how Ramadan may impact drilling projects, but could not find much on Saudi
Arabia except an article that mentions the 2012 Saudi Aramco hack was made worse because most
Saudi Aramco employees were on holiday for Ramadan. Various other Muslim nations reduce work hours
for both Muslims and non-Muslims, and Algeria completely stops drilling during Ramadan. Long story
short, I could not find anything too conclusive.
It would be difficult to tell if Ramadan has an impact on oil production in Muslim countries
since it would be a delayed effect that doesn't sit squarely in a single month, and is drowned
out by other political, seasonal, and economic changes. I'm still very curious if there is a relationship
though.
Ramadan moves forward an average of 11.6 days per year. Nothing much changes during Ramadan except
Muslim workers don't work as hard or as long. But non-Muslim workers carry on as if nothing has
happened. Well except that they, during daylight hours, cannot eat, drink or smoke in the presence
of a Muslim.
Ramadan has little or no effect on the vacation of non-Muslim workers.
Saudi uses a lot more oil to generate electricity than they used to because they simply do
not have enough natural gas to run their power plants and desal plants on gas alone. When I was
there in the early 80s natural gas was used almost exclusively to produce electricity and water.
Their largest desal plants are evaporative plants though they do have a lot of reverse osmosis
desal plants that serve smaller areas.
It appears that world oil exports has increased very little, if any, since 2005.
Notable quotes:
"... I can only guess that oil production in importing nations, which are generally capitalist countries, is more sensitive to oil price changes than exporters (whose systems of govt allows for maintaining production regardless of price). ..."
"... The largest increase in production, by far, came from the US which is an importing nation. And huge declines came from Norway, the UK and Mexico, all exporting nations. That is largely why we see production increasing while exports stayed flat. ..."
"... Exporting nations, the UK and Indonesia, became net importers during that period. There may have been others, I haven't looked that closely. ..."
"... I find Mexico to be an interesting case. I read somewhere that 30% of federal tax revenue is received from taxation of Pemex. Mexico exports are down 21% in 2015 compared to 2014. I'm not sure what is going to happen to Mexico when it becomes a net oil importer. ..."
This mostly means that importers have simply increased production right?
Gains in U.S. and Canadian production reduced imports, and allowed countries like China and
India to import more even though net export availability remained flat.
I can only guess that oil production in importing nations, which are generally capitalist
countries, is more sensitive to oil price changes than exporters (whose systems of govt allows
for maintaining production regardless of price).
The next 12 months may see increasing prices even if net exports do not decline simply due
to increased export demand from countries like the U.S. that flip from a multi-year decline in
import demand.
Yes, exactly. The largest increase in production, by far, came from the US which is an importing
nation. And huge declines came from Norway, the UK and Mexico, all exporting nations. That is
largely why we see production increasing while exports stayed flat.
Exporting nations, the UK and Indonesia, became net importers during that period. There
may have been others, I haven't looked that closely.
Hi Ron, according to the Energy Export Data Browser UK is an importer.
I find Mexico to be an interesting case. I read somewhere that 30% of federal tax revenue
is received from taxation of Pemex. Mexico exports are down 21% in 2015 compared to 2014. I'm
not sure what is going to happen to Mexico when it becomes a net oil importer. Whenever it
is it won't be good. Perhaps Mexico will join their neighbors to the south (El Salvador, Guatemala
and Honduras) in being failed states.
"... Worldwide investment in the development of oil and gas resources from 2015 to 2020 will be 22 percent, or $740 billion, lower than anticipated before prices plunged in 2014, with the deepest cuts in the U.S., Wood Mackenzie said in a statement Wednesday. A further $300 billion will be eliminated from exploration spending. Global production this year will be 3 percent lower than previously forecast, the consultant said. ..."
The oil and gas industry will cut $1 trillion from planned spending on exploration and development
because of the slump in prices, leading to slower growth in production, according to consultant Wood
Mackenzie Ltd.
Worldwide investment in the development of oil and gas resources from 2015 to 2020 will be 22 percent,
or $740 billion, lower than anticipated before prices plunged in 2014, with the deepest cuts in the
U.S., Wood Mackenzie said in a statement Wednesday. A further $300 billion will be eliminated from
exploration spending. Global production this year will be 3 percent lower than previously forecast,
the consultant said.
"... According to data from National Bureau of Statistics released today, oil output in May was down 7.3% from a year ago to 16.87 million metric tons (3.97 m/d, using 7.3 ton/barrel conversion factor). Daily output declined 1.6% from April and 10% from June 2015 peak of 4.41 mb/d. ..."
According to data from National Bureau of Statistics released today, oil output in May was down
7.3% from a year ago to 16.87 million metric tons (3.97 m/d, using 7.3 ton/barrel conversion factor).
Daily output declined 1.6% from April and 10% from June 2015 peak of 4.41 mb/d.
I think the decline is a result of both ageing onshore oil fields and reduced infill drilling
due to lower upstream investments.
China oil production (kb/d) and year-on-year change (%)
source: National Bureau of Statistics
"... Long predicted as a natural development after the 2014 start of the collapse in the oil price the inevitable has been delayed by drillers squeezing every drop out of their wells, but that game is all but over. ..."
"... Declines in U.S. oil output set to accelerate ..."
"... A lack of drilling is about to catch up to US oil output. To maintain current production levels in the US requires 439 rigs, compared to the 280 in operation, according to ANZ Research. "If that trend persists, we could see production fall below 8.5mb/d by July," comments Daniel Hynes, commodity researach analyst. ..."
"... Financial stress could exacerbate this. Oil producers with sub investment grade debt maturing this year produced approximately 1.3mb/d of oil. We have also seen more downgrades of credit ratings in 2016 than over the past three years. ..."
"... This should see oil prices remain well supported over the next six months. ..."
U.S. oil production has entered the end game with output forecast to plummet as drilling
dries up and banks foreclose on oil companies teetering on the brink of insolvency.
Long predicted as a natural development after the 2014 start of the collapse in the oil price
the inevitable has been delayed by drillers squeezing every drop out of their wells, but that game
is all but over.
From a peak of more than 9.5 million barrels a day early last year current output has slipped
to 9.1mb/d but if a fresh forecast is correct the number could be 8.5mb/d by July and possibly
below 8mb/d in the September quarter…
Saudi Smiles
The Saudi view has consistently been that the oil market will fix itself with low prices forcing
high cost producers out of business, leading to a sustainable price recovery.
What the ANZ has done with its report released earlier today is reinforce the Saudi position
with the headline telling the story: "Declines in U.S. oil output set to accelerate".
A lack of drilling is about to catch up to US oil output. To maintain current production levels
in the US requires 439 rigs, compared to the 280 in operation, according to ANZ Research. "If
that trend persists, we could see production fall below 8.5mb/d by July," comments Daniel Hynes,
commodity researach analyst.
Financial stress could exacerbate this. Oil producers with sub investment grade debt maturing
this year produced approximately 1.3mb/d of oil. We have also seen more downgrades of credit ratings
in 2016 than over the past three years.
This should see oil prices remain well supported over the next six months.
It has always seemed perfectly obvious to me that the price would HAVE to go back up, and it has
, quite a bit already.
The thing that surprised me is that it has taken as long as it has for the high cost producers
to start falling by the wayside. In other industries, the blood would have been in the water MUCH
quicker.
Does anybody have a figure for the "typical or average " cost of storing crude per barrel per
year? How has the price of storage varied for the last couple of years?
I tend to agree, but it will not surprise me to get a soft patch in prices late summer, if it
is shallow, no pun intended, we will have the episode be hide us and I would look at it as a time
to add to pub co stocks. By then the production trends as highlighted in the work presented here
will be very much in place. Who knows Dennis might have to adjust his trend lines on the C+C chart
by that time and will need to use peak flow as the starting point.
Shallow you do not need to tell me, of the hundreds of thousands of people who work in oil
an gas extraction the number of them "barons" would fit on one of the those new electric buses.
If we substitute Dean's better estimate for Texas into the EIA's US estimate (removing the
EIA's Texas estimate from the US total) and use the data from the peak in April 2015 to the most
recent monthly data point of March 2016 and fit a trend line using the method of least squares
we get production decreasing at an annual rate of about 200 kb/d over the most recent 12 months.
Middle East oil producers turn to debt markets. Oman
sold $2.5 billion in bonds on Wednesday, as it seeks to improve its financial position. The Gulf
state oil producer, who is not a member of OPEC, went to the debt markets for the first time in more
than twenty years, a sign of how badly it has been damaged from low oil prices. The move comes after
some of Oman's neighbors issued new bonds earlier this year – Qatar sold $9 billion in debt and Abu
Dhabi sold $5 billion. Saudi Arabia is also expected to turn to the bond markets, perhaps selling
as much as $15 billion worth of bonds. But the IMF
warns that the Gulf States are going to need to do a lot more to cut spending in order for them
to hold onto their currency pegs.
Speculators gamble on $100 oil.Bloomberg
reports that some oil traders are buying contracts that will only pay out if oil surpasses $100
per barrel at some point in the next few years. The contracts do not suggest that such an outcome
is necessarily likely, but only that some traders view it as a potential profitable position. The
fact that traders are buying up these kinds of contracts suggests that the markets are starting to
believe that today's severe cutbacks in exploration and development will create the conditions for
a supply shortage somewhere down the line.
"... I hope everyone understands that by 2020, most of the 2014 and prior vintage Bakken and TFS wells will be just like what Oasis sold, 21,000′ well bores making under 20 bopd. ..."
"... There are going to be about 40,000 stripper wells in the US that have a TD in excess of 15,000′ in about 5 years. If those are economic I think we will be very happy. ..."
"... I sure agree, hope this rally isn't a repeat of last year. ..."
"... WPX Energy Inc prices public offering of 49.5 mln shares for total gross proceeds (before estimated expenses) of about $485 mln ..."
"... You know that Permian, break even at $30, 30% IRR at $35. LOL! ..."
"... The Mighty MIGHTY MARKET and the ( near) Invincible Invisible Hand really can work economic miracles, sometimes, not every time, given time enough. ..."
"... The "Invisible Fist" generally just plummets our proletarian friends. ..."
Article in WSJ about shut in wells in the Bakken and various entities and individuals who are
taking their first stab in the oil business by purchasing distressed Bakken production.
Hope they have their eyes wide open, so to speak.
Saw that Oasis sold all of its non Middle Bakken/TFS wells and acreage for $16.5 million to
Samson. Not the KKR bankrupt Samson, but the Austrailian penny stock Samson.
780 BOEPD net and over 50K of acreage, but lots of shut in wells.
I hope everyone understands that by 2020, most of the 2014 and prior vintage Bakken and TFS
wells will be just like what Oasis sold, 21,000′ well bores making under 20 bopd.
Think we'll stick to the ones that make 1/20th of the oil but are also 1/20th of the depth.
There are going to be about 40,000 stripper wells in the US that have a TD in excess of
15,000′ in about 5 years. If those are economic I think we will be very happy.
is that "we" meant to be the you oil barrons :-), I think the Nathaniel's and Fred's of the world
might have a different perspective, but it may also be a learning experience. For the first time
in a year the light at the end of the tunnel might not be the another freakin train.
BRIEF -- WPX Energy Inc prices public offering of 49.5 mln shares for total gross proceeds (before
estimated expenses) of about $485 mln
The stock went up with the dilution (?) and they plan to use the money to drill wells:
"WPX says it plans to use the proceeds for general corporate purposes, which may include an acceleration
of drilling and completion activities, bolt-on acreage acquisition, and midstream infrastructure
in the Delaware Basin."
The Mighty MIGHTY MARKET and the ( near) Invincible Invisible Hand really can work economic
miracles, sometimes, not every time, given time enough.
Here is an example of incremental change that can WORK, NOW. Plug in hybrid trucks aren't going
to solve the oil depletion problem. Electric cars won't solve it either. But they will DELAY the
day of reckoning- maybe long enough for us to change our ways sufficiently to avoid an economic
catastrophe.
Twenty four miles on battery power alone is enough to cut substantially into diesel fuel consumption
if a truck is running a short route. Ten years from now, fifty miles on battery power alone will
probably be feasible.
According to consulting firm McKinsey, the
current oil futures market is pointing to a coming balance between demand
and supply-a balance which has the potential to render most oil and gas
investments uneconomical.
The futures market is often a reliable
guide to forcasting the future direction of oil prices, and analysts rely
on both contangos or backwardation when determining their forecasts.
During a supply glut, a contango is typically observed. This is a
condition where the spot price for future contracts is far higher than
the current price for nearby contracts. This means that people are
willing to pay more for a commodity sometime down the road than the
actual price for the commodity.
Backwardation is noticed when the current demand is higher than the
supply, thereby making the nearby contracts costlier compared to future
contracts.
(Click to enlarge)
Until around 2005, backwardation was the normal condition, as seen in
the charts. But since 2005, contango has become the normal condition,
reports
Reuters
. Experts differ on their views regarding this shift.
Large contango is indicative of market bottoms. During the 2008-09
crude oil crash, the oil market witnessed a super-contango, when the
price difference between the first month and the seventh month contract
had reached up to $10 per barrel.
Similarly, during the current crisis, the contango reached $8 per
barrel twice, once in February of 2015 and again in February of 2016, as
shown in the chart below, after which, the markets bottomed out.
During the 1985-2004 period, the average backwardation was $1.07 per
barrel, and during the 2005-2014 period, the average contango was $1.50
per barrel as shown in the chart below. The current contango hovers
around $2 per barrel, which is close to the average during the 2005-2014
period.
(Click to enlarge)
The current oil crisis is unlike the oil
crisis of 2008-2009, as there is no demand destruction this time. Demand
for oil is on the rise and is likely to increase by 1.5 million barrels
per day, both in 2016 and 2017, according to the latest
Short-Term Energy Outlook
by the U.S.
Energy Information Administration.
In the short-term, the supply outages to the tune of 3 million b/d
have supported oil prices by easing the supply glut and restoring the
balance between supply and demand. If supply is restored, the oil markets
will again return to a surplus, putting pressure on prices.
Due to low oil prices, billions of dollars in investments have either
been scrapped or postponed. As and when the markets shift from surplus to
deficit, new supply will find it difficult to catch up with increased
demand. Markets need higher prices for investments to start trickling
into the industry.
However, consulting firm McKinsey believes that oil demand will peak
around 100 million barrels per day by 2030 from the current levels of 94
million barrels per day.
"This change is driven by three factors: first, overall GDP growth is
structurally lower as the population ages; second, the global economy is
shifting away from energy-intense industry towards services; and third,
energy efficiency continues to improve significantly," McKinsey's Occo
Roelofsen said. "Peak oil demand could be reached around 2030", reports
The Telegraph.
If oil demand behaves according to Mckinsey's expectations, most new
investments into oil will be uneconomical due to weak demand in the
future.
Though the long-term is slightly uncertain, balance is maintained in
the short-term. Unless we see supply outages restored, prices are likely
to remain in a small range following an impressive run.
06/09/2016 at 12:11 am
Some interesting DUC numbers from Bentekenergy.com for the Marcelus. 2010
current, down 700 since Oct last year. The question remains, at what price and
stock of DUCs, is required for the producers start drilling again.
Northeast rig count continues downward march
Tuesday, June 07, 2016 – 5:45 AM
Active rigs in the Northeast have, yet again, hit another all-time low at 30
rigs for the week-ending June 3, down by 66% over the past year and by two rigs
over the past week. Rigs have been on a precipitous slide since a recent peak
of 144 during the first week of August 2014, declining by about 1.2 rigs per
week. Producers Chesapeake Energy, Consol Gas, EQT, Range Resources, and Ascent
Resources have accounted for half of the total drop since the August peak, with
Chesapeake and Consol reporting zero rigs in the most recent data. Bentek is
currently tracking 2,010 wells in inventory for March, down by nearly 700 wells
since the October 2015 high and has helped production stay afloat as active
rigs dwindle across the region. The wells in inventory will help offset the
0.8-1.0 Bcf/d first month-on-month decline from existing producing wells and if
assuming drilling remains flat.
The Saudi's new energy minister, Khalid Al-Falih, told reporters in Vienna that the Kingdom currently
can produce 12.5 million barrels of crude per day, but plans to keep some of this in reserve despite
the privatization of a small part of the company by 2018. He also told the reporters that the Saudis
will no longer be the world's "swing producer" and will no longer control prices by raising and lowering
production through OPEC quotas.
The Saudis are preparing to borrow some $15 billion by July to cover state budget deficits that
reached 15 percent last year. The government's new "National Transformation Plan" that will be unveiled
shortly envisions cutting subsidies and other measures that will produce $100 billion in non-oil
revenues. The Saudis are even talking about more women joining the work force – an anathema to religious
conservatives.
Saudi Aramco is planning to increase its cross-country pipeline that can now move some 5 million
b/d from the eastern oil fields to the west coast where it is planning to expand its refineries and
petrochemical plants.
The Saudi's deputy crown prince and de facto ruler of Saudi Arabia will be visiting Washington
in mid-June to discuss a number of growing frictions between the two countries.
The best thing here is:
Capex is slashed worldwide, hidden capex from 3rd world states I think even more since they are
simply broke with the current oil prices.
And the production continues to increase – why this Capex frenzy the last years, if you can
increase production simply on no money spending, rust and decline being no problem anymore.
"... The major factor pushing prices higher last week was the unplanned production outages in Alberta, Nigeria, and Venezuela. Although the fires are now well past the Alberta tar sands, it will be several weeks before the 1 million b/d of production that had to be shut down during the firestorms can return fully to production. In the meantime, the Alberta outage and the one in Nigeria have likely removed much or all of the production surplus that has overhung the markets and for now, there may be a rough balance of supply and demand. ..."
"... In recent years, these companies have seen a string of massive cost overruns such as in the Caspian and Bering Seas, and disasters such is Deepwater Horizon in the Gulf of Mexico. Last year the oil industry discovered only 12 billion barrels of new reserves, about a third of annual global consumption. ..."
"... Nearly all of the major oil companies reduced capital spending to less than half of what it as been in recent years. With decreasing oil production, supply is likely to start falling short of demand later this year, if it has not already, due to the various outages. ..."
Oil prices hovered just below the $50 level last week with Brent closing just above $50 on
Thursday before settling at $49.46 on Friday. As has been the case lately, there were numerous
factors pressuring oil prices one way or another. The week opened with much enthusiasm that OPEC
would agree to a production freeze, but this went away when the OPEC meeting failed to take any
action. The major factor pushing prices higher last week was the unplanned production outages
in Alberta, Nigeria, and Venezuela. Although the fires are now well past the Alberta tar sands,
it will be several weeks before the 1 million b/d of production that had to be shut down during
the firestorms can return fully to production. In the meantime, the Alberta outage and the one in
Nigeria have likely removed much or all of the production surplus that has overhung the markets
and for now, there may be a rough balance of supply and demand.
While production in Alberta is returning to normal, the political/economic situations in Nigeria
and Venezuela continue to get worse with the likelihood that both countries will soon see a
significant drop in oil production – possibly enough to offset surplus production elsewhere.
There is no end in sight to the problems in either of these countries, and their situations
seemed destined to get worse before they get better.
The US crude inventory saw a small drawdown last week, which is not surprising considering the
outages in Alberta over the past month. The EIA continues to estimate that US production is still
dropping. However, the US oil rig count climbed by nine units last week as drillers responded to
oil prices approaching $50 a barrel coupled with a buyers' market for oil production services and
oilfield workers. The meager increase in US employment last week has some worried about the
outlook for US economic growth in the near future. At a minimum, the widely expected interest
rate increase by the Federal Reserve is likely to go on hold for a while.
The problems of the oil industry continue, however, with US bank earnings down 2 percent in the
first quarter largely due to delinquent loans to the oil industry where bankruptcies continue to
be announced. Observers are starting to talk about the inevitable decline of the large
international oil companies. These companies are finding it increasingly difficult to find new
reserves to exploit and those that are available are mostly in deepwater projects where the costs
of extraction are well above the current selling price of oil. In recent years, these
companies have seen a string of massive cost overruns such as in the Caspian and Bering Seas, and
disasters such is Deepwater Horizon in the Gulf of Mexico. Last year the oil industry discovered
only 12 billion barrels of new reserves, about a third of annual global consumption.
Nearly all of the major oil companies reduced capital spending to less than half of what it
as been in recent years. With decreasing oil production, supply is likely to start falling short
of demand later this year, if it has not already, due to the various outages. Global crude
reserves are still at record levels, so daily shortages of even a million b/d or two are unlikely
to send prices into three figures right away.
By 2020, give or take a bit, prices are likely to start climbing into new territory as
shortages become larger, and rationing-by-price again comes into effect.
"... The longer it takes the EIA to correct this the more dramatic the market reaction will be. I could see a severe price reaction since WTI is now firmly above $50, and the overwhelming sentiment/fear is that frackers will all instantly completing thousands of wells at that price. It would be an incorrect conclusion, but the timing between $50 WTI and revisions that show increased production would match the sentiment perfectly and oil prices would surely experience a significant correction. ..."
Well hell, if you can cut capex by 62% and continue to produce at record highs, then I say go
for it.
...In November 2014 the [rig] count stood at 3,570 rigs. Last month the count was 1,405, a
drop of 2,165 rigs or 61%.
...If my prediction of 2015 as the year crude oil peaked is to be proven wrong, it looks like
those making that claim will have to wait a few years to make their case. I know, there is
nothing about OPEC in this report but OPEC is looking pretty shaky right now.
Brian Rose, 06/07/2016 at 4:38 pm
Dennis,
When would you expect it to become clear to the markets that U.S. production has been higher
than forecast for several months?
The EIA's weekly inventory and production data comes out tomorrow morning. Any chance that
they will start moderating their weekly production decline estimates tomorrow, or even say
production increased to make up the gap?
Anyone here know what the time lag is likely to be?
I mean, the gap has become wide enough that they must be aware that their stated production is
too low, right?
The longer it takes the EIA to correct this the more dramatic the market reaction will be.
I could see a severe price reaction since WTI is now firmly above $50, and the overwhelming
sentiment/fear is that frackers will all instantly completing thousands of wells at that
price.
It would be an incorrect conclusion, but the timing between $50 WTI and revisions that show
increased production would match the sentiment perfectly and oil prices would surely
experience a significant correction.
learner2, 06/07/2016 at 6:01 pm
If the EIA comes out saying production had increased to fill the gap, I would think the
market will see that the price went up in real time, meaning supply and demand already
balancing, implying that demand must be really high to soak up all the supply. I don't think
thats a reason to sell, quite the opposite in fact.
"... My initial advice would be to see what the CEO, upper management, etc., are being paid and then compare that to the company's total production. Look at G & A per barrel, or per BOE. ..."
"... The problem with a lot of public companies in the E & P space, both shale and non-shale, is that they are ran primarily for management, and not for the shareholders. ..."
"... I see a lot of relatively small E & P's that are cash flow negative that are borrowing to pay the upper management big salaries. ..."
"... So, if you see a public company producing under 10K BOEPD, where top management are being paid in the hundreds of thousands of dollars (or millions) in salary, my general advice is to stay away. ..."
"... Most private conventional E & P in onshore lower 48 have been paying little to no distributions since the end of 2014. Management is taking just enough salary to pay their personal expenses, if that even. Things are still very dire, although there is considerable improvement since Q1 2016. ..."
"... Please note my comment regarding the revised OCC (Office of the Comptroller of the Currency) guidelines. I see there are not comments on this. Further, the MSM has totally missed the boat on this. ..."
"... Shallow, I wish to acknowledge your OCC findings and all of your analysis regarding the economics and finances of shale oil development. Your value here on this blog is immense. I agree with you, by the way, that the ramifications of these new banking requirements will potentially end any additional lending to the shale industry…until it find ways to worm around these new standards. Which we should expect, of course. I mean, after all, the lower the price of oil goes, the lower shale oil breakeven costs go, the higher EUR's go. Its a miracle -- ..."
"... Shale oil proponents have the unique ability to disassociate themselves completely from the business of producing hydrocarbons and, forgive me, are delusional about economics, profit, and where the money comes from to drill wells. They don't get it. They don't want to get it. ..."
"... For financing reasons, environmental and social reasons, for reasons of enormous, unmanageable debt, the shale oil industry in America will never again be what it was, not even close. ..."
"... Initially, OCC was going to include ALL junior debt. The OCC apparently found out (I wonder how they did not already know?) that including ALL junior debt would result in massive borrowing base cuts, and force many more E & P's into either BK, or into mezzanine financing (high interest/onerous terms). To quote Raw Energy, cause a mini-meltdown akin to the mortgage backed security financial crisis. ..."
"... I think this issue is critical here, where many readers and posters are closely following US production. Absent the ability to issue equity, or obtain mezzanine financing, I'd say shale is going to have to drill out of cash flow. Further, shale is now taking a big risk by not setting aside any money to pay down junior debt. So, what little cash flow there is may be needed to pay down junior debt, not drill new wells. ..."
"... I don't think we would want the LTO industry to be what it once was, a loss making enterprise (for most companies), there were a few well run companies such as EOG that were profitable before the crash in oil prices. ..."
"... I expect by 2020 (at least) oil prices will be at least $80/b (in 2016$). ..."
"... The EIA's AEO 2016 reference case has WTI at $71/b in 2020 and $97/b in 2030 (both in 2015$). ..."
I just learned of the revised OCC guidelines for US upstream E & P.
They were released in late March, 2016.
I am embarrassed I am just learning of them. However, I am not aware of the US business
media reporting on them either.
I believe these new guidelines directly resulted in the numerous May, 2016 BK, and effectively
end much of the shale revolution. No longer will banks be permitted to ignore a company's junior
debt.
Haynes and Boone has a good summary dated 3/28/16.
Years ago I bought shares in a London listed company with producing assets in Russia. In
2012, Maxim Barskiy made a strategic investment in the Company. Shortly after doing so, he
took over as CEO. They sold the field in Russia and bought leases in the Texas pan handle with
active and non active stripper wells.
There have been various acquisitions and mergers, some wells are currently shut in but they
are still drilling vertical wells ( but only 4 this year). The interesting point is that they
are now fracturing these new wells in the old conventional fields.
I just wondered if you knew of any other operator that was re completing stripper well by
fracturing them.
My initial advice would be to see what the CEO, upper management, etc., are being paid
and then compare that to the company's total production. Look at G & A per barrel, or per BOE.
The problem with a lot of public companies in the E & P space, both shale and non-shale,
is that they are ran primarily for management, and not for the shareholders.
I see a lot of relatively small E & P's that are cash flow negative that are borrowing
to pay the upper management big salaries.
So, if you see a public company producing under 10K BOEPD, where top management are
being paid in the hundreds of thousands of dollars (or millions) in salary, my general advice
is to stay away.
Most private conventional E & P in onshore lower 48 have been paying little to no distributions
since the end of 2014. Management is taking just enough salary to pay their personal expenses,
if that even. Things are still very dire, although there is considerable improvement since
Q1 2016.
Please note my comment regarding the revised OCC (Office of the Comptroller of the Currency)
guidelines. I see there are not comments on this. Further, the MSM has totally missed the boat
on this.
I think many more public E & P's will be forced into bankruptcy due to the tighter guidelines
(which IMO should have been in place from the beginning – we would not be where we are today
if they had been).
Again, Haynes and Boone has a client letter dated 3/28/16 which can easily be found by Google
search. Maybe someone here can provide a link.
It is a big deal, IMO. Anyone who is trying to forecast US oil production needs to look
at this issue. I think it is going to choke off the alleged, "Return of rigs at $50 WTI".
The only companies able to do much now are those Permian guys who raised cash through diluting
the equity. I'd say the Bakken, EFS and Niobrara focused companies will not be able to do much
absent the NYMEX strip jumping about $25+ as that is what will be needed, minimum, to get PV10
high enough for them to qualify for more reserve backed funds.
Shallow, I wish to acknowledge your OCC findings and all of your analysis regarding the
economics and finances of shale oil development. Your value here on this blog is immense. I
agree with you, by the way, that the ramifications of these new banking requirements will potentially
end any additional lending to the shale industry…until it find ways to worm around these new
standards. Which we should expect, of course. I mean, after all, the lower the price of oil
goes, the lower shale oil breakeven costs go, the higher EUR's go. Its a miracle --
This OCC matter will be of little interest to most people, however. Shale oil proponents
have the unique ability to disassociate themselves completely from the business of producing
hydrocarbons and, forgive me, are delusional about economics, profit, and where the money comes
from to drill wells. They don't get it. They don't want to get it.
For financing reasons, environmental and social reasons, for reasons of enormous, unmanageable
debt, the shale oil industry in America will never again be what it was, not even close.
From what I have read, there are presently/will be a lot of energy loans examined under
these new guidelines between now and the next borrowing base redeterminations coming this fall.
Initially, OCC was going to include ALL junior debt. The OCC apparently found out (I
wonder how they did not already know?) that including ALL junior debt would result in massive
borrowing base cuts, and force many more E & P's into either BK, or into mezzanine financing
(high interest/onerous terms). To quote Raw Energy, cause a mini-meltdown akin to the mortgage
backed security financial crisis.
So, for now OCC is only including any junior debt which COMES DUE prior to the first lien
bank lines. Most of the bank lines are multi-year, so there could be a lot of junior debt which
does come due prior.
Further, OCC is counting not just the drawn, but also the undrawn amounts on the bank lines.
So, if Shale R Us brags they have a $2 billion line of credit, but only have $100 million drawn,
there is still a problem as the whole line is included in the calculation. It actually becomes
a detriment to have a large, undrawn, bank line.
Further, banks are now also being directed to use the NYMEX forward strip, rather than their
own price decks. This is a problem, as I suspect many of the banks have been assuming much
higher prices in 2018 and beyond, than is indicated by the futures strip.
Raw Energy, on Seeking Alpha, is much better versed on these matters than I am. Hopefully
he will write an article there about the implications of the new OCC guidelines.
I think this issue is critical here, where many readers and posters are closely following
US production. Absent the ability to issue equity, or obtain mezzanine financing, I'd say shale
is going to have to drill out of cash flow. Further, shale is now taking a big risk by not
setting aside any money to pay down junior debt. So, what little cash flow there is may be
needed to pay down junior debt, not drill new wells.
Consider the possibility that many LTO companies go bankrupt, that wipes out most of the
debt. Oil output decreases in the US. What would you expect might happen to World oil prices?
I don't think we would want the LTO industry to be what it once was, a loss making enterprise
(for most companies), there were a few well run companies such as EOG that were profitable
before the crash in oil prices.
Based on EIA data on proved reserves at the end of 2014 there is still some LTO oil that
can be produced. Higher oil prices ($80/b or more) will be needed for this oil to be produced
profitably.
I expect by 2020 (at least) oil prices will be at least $80/b (in 2016$).
What is your expectation for future oil prices? Do you believe oil prices will be less than
$70/b (2016$) in 2020?
Current futures strip is $56/b in Dec 2020, but futures do not predict future prices very
well that far forward.
The EIA's AEO 2016 reference case has WTI at $71/b in 2020 and $97/b in 2030 (both in
2015$).
Bloomberg New Energy Finance (BNEF) has a different number of global EV sales in 2015, "when
EV sales are estimated to have been 462,000, some 60% up on 2014."
The BNEF study, published in February, "forecasts that sales of electric vehicles will hit
41 million by 2040, representing 35% of new light duty vehicle sales."
"The research estimates that the growth of EVs will mean they represent a quarter of the cars
on the road by that date, displacing 13 million barrels per day of crude oil but using 2,700TWh
of electricity. This would be equivalent to 11% of global electricity demand in 2015."
Global light-duty vehicle fleet by type
source: Exxon (2016)
• Hybrid vehicles become more commonplace by 2040
• By 2040, one of every four cars on the world's roads will be a hybrid
• Conventional cars (primarily gasoline-powered) will remain most popular to 2040
• Plug-in electric cars see modest gains; cost and functionality remain barriers
• Natural gas remains challenged as a fuel for most personal vehicles
The study predicts 50 dollar oil slowly rising to 70 by 2040, very conservative. Considering
that a lot of new crude oil doesn't make a profit at $70 and old oil will have faded away by
2040, I find this study flawed.
I suppose they did not take into account that there will probably be less than 60 percent of
current crude oil production by 2040.
IEA is probably OK for use as historical data source, but any use of their forecasts is a sign
of gross negligence, based on their track record. Their 'waterfall" style forecasts are just
propaganda.
My feeling is that 80 dollars bbl are needs to increase shale oil production. Before that it will might be
continue to decline. Saudis are a spent bullet. So chances of them coming into play again with more oil to
suppress oil price further are close to zero.
If so, the key question we need to answer is when oil will hit this magic price point.
U.S. crude oil production averaged 9.4 million barrels per day (b/d) in 2015. Production is
forecast to average 8.6 million b/d in 2016 and 8.2 million b/d in 2017, both unchanged from last
month's STEO.
EIA estimates that crude oil production for May 2016 averaged 8.7 million b/d,
which is more than 0.2 million b/d below the April 2016 level, and approximately 1 million b/d
below the 9.7 million b/d level reached in April 2015.
U.S. oil and natural gas producer Devon Energy Corp said it would sell assets in Texas for
nearly $1 billion and that it was making progress on the sale of other assets as part of its plan
to improve its finances through divestitures.
Devon said on Monday it would sell producing assets in east Texas for $525 million and in Anadarko
Basin's Granite Wash area for $310 million.
The company will also sell its royalty interests in the northern Midland Basin in the Texas
region for $139 million.
With these sales, Devon's proceeds from divestitures of natural gas-focused assets would total
$1.3 billion, Chief Executive Dave Hager said.
"Proceeds for the entire divestiture program are well on their way to achieving our previously
announced range of $2 billion to $3 billion in 2016," Hager said.
The company said it expected to make an announcement within the next several weeks on the sale
of its 50 percent interest in Canada's Access Pipeline, which carries heavy oil across northeastern
Alberta.
Devon also said it was making progress toward selling more Midland basin assets that produced
an average of 25,000 barrels of oil equivalent per day in the first quarter.
Warren Resources Inc., Denver, filed for bankruptcy protection in a Houston federal court on
June 2 after negotiating a debt-for-equity swap with a group of senior lenders led by Blackstone
Group's GSO Capital Partners.
Senior lenders agreed to swap $248 million they are owed for an 82.5% stake in the reorganized
company, court papers showed.
Warren Resources primarily focuses on oil in the Wilmington field in the Los Angeles basin
of California, natural gas in the Marcellus shale in Pennsylvania, and the Washakie basin of Wyoming.
=========================================
On May 29, 2016, US subsidiaries of Linc Energy Ltd. filed voluntary petitions for relief under
Chapter 11 of the United States Bankruptcy Code.
Linc Energy is a global business with oil and gas operations primarily onshore in the USA (Alaska,
Texas, Louisiana & Wyoming); exploration for shale oil and gas in the Arckaringa Basin in South
Australia; developing a proprietary technology for the extraction of heavy oil; and a number of
opportunities to apply its proprietary Underground Coal Gasification (UCG) technology in target
markets including Asia and Africa.
Dennis – you asked at some previous post about discovered, undeveloped reserves. Overall I'd
go with Jean Laherrere, he knows more about these things than most and definitely understands
the politics behind some government forecasts, looks at things globally and probably still has
access to some of the more confidential figures. My less informed view is as follows.
So far about 1350 billion barrels C&C have been produced. Current production is about 28 billion
per year excluding extra heavy oil. Recently Rystad indicated mature filed decline rates at 5%
per year, if that held through the complete depletion (unlikely but all I have to go on) that
would mean another 540 billion, at 3% average decline it would be 900 billion. For 2200 billion
total that could mean (say) another 100 billion to find, 50 billion which is developed but offline
(in Libya, neutral zone, Abqaiq maybe, Syria etc.) and 150 billion discovered but undeveloped.
If there is that amount (or more for higher URR or higher overall decline rates, maybe up to 900
billion by your figures) it must be in OPEC Middle East countries or Russia. A lot of the older
undeveloped, mostly heavy oil, reserves elsewhere have been developed recently (e.g. in the North
Sea) in response to high oil prices. Similarly deep sea in GoM and offshore Africa and Brazil
(see the paper above – there isn't much left in the GoM and discoveries have dropped to near zero
per year). The larger reserves that I know about are complicated and expensive to develop (e.g.
Brazil pre salt, Kazakhstan high sulphur) or have some political issues (offshore Nigeria). I
don't think these would total more than 50 billion though.
If the Middle East OPEC countries have significant known undeveloped reserves they don't act
like it – i.e. why develop tight gas fields, or explore deep sea pre-salt, or double or more the
number of exploration and in fill wells, or get IOCs to come in and redeveloped existing fields.
Somewhere I read that Saudi assume 75% recovery and develop their fields to deplete 2% of the
field per year during plateau phase. That sounds about right for a URR of 250 billion (i.e. assuming
they report total recoverable resources, not what is left) but would mean pretty much everything
they have is on production with nothing much known but undeveloped. 75% may be high but I think
probably achievable for huge onshore fields (not so much for heavy oil offshore like Safinayah;
Abqaiq, which may be exhausted by now; or the neutral zone, which sounds like it needs steam flood
to recover much more). To me Saudi's recent posturing is about setting up excuses for post peak
declines, without having to admit they don't have as much oil as they've stated. Also Kuwait's
initiative as described in terms of new exploration and debottlenecking existing facilities, not
developing known fields.
IHS, Rystad and Wood Mackenzie probably know more, but their past performance at predicting
anything makes you wonder (Rystad seems better than the others though).
For extra heavy oil I think the recovery factors are probably overstated and based on the early,
and easiest to exploit developments. However this probably doesn't make much difference as the
limiting factor is the surface production facilities, and will be for the next few decades. CAPP
predict Canadian oil sands rising to about 3 to 4 mmbpd by 2030, but even this presupposes another
two pipelines approved and built and a sustained, high oil price (i.e. above $100, and probably
more if natural gas prices start to rise at the same time).
In Venezuela exploiting the extra heavy oil would be difficult even for a stable society. It
needs a large amount of oil wells in areas without that great infrastructure (I think around 5
to 10,000 per mmbpd), additional pipelines (I guess piggybacked so the Naphtha diluent can be
recycled), and a bunch of new upgraders – one for every new 200 to 300,000 bpd. The existing upgraders
aren't in great shape, a lot of the skilled workforce from these actually left for USA when the
industry was nationalised. There is a significant shrinkage (I think 15 to 30%) in the upgraders
as they take out carbon to make the oil lighter (compared to hydrocrackers used in places in Canada
which add hydrogen from natural gas). They produce highly toxic waste streams of coke, sulphur
and heavy metals, which need to be safely stored for ever after (I wonder how that's going there
at the moment). The three phases of the Carabobo development, which was supposed to get to 1.2
mmbpd by 2018 don't seem to be going anywhere – oil is still being trucked I think, the new upgraders
are on permanent hold, the well services companies are pulling out, and the government can't afford
to buy the diluent naphtha. That is a recipe for prolonged decline, not growth to 8 mmbpd, which
was once proposed.
Ecuador has ultra heavy oil, discovered and undeveloped, of about 6 billion – but no-one has
figured out how to develop it commercially. The upgrader required has really been proved technically.
They were working with Ivanhoe on something that looked to me a bit like a CTL system, but Ivanhoe
went bust so I don't think this is going anywhere. Overall anything more than about 5 or 6 mmbpd
from extra heavy sources would be stretch over the next 20 to 30 years.
The recent UK production benefited mostly from Golden Eagle ramp up through 2015. Buzzard is by
far the largest single producer at about 180,000 bpd. It is due for an extended turn around this
year. It also more than doubled it's water cut over the last six months, so could be coming off
plateau quickly (ramp up was through 2007). It will be a contest between it's decline against
new production from Clair Ridge and Glen Lyon and 3 or 4 smaller projects over the next 2 years
(about 300,000 bpd combined plateaus).
The government prediction is for a gentle decline of about 15% overall to 2021, but if a lot
of the smaller producers get shut down in the near term it might be a bit steeper.
Exported oil from Canada totals 120,000,000 barrels per month, 4,000,000 bpd.
Imported oil from Canada included in the net import numbers?
11 cars of crude from the Bakken derailed in Oregon today and caught fire. likbez
,
06/04/2016 at 12:41 pm
There is another nuance here that was discussed before: It looks like EIA does not subtract
imported from the USA dilutant in the total volume of oil exports from Canada overstating the
total heavy oil production by this amount (double counting).
Raw bitumen must be blended with around 30% of diluent. At the moment Canada uses for diluent
about 200,000 to 250,000 bpd of condensate, most of that imported from the United States. Much
of it travels from the U.S. Gulf Coast, where supply is abundant so there are significant transportation
costs involved.
It overstates the world total production by the amount of condensate used for dilution, is
not it?
In this case EIA adds production numbers from all countries, but it do not take into account
that part of Canadian oil and Venezuelan oil was "already produced" and accounted in the USA
production stats.
So Dennis your world production figures are fudged :=)
The production statistics include the oil produced, not the oil shipped.
So no the production statistics may not be overstated.
Canadians are pretty smart, I believe they know how much oil they produce and are not counting
the condensate imported to ship the bitumen as "produced oil".
My guess is that the secondary sources that estimate Venezuelan output also know they should
not count imported condensate as oil production.
The calculation is really quite simple, if one counts production by what flows through the
pipeline, just deduct the imported condensate used to create the dilbit.
The World numbers are not that accurate so any number reported is no more than a rough guess
(+/- 1 Mb/d).
The article should also account for the speculation that impacted prices as
institutional investors, producers, consumers and the speculators embarked on
hedging oil prices that led to some bizarre consequences. As these hedges
expire, the futures market is yet again getting into new windows of opportunity
for all of these four constituencies. Large consumers of oil like the airlines
industry and the producers of oil hold the two opposite poles of the hedges,
while the other two act as long term and short term investors in the game. This
would have completed the otherwise deeply data driven article to its fruition.
The interesting question is, what is driving the oil price at any
given moment in time? It's not always the same thing. From July last year
until, say, a few weeks ago, spot was driving futures prices. Ordinarily,
the medium term futures prices (say, 18-24 months out) should represent
some notion of marginal cost, with oil prices tending to return to that
level over time. The spot price would in turn be determined by the
futures prices less the cost of storage and capital, in the case of
onshore storage, perhaps $0.50 per month. Therefore, if we thought $65
was marginal cost, then the spot price should be about $12 less, so
figure $50-55.
However, this notion disintegrated last summer, because investors lost
confidence in both marginal cost and the time necessary to achieve it (ie,
how long it would take the market to clear). Further, supply-demand data
was so unreliable (and remains so today), that market participants could
not determine the actual state of play. How big was that oil supply glut?
To this day, we're really not sure.
Without data and confidence in the clearing interval. investors turned
instead to the spot price for guidance. We can know with some certainty
what oil traded for today. The futures prices thus became the spot price
plus the cost of storage.
But what determines the spot price in a glut? This price may be highly
susceptible to news and sentiment. And I think it was, particularly
sentiment related to China. Now, if you're using a fundamentals (ie,
marginal cost-based) model, then the last year has been all but
unintelligible. So the model you use has to change with prevailing market
conditions. Prices are not always determined by the same driver, or to
quote Scott Sumner, never reason from a price change.
I wonder to what extent did ethanol and other biofuels made up for flat oil
production in the 2005-2013 period.
I seem to recall an opinion from Francisco Blanch at Bank of America Merrill
Lynch that oil would have to reach US$60/bbl before new wells were drilled in
the USA. I tend to think that volatility will keep capital backers over in the
cautious camp even if oil does temporarily lurch north of US$60/bbl.
These recent supply interruptions, including the wild fire in the Fort
McMurray area of northern Alberta were all unanticipated for the most part.
Except Nigeria and Venezuela perhaps. Those two poster children for the
Resource Curse were expected to fall apart at some point though getting the
exact timing is always tough.
Northern Alberta heavy oil production will recover quickly. Nigeria and
Venezuela?
Incidentally, oil consumption is growing again in Mexico. See John Kemp's
article at reuters.com.
The EIA tracks two type of net US oil imports: (1) Net crude oil imports,
which is the net volume of crude oil that US refiners import in order to supply
their refineries with the mix of Crude + Condensate (C+C) that they need and
(2) Net total liquids imports, which are basically gross exports less gross
imports, inclusive of total liquids production, including biofuels and refinery
gains.
Both EIA metrics showed increasing US annual net oil imports from 2002 to
2005, and declining US annual net oil imports from 2005 to 2015. However, US
net imports have shown a large year over year increase. Based on year to date
weekly supply data through 5/20/16, US net crude oil imports increased from 6.8
million bpd last year to 7.4 million bpd this year (versus same time period
last year). Net total liquids imports increased from 5.2 million bpd last year
to 5.6 million bpd this year.
Note that this is the first time since the 2002 to 2005 time period that
both the US and the Chindia region are showing increasing net oil imports.
Circa 2002 to 2005, annual Brent crude oil prices approximately doubled from
$25 in 2002 to $55 in 2005, a rate of increase of 26%/year. It's important to
remember that what I call Global Net Exports of oil (GNE*) increased strongly
from 2002 to 2005, but the available data suggest that GNE have been below the
2005 rate for probably 10 straight years, through 2015.
So, the last time that the Chindia region + the US showed increasing net oil
imports, annual Brent crude oil prices increased at 26%/year from 2002 to
2005–versus an increasing supply of GNE.
But this time the Chindia region + the US are showing increasing net oil
imports–versus an almost certain ongoing post-2005 decline in GNE.
And again, when analysts discuss "Crude oil," they generally mean Crude +
Condensate (C+C), and in my opinion, we are probably in the early stages of a
very sharp decline in actual global crude oil production (45 API Gravity and
lower crude oil)–my premise being that only trillions of dollars in post-2005
upstream global capex has heretofore staved off a collapse in actual global
crude oil production, and that very upstream global capex is now collapsing
(see link below).
Incidentally, gross US C+C exports have declined year over year, down from
0.5 million bpd last year to 0.4 million bpd this year (year to date data
comparisons), even as US export restrictions were eliminated. I suspect that US
shale players have borrowed billions of dollars in order to build up a huge
surplus of a commodity for which there is little incremental demand, to-wit,
condensate.
*Combined net exports from (2005) Top 33 net exporters (total petroleum
liquids + other liquids production less total liquids consumption, EIA)
In regard to the volumetric decline from existing wells, US operators are
facing two challenges, even apart from the economic issues: (1) As
production increases, the volumetric decline from existing wells increases
(at a given decline rate) and (2) as the percentage of total production that
comes from high decline rate tight/shale plays increases, the rate of
decline from existing wells increases.
For example, US Crude + Condensate (C+C) production averaged 5.0 million
bpd in 2008 and 9.4 million bpd in 2015.
If we assume a 5%/year rate of decline from existing wells in 2008, US
operators only needed to add 0.25 million bpd of new production in 2009 to
offset declines from existing wells.
If we assume a 15%/year rate of decline from existing wells in 2015, US
operators would need to add 1.4 million bpd of new production in 2016 to
offset declines from existing wells, which is clearly not happening.
The math is similar for both oil and gas, although the rate of decline
from existing wells appears to be higher for gas. I frequently cite a Citi
Research estimate that the rate of decline in existing US gas production is
about 24%/year. As support of this estimate, Louisiana's net rate of decline
in marketed gas production from 2012 to 2014 was 20%/year (this was the net
rate of decline, after new wells were added; of course, the decline followed
the collapse in the Haynesville Shale Gas Play rig count).
In any case, a reasonable estimate is that the US currently needs about
17 BCF/day of new gas production per year, just to offset declines from
existing wells. 17 BCF/day matches or exceeds the 2014 dry gas production
rate of every country in the world, except for the US & Russia (BP data).
Of course, with continued low rig counts, hyperbolic decline rates will
moderate the rates of declines in existing production, but for both oil and
gas US operators are facing much higher volumetric rates of decline in
existing production–versus what they faced prior to the tight/shale boom.
Following are the monthly marketed gas production numbers for Louisiana
for March (from both conventional and tight/shale gas), for 2012 to 2016,
along with the year over year net exponential rates of decline in monthly
production (of course gross rates of decline from existing wells would be
even higher):
3/12: 252 BCF/month
3/13: 219 (14%/year)
3/14: 173 (24%/year)
3/15: 167 (4%/year)
3/16: 154 (8%/year)
Link to a graph showing total Haynesville Shale Gas Play gas production
(presumably from both Texas and Louisiana) versus the rig count:
I estimate that Saudi net exports (total petroleum liquids + other liquids,
EIA) fell from 9.5 million bpd in 2005 to around 8.7 million bpd in 2015, and
since all available data indicate that Saudi net exports were below their 2005
net export rate of 9.5 million bpd in the intervening years, Saudi net exports
have almost certainly been below their 2005 rate for 10 straight years.
And:
Saudi Aramco CEO (January, 2015): "The math will tell you that our
exports are gradually declining."
In order to get a rough estimate of post-export peak CNE (Cumulative Net
Exports) I take the rate of decline in what I call the ECI Ratio (ratio of
production to consumption) and then estimate when the ECI Ratio would approach
1.0 and thus zero net exports (production = consumption). I then multiply
annual net exports at peak times the number of years to estimated zero net
exports, divided by 2 (to get the area under a triangle), and I then subtract
annual net exports at peak, to get estimated post-export peak CNE.
The Six Country Case History consists of the major net exporters that hit or
approached zero net oil exports from 1980 to 2010 (excluding China)–Indonesia,
UK, Egypt, Argentina, Malaysia, Vietnam. Their combined net exports peaked in
1995, but their combined production did not fall below the 1995 rate until the
year 2000.
Based on the 1995 to 2002 rate of decline in the Six Country ECI Ratio, they
would approach zero net exports around the year 2015. Their annual net exports
in 1995 were 1.0 Gb/year. So, estimated post-1995 CNE, based on the initial
seven year (1995 to 2002) rate of decline in the ECI Ratio, were as follows:
(1.0 Gb/year X 20 years X 0.5) less 1.0 Gb = 9.0 Gb
Actual Six Country post-1995 CNE were 7.3 Gb, and they hit zero net exports
in the year 2007. Note that in only four years (from 1995 to 1999), as the Six
Countries showed increasing production, they had already shipped 54% of
post-1995 CNE.
If we do a similar exercise for Saudi Arabia, using estimated numbers for
2015, it suggests that post-2005 Saudi CNE will be on the order of about 60 Gb,
with 2006 to 2015 inclusive CNE of about 30 Gb, suggesting that Saudi Arabia
may have already shipped about 50% of their total post-2005 supply of CNE.
Note that by definition, it's not whether, but to what degree, that Saudi
Arabia has depleted their remaining volume of post-2005 CNE.
• Decade-long improvement in fuel efficiency in U.S. seen ending
• Light trucks, vans, SUVs account for 60% of U.S. vehicle sales
Last year, SUVs outsold any other type of passenger vehicle in Europe
for the first time, according to auto industry consultants JATO Dynamics.
The trend has continued in 2016, with demand for SUVs … accounting for a
quarter of sales in the biggest European countries.
Europe is a mirror of what's happening across the world. From China to the
U.S., drivers are buying bigger vehicles, while sales of fuel-efficient
hybrids struggle.
[In the U.S.] the average car sold in April achieved a fuel economy of
25.2 miles per gallon, down from a peak of 25.8 set in August 2014, just
before oil prices crashed, according to data from the Transportation Research
Institute at the University of Michigan. At current trends, this year will
mark the first drop in average U.S. fuel economy since at least 2007, the
data show.
"Fuel-economy improvement is really flatlining," said Sam Ori, executive
director of theEnergy Policy Institute at the University of Chicago. "The
gains completely stopped right at the same time that oil prices started
to decline."
Today in the U.S., light trucks, vans and SUVs account for 60 percent of
total vehicle sales - a level only reached briefly in 2005, when Brent crude,
the global oil benchmark, averaged $55 a barrel. It's now around $50. The
International Energy Agency said in May that less-efficient vehicles, including
four-wheel drives, "remain very much in vogue, a consequence of persistently
lower retail pump prices."
In 2008, when oil prices averaged $100 a barrel, the share of gas guzzlers
in U.S. total vehicles sales dropped at one point to just 43 percent.
With larger vehicles hitting the roads and Americans driving longer distances
as the economy recovers, U.S. gasoline consumption is set to rise to a record
in 2016, according to the Energy Information Administration. U.S. gasoline
demand will average 9.3 million barrels a day this year, surpassing the
peak set in 2007, the EIA said in its most recent monthly report.
The EIA forecast U.S. drivers will enjoy the cheapest gasoline this driving
season in 12 years.
In China, the world's second-biggest oil consumer, drivers are also opting
for larger vehicles as never before. While cheaper gasoline and diesel helps,
analysts said it's higher incomes - and a desire to impress relatives and
friends - that's driving the purchases. According to official data, vehicles
such as light trucks and SUVs accounted for almost 35 percent of total Chinese
passenger sales in April, up from 10 percent in 2010 and less than 5 percent
a decade ago.
You are right AlexS, Americans need to be more frugal and forward thinking.
My town wants to allow a gas station to be put in near the highway, there
is a gas station a short drive away. Not only will the gas station be mere
feet from a Category 1 trout stream, it will be almost at the level of the
stream. The three large tanks will be actually buried in the aquifer for
the town and have to be held down from floating. Everything runs off wells
here, so contamination will effect much of the town and wreck the aquifer.
To top it all off, the land is now a ride-sharing lot, something that
reduces fuel use and pollution as well as reduces the wear and tear on cars
(slowing down the need for vehicle replacement and all the energy/pollution
that involves).
There are gas stations just a few miles in either direction along the
highway.
US Weekly Petroleum
Status Report has US C+C production down 32,000 bpd for the last full week in May to 8,735,000
bpd. No surprises here, this is exactly what I had predicted. US lower 48 production was down
40,000 bpd for the week, Alaska was up 8,000 bpd.
This is important people, US crude oil production is now in full scale retreat.
If you doubt these doubt these falling production numbers then explain the climbing net import
numbers. US weekly net petroleum products imports, 3 month average and 6 month average reached
a two year high this week.
When production is falling, and consumption is not falling, then the only solution is import
more, a lot more.
We are importing, on average, almost one million barrels per day more than we were just
last November.
"... Well, all I can say is the 'plan' did not work out so well. The US LTO industry is 250 billion in debt and dead broke. It will have to hoc it's fleet of G-4 600's and all of it's copying machines just to frac it's DUC wells. The only way it can drill another shale well is paying for it with MasterCard, on installments. Its at a dead stop alright. ..."
"... Lots of roads got tore up, then they got fixed, sort of, with all those "taxes" paid. Nobody got too drunk and save for a few earthquakes out in the parking lot, everybody had a grand time. Now pay the bill -- The band, the hall, the beer distributor, everybody wants to get paid. Can't throw a party and not pay the bills. Its un-Texas like not to. ..."
"... Again the shale boom has made my normal business life a much difficult environment to conduct business. However, it seems to me, taking Texas as an example, where Rick Perry used to run around telling people that 99% of NEW jobs in the US were generated in Texas, was a direct result of the boom even though it made my life more difficult. From a government point of view, compared to the alternatives, was/is the shale boom more efficient at increasing the velocity of money compared to let us say "cash for clunkers" or all those "shovel ready jobs" where government at all levels, union bosses etc take their cut of the money before it is ever spent at digging the hole. ..."
"... I have hammered and hammered on this, but apparently future net cash flows do not matter to shale. That is a big problem. Future net cash flow are the most important metric for any business. If those cannot retire the debt, over the long term, the business cannot survive. ..."
"... PXD says they need $50 WTI and they will add rigs. Per their own 10K, if the price stays at $50 WTI, they have almost no PUD value. So which are we supposed to believe? Why would they add rigs when the net future cash flows from those rigs will not pay back their cost? ..."
"... Then, we have the issue of CEO pay. Of course, CEO pay is akin to the oil lease promoter, who gets paid whether the well succeeds or fails. Management is still getting paid high salaries, despite that the companies cannot afford to pay them. ..."
"... Was looking at a shale gas company, Eclipse Resources, over on Seeking Alpha. They lost .58 per share in 2013, 1.27 in 2014 and 4.46 in 2015. PV10 all categories is $212 million, long term debt $527 million. The top three in management are still tapping the company for $500-$700K in salaries. And, this company is talking about making a profit on $30 million (yes, that is the cost) Utica wells with record length laterals. At $2.00 gas. The company is OPERATING at a loss, and always have. ..."
"... Sorry if this kind of nonsense makes me a little emotional. ..."
"... My model keeps saying the oil price average will be $65 (more or less) over the next three years. I guess I need to update the input data, and it may be a little bit different. ..."
"... The shale companies have posted losses every quarter in the last five. The upper management keeps making the big bucks. ..."
"... Now that Is Over report from Pew Research Center reveals that between the third quarter of 2000 and the same period of last year, wages across the U.S. rose by an impressive 7.4 percent in real terms, driven largely by the oil and gas industry. ..."
"... Wages in energy-dependent communities rose by the most, in some cases more than twofold, such as in Texas. This shouldn't be surprising as the period reviewed coincides with the peak of the shale boom in the country, even though it also covers two periods of recession. ..."
"... Before we tout all the amazing benefits that the shale oil revolution has given society, we should first see who actually pays for those benefits, right? I mean if it ends up being society that pays for it, soon, or down the road with the other 19 trillion dollars of debt we are leaving our kids, then it really isn't the shale oil industry we should be thanking, is it? ..."
"Shale oil offers a predictable, manufacturing-like business model around which companies
can plan. And it can be stopped and started on a dime depending on oil prices."
Well, all I can say is the 'plan' did not work out so well. The US LTO industry is 250
billion in debt and dead broke. It will have to hoc it's fleet of G-4 600's and all of it's copying
machines just to frac it's DUC wells. The only way it can drill another shale well is paying for
it with MasterCard, on installments. Its at a dead stop alright.
Yes, Mr. Tea; it was a great party the shale industry threw. It was really fun for less than 1/100th
of 1% of American's who got free royalty income, not so good for the hundreds of thousands of
men and women that got hired, then fired. Shareholder equity had an OK time; most I'll bet wish
they'd never come.
Lots of roads got tore up, then they got fixed, sort of, with all those "taxes" paid. Nobody
got too drunk and save for a few earthquakes out in the parking lot, everybody had a grand time.
Now pay the bill -- The band, the hall, the beer distributor, everybody wants to get paid. Can't
throw a party and not pay the bills. Its un-Texas like not to.
Texas tea. If you are equating shale to the US government borrowing money to give everyone $600
to stimulate the economy, I think you are making Mike's point.
SS, I am trying to understand the why and hows. I try to leave emotion at the doorstep and see
things from a bigger picture.
Again the shale boom has made my normal business life a much difficult environment to conduct
business. However, it seems to me, taking Texas as an example, where Rick Perry used to run around
telling people that 99% of NEW jobs in the US were generated in Texas, was a direct result of
the boom even though it made my life more difficult. From a government point of view, compared
to the alternatives, was/is the shale boom more efficient at increasing the velocity of money
compared to let us say "cash for clunkers" or all those "shovel ready jobs" where government at
all levels, union bosses etc take their cut of the money before it is ever spent at digging the
hole.
The answer to that question give us great insight to the future in terms of where we may make
investments decisions today. Lastly, irrespective of the economics, not compared to yesteryear,
but the alternatives of today, based on the article cited and the actual decisions being in corporate
boardrooms it appears LTO is here to stay.
I start with reading 10K and 10Q, and with actual production data. Facts.
The emotion comes from reading the facts, and then matching them to the claims. The claims
appear to be at best, misleading, at worst, false.
Over a year ago, when 2014 10K came out, I noted here that almost every shale player would
have PDP PV10 less than long term debt at $50 WTI.
As it turns out, in looking at the 2015 10K, many have PV10 ALL CATEGORIES less than long term
debt. Further, most took great liberties with estimates of future production costs in even arriving
at the 2015 PV10 numbers.
I have hammered and hammered on this, but apparently future net cash flows do not matter to
shale. That is a big problem. Future net cash flow are the most important metric for any business.
If those cannot retire the debt, over the long term, the business cannot survive.
PXD says they need $50 WTI and they will add rigs. Per their own 10K, if the price stays at
$50 WTI, they have almost no PUD value. So which are we supposed to believe? Why would they add
rigs when the net future cash flows from those rigs will not pay back their cost?
I'd be glad if you could explain how any of these companies are going to make it at the current
WTI and HH strips.
Heck, I would be happy if you can explain how CLR was able to reduce estimated future production
costs by 60% year over year, but yet only reduce reserves 9%. I continue to be astonished that
no one has noticed stuff like this.
Then, we have the issue of CEO pay. Of course, CEO pay is akin to the oil lease promoter, who
gets paid whether the well succeeds or fails. Management is still getting paid high salaries, despite that the companies cannot afford to
pay them.
Was looking at a shale gas company, Eclipse Resources, over on Seeking Alpha. They lost .58
per share in 2013, 1.27 in 2014 and 4.46 in 2015. PV10 all categories is $212 million, long term
debt $527 million. The top three in management are still tapping the company for $500-$700K in
salaries. And, this company is talking about making a profit on $30 million (yes, that is the
cost) Utica wells with record length laterals. At $2.00 gas. The company is OPERATING at a loss,
and always have.
Sorry if this kind of nonsense makes me a little emotional.
Shale is here to stay, and I hope it can someday pay for itself, because that will mean long
term $100+ oil.
Most companies set up budgets and plans on a price forecast which may be higher or lower than
current prices. They take that price forecast and use it to estimate project economics. Therefore,
this company is using a higher price forecast.
My model keeps saying the oil price average will be $65 (more or less) over the next three
years. I guess I need to update the input data, and it may be a little bit different.
you say "Shale is here to stay, and I hope it can someday pay for itself, because that will
mean long term $100+ oil."
I think the odd favor that scenario. To your larger question question, I don't think any body
on shore US thinks they will make money on any drilling prospect, be they conventional or unconventional
with the prices we have seen over the last 6 months. Here is the question, where do you feel the
most comfortable buying production, when oil is at $110 or $28, and why. That is the same calculation
that is being made industry wide.
The article I cited above make some very good points, drilling and marketing risk are greatly
reduced, the mix of product (gor) is also known. The one, and it is a big unknown variable, is
price, but price is and has always been the unknown. The energy is there, the amount is know (within
certain parameters) and it is my professional life experience that the industry will find a way
to produce it, to make it "economic" that assumes a higher price, better efficiencies and do not
discount the possibility of certain tax incentives, we have seen them before.
Shallow, you need not explain the emotional component to your shale oil economic analysis to anyone,
sir. Thank you for being gracious, but certainly not to me you do not need to explain. You, like
thousands of other operators in America, stripper or otherwise, have been devastated by the price
collapse recently, caused entirely by overleveraged LTO oversupply. You have your OWN money, and
likely a good part of your life, invested in your production and in caring for your employees.
Its hard not to be emotional when you are getting run over by a freight train. A freight train,
I might add, that drilled 41,000 shale wells with finding costs way less than the even the KSA's
finding costs…because the shale oil industry has essentially not paid for it's wells yet. It probably
won't ever be able to pay for them. Yet, you are correct, upper management in every public shale
oil company in the country is still making tons of money, with little regard for shareholder equity
and the probability of bankruptcy. If it doesn't seem fair, it's not fair. Anybody cheerleading
for the shale oil industry needs to carefully re-examine their own values.
Hold your head up high, buddy. You were here before the shale oil industry fell on the floor,
you'll be here long after they are gone.
Now that Is Over report from Pew Research Center reveals that between the third quarter of
2000 and the same period of last year, wages across the U.S. rose by an impressive 7.4 percent
in real terms, driven largely by the oil and gas industry.
Wages in energy-dependent communities rose by the most, in some cases more than twofold, such
as in Texas. This shouldn't be surprising as the period reviewed coincides with the peak of the
shale boom in the country, even though it also covers two periods of recession.
Respectfully, Mr. Tea, the oil industry did not drive wage growth, a Federal monetary policy that
allowed limitless, low interest loans to the oil industry, particularly the shale oil industry,
is what drove wage growth. It was just another form of economic stimulus.
Before we tout all the amazing benefits that the shale oil revolution has given society, we
should first see who actually pays for those benefits, right? I mean if it ends up being society
that pays for it, soon, or down the road with the other 19 trillion dollars of debt we are leaving
our kids, then it really isn't the shale oil industry we should be thanking, is it?
"... When the price's around $60, I asked Rex, "What do you think?" He said, "Well, it's going to be between $20 to $120, and we're set up for all of those environments. I think it'll go a little lower than higher, but what do I know? I've just been doing this my whole life." And I thought, he's kidding, but he really wasn't. ..."
The oil price is making a fool of everyone. That's according to Steve Schwarzman, cofounder of
private-equity giant Blackstone. The billionaire investor was speaking at the Bernstein Thirty-Second
Annual Strategic Decisions Conference 2016 on Thursday, and talked about the volatile oil price.
He said:
Let's just take energy first because it's in the news a lot. And talk about a crazy business
where there's almost not one person who knows what they're doing, right? At $120, it was going
to $140 a barrel. When you were at $80, it was going to stabilize at $60. And when you're in $60,
you didn't quite know, but maybe it would be $50 to $70. And then when it went to $24, everybody
is a bozo, right? And then it was going to stay there, sort of $25 to $35 or maybe $40 for the
next year or two, and now it's $50.
We've seen crazy swings in oil prices this year, largely driven by slowing demand, increased supply,
and speculation over a potential coordinated cut in the production of oil. US oil prices ended slightly
lower on Thursday after briefly rising above $50 a barrel in intraday trading.
Schwarzman said that his favorite person to talk to when trying to make sense of the oil market was
Exxon CEO Rex Tillerson. He said:
When the price's around $60, I asked Rex, "What do you think?" He said, "Well, it's going to
be between $20 to $120, and we're set up for all of those environments. I think it'll go a little
lower than higher, but what do I know? I've just been doing this my whole life." And I thought, he's
kidding, but he really wasn't.
"... Most probably you are wrong. LTO producers lost access to unlimited financing from Wall Street. They can't finance expansion from their cash flow (which is still negative), so they are cooked. Wells you are talking about were drilled, but not fracked. Drilling is only one third of the total cost of the well. So those two-thirds that are needed to complete the well is a problem. And will the particular well generate positive cash flow if oil price remains in $50-$60 range is another problem. Money spend on drilling are debt. Most shale wells will not compensate with their total production the amount of debt and interest. ..."
"... They need around $80 per barrel to revive their operations. ..."
Its interesting – I've been baffled by the apparent confidence of the markets in rising prices,
and so far it seems they've been right. But I think we'll only know for sure later in the year.
I suspect $50 will be the signal for a lot of struggling tight oil operators to open up their
fracked but sealed wells, so there might be an unpleasant surprise for the bulls in the US market,
if not elsewhere.
I suspect $50 will be the signal for a lot of struggling tight oil operators to open
up their fracked but sealed wells
Most probably you are wrong. LTO producers lost access to unlimited financing from Wall
Street. They can't finance expansion from their cash flow (which is still negative), so they are
cooked. Wells you are talking about were drilled, but not fracked. Drilling is only one third
of the total cost of the well. So those two-thirds that are needed to complete the well is a problem.
And will the particular well generate positive cash flow if oil price remains in $50-$60 range
is another problem. Money spend on drilling are debt. Most shale wells will not compensate with
their total production the amount of debt and interest.
They need around $80 per barrel to revive their operations.
"... No producer can afford to increase production at $50/B. Operating costs are much different than drilling costs. Most production is on a decline now. There are no capital expenditures to increase production, only to maintain production. The hydraulic fracturing play will be first to resume drilling when prices gradually increase. ..."
"... Iranian production has not increased - they are simply shipping stock tank oil. To increase actual field production at $50 per barrel is not economical. ..."
"... The economics of hydraulic fracturing will control crude pricing into the future. ..."
1) SA grossly misjudged the price reaction in raising production from 10 million to 10.3 million
per day.
2) No producer can afford to increase production at $50/B. Operating costs are much different
than drilling costs. Most production is on a decline now. There are no capital expenditures to
increase production, only to maintain production. The hydraulic fracturing play will be first
to resume drilling when prices gradually increase.
3) Iranian production has not increased - they are simply shipping stock tank oil. To increase
actual field production at $50 per barrel is not economical.
4) The economics of hydraulic fracturing will control crude pricing into the future.
novus_ordo 17 minutes ago
US is concerned, Oil transactions are not being done by an OPEC {Petro-dollars} Member. Russia
will NEVER join OPEC. The US should behave better with China, if the Chinese are pressed, the
possibility of the Chinese calling in the US debt to it, would be devastasting. US cannot pay,
and the Chinese know it. Result for USA would be similar to what happened when Wall St. called
in the Argentine debt in the 70's. Skyrocketing Inflation the main feature.
novus_ordo
Russia and China to release world from dollar peg Russia has outmaneuvered the Saudis in fight
for the Chinese oil market despite Western states' unity in sanctions opposition with Russia and
conspiracy theory on the US oil deal with Saudi Arabia. In April China increased oil import from
Russia 52%, while import from Saudi Arabia dropped 22%.
joe 5 hours ago
No outrage of human rights violations in Saudi Arabia because Congress, Billary Bamboozler and
Puppet President are bought and paid for. Remember when US boycotted South Africa?
Raygun 10 hours ago
Saudi is infested with Wahhabis on jihad and the government of Iran funds Hezbollah an Islamic
terror organization similar to Isis. When the oil runs out maybe this crazy totalitarian ideology
will die out because it's no longer funded.
"... "promoting Wahhabism, the radical form of Sunni Islam that inspired the 9/11 hijackers and that now inflames the Islamic State." ..."
"... "Saudi Arabia has frustrated American policy makers for years," ..."
"... In particular, the august US "newspaper of record", which can be taken as a barometer of official Washington thinking, accused Saudi Arabia and the other Persian Gulf monarchies of turning the Balkan country of Kosovo into a failed state. This was because the Saudis have sponsored "extremist clerics" who are "fostering violent jihad", thereby making it a "fertile ground for recruitment to radical ideology". ..."
"... "free riders" ..."
"... As for claims that the Saudis and other Persian Gulf states are sponsoring Islamic extremism, this conveniently obscures US covert policy since the 1970s and 80s in Afghanistan, when American planners like Zbigniew Brzezinski conceived of al Qaeda terrorist proxies to fight against the Soviet Union. ..."
"... The question is: how much can the strategic alliance between the US and its Saudi partner bear – before a straw breaks the camel's back? ..."
For months now, US-Saudi relations have become increasingly strained. The latest American aggravation
is blaming its Arab ally for turning Kosovo into an "extremist breeding ground". In an
article by the New York Times' editorial board last week, entitled 'The World Reaps What
the Saudis Sow' , the leading US publication castigated the Saudi rulers for "promoting
Wahhabism, the radical form of Sunni Islam that inspired the 9/11 hijackers and that now inflames
the Islamic State."
It was an astounding broadside of condemnation, articulated with palpable contempt towards the
Saudi rulers. "Saudi Arabia has frustrated American policy makers for years," the editorial
bitterly lamented.
In particular, the august US "newspaper of record", which can be taken as a barometer of official
Washington thinking, accused Saudi Arabia and the other Persian Gulf monarchies of turning the Balkan
country of Kosovo into a failed state. This was because the Saudis have sponsored "extremist clerics"
who are "fostering violent jihad", thereby making it a "fertile ground for recruitment to radical
ideology".
That Kosovo has become a hotbed of Islamic radicalism and a source of young militants going to
Syria and Iraq to join the ranks of the Islamic State and other terrorist groups is not in dispute.
Nor is it in dispute that the Saudis and other Gulf Arab states have pumped millions of dollars
into the Balkan territory to promote their version of Islamic fundamentalism – Wahhabism – which
is correlated with extremist groups.
... ... ...
US President Barack Obama riled the already-irked Saudi rulers when he referred to them as
"free riders" in a high-profile
interview published in April, suggesting that the oil-rich kingdom was overly reliant on American
military power. In the same interview, Obama also blamed Saudi Arabia for destabilizing Iraq, Syria
and Yemen.
The Saudis reacted furiously to Obama's claims. The White House then tried to back-pedal on the
president's criticisms, but it was noticeable that when Obama flew to Saudi Arabia for a summit with
Persian Gulf leaders later that month, he
received a chilly reception.
Since then, relations have only become even more frigid. The passage of a bill through Congress
which would permit American citizens to sue the Saudi state over alleged terrorism damages from the
9/11 events has provoked the Saudi rulers to warn that they will retaliate by selling off US Treasury
holdings.
Then there are strident calls by US politicians and media pundits for the declassification of
28 pages in a 2002 congressional report into 9/11, which reputedly indicate Saudi state involvement
in financially supporting the alleged hijackers of the civilian airliners that crashed into public
buildings in September 2001.
President Obama has said that he will veto the controversial legislation and publication of classified
information. Nevertheless, the Saudi rulers are incensed by the moves, which they see as treacherous
backstabbing by their American ally. An alliance that stretches back seven decades, stemming from
FDR and the first Saudi king Ibn Saud.
As American writer Paul Craig Roberts has
pointed out,
the latest twists in the 9/11 controversy appear to be efforts by the US "deep state" to
make the Saudis a convenient fall guy.
The same goes for Obama accusing Saudi Arabia for destabilizing Iraq, Syria and Yemen. Yes, sure,
the Saudis are involved in fomenting violence and sectarianism in these countries and elsewhere.
But, again, the bigger culprit is Washington for authoring the overarching agenda of regime change
in the Middle East.
As for claims that the Saudis and other Persian Gulf states are sponsoring Islamic extremism,
this conveniently obscures US covert policy since the 1970s and 80s in Afghanistan, when American
planners like Zbigniew Brzezinski conceived of al Qaeda terrorist proxies to fight against the Soviet
Union.
Blaming the Saudis over the failed state of Kosovo is but the latest in a long list of scapegoating
by Washington. No wonder the Saudis are livid at this American maneuver to dish the dirt. Washington
is setting the Saudi rulers up to take the rap for a myriad of evils that arguably it has much more
responsibility for.
The question is: how much can the strategic alliance between the US and its Saudi partner
bear – before a straw breaks the camel's back?
"... But… the decline has only just begun. The price collapse caused the plateau in world oil production that begun about March 2015. However, the decline did not actually begin until January 2016. The dramatic rise in production from Iran has kept the decline from becoming obvious to everyone. However when the May production numbers come in, I think it will then become obvious to everyone. ..."
In conclusion, In spite of the recent increase in Russian production, as well as the slight increase
from the North Sea, and in spite of the dramatic production increase from Iran due to the lifting
of sanctions, world crude oil production is in decline. And while it is true that most of this decline
is due to the price crash, it remains to be seen just how much production will recover when the price
returns to… to… wherever it returns to before it stops.
But… the decline has only just begun. The price collapse caused the plateau in world oil production
that begun about March 2015. However, the decline did not actually begin until January 2016. The
dramatic rise in production from Iran has kept the decline from becoming obvious to everyone. However
when the May production numbers come in, I think it will then become obvious to everyone.
"... The United States Energy Information Administration (EIA) reported a draw of 1.366 million barrels of crude oil on Wednesday, falling short of what experts predicted would be a 3.1-million barrel decrease in US crude oil supplies. ..."
"... Last week, crude oil inventories reported by the EIA decreased by 1.4 million barrels, but still represented "historically high levels for this time of year," an official document read. Tuesday's American Petroleum Institute (API) figures said crude inventories increased by 2.35 million barrels, once gain contradicting the EIA's numbers, but also defying its own forecasts. ..."
"... Last week's API report said supplies of the unrefined substance experienced a 5.1 million barrel drop - the largest such event since December. The market responded to the decrease and Brent oil prices almost hit $50 a barrel - a seven month high. ..."
"... many of the U.S.' major energy producing states saw slightly lower production rates during May, including Texas and North Dakota. Offshore drilling sites in the Gulf of Mexico represented a notable exception, which saw a month-over-month increase of 4.1 percent in crude oil production. ..."
The United States Energy Information Administration (EIA) reported a draw of 1.366 million
barrels of crude oil on Wednesday, falling short of what experts predicted would be a 3.1-million
barrel decrease in US crude oil supplies.
Last week, crude oil inventories reported by the EIA decreased by 1.4 million barrels, but still
represented "historically high levels for this time of year," an official document read. Tuesday's
American Petroleum Institute (API) figures said crude inventories increased by 2.35 million barrels,
once gain contradicting the EIA's numbers, but also defying its own forecasts.
The decrease suggests a greater demand for oil in the United States, according to the source's analysis.
Last week's API report said supplies of the unrefined substance experienced a 5.1 million
barrel drop - the largest such event since December. The market responded to the decrease and Brent
oil prices almost hit $50 a barrel - a seven month high.
On June 2nd, the barrel price of oil reached $50.10 cents as the OPEC meeting commenced in Vienna,
according to NASDAQ's estimates.
Gasoline inventories also faced a draw of 1.492 million barrels after enjoying a two million barrel
EIA-reported increase during the week ending on May 27th.
The agency's monthly report released earlier this week said many of the U.S.' major energy producing
states saw slightly lower production rates during May, including Texas and North Dakota. Offshore
drilling sites in the Gulf of Mexico represented a notable exception, which saw a month-over-month
increase of 4.1 percent in crude oil production.
"... Timchenko's exit was designed to quell any concerns about his role in the company, as he was due to be named in a list of people with alleged links to the Kremlin sanctioned by the US after Russia's invasion of Crimea. ..."
Oil trading giant Gunvor handed its chief executive a $1bn dividend to fund a deal that
helped the company distance itself from US sanctions against Russia.
Torbjörn Törnqvist agreed to buy a 43% stake in the company, the fourth largest oil trader
in the world, from co-founder Gennady Timchenko in 2014 for an undisclosed fee.
Timchenko's exit was designed to quell any concerns about his role in the company, as he
was due to be named in a list of people with alleged links to the Kremlin sanctioned by the
US after Russia's invasion of Crimea.
But the sheer size of Gunvor, which pulled in revenues of $64bn (£44bn) last year despite
rock-bottom oil prices, meant Törnqvist could not fund the deal in one go.
The payment of a $1bn dividend, only part of which was used to fund the deal, allowed Törnqvist
to settle his remaining debt to Timchenko.
"... "Four tankers carrying over 2 million barrels of U.S. crude are stuck at sea and cannot discharge at a Caribbean terminal because Venezuela's PDVSA has not yet paid supplier BP Plc (BP.L), according to two sources and Thomson Reuters vessel tracking data. ..."
"... The deal was to import some 8 million barrels of West Texas Intermediate (WTI) crude so Venezuela could dilute its extra heavy crudes and feed its Caribbean refineries. ..."
Venezuela PDVSA is not paying for their imports from the US.
"Four tankers carrying over 2 million barrels of U.S. crude are stuck at sea and cannot discharge
at a Caribbean terminal because Venezuela's PDVSA has not yet paid supplier BP Plc (BP.L), according
to two sources and Thomson Reuters vessel tracking data.
The cargoes are part of a tender Petroleos de Venezuela [PDVSA.UL], known as PDVSA, awarded
in March to BP and China Oil. The deal was to import some 8 million barrels of West Texas Intermediate
(WTI) crude so Venezuela could dilute its extra heavy crudes and feed its Caribbean refineries.
While three cargoes for this tender were delivered in April, seven other vessels, including
BP's four hired ones, are waiting to discharge, leaving up to 3.85 million barrels of WTI in limbo.
"
"... 18 months of pain for the Saudis, knocking out production, exploration and development everywhere. ..."
"... They lack the ability to produce at a higher rate for a long time, therefore this wasn't about increasing market share. They didn't stop the Iranians and Russians in Syria, which may have been a reason for the price war. They lost a ton of cash flow, will lose more in the future. They caused unemployment in the USA. ..."
"... "As far as I can see KSA has a volatile, unreliable, nutty dictatorship with very little idea of how to pull itself out of the overpopulation and religious nuttism it has been encouraging" ..."
"... that is probably the best explanation for their policy I have heard because no other has made any sense. I read a article yesterday that for the first time they are entering the world bond market to raise at least $15 billion, I guess one might say they too are borrowing money to drill wells. ..."
Are you sure? They lack the ability to produce at a higher rate for a long time, therefore this
wasn't about increasing market share. They didn't stop the Iranians and Russians in Syria, which
may have been a reason for the price war. They lost a ton of cash flow, will lose more in the
future. They caused unemployment in the USA.
As far as I can see KSA has a volatile, unreliable, nutty dictatorship with very little idea
of how to pull itself out of the overpopulation and religious nuttism it has been encouraging.
Their aims are being defeated, and they will be increasingly dangerous as a result.
"As far as I can see KSA has a volatile, unreliable, nutty dictatorship with very little idea
of how to pull itself out of the overpopulation and religious nuttism it has been encouraging"
that is probably the best explanation for their policy I have heard because no other has made
any sense. I read a article yesterday that for the first time they are entering the world bond
market to raise at least $15 billion, I guess one might say they too are borrowing money to drill
wells.
"... It is hard to pinpoint these decline rates exactly since each field is unique unto itself. What the industry generally believes is that offshore production declines at twice the rateof conventional onshore. ..."
"... That would put the offshore decline rate somewhere between 15-20% per year. These higher decline rates mean that the sudden halt to offshore development will result in BIG offshore production declines. ..."
"... Off a 22 million barrel per day production base-15-20%= 3.3-4.4 million barrels a day-gone. That is substantially more than the spare capacity of OPEC right now. That means that in just one year, the world oil supply could be put into deep undersupply (pardon the pun) as offshore exploration and development stagnate. ..."
"Offshore production has lower decline rates than shale does, but considerably higher decline
rates than onshore vertical developments.
It is hard to pinpoint these decline rates exactly since each field is unique unto itself.
What the industry generally believes is that offshore production declines at twice the rateof
conventional onshore.
That would put the offshore decline rate somewhere between 15-20% per year. These higher
decline rates mean that the sudden halt to offshore development will result in BIG offshore production
declines.
Off a 22 million barrel per day production base-15-20%= 3.3-4.4 million barrels a day-gone.
That is substantially more than the spare capacity of OPEC right now. That means that in just
one year, the world oil supply could be put into deep undersupply (pardon the pun) as offshore
exploration and development stagnate.
The new complex will allow to increase the output of diesel fuel of Euro-5 class.
The PM D. Medvedev will visit Volgograd on May 31st.
He will participate in the ceremony of start-up and commissioning works at the plant "Lukoil-Volgogradnetepererabotka".
The new complex of deep processing of vacuum gasoil with the capacity of 3,500 thousand tons a
year is to become the largest one in Russia. The complex comprises: a unit of vacuum gasoil hyrocracking;
a hydrogen production unit meant for hydrogen containing gas supply to the hydrocracking process;
a combined sulfur unit used for utilization of hydrogen disulfide containing amine solution of the
hydroracking process. With the putting of the complex into operation the output of diesel fuel
of class-5 will grow by 1.8 mln tons a year, oil processing efficiency will reach 95%.
If the whims of oil speculators are
anything to go by, then another oil price downturn looks increasingly
unlikely.
Oil prices have gained more than 80 percent over the
past three months, bouncing off of $27 lows in February to hit $50 last
week. Those sharp gains raised the possibility of another crash in prices
because the fundamentals still appeared to be bearish in the near term.
By early May, oil speculators had built up strong net-long positions
on oil futures, extraordinary bullish positions that left the market
exposed to a reversal. Speculators had seemingly bid up oil prices faster
than was justified in the physical market.
But the physical market got some help. The massive supply outages in
Canada (over 1 million barrels per day) and Nigeria (over 800,000 barrels
per day) provided some support to prices, erasing some of the global
surplus.
Now speculators who had started to short oil in May have retreated,
pushing short bets down to an 11-month low. "If you've been short since
February this has been a very painful ride," Kyle Cooper, director of
research with IAF Advisors and Cypress Energy Capital Management,
told Bloomberg
in an interview. "There are always a few die-hards but
otherwise you'd want to get out. This is indicative of the improving
fundamentals."
"... Offshore production has lower decline rates than shale does, but considerably higher decline rates than onshore vertical developments. ..."
"... That would put the offshore decline rate somewhere between 15-20 percent per year. These higher decline rates mean that the sudden halt to offshore development will result in BIG offshore production declines. ..."
"... That is substantially more than the spare capacity of OPEC right now. ..."
Offshore production accounts for 30 percent of total global oil
production. The percentage of global production has remained the same
since the early 2000s but the absolute amount of production has grown.
(Click to enlarge)
Today nearly 22 million barrels of oil per day is produced offshore;
the figure in the chart above includes all liquids.
Offshore production has lower decline rates than shale does, but
considerably higher decline rates than onshore vertical developments.
It is hard to pinpoint these decline rates exactly since each field is
unique. What the industry generally believes is that offshore production
declines at twice the rate of conventional onshore.
That would put the offshore decline rate somewhere between 15-20
percent per year. These higher decline rates mean that the sudden halt to
offshore development will result in BIG offshore production declines.
Off a 22 million barrel per day production base, 15-20 percent would
equal 3.3 to 4.4 million barrels a day-gone. That is substantially
more than the spare capacity of OPEC right now. That means that in
just one year, the world oil supply could be put into deep undersupply
(pardon the pun) as offshore exploration and development stagnate.
Mohammad Al Sabban, the former Saudi representative to OPEC until 2014, insists Saudi Arabia
really has the ability to ramp up output to 12.5 million barrels a day.
Yet Al Sabban told Raymond James that only half of those barrels would be available immediately
within days or weeks. The rest could take up to six months.
Raymond James thinks investors should take those claims with a grain of salt.
"We don't buy the Saudi excess capacity argument," the firm wrote.
Raymond James points to three reasons why they think Saudi is lying. I like #3 the best.
3.) Saudi rig counts are surging: There is a camp in the oil industry that believes
Saudi Arabia's oilfields have gotten so old that they aren't as productive as they once were.
For instance, the Ghawar field - the world's largest with an estimated 75 billion barrels of oil
- is over 60 years old.
Skeptics point to the fact that rig counts in Saudi Arabia have tripled over the past decade
- even though output hasn't gone up nearly as much. At the same time, Saudi stockpiles of oil
have declined by around 30 million barrels since October 2015.
"If they only need to turn valves on to flood the market, why are Saudi oil inventories
falling?" Raymond James asks.
"... So I am asking you or whoever thinks price had any role in CAPEX to show me where is that correlation between price, CAPEX and Debt? If Debt has been increasing progressively every single year regardless of price how can you say that CAPEX has any correlation with price? ..."
"... There is clear correlation between oil price and oil companies capex. Combined capex of the U.S. E&Ps was down more than 40% last year and will decline further this year. ..."
"... The issue with the shale players is that the decline in capex is not sufficient to achieve cashflow neutrality. Operating cashflow declines even more than capex; therefore their debt is rising. They were outspending cash when oil was at $100/bbl, and they continue to outspend it with much lower capex at $30-50/bbl. ..."
"... Just like Tesla :-). ..."
"... Big guys/majors that you mentioned that also reduced CAPEX are completely different animal: they are vertically integrated, they produce overseas, in different currencies, they do all kinds of deals, they have economy of scales, and they are big and established long enough to make balance of payments in offices in New York or Panama and not just on the oil field, they have army of lobbyist, tax breaks, whatever they like. You can't compare them with shale. They are protected like polar bears. ..."
"... Disturbing indeed. That said, at $75k/BOPD (giving credit for what I suspect is ample PUDs), YE15 value is about $16B. They will survive…but debt will tie their hands until oil is above $150/bbl. ..."
"My point is in response to the price collapse at the end of 2008, CAPEX in 2009 was cut substantially
from 2008 levels."
But that is only true if you pick years 2008 & 2009 and compare it. If you pick 2008 and 2015
CAPEX did not get cut substantially considering the price drop. CAPEX is 3x higher than in 2008
and debt is 6x higher. So I am asking where is correlation with the oil price in 2015? There is
no correlation because CAPEX should be zero in 2016.
Yes they need the price of $150 for the next 10 years if you look just debt but hey that's
why there is Chapter 11 so they will still be around for few more years (like Halcon) drilling
little bit here and there even without $150 price.
I don't disagree that they should have spent less, or even zero, CAPEX in 2015.
I am just making the point CAPEX was cut in half in 2009 as a result of 2008 crash, and again
in 2015 as a result of 2014-15 crash, and in half again as prices trended even lower second half
2015 into 2016.
I agree with you that CAPEX was cut but I don't agree with you and Dennis that price was factor
because look from 2008 untill 2015 BOE went from $77.66 (2008) to $31.48 (2015) and in between
and debt increased from $376 million to 7 billion regardless of price movement.
So I am asking you or whoever thinks price had any role in CAPEX to show me where is that
correlation between price, CAPEX and Debt? If Debt has been increasing progressively every single
year regardless of price how can you say that CAPEX has any correlation with price?
12/31/2008.
Long term debt $376 million
12/31/2009
Long term debt $524 million
12/31/2010
Long term debt $926 million
12/31/2011
Long term debt $1.254 billion
12/31/2012
Long term debt $3.540 billion
12/31/2013
Long Term Debt: $4.651 billion
12/31/2014
Long Term Debt $5.929 billion
12/31/2015
Long Term Debt $7.118 billion
The only correlation that I see if you look numbers that you have put together is that CLR
produce LESS debt if produce LESS oil and produce MORE debt if produce MORE oil.
2008 Production 36,018 BOEPD
2008 Long term debt $376 million
2015 BOEPD 221,715 66% oil
2015 Long Term Debt $7.118 billion
There is clear correlation between oil price and oil companies capex. Combined capex of
the U.S. E&Ps was down more than 40% last year and will decline further this year.
The issue with the shale players is that the decline in capex is not sufficient to achieve
cashflow neutrality. Operating cashflow declines even more than capex; therefore their debt is
rising. They were outspending cash when oil was at $100/bbl, and they continue to outspend it
with much lower capex at $30-50/bbl.
In that sense you are right that they "produce LESS debt if produce LESS oil and produce MORE
debt if produce MORE oil."
" In that sense you are right that they "produce LESS debt if produce LESS oil and produce
MORE debt if produce MORE oil."
That is good that we agree because I was not sure that we looking at the same numbers that
Shallow posted :-)
Well I was strictly speaking about shale and the oil price, and I said that in one of my posts
above. But we have to remember that they are significant, (with tar sands nearly half) part of
oil production in North America so obviously it is very important to see how their finances distort
the market.
Big guys/majors that you mentioned that also reduced CAPEX are completely different animal:
they are vertically integrated, they produce overseas, in different currencies, they do all kinds
of deals, they have economy of scales, and they are big and established long enough to make balance
of payments in offices in New York or Panama and not just on the oil field, they have army of
lobbyist, tax breaks, whatever they like. You can't compare them with shale. They are protected
like polar bears.
Disturbing indeed. That said, at $75k/BOPD (giving credit for what I suspect is ample PUDs),
YE15 value is about $16B. They will survive…but debt will tie their hands until oil is above $150/bbl.
For volumes you need to take into account the margin of error of data. Any attempt to exceed the
margin of error of input data by some voodoo methods is suspect. That's a pretty serious and debilitating
disease a lot of "graphic artists" working on oil production forecasts suffer from: they never try
to address the question of the accuracy of input data and resulting "zones of uncertainty" if future
volumes. For example if margin or error of the input data is 0.1Mb/d, any change below that is essentially
the same as no change. It represents "status quo".
All this attempts to guess the future volume "to a barrel" are futile, because people who are
doing this do not understand the concept of the "margin of error" (and probably never will). That
actually create excellent propaganda opportunities that were used during oil glut paranoia.
But in any forecast the most important variable is not exact volume, but guessing the correct
trend, the first derivative of the volume dynamics Which BTW is also difficult, to the extent that
the EIA honchos can be call charlatans.
So before we discuss the question of forecasting correct volume, we need to address the question
of forecasting of the correct trend. There are laws of economics, there is pretty reliable information
about the US LTO reservoirs, there is significant volume of historical data, and there are laws of
physics. All of that makes pretty reliable short-term forecasts of the trend possible.
For example nobody expect that LTO producers will increase production this year. This is a pretty
reliable forecast, that cuts 50% of possibilities.
Also any simplistic adherence to neoclassical economy (religious belief in supply/demand equilibrium
as a normal condition of the market) is suspect in the world of HFT. It ignored the existence of
what we called arbitrary coherence. The basic idea of arbitrary coherence is this: although even
if initial prices are completely arbitrary, once those prices are established they will shape future
prices serving as an anchor for market participants (this makes them "coherent"). For oil this effect
is called "low price forever" mentality which now affects us all became of "legitimacy" of recent
"below $30" prices, even if they were achieved by blatant manipulation of the markets.
That's why many "market watchers" are now too shy to predict oil price spike because of destruction
of the industry caused by the regime of low oil prices in 2015-2016.
"... One analyst told CNBC that he doubted the very foundation of the U.S. shale oil industry which he said had been founded and expanded on cheap money and had effectively been a "Ponzi scheme" – an investment operation that generates returns for older investors by acquiring new investors. ..."
"... "I think in ten years' time someone is going to write a great book and make a great movie about the shale industry in the U.S. because I think it is, quite frankly, one of the biggest Ponzi schemes known to mankind," Gavin Wendt, founding director & senior resource analyst at MineLife, told CNBC on Thursday. ..."
One analyst told CNBC that he doubted the very foundation of the U.S. shale oil industry
which he said had been founded and expanded on cheap money and had effectively been a "Ponzi scheme"
– an investment operation that generates returns for older investors by acquiring new investors.
"I think in ten years' time someone is going to write a great book and make a great movie
about the shale industry in the U.S. because I think it is, quite frankly, one of the biggest
Ponzi schemes known to mankind," Gavin Wendt, founding director & senior resource analyst at MineLife,
told CNBC on Thursday.
Much better now than 2014. Not good enough to drill new wells. Cash flow positive.
Notable quotes:
"... Brent above $50 today; WTI very close to it. I still think a mild price correction is possible in the next month or two before upward trend continues in 2H 2016. ..."
"... Shallow sand, do you think shut in stripper wells will re-start at these levels? Agree with you that there will be some uptick in LTO activity later this year. Overall U.S. C+C output will likely bottom by the end of 2016, rather than mid-2017, as expected by the EIA. ..."
"... Lack of vertical rigs will mean US onshore conventional will continue to decline. ..."
"... Won't the reactivation of shut in strippers at least reduce the rate of conventional decline? I would think there might be some people out there that might drill some wells as prices improve. At $58/b, after a few months (say 4 months) of balance sheet repair would you be in a position to drill new wells or would you wait for $65/b? ..."
Much better now than 2014. Not good enough to drill new wells. Cash flow positive.
Since 2014 have been able to cut expenses in all areas except:
1. Electricity (not counting shut in wells, of course, which we are now reactivating).
2. Annual well fees.
3. Ad valorem taxes.
4. Severance taxes.
5. Liability insurance.
Everything else costs less than 2015, which cost less than 2014.
Hard to believe, but likely May will have the highest monthly average price since July, 2015.
We are 18 months into the bust, which I feel became official Thanksgiving Day, 2014. The downturn
started in June, 2014, so almost to the two year point since the price first turned.
Would like to see $55-65 WTI. Would be akin to 2005-2006, which were very good years for us,
and which would not drag down the US economy IMO, as gas would be $2.50-2.60 range.
Think would see slight uptick in LTO activity, but nothing big.
Brent above $50 today; WTI very close to it.
I still think a mild price correction is possible in the next month or two before upward trend
continues in 2H 2016.
Shallow sand, do you think shut in stripper wells will re-start at these levels? Agree with you that there will be some uptick in LTO activity later this year.
Overall U.S. C+C output will likely bottom by the end of 2016, rather than mid-2017, as expected
by the EIA.
Yes, will restart shut in strippers, not all, but many. Summer weather will affect that also.
Many wells shut down in winter out of necessity, likely were slow to be reactivated, but will
come back online now.
Will be interesting to watch not only hz rig count, but vertical also. I sense there is a lot
of balance sheet healing needed, plus a lot of caution given collapse post June, 2015.
Lack of vertical rigs will mean US onshore conventional will continue to decline.
Won't the reactivation of shut in strippers at least reduce the rate of conventional decline?
I would think there might be some people out there that might drill some wells as prices improve.
At $58/b, after a few months (say 4 months) of balance sheet repair would you be in a position
to drill new wells or would you wait for $65/b?
I guess that was my point, some wells might be drilled by more aggressive (or desperate) companies
and if that is the case the decline may stop. I doubt there will be enough to get US output to
increase until we reach $75/b or more, but $60/b may result in flat output if we ever get there
(Sept or Oct 2016 would be my guess).
On Friday, May 13, IHS Energy released an alarming new study. It found that the volumes
of oil and gas discovered outside of the U.S. last year were the lowest since 1952.
Oil alone set a record low, with only 2.8 billion barrels of oil equivalent found during
2015.
The vast majority of large, conventional undiscovered oil and gas fields are offshore. Unfortunately,
these fields are uneconomical to develop with oil prices below $80 per barrel.
That's why a few years ago, when prices first dipped under $60, many oil companies refocused
their efforts. They bet big on U.S. shale.
Now, many are regretting that decision. Most shale basins – other than the Permian – are
losers at current WTI prices. (Though there are some winners, as I showed you
here .)
Reply
"... Art says that the average debt to cash flow ratio has increased 4 times in 2016. Gas production is falling in all shale gas plays with the exception of the Utica which managed a small increase. It would be interesting to know more precisely where all of this debt is being invested and how much is in the Utica. ..."
"... I asked Berman about a year ago if he had changed his opinion on the gas shales. He said he had not. I think Berman has been right all along. I just don't think geology can be trumped with with financial accounting. Notwithstanding GORs in the LTO plays, the first Seneca Cliff may well be natural gas. ..."
"... as two third of production represents shale, the decline may be much faster than in previous declines; ..."
Art Berman has a new post out on shale gas. He goes into some detail on the 1st Qtr financial
results of several companies that are not often discussed here. Among them: Devon, Southwestern,
EQT, Encana, Rice.
Art says that the average debt to cash flow ratio has increased 4 times in 2016. Gas production
is falling in all shale gas plays with the exception of the Utica which managed a small increase.
It would be interesting to know more precisely where all of this debt is being invested and how
much is in the Utica.
It was a warm winter, storage is already full. They only need to average 68 mmcf per week to
totally fill their storage. The supply can stay low this year and still have storage in good order
for next winter.
Now if the 2016-17 is cold and storage drops significantly, then the spot light will be on
the producers and how they can ramp up their production. If they can't, due to money problems
or any other issues, that is when your sudden price increases may occur. It won't be until the
producers are put under pressure to perform, that we will know the result. After the 2013-14 arctic
vortex, they did step up to the plate and performed. Can they do the same in 2017 with limited
money supply, that will be interesting to watch!
I think you are both correct. Shale gas production seems to be falling, though not as fast
as I would like it to. Storage is market supply. PDP reserves and PUD reserves are the unknowns
to me.
The SOB at the family reunion seems to be the DUCS. At what price are those wells really economic?
How many exist and where are they in relation to the economic sweet spots? If a DUC can't be counted
as PDP or PUD then to me it's a plugging liability and who would pay money for a liability?
What about gathering systems or production facilities to get from the well head to a point
of sale with a mid stream provider?
There in lies the rub.
I asked Berman about a year ago if he had changed his opinion on the gas shales. He said he
had not. I think Berman has been right all along. I just don't think geology can be trumped with
with financial accounting. Notwithstanding GORs in the LTO plays, the first Seneca Cliff may well
be natural gas.
In my view there are three factors influencing the supply/demand picture and may come as a
surprise to the market.
– as two third of production represents shale, the decline may be much faster than in previous
declines;
– net imports could turn into net exports and this will draw much faster on inventories;
– power burn is around 20% higher than last year (see beow chart) and rising much faster than
even renewables due to retirement of coal power plants; in my view the reason for the high power
burn could be also role of gas as a swing producer for PV and wind generation;
"... Financialization is the lubricant that makes it possible to think of everything as an asset that could immediately be liquidated at near full value, including hypothetical growth options. When everything is fully financialized and real world frictions are removed, it will always make more sense to buy and sell the assets and their affiliated options that to actually invest and improve anything. ..."
Sinking rig counts worldwide doesn't correspond to these fantastic planned production increases
– if it was that easy to crank up production, why has everyone hasn't done it before?
And opening the chokes, damaging the oilfied only works short term before new infills / CO2
or other expensive stuff is neccessary.
Sinking rig counts worldwide doesn't correspond to these fantastic planned production increases
– if it was that easy to crank up production, why has everyone hasn't done it before?
A relevant quote:
Financialization is the lubricant that makes it possible to think of everything as an asset
that could immediately be liquidated at near full value, including hypothetical growth options.
When everything is fully financialized and real world frictions are removed, it will always
make more sense to buy and sell the assets and their affiliated options that to actually invest
and improve anything.
This is one of the most straightforward ways to visualize how increased financialization
can harm the economy. Although simply calling bankers parasites is arguably even more straightforward.
"... US oil production is now in its freefall phase and this makes me very optimistic about future oil prices. ..."
"... But the health of the USA economy in late 2016 and 2017 is a big open question and it might provide the celling for the oil prices. One of the key factors that prevented sliding of the US economy into the continuation of Great Recession in 2014 was the dramatic drop of oil prices, which started in the second half of 2014. So in 2014-2016 the resilience of the US economy was partially due to this "low oil price" factor. ..."
"... Impoverishment of the low 80% of population makes the recovery impossible; neoliberalism makes the redistribution of gains in favor of lower 80% impossible (most of the gains go to the top 0.1% - the financial oligarchy; top 20% probably hold their own; everybody else are gradually sliding into poverty). So this is a deadlock situation. ..."
"... So when oil price recovers to $80-$100 price band the stimulating role of low oil prices on the economy will be gone. From this point it might be a bumpy ride… ..."
Production fell just 24 000 b/d and week. However, the previous number has been revised downwardly
by around 50 000 b/d and the recent number is down over 70 000 b/d, which is enormous and contributes
very much to the recent oil price rise. US production is down by over 6.4% and net product exports
fell considerably. This is exactly the right thing to do to bring oil prices up again.
US oil production is now in its freefall phase and this makes me very optimistic about
future oil prices.
US oil production is now in its freefall phase and this makes me very optimistic about future
oil prices.
Not so fast.
I am pretty positive that the worst days for the conventional oil are over, and "carpet drilling"
days for LTO are also history.
But the health of the USA economy in late 2016 and 2017 is a big open question and it might
provide the celling for the oil prices. One of the key factors that prevented sliding of the US
economy into the continuation of Great Recession in 2014 was the dramatic drop of oil prices,
which started in the second half of 2014. So in 2014-2016 the resilience of the US economy was
partially due to this "low oil price" factor.
But the effect was pretty small; due to this the FED was not able to "normalize" interest rates
(they made only one hike) and now can face the new phase of the recession with all the ammunition
already fired.
Impoverishment of the low 80% of population makes the recovery impossible; neoliberalism
makes the redistribution of gains in favor of lower 80% impossible (most of the gains go to the
top 0.1% - the financial oligarchy; top 20% probably hold their own; everybody else are gradually
sliding into poverty). So this is a deadlock situation.
Ves wrote something about his views on this subject in this thread and as far as I recall he
thinks that without artificially low interest rates the game is over.
So when oil price recovers to $80-$100 price band the stimulating role of low oil prices
on the economy will be gone. From this point it might be a bumpy ride…
The EIA's Monthly Energy Review
is out today with production data for April. US C+C production fell 123,000 barrels per day
in April to 8,915,000 barrels per day. US lower 48 fell 100,000 bpd while Alaska fell 23,000 bpd.
This data matches the weekly data very close. 8,915 K barrels per day is the average
for April, not the production on the last day or the last week. The EIA has production for the
third week in April at 8,767 K barrels per day. So it looks like US production will fall about
the same amount in May as it fell in April, about 125,000 barrels per day.
US C+C production has fell 779,000 barrels per day since peaking one year ago in April.
"... Anybody got a handle on overall accurate storage stats? I believe that we are heading into a period that oil in storage and market sentiment will be more important than production at some point. At least I'm hoping we are getting there. That'd be a great idea for a new post Dennis. Oil in storage. But there are no stats on private storage in the lower 48 right? Hell, me and my two best business buddies have 25 thousand barrels in our tank farms right now. And we are small fry compared to the gangster bank backed shale guys. ..."
WTI and Brent spread has closed quite a bit lately. Anybody heard what the crooks at the tbtf
mega banks are giving as an excuse?
Citi just announced that crude was headed to 50 a barrel in Q3, that's a pretty amazing call seeing
as how it's pushing 49.50 right now. Those "analysts" probably will get a huge bonus for making
that call right?
Anybody got a handle on overall accurate storage stats? I believe that we are heading into
a period that oil in storage and market sentiment will be more important than production at some
point. At least I'm hoping we are getting there. That'd be a great idea for a new post Dennis.
Oil in storage. But there are no stats on private storage in the lower 48 right? Hell, me and
my two best business buddies have 25 thousand barrels in our tank farms right now. And we are
small fry compared to the gangster bank backed shale guys.
"... If one assumes that gas stays low priced, WTI will need to pass $55 sustained for 3 months for most US LTO producers to not show losses for GAAP purposes. This, of course, does not include hedges. ..."
ExxonMobil and Chevron also had large North American losses.
Due to the high CAPEX spent 2011-14, and given depreciation, depletion
and amortization methods selected by US producers, expect $20-$25 per BOE
in D,D & A for US oil weighted LTO producers for at least the next 3 years.
Then add in $8 or more of LOE, $3-5 G & A, and $4-$7 in interest, all in
BOE terms. Also, some monetized gathering, so there could be expenses there.
Also include severance taxes of 6-10% of $ per BOE sold.
If one assumes that gas stays low priced, WTI will need to pass $55
sustained for 3 months for most US LTO producers to not show losses for
GAAP purposes. This, of course, does not include hedges.
"... The shalies will say anything to keep the money coming in. I would only trust the data you can see at the well level. In the Bakken, CLR has touted 800,000 EUR's. In their recent 10-K, they actually booked about 170,000 in reserves per completed well in the Bakken in 2015. Their problem nowis there are actual well histories. They can't book high PDP given what their past wells have produced. ..."
I think the presentations and reports by CLR and other shalies have to be looked at very skeptically
as their breakevens are much, much higher than the numbers they tout. I have looked at loads of presentations
by LTO players the last 5 years. Even with high oil prices, almost all their claims were disproven
by the poor to mediocre financial results posted.
The shalies will say anything to keep the money
coming in. I would only trust the data you can see at the well level. In the Bakken, CLR has touted
800,000 EUR's. In their recent 10-K, they actually booked about 170,000 in reserves per completed
well in the Bakken in 2015. Their problem nowis there are actual well histories. They can't book
high PDP given what their past wells have produced.
"... If on the other hand you have paid your share of drilling and completion costs with CLR, and lease operating expenses, and you are pleased with the outcome of your investment. Congratulations. You are one of very few. ..."
Mr. Tea, up hole you have said, I believe, this: "I have participated in LTO wells with CLR and
others in Oklahoma (we own minerals)…" It is understandable that your glass might be half full
regarding the shale oil business if all your income associated therewith is free and clear of
all costs. If on the other hand you have paid your share of drilling and completion costs with CLR, and lease operating expenses, and you are pleased with the outcome of your investment. Congratulations.
You are one of very few.
Don't be dumbfounded, sir; I am an operator myself and do not believe that debt, and oil, works
together. It has not worked in the US LTO industry to date, and it will not in the future. Believe
it or not there are a lot of us experienced oil and gas professionals out here that feel the same
way.
"... Those one after another announcements compose into something resembling a Requiem (aka Mass for the dead; Latin: Missa pro defunctis) for LTO boom and "low oil price forever" gambit (with due apologies for the deviation from your neoclassical supply-demand article of faith ;-). ..."
Halcon Resources plans to file a Chapter 11 bankruptcy plan if enough lenders agree to the terms,
the company said Wednesday in a press release.
Since the start of 2015, 138 oilfield service companies and oil and gas producers have gone
bankrupt owing more than $61 billion, law firm Haynes & Boone said in an April 29 report.
Halcon Resources plans to file a Chapter 11 bankruptcy
Since the start of 2015, 138 oilfield service companies and oil and gas producers have gone
bankrupt owing more than $61 billion, law firm Haynes & Boone said in an April 29 report.
Those one after another announcements compose into something resembling a Requiem (aka Mass
for the dead; Latin: Missa pro defunctis) for LTO boom and "low oil price forever" gambit (with
due apologies for the deviation from your neoclassical supply-demand article of faith ;-).
"Now this is not the end. It is not even the beginning of the end. But it is, perhaps, the
end of the beginning." Sir Winston Churchill
LINN Energy LLC and LinnCo LLC have been delisted from The NASDAQ Stock Market. Trading of
LINN and LinnCo securities were suspended prior to the open of the market today, Tuesday, May
24, 2016.
On May 11, 2016, LINN Energy, LinnCo, certain of the company's direct and indirect subsidiaries,
and Berry Petroleum Co. LLC, filed voluntary petitions for reorganization under Chapter 11.
"... I think $80/b will be enough for the current average well to be profitable. I agree that eventually average new well EUR will decrease and higher prices will be needed for profitable wells. The figure below shows debt was being paid down in 2013, based on Rune Likvern's analysis. ..."
"... It is just hilarious that you got call from WSJ just right now to have a chat after all has been printed regarding fake shale "technology improvements", "efficiency", and "energy revolution" in general. If you get ever invite by CNBC/Bloomberg for live TV appearance please let us now so we can all watch :-) ..."
"... But I know that they don't want you near their parking lot because their audience is not ready to handle the truth. They will bring Mr. Ward who is not really independent analyst but he was part of shale for so many years so of course he knows the numbers. But he will only say things in small dosages, one tea-spoon at the time so audience can absorb the news in small bits. ..."
Mr. Tea; I am familiar with the history of LTO development, thank you; I have interest in shale
wells, sat them, know what they cost, seen and heard all the technology bells and whistles up
close and personal and have watched my checks dribble to nothing. I have spent a half century
of economic analysis on wells I have drilled with my own money; I can add and subtract. Most of
the time when I am analyzing shale oil economics I am subtracting.
I have also heard all the hubbub about the shale oil miracle that I can stand; much obliged.
The "long history of the US oil and gas business model" has absolutely nothing to do with shale
oil extraction. The two have little to do with each other.
We have NEVER seen debt play such an enormous role in oil extraction as today, not in the 80's,
never in history.
Shell and BP got out of the shale biz early, Chevron never got in. CNOCC does not send CHK
Christmas cards anymore, I promise you and if you could get a straight answer from Exxon, Statoil
and BHP they'd probably say they screwed up, big time. We'll see who buys what. I'd say if this
shale stuff was so valuable there would be fierce competition to buy the stuff at low oil prices,
now, when folks are so eager to get out of trouble; Mr. Alex is correct, thus far no major integrated
oil company has even whiffed at shale oil acquisitions.
Hoping for higher oil prices is not a plan for long term sustainability, Mr. Tea. Good luck,
sir.
I would consider XOM and Statoil as major oil companies. Both are involved in LTO.
Rune Likvern showed the Bakken LTO players were cash flow neutral before the price crash, but
perhaps there are no more good wells left to drill.
I think $80/b will be enough for the current average well to be profitable. I agree that eventually
average new well EUR will decrease and higher prices will be needed for profitable wells. The
figure below shows debt was being paid down in 2013, based on Rune Likvern's analysis.
Since that time well costs have decreased and lower prices may be adequate ($80/b rather than
$100/b).
Thanks Mike.
When 2 years ago at the time of oil price collapse I first looked at this "black box" called LTO
the only people that made sense regarding LTO economics were you, shallow, Mr Berman, and Mr.
Likvern. 4 people in the whole English speaking world!! There was one more person in Russian language
that I have read his thoughts where he touched on LTO economics but more in context of general
oil depletion. So 1000's of blogs, 1000's of tv channels, 1000's of newspapers and only 4 people
that made sense regarding this LTO subject in English!!! So after 2 years when shale economics
are crystal clear there are still 4 people in English speaking world talking common sense!! Unbelievable.
It is just hilarious that you got call from WSJ just right now to have a chat after all has
been printed regarding fake shale "technology improvements", "efficiency", and "energy revolution"
in general. If you get ever invite by CNBC/Bloomberg for live TV appearance please let us now
so we can all watch
:-)
But I know that they don't want you near their parking lot because their audience is not ready
to handle the truth. They will bring Mr. Ward who is not really independent analyst but he was
part of shale for so many years so of course he knows the numbers. But he will only say things
in small dosages, one tea-spoon at the time so audience can absorb the news in small bits.
Have a nice day.
"... "cash flow neutral" is not good if you are actually in the oil business. The point in the exercise is to make money . I won't now get argue with you, except to ask what is your definition of profitable "enough." Is 80 dollars profitable enough to manage new debt and pay down old debt with wells that decline 73% in 3 years? No, not in the face of declining productivity and even higher costs. ..."
"... My analysis of SEC fillings shows that a vast majority of shale players were deeply cash negative even before the drop in oil prices. This includes the largest oil producers in the Bakken, Continental and Whiting. ..."
"... It is just hilarious that you got call from WSJ just right now to have a chat after all has been printed regarding fake shale "technology improvements", "efficiency", and "energy revolution" in general. ..."
"... Mike has opened several investment bankers eyes over there. These guys believed the shale guys break evens until the 2015 10K came out, and some of us started saying, "hey, these guys are ALL insolvent at $50 WTI, and the price is currently $30". ..."
I would consider XOM and Statoil as major oil companies. Both are involved in LTO.
Rune Likvern showed the Bakken LTO players were cash flow neutral before the price crash, but
perhaps there are no more good wells left to drill.
I think $80/b will be enough for the current average well to be profitable. I agree that eventually
average new well EUR will decrease and higher prices will be needed for profitable wells. The
figure below shows debt was being paid down in 2013, based on Rune Likvern's analysis.
Since that time well costs have decreased and lower prices may be adequate ($80/b rather than
$100/b).
Yes, Dennis; I know they are majors. I suspect they would like to have now stayed out of the shale
oil and shale gas business completely.
I appreciate your work a lot but I've leaned over the years to not get in pissing matches with
you, Dennis. You are into numbers, I am into solving problems in real life. For instance, "cash
flow neutral" is not good if you are actually in the oil business. The point in the exercise is
to make money . I won't now get argue with you, except to ask what is your definition of profitable
"enough." Is 80 dollars profitable enough to manage new debt and pay down old debt with wells
that decline 73% in 3 years? No, not in the face of declining productivity and even higher costs.
Take care, sir; and thanks for the venue to occasionally blow down my SICP.
Dennis. XOM, through it's subsidiary, XTO, lost over $800 million in the first 90 days of 2016.
I should probably let Rune address this, but the impression I get from him is that Statoil
likewise has suffered some heavy losses in the lower 48.
Furthermore, look at Schlumberger CEO recent comments about the profitability of lower 48 for
service companies.
We have beaten some of this stuff to death, but we have a large incentive to do so.
So I am going to keep at it, LTO is high cost, it generally needs prices of at least those
seen in 2010-2014 to be successful. Practically every LTO company has PDP PV10 less than long
term debt at $50 oil. Further, this is after most knocked the crap out of estimated future production
costs (IMO they had to fudge some numbers to even get them where they were reported).
99% of US residents want to believe that the "shale renaissance" means $20-$30 oil for the
next 20 years. I want to help make sure they, and Wall Street in particular, know that isn't going
to work.
I also want it known the reason there is so much interest in LTO in the lower 48 is because
these large companies have few other options. We have went through those.
Finally, we do not want to go through $20-$30 WTI again. It has been a harrowing experience.
Maybe no traders read this stuff, but if they do I want them to know if they are shorting oil
they better have good timing, because the price is STILL far below what is needed to meet estimates
of future demand.
Dennis, I will again say thank you for keeping POB going.
My analysis of SEC fillings shows that a vast majority of shale players were deeply cash negative
even before the drop in oil prices. This includes the largest oil producers in the Bakken, Continental
and Whiting.
One of a few exceptions is EOG, which was cash-positive in 2013 and 2014. Others were large
E&Ps with significant conventional assets (such as Oxy)
Dennis wrote; "The figure below shows debt was being paid down in 2013, based on Rune Likvern's analysis."
What my chart shows is that some of the investments/CAPEX was recovered [temporarily cash flow
positive] while oil prices were high, WTI above $100/bo.
It is not possible to derive from the chart how all the surplus [positive cash flows] was disposed.
Positive cash flows have likely been used for dividend payments, pay down some principal and/or
increase cash to make companies better prepared to ride out what many expected to be a temporarily
down leg in the oil price.
For the months Jan – Mar-16, my estimates show that for all Bakken(ND) it was cash flow
negative of about $1.1 – $1.2Billion .
That explains the resilience of the Bakken LTO extraction.
"I think $80/b will be enough for the current average well to be profitable."
Current as in existent producing wells?
And is $80/bo (@WH) a weighted average price?
Average for May-16 is $33/bo for ND sweet (and nat gas now comes with a loss on sales).
The thing is, and due to the geometrical shape of the profile from the existing producing wells,
the longer the price remains low, the higher it needs to become later to reach a weighted average
of $80/bo.
The $80/b is a breakeven price for a well drilled today, including only the cost of debt for
that well.
Imagine a company who has bought up some existing leases from a bankrupt company. They are
a company with deep pockets that can borrow at the prime rate.
For such a company, or a well run LTO player such as EOG, a 2014/2015 average LTO well in the
Bakken, or Eagle Ford breaks even at about $80/b at the refinery gate.
The average well will not be profitable below $80/b.
The companies that continue to drill and complete wells are just trying to stay afloat, hoping
other companies go bankrupt.
Or they think that most of their wells will be above average.
:-)
To be honest I expected the decline rates to be much higher in the LTO plays at current price
levels than we have seen.
The DUCs can pay back the completion costs at $50/b. The money spent on drilling cannot be
unspent, so perhaps that explains some of the continued well completion.
Thanks Mike.
When 2 years ago at the time of oil price collapse I first looked at this "black box" called LTO
the only people that made sense regarding LTO economics were you, shallow, Mr Berman, and Mr.
Likvern. 4 people in the whole English speaking world!! There was one more person in Russian language
that I have read his thoughts where he touched on LTO economics but more in context of general
oil depletion.
So 1000's of blogs, 1000's of tv channels, 1000's of newspapers and only 4 people
that made sense regarding this LTO subject in English!!! So after 2 years when shale economics
are crystal clear there are still 4 people in English speaking world talking common sense!! Unbelievable.
It is just hilarious that you got call from WSJ just right now to have a chat after all has
been printed regarding fake shale "technology improvements", "efficiency", and "energy revolution"
in general.
If you get ever invite by CNBC/Bloomberg for live TV appearance please let us now
so we can all watch :-)
But I know that they don't want you near their parking lot because their audience is not ready
to handle the truth. They will bring Mr. Ward who is not really independent analyst but he was
part of shale for so many years so of course he knows the numbers. But he will only say things
in small dosages, one tea-spoon at the time so audience can absorb the news in small bits.
Have a nice day.
Ves. Mike deserves some credit for taking the message to Oilpro. Rune and Enno do too.
Mike has opened several investment bankers eyes over there. These guys believed the shale guys
break evens until the 2015 10K came out, and some of us started saying, "hey, these guys are ALL
insolvent at $50 WTI, and the price is currently $30".
Suddenly some light bulbs started going off that a lot of BS was being tossed around.
Shallow. Yes, Rune and I did mention Mr. Likvern but forgot about Mr Enno. That is some great
stuff that Enno is doing and I am always wondering how he finds time with data that he is collecting
because I am always short on time.
And Mr. David Hughes at this website http://shalebubble.org
My job is to make good decisions as they relate to my business and hopefully in doing so, take
care of my family. I have yet to invest in any Solar, windmill or electric car company, the facts
just do not support those investments yet.
Texas tea, obviously I strongly disagree! I certainly do not begrudge your right to make a
living and support your family as best you see fit. However I just don't see how you, or anyone
else for that matter, are going to do that by continued investments in oil and gas. The EROEI
numbers just don't support your point of view. Parking lots full of monster pick ups and SUVs
notwithstanding. To me all of that looks like dinosaurs on the brink of extinction.
To be clear, while personally I hope we still have a least a slightly better than a snowball's
chance in hell of pulling out of our current economic mess by transitioning to a mostly renewables
based economy I don't think the continuation of BAU is very likely for long.
BTW some might find it a bit contradiction given some of my posts but I think you are right
that TESLA and Aubry McClendon are flip sides of the same coin! But Aubry is dead while Musk is
still alive to see another day. Musk and all of us could be gone in pretty short order if we don't
manage a transition very soon,
The Paradox of Oil: The Cheaper it is, the More it Costs
What we do know is that the EROEI of oil is in terminal decline, and it is this geological
reality which means that there will forever be upward pressure on the price of oil, and that is
forever going to put pressure on oil-dependent, growth-orientated economies. As Murphy and Hall
argue: 'increasing the oil supply to support economic growth will require high oil prices that
will undermine that economic growth' (Murphy and Hall, 2011a: 52). This is the world we now live
in.
That very same set of circumstances is also prejudicial to the yet to be born alternative energy
paradigm which could very well be still born. Musk might yet end up slamming one of his TESLA
P90D ludicrous mode luxury sedans into the side of an overpass at 100 mph just like McClendon
did with his LNG powered vehicle.
I wish all of us lot's of luck and may we all see a brighter future for our families and children.
Thanks, I've downloaded it and will definitely read it but I'm interested in trying to understand
the implications in a deeper more systemic way and more specifically if it is possible to identify
thresholds and tipping points when a previously viable fuel ceases to be viable. At the moment
I just have sort of a gut feeling but I suspect that no matter what happens to the price of oil
from here on out, shales and tar sands are no longer going to be worth going after. Of course
even if that can be proven I doubt it will stop society from going after them.
"Tar sands retrieved by surface mining has an EROI of about 5:1….tar sands retrieved from deeper
beneath the earth (steam injection), fares worse, with a max average ratio of just 2.9 to 1. That
means one unit of natural gas is needed to create less than three units of oil-based energy."
Almost predictable.
Can you imagine if for mountain-top removal coal mining that the company was required to put the
mountain-top back in place? The return would go way negative.
Price doesn't matter? This is a conservative perspective. A more bold one is that price can
be decreed to define function within the facade of normalcy.
Surely every power center
of the world knows oil is entirely decisive. It would be insane to allow it to fluctuate without
efforts at explicit control.
"... Some days ago I had the opportunity to watch a picture titled "The Big Short", an opus on the 2008 financial crisis. It portraits remarkably well how the marriage of ignorance with the lack of scruples can concoct the most toxic of outcomes. The so called "shale oil boom" is not much of a different story, only perhaps at a different scale. ..."
"... This contraction cycle will resound for years to come. Existing fields decline at a rate somewhere between 4% to 5% per year, meaning that the industry needs to bring online additional 3 Mb/d to 4 Mb/d every year just to keep extraction levelled. The investment deferrals under way and the time lag required to bring new fields online guarantee this replacement will be missed several years going forwards. ..."
"... Rystad Energy, a Norwegian petroleum and gas business intelligence consultancy, projects new extraction projects to miss the yearly decline of existing fields for at least the next five years . This consultancy expects an overall extraction decline of 300 kb/d this year, 1.2 Mb/d in 2017 and 2018 and deeper declines in 2019 and 2020. ..."
"... There are also reasons to believe the IEA is underestimating consumption , but this estimate produces a conservative (nearly best case) scenario: growth of 1.25 %/a. ..."
"... the extra stocks built by the OECD can alone keep consumers happy until the end of 2017; to go beyond that China has to follow the same strategy. However, if the trends identified here prevail, by the beginning of 2018 consumption will be exceeding extraction by almost 3 Mb/d, exhausting the remaining stocks of 0.5 Gb in a matter of months. ..."
"... The successive supply destruction - demand destruction cycles are the key dynamics of peak oil at an yearly scale. These cycles push left and transform each curve in succession, eventually producing a stall of traded volumes and finally a decline. The petroleum market has endured a supply destruction cycle for almost two years now, that while clearly closing, is yet far from the 100+ $/b price required to provide a reversing signal to the industry. With various petroleum exporting nations on the brink - in great measure due to the financial machinations concocted in the US - this supply destruction cycle might have been just too long. ..."
"... Present supply destruction cycle is coming to an end. ..."
Titling the
last press review of 2015
I asked if that had been the year petroleum peaked. The question mark
was not just a precaution, the uncertainty was really there. Five months later the reported world
petroleum extraction rate is pretty much still were it was then. This is not a surprise, but the
impact of two years of depressed prices is over due.
Nevertheless, during these five months of lethargy the information I gathered brings me considerably
closer to remove the question mark from the sentence and acknowledge that a long term decline is
settling in. Understanding the present petroleum market as a feature of the supply destruction -
demand destruction cycle makes this case clear.
Looking Backwards
Worldwide petroleum extraction hit some sort of ceiling back in 2004, once it crossed above 70
Mb/d. The volume coming to the market kept increasing, but at a shy pace. From 2004 to 2012 the extraction
rate grew only 3%, from 72 Md/b to 74 Mb/d.
At the same time, the Brent index endured a remarkable rise from 2004 to 2008. Some called this
the "end of cheap oil", alluding to the increasing need for lower return-on-investment resources:
ultra-deep water, heavy petroleums, Arctic, etc. Nevertheless, the price collapsed to a third from
2008 to 2009. Back then I explained how
the concept of an ever rising petroleum price was at odds with "peak oil"
. For the world extraction
to enter a declining trend, periods of supply destruction must take place to keep those higher entropy
resources at bay.
Today the market lives the second supply destruction cycle since the 2004 shift. In reality these
cycles are lasting far longer than I anticipated, showing a considerable time lag in the adjustment
of the supply curve. There is however something especial to this supply destruction cycle, that could
possibly be sealing the end of growth to what petroleum is concerned.
The Miracle
Some days ago I had the opportunity to watch a picture titled "The Big Short", an opus on the
2008 financial crisis. It portraits remarkably well how the marriage of ignorance with the lack of
scruples can concoct the most toxic of outcomes. The so called "shale oil boom" is not much of a
different story, only perhaps at a different scale.
From 2011 to 2013 the extraction of petroleum from source rocks and other low permeability
reservoirs in the US grew almost 2 Mb/d. These were remarkable days for the industry, with plenty
of jobs created and a major revival to the American hands-on approach to business. However, such
a rapid growth on a relatively small resource left many wondering if something else was at play.
By the beginning of 2014 it was becoming evident that the "shale oil boom" had been largely fuelled
by the finance industry, that was feeding relentless amounts of what is sometimes called "dumb money"
to be burned on America's source rocks. The scheme was simple: petroleum companies inflated their
reserve assessments 10 times or more and imprudent investors kept buying bonds irrespective of losses.
They thought they were investing on conventional 30 years petroleum bearing wells, when in fact were
getting 3 years lifetime wells.
By late 2014 "shale oil" extraction in the US had increased 3.5 Mb/d since 2011, but at that point
the price of petroleum in international markets was already coming off a cliff. 200 G$ rested on
the American junk bond market, left to be trounced by a deep supply destruction cycle.
A bond default and bankruptcy wave formed throughout 2015, and is still surging today. One third
of the companies involved in the "shale boom"
should go belly up
this year alone
. However, these financial owes have not yet translated into a visible decline
in extraction rates. This means that even bankrupt, petroleum companies are still bringing new source
rock wells online, only deepening further the present supply destruction cycle.
When the WTI index (the regional equivalent to Brent) sank under 40 $/b late last year, Arthur
Berman produced
a most elucidating set of maps
spatially portraying well profitability. At those prices only
a small fraction of the wells extracting petroleum in the Permian formation were profitable.
And this is the remarkable achievement engendered by the marriage of America's petroleum and finance
industries. Petroleum extraction became effectively insulated from prices; bankrupt or not, the wells
on the Permian, Bakken and Eagle Ford formations will keep pumping - because the dumb money keeps
burning. For the rest of the world, this is like inserting a sliver of 4 Mb/d at 0 $ at the far left
of the supply curve, pushing all other resources rightwards. For an international industry already
in contraction, this is like adding gasoline to the fire.
Supply Destruction
The present supply destruction cycle dates back to the beginning of 2014 - it actually unfolded
before the price collapse. While prices still held above 100 $/b, international petroleum companies
started facing issues regarding shareholder revenues. The supply curve is simply becoming too steep,
when resources such as "Arctic oil" or "pre-salt" enter the portfolios of petroleum companies. The
scale down of exploration activities started that year, as so the slashing of staff. In 2014 circa
100 000 jobs were laid off by the industry
.
The price rout brought about by the shale miracle only accelerated this contraction. In 2015 the
number of jobs laid off
is estimated to have hit 250 000
. 2016 could end up close to that.
In panic mode, petroleum companies have been postponing or outright cancelling projects. Recent
estimates point to
a total of 400 G$ in deferred investments
. A new wave of mergers in the industry is now expected.
This contraction cycle will resound for years to come. Existing fields decline at a rate somewhere
between 4% to 5% per year, meaning that the industry needs to bring online additional 3 Mb/d to 4
Mb/d every year just to keep extraction levelled. The investment deferrals under way and the time
lag required to bring new fields online guarantee this replacement will be missed several years going
forwards.
Rystad Energy, a Norwegian petroleum and gas business intelligence consultancy, projects new
extraction projects to miss the yearly decline of existing fields
for at least the next five years
. This consultancy expects an overall extraction decline of 300
kb/d this year, 1.2 Mb/d in 2017 and 2018 and deeper declines in 2019 and 2020.
Looking Forwards
In a previous post
I analysed the gap between petroleum extraction and consumption reported by
the IEA. Using data fragments published by the press I then produced an estimate for China's stock
flows that greatly explains what have been heretofore unaccounted barrels. In essence, the OECD and
China could have amassed together a total of extra 900 Mb in stocks since the beginning of 2014.
Using this estimate for worldwide stocks I was then able to compute world petroleum consumption
for the past two years.
There are also reasons to believe
the IEA is underestimating consumption
, but this estimate produces a conservative (nearly best
case) scenario: growth of 1.25 %/a.
Matching the outlook produced by Rystad with this consumption trend one can start the always risky
exercise of predicting the future. In this case I projected forwards the consumption pattern of 2015
- with a double slump in later Winter and Spring, and the Summer up-tick - increasing at the steady
pace identified before. As for extraction, I simple spread Rystad's outlook into a monthly dataset.
The end result can be observed in the graph below.
The extraordinary stocks built by the OECD and China since 2014 are projected to hit 1 Gb right about
now, but also to soon stop growing. None of this counts with the fires in Alberta, or the social-economic
owes endured presently by Nigeria or Venezuela. Still, in this conservative scenario consumption
is just about to exceed extraction.
In the scenario above I also made the exercise of estimating how long can these extraordinary
stocks last if they are immediately released on the market to stave off an immediate price reaction.
That being the case,
the extra stocks built by the OECD can alone keep consumers happy until
the end of 2017; to go beyond that China has to follow the same strategy. However, if the trends
identified here prevail, by the beginning of 2018 consumption will be exceeding extraction by almost
3 Mb/d, exhausting the remaining stocks of 0.5 Gb in a matter of months.
How likely is this scenario? Is the OECD willing to bring its stocks promptly on the market to
keep prices where they are now? Or will it wait for prices to rise to provide breathing air to the
petroleum industry? And for how long can countries like Iraq, Nigeria or Venezuela withstand prices
under 100 $/b?
As the events of recent months show, it might be far more likely for some disruptive happening
to shake things up, than for these pretty trends to endure. In any case, this supply destruction
cycle is coming to an end sooner rather than later. The market will eventually have to fix the widening
gap projected in the graph above.
Consequences
These two years of supply destructive prices have pushed various important petroleum nations and
regions to the brink. If there is some unexpected event shaking up the petroleum market, it will
likely be in one of these places.
Iraq
- a country in war and divided in four different zones of military influence.
The impact of low petroleum prices on the Bagdad budget is postponing a victory over Daesh and
brewing political chaos. The increase in extraction of recent years halted and could reverse if
the politico-military situation does not improve. Daesh' burnt land policy is not helping either.
Nigeria
- shortages of hard currency have greatly impaired daily economic life and
an IMF intervention seems likely. In parallel, rebel groups have entailed a series of sabotage
operations on petroleum assets. Petroleum extraction should decline visibly in the next few years
and some fields even abandoned if petroleum prices stay below 60 $/b.
Venezuela
- overwhelmed by a snowball effect where under-priced petroleum causes such
economic disruption that impacts extraction itself. Exporting less petroleum for less money and
on the verge of serious social convulsion.
Canada
- petroleum regions in depression menace to drag down the whole economy with
visible impacts on housing and all industries related to extraction. Number and size of new projects
greatly reduced in recent months may augur an almost unthinkable long term extraction decline
in the country with the largest claimed petroleum reserves in the world. The long term effect
of the wild fires raging presently in Alberta is still unknown. If petroleum facilities are destroyed,
it might not be easy to recover with prices under 50 $/b.
Angola
- ran out of hard currency reserves to pay foreign contractors, sending the
latter on the run. Presently negotiating an aid programme with the IMF. Meanwhile, the ruling
regime has imprisoned numbers of opponents. Petroleum extraction bound to decline in the next
few years.
Azerbaidjan
- for long in "secret" talks with the IMF over an aid programme. Ambitious
prospects for export hikes are likely unattainable.
Mexico
- lost 1 Mb/d to depletion during the past ten years and is unlikely to hold
or halt the decline. Relevant downwards reserve revisions have been conducted in recent times.
Brasil
- engulfed in political chaos tied to misuse and mismanagement of its national
petroleum company, Petrobras, one of the most indebted companies in the world. The pre-salt resource
seems adjourned
sine die
.
North Sea
- extraction is expected to stop in 100 different fields throughout 2016.
Conclusion
Depending on how the OECD (and perhaps China) decide to manage their extra petroleum stocks, the
shift to a new demand destruction cycle closing the gap portrayed in the graph above will be complete
by early 2018 the latest. If something goes seriously wrong with one of the key petroleum exporting
nations, this shift could happen overnight.
What will such new cycle bring? Recent experience provides some clues: it took eight years for
world extraction to rise from 72 Mb/d to 74 Mb/d; the so called "shale boom" required four years
at prices above 110 $/b. These long time lags mean that Rystad's declining outlook is by this time
almost certain.
The coming demand destruction cycle is therefore likely to be a long one too. And at some point
it can invert the extraction trend upwards. In such a scenario, can extraction return to the 80 Mb/d
rate of 2015? That is the big question, which I will abstain from answering definitively. Looking
at it from the other side of the equation, for such a scenario to ever materialize, demand must withstand
again a good number of years at high prices without undershooting.
The successive supply destruction - demand destruction cycles are the key dynamics of peak
oil at an yearly scale. These cycles push left and transform each curve in succession, eventually
producing a stall of traded volumes and finally a decline. The petroleum market has endured a supply
destruction cycle for almost two years now, that while clearly closing, is yet far from the 100+
$/b price required to provide a reversing signal to the industry. With various petroleum exporting
nations on the brink - in great measure due to the financial machinations concocted in the US - this
supply destruction cycle might have been just too long.
The Take Away
"Shale oil" is effectively insulated from prices by the US finance industry.
Present supply destruction cycle is coming to an end.
After two years of low prices, extraction is set for a multi-year decline.
New demand destruction cycle to start in the next 18 months, depending on how stocks are managed.
A return to an extraction rate of 80 Mb/d seems unlikely for the foreseeable future.
Alleged peace-maker John Kerry threatened to wage war-without-end
on Syria - if the Middle East country does accept the US demand for regime change.
That's hardly the language of a supposed bona fide diplomat who presents an image to the world as
a politician concerned to bring about an end to the
five-year Syrian conflict.
The US Secretary of State repeatedly sounds anxious to alleviate the appalling suffering of the Syrian
nation, where over the past five years some 400,000 people have been killed and millions displaced
as refugees.
Anyone who has not been brainwashed by Western media propaganda knows full well that the suffering
of Syria has been caused by Washington and its allies sponsoring a covert war for regime change in
that country.
Kerry was speaking during another round of failed negotiations - this time in Vienna - along with
other leaders from the 17-nation International Syria Support Group that includes Russia, as well
as the United Nations.
The "support group" is a disgustingly erroneous name, given that certain
members of this entity - primarily the US, Saudi Arabia and Turkey - have done everything in their
power to sponsor a proxy terrorist war on Syria. If the truth were not so abject, it would be laughable.
In a Voice of America
report headlined "US still has leverage in Syria," Kerry is quoted thus: "He said the greatest
leverage [on Syria] was the fact that [President] Assad and his backers would never be able to end
the war in Syria if they declined to negotiate a political settlement."
In Kerry's Footsteps: What Saudi 'Plan B' Actually Means for Syria and Iran Consider the pernicious
import of that for a moment. In other words, America's top "diplomat" is laying down a criminal ultimatum
to the sovereign state of Syria and its elected government of President Bashar al-Assad. Kerry is
saying in no uncertain terms that unless the Syrian authorities do not accept Washington's demand
for regime change, then the country is facing never-ending war.
Of course, being a weasel-worded diplomat, Kerry does not use the illegal term "regime change".
He instead talks about "political transition". And he has set a date in August for this "transition"
to take place. But what Kerry's euphemistic jargon boils down to is this: the Syrian president and
his administration must vacate government - or else face more violence and destruction.
This is the political objective that Washington and its allies in NATO, Saudi Arabia and Turkey
have wanted all along. They want what is an independent, anti-imperialist Syrian government to give
way to some composite regime that would be a puppet for Washington's geopolitical interests in the
oil-rich, strategically vital Middle East region.
Any replacement regime would spurn its erstwhile allies of Russia, Iran and Lebanon's Hezbollah
resistance movement to become an American vassal.
In reality, the supposed pro-democracy change that Washington allegedly
wants to install in Syria would be dominated by a repressive, fundamentalist regime that would betray
the interests of the Syrian people. We can count on this outcome because the proxies who are waging
Washington's covert war are dominated by extremists fully aligned with their despotic sponsors in
Saudi Arabia and Turkey.
Kerry's apparent confidence in predicting that Syria faces a war of attrition if it does capitulate
is a tacit admission by Washington that it controls the illegally armed factions in Syria.
The United States may officially proscribe terror groups like al Qaeda-linked Jabhat al Nusra
and the so-called Islamic State (also known as Daesh). The US pays lip service to "defeating terrorism".
But anyone with an informed understanding of what is really happening in
Syria and other countries subjected to US-led regime change knows that Washington has orchestrated
these same terror groups for its criminal political objectives.
This is corroborated by the fact that Washington refuses to coordinate its (ineffectual) bombing
campaign with Russia to eliminate the terror groups. It is corroborated by the fact that Washington
and its allies point-blank refuse Russia's proposals at the UN Security Council to designate other
known terror outfits - Jaysh al-Islam and Ahrar al-Shams - as terrorist.
Jaysh al-Islam and Ahrar al-Shams are every bit as vile and barbaric as the other al Qaeda-affiliated
franchises. They all espouse the same twisted death-cult ideology; fight alongside each others (when
they are not feuding, that is, over war spoils); and ultimately they all share the same sponsors
and American-supplied weaponry.
'Fair Game'? What Kerry's 'Absolute Lines' in Syria Really Mean It is openly admitted that America's
allies Saudi Arabia and Turkey, as well as Qatar, bankroll Jaysh al-Islam and Ahrar al-Shams and
that this nexus serves as a conduit for American weapons from the Central Intelligence Agency.
Why else would John Kerry
begin his week of "diplomacy" in Vienna by first making an urgent visit to Saudi King Salman last
weekend. Kerry was reportedly appealing to the 9/11-sponsoring Saudi regime to support his diplomatic
push in Vienna. The Western media "reported" Kerry's Saudi visit as if it were a benign mission,
as they usually do. Whenever it should be obvious that what he was really doing was trying to get
the Saudis to ease off on the terror war in Syria.
Washington is currently trying to wrangle regime change in Syria through a political track. That
is a world of difference from gullible Western media projections of Kerry's pretensions of "negotiating
peace".
Yet all the while the US and the Saudis are reserving the right to use "Plan B" if the political
track should not materialize in regime change.
That is what Kerry really means when he said in Vienna that "Assad and his
backers would never be able to end the war in Syria if they declined to negotiate a political settlement."
Washington's "leverage" in Syria is due to the simple, diabolical fact that it and its despotic
allies ultimately can turn on and off the violence when it is expedient for their interests. And
that violence relies on the deployment of known terrorist organizations, including the ones that
Washington's double-think refuses to recognize as "terrorist".
So let's put this into stark perspective. Despite his Orwellian title of diplomat and peace-maker,
US Secretary of State John Kerry is the public face of a terrorist enterprise.
What other world power gives itself the right to threaten nations with "regime
change or war"? And yet this same nation considers itself a paragon of democracy, human rights and
law-abiding probity.
The United States of America is a rogue regime on a criminal scale that exceeds the very worst
in history.
As a parting footnote, John Kerry is a decorated American "war hero". He served four months as
a navy officer during the US genocidal war on Vietnam during the late 1960s. Kerry received a bunch
of medals for his "actions", which according to reliable accounts from veterans on his river-boat
patrols, involved shooting fleeing Vietnamese peasants in the back.
This is the same Kerry who is now purporting to bring peace to Syria.
Like everything that Washington says, it is full of lies and deception. The abiding lesson: don't
turn your back on Washington and its terrorist-sponsoring, war-mongering "diplomats".
The views expressed in this article are solely those of the author and do notnecessarily reflect
the official position of Sputnik.
Decision could lead to many more abandoned wells in Alberta
Tracy Johnson · CBC News May 19, 2016
The Redwater Energy case is one that the energy sector, international investors, bankers,
lawyers and regulators were all watching closely.
Redwater was a tiny oil and gas company that went into insolvency in the spring of 2015.
It owned a stake in 16 producing oil and natural gas wells, as well as nearly 70 more inactive
wells. It owed its bank, ATB Financial, a little more than $5 million.
Redwater's bankruptcy trustee, Grant Thornton, wanted the ability to sell the producing
wells in order to pay back debt.
However, the Alberta Energy Regulator (AER) argued that any proceeds from asset sales needed
to go first to clean up the mess - namely those 70 non-operational wells, that have not been
subject to the costly decommissioning process.
The judge ruled Wednesday that secured creditors, such as banks, have priority over environmental
concerns.
"... Tom Ward, formerly of Chesapeake and Sandridge, yesterday on CNBC. "The dirty little secret in our business is that you cannot grow production within cash flow.". This, my friends, is a statement guys like Mike and me have been waiting for the "shale barons" to admit. ..."
"... At least he admits it. They claim they are drilling "world class" reservoirs, but they drill hundreds of wells a year and NEVER reach a point where they can develop out of cash flow. That is far from a world class reservoir. ..."
"... When even hard core businessmen stop making sense, we know that is just another sign of a failing society. The ride down is going to produce some strange actions and some strange bedfellows. ..."
Tom Ward, formerly of Chesapeake and Sandridge, yesterday on CNBC. "The dirty little secret
in our business is that you cannot grow production within cash flow.". This, my friends, is a
statement guys like Mike and me have been waiting for the "shale barons" to admit.
At least he admits it. They claim they are drilling "world class" reservoirs, but they drill
hundreds of wells a year and NEVER reach a point where they can develop out of cash flow. That
is far from a world class reservoir.
When even hard core businessmen stop making sense, we know that is just another sign of a
failing society. The ride down is going to produce some strange actions and some strange bedfellows.
Reply
There have always been three routes out of the unsustainably low prices: natural
decline/growth of supply/demand, collaboration constraints on supply, and military conflict.
Since January, while the talk of a growth freeze had no effect whatsoever on actual supply, the
natural decline/growth did reduce the overhang by a couple of hundred thousand barrels of oil per
day. Meanwhile, two little-discussed and less-understood military interventions took a combined
900,000 bopd out of supply in a virtual instant.
The history of attacks by rebels on oil infrastructure in the Niger Delta and the coincident
prosecution of a former rebel superficially suggested that this attack was another in protest. On
the other hand, responsibility for the attack was first claimed two months after the fact and by
a group not previously known to exist, namely the Niger Delta Avengers. Moreover, the
sophistication of the attack diverges from the historical airboat-and-AK style of rebels in the
region.
A similarly mysterious outage affected 600,000 bopd out of northern Iraq. Located in a region of
multi-lateral conflict and poor transparency, this interruption could be easily dismissed.
Nevertheless, the fact remains that the exact cause of this major supply interruption was not
publicly claimed or understood by any of the parties.
"... as a newbie to post but a long time reader of this blog, i think you hit the nail on the head. I have participated in LTO wells with CLR and others in Oklahoma (we own minerals) and have followed the companies who are active there since the "discovery" of the Woordford and others. Paying particular attention to CLR when they use the words like "patience" before starting to drill again, this is a sea change in attitude. ..."
"... I for one am in the camp that with higher frac loads and increased number of stages not only does the IP rate increase but I think the ultimate recovery also increases as more rock is broken down and open to the well bore. again just MHO, time will tell. ..."
"... One other quick point, a lot of the LTO players are selling assets elsewhere and buying leasehold in SCOOP and STACK. Over pressured, great infrastructure, favorable business climate, now if we can just get rid of the pesky earthquakes. ..."
Shallow sand, As for shale, it is very dependent on credit. If credit does not come back as prices rise,
and just develops out of cash flow, I think the actual data from CLR is evidence that a very high
price will be needed for it to begin to grow again.
Exactly. LTO companies will not be able to rump up production because:
1. They have little or no positive cash flow
2. Need to service accumulated (huge) level of debt
3. Can not increase the level of debt further, as they fell out of favor for Wall Street.
as a newbie to post but a long time reader of this blog, i think you hit the nail on the
head. I have participated in LTO wells with CLR and others in Oklahoma (we own minerals) and have
followed the companies who are active there since the "discovery" of the Woordford and others.
Paying particular attention to CLR when they use the words like "patience" before starting to
drill again, this is a sea change in attitude.
Their stock price has been rewarded I think because they have hinted that their priority is
maintaining liquidity and servicing their debt. If you can't increase your production, how can
you increase your net income? By letting prices raise and limiting spending.
If prices rise 50% from here to $90WTIC, that is better then doubling your production and selling
it at $45. There will be "new" money for sure come back into the LTO space as prices increase,
but the best "sweet spots" are now HBP and will be developed as cash flow allows.
Just my humble opinion. I have watched in amazement as marathon oil has permitted two multiunit
wells on us and has spud one. I can't help but think they believe oil prices will be higher (while
drilling cost are lowest) by the time these wells get to market in late fall.
If I had to pick a price point for the best areas in the LTO space it is $80 plus to make a
decent return.
If you do not mind me asking, am I correct that most of the BOE out of these "new" OK hz plays
consists of natural gas and condensate, and that oil tends to decline very fast?
I have read your comments with interest as your experiences are very much mainstream of what
the oil and gas industry is enduring. My first bust was 85-86 so this is not new to us. To your
question, based on all the data public and otherwise some of the very best wells in the LTO space
are being made in the SCOOP area of central Oklahoma. As with many of the shale plays there are
different "zones" from dry gas at the deeper part of the play to "oil" in the most up dip areas.
Thickness varies from 150′-350′. The area that is being focused on under the economic parameters
that now exist is the "wet gas" area where you will get a flush of oil say 100,000 BO in the first
year or so but the oil will decline rapidly and you are left with "wet gas". 1350BTU.
Some operators strip out the liquids other do not. But I have wells that are 4 years old still
producing over 3oooMCFD. Now at $2MMBTU that sucks but when (if) nat gas prices normalizes it
will ring the cash register.
On the up dip oil part we have only two fully developed units, Good Martin with 8 wells and
the May Unit with 7 wells. The Good Martin unit has been on production for a year last month.
The production is within the range that was expected but I do not have pressure data to give me
full confidence in the ultimate recovery. The May unit is still being completed. I will say, both
CLR and Marathon have INCREASED their BOE recovery in the most recent reports.
As with all things, as completion cost have come down, you can increase the load and up the
recovery. I for one am in the camp that with higher frac loads and increased number of stages
not only does the IP rate increase but I think the ultimate recovery also increases as more rock
is broken down and open to the well bore. again just MHO, time will tell.
One other quick point, a lot of the LTO players are selling assets elsewhere and buying
leasehold in SCOOP and STACK. Over pressured, great infrastructure, favorable business climate,
now if we can just get rid of the pesky earthquakes.
"... I will tell you how "sane" companies react to down turns like we are going through. They batten down the hatches, cut costs to bare minimum. When prices recover, they do not immediately go great guns. They first get caught up on the maintenance that was delayed due to the downturn. Then, once that is done, they slowly begin to spend money on new wells. ..."
"... Early on, most companies were hoping for a quick recovery. 2015 persistent low prices, followed by the hammer of $20 oil in Q1 has really taken a toll, IMO. This is why we are now seeing many BK. Q1 knocked them out. ..."
"... What I think should worry many people is that those of us considered "marginal" are weathering this storm better than many of the large companies. We are operating stuff that the majors/large independent companies got rid of decades ago, that was deemed to be too costly for them to continue to operate. ..."
"... Now, those majors/large independents are finding there is almost nothing left of "cheap" to develop oil. Deep water, no. Shale, no. Tar sands, no. ..."
"... The shale companies are spending over $5 million per well to obtain 150-400K BO over a period of 20+ years. Folks, they have sold off assets all over the world to go after this stuff. That should be a big concern. ..."
"... In December 2008 oil price was $40. Shale started expansion around that time with the free money from the banks. Today in mid 2016 price of oil is $48 and it is evident that Shale is gradually closing the shop with just additional life-support from the banks to scrape the bottom of the barrel in the remaining sweet spots. ..."
"In fact the price has collapsed hasn't it, in spite of steadily worsening EROI and now
virtual cessation of exploration and development. Gail's explanation fits the evidence we have
in front of us today. Simple EROI or depletion models don't so well. "
The 2014-16 price collapse was due to over-production, which was a result of a 4-fold increase
in upstream capex over the previous 10 years. It's a cyclical event, like in 1982-86, 1998, 2001-02
and 2008-09. The global supply and demand are gradually rebalancing. Prices are already recovering
(+80% since Fenruary lows) and will rise much further in the next several years due to the current
sharp decrease in exploration and development spending.
One point I would like to make is that, unlike in response to prior cyclical downturns, OPEC,
thus far at least, has not cut production. I question if anyone has spare capacity, outside of
that caused by war/political strife.
It took massive amounts of leverage for the US and Canada to ramp up production, along with
a relatively stable oil price band of $85-$105.
It remains to be seen if that type of leverage will occur again in the immediate future.
I note, despite the price improvement, the rig count we all follow, North Dakota, is down to
24, with one still listed as stacking.
I will tell you how "sane" companies react to down turns like we are going through. They
batten down the hatches, cut costs to bare minimum. When prices recover, they do not immediately
go great guns. They first get caught up on the maintenance that was delayed due to the downturn.
Then, once that is done, they slowly begin to spend money on new wells.
Early on, most companies were hoping for a quick recovery. 2015 persistent low prices,
followed by the hammer of $20 oil in Q1 has really taken a toll, IMO. This is why we are now seeing
many BK. Q1 knocked them out.
If OPEC's goal is to finish off US companies, they will figure out a way to keep a lid on prices
this summer, and then drive prices back down into the $20s again. However, I am not sure if this
can be accomplished, or if OPEC members can even handle that. Further, it is clear to me that
Russia can ride out low prices better than most, but not $20s. The Q1 price collapse caused Russia
to act.
We are still here, and cautiously optimistic, but it is a very, very cautious optimism.
What I think should worry many people is that those of us considered "marginal" are weathering
this storm better than many of the large companies. We are operating stuff that the majors/large
independent companies got rid of decades ago, that was deemed to be too costly for them to continue
to operate.
Now, those majors/large independents are finding there is almost nothing left of "cheap"
to develop oil. Deep water, no. Shale, no. Tar sands, no.
The shale companies are spending over $5 million per well to obtain 150-400K BO over a
period of 20+ years. Folks, they have sold off assets all over the world to go after this stuff.
That should be a big concern.
This point has been made here repeatedly. Despite this severe price downturn and the alleged
glut, I think it is still true. There may be a lot of oil out there left to produce, but it will
cost a lot per BO to get it out of the ground.
…but it will cost a lot per BO to get it out of the ground.
Can you define "a lot" ?
I think $75/b (2015$) will allow a fair amount of oil to be produced profitably, but agree
it will take 6 to 12 months before there will be much of a production increase (say 1 Mb/d Worldwide)
in response to oil prices at $75/b. I imagine the slow response will result in a price spike to
$100/b as supply starts to run short (probably in 2018).
In December 2008 oil price was $40. Shale started expansion around that time with the free
money from the banks. Today in mid 2016 price of oil is $48 and it is evident that Shale is gradually
closing the shop with just additional life-support from the banks to scrape the bottom of the
barrel in the remaining sweet spots.
So the price in Shale case did not play ANY role. So where is that "cycle" that you see it?
There is no cycle. Shale was drilled regardless of price to kick the can just for few years to
mask over-leveraged economy.
Also from Dec 2008 to March 2008 only 27 wells per month were added in the Bakken/Three Forks.
Other LTO plays didn't really get going until 2010.
By August 2009 Brent was up to $72/b, from March 2009 to July 2009 the average wells added
per month in the Bakken was 40 wells/month.
Also it was the high prices earlier in 2008 that got things started, oil prices were over $80/b
from Oct 2007 to Sept 2008, the dip in oil prices was relatively brief, the oil price was under
$60/b for only 7 months from Nov 2008 to May 2009. The oil industry takes some time to react to
oil price changes. Chart with annual average Brent oil price in nominal dollars below. The price
has been above $70/b for all but 2 years from 2007 to 2015 (2009 and 2015).
There is no free market CYCLE if OPEC cuts 4.2mbd in January 2009 and then it does not cut
single barrel in November 2014. Of course there is always a "cycle" in long term.
"Prices did not remain between $40 and $48 per barrel"
That just shows you that price points are irrelevant. In 2008 when price was $40 did Shale
had crystal ball to know that price will go $100 in the next 6-7 years?
400 rigs that are drilling right now in US do they know where the price will be next year?
Reply
"... I also question as to whether or not this extreme debt-fueled LTO production will ever be able to ramp up again as we have recently seen? It looks as if gullible investors are lining up with every increase in price, but the real onslaught of bankruptcies are just beginning, imho. ..."
"... This is a pretty big bust, and as mentioned by a few insiders in the last post, (Doug Leighton and a few others), will the experienced and knowledgeable 'hands' be available to ramp up production in such big numbers, ever again? Will there be financing? Will they be forced to produce by Govt decree/intervention? How about by a 2 for 1 tax incentive like Canada has done in the past? ..."
"... Not to doom and gloom a new reality, mostly because I am optimistic by nature, nevertheless, an acknowledged Plateau or decline will shake society to its very core as we move forward. I think it will be like those cheap B level movies about the looming asteroid casting a shadow on Earth, with hordes of people frantically looking for any means to escape the ramifications. ..."
regarding statement: "but the USGS may be mistaken in assuming that US reserve growth is a good
analog for the rest of the world."
Is oil distribution different than every other resource as it applies to the US? I don't think
so. That is a very big assumption and does not take into account misrepresented reserves by more
secretive countries, as well as political unrest and other disruptions that may occur going forward.
Furthermore, as the Majors seem to be dropping in profitability will they be able to continuing
producing at today's rates, or will they wind down and/or diversify with respect to their shareholders,
their first responsibility? I also question as to whether or not this extreme debt-fueled LTO
production will ever be able to ramp up again as we have recently seen? It looks as if gullible
investors are lining up with every increase in price, but the real onslaught of bankruptcies are
just beginning, imho.
This is a pretty big bust, and as mentioned by a few insiders in the last post, (Doug Leighton
and a few others), will the experienced and knowledgeable 'hands' be available to ramp up production
in such big numbers, ever again? Will there be financing? Will they be forced to produce by Govt
decree/intervention? How about by a 2 for 1 tax incentive like Canada has done in the past?
Every one of these graphed scenarios but one show the 'Peak' 15-20 years out. Ron P, who I
respect very highly, has said in the past he believes that 2015-16 will/might/just may be the
peak, which we will know only in hindsight. Has anything really changed beyond dodgy economics
and a slowing economy? I suppose if the economy continues slowing the peak might ultimately be
delayed, but then if this is the case BAU is finished, anyway.
Not to doom and gloom a new reality, mostly because I am optimistic by nature, nevertheless,
an acknowledged Plateau or decline will shake society to its very core as we move forward. I think
it will be like those cheap B level movies about the looming asteroid casting a shadow on Earth,
with hordes of people frantically looking for any means to escape the ramifications.
I sent an oil post to my best friend last week. Actually, it was the article I shared with
this forum in the last post about Ft Mac. His response was, "wasn't Jeff Rubin the guy who once
predicted Peak Oil"? I wrote back with several other articles attached and said, "This is Peak
right now, it is beginning….the effects are simply not acknowledged, etc etc etc". The conundrum,
as I see it, is that every time this industry goes bust, for whatever reason(s), the entrenched
say, "See, there's no Peak, what a bunch of bullshit. If there was a Peak the prices would be
climbing"!
Dennis, I would really appreciate reading a strong prediction from you, and others from this
forum. I appreciate that you kind of did this with the caveat, (very polite I might add) that
said, "a more realistic decline scenario might be"… (or words to that effect), but it's driving
me nuts. I kind of see why TOD shut down, now. Their reasons were that there were simply not enough
solid articles about PO to keep a good discussion flowing. I reluctantly switched to PO.com for
daily background reading and the quality of discussion and ideas have been reduced on that site
to playground levels of name calling with lots of swearing and personal attacks tossed in. The
contibutors on this forum are the only game in town these days. I thank you all in advance for
sharing you opinions and knowledge.
Denis does good work, but its very difficult to pin down numbers when nobody releases detailed
data. The ones who have the better data bases are IHS and the oil companies which purchase it
from IHS. But nobody is about to release something that's probably worth several hundred million
$.
For example, what is the usgs estimate for reserv increases at El Furrial in Venezuela? That
reservoir has been badly mismanaged over the last 10 years. The mismanagement reduces booked reserves,
and also makes impossible the introduction of a large tertiary process project such as CO2 injection.
The same applies to dozens of fields. Several Venezuelan heavy oil fields with more than 10
billion barrels of oil in place are headed towards less than half of the pdvsa booked reserves.
And given the current practices and political regime, the reservoirs will be left gutted, which
makes impossible introducing meaningful changes in the future. The Maduro regime has turned into
a full blown dictatorship as of this week, it will change for the worse, so it looks like the
ongoing reserve destruction will continue for at least a decade.
"... Yet another BK, as Rune notified me today. Halcon, ticker HK, with operations in the Bakken and EFS. $3+ billion of debt. ..."
"... One of the Permian guys here mentioned that those of us who survive this debacle need to hoist a few cold ones sometime. I'm ready, once I am sure the debacle has passed. ..."
"... From todays article regarding Halcon: "it plans to file for a prepackaged bankruptcy that would wipe out $1.8 billion in debt and help it survive the drop in crude prices." ..."
"... It is the game of pretending where debt is wiped out as Kramer from Seinfeld would say "Jerry they write it off (debt). They do all the time". And then magically a "new" set of investors show up with newly printed or digitally created numbers on the account and start process again. And start drilling cash into the ground in order to get any oil left regardless of monetary paper loss/gain. What that tells you that current economic system is completely broken. It is running on fumes. ..."
Yet another BK, as Rune notified me today. Halcon, ticker HK, with operations in the Bakken
and EFS. $3+ billion of debt.
Further, Mr. McClendon's new company, American Energy Partners, announced they are winding
down and closing up shop.
One of the Permian guys here mentioned that those of us who survive this debacle need to
hoist a few cold ones sometime. I'm ready, once I am sure the debacle has passed.
Ves, 05/19/2016 at 9:43 am
SS,
This is not bankruptcy in real sense.
From todays article regarding Halcon: "it plans to file for a prepackaged bankruptcy that
would wipe out $1.8 billion in debt and help it survive the drop in crude prices."
It is the game of pretending where debt is wiped out as Kramer from Seinfeld would say
"Jerry they write it off (debt). They do all the time".
And then magically a "new" set of investors show up with newly printed or digitally created numbers
on the account and start process again. And start drilling cash into the ground in order to get
any oil left regardless of monetary paper loss/gain. What that tells you that current economic
system is completely broken. It is running on fumes.
"... The EROEI problem is quite evident in how it exacerbated this supply glut. A huge amount of metals production globally was allocated to the global oil boom for rigs, wells, platforms, vehicles, heavy equipment, etc... ..."
"... All the extra energy needed to produce that oil was "spent" on water trucks, sand businesses, metal extraction and refining, and a huge number of other ancillary businesses. The economic expansion it created fueled even more energy demand as the trucker, the business owner, the roughneck, or the expanding water truck companies new accountant spent their new income. ..."
"... As this low EROEI energy source went to a halt the last 2 years it made the oil glut even worse on the demand side as a significant driver of demand – fueling the multitude of ancillary businesses that make it low EROEI in the first place – also shut down. ..."
"... It is also why a slow uptick in low EROEI production as prices rise will actually have an odd tail-wind effect to rising prices at first. Its very nature means a significant investment of energy, and the way that plays out economically, in the real world, is the increased demand for everything from sand to chemicals, steel, specialty manufacturer parts, housing, and even pizza and strippers requires, and perpetuates as it passes hands multiple times through the economy (increasing money velocity in monetary terms). ..."
"... It's the true double edged sword of low EROEI (i.e. high cost) energy sources – if they shut down because of low prices created by a supply glut it makes the glut EVEN WORSE as that energy is no longer used, and the economic impact is a decrease in money velocity. ..."
"... The ripple effect from, say, a parts manufacturer laying off 10 employees, who now don't go to Chucky Cheese on Friday's, or buy Sam Adam's as often, or don't give the stripper a $20 anymore. The knock-on effect of lower money velocity amplifies the economic impact of low EROEI energy going offline, but has the opposite effect on the way up. ..."
"... Excellent points, Brian! I think it underscores why the financial shenanigans of funding low EROEI projects such as shale oil and tar sands backfired so badly. It is the classic example of throwing good money or good energy after bad! ..."
"... While it is becoming ever more self evident that as fossil fuels peak and their EROEI ratios decline that a BAU based industrial civilization can no longer be sustained, it also raises the question as to what kind of civilization we can maintain with relatively low EROEI alternatives such as wind and solar. ..."
The EROEI problem is quite evident in how it exacerbated this supply glut. A huge amount
of metals production globally was allocated to the global oil boom for rigs, wells, platforms,
vehicles, heavy equipment, etc...
An article on Bloomberg not long ago detailed a small Wisconsin town with particularly good
sand for fracking. This entire town in Wisconsin, hundreds of miles from the Bakken, had boomed
since 2010. Now it is in severe recession, and many businesses are struggling – not just the sand
producers.
THAT is how lower EROEI unfolds in the real world.
All the extra energy needed to produce that oil was "spent" on water trucks, sand businesses,
metal extraction and refining, and a huge number of other ancillary businesses. The economic expansion
it created fueled even more energy demand as the trucker, the business owner, the roughneck, or
the expanding water truck companies new accountant spent their new income.
As this low EROEI energy source went to a halt the last 2 years it made the oil glut even
worse on the demand side as a significant driver of demand – fueling the multitude of ancillary
businesses that make it low EROEI in the first place – also shut down.
It is also why a slow uptick in low EROEI production as prices rise will actually have
an odd tail-wind effect to rising prices at first. Its very nature means a significant investment
of energy, and the way that plays out economically, in the real world, is the increased demand
for everything from sand to chemicals, steel, specialty manufacturer parts, housing, and even
pizza and strippers requires, and perpetuates as it passes hands multiple times through the economy
(increasing money velocity in monetary terms).
It's the true double edged sword of low EROEI (i.e. high cost) energy sources – if they
shut down because of low prices created by a supply glut it makes the glut EVEN WORSE as that
energy is no longer used, and the economic impact is a decrease in money velocity.
If prices rise enough because the glut is ending, then increasing supply will also carry increased
demand and money velocity with it. This can create even higher prices, albeit on a marginal scale
globally, due to the multiplying effect of money velocity.
I shouldn't suggest it is extremely marginal though – 5 of the 10 largest companies on Earth
were energy extraction companies in 2014. The global impact, on a shockingly large amount of diverse
industries, from a boom in low EROEI energy extraction is meaningful for how it creates self-reinforcing
demand growth, and for how it exacerbates its own glut with demand destruction as their activities
slow down.
The ripple effect from, say, a parts manufacturer laying off 10 employees, who now don't
go to Chucky Cheese on Friday's, or buy Sam Adam's as often, or don't give the stripper a $20
anymore. The knock-on effect of lower money velocity amplifies the economic impact of low EROEI
energy going offline, but has the opposite effect on the way up.
This can then ALSO lead to inflation picking up faster than expected, and Central Banks running
to keep up by raising interest rates continuously (2004-2008 is an ideal example). That can lead
to serious consequences if, say, the low EROEI supply coming online is only replacing declining
supply elsewhere, all the while fueling higher demand, so prices keep rising because supply isn't
rising, but demand is. A double crunch eventually makes SOMETHING in the economy crack as higher
interest rates and rising oil prices (and therefore higher prices for… everything) hit the economy
with a one-two bunch of stagflation.
Next thing you know it's 2008, or 2018, or 2020, or… whenever the next crisis hits.
Excellent points, Brian! I think it underscores why the financial shenanigans of funding low
EROEI projects such as shale oil and tar sands backfired so badly. It is the classic example of
throwing good money or good energy after bad!
While it is becoming ever more self evident that as fossil fuels peak and their EROEI ratios
decline that a BAU based industrial civilization can no longer be sustained, it also raises the
question as to what kind of civilization we can maintain with relatively low EROEI alternatives
such as wind and solar.
My hunch is that if we can somehow muster the political will use what is left of the fossil
fuel windfall we have had access to over the last century or so and go pedal to the metal in building
out a renewables based civilization some pockets of humanity might be able to live quite well
for a long time into the future. BUT! there will still be a lot of pain and suffering for the
majority of earth's population.
I view what is happening with mass migrations from the Middle East into Europe as just the
beginning of a long term process of upheaval that will become more and more evident in many parts
of the world. It is really a process of triage of those who will make it through the coming energy
bottleneck.
This is exactly why I mentioned recently that I was becoming more interested in studying EROEI.
On a broad basis, the increasing migration and social inequality created from the growing gap
between those who transition and those formerly in the middle class that didn't make it, could
manifest societal breakdowns that impact everyone.
A global financial crisis that isn't handled as well as 2008 was by governments and Central
Banks could be a strong catalyst for the more grim scenarios some here see as inevitable.
It'll be a shame if we don't make it through. We will have been SO CLOSE to keeping it together
and getting past the most critical period of initial transition.
Fred, what did you think about the exercise I did in my
post on the last key post, attempting to compare the financial returns on a typical LTO well
with one particular alternative energy source? In one respect, I think the extremely poor short
term financial returns of the alternative when compared to the LTO well, are an indication of
the relatively low EROEI of the alternative.
On the other hand I also tried to examine the long term performance in that, the alternative
is expected to produce not less than 80% of it's nameplate after 25 years while the LTO well drops
to half of it's first years average production in it's second year, less than one fifth in it's
fifth year and almost a tenth in it's ninth year.
A crude comparison of vehicle miles traveled using the output of a typical shale well compared
to the output of the alternative suggested that, while the LTO well would fuel travel over a much
larger distance early in it's life, an equal investment in the alternative would provide enough
energy for as much as twice the distance over 25 years.
If you think your answer is going to go too far off topic, we could take it over to the non-oil
thread
"... I would say shale is not viable below $80 per barrel, at a minimum. ..."
"... I completely agree. I think that conventional oil production will get some boost in $50-$80 price range, but not the US LTO oil production. Prices of metals, transportation, almost everything, correlate with the price of oil. So they will move up and that (along with heavy debt load) makes the repetition of "carpet drilling" unlikely and a large part of so called "productivity gains" a mirage. IMHO. ..."
"... Add to this debt load and the status of red hair step child that LTO now got in financial industry and it is plausible that we need $100 per bbl for full revival. ..."
"... I think that oil industry internationally is now sufficiently screwed up for another oil price spike (and possibly a second crash in five-seven years time frame). So all those "linear extrapolation" forecasts in best EIA style does not take into account one crucial variable: the level of financialization of the world economy and as such are mostly wrong. ..."
"... Instability due to strong positive feedback loops provided by financialization is the hall mark of neoliberalism. ..."
Texas C&C is also falling, yet not as strongly as condensate and gas (see below chart).
In my view there is something slowly cooking up for gas. As below chart shows total Texas gas
still above 20 bcf/d in March, the recent
http://www.bentekenergy.com report
for the week to May 14 shows Texas gas at 18.3 bcf/d. This is a steep plunge from last year. If
you take look at below chart you can feel the gravity drawing down the curves.
And given the recent plunge of gas drilling to 88 rigs from a high of 1600 not so long ago,
this can only mean a massive gas shortage in a few months. I took for my part considerable buy
options for natgas.
I will do a full post in a few days, but Dean sent me the following Chart.
He also said:
…find attached the Texas data for March 2016. I also attach the evolution of my correcting
factors over time: given these data, I've started thinking that Texas oil production did not fall
in the first months of 2016, but actually increased (a bit), similarly to what we observed in
2015.
I would say shale is not viable below $80 per barrel, at a minimum.
I completely agree. I think that conventional oil production will get some boost in $50-$80 price range, but not
the US LTO oil production. Prices of metals, transportation, almost everything, correlate with the price of oil. So they
will move up and that (along with heavy debt load) makes the repetition of "carpet drilling" unlikely
and a large part of so called "productivity gains" a mirage. IMHO.
Add to this debt load and the status of red hair step child that LTO now got in financial industry
and it is plausible that we need $100 per bbl for full revival.
I think that oil industry internationally is now sufficiently screwed up for another oil price
spike (and possibly a second crash in five-seven years time frame). So all those "linear extrapolation"
forecasts in best EIA style does not take into account one crucial variable: the level of financialization
of the world economy and as such are mostly wrong.
Instability due to strong positive feedback loops provided by financialization is the hall
mark of neoliberalism.
"... I think posting these historical numbers from the 10K since CLR went public tell a story. I am not good at guessing what will happen in terms of production at $50 WTI, $60 WTI, etc. I have made general views here pretty clear, and I do not think I need to repeat them. ..."
"... I will note, however, that CLR has about 6 times long term debt per BOEPD as of 12/31/2015 than it had as of 12/31/2007. I think this is a relevant metric. ..."
"... Assuming investors and banks look at figures like these, it should take a very high price for LTO to "ramp back up". It did not do so well, IMO, despite very high prices from 2007-2014. ..."
"... The price of oil will always be a major factor with regard to CAPEX levels, but there is a lag, as companies react to oil prices. ..."
There were some comments above about what price is needed to ramp up shale production, and whether
price is a big factor. Thought I would post down here to widen things out.
I always pick on Continental Resources, primarily because they are big enough to draw some
conclusions about LTO, but also because their financials are straightforward, they pretty much
strictly operate LTO, and they have not raised funds through equity issuances. In other words,
10K's are straightforward.
CLR went public 5/14/2007. They had been in business as a private company since 1967.
As of 12/31/2007, per the 10K, CLR produced 30,369 BOEPD, 82% oil, spent $526 million in CAPEX
for the year, and had long term debt of $165 million at year end. For 2007 their realized prices
were $63.55 for oil, $5.87 for gas, for BOE of $58.32
12/31/2008.
Production 36,018 BOEPD, 76% oil.
CAPEX $989 million
Long term debt $376 million
Oil price $88.87
Gas price $6.90
BOE $77.66
12/31/2009
Production 37,323 BOEPD 74% oil
CAPEX $444 million (refutes the idea that oil price does not matter – see 2008)
Long term debt $524 million
Oil price $54.44
Gas price $3.22
BOE $45.10
12/31/2010
BOEPD 43,318 75% oil
CAPEX $1,237 million
Long term debt $926 million
Oil price $70.69
Gas $4.49
BOE $59.70
12/31/2011
BOEPD 61,866 73% oil
CAPEX $2.224 billion
Long term debt $1.254 billion
Oil price $88.51
Gas price $5.24
BOE $73.05
12/31/2012
BOEPD 97,585 70% oil
CAPEX $4.358 billion
Long term debt $3.540 billion
Oil Price $84.59
Gas price $4.20
BOE $66.83
12/31/2013
BOEPD 135,918 71% oil
CAPEX $3.842 billion
Long Term Debt: $4.651 billion
Oil price $89.93
Gas price $4.87
BOE $72.04
12/31/2014
BOEPD 174,189 70% oil
CAPEX $5.016 billion
Long Term Debt $5.929 billion
Oil price $81.26
Gas price $5.40
BOE $66.53
12/31/2015
BOEPD 221,715 66% oil (note for 2016 guiding 60% oil)
CAPEX $2.564 billion
Long Term Debt $7.118 billion
Oil Price $40.50
Gas Price $2.31
BOE $31.48
They are guiding about 15,000 BOEPD less production in 2016, are going to be spending close
to $1 billion in CAPEX in 2016. They are going to be producing more gas as almost all completions
will be in OK, which are primarily gas plays.
I think posting these historical numbers from the 10K since CLR went public tell a story.
I am not good at guessing what will happen in terms of production at $50 WTI, $60 WTI, etc. I
have made general views here pretty clear, and I do not think I need to repeat them.
I will note, however, that CLR has about 6 times long term debt per BOEPD as of 12/31/2015
than it had as of 12/31/2007. I think this is a relevant metric.
Assuming investors and banks look at figures like these, it should take a very high price
for LTO to "ramp back up". It did not do so well, IMO, despite very high prices from 2007-2014.
2010
Price $59
CAPEX 1,2 m (refutes idea that price matters, see the price and CAPEX in 2008)
And let's look at Long term debt.
Shallow when your debt starts increasing do you cut CAPEX spending or you keep increasing? Obviously
if you look at that long term debt of CLR that did not matter in relation to CAPEX . So how can
you say that price matters when CAPEX increased and Long term debt increased even at higher rate??
and then 2015
Price $31
CAPEX 2.5 bilion (refutes idea that price matters see 2008 price and CAPEX)
Here I am talking only about shale not the rest of conventional.
Ves. My point is in response to the price collapse at the end of 2008, CAPEX in 2009 was cut substantially
from 2008 levels.
The same happened if we compare 2014 CAPEX to 2015 CAPEX, and will happen again 2015 compared
to 2016.
The 2008 collapse was very severe, I remember it very well. The price dropped over $100 in
around 5 months. But the price recovered fairly well.
The price of oil will always be a major factor with regard to CAPEX levels, but there is
a lag, as companies react to oil prices.
As for shale, it is very dependent on credit. If credit does not come back as prices
rise, and just develops out of cash flow, I think the actual data from CLR is evidence that a
very high price will be needed for it to begin to grow again.
"... "Saudi Arabia's crude oil stockpiles fell in March for the fifth month in a row reaching the lowest level in 18 months as the kingdom kept shipping crude to meet customer demand while keeping a lid on production." ..."
"... Sinking rig counts worldwide doesn't correspond to these fantastic planned production increases – if it was that easy to crank up production, why has everyone hasn't done it before? ..."
"... And opening the chokes, damaging the oilfield only works short term before new infills / CO2 or other expensive stuff is necessary. ..."
What does this say about Saudi spare capacity, the Doha meeting and future supply (if anything):
"Saudi Arabia's crude oil stockpiles fell in March for the fifth month in a row reaching the
lowest level in 18 months as the kingdom kept shipping crude to meet customer demand while keeping
a lid on production."
Sinking rig counts worldwide doesn't correspond to these fantastic planned production increases
– if it was that easy to crank up production, why has everyone hasn't done it before?
And opening the chokes, damaging the oilfield only works short term before new infills / CO2
or other expensive stuff is necessary.
To me this means that Saudi Arabia has peaked. And crown prince Mohammed bin Salman's plan
to ween Saudi Arabia off oil is simply additional proof of this being the case.
"... Financial crises are always ultimately credit crises. Even when the proximate cause seems to be a stock market crash, the amount of damage done depends on how much leveraged speculation took place and how that affects critical lending and payment systems. Even though Japan's payment system was never at risk in the implosion of its colossal credit bubble, its banks and economy have been in a zombie state for a full quarter century. Japan's massive bubble took place through a mere 11 massive "city banks" and another three "long term credit banks". By contrast, China has a large shadow banking system. Just like our officialdom in 2007 and 2008, it's very unlikely that they have a good grasp of the extent and the interconnectedness of the risks. They may find out very soon. ..."
"... Remember the shoddy construction in schools – earthquake collapse. Then there is the bubble in unoccupied "ghost cities" that go on forever. ..."
"... Why did Xi burst the bubble. I had suspected the smog and pollution have done more damage in death and disability than admitted. I wonder if the population is even in decline not just the labor force. ..."
"... If China is suddenly officially ready to countenance a huge rise in unemployment, one presumes they have some plan to socialize the pain, to take care of the population. ..."
"... If this is true, what's in store may be something like IIRC Lambert proposed in comments the other day: nationalize the financial institution, file the Chinese equivalent of RICO charges, impound the wealth and tie the former elite up in jail/litigation for the next decade. ..."
"... "impound the wealth" –including all the wealth offshore? including the wealth Chinese oligarchs have invested in foreign real estate? Are Chinese oligarchs any more likely to go against their own class than Western oligarchs? ..."
"... I missed that Telegraph article – it really is quite alarming. I have to say though that anecdotally, my Chinese friends are no more pessimistic than usual, so I don't think that ordinary Chinese are feeling worried yet – property prices are still going up, which is reassuring to most middle class there, and there is no evidence I've heard of any panic in the various 'informal' or shadow investing markets (lots of Chinese run what amount to unofficial banks, borrowing and investing on behalf of friends). ..."
"... AEP suggests that Xi may not be the firm hand on the tiller that everyone assumes – his overt confidence may well be a front for some very confused ideas. I think there is increasing evidence that this may be the case. For all the sound and fury, there is little real evidence of reform from within. But I think the safe bet is that the CCP has enough of a firm hand that they can prevent an outright crash – much more likely is the sort of crippling slow motion collapse that we saw in Japan a quarter of a century ago. But the longer they insist on shovelling fuel on to the fire, the less likely that happens. As Pettis constantly points out, economists consistently underestimate the speed and severity of crashes. ..."
"... Given the huge amount of foreign investment in china and how much it is likely leveraged, the global financial system will collapse again triggering the collapse of many states. proposals of bailouts would be likely met with violent resistance, even revolution. far right politicians would seize power and, where they haven't been politically neutered, maybe some leftists would, too. were it to happen before november, we could welcome into office president trump in january. ..."
Ambrose Evans-Pritchard has a must-read article on what may be the beginning of the end of the
China-as-economic-wunderkind story. The reason for the hesitancy is that the lengthy article that
appeared in early May on the front page of the house organ of the Politboro may either be an official
declaration or an effort by a powerful minority to press for a meaningful, sustained effort to stop
the growth in debt levels. Particularly since the global financial crisis, China has relied heavily
on increases in private-sector debt to keep growth levels up. Mind you, borrowing to invest is not
necessarily a bad idea if it goes into projects that are sufficiently productive. But as readers
know well, China has had investment at an unprecedented proportion of GDP for years, and most of
it has gone into assets created for speculation (housing that sits vacant and is seen by investors
as an alternative to the stock market) or unproductive increases in industrial capacity. Consider
this extract from a
March article in the South China Morning Post:
At the peak of its cement production in 2014, China turned out more cement in just two years
than the United States had produced in the previous century.
As the first chart shows, the trend finally topped out last year but it still indicates almost
30 times as much cement production in China as in the US, a much larger economy. Is this huge
volume of cement really needed? Is this sustainable?
There is certainly an argument for more cement production in China than in the US, which has
largely built its cities and its transport infrastructure. China is still in the process of doing
so. Its cement requirements are thus proportionately much greater.
True, but 30 times as great with as much cement production in two years as the US recorded
in 100 years? That's pushing things.
And while economic growth in China is faster than in the US, much of it represents just this
pouring of cement. Fixed capital formation accounts for 45 per cent of gross domestic product,
about twice the average of the rest of Asia, and higher multiples yet than the rest of the world.
This sort of excess crashes if demand turns sour. And it could take a lot more with it than just
cement and steel plants
The story is told in many more sectors than just cement. The second chart shows you that China's
steel production is topping out but is still running at five times the rate of all 28 countries
in the European Union combined and almost 10 times steel production in the US.
This steel is still being used but there are reasons to doubt the continued demand. Car production
last year of 12 million units, for instance, was three times the equivalent of domestic production
in the US.
Yes, I know Americans are importing ever more cars as they begin to share the rest of the world's
doubts about their own Chevrolets and Chryslers and, yes, car ownership ratios are still much
higher in the US than in China, but three times as much car production in China as in the US still
has a feeling of unreality. China is not rich enough yet to afford so large a car market.
AEP recaps the well-known-if-you've been-watching signs that China is in the advanced stages of
a monster debt binge. The problem with bubbles, as anyone who has lived through them knows so well,
is they typically run much further than clinical observers imagine possible. So the nay-sayers look
like gloomy Gusses while the momentum traders party until the whole thing goes kaboom. AEP's danger
signals,
from his Telegraph account :
China's debt is approaching $30 trillion. The fresh credit alone created since 2007 is greater
than the outstanding liabilities of the US, Japanese, German, and Indian commercial banking systems
combined…
To put matters in context, leverage rose by roughly 50 percentage points of GDP in Japan before
the Nikkei bubble burst in 1990, or in Korea before the East Asia crisis in 1998, or in the US
before the subprime debacle. This gauge is an almost mechanical indicator of a future credit crisis.
As we all know, China is in a class of its own. Debt has risen by 120 to 140 percentage points.
The scale of excess industrial capacity – and China's power and life and death over commodity
markets – mean that any serious policy pivot by the Communist Party would set off an international
earthquake.
Yet that is what at least an important group of the officialdom is prepared to do. The logic for
a crackdown now is that delaying a day of reckoning will only make the inevitable contraction worse:
China watchers are still struggling to identify the author of an electrifying article in the
People's Daily that declares war on debt and the "fantasy" of perpetual stimulus…
The 11,000 character text – citing an "authoritative person" – was given star-billing on the
front page. It described leverage as the "original sin" from which all other risks emanate, with
debt "growing like a tree in the air".
It warned of a "systemic financial crisis" and demanded a halt to the "old methods" of reflexive
stimulus every time growth falters. "It is neither possible nor necessary to force economic growing
by levering up," it said.
It called for root-and-branch reform of the SOE's – the redoubts of vested interests and the
patronage machines of party bosses – with an assault on "zombie companies". Local governments
were ordered to abandon their illusions and accept the inevitable slide in tax revenues, and the
equally inevitable rise in unemployment.
If China does not bite the bullet now, the costs will be "much higher" in the future. "China's
economic performance will not be U-shaped and definitely not V-shaped. It will be L-shaped," said
the text. We have been warned.
The article also describes how China put its foot on the accelerator in recent quarters, so if
this article represents a policy change, it would be a real gear shift:
The latest stop-go credit cycle began in mid-2015 and has since accelerated to an epic blow-off,
with the M1 money supply now growing at 22.9pc, by the fastest pace since the post-Lehman blitz.
Wei Yao from Societe Generale estimates that total loans rose by $1.15 trillion in the first
quarter, equivalent to 46pc of quarterly GDP. "This looks like an old-styled credit-backed investment-driven
recovery, which bears an uncanny resemblance to the beginning of the 'four trillion stimulus'
package in 2009. The consequence of that stimulus was inflation, asset bubbles and excess capacity,"
she said.
House sales rose 60pc in April, despite curbs to cool the bubble. New starts were up 26pc.
Prices jumped 63pc in Shenzhen, 34pc in Shanghai, 20pc in Beijing, and 18pc in Hefei. Panic buying
is spreading to the smaller Tier 3 and 4 cities with the greatest glut.
There is still some fiscal spending in the pipeline, so the robust times will continue at least
through the summer. But liquidity is already starting to dry up despite all the money creation as
investors are getting more and more evidence that the government will not rescue wealth management
products (which are often invested in real estate projects sponsored by local government entities)
or the bond issues of state owned enterprises (SOEs).
Again from AEP's report :
Moody's warned this month that China's state-owned entities (SOEs) have alone racked up debts
of 115pc of GDP, and a fifth may require restructuring. The defaults are already spreading up
the ladder from local SOE's to the bigger state behemoths, once thought – wrongly – to have a
sovereign guarantee…
The rot in the country's $7.7 trillion bond markets is metastasizing. Bo Zhuang from Trusted
Sources said more than 100 firms cancelled or delayed bond issues in April due to widening credit
spreads…
Ten companies have defaulted this year, with the shipbuilder Evergreen, Nanjing Yurun Foods,
and the solar group Yingli Green Energy all in trouble this month. But what has really spooked
markets is the suspension of nine bonds issued by the AA+ rated China Railways Materials, the
first of the big central SOE's to signal default. "This has greatly weakened investors' long-standing
expectation of implicit government support," he said.
Bo Zhuang said investors have poured money into bonds in the latest frenzy. The stock of corporate
bonds has jumped by 78pc to $2.3 trillion over the last year. It is the epicentre of leverage
through short-term 'repo' transactions, and it is now coming unstuck.
Financial crises are always ultimately credit crises. Even when the proximate cause seems
to be a stock market crash, the amount of damage done depends on how much leveraged speculation took
place and how that affects critical lending and payment systems. Even though Japan's payment system
was never at risk in the implosion of its colossal credit bubble, its banks and economy have been
in a zombie state for a full quarter century. Japan's massive bubble took place through a mere 11
massive "city banks" and another three "long term credit banks". By contrast, China has a large shadow
banking system. Just like our officialdom in 2007 and 2008, it's very unlikely that they have a good
grasp of the extent and the interconnectedness of the risks. They may find out very soon.
There is no evidence that cement is being stockpiled to my knowledge – its all being poured.
The problem is that the construction projects just don't have a productive return any more.
However, there is a serious point to be made about concrete in China – it is generally low
quality. This is ok for regular engineering, but for specialist needs, such as High Speed Rail,
it seriously reduces the life span of the structure. I can't find a link to it now, but a few
years ago an engineering journal was estimating that Chinas
High Speed
Rail network would have to reduce its speed limits by several mpg per year as the structures
were degrading very rapidly. It estimated that in 20 years the HSR network would be no faster
than a conventional railway network.
Our imports from China fell big last month and the department stores that sell the junk are
gone down even faster so if we lost half or 200 billion of their junk I an not sure it would be
missed or replaced. I do think that this China implosion is important. I have some questions.
China has a pork shortage and owns Smithfield but is not importing. Why?
Why did Xi burst the bubble. I had suspected the smog and pollution have done more damage
in death and disability than admitted. I wonder if the population is even in decline not just
the labor force.
Please keep covering whatever it is that is going on in China.
If China is suddenly officially ready to countenance a huge rise in unemployment, one presumes
they have some plan to socialize the pain, to take care of the population.
If this is true, what's in store may be something like IIRC Lambert proposed in comments
the other day: nationalize the financial institution, file the Chinese equivalent of RICO charges,
impound the wealth and tie the former elite up in jail/litigation for the next decade.
"impound the wealth" –including all the wealth offshore? including the wealth Chinese oligarchs
have invested in foreign real estate? Are Chinese oligarchs any more likely to go against their
own class than Western oligarchs?
I missed that Telegraph article – it really is quite alarming. I have to say though that
anecdotally, my Chinese friends are no more pessimistic than usual, so I don't think that ordinary
Chinese are feeling worried yet – property prices are still going up, which is reassuring to most
middle class there, and there is no evidence I've heard of any panic in the various 'informal'
or shadow investing markets (lots of Chinese run what amount to unofficial banks, borrowing and
investing on behalf of friends).
As one Chinese friend put it to me 'everyone in my town owes more money than they have to everyone
else'. I've always suspected its the informal/shadow system that would show stress before the
formal system. The only thing I do know is that a friend of mine who runs a business helping Chinese
people move to Europe using 'investment' visas has found more and more people of very modest means
attempting to do it – its not just the rich who are buying properties.
The usually reliable
Michael Pettis also seems his usual gently bullish, but steady self, I'd expect him to write
something if there was something nasty growing.
AEP suggests that Xi may not be the firm hand on the tiller that everyone assumes – his
overt confidence may well be a front for some very confused ideas. I think there is increasing
evidence that this may be the case. For all the sound and fury, there is little real evidence
of reform from within. But I think the safe bet is that the CCP has enough of a firm hand that
they can prevent an outright crash – much more likely is the sort of crippling slow motion collapse
that we saw in Japan a quarter of a century ago. But the longer they insist on shovelling fuel
on to the fire, the less likely that happens. As Pettis constantly points out, economists consistently
underestimate the speed and severity of crashes.
let's try to imagine the global impact of a Chinese implosion.
as china is the main source of global export demand, if they hit a brick wall it would devastate
all but the most diversified or isolated economies. from Australia to Zaire, the impact would
be devastating to employment.
Given the huge amount of foreign investment in china and how much it is likely leveraged,
the global financial system will collapse again triggering the collapse of many states. proposals
of bailouts would be likely met with violent resistance, even revolution. far right politicians
would seize power and, where they haven't been politically neutered, maybe some leftists would,
too. were it to happen before november, we could welcome into office president trump in january.
domestically, Chinese job losses would be enormous causing mass discontent and protests. indeed,
the only thing to do with legions of disgruntled, unemployed, unmarried men would be to draft
them into the army. but so much fodder requires cannons, and so, the likelihood of war would be
very high.
The problem is that Iraq government has no money to pay oil companies. So they are running on
fumes.
Notable quotes:
"... I think the title of the article is misleading. A sharp decrease in investments does not mean a peak in Iraqi oil output. It will result in a slower growth in production. Iraqi government's goal of 6 mb/d by 2020 is obviously unrealistic. But Iraq still can increase output from the current 4.3 mb/d to more than 5 mb/d in 2020. ..."
Crude output in Iraq, OPEC's second-largest producer, has probably peaked and is likely
to fall short of the country's target over the next two years, according to an official with Lukoil
PJSC, operator of one of the country's biggest fields.
I think the title of the article is misleading. A sharp decrease in investments does not mean
a peak in Iraqi oil output. It will result in a slower growth in production. Iraqi government's
goal of 6 mb/d by 2020 is obviously unrealistic. But Iraq still can increase output from the current
4.3 mb/d to more than 5 mb/d in 2020.
"... So at $35/b at the wellhead you get $31.85/b after taxes, then if we deduct OPEX we get $23.85/b, so net revenue would be 1.67 million the first year. Also remember the future revenue should be discounted at 10% per year. With no discount shallow sands wants the net revenue to pay for the well after 5 years. In this case the net revenue is $3.737 million after 5 years and the well is a failure (it loses money). Even after 14 years net revenue is only $5.25 million. I have ignored interest in this example and have assumed the well has been paid for out of cash flow. If the well head price were between 50 and 51 per barrel the well would be paid for after 5 years. ..."
"... I quickly checked the same analysis for the recent Bakken well profile, which has a higher 60 month EUR (266 kb vs 196 kb for the 2013 well). The well is paid for in 60 months at a wellhead price of $40/b using the same assumptions I used in the previous example. ..."
"... Of course, as you mention, none of the companies are able to pay for wells right now out of cash flow. All have interest expense, many have interest expense in excess of $5 per barrel. ..."
"... Also, another expense I have noticed with more frequency are gathering expenses. Many of the LTO companies sold their gathering and/or produced water disposal infrastructure in order to raise cash. They now are required to pay $X per barrel or mcf of gas in order to get their products to market. ..."
"... I would also note, 20% is a "base case" for Bakken royalties. The actual figures can range from 12.5% (1/8) to over 25% (1/4). If one is looking at the EFS or Permian, I suggest using a "base case" royalty of 25% (1/4). However, taxes in TX are less than ND. ..."
"... "We are slowly technologizing ourselves into extinction. Technology is seductive. Is it the power? Is it the comfort? Or is it some internal particularly human attribute that drives it? Technology surrounds us and becomes part of our story and myths. Technology tantalizes the human mind to make, combine, invent. There are always unintended consequences with technology. It affects how we experience the world in time and space. It affects how we feel about the world. If all the externalities were included in the prices and cost to nature, we would be very, very wary of technology. ..."
"... We will do more of the same, business as usual until there are no more holes in the ground to dig, no more water above and below to contaminate, no humans to wage slave, no other lifeforms to eliminate. Yes, we are building Trojan horses in our hearts, minds and spirits. It will be elitist and entitlement and hubris – it will end with both a bang and a whimper." ~ John Weber ..."
The wells never stop declining so for your final three years each year
should be 93% of the previous year, this doesn't really happen for about
10 to 15 years. Below are annual decline rates for an average new Bakken
well in 2013. The first year's average output is 2.9 kb/d and the decline
rates are year 1 to 2, 2 to 3, …, 9 to 10.
Output in barrels per year
87696
42170
28453
20911
16643
13811
11796
10289
9120
8187
7425
6792
6252
5763
Hope that helps. The decline rate eventually levels out at about 7% per
year by year 15 and remains at that rate until the well is shut in about
12 years later (with the well producing about 6 b/d).
Thanks Dennis, I worked those decline rates into my spreadsheet but the
essential message is the same, relative to PV shale oil will generate more
than 15 times the gross revenue in year 1 and still be generating more than
twice the gross revenue in year 7! Your figure of 2.9 kb/d for the average
first year production seems way out of line with the numbers that shallow
sand used in the analysis I referred to or anything that can be interpreted
from Enno's graph below. I was really hoping that shallow or Ciaran would
have commented on my estimate but, I guess my work is way too amateurish
for them! :-)
Edit: Dennis, after I posted this, I noticed your additional responses
below. I will try to add these additional factors into my spreadsheet as
I am interested in how these enterprises gobble up millions of dollars!
I also noticed where you mention 266 kb as EUR and wonder how a well
that produces 2.9 kb/d can end up with an EUR of 266 kb after 60 months?
My mistake 2.9 is a factor of 12 too high, I multiplied by 12 where I
shouldn't have, but the numbers for barrels per year are correct. It should
have been 240 barrels per day for the average first year output.
Also if you look at the numbers for output per year that I posted (which
can be copied and pasted into a spreadsheet) it is clear that 87,696/365
is not equal to 2900 b/d, it is 240.2 b/d. Sorry for the mistake.
The royalties are 20% of output, taxes are another 9% or so. So if you
had 100,000 barrels of output, you keep 80,000 barrels and then figure you
only get net revenue of 91% of the wellhead price and then you have to subtract
opex, G+A, etc.
So at $35/b at the wellhead you get $31.85/b after taxes, then if
we deduct OPEX we get $23.85/b, so net revenue would be 1.67 million the
first year. Also remember the future revenue should be discounted at 10%
per year. With no discount shallow sands wants the net revenue to pay for
the well after 5 years. In this case the net revenue is $3.737 million after
5 years and the well is a failure (it loses money). Even after 14 years
net revenue is only $5.25 million. I have ignored interest in this example
and have assumed the well has been paid for out of cash flow. If the well
head price were between 50 and 51 per barrel the well would be paid for
after 5 years.
Shallow sand can correct my mistakes. Note that I have used my numbers
for yearly well output, based on data from Enno Peters. The well used is
the average 2013 Bakken well.
I quickly checked the same analysis for the recent Bakken well profile,
which has a higher 60 month EUR (266 kb vs 196 kb for the 2013 well). The
well is paid for in 60 months at a wellhead price of $40/b using the same
assumptions I used in the previous example.
Of course, as you mention, none of the companies are able to pay
for wells right now out of cash flow. All have interest expense, many
have interest expense in excess of $5 per barrel. Then, the question
is when will any of these companies begin to use cash flow to reduce debt
principal. Some have reduced debt, by buying back their own debt at distressed
levels, and/or exchanging the debt with creditors for reduced principal
new debt, but at much higher interest rates and more stringent terms (liens
upon company assets as opposed to unsecured bonds).
Also, another expense I have noticed with more frequency are gathering
expenses. Many of the LTO companies sold their gathering and/or produced
water disposal infrastructure in order to raise cash. They now are required
to pay $X per barrel or mcf of gas in order to get their products to market.
I would also note, 20% is a "base case" for Bakken royalties. The
actual figures can range from 12.5% (1/8) to over 25% (1/4). If one is looking
at the EFS or Permian, I suggest using a "base case" royalty of 25% (1/4).
However, taxes in TX are less than ND.
I was trying to keep it simple. For someone like you who probably does
not borrow, there would be very little interest expense. This may also be
true for XTO and Statoil. So basically someone who uses a 60 month payout
rule, probably is not in debt so interest payments are not a factor. I also
was trying to get it done in 5 minutes so skipped some steps.
I get 137 million miles of driving, if we ignore the energy used for
refining and distribution of the oil produced for the 2013 average Bakken
well, for the more recent wells it is 185 million miles over 7 years. For
the late 2015 to early 2016 Bakken average well we get 248 million miles
of driving over a 25 year well life (ignoring refining and distribution
energy). So over the long term we get more driving miles out of the PV.
Note that the average Bakken well really costs more like 8 million rather
than 5.9 million so the apples to apples comparison over 25 years would
be 378 million miles from PV and 248 million miles from the LTO well. So
50% more miles of driving per dollar spent on energy to fuel the ICEV or
EV.
2.8 acres of PV produces 1 GWh annually of output (fixed array). PV farm
cost is about $500,000 per acre. Typical well cost is $15 million (initial
plus continuous costs) and lasts for about 15 years, with low output the
last 10.
So $15 million of PV would be thirty acres at 10.7 GWh output. By year 15
the output might be at 90% so average is 95% over 15 years giving 152 GWh
total ouput for 15 years. Since the PV is local I won't use transmission
losses. At 0.3 kWh per mile that is 506 million miles. The PV farm will
produce almost double that over it's full lifetime. No pollution produced,
no pipelines, no refineries, no spills, no smog, no noise, no global warming,
etc. No Red Queen effect. No depletion problem. PV panels are getting better
and cheaper, oil is not.
URR of well being about 300,000 barrels would give 265 million miles
at 30 mpg (70 percent fuel recovery). When one starts to take into account
the energy losses in drilling, transport, refining, more transport, etc.
That would drop significantly.
No brainer for transportation.
Consider also that hydropower uses over 25 times the area to produce
the same amount of power and also messes up the environment. PV looks a
lot better all around.
Photovoltaic panels have a significant opex. This is associated with parts
replacement, as well as panel washing (they are worse than cars left in
the open). When you compare apples to lemons make sure you include everything.
Yair . . .
This "panel washing" may be a factor on commercial installations but I occasionally
see it mentioned in relation to domestic as a difficult problem on hard
to access roofs . . . well we have been running panels for over twenty five
years and they get washed when it rains.
"We are slowly technologizing ourselves into extinction. Technology
is seductive. Is it the power? Is it the comfort? Or is it some internal
particularly human attribute that drives it? Technology surrounds us
and becomes part of our story and myths. Technology tantalizes the human
mind to make, combine, invent. There are always unintended consequences
with technology. It affects how we experience the world in time and
space. It affects how we feel about the world. If all the externalities
were included in the prices and cost to nature, we would be very, very
wary of technology.
I think we have moved from technology in the service of religion
(pyramids and gothic cathedrals) to religion and culture in the service
of technology. It isn't a deity that will save humanity but in the eyes
of many – it will be technology.
We will do more of the same, business as usual until there are
no more holes in the ground to dig, no more water above and below to
contaminate, no humans to wage slave, no other lifeforms to eliminate.
Yes, we are building Trojan horses in our hearts, minds and spirits.
It will be elitist and entitlement and hubris – it will end with both
a bang and a whimper." ~
John Weber
"... Renewables sector has $4.4 billion bond maturities by year-end ..."
"... Upstream companies are 'still suffering from excess supply' ..."
"... China's clean-energy firms face record bond maturities this year, just as investor confidence was shaken by the default of a company that had been the world's top solar-panel manufacturer. ..."
"... U.S. solar energy company SunEdison Inc, whose aggressive acquisition strategy has saddled it with almost $12 billion of debt, is at "substantial risk" of bankruptcy, one of its two publicly listed units warned on Tuesday. ..."
"... A bankruptcy would rank among the largest involving a non-financial company in the past 10 years, according to bankruptcydata.com. SunEdison declined to comment. SunEdison's shares – already reeling from a Wall Street Journal report on Monday that the company was being investigated for overstating its cash position – fell as much as 60 percent to a record low of 50 cents. ..."
"... I'm not questioning the fact that the solar industry will survive. My point is that current prices of solar panels may not properly reflect the true cost of production. ..."
"... Tesla Motors announced on Wednesday an underwritten registered public offering of about $2 billion shares of its common stock to accelerate the ramp of the Model 3. ..."
"... The electric automaker is offering about $1.4 billion in shares. CEO Elon Musk will sell the remaining shares to "cover tax obligations associated with his concurrent exercise of more than 5.5 million stock options." ..."
Those who are excited about rapid growth in EV sales ignore the dire financial situation of EV
producers, such as Tesla Motors.
Same can be said about producers of solar panels. Rapid volume growth and declining product
prices in this sector resulted in sharply deteriorating financial situation of the companies producing
solar panels.
The real price of aggressive growth, be it in shale oil and gas production, electric vehicles,
or solar panels, is negative cashflows, rapidly rising debt and, finally, a wave of bankruptcies.
When your compare competitive advantages of new technologies for the consumers, you should also
pay attention to the economics of the producers.
---------–
China Green Energy Firms Have Record Debt Due as Yingli Defaults
Renewables sector has $4.4 billion bond maturities by year-end
Upstream companies are 'still suffering from excess supply'
China's clean-energy firms face record bond maturities this year, just as investor confidence
was shaken by the default of a company that had been the world's top solar-panel manufacturer.
Renewable companies must repay 28.8 billion yuan ($4.4 billion) of bonds over the rest of the
year, more than any other previous annual repayments, according to Bloomberg-compiled data. A
venture of Yingli Green Energy Holding Co., the top producer of panels until 2014, missed payments
on 1.76 billion yuan of its notes. That brings the number of companies that defaulted on bonds
to four, involving $1.8 billion, data compiled by Bloomberg show.
Overcapacity still plagues the industry after years of aggressive expansion that left the sector
with 105 billion yuan of outstanding bonds. While President Xi Jinping has vowed to reduce pollution
that's a byproduct of a 30-year economic boom, the number of solar and wind-power generating plants
in the nation lagged behind production of equipment.
"Companies in the upstream sector are still suffering from excess supply," said Li Ning, general
manager of the fixed income department at Western Securities Co. in Beijing. "Downstream companies,
such as electricity providers, in the renewable energy industry have better credit profiles because
of government support."
Yingli's venture Baoding Tianwei Yingli New Energy Resources Co. failed to make payments on Thursday
for two separate five-year bonds, according to statements posted on the website of ChinaBond.
One of the two notes was originally in default in October and holders had sought repayment by
May 12.
Solar-cell maker Shanghai Chaori Solar Energy Science & Technology Co., was the first company
to default on onshore notes March, 2014. Suntech Power Holdings Co. and LDK Solar Co. missed obligations
on offshore bonds.
There are signs investors are getting wary. Clean energy companies only managed to sell 7.9 billion
yuan of bonds this year, 14 percent less than the same period last year.
======================================
SunEdison at risk of bankruptcy, unit says; shares plummet 60 percent
U.S. solar energy company SunEdison Inc, whose aggressive acquisition strategy has saddled
it with almost $12 billion of debt, is at "substantial risk" of bankruptcy, one of its two publicly
listed units warned on Tuesday.
A bankruptcy would rank among the largest involving a non-financial company in the past 10 years,
according to bankruptcydata.com. SunEdison declined to comment.
SunEdison's shares – already reeling from a Wall Street Journal report on Monday that the company
was being investigated for overstating its cash position – fell as much as 60 percent to a record
low of 50 cents.
Bankruptcies have historically been extremely common in all really fast growing industries.
There are always survivors that go on to become household names and stock market big boys.
At one time at least four hundred companies were building automobiles here in the USA. Eventually
we got down to about three or four survivors big enough to matter,plus companies specializing
in commercial trucks. Now we are back up to at least eight or ten, counting foreign makes that
have set up production here in the USA, plus a number of smaller companies that may or may not
survive.
Tesla will probably survive and thrive imo, but if not, the company will be bought up by a
bigger company, and the early investors who held on will make out like bandits- barring an economic
crash.
I'm not questioning the fact that the solar industry will survive.
My point is that current prices of solar panels may not properly reflect the true cost of production.
True enough about current prices possibly not covering current production costs. On the other
hand, as the technology advances, more efficient panels at higher prices may still result in falling
turn key system prices.
I am betting myself that the price of a COMPLETE system, including racking, converters, etc
will continue to fall for at least four or five more years, which is about how long it will take
me to do all the OTHER things I can do to cut back on my own fossil fuel dependency. If I had
plenty of money, I would put in pv and get an electric car NOW, but there are other things I can
still do that will yield a bigger bang for my dollar for the time being.
I am not hard up, but otoh, I don't have a lot of cash laying around getting mold on it either.
Field-install labor is the big item now. I expect to see pre-wired structural arrays, with panels,
connecting structural channels, cabling, micro inverters, everything factory-installed, in 1 kW
modules. You just drop 4 modules onto the roof, bolt down to the structure, plug assemblies together
with pre-wired cabling connectors, and run the main circuit to the electrical panel. 4 kW installed,
connected, and operational in 3-4 hours by a two-man crew and a trailer-towed lightweight mobile
crane to set the assemblies. If they can get the labor down to about $0.35/watt and materials/overhead/profit
at $1/watt, the numbers start to look real good.
This one is for u Alex.
A continuation on our last Tesla/Musk discussion.
-– Tesla Motors announced on Wednesday an underwritten registered public offering of about $2 billion
shares of its common stock to accelerate the ramp of the Model 3.
The electric automaker is offering about $1.4 billion in shares. CEO Elon Musk will sell the
remaining shares to "cover tax obligations associated with his concurrent exercise of more than
5.5 million stock options."
Shares of Tesla were down more than 2 percent in after-hours trading.
In a Wednesday note to clients, Goldman Sachs estimated that Tesla only needed to raise $1
billion to fund accelerated Model 3 production. The firm also said it sees a 22 percent upside
to its six-month price target of $250.
Current production will have to continue to fall at current rates all though 2016 to reach current
projection and end near 8.2 mbd.
Notable quotes:
"... Basically, the EIA is projecting much higher LTO production from mid-2020s, with continuing rising trend, instead of the peak in 2020 in AEO-2015. ..."
"... [According to EIA forecast] The cumulative tight oil output for the reference case from 2015 to 2040 is 57 Gb. I think that is too optimistic by a factor of 2 at least. My guess, based on the USGS 2013 study of the Bakken/Three Forks and work by David Hughes on other LTO plays in Drilling Deeper is about 30 Gb for US LTO output (2005 to 2050) if prices go to over $100/b and remain close to the AEO reference oil price scenario for 2020 to 2040. Those prices might not even be high enough (in other words 30 Gb is an optimistic estimate, or pessimistic if one believes very high oil prices will be needed for a transition to alternatives). ..."
"... It ain't just what US C+C production will be down the road. See my post further up. Hint, some observers think they are way out of left field on renewables as well. ..."
Sorry for posting this down here instead of replying to one or the other AEO 2016 comments but
I wanted to get it wide enough.
Just looking at the difference in C+C predictions for each year leaves one to believe that
the EIA has not a clue as to what US C+C production will be down the road.
Basically, the EIA is projecting much higher LTO production from mid-2020s, with continuing
rising trend, instead of the peak in 2020 in AEO-2015.
Projected conventional production is lower than in AEO-2015
LTO was a "black swan" in 2010-14, and it remains one of the biggest uncertainties for future
global oil production
-------–
In the early release, the EIA does not explain its assumptions for the LTO output.
All they say is:
"Lower prices through 2017 has the greatest impact on tight oil production, which drops to 4.2 million b/d in 2017 before
increasing to 7.1 million b/d in 2040. The general increase in tight oil production is largely attributed to the higher oil prices
and the ongoing exploration and development programs that expand operator knowledge about producing reservoirs."
[According to EIA forecast] The cumulative tight oil output for the reference case from 2015 to 2040 is 57 Gb.
I think that is too optimistic by a factor of 2 at least. My guess, based on the USGS 2013 study
of the Bakken/Three Forks and work by David Hughes on other LTO plays in Drilling Deeper is about
30 Gb for US LTO output (2005 to 2050) if prices go to over $100/b and remain close to the AEO
reference oil price scenario for 2020 to 2040. Those prices might not even be high enough (in
other words 30 Gb is an optimistic estimate, or pessimistic if one believes very high oil prices
will be needed for a transition to alternatives).
I think we may reach a peak that is 10% to 20% higher than the March 2015 peak in LTO output
in 2021 and then output will start to decline rapidly by 2025, the maximum decline rate will be
about 12% per year in 2027 and by 2032 decline will become more moderate at about 7%/year (this
is US LTO output only).
In addition to the 57 Gb of cumulative LTO production until 2040 they project 7 mb/d production
on an upward trend at that point implying at least 50 Gb remains to be produced after that. So
it's more like optimistic by a factor of 4 since you and Hughes rightly predict that LTO production
will have declined to a low level by 2040-50.
If we assume the decline has a similar slope of opposite sign, you would be correct, in the
case of LTO I expect a pretty steep decline for 2 or 3 years (maybe a 15% overage decline rate
over that period.)
So maybe a factor of 3 too high, but I agree more than a factor of 2 is definitely correct
(if my 30 Gb estimate is roughly correct.)
Just looking at the difference in C+C predictions for each year leaves one to believe that
the EIA has not a clue as to what US C+C production will be down the road.
It ain't just what US C+C production will be down the road. See my
post
further up. Hint, some observers think they are way out of left field on renewables
as well.
What this means is simple: as a result of the budget imbalance driven by low oil prices,
largely a Saudi doing, the kingdom is forced to give workers an implicit pay cut. It also means
that since the government has to "pay" through the issuance of debt, that the liquidity crisis in
the kingdom is far worse than many had anticipated.
Which brings up the question of devaluation: how long until the SAR has to follow the Yuan and
see a substantial haircut. According to the market, 12 month SAR forward are now trading at a
price which implies a 12% devaluation in the coming months.
When that happens is, of course, up to the King Salman.
What it also means is that as Saudi Arabia is now scrambling to generate any incremental cash, it
too will be caught in the deflationary spiral of excess production as it will have no choice but
to outsell its competitors, especially those rushing to grab Chinese market share such as Russia,
as it seeks to make up with volume what it has lost due to lower prices. It also means that any
hopes of a production freeze by Saudi Arabia - and thus OPEC - are hereby snuffed for the
indefinite future.
"... 0-12 month production is a combination of reservoir and fracture dominated flow. Increases in mean rates are mainly related to advances in completion technology (longer horizontals, > number of stages, reduced spacing between stages, improved proppant technology). ..."
"... After 12 months, liquid production is reservoir dominated. Decline curves converge to +/- 5 bopd. Geology is the main controlling factor. From 2008 to 2015, the following increases have been observed; ..."
"... Completion technology gets you more gas (and oil) in the short term. In the longer term geology plays a far more important role on single well life of field economics than completion technology. ..."
Completion technology gets you more gas (and oil) in the short term. In
the longer term geology plays a far more important role on single well life
of field economics than completion technology.
0-12 month production is a combination of reservoir and fracture
dominated flow. Increases in mean rates are mainly related to advances
in completion technology (longer horizontals, > number of stages, reduced
spacing between stages, improved proppant technology).
After 12 months, liquid production is reservoir dominated. Decline
curves converge to +/- 5 bopd. Geology is the main controlling factor.
From 2008 to 2015, the following increases have been observed;
197% increase in 90 day gas only production
46% increase in 90 day oil and gas production
27% increase in 90 day oil only production
10% increase in 90 day income
Extrapolating the 2008 to 2015 curves to 20 years of production,
the following changes have been estimated;
6% increase in 20 year income
Break Even oil price lowered from $64 to $60
Conclusion: Completion technology gets you more gas (and oil) in
the short term. In the longer term geology plays a far more important role
on single well life of field economics than completion technology.
"... Increasing gor in an oil reservoir is not good. But I thought you were inferring that Texas was in worse shape. My point was you can't make that assumption. My only point ..."
"... I thought maybe the units should be thousands of cubic feet of natural gas per barrel of oil because both Texas and North Dakota are over 1200 cf/bo GOR. ..."
My point is simply that currently North Dakota is at about 1500 cubic
feet natural gas per barrel of oil produced.
Fernando says this is a problem, I think.
Not sure if it is or isn't. Increasing gor in an oil reservoir is not
good. But I thought you were inferring that Texas was in worse shape. My
point was you can't make that assumption. My only point
I thought maybe the units should be thousands of cubic feet of natural
gas per barrel of oil because both Texas and North Dakota are over 1200
cf/bo GOR.
Isis claims responsibility for deadly suicide attack on Baghdad gas plant
Militants have launched a suicide attack on a natural gas plant near the Iraqi capital Baghdad,
killing at least 11 people and injuring a dozen more.
During the assault, which extremist militant group Isis said it had carried out, a car was
blown up at the entrance to the facility approximately 20km north of Baghdad.
Six people then entered the site with explosive vests and fought security officers, the
Reuters news agency reported. Three gas storage tanks were set on fire during the fighting.
Suppose they had hauled a small artillery piece within range, meaning anywhere out to fifteen
or twenty kilometers, and set up those same suicide fighters to defend the gun. My guess is they
could have burned everything that WOULD burn, and shot the rest up pretty good.
Such a gun could be concealed in a load of building material or even inside a tanker truck.
Russian Q1 GDP came in better than expected but still showing contraction at -1.2 percent YoY
(versus -2.1 percent expected). A piece in the
Wall Street Journal today addresses the challenges experienced by Russia currently, as the government
is considering raising taxes to help ease its budget deficit. As the chart below illustrates, Russia's
reserve fund is being swiftly depleted – to levels not seen since the 2009 financial crisis – as
the government tries to plug the gap left by lost revenue from lower oil prices:
"... Russia is diversifying oil and gas exports towards rapidly rising Asian markets due to economic and security considerations. But cutting oil exports to Europe, even for one month, would be inefficient and self-destroying. ..."
"... There are also serious logistical issues. Russia exports oil to Asia from the fields in Eastern Siberia and Far East. The fields in West Siberia, Volga-Urals and Timan-Pechora regions are not linked by pipelines with Russia's eastern borders and transportation costs in this case would be too high. ..."
"... Cutting energy supplies to Europe, even for a month, would destroy Russia's reputation as a reliable supplier and result in multiple lawsuits and potential multi-billion fines. Note that Russian oil companies own significant assets in Europe, including refineries, oil terminals, storage facilities, etc. ..."
"... However, if Russia (even for economic reasons) began diverting supplies to Asia via pipelines, wouldn't that mean there would be less for the West to buy? Due to the laws of mathematics? ..."
"... Try putting together a spreadsheet with sources and sinks. Use transport costs to link these two. When you do you'll see the only difference is to change transport costs and security. I used to work and live in Russia and I'm sure they are using models like we did to understand the best options to move Russian oil. I'm a bit outdated, but what we see is a need to refine oil for internal consumption with a better kit. They need to improve their refineries to grind oil molecules for real. ..."
"... This is a very questionable assumption. Supply/demand dynamics, especially reckless financing of shale in the USA was a factor (as in "crisis of overproduction" - if we remember classic Marxist term ;-), but this is only one and probably not decisive contributing factor. Paper oil, HFT, Saudis oil damping and Western MSM and agencies (Wild cries "Oil Glut !!!", "OMG Oil glut !!!" supported by questionable statistics from EIA, IEA and friends) were equally important factors. It you deny this you deny the reality. ..."
"... I agree, but this not the whole story. Western MSM went to crazy pitch trying to amplify Saudi animosities and to play "young reckless prince" card toward Iran and Russia. Do you remember the interview the prince gave to Bloomberg just before the freeze ? Do you think that this was accidental? ..."
"... definitely $50-$60 price band is not enough to revive the US shale. LTO is dead probably on any level below $80 and may be even above this level. That does not exclude "dead chicken bounce". Moreover LTO is already played card for financial industries. In reality it probably needs prices above $100 to fully recover. ..."
"... neoliberals still dominates in Russia. Especially oil and economics ministries. Reading interviews of Russian oil officials is pretty depressing. They swallow and repeat all the Western propaganda one-to-one. Unfortunately. In this area they have a lot to learn from Americans :-). ..."
"... At the same time, increasing the volume of high additional value products such as plastics, rubber, composites, etc is in best Russia's interest. It is difficult to achieve though. I think creating the ability to withhold substantial amount of oil from the markets for the periods of say 6 to 12 month is more important. And here they can get some help from OPEC members, Saudi be damned. ..."
"... This is a tricky balancing solution, but still this is some insurance against the price slumps like the current one, when Russia was caught swimming naked and did not have any viable game plan. It is unclear what is the optimal mix, but in no way this 100% or even 80% raw oil. ..."
3) Russia's oil policy is driven by economic considerations. Cutting oil exports (and hence foreign
currency revenues) in order to "punish" the West is like shooting yourself in the foot.
Aleks,
I agree that a sustained embargo on the West by Russia is not realistic economically. Cutting
supplies for a month to send a message might be.
Or you could do something else…send your supplies via pipeline to Asia.
There by you get your money and decrease the supplies the West has access to.
I am sorry, but what you and likbez are saying here sounds naïve.
Russia is diversifying oil and gas exports towards rapidly rising Asian markets due to
economic and security considerations. But cutting oil exports to Europe, even for one month, would
be inefficient and self-destroying.
1) European customers could easily find alternative sources of supply. Saudi Arabia and
Iran would be happy to take Russia's share in the European market and it would be very difficult
to take it back.
2) It is impossible to redirect all Russian oil exports to Asia. Nobody there expects sharply
increased volumes of Russian oil. China has increased oil imports from Russia, but is not willing
to depend entirely on Russian supplies. There are also serious logistical issues. Russia exports
oil to Asia from the fields in Eastern Siberia and Far East. The fields in West Siberia, Volga-Urals
and Timan-Pechora regions are not linked by pipelines with Russia's eastern borders and transportation
costs in this case would be too high.
3) Contrary to what the western MSM is saying, Russia has never used energy exports as a political
weapon. The episodes when Russia was cutting gas supplies to Ukraine were related with prolonged
non-payments from that country. As soon as payments were resumed, Russia restarted gas supplies.
Today, when relations between Russia and Ukraine are worse than ever, Russia is supplying gas
to Ukraine as Ukraine is paying for it.
Cutting energy supplies to Europe, even for a month, would destroy Russia's reputation
as a reliable supplier and result in multiple lawsuits and potential multi-billion fines. Note
that Russian oil companies own significant assets in Europe, including refineries, oil terminals,
storage facilities, etc.
In general, Russia and Europe are so interdependent in the energy sector, that any drastic
steps there may have extremely negative consequences for both sides. Not surprisingly, the western
sanctions against Russia did not include a ban on the imports of Russian oil and gas. Russia,
on its side, will never cut its energy supplies to Europe.
"Russia is diversifying oil and gas exports towards rapidly rising Asian markets due to economic
and security considerations. But cutting oil exports to Europe, even for one month, would be
inefficient and self-destroying ".
Hey AlexS,
I think you are correct with the bolded part above.
However, if Russia (even for economic reasons) began diverting supplies to Asia via pipelines,
wouldn't that mean there would be less for the West to buy? Due to the laws of mathematics?
Unless of course Russia's Oil/Gas production is growing to offset the diversion.
Also, please note that my couch potato analysis was meant to be considered under Peak Oil/ELM
conditions. Not BAU as in today. I should have specified.
If there is anyone to trust on this point…It isn't me!!! LOL!
No. Try putting together a spreadsheet with sources and sinks. Use transport costs to link
these two. When you do you'll see the only difference is to change transport costs and security.
I used to work and live in Russia and I'm sure they are using models like we did to understand
the best options to move Russian oil. I'm a bit outdated, but what we see is a need to refine
oil for internal consumption with a better kit. They need to improve their refineries to grind
oil molecules for real.
The current oil price slump is due to supply/demand dynamics, not to western conspiracies
This is a very questionable assumption. Supply/demand dynamics, especially reckless financing
of shale in the USA was a factor (as in "crisis of overproduction" - if we remember classic Marxist
term ;-), but this is only one and probably not decisive contributing factor. Paper oil, HFT,
Saudis oil damping and Western MSM and agencies (Wild cries "Oil Glut !!!", "OMG Oil glut !!!"
supported by questionable statistics from EIA, IEA and friends) were equally important factors.
It you deny this you deny the reality.
Remember the key Roman legal principle "cue bono". And who in this case is the prime suspect?
Can you please answer this question.
And please remember that the originator of the word "conspiracies" was CIA (to discredit those
who questioned the official version of JFK assassination).
2) The Doha deal was torpedoed by Saudi Arabia, primarily due to its conflict with Iran
and the intention to defend market share.
I agree, but this not the whole story. Western MSM went to crazy pitch trying to amplify
Saudi animosities and to play "young reckless prince" card toward Iran and Russia. Do you remember
the interview the prince gave to Bloomberg just before the freeze ? Do you think that this was
accidental?
BTW I agree that this was a huge win of Western diplomacy and "low oil price forever" forces.
An increase in oil prices well above $50 this year is not in Russia's or Saudi interest,
as it could reverse the declining trend in LTO output.
Nonsense. First of all mankind now needs oil above $100 to speed up the switch to hybrid cars
for personal transportation, and Russia and Saudi are the part of mankind.
It is also in best Russia's and Saudi economic interests, contrary to what you read on Bloomberg
or similar rags. World oil production is severely damaged by low oil prices and 1MB/d that shale
it can probably additionally produce in best circumstances is not that easy to achieve after this
slump.
And definitely $50-$60 price band is not enough to revive the US shale. LTO is dead probably
on any level below $80 and may be even above this level. That does not exclude "dead chicken bounce".
Moreover LTO is already played card for financial industries. In reality it probably needs prices
above $100 to fully recover.
For probably the next five-seven years everybody will be too shy in financing shale and other
high risk oil production ventures. So the oil price will probably set a new record. After that
we will have another round of "gold rush" in oil as institutional memory about the current oil
price slump will gradually evaporate. Neoliberalism is an unstable economic system, you can bet
on that.
Russia's oil policy is driven by economic considerations. Cutting oil exports (and hence
foreign currency revenues) in order to "punish" the West is like shooting yourself in the foot.
Nonsense. No nation politics is driven only by economic consideration but Russia stupidly or
not tried to play the role of stable, reliable oil and gas supplier to people who would betray
you for a penny. And sometimes this desire to play nice with the West led to betraying its own
national interests.
If I were Putin I would create strategic reserves and divert part of oil export to them to
sell them later at higher prices. Buy low, sell high: is not this a good strategy :-)
Or play some other card by artificially restricting export of oil to Western Europe to refined
products (and to please the USA, as it so badly wanted Russia to restrict supplies to EU to damage
their long time strategic partner :-) and let the EU face consequences of their own polices.
But this is probably not a possibility as neoliberals still dominates in Russia. Especially
oil and economics ministries. Reading interviews of Russian oil officials is pretty depressing.
They swallow and repeat all the Western propaganda one-to-one. Unfortunately. In this area they
have a lot to learn from Americans :-).
Exports are reliable hard currency stream. But it not a stable stream, as Russia recently discovered.
At the same time, increasing the volume of high additional value products such as plastics,
rubber, composites, etc is in best Russia's interest. It is difficult to achieve though. I think
creating the ability to withhold substantial amount of oil from the markets for the periods of
say 6 to 12 month is more important. And here they can get some help from OPEC members, Saudi
be damned.
Upgrading oil refining capacity means that Russian oil companies are able to increase
the share of refined products in total exports at the expense of crude oil.
This is a tricky balancing solution, but still this is some insurance against the price
slumps like the current one, when Russia was caught swimming naked and did not have any viable
game plan. It is unclear what is the optimal mix, but in no way this 100% or even 80% raw oil.
Goldman Sachs ... pronounced that the oil market is shifting into a deficit 'much earlier
than expected', as a fourth Nigerian crude grade, Qua Iboe, comes offline due to a damaged
pipeline. As demand growth continues to show strength, and outages start to add up, Goldman
Sachs suggests that the market has shifted into a deficit this month:
"... On May 11th the U.S. Energy Information Administration (EIA) reported that U.S. crude oil production declined by 206,000 barrels per day over the six weeks ending May 5 ..."
"... U.S. crude oil inventories unexpectedly fell by 3.41 million barrels during the week ending May 6, 2016 ..."
"... Gasoline inventories declined by 1.231 million barrels ..."
"... Distillate stockpiles fell by 1.647 million barrels ..."
"... When the oil markets are oversupplied, the speculators which control the oil futures markets tend to ignore supply outages that they consider short-term. ..."
"... The oil sands projects shut in by the fires are now coming back on-line, but it will take months before production is fully restored. ..."
"... Oil price cycles do not end well. The big ones, and this is one of the biggest ever, overshoot the mark and result in a supply shortage. With OPEC now producing flat out, there is very little excess production capacity in the world. After the end of 2016, when oil supply and demand are back in balance, all significant supply outages (i.e. Canadian fire, Nigerian militants, ISIS attacks in the Middle East, etc.) will send crude oil prices skyrocketing. The Wall Street analysts that are saying we will never see oil over $100/bbl again will be eating those words. ..."
On May 11th the U.S. Energy Information Administration (EIA) reported that U.S.
crude oil production declined by 206,000 barrels per day over the six weeks ending May 5, 2016. In
the same weekly report:
U.S. crude oil inventories unexpectedly fell by 3.41 million barrels during the week ending
May 6, 2016
Gasoline inventories declined by 1.231 million barrels
Distillate stockpiles fell by 1.647 million barrels
• The International Energy Agency (IEA) say the annual summer spike in demand
for transportation fuels has begun.
When the oil markets are oversupplied, the speculators which control the oil futures markets tend
to ignore supply outages that they consider short-term. For example, the forest fires in Alberta
that shut-in more than a million barrels per day of Canadian heavy oil products in early May did
not seem to have much impact on the price of oil. As supply and demand move back into balance, an
outage of that size will send the NYMEX strip prices sharply higher. The oil sands projects shut
in by the fires are now coming back on-line, but it will take months before production is fully restored.
Nigeria has much bigger problems
On Friday, May 13 an explosion closed a second Chevron facility in Nigeria, Africa's biggest oil
producer. The explosion was the result of an attack by militants who are upset with their government.
70 percent of Nigerians live on less than $1/day. They see the "Top 1 Percenters" living like kings,
while they have trouble finding enough food to eat. Apparently, they have money enough for guns and
explosives.
Exxon Mobil also reported on May 13 that a drilling rig damaged a pipeline, shutting off more
production of crude. Nigeria's oil production was already down 600,000 barrels per day before these
two incidents, primarily the result of militant attacks. Shell is now evacuating workers from its
offshore Bonga oilfield following a militant threat. Shell's Forcados export terminal has been shut
down since a February bombing. To say Nigeria is a mess is an understatement.
Adding to the country's problems is the fact that they are over a year behind in paying invoices
for oilfield services. Schlumberger Ltd. (SLB) has pulled personnel and equipment
out of Nigeria, apparently tired of running up the bad debts.
Venezuela: Another OPEC nation on steep decline
Latin American oil production is now down close to 500,000 bpd from year ago levels.
On May 6, Bloomberg reported that Halliburton (HAL) has joined rival Schlumberger
in curbing activity in Venezuela due to lack of payment during the oil industry's worst financial
crisis.
"During the first quarter of 2016, we made the decision to begin curtailing activity in Venezuela,"
Halliburton, the world's second-largest oil services provider, said May 6th in a filing with the
U.S. Securities and Exchange Commission. "We have experienced delays in collecting payment on our
receivables from our primary customer in Venezuela. These receivables are not disputed, and we have
not historically had material write-offs relating to this customer," the company said.
Halliburton's receivables in Venezuela rose 7.4 percent in the first quarter to $756 million compared
to the end of 2015, representing more than 10 percent of its total receivables, the Houston-based
company said. If you own Halliburton stock, prepare yourself for a big bad debt expense later this
year.
On the demand side of the equation, May is the beginning of an annual spike in demand for hydrocarbon
based liquid fuels. In their monthly Oil Market Report dated May 12, 2016 the International Energy
Agency (IEA) forecasts that demand will increase by 1.66 million barrels per day from the first quarter
of this year to the third quarter.
If history repeats itself, the demand spike will be even larger. In 2010, the final year of the
last major oil price cycle, the IEA began the year forecasting a 1.0 million barrel per day increase
that year. Actual demand growth was 3.3 million barrels per day. The forecast error made in 2010
was that IEA's formula for calculating demand, did not consider the impact of lower fuel prices on
demand. I believe they've made the same mistake this time around.
Key points from the IEA report:
Global oil demand growth for 1Q16 was revised upwards to 1.4 mb/d, led higher by strong gains
in India, China and, more surprisingly, Russia. Russia had a cold winter and they still use a
lot of oil for space heating.
Oil inventory builds are beginning to slow in the OECD; in 1Q16 they grew at their slowest
rate since 4Q14 and in February they drew for the first time in a year.
"Changes to the data in this month's Oil Market Report confirm the direction of travel of
the oil market towards balance. The net result of our changes to demand and supply data is that
we expect to see global oil stocks increase by 1.3 mb/d in 1H16 followed by a dramatic reduction
in 2H16 to 0.2 mb/d."
"We have left unchanged our outlook for global oil demand growth in 2016 at a solid 1.2 mb/d.
However, for 1Q16 revised data shows demand growing faster at 1.4 mb/d, in spite of the northern
hemisphere winter being milder than usual. This strong 1Q16 performance might raise expectations
that demand will remain at this stronger level causing us to raise our average figure for 2016."
As you can see by this statement, IEA is already seeing the error in their forecasting model.
Like most government agencies, they will never come out and say they screwed up.
During the first quarter, oil prices were under pressure from predictions that China's demand
for oil would soften this year. Chinese demand growth has slowed down from the rapid pace of the
prior ten years, but it is still going up. This is thanks in part to sales of SUVs that are still
climbing in China. Apparently the Chinese people are becoming more status driven (like Americans),
owning an SUV in China indicates your family has joined the Upper Middle Class.
Per the IEA report, India is rapidly becoming the leader in global demand growth. Oil demand in
India increased by 400,000 barrels per day year-over-year in the first quarter.
I have worked in the upstream energy sector for 38 years. During my career the industry has survived
six major and a few minor oil price cycles. It will survive this one because the products made from
crude oil, natural gas and natural gas liquids (NGLs) are critical to the world economy. Our high
standard of living depends on a steady supply of oil.
Oil price cycles do not end well. The big ones, and this is one of the biggest ever, overshoot
the mark and result in a supply shortage. With OPEC now producing flat out, there is very little
excess production capacity in the world. After the end of 2016, when oil supply and demand are back
in balance, all significant supply outages (i.e. Canadian fire, Nigerian militants, ISIS attacks
in the Middle East, etc.) will send crude oil prices skyrocketing. The Wall Street analysts that
are saying we will never see oil over $100/bbl again will be eating those words.
Oil prices do not go up or down in a smooth line, as you can see in the chart above. Investors
that can look past the short-term noise and invest in the best companies will harvest market beating
gains as this cycle moves back to the long-term trend.
"... Both candidates said they had planned to hold the press conference next Monday but moved it up after they were contacted by an attorney for a division employee who claimed Mineral Resources Director Lynn Helms ordered the destruction of emails and records related to the transportation and sale of oil. ..."
"... Sorum said a recent audit of the state Department of Trust Lands that identified errors in how oil and gas royalty payments were made underscores the need for an independent audit of the Oil and Gas Division, which oversees about 13,000 active oil and gas wells. ..."
"... He said mineral owners who receive oil and gas royalty payments often receive revised settlement sheets notifying them that a mistake was made, which indicates production numbers aren't being adequately tracked and shows the need for an audit so mineral owners don't get shortchanged. ..."
Two gubernatorial candidates from opposing parties called Thursday for an audit of North Dakota's
Oil and Gas Division, raising concerns that production numbers are not being verified and citing
a tip that employees were ordered to destroy public records – a claim the agency's spokeswoman called
"completely baseless." Republican candidate Paul Sorum of Bismarck and Democratic hopeful Marvin
Nelson, a state representative from Rolla, held a joint press conference in Bismarck to call for
a performance audit of the division within the Department of Mineral Resources.
"This is not a partisan issue, which is why Marvin and I and many other people are on the same
page. We just want the law to be followed," Sorum said.
Both candidates said they had planned to hold the press conference next Monday but moved it up
after they were contacted by an attorney for a division employee who claimed Mineral Resources Director
Lynn Helms ordered the destruction of emails and records related to the transportation and sale of
oil.
Sorum and Nelson said they had no proof that records were destroyed. The attorney asked not to
be named publicly because it would identify the employee, they said, agreeing that the state's whistleblower
laws provide inadequate protection.
"Even without those rumors, there's still significant reasons why we should be do that (audit),
and it should be urgent that we do that," Sorum, an oilfield consultant, said in an interview.
Division spokeswoman Alison Ritter said the allegation of destroying records was untrue. "That's completely baseless," she said. "I think it's just absurd, actually." Ritter added that the office had a staff meeting Wednesday which involved making sure staff were
reading the code of ethics policy, which includes a page related to records and making records available.
Sorum and Nelson said they did not contact Attorney General Wayne Stenehjem, chief enforcer of
the state's open records laws, about the report of records being destroyed. Stenehjem, who is the
Republican Party's endorsed candidate for governor and also serves on the three-member Industrial
Commission that oversees the Oil and Gas Division, "is part of the problem," Sorum said.
Stenehjem was on the campaign trail and could not immediately be reached for comment. Fargo businessman
Doug Burgum also is seeking the GOP nomination in the June 14 primary.
Sorum said a recent audit of the state Department of Trust Lands that identified errors in how
oil and gas royalty payments were made underscores the need for an independent audit of the Oil and
Gas Division, which oversees about 13,000 active oil and gas wells.
A bill co-sponsored by Nelson last year would have required a performance audit of state agencies
that regulate oil and gas development, but House lawmakers rejected it 67-22.
Nelson serves on the Legislative Audit and Fiscal Review Committee, which has the authority to
request performance audits, but he couldn't recall if there had been a formal request for a division
audit.
He said mineral owners who receive oil and gas royalty payments often receive revised settlement
sheets notifying them that a mistake was made, which indicates production numbers aren't being adequately
tracked and shows the need for an audit so mineral owners don't get shortchanged.
"There's really a public responsibility to get it right," he said.
Ritter noted the state auditor's office recently completed a routine audit of the agency for the
2013-15 biennium and there were no formal findings for the Oil and Gas Division and a few formal
fin
Republican candidate Paul Sorum of Bismarck and Democratic hopeful Marvin Nelson, a state representative
from Rolla, held a joint press conference in Bismarck to call for a performance audit of the division
within the Department of Mineral Resources.
"This is not a partisan issue, which is why Marvin and I and many other people are on the same
page. We just want the law to be followed," Sorum said.
Both candidates said they had planned to hold the press conference next Monday but moved it up
after they were contacted by an attorney for a division employee who claimed Mineral Resources Director
Lynn Helms ordered the destruction of emails and records related to the transportation and sale of
oil.
Sorum and Nelson said they had no proof that records were destroyed. The attorney asked not to
be named publicly because it would identify the employee, they said, agreeing that the state's whistleblower
laws provide inadequate protection.
"Even without those rumors, there's still significant reasons why we should be do that (audit),
and it should be urgent that we do that," Sorum, an oilfield consultant, said in an interview.
Division spokeswoman Alison Ritter said the allegation of destroying records was untrue.
"That's completely baseless," she said. "I think it's just absurd, actually."
Ritter added that the office had a staff meeting Wednesday which involved making sure staff were
reading the code of ethics policy, which includes a page related to records and making records available.
Sorum and Nelson said they did not contact Attorney General Wayne Stenehjem, chief enforcer of
the state's open records laws, about the report of records being destroyed. Stenehjem, who is the
Republican Party's endorsed candidate for governor and also serves on the three-member Industrial
Commission that oversees the Oil and Gas Division, "is part of the problem," Sorum said.
Stenehjem was on the campaign trail and could not immediately be reached for comment. Fargo businessman
Doug Burgum also is seeking the GOP nomination in the June 14 primary.
Sorum said a recent audit of the state Department of Trust Lands that identified errors in how
oil and gas royalty payments were made underscores the need for an independent audit of the Oil and
Gas Division, which oversees about 13,000 active oil and gas wells.
A bill co-sponsored by Nelson last year would have required a performance audit of state agencies
that regulate oil and gas development, but House lawmakers rejected it 67-22.
Nelson serves on the Legislative Audit and Fiscal Review Committee, which has the authority to
request performance audits, but he couldn't recall if there had been a formal request for a division
audit.
He said mineral owners who receive oil and gas royalty payments often receive revised settlement
sheets notifying them that a mistake was made, which indicates production numbers aren't being adequately
tracked and shows the need for an audit so mineral owners don't get shortchanged.
"There's really a public responsibility to get it right," he said.
Ritter noted the state auditor's office recently completed a routine audit of the agency for the
2013-15 biennium and there were no formal findings for the Oil and Gas Division and a few formal
fin
Republican candidate Paul Sorum of Bismarck and Democratic hopeful Marvin Nelson, a state representative
from Rolla, held a joint press conference in Bismarck to call for a performance audit of the division
within the Department of Mineral Resources.
"This is not a partisan issue, which is why Marvin and I and many other people are on the same
page. We just want the law to be followed," Sorum said.
Both candidates said they had planned to hold the press conference next Monday but moved it up
after they were contacted by an attorney for a division employee who claimed Mineral Resources Director
Lynn Helms ordered the destruction of emails and records related to the transportation and sale of
oil.
Sorum and Nelson said they had no proof that records were destroyed. The attorney asked not to
be named publicly because it would identify the employee, they said, agreeing that the state's whistleblower
laws provide inadequate protection.
"Even without those rumors, there's still significant reasons why we should be do that (audit),
and it should be urgent that we do that," Sorum, an oilfield consultant, said in an interview.
"... Moody's cut the country's long-term issuer rating one notch to A1 from Aa3 after a review that began in March. ..."
"... Moody's lowered Oman to Baa1 from A3 and Bahrain to Ba2 from Ba1. The ratings agency did not downgrade Kuwait, Qatar, the United Arab Emirates or Abu Dhabi, but it assigned a negative outlook to each. ..."
...Moody's cut the country's long-term issuer rating one notch to A1 from Aa3 after a review
that began in March.
...Moody's Investors Service said Saturday that it also downgraded Gulf oil producers Bahrain
and Oman. It left ratings unchanged for other Gulf states including Kuwait and Qatar.
...Moody's lowered Oman to Baa1 from A3 and Bahrain to Ba2 from Ba1. The ratings agency did
not downgrade Kuwait, Qatar, the United Arab Emirates or Abu Dhabi, but it assigned a negative
outlook to each.
ERoEI of solar panels in around 10. This is that critical zone -- sources of energy with ERoEI
below 10 suggest drastic drop of of the current standard living
That does not doom it, but that suggest fundamental problems in scaling up this source of electrical
energy from single digits.
An interesting term related to CV is "energy cannibalization". See:
Another relevant term is "energy density" -- the term applicable to batteries:
Energy density is the amount of energy stored in a given system or region of space per unit
volume or mass, though the latter is more accurately termed specific energy. Often only the useful
or extractable energy is measured, which is to say that chemically inaccessible energy such as
rest mass energy is ignored.
The lower the energy density of the battery, the less efficient is it's use in cars, as you need
to move the battery along with the useful load. This is another side of "energy cannibalization"
which typical calculations of efficiency of EV do not take into account
And nother intersting term design to counter alternative fuels hype is "Pseudorenewables":
That's possible, yes.
And it continues to permeate throughout this violence and
hate-based culture.
"If you're not careful, the newspapers will have you hating
the people who are being oppressed, and loving the people who
are doing the oppressing." ~ Malcolm X
"the factory, itself, was was made through the same process,
and so it's congealed stolen labour from workers as well…
Capitalists do have the most weapons usually, and they take that
stuff at the beginning [historically]. So that's why they claim
to own it– they conquer it. The… first part of capitalism is
called primary accumulation, and that's basically going out
somewhere and stealing money and resources and enslaving people…
So basically, it begins as conquering and then once it's owned,
they claim to have a right to it. Capitalism involves the
domination of this class over the working class and it also
involves the resistance of workers to that domination in the
matrix of social relations that are manifested in political and
idealogical fields. So that's class struggle, and it shapes our
everyday lives, everything we do. It shapes our taste in music,
what we care about, what we wear… It's ideological domination…
The whole society, the way that it exists has been shaped by the
economic system that we live under… and in the interests of that
class that dominates that system." ~ Stephanie McMillan
Those are some contexts in which electriclivingroomsonwheels and
pseudorenewables are made.
I know… Let's take a moment of peaceful silence for Fred…
… while we do that, let's imagine the effects, including energy
cannibalization and/in the race for governpimp-owned-and-mandated
national-oil-turned-(pseudo)renewables washing over the the gentle
corals of Fred's ocean…
"Caelan, I tend to agree with a lot of your positions and I
think I understand where you are coming from and also how
frustrating it can be to be surrounded by people who are oblivious
to what you perceive as self evident truths…
I do however have quite a bit of experience in dealing with
people from all walks of life and multiple cultural, ethnic and
linguistic backgrounds… In any case lashing out in anger at those
who aren't there yet, IMHO is counter productive." ~
Fred Magyar
"Its only 300 years old. Obvious the climate was different 300
year ago. Nothing about nature is static, but humans like to think
it is static or can be made static." ~ TechGuy
"
No asshole, you missed my point completely…
Fuck you and everybody who thinks like you!
" ~
Fred Magyar
Maybe Hickory is interested in being right; I am interested in the
truth.
"... The thing is that even though oil will produce more revenue and arguably a better standard of living for the people working in the industry, at some point that party is going to end. PV is not going to sustain anything like the standards of living afforded by oil but, assuming some semblance of BAU can be kept going the benefits of PV will last a lot longer and there is the possibility that the materials used may be recycled or re-used, unlike the oil which once burned, is gone forever. ..."
R Walter's
post further up got me thinking, what if the money spent on 2000 shale oil wells had been
spent installing utility scale PV instead? Since these gizmos that we use to connect to Internet
can make fairly light work of doing the arithmetic for some interesting scenarios, I decided to
put together a little spreadsheet to do a comparison.
Using Ronald's figure of 2,000 wells at an average cost of $5.9 million per well, the total
cost for all these wells would be $11.8 billion. shallow sand
posted an analysis, of the economics for a "typical" Bakken well but, since finance and economics
are not my forte, I haven't been able to come up with calculations I have too much confidence
in. To make matters worse (for me), I had a look at the guest post by Ciaran Nolan,
BAKKEN – Single
Well Economics and I just don't have the chops to do that sort of work. My curiosity got the
better of me and I decided to go ahead with an extremely crude comparison.
Based on
this
graph from Enno Peters , I tried to estimate average annual production, year by year for seven
years for a typical well and came up with 250 bpd average in year 1 with 120, 90, 60, 50, 50 and
50 bpd average for the subsequent six years. That gives 91250 barrels for the first year with
43,800, 32,850, 21,900, 18,250, 18,250 and 18250 for the subsequent years. These numbers are critical
to the results so if I am off, I would gladly be corrected. As the old axiom says "garbage in,
garbage out".
I used a price of $35/barrel (wellhead price?) and OPEX and G&A of $8 as per shallow sands'
example. I have no idea how to calculate lease expenses or royalties or taxes or any other expenses
so, they are omitted. I also assumed all of the well cost was financed at 5% and that, all of
the net income was used to pay down the principal. This very crude spreadsheet gave me a net income,
after OPEX, G&A and interest expense of $2.17 million in year one, dropping to $461k in year 7
with a loan balance of $636k.
I attempted to do a similar set of calculations for PV and for the cost of a $5.9 million well
you will get 1.97 MW of PV using an installed cost of $3/Watt.
This Wikipedia
page cites the EIA and gives the lowest LCOE of any source as onshore wind at $65.6/MWh and
at that price the interest rate used to finance the project would have to be less than 3.2% for
the income of $193520, before expenses, to be greater than the interest, based on the production
from an area with solar resources equal to Wyoming or Nebraska (see
this map ). If the quality of the solar resource is more like the desert south west, or if
the installed cost is less, the project could withstand higher interest rates but, under no circumstances
will PV generate millions of dollars per annum from a $5.9 million investment. For example using
the best available areas in the US and an installed cost of only $1/Watt, would still not break
the million dollar mark.
The results show why people, especially those in the oil/FF business, think solar is a waste
of time! There is just not the same magnitude of money sloshing around when it comes to PV. In
the calculations for PV there is no OPEX or G&A so the situation is actually worse than what the
spreadsheet shows. It may be the case that Operations and Maintenance costs (O&M) in the PV business
are very low compared to oilfield OPEX but, that suggests that there will be nowhere near the
amount of good paying jobs in solar O&M as the are in the oil business. If LTO is bad as an investment,
it would appear that PV without incentives is far worse.
I did a little exercise to see how many vehicle miles would be powered by the sample well versus
1.97 MW of PV, using 31 gallons of fuel yield per barrel, average fleet mpg of 20 and a figure
of 340 Wh/mile EV power consumption. The sample oil well could fuel 56.6 million miles in the
first year and fall steadily to 11.3 million miles in year five with a cumulative 151.6 million
miles for the seven years. The PV on the other hand could provide power for 12.1 million miles
in the first year, declining slowly to 9.5 million miles by year 25, due to the performance of
the PV declining to 80% of nameplate in year 25. The PV hits 150 million cumulative miles by year
thirteen and powers over 279 million miles by year 25.
The thing is that even though oil will produce more revenue and arguably a better standard
of living for the people working in the industry, at some point that party is going to end. PV
is not going to sustain anything like the standards of living afforded by oil but, assuming some
semblance of BAU can be kept going the benefits of PV will last a lot longer and there is the
possibility that the materials used may be recycled or re-used, unlike the oil which once burned,
is gone forever.
It seems to me that most or nearly all of the really big oil companies are putting enough money
into wind and solar power ( even if the actual amount is trivial compared to their revenues) that
they will have INSIDER access to the all important day to day data of running a renewables operation.
When the time comes, they will be ready, and they are in the BEST POSSIBLE position to know when
the time will arrive, lol.
Shell says not to expect much out of this new division for about ten years, because management
thinks it will be that long before conditions are ripe for Shell to make gobs of money in renewables.
The International Energy Agency estimates that the world is dealing with a supply surplus of 1.3
million barrels per day (mb/d) right now, which should last through the end of the second quarter.
By the third and fourth quarters, however, the surplus shrinks to just 0.2 mb/d.
The IEA reiterated its forecast that demand will hold at 1.2 mb/d, and expressed a growing sense
of confidence that oil markets are only a few months away from moving into balance.
For its part, OPEC largely agreed in its May
Oil Market Report. But OPEC also chose to focus on the slightly longer-term, citing the massive
cut in capital expenditures taken over the past two years. The industry has slashed $290 billion
from 2015 and 2016 spending levels so far, with more cuts expected. The spending reductions contributed
to the shockingly low level of new oil discoveries last year – the industry discovered less than
3 billion barrels of new oil reserves in 2015, the lowest level in six decades. With few new discoveries,
and a rising number of projects deferred, there is a very low level of new projects in the pipeline,
so to speak. In other words, oil supply and demand curves are converging towards a balance, and could
even cross over at some point a few years down the line as supply fails to keep up with demand.
... ... ...
Canadian wildfires knocked off more than 1.2 million barrels per day of production, a disruption
that will be temporary, but ultimately could last a few weeks.
Nigeria has lost roughly 0.4 to 0.5 mb/d due to a handful of attacks on oil pipelines and platforms.
Shell and Chevron have shut down facilities and evacuated personnel because of attacks from the Niger
Delta Avengers. Venezuela has seen production
decline at least 0.1 mb/d from last year, and could fall another 0.2 mb/d at least over the course
of 2016.
All of these supply disruptions come on top of the expected decline in output from around
the world, especially high cost U.S. shale. U.S. oil production has fallen to 8.8 mb/d as of early
May, taking the loss in U.S. oil production to about 900,000 barrels per day since April 2015.
Scientists are heading out to study the latest oil spill in the Gulf of Mexico, a
release of about 88,200 gallons from a Shell oil field about 90 miles off the coast of Louisiana.
Last Thursday a leak from a pipeline at the Shell oil production field was spotted and
clean-up vessels began to skim oil off the Gulf on Friday. The cleanup continues.
The leak was contained after wells flowing into the pipeline were shut in.
Some 8,000 workers at oil camps north of the fire-ravaged Canadian city of Fort McMurray were
ordered to evacuate late Monday as authorities continued the battle to bring wildfires under
control.
...Suncor, one of the major operators working on Canada's oil sands, issued a news release
late Monday confirming it had "started a staged and orderly shutdown of our base plant
operations" and that personnel were being transported to work camps further north. It stressed
there has been no damage to Suncor infrastructure.
SandRidge Energy filed for bankruptcy protection Monday, saying it hopes to convert $3.7
billion of long-term debt into equity while allowing the company to keep its operations going.
The Oklahoma City-based company filed the Chapter 11 paperwork in the U.S. Bankruptcy Court
for the Southern District of Texas. The petroleum and natural gas exploration company said it had
the support of creditors who hold more than two-thirds of its $4.1 billion in total debt.
...Under the bankruptcy plan, the company would restructure $3.7 billion of long-term debt
into equity, including $300 million of debt that would later convert to equity in the reorganized
company. The company would still owe about $425 million in reserve-based lending facility debt.
Construction work is starting on a new pipeline project bringing Azeri gas through northern
Greece and Albania to Italy, reducing Europe's energy dependency on Russia.
The Trans Adriatic Pipeline will run for 878 kilometers (550 miles), from Greece's border with
Turkey to southern Italy, and includes a 105-kilometer (65-mile) stretch under the Adriatic Sea.
First deliveries to Europe are expected in 2020.
Greek Prime Minister Alexis Tsipras said the project would create 8,000 jobs in his financially
struggling country, which has more than 24 percent unemployment.
He spoke at a ceremony Tuesday to mark the beginning of the pipeline's construction in the
northern port city of Thessaloniki.
TAP is a joint project by Britain's BP, Azerbaijan's SOCAR, Italy's Snam, Belgium's Fluxys,
Spain's Enagas and Swiss Axpo.
"... Angola has become Africa's biggest oil producer as Nigeria's output slumped to 1.4 million barrels a day, Oil Minister Ibe Kachikwu said Monday, endangering a budget based on production of 2.2 million barrels. ..."
"... Some 70 percent of Nigerians are living below the poverty line, according to the United Nations, despite the country's wealth. ..."
"... The threatened strike comes as militants in the Niger Delta resumed attacks and forced oil majors to evacuate some workers. There are reports the Niger Delta Avengers are sponsored by southern politicians to sabotage Buhari. The president has deployed thousands of troops to the area, where the Avengers are demanding a greater share of the country's oil wealth and protesting cuts to a 2009 amnesty program that paid 30,000 militants to guard installations they once attacked. ..."
LAGOS, Nigeria (AP) - Militant attacks on oil installations and a threatened nationwide strike
are driving Nigeria's petroleum production and its naira currency to new lows.
Angola has become Africa's biggest oil producer as Nigeria's output slumped to 1.4 million barrels
a day, Oil Minister Ibe Kachikwu said Monday, endangering a budget based on production of 2.2 million
barrels. Angolan production was steady at near 1.8 million barrels daily, according to the Organization
of Petroleum Exporting Countries.
The naira fell to 350 to the dollar on the parallel market, against an official rate of 199, amid
reports and denials that President Muhammadu Buhari's government plans an imminent devaluation, bowing
to demands of the International Monetary Fund in exchange for soft loans.
Nigeria's National Labour Congress and the Trade Union Congress, which say they represent 6.5
million workers, and some civic organizations called for a strike Wednesday to protest a 70 percent
increase in gasoline prices, forced by shortages of foreign currency. Nigeria is dependent upon imports
with oil accounting for 70 percent of government revenue.
The crisis is dividing labor leaders on religious and ethnic lines, with those from the mainly
Muslim north against the strike and Christians who dominate the oil-producing south urging citizens
to "Occupy Nigeria!" Buhari is a northerner.
The division may mean that the country will not be subjected to the massive protests that forced
the previous government to shelve plans to do away with a fuel subsidy in 2012, although many Nigerians
are stocking up on food and water.
Inflation officially rose nearly 14 percent last month and prices of food and electrical goods
have doubled while tens of thousands of workers have not been paid in months. Many angry Nigerians
say the government could not have chosen a worse time to drop the fuel subsidy, though shortages
forced people to pay double the fixed price anyway.
Some 70 percent of Nigerians are living below the poverty line, according to the United Nations,
despite the country's wealth.
Buhari took over a year ago from President Goodluck Jonathan, whose government is accused of looting
the treasury of billions of dollars.
The threatened strike comes as militants in the Niger Delta resumed attacks and forced oil majors
to evacuate some workers. There are reports the Niger Delta Avengers are sponsored by southern politicians
to sabotage Buhari. The president has deployed thousands of troops to the area, where the Avengers
are demanding a greater share of the country's oil wealth and protesting cuts to a 2009 amnesty program
that paid 30,000 militants to guard installations they once attacked.
"... Of course, as you mention, none of the companies are able to pay for wells right now out of cash flow. All have interest expense, many have interest expense in excess of $5 per barrel. Then, the question is when will any of these companies begin to use cash flow to reduce debt principal. Some have reduced debt, by buying back their own debt at distressed levels, and/or exchanging the debt with creditors for reduced principal new debt, but at much higher interest rates and more stringent terms (liens upon company assets as opposed to unsecured bonds). ..."
"... Many of the LTO companies sold their gathering and/or produced water disposal infrastructure in order to raise cash. They now are required to pay $X per barrel or mcf of gas in order to get their products to market. ..."
"... I would also note, 20% is a "base case" for Bakken royalties. ..."
Of course, as you mention, none of the companies are able to pay for wells right now out of
cash flow. All have interest expense, many have interest expense in excess of $5 per barrel. Then,
the question is when will any of these companies begin to use cash flow to reduce debt principal.
Some have reduced debt, by buying back their own debt at distressed levels, and/or exchanging
the debt with creditors for reduced principal new debt, but at much higher interest rates and
more stringent terms (liens upon company assets as opposed to unsecured bonds).
Also, another expense I have noticed with more frequency are gathering expenses. Many of the LTO companies sold their gathering and/or produced water disposal infrastructure in order to raise
cash. They now are required to pay $X per barrel or mcf of gas in order to get their products
to market.
I would also note, 20% is a "base case" for Bakken royalties. The actual figures can range
from 12.5% (1/8) to over 25% (1/4). If one is looking at the EFS or Permian, I suggest using a
"base case" royalty of 25% (1/4). However, taxes in TX are less than ND.
"... Breitburn's estimated proven reserves, which were valued at $4.5 billion at the end of 2014, were worth only $1.3 billion as of the end of 2015. ..."
"... On another part of this debacle….one of the auctioneers in West Texas saidthey are getting about $.15 on the dollar for oil field equipment at auction. ..."
"... I think this bust is trying to claim the top prize for most brutal oil and gas bust, ..."
HC Debt disease spreads to California
-About $3 billion of Breitburn's debts are bank and bond debt, topped by $1.25 billion in loans
from lenders led by Wells Fargo Bank, NA. Breitburn is carrying $650 million of senior secured
second-lien bonds and $1.1 billion in unsecured bonds.
-Breitburn's estimated proven reserves, which were valued at $4.5 billion at the end of 2014,
were worth only $1.3 billion as of the end of 2015.
-Breitburn has crude oil and natural gas assets in the Midwest, Ark-La-Tex, the Permian Basin,
the Mid-Continent, the Rockies, the Southeast and California.
"Crude Oil" ??
http://www.wsj.com/articles/breitburn-energy-partners-files-for-chapter-11-bankruptcy-1463400009
http://www.wsj.com/articles/sandridge-energy-files-for-bankruptcy-protection-1463404621
On another part of this debacle….one of the auctioneers in West Texas saidthey are getting
about $.15 on the dollar for oil field equipment at auction.
I also see the C & J services is rumored to be filing BK. I am not familiar with them, from my
reading they are a very large well completion company. Looks like their CEO passed away unexpectedly
at age 46 back on 3/11/16.
I think this bust is trying to claim the top prize for most brutal oil and gas bust,
"... China, the world's fourth-largest oil producer, pumped 5.6 percent less crude year-on-year in April, official data showed, as oil firms struggled with cost pressures with crude prices hovering around $40 a barrel. ..."
China, the world's fourth-largest oil producer, pumped 5.6 percent less crude year-on-year
in April, official data showed, as oil firms struggled with cost pressures with crude prices hovering
around $40 a barrel.
Data from the National Bureau of Statistics released on Saturday showed China produced 16.59 million
tonnes of crude oil last month, or about 4.04 million barrels per day (bpd), the lowest rate since
July 2013 on a daily basis.
Production in the first four months was down 2.7 percent over the same year-ago period to 68.14
million tonnes, or about 4.11 million bpd.
PetroChina, the country's top producer, recorded a 0.2 percent drop in oil and gas production
in the first quarter and Sinopec scaled back domestic crude production by 10.35 percent in the
same period, companies said in April.
Offshore specialist CNOOC Ltd, however, delivered a 5.1 percent rise in total net oil and gas
production in the first quarter over a year ago, thanks to new Chinese offshore fields.
Natural gas output last month rose 5.6 percent on the year to 10.6 billion cubic meters, with
production up 5.3 percent in the first four months, the data showed.
"... And whatever the arcane arguments made by EIA, the fact remains that even without the impact of new policies, the agency's scenarios remain utterly incongruent to current reality. ..."
Much ink has been spilled over the vast difference between the scenarios put forward by
the U.S. Department of Energy's Energy Information Administration (EIA) and reality. And whatever
the arcane arguments made by EIA, the fact remains that even without the impact of new policies,
the agency's scenarios remain utterly incongruent to current reality.
Unlike the agency's Annual Energy Outlook (AEO), International Energy Outlook focuses on global
trends. But like AEO, the report misses the boat on renewable energy and makes projections about
the fossil fuel industry which run counter to facts on the ground.
International Energy Outlook 2016's section on electricity forecasts that total generation
from renewable energy sources will rise 2.9% annually under the baseline scenario to reach 29%
in 2040, driven by non-hydro renewable energy rising 5.7% annually. By contrast, EIA expects global
coal use to rise 0.8% annually, and for coal to still represent 29% of global electricity generation
in 2040, the same amount as renewable energy.
"... While oil production in the Bakken has been in decline for more than a year, natural gas production continues to increase. As there is no big natural gas fields in North Dakota and most of the gas is associated, this trend can be entirely attributed to the rising GOR. ..."
"... Since the beginning of the shale boom in the Bakken North Dakota the natural gas to oil production ratio has increased almost 3 times ..."
While oil production in the Bakken has been in decline for more than a year, natural gas production
continues to increase. As there is no big natural gas fields in North Dakota and most of the gas
is associated, this trend can be entirely attributed to the rising GOR.
Oil and natural gas production in the Bakken
source: NDIC
"... The exact words used by Van Beurden were that he has 'no hesitation to predict that in years to come solar will be the dominant backbone of our energy system, certainly of the electricity system.'. Considering that these words were from the CEO of one of the largest oil companies in the world, one would assume that he has good reasons for saying what he did ." ..."
"... Total – Investing In Solar. The French oil and gas giant… increased its investments in green energy. With revenues of $ 2.4 billion in 2012, Sunpower is one of the leading manufacturers of solar panels. ..."
"... Statoil – Placing Its Bet On Wind. The Norwegian multinational company is one of the largest investors in clean energy. Being the biggest shareholder of Statoil, the government of Norway has decided to boost its investments in renewables by utilizing its $860 billion oil fund. ..."
"... Truth: The U.S. oil and natural gas industry invested over $121 billion between 2000 and 2007 in emerging energy technologies, including $12 billion in non-hydrocarbons and $42 billion in greenhouse gas emission mitigation technologies. ..."
"... This investment represents 65% of the estimated total of $188 billion spent by U.S. based companies and the Federal government on emerging energy technologies. ..."
"... Even though oil companies reap the financial benefits of our demand for oil, they claim to be leading efforts in search of alternative sources of energy (solar, wind or biofuels)… ..."
"... Oil and gas companies have been dabbling in the renewables business for a long time. In the wake of the oil shock of the 1970s, OECD governments established a range of incentives and subsidies for energy independence. This sparked a first wave of standalone renewable business ventures by the oil patch, focusing on solar, wind and geothermal energy. ..."
"... The reason is that, outside of government, it is the traditional oil and gas companies that are constructing much of the green energy projects in the country, such as wind, hydro and solar. ..."
"... "n.b. Ferruccio Ferroni is/was president of the NIPCC-SUISSE, a climate change denier group. His (apparent) Linked-in page (in German) https://ch.linkedin.com/in/ferruccio-ferroni-85480060 has some fragment of 'Head Division Safety bei Leibstadt Nuclear Power Plant'." ~ sunnnv ..."
" A national oil company (NOC) is an oil company fully or in the majority owned
by a national government . According to the World Bank, NOCs accounted for
75% global oil production and controlled 90% of proven oil reserves in 2010 …" ~ Wikipedia
Solar energy will comprise the backbone of the world's energy system in years to come, according
to the CEO of Shell (yes, that Shell), Ben van Beurden.
The exact words used by Van Beurden were that he has 'no hesitation to predict that
in years to come solar will be the dominant backbone of our energy system, certainly of the
electricity system.'. Considering that these words were from the CEO of one of the largest
oil companies in the world, one would assume that he has good reasons for saying what he did
."
"In the current market scenario, it is interesting to look at those major oil and gas companies
who are still investing substantially in green energy.
Total – Investing In Solar. The French oil and gas giant… increased its investments
in green energy. With revenues of $ 2.4 billion in 2012, Sunpower is one of the leading manufacturers
of solar panels.
Statoil – Placing Its Bet On Wind. The Norwegian multinational company is one of the
largest investors in clean energy. Being the biggest shareholder of Statoil, the government
of Norway has decided to boost its investments in renewables by utilizing its $860 billion
oil fund.
"Truth: The U.S. oil and natural gas industry invested over $121 billion between 2000
and 2007 in emerging energy technologies, including $12 billion in non-hydrocarbons and $42
billion in greenhouse gas emission mitigation technologies.
This investment represents 65% of the estimated total of $188 billion spent by U.S.
based companies and the Federal government on emerging energy technologies."
"Even though oil companies reap the financial benefits of our demand for oil, they claim
to be leading efforts in search of alternative sources of energy (solar, wind or biofuels)…"
"Oil and gas companies have been dabbling in the renewables business for a long time.
In the wake of the oil shock of the 1970s, OECD governments established a range of incentives
and subsidies for energy independence. This sparked a first wave of standalone renewable business
ventures by the oil patch, focusing on solar, wind and geothermal energy."
"But in Canada, divestiture may not be the best method of promoting renewable energy development.
Traditional oil, gas and coal companies are creating the majority of renewable energy in
Alberta…
The reason is that, outside of government, it is the traditional oil and gas companies
that are constructing much of the green energy projects in the country, such as wind, hydro
and solar.
For instance, the largest wind and hydro projects in Alberta are owned in whole or in part
by traditional oil, gas and coal companies."
"In a sign of the changing times the Rockefeller family are to sell oil interests
to reinvest into clean energy . This kills one of the myths that big oil will suppress
clean or free energy.
"(And that's probaby why we're going to get a seneca cliff, incidentally, and why…
photovoltaic PV solar panels may be a 'short-term huckster' by Big Oil/Big Energy.
Who says Big Oil/Big Government/Big Energy doesn't own or have a large share/stake in the Gigafactory/PV
pie
…with Musk being their posterboy, their 'logo', like Colonel Sanders or Ronald MacDonald.
Do you think Big Oil didn't/doesn't have access to Marion King Hubbert's work and related
peak oil details? Big Oil/Big Energy powers Big Government; Big Oil/Big Energy IS Big Government
.)
"n.b. Ferruccio Ferroni is/was president of the NIPCC-SUISSE,
a climate change denier group.
His (apparent) Linked-in page (in German)
https://ch.linkedin.com/in/ferruccio-ferroni-85480060
has some fragment of 'Head Division Safety bei Leibstadt Nuclear Power Plant'." ~
sunnnv
Hahaha… Good times… ('Deny climate change; then/thus push for lots of so-called renewables
very fast.')
"The twin peaks of oil and government are causally linked: central government's
great era of expansion has been fueled by abundant, cheap liquid fuels. As economies powered
by abundant cheap energy expanded, so did tax revenues .
Demographics also aided Central States' expansion: as the population of working-age citizens
grew, so did the work force and the taxes paid by workers and enterprises.
The third support of Central State expansion was debt, and more broadly, financialization,
which includes debt, leverage, and institutionalized incentives for speculation and misallocation
of capital. Not only have Central States benefited from the higher tax revenues generated by
speculative bubbles, they now depend on debt to finance their annual spending. In the U.S.,
roughly one-third of Federal expenditures are borrowed every year. In Japan - which is further
along on this timeline, relative to America - tax revenues barely cover social security payments
and interest on central government debt; all other spending is funded with borrowed money.
The fourth dynamic of Central State expansion is the State's ontological imperative to expand.
The State has only one mode of being, expansion. It has no concept of, or mechanisms
for, contraction ."
"Behind Boetie's thinking was the assumption, later spelled out in great detail by David Hume,
that states cannot rule by force alone. This is because the agents of government power are always
outnumbered by those they rule. To insure compliance with their dictates, it is essential to convince
the people that their servitude is somehow in their own interest. They do this by manufacturing
ideological systems …" ~ Llewellyn H. Rockwell, Jr.
Like PV or EV.
With your tax-pimped money.
So keep eating what they serve up. Maybe including Tony Seba's slop.
"... …rain forests in southeast Asia got clearcut so that palm oil plantations could supply the upper middle classes of Europe and America with supposedly sustainable biodiesel. It could have gotten much worse, except that the underlying economics were so bad that not that many years into the biofuels boom, companies started going broke at such a rate that banks stopped lending money for biofuel projects; ..."
"... For quite a while there, you couldn't click through to an energy-related website without being assailed with any number of grandiose diatribes glorifying fracking as a revolutionary new technology that, once it was applied to vast, newly discovered shale fields all over North America, was going to usher in a new era of US energy independence. Remember the phrase 'Saudi America' ? I certainly do. ..."
"... We often talk of grid parity, meaning when solar reaches the cost of residential energy. But residential electricity is a luxury. What matters to industrial society is the grid parity of industrial energy! That is what determines the cost of all goods produced. ..."
"... Now consider industrial society where the cost of every energy intensive good is 10 or 20 times what it is today. Gas taxes must be 10 or 20 times higher to pay for roads. Glass and steel is 10 or 20 times more expensive. Cars (glass, steel) are 10 or 20 times more expensive. Solar energy itself will be 10 or 20 times more expensive. ..."
"... Most people will no longer be able to afford any of those things. ..."
"…rain forests in southeast Asia got clearcut so that palm oil plantations could supply
the upper middle classes of Europe and America with supposedly sustainable biodiesel. It could
have gotten much worse, except that the underlying economics were so bad that not that
many years into the biofuels boom, companies started going broke at such a rate that
banks stopped lending money for biofuel projects; some of the most highly ballyhooed algal
biodiesel projects turned out to be, in effect, pond scum ponzi schemes; and except for those
enterprises that managed to get themselves a cozy spot as taxpayer-supported subsidy dumpsters,
the biofuel boom went away.
It was promptly replaced by another energy resource that was sure to save industrial civilization.
Yes, that would be hydrofracturing of oil- and gas-bearing shales, or to give it its popular
moniker, fracking. For quite a while there, you couldn't click through to an energy-related
website without being assailed with any number of grandiose diatribes glorifying fracking as
a revolutionary new technology that, once it was applied to vast, newly discovered shale fields
all over North America, was going to usher in a new era of US energy independence.
Remember the phrase 'Saudi America' ? I certainly do.
Here again, there were two little problems with these claims, and the first was that once
again the numbers didn't work out ."
The technology and efficiency improvements will lower the cost, until the rising cost of
energy overwhelms those improvements and forces the cost back up.
We often talk of grid parity, meaning when solar reaches the cost of residential energy.
But residential electricity is a luxury. What matters to industrial society is the grid parity
of industrial energy! That is what determines the cost of all goods produced.
Now consider industrial society where the cost of every energy intensive good is 10 or 20
times what it is today. Gas taxes must be 10 or 20 times higher to pay for roads. Glass and
steel is 10 or 20 times more expensive. Cars (glass, steel) are 10 or 20 times more expensive.
Solar energy itself will be 10 or 20 times more expensive.
Most people will no longer be able to afford any of those things.
… Fossil depletion removes the choice of BAU . Industrial society will
end because no one will be able for afford it."
If that "U" shaped curve turns out to be true, its a great reason to get on with the "Great PV
Rollout" now, on a massive and unrelenting scale, while prices of fossil aren't prohibitive.
"... Prices have bounced back to $46 a barrel from February lows in the mid-$20s ..."
"... That will not help smaller producers built for far higher prices. These companies have largely exhausted funding alternatives after issuing more equity and debt, tapping second-lien loans and shedding assets over the last two years to stay afloat as banks trimmed credit lines. ..."
"... Some companies are in more acute distress, faced with the expiration of derivative contracts that had allowed them to sell oil above market prices. ..."
"... "Everybody was able to hold on for a while," said Gary Evans, former CEO of Magnum Hunter Resources, which emerged from bankruptcy protection this week. "But once the hedges roll off you can't support that debt." ..."
"... Founded in 2003, Linn has about $10 billion in debt, about twice that of Samson Resources Corp and Energy XXI Ltd, two of the largest oil and gas companies to file recently. Linn was designed as a high-yield investment vehicle, which received beneficial tax treatment in return for paying out the bulk of its profits to unitholders. Because of this structure, it took on significant debt to grow through acquisitions. ..."
The wave of U.S. oil and gas bankruptcies surged past 60 this week, an ominous sign that the
recovery of crude prices to near $50 a barrel is too little, too late for small companies that
are running out of money.
On Friday, Exco Resources Inc, a Dallas-based company with a star-studded board, said it
will evaluate alternatives, including a restructuring in or out of court. Its shares fell 35
percent to 62 cents each.
Exco's notice capped off one of the heaviest weeks of bankruptcy filings since crude prices
nosedived from more than $100 a barrel in mid-2014.
Prices have bounced back to $46 a barrel from February lows in the mid-$20s , but
the futures market shows investors do not expect U.S. benchmark crude to rise above $50 for
more than a year.
That will not help smaller producers built for far higher prices. These companies have
largely exhausted funding alternatives after issuing more equity and debt, tapping second-lien
loans and shedding assets over the last two years to stay afloat as banks trimmed credit lines.
Some companies are in more acute distress, faced with the expiration of derivative contracts
that had allowed them to sell oil above market prices.
"Everybody was able to hold on for a while," said Gary Evans, former CEO of Magnum Hunter
Resources, which emerged from bankruptcy protection this week. "But once the hedges roll off
you can't support that debt."
Bankruptcy filers this week included Linn Energy LLC and Penn Virginia Corporation. Struggling
SandRidge Energy LLC, a former high flyer once led by legendary wildcatter Tom Ward, said it
would not be able to file quarterly results on time.
The number of U.S. energy bankruptcies is closing in on the staggering 68 filings seen during
the depths of the telecommunications sector bust of 2002 and 2003, according to Reuters data,
the law firm Haynes & Boone and bankruptcydata.com.
Linn's bankruptcy was the biggest among energy companies so far in this downturn, even though
the company is a modest producer of about 59,000 barrels of oil per day, and 607 million cubic
feet of gas per day.
Founded in 2003, Linn has about $10 billion in debt, about twice that of Samson Resources
Corp and Energy XXI Ltd, two of the largest oil and gas companies to file recently. Linn was
designed as a high-yield investment vehicle, which received beneficial tax treatment in return
for paying out the bulk of its profits to unitholders. Because of this structure, it took on
significant debt to grow through acquisitions.
Exco's warning showed that the crude price rout has not spared companies with highly experienced
management. Exco has reported a loss for the last five quarters in a row. It has a number of
big-name board members including billionaire investor Wilbur Ross and executive chairman John
Wilder, who engineered the giant leveraged buyout of TXU.
Valued at about $495 million as of Thursday's stock market close, Exco had long-term debt
of $1.32 billion on March 31, according to a regulatory filing.
One probable outcome, as Exco said on Friday, may include getting rid of debt by having
debtholders become shareholders, possibly wiping out existing equity owners.
Penn Virginia's strategy is similar. "Once the restructuring is implemented, the Company
will have substantially less debt and a much stronger balance sheet," Penn Virginia's Chairman
and interim CEO Edward Cloues said in a statement.
(Reporting By Terry Wade; Editing by Luc Cohen and David Gregorio)
"... I have read 25% of US E & P/ service co went BK in 1986. The US bankruptcy law firm Haynes and Boone is tracking oil and gas BK this time around. Through 4/30/16, 69 had filed with debts totalling about $35 billion. ..."
"... The list doesn't include May, which could see another $20 billion of debt alone in BK for the industry. ..."
"... If you would have told me in 2013 that $40 oil would be brining us great relief, is would have said you were certifiable. ..."
"... In my opinion, almost all drilling activity at present in the US lower 48 is to avoid closing down company divisions. So many in the Bakken with just one rig, for example. ..."
You can't avoid playing in this global financial casino. Doug Leighton ,
05/13/2016 at 5:30 pm
Hi Shallow,
Well, the '86 bust was bloody terrible for me; I had kids in university then. Of course it
was much worse for some of the other guys. At least my wife had her teaching/research job in Sweden
so we managed. On a personal level I'd say it depends on where you're sitting. Sometimes I feel
like a shit babbling on here when some very smart, productive and capable people, like you, are
in the thick of it.
I guess I am just wondering if there are any statistics out there comparing job losses and/or
company bankruptcies?
I have read 25% of US E & P/ service co went BK in 1986. The US bankruptcy law firm Haynes
and Boone is tracking oil and gas BK this time around. Through 4/30/16, 69 had filed with debts
totalling about $35 billion.
The list doesn't include May, which could see another $20 billion of debt alone in BK for the
industry.
Of course, it is still my opinion that many more companies are technically insolvent as reserve
values are below debts of most.
If you would have told me in 2013 that $40 oil would be brining us great relief, is would have
said you were certifiable.
In my opinion, almost all drilling activity at present in the US lower 48 is to avoid closing
down company divisions. So many in the Bakken with just one rig, for example.
"... There should be some overall increased recovery, but mostly these techniques push out the peak. Saudi are looking at Safaniya Phase III development, which might be their last option for the offshore fields; once ESPs are installed in new completions on old fields, as was done in the 2012 upgrades, then you are pretty close to sucking up the dregs. Similarly for intelligent completions – I have worked on fields with horizontal producers in water flood with much simpler methods then Saudi are using but once the water contact started to rise past the producers production dropped over 60% in two years. There was a much slower decline thereafter, in fact almost a plateau for some time but it took more drilling to maintain it. H/L doesn't work in such circumstances. ..."
Using EOR methods such as artificial lift, as they have installed in Safaniya, and intelligent
multilaterals, as in Ghawar, it is possible to significantly increase production (i.e. not only
reduce decline rates but turn them into production acceleration and increased capture). But eventually
it catches up and the rates will crash, as was seen with nitrogen injection EOR on Cantarell.
There should be some overall increased recovery, but mostly these techniques push out the peak.
Saudi are looking at Safaniya Phase III development, which might be their last option for the
offshore fields; once ESPs are installed in new completions on old fields, as was done in the
2012 upgrades, then you are pretty close to sucking up the dregs. Similarly for intelligent completions
– I have worked on fields with horizontal producers in water flood with much simpler methods then
Saudi are using but once the water contact started to rise past the producers production dropped
over 60% in two years. There was a much slower decline thereafter, in fact almost a plateau for
some time but it took more drilling to maintain it. H/L doesn't work in such circumstances.
China has reported April 2016 production at 4.04 mbpd. A 5.6% decline year on year. It's down
380,000 bopd (8.6%) from the 4.42 mbpd JODI lists for June 2015.
"... Generally speaking (in Texas anyway) a lease must generate cash flow in excess of its monthly cost of production. $1 over that monthly cost is sufficient. Naturally, each operator's cost are different and each lease/well is different. ..."
Generally speaking, an OGL that is past its primary term must produce
oil and/or gas in "paying quantities" with no cessation of more than xx
days (depends on lease language) to continue to be held in effect. There
are many ways an operator can handle this situation by producing just a
few days a month. An operator can pay a "shut-in gas" royalty to defer a
production obligation in certain circumstances. Each situation is different
and requires its own analysis.
An operator is not required to show that a well or leasewell is capable
of "paying out" it's cost of the lease, drilling and completion, gathering,
treating facilities and so forth.
The important issue is that a well or lease must be capable of producing
oil or gas in "paying quantities".
Generally speaking (in Texas anyway) a lease must generate cash flow
in excess of its monthly cost of production. $1 over that monthly cost is
sufficient. Naturally, each operator's cost are different and each lease/well
is different.
In my opinion, many wells are "magically" producing just enough oil and
gas to generate a marginally positive cash flow. Why you ask? To avoid plugging
and abandonment until a greater fool comes along to buy the lease and allow
the current operator to get off the hook.
I know of one case where SandRidge Energy (Arena Acquisition) drilled
52 vertical wells in one 640 acre section. Each well is capable of producing
1-2 bbls/day. Payout will never happen and I doubt that production in paying
quantities is happening. I also doubt that a greater fool exists to take
over this lease
But…… someday someone (perhaps you) will be on the hook to plug and abandon
and restore the surface to its original condition.
Russia is not planning to significantly ramp production capacity.
Energy Minister Novak said today that the country will be able to maintain
long-term production levels within the range 525-545 million tons per year
(10.5-10.9 mb/d). That's what Russian officials were saying earlier.
According to the Saudi officials, planned expansion of the Khurais and
Shaybah oil fields will only
compensate for falling output at other fields. They claim that the country's
"maximum sustainable output capacity is 12 million barrels per day and the
nation's total capacity is 12.5 million bpd", but there are no plans to
increase capacity and there is no evidence that this capacity really exists.
I think that in reality Saudi Arabia is able to increase crude production
from the current 10.2 mb/d to 10.5-10.6 mb/d during the peak season for
local demand in the Summer, but not well above those levels.
"... As the project's most hight cost producers started to bleed cash, corporations laid off 40,000 engineers, labourers, cleaners, welders, mechanics and trades people with little fanfare and even less thanks. ..."
"... In fact bitumen has lost so much of its global investment lustre that, even before the Fort Mac blaze, Bloomberg reported that no new supplies of low-grade bitumen will enter the market in 2018. This would mark the first time in more than a decade that the rate of bitumen extraction, now at 2.4 million barrels a day, will not increase. ..."
"... Since the 1980s Koch Industries has been buying Canada's bitumen crude and turning it into high value jet fuel and gasoline at their Pine Bend refinery. In fact Koch Industries now gobbles up 300,000 barrels of bitumen a day and remains the single largest buyer of Canada's dirtiest crude. To the Kochs it's a no brainer: bitumen offers some of the most attractive refinery margins in the world. ..."
"... Bloomberg reported that no new supplies of low-grade bitumen will enter the market in 2018. ..."
"... With the oil price collapse the Kochs keep on making more money, while Alberta gets poorer.In February the Alberta government set a minimum value for bitumen at $10 per cubic metre. That equates to a value of about $1.50 per barrel of bitumen. But in 2014 the government's monthly report valued bitumen at $421 per cubic metre. The data suggests that bitumen has lost 97 per cent of its value during the price collapse. In other words companies once worth billions are now worth millions. ..."
"... When oil prices stood at $100, rash bitumen development made some sense. But when prices fell below $45 the gamble turned into Russian roulette. Unlike Saudi oil, most bitumen projects require prices of at least $60 to $70 a barrel to survive. ..."
"... And so most tar sands extractors (except those who own refineries) are now bleeding cash; many banks have developed nervous twitches; and thousands of workers have found themselves unemployed. The overproduction of bitumen explains why, says Rubin, "the oilsands morphed from an engine of economic growth into the epicenter of a made-in-Canada recession." ..."
"... Oil is currently over 45 bucks a barrel, but as Nikiforuk points out the values - especially related to raw bitumen - are insanely low and are simply cannon fodder for the Koch brothers war chest to unseat the Democrats. ..."
"... It seems to me another aspect of this is how quarterly profit driven short term thinking has ruled the day so completely that the reality that the solar energy bound up and stored in the tar-sands isn't going to evaporate is overlooked by the bean counters. One day, hopefully, someone will invent a technology that can harvest this energy without causing all the various pollution problems our current technologies create. ..."
"... Its easy to understand why the Koch brothers as but one of several parties are happy to oblige Alberta by buying low and selling high as Andrew Nikiforuk details. ..."
"... However none of the analyses exposes by what process are "Most Albertans and most Fort McMurray residents" silenced into the Koch brothers serfdom ..."
"... I quite appreciate how you observe what the problem politic is when you say "Their beliefs included 'big government is bad; the only good government is a small government' and 'self-regulation' and 'private industry always does it best'. Even after more than 35 years of spectacular failures these nutjobs still think they are on to something grand." ..."
"... Chris Hedges, from the US, a much more dysfunctional society than ours, sees violent revolution as the only way forward with many, many losers and his side being the winner. I'm in favour of that outcome but I fear it's far from certain who will be the winner while it is absolutely certain that there will be many losers. Without some immediate and significant change to our way of life both the natural environment and the social environment will soon reach a tipping point. Then there will no end to the missing people and carnage and wasted resources. ..."
"... My point is that I bought into Mr. Rubin's $200 dollar peak oil forecast. He had lots of facts and figures then too. He was still completely wrong. He may be completely wrong again today. ..."
At the end of the day the $10-billion wildfire that consumed 2400 homes and buildings in Fort
McMurray may be the least of the region's problems.
Although the chaotic evacuation of 80,000 people through walls of flame will likely haunt its
brave participants for years, a slow global economic burn has already taken a nasty toll on the region's
workers.
That fire began last year when global oil prices crashed by 40 percent and evaporated billions
of investment capital in the tarsands.
As the project's most hight cost producers started to bleed cash, corporations laid off 40,000
engineers, labourers, cleaners, welders, mechanics and trades people with little fanfare and even
less thanks.
Many of these human "stranded assets" endured home foreclosures and lineups at the food bank.
Worker flights to Red Deer and Kelowna got cancelled and traffic at the city's new airport declined
by 16 per cent. Unemployment in Canada's so-called economic engine soared to nearly nine percent.
In fact bitumen has lost so much of its global investment lustre that, even before the Fort
Mac blaze, Bloomberg
reported
that no new supplies of low-grade bitumen will enter the market in 2018.
This would mark the first time in more than a decade that the rate of bitumen extraction, now
at 2.4 million barrels a day, will not increase.
... ... ...
Since the 1980s Koch Industries has been buying Canada's bitumen crude and turning it into high
value jet fuel and gasoline at their Pine Bend refinery. In fact Koch Industries now gobbles up 300,000
barrels of bitumen a day and remains the single largest buyer of Canada's dirtiest crude. To the
Kochs it's a no brainer: bitumen offers some of the most attractive refinery margins in the world.
Up in smoke? Even before the Fort Mac blaze,
Bloomberg reported that no new supplies of low-grade
bitumen will enter the market in 2018.
With the oil price collapse the Kochs keep on making more money, while Alberta gets poorer.In February the Alberta government set a minimum value for bitumen at $10 per cubic metre. That
equates to a value of about $1.50 per barrel of bitumen. But in 2014 the government's monthly report valued bitumen at $421 per cubic metre. The data suggests
that bitumen has lost 97 per cent of its value during the price collapse. In other words companies
once worth billions are now worth millions.
... ... ...
When oil prices stood at $100, rash bitumen development made some sense. But when prices fell
below $45 the gamble turned into Russian roulette. Unlike Saudi oil, most bitumen projects require prices of at least $60 to $70 a barrel to survive.
And so most tar sands extractors (except those who own refineries) are now bleeding cash; many
banks have developed nervous twitches; and thousands of workers have found themselves unemployed. The overproduction of bitumen explains why, says Rubin, "the oilsands morphed from an engine of
economic growth into the epicenter of a made-in-Canada recession."
Selected Skeptical Comments
Kevin Logan
Oil is currently over 45 bucks a barrel, but as Nikiforuk points out the values - especially
related to raw bitumen - are insanely low and are simply cannon fodder for the Koch brothers war
chest to unseat the Democrats.
The business case in the tarpit was always very dependent on massive subsidy, low royalty and
political interference. Now that Alberta is just another Province with an NDP government and not
the conservative mecca that rules the land from coast to coast, I suspect they will dole out much
more pain for average folks.
Once the NDP there instills a massive tax regime with carbon taxes, sales tax and fees etc,
to balance the budget on the backs of the people the conservatives will once again take back power
and upscale the fleecing of the natural resource.
BC is on the same path, right now its the land of milk and honey because they need to build
out the infrastructure to fleece us, but once the LNG facilities are in and the pipes are pumping,
the pain will come. Fortunately for us they already are taxing us into the ground and hydro, fees
licensing etc is already in place, so the fleecing of our natural resource wealth will result
in less volatile boom and bust but no less of a complete fleecing - to be sure.
bruce kay > Kevin Logan
No one in Canada is being "taxed into the ground". that is an entirely fallacious statement,
especially Alberta. Now you can certainly argue that the Tax regime is not particularly progresive
in that the wealthier are proportionally under taxed but there is no doubt, particularly if one
simply views other (generally more socially successful) countries, that taxation is a key element
in creating opportunity where otherwise it does not exist.
That is at least one element that perpetuates the corporate dominance of our public policy
that you talk about
Kevin Logan > bruce kay
Trust me, for Alberta to fix their woes, the plebes will feel as if they have been taxed into
the ground. For decades the low tax environment of Alberta was its single pride and joy - the
Alberta Advantage. Which is why the Cons would not mess with new taxes. The NDP was elected to
get fair returns from the industry, but instead they capitulated and implemented a carbon tax
they did not run on that only average folk pay as oil companies can write it off against their
royalties. Bizarrely the new government plans to take that new 3 billion in annual revenue from
average folk and hand it to industry to green up and what not, as there is no specifics released
yet.
Letting off the oil companies, leaving royalty structures in tact and balancing the budget
with new taxes on average Albertans was not what they ran on, but its what they delivered and
its why the wildrose now polls first place way ahead of the NDP at some 25% in the polls.
bruce kay > Kevin Logan
Maybe I missunderstood your intent. I can't argue with that, on both counts. I'm not familiar
with how the carbon tax revenue will be directed but certainly, lower income taxpayers need to
avoid punitive costs simply because they can't avoid driving.
Otherwise, as you say the fury of populist revolt will sabotage whatever gains are made and
the Trumps will fill the power void
RiversidePaulo > Kevin Logan
You'll never see an LNG plant built in BC. That ship sailed long ago.
WWallace Mud > Kevin Logan
Hi Kevin,
It seems to me another aspect of this is how quarterly profit driven short term thinking
has ruled the day so completely that the reality that the solar energy bound up and stored in
the tar-sands isn't going to evaporate is overlooked by the bean counters. One day, hopefully,
someone will invent a technology that can harvest this energy without causing all the various
pollution problems our current technologies create.
Future Canadians, our kids and grand-kids or theirs, will need energy to power whatever industries
exist in the future, industries that will create their jobs and their future weal.
i say leave it in the ground, it'll only be worth more in the future. For sure this isn't the
best plan from the banker's and shareholder's perspective, but it's the best plan for Canada and
Canadians in the long term.
Tierra y Liberdad
I really enjoy reading Mr. Nikoruk's research on the future of oil. Clearly the numbers do
not lie. The reality of certain laws are coming home to roost: the law of supply and demand, as
well as the law of diminishing returns means bad news for the oil industry....and Canada thanks
to past government's myopic, narrow oil-orgy led policies.
political ranger > Tierra y Liberdad
Read Rubin's report for a very sobering look at our near-term future.
cliche guevera > political ranger
I think people either get it or they don't want to get it.
WAC
If I was an unemployed homeowner in McMurray, I would take the insurance money and run!
cliche guevera > WAC
And the 72 week E.I.Program Trudeau announced today, to re-train and get a new job skill that
might even pay better than the Fort Mac daily grind.
Mindcraft
Thank you Andrew Nikiforuk you have brought to light all the questions missing yet again in
the mainstream media my wife has been spouting. It is unfortunately a gold rush town.
Eduard Hiebert > Mindcraft
If "gold rush" is an appropriate metaphor, in view of recent federal and provincial politics
is it anywhere appropriate to limit this "rush" to an image of a "gold rush town"?
It's all in Canadian History, repeat, delete, repeat.
Mindcraft > Eduard Hiebert
I have agonized over making examples from the beginning of the 1990's
If an industry creates waste, including premature death, it must invest in building ways to remedy
the fallout and not employ a cover up team to continue the self distructive end game which is
the lateral part of corporate un sustainability. The pulp mill near me has many fine hands on
tech people all willing to address problems in their own time as a community yet they are constantly
seen as a threat to shareholders achieving monetary gain from experimenting with the unknown in
diversifying into creative sub groups.
No different than the Lego (before its forecasted demise
many years ago) company letting parents decide, explore products of reality and culture. We have
silo's of control in every level of governance.
Eduard Hiebert
Its easy to understand why the Koch brothers as but one of several parties are happy to oblige
Alberta by buying low and selling high as Andrew Nikiforuk details.
However none of the analyses exposes by what process are "Most Albertans and most Fort McMurray
residents" silenced into the Koch brothers serfdom
when Nikiforuk concludes "Most Albertans and
most Fort McMurray residents never wanted reckless growth. In a heartbeat they would have voted
to slow down the tarsands years ago with higher royalties and better regulations, but their political
masters refused to put on the brakes"?
def > Eduard Hiebert
The processes you refer to include the pathologies of capitalism and corporate 'democracy'.
The therapy includes 'economic democracy' in which economic decision are based upon the control
of all people effected by any given economic decision.
However, after decade after decade of corporate brainwashing such thoughts are not sufficiently
sophisticated for serious consideration by present media, thoughtless talking heads, political
propagandists, or god forbid, being explored in the curricula of the education system.
It has proved to be a voracious and merciless process that shows few if any signs of relenting.
Eduard Hiebert > def
Since its the many who bear the costs of what the few impose on us, from beginning to your
end agreed that "It has proved to be a voracious and merciless process that shows few if any signs
of relenting."
Surely you are not suggesting say the Koch brothers initiate and do the necessary change for
us as in to us when you yourself see that the answer involves "The therapy includes 'economic
democracy' in which economic decision are based upon the control of all people effected by any
given economic decision"?
Mindcraft > ScottyonDenman
6 hours ago
It is a mining camp that is sustained by federal gambling, how shrinkable is any gambling.
Sustainability starts with no waste. Corporatists start with abuse and suckers to trample on,
ie the ignoramus conmunitas.
disqus_Wf91wKMTsJ
Jeff Rubin, CIBC's former chief economist, notes that the world economy is stagnating; but
the shrinking demand for tar sands oil is just part of the reason.
Rubin, along with most folks pushing for "green" energy, are being overly optimistic if they
believe "an orderly transition that protects communities and oilsands workers, and rewards them
for the economic contributions they've made by providing funds for retraining and industry diversification",
will allow folks to avoid the economic pain that accompanies global resource scarcity.
Aside from nuclear energy, which has its own unique problems, there isn't another source of
energy that has the same energy density and the same portability that fossil fuels provide.
political ranger > Eduard Hiebert
6 hours ago
In Klein's world there was no planning, no short & long term, only the here and now. They had,
the PC's and wild-rosecrucian's still have, a rigid belief in their ideology, much like the religious
zealots in the far east, or anywhere.
Their beliefs included 'big government is bad; the only good government is a small government'
and 'self-regulation' and 'private industry always does it best'. Even after more than 35 years
of spectacular failures these nutjobs still think they are on to something grand.
Nobody cared when the riches were just flowing out of the ground. Now, as you say, the blindfolds
are not working so well.
Eduard Hiebert > political ranger
I quite appreciate how you observe what the problem politic is when you say "Their beliefs
included 'big government is bad; the only good government
is a small government' and 'self-regulation' and 'private industry
always does it best'. Even after more than 35 years of spectacular
failures these nutjobs still think they are on to something grand."
I not that by defining the ones who are doing this to us as "they" you too are not part of
that group. So how instead of us the masses being silence, do we get to have our say and not be
beholden tho the relatively few you refer to as "they"?
political ranger > Eduard Hiebert
2 hours ago
Sorry Ed, I don't know what you've written. Extensively or otherwise. Please state your thesis,
perhaps not so extensively.
I'm not advocating bloodshed, nor to be clear, do I advocate more of the status quo. We quite
clearly need a more immediate method of making culture-wide change.
How? I don't have The Solution, I'm afraid. I have advocated for a strong, aggressive and activist
government. It would likely be their one and only time at bat but perhaps they might start the
change (for the better) process.
Chris Hedges, from the US, a much more dysfunctional society than ours, sees violent revolution
as the only way forward with many, many losers and his side being the winner. I'm in favour of
that outcome but I fear it's far from certain who will be the winner while it is absolutely certain
that there will be many losers.
Without some immediate and significant change to our way of life both the natural environment
and the social environment will soon reach a tipping point. Then there will no end to the missing
people and carnage and wasted resources.
anthony rose
5 hours ago
In my opinion:
I see what is going on at the Tyee. Any one who has anything that does not fit the pr-ordained
narrative regarding Jeff Rubin, is deleted. Why?
Jeff Rubin is a man who predicted peak oil of $200 USD 10 years ago. He was wrong then and
he is likely wrong now. Why do you accept his ideas as correct all the time? What happened to
journalistic ethics and objectivity? So sad.
political ranger > anthony rose
5 hours ago
read his report.
It's chock full of facts, figures and statistics about all kinds of things that in his OPINION
leads to a decline in the petro-biz in Albaturda.
If you disagree with any of the aforementioned facts, figures and statistics; well let fly, we'd
love to hear about it. Some of us are, after all, here in the Tyee, data junkies and logic zombies
always looking for our next fix. Tell us what data is deficient and what should replace it or
what flaw in the argument could lead to a different conclusion.
If you have a different opinion, don't hold back. We've heard just about everything from your
kind. There is always a chance that one of you will actually make some sense.
anthony rose > political ranger
2 hours ago
In my opinion:
Here is a link to an article entitled: Jeff Rubin gets peak oil wrong from Canadian Business:
www.canadianbusiness.co
by the way what do you mean by the phrase : " from your kind"?
anthony rose > political ranger
an hour ago
In my opinion:
My point is that I bought into Mr. Rubin's $200 dollar peak oil forecast. He had lots of facts
and figures then too. He was still completely wrong.
He may be completely wrong again today.
Again I ask what you meant by your phrase " From your kind?" ›
Jack Lumber
Oil will boom again. Global consumption continues to rise, but the global glut has stalled
investment on new extraction. So our extraction levels will flatten out, but consumption will
still rise. Eventually it will catch up. Hopefully it does so slowly, or there could be a future
energy crisis.
"... This is a very questionable assumption. Supply/demand dynamics, especially reckless financing of shale in the USA was a factor (as in "crisis of overproduction" - if we remember classic Marxist term ;-), but this is only one and probably not decisive contributing factor. Paper oil, HFT, Saudis oil damping and Western MSM and agencies (Wild cries "Oil Glut !!!", "OMG Oil glut !!!" supported by questionable statistics from EIA, IEA and friends) were equally important factors. It you deny this you deny the reality. ..."
"... I agree, but this not the whole story. Western MSM went to crazy pitch trying to amplify Saudi animosities and to play "young reckless prince" card toward Iran and Russia. Do you remember the interview the prince gave to Bloomberg just before the freeze ? Do you think that this was accidental? ..."
"... definitely $50-$60 price band is not enough to revive the US shale. LTO is dead probably on any level below $80 and may be even above this level. That does not exclude "dead chicken bounce". Moreover LTO is already played card for financial industries. In reality it probably needs prices above $100 to fully recover. ..."
"... neoliberals still dominates in Russia. Especially oil and economics ministries. Reading interviews of Russian oil officials is pretty depressing. They swallow and repeat all the Western propaganda one-to-one. Unfortunately. In this area they have a lot to learn from Americans :-). ..."
"... At the same time, increasing the volume of high additional value products such as plastics, rubber, composites, etc is in best Russia's interest. It is difficult to achieve though. I think creating the ability to withhold substantial amount of oil from the markets for the periods of say 6 to 12 month is more important. And here they can get some help from OPEC members, Saudi be damned. ..."
"... This is a tricky balancing solution, but still this is some insurance against the price slumps like the current one, when Russia was caught swimming naked and did not have any viable game plan. It is unclear what is the optimal mix, but in no way this 100% or even 80% raw oil. ..."
I doubt that Russian will so easily forgive the West the current price slump and sanctions.
Remember it was Russia which was one on the main initiators of "freeze" the US and EU managed
to derail.
My impression is that Russia wants to process most of its oil internally which will reduce
the amount of oil available for export significantly. That's now semi-official policy.
Production figures are less meaningful in this context then export volumes and are like a smokescreen
on the eminent move to oil shortages on world markets.
Yes, production might be stable or slowly declining. But exports will not be stable. They will
be declining. Now what ?
1) The current oil price slump is due to supply/demand dynamics, not to western conspiracies.
This is very well understood by Russian officials.
2) The Doha deal was torpedoed by Saudi Arabia, primarily due to its conflict with Iran and
the intention to defend market share.
3) The output freeze deal was intended at changing the sentiment in the market and prevent
further decline in oil prices. This objective was achieved: oil prices are up 70% from February
lows, which is partly due to the talks between Russia, Saudi Arabia and others that started in
February.
Nobody expected the Doha deal to help oil prices to return to $100 levels, as an output freeze
is not an output cut. Besides, the agreement should have been non-binding and there was no mechanism
to control its implementation.
An increase in oil prices well above $50 this year is not in Russia's or Saudi interest, as
it could reverse the declining trend in LTO output. Russia's government officials, management
of oil companies and experts generally think that rebalancing of the oil market should be left
to market forces, and any attempts to artificially cut supply would be counter-productive. Therefore,
nobody saw the failure of the Doha agreement as a tragedy, particulalry as prices are already
at acceptable levels.
3) Russia's oil policy is driven by economic considerations. Cutting oil exports (and hence
foreign currency revenues) in order to "punish" the West is like shooting yourself in the foot.
4) As Russian oil production was increasing in the past 15 years, and domestic demand remained
relatively stable, the country has been ramping up exports of both crude oil and refined products.
Upgrading oil refining capacity means that Russian oil companies are able to increase the share
of refined products in total exports at the expense of crude oil.
This results in changing structure of liquid fuel exports, not in the decrease in its combined
volume. In fact, the structure of petroleum exports depends on comparative profitability of crude
and product exports. Sometimes it is more profitable to export crude rather than diesel or fuel
oil.
The current oil price slump is due to supply/demand dynamics, not to western conspiracies
This is a very questionable assumption. Supply/demand dynamics, especially reckless financing
of shale in the USA was a factor (as in "crisis of overproduction" - if we remember classic Marxist
term ;-), but this is only one and probably not decisive contributing factor. Paper oil, HFT,
Saudis oil damping and Western MSM and agencies (Wild cries "Oil Glut !!!", "OMG Oil glut !!!"
supported by questionable statistics from EIA, IEA and friends) were equally important factors.
It you deny this you deny the reality.
Remember the key Roman legal principle "cue bono". And who in this case is the prime suspect?
Can you please answer this question.
And please remember that the originator of the word "conspiracies" was CIA (to discredit those
who questioned the official version of JFK assassination).
2) The Doha deal was torpedoed by Saudi Arabia, primarily due to its conflict with Iran
and the intention to defend market share.
I agree, but this not the whole story. Western MSM went to crazy pitch trying to amplify
Saudi animosities and to play "young reckless prince" card toward Iran and Russia. Do you remember
the interview the prince gave to Bloomberg just before the freeze ? Do you think that this was
accidental?
BTW I agree that this was a huge win of Western diplomacy and "low oil price forever" forces.
An increase in oil prices well above $50 this year is not in Russia's or Saudi interest,
as it could reverse the declining trend in LTO output.
Nonsense. First of all mankind now needs oil above $100 to speed up the switch to hybrid cars
for personal transportation, and Russia and Saudi are the part of mankind.
It is also in best Russia's and Saudi economic interests, contrary to what you read on Bloomberg
or similar rags. World oil production is severely damaged by low oil prices and 1MB/d that shale
it can probably additionally produce in best circumstances is not that easy to achieve after this
slump.
And definitely $50-$60 price band is not enough to revive the US shale. LTO is dead probably
on any level below $80 and may be even above this level. That does not exclude "dead chicken bounce".
Moreover LTO is already played card for financial industries. In reality it probably needs prices
above $100 to fully recover.
For probably the next five-seven years everybody will be too shy in financing shale and other
high risk oil production ventures. So the oil price will probably set a new record. After that
we will have another round of "gold rush" in oil as institutional memory about the current oil
price slump will gradually evaporate. Neoliberalism is an unstable economic system, you can bet
on that.
Russia's oil policy is driven by economic considerations. Cutting oil exports (and hence
foreign currency revenues) in order to "punish" the West is like shooting yourself in the foot.
Nonsense. No nation politics is driven only by economic consideration but Russia stupidly or
not tried to play the role of stable, reliable oil and gas supplier to people who would betray
you for a penny. And sometimes this desire to play nice with the West led to betraying its own
national interests.
If I were Putin I would create strategic reserves and divert part of oil export to them to
sell them later at higher prices. Buy low, sell high: is not this a good strategy :-)
Or play some other card by artificially restricting export of oil to Western Europe to refined
products (and to please the USA, as it so badly wanted Russia to restrict supplies to EU to damage
their long time strategic partner :-) and let the EU face consequences of their own polices.
But this is probably not a possibility as neoliberals still dominates in Russia. Especially
oil and economics ministries. Reading interviews of Russian oil officials is pretty depressing.
They swallow and repeat all the Western propaganda one-to-one. Unfortunately. In this area they
have a lot to learn from Americans :-).
Exports are reliable hard currency stream. But it not a stable stream, as Russia recently discovered.
At the same time, increasing the volume of high additional value products such as plastics,
rubber, composites, etc is in best Russia's interest. It is difficult to achieve though. I think
creating the ability to withhold substantial amount of oil from the markets for the periods of
say 6 to 12 month is more important. And here they can get some help from OPEC members, Saudi
be damned.
Upgrading oil refining capacity means that Russian oil companies are able to increase
the share of refined products in total exports at the expense of crude oil.
This is a tricky balancing solution, but still this is some insurance against the price
slumps like the current one, when Russia was caught swimming naked and did not have any viable
game plan. It is unclear what is the optimal mix, but in no way this 100% or even 80% raw oil.
"... There are rumored to be a couple more multi-billion dollar bankruptcies being filed next week. As I have stated, I was not paying attention in 1986. I feel that things are worse in this bust than in 1998-1999. ..."
"... Well, the '86 bust was bloody terrible for me; I had kids in university then. Of course it was much worse for some of the other guys. At least my wife had her teaching/research job in Sweden so we managed. On a personal level I'd say it depends on where you're sitting. Sometimes I feel like a shit babbling on here when some very smart, productive and capable people, like you, are in the thick of it. ..."
There are rumored to be a couple more multi-billion dollar bankruptcies being filed next
week. As I have stated, I was not paying attention in 1986. I feel that things are worse in this
bust than in 1998-1999.
Wonder if there is a way to determine which of the three busts has been the worst so far (I
do not think the current one is over yet, it could last quite a while)?
Well, the '86 bust was bloody terrible for me; I had kids in university then. Of course
it was much worse for some of the other guys. At least my wife had her teaching/research job in
Sweden so we managed. On a personal level I'd say it depends on where you're sitting. Sometimes
I feel like a shit babbling on here when some very smart, productive and capable people, like
you, are in the thick of it.
"... Russia is not planning to significantly ramp production capacity. Energy Minister Novak said today that the country will be able to maintain long-term production levels within the range 525-545 million tons per year (10.5-10.9 mb/d). That's what Russian officials were saying earlier. ..."
"... According to the Saudi officials, planned expansion of the Khurais and Shaybah oil fields will only compensate for falling output at other fields. They claim that the country's "maximum sustainable output capacity is 12 million barrels per day and the nation's total capacity is 12.5 million bpd", but there are no plans to increase capacity and there is no evidence that this capacity really exists. ..."
Russia is not planning to significantly ramp production capacity.
Energy Minister Novak said today that the country will be able to maintain long-term production
levels within the range 525-545 million tons per year (10.5-10.9 mb/d). That's what Russian officials
were saying earlier.
According to the Saudi officials, planned expansion of the Khurais and Shaybah oil fields will
only
compensate for falling output at other fields. They claim that the country's "maximum sustainable
output capacity is 12 million barrels per day and the nation's total capacity is 12.5 million
bpd", but there are no plans to increase capacity and there is no evidence that this capacity
really exists.
I think that in reality Saudi Arabia is able to increase crude production from the current
10.2 mb/d to 10.5-10.6 mb/d during the peak season for local demand in the Summer, but not well
above those levels.
I agree with AlexS's assessment. In short, no not much further
increase in output will come from Russia and Saudi Arabia, certainly not
until oil prices rise above $70/b in 2018, and perhaps never.
The combined output of Russia and KSA will remain within +/- 2 Mb/d of
2015 C+C output levels until 2020 in my view.
"... …Since the start of 2015, 130 North American oil and as producers and service companies have filed for bankruptcy owing almost $44 billion, according to law firm Haynes & Boone. The tally doesn't include Chaparral Energy Inc., Penn Virginia Corp. and Linn Energy LLC, which filed for bankruptcy this week owing more than $11 billion combined." ..."
"... They survived by selling shares, junk bonds and flipping leases against a background of relentless/stupid hype. People were desperate to believe; finance lent and that was all that mattered … and matters today. ..."
"... A few more months of low(ish) prices and the hype will be unmasked as fraud. Two years = 730 tomorrows. How many more before utopia arrives … ? ..."
"... Never. $45/barrel = too low for drillers yet it is still too high for (broke) customers who would rather spend the spare change they have left on alcohol and beignets. ..."
OIL AT $45 A BARREL PROVING NO SAVIOR AS BANKRUPTCIES PILE UP
"Three bankruptcies this week shows that $45 a barrel oil isn't enough to rescue energy companies
on the verge of collapse…
…Since the start of 2015, 130 North American oil and as producers and service companies have
filed for bankruptcy owing almost $44 billion, according to law firm Haynes & Boone. The tally
doesn't include Chaparral Energy Inc., Penn Virginia Corp. and Linn Energy LLC, which filed for
bankruptcy this week owing more than $11 billion combined."
Not surprising as some (most) of these firms were underwater @ $110/barrel.
They survived by selling shares, junk bonds and flipping leases against a background of relentless/stupid
hype. People were desperate to believe; finance lent and that was all that mattered … and matters
today.
A few more months of low(ish) prices and the hype will be unmasked as fraud. Two years = 730
tomorrows. How many more before utopia arrives … ?
Never. $45/barrel = too low for drillers yet it is still too high for (broke) customers who
would rather spend the spare change they have left on alcohol and beignets.
"... We just did some work on the EIA/IHS report on well costs that came out a little while ago. We suspect that these longer peaking wells may be possible due to lower service costs. Operators have switched to natural sand, and lots of it. Not being an engineer, this is only an educated guess, but the general gist I can gather is that natural sand crushes more easily than artificial ceramic proppant, but is significantly cheaper. ..."
"... Our assumption on the interests of operators like CLR and WLL is that they currently want to maximise short-term production to boost revenue, and they care significantly less about maximising recovery. Using lots of natural sand fits in with that – though the sand will be crushed more quickly than if artificial proppant will be used, more fractures will be propped open in the short term. ..."
"... Many of these short term production gains may be given up shortly after any price increase, as the service costs will also rise, and the short term revenue considerations will become less important. That's the theory we're working under currently, anyway… ..."
Great comment, Enno, as ever. It's important to remember that the EIA's
forecasts seem to generally be very "smooth", and their models are mostly
done at an economic level, meaning they aren't working from number of wells
upwards. This meant they completely missed the beginning of the production
decline – their initial forecasts kept on adding ~30kbpd a month to Bakken
until April15, for example. Now they are a little to heavy to the downside.
We just did some work on the EIA/IHS report on well costs that came
out a little while ago. We suspect that these longer peaking wells may be
possible due to lower service costs. Operators have switched to natural
sand, and lots of it. Not being an engineer, this is only an educated guess,
but the general gist I can gather is that natural sand crushes more easily
than artificial ceramic proppant, but is significantly cheaper.
Our assumption on the interests of operators like CLR and WLL is
that they currently want to maximise short-term production to boost revenue,
and they care significantly less about maximising recovery. Using lots of
natural sand fits in with that – though the sand will be crushed more quickly
than if artificial proppant will be used, more fractures will be propped
open in the short term.
Many of these short term production gains may be given up shortly
after any price increase, as the service costs will also rise, and the short
term revenue considerations will become less important. That's the theory
we're working under currently, anyway…
The decline after peak of new wells appears to be significantly steeper
than previous years, so when companies claim 40% IP increase = 40% EUR increase,
one should be extremely skeptical. By month 7 of production, the average
2014 well had produced 18% more oil than the average 2010 well at the same
stage of its life – but by month 26, that difference was down to 7.6%. In
month 3, the average 2014 well had produced nearly 9% more than the average
2013 well – by month 26, that was down to 2%. Those are total cumulative
oil produced figures, btw.
"... the global industrial machine seems to be running now on the EROEI of what? Deep sea/shale oil EROEI? Which is what? 20:1? 15:1? ..."
"... To be clear by negative EROEI I mean negative vs the needs of the society. This happens well before EROEI drops to 1:1 or less I'd suggest it depends on the complexity of the society at what level it enters a situation that it can no longer sustain itself. ..."
"... The simple calculation of how many people are involved in actually planting and harvesting that leads to and assertion that 1-2% of the population are farmers is simply bullshit. It does not include the gene engineers at Monsanto or the fertilizer or tractor manufactures nor does it include the prepared food industry needed to process the centralized food stores etc etc etc. My best guess is at least 30% of the population is indirectly involved in the food industry from frozen foods to actual farming. ..."
"... So if everyone else supported the energy and other commodity industries like metals you need at least a 2:1 EROEI to break even . Of course outside of food the rest of the various core industries have their own support pyramids just guess that they are 10% each. ..."
"... This leads to a ballpark figure of 10:1 for the minimum energy industry direct EROEI before the society structure as a whole is negative . ..."
"... It is essential to realize that energy is the life blood of a society. Sustainability amounts to providing a sustainable renewable energy technology, a technology that harvests energy (corrected for entropy) from the sun in real time and that returns more energy than is consumed to install it, operate it, maintain it, maintain its storehouses of natural material capital, prevent or repair environmental damage including aesthetic damage, and support the community that it serves. ..."
"... we must begin to think of society as a system the purpose of which is to maintain the flow of high-grade renewable energy. Let us begin with a thought experiment … http://eroei.net/sustainability.htm ..."
"... The damage to marine and coastal environments associated with the Macondo Prospect blowout is substantial. Commercial fisheries production and economic losses to the coastal tourism sector are expected to cost tens of billions of dollars. Including such costs in the analysis would likely cause the Macondo Prospect EROI to be negative. ..."
"... 'Ultra-Deepwater Gulf of Mexico Oil and Gas: Energy Return on Financial Investment and a Preliminary Assessment of Energy Return on Energy Investment' ..."
"... "Caelan why are you such a downer these days?" ~ Aws ..."
Hi guys, I have a question that follows from my
previous post .
To carry over a quote:
"Think of a society dependent upon one resource: its domestic oil. If the EROI for this
oil was 1.1:1 then one could pump the oil out of the ground and look at it. If it were
1.2:1 you could also refine it and look at it, 1.3:1 also distribute it to where you want to
use it but all you could do is look at it . Hall et al. 2008 examined the
EROI required to actually run a truck and found that if the energy included was enough
to build and maintain the truck and the roads and bridges required to use it, one would need
at least a 3:1 EROI at the wellhead.
Now if you wanted to put something in the truck, say some grain, and deliver it, that would
require an EROI of, say, 5:1 to grow the grain . If you wanted to include
depreciation on the oil field worker, the refinery worker, the truck driver and the farmer
you would need an EROI of say 7 or 8:1 to support their families . If the
children were to be educated you would need perhaps 9 or 10:1, have health care 12:1,
have arts in their life maybe 14:1, and so on . Obviously to have a modern civilization
one needs not simply surplus energy but lots of it, and that requires either a high EROI or
a massive source of moderate EROI fuels."
That quote, the global industrial machine seems to be running now on the EROEI of what?
Deep sea/shale oil EROEI? Which is what? 20:1? 15:1?
So my main question is; what might it be, roughly, and what kind of change for EROEI would
we guesstimate over what timeframe?
IOW, how soon do you think the global fossil fuel supply might begin to breach, say,
an EROEI threshold of 10:1? Also, given price-production-destruction, would it accelerate?
Where's Jeffrey Brown, by the way?
"To be clear by negative EROEI I mean negative vs the needs of the society. This happens
well before EROEI drops to 1:1 or less I'd suggest it depends on the complexity of the society
at what level it enters a situation that it can no longer sustain itself.
Simpler societies can probably get away with very low EROEI's since simplicity simply means
most members of society are themselves involved in energy/food procurement. Then net gain or
complexity level is trivial to determine its the amount of food/energy they produce in excess
of what they can consume.
More complex societies both make the required net gain larger and
make it more difficult to calculate the minimum. I've tried using the concept of the typical
support pyramid for a core industry to calculate the minimum EROEI. The idea is that you take
a key industry say for example farmers and determine how many people are needed to directly
support the modern farmer.
The simple calculation of how many people are involved in actually
planting and harvesting that leads to and assertion that 1-2% of the population are farmers
is simply bullshit. It does not include the gene engineers at Monsanto or the fertilizer or
tractor manufactures nor does it include the prepared food industry needed to process the centralized
food stores etc etc etc. My best guess is at least 30% of the population is indirectly involved
in the food industry from frozen foods to actual farming.
We changed the nature of the work
but I'd argue it has not really fallen from its low of 40% just the work has changed from direct
planting. On top of this you have additional support industries such as housing for those in
the food industry and cars and doctors etc every modern person uses a very generic set of services
regardless of what the core industry is that creates the initial wealth. I make a WAG that
this adds 10-20% to the total bring the number of people that make a living off of food up
close to 50% of the population.
So if everyone else supported the energy and other commodity industries like metals
you need at least a 2:1 EROEI to break even . Of course outside of food the
rest of the various core industries have their own support pyramids just guess that they are
10% each.
This leads to a ballpark figure of 10:1 for the minimum energy industry direct EROEI
before the society structure as a whole is negative . You can cut down my estimate
for food but I worked pretty hard at it and was surprised how much of the worlds economy is
directly then indirectly related to supplying food. And I don't think its wrong. And even if
I'm off its easy to imagine that other industries can certainly command a bigger part of the
economic pie then I've allocated bottom line is you can come up with about 10:1 or
15:1 repeatedly using various estimates of our support pyramid for our modern economies
.
If right and your paper is right and we have dropped into the 3-5:1 range then one would
expect that the economy would fall into a collapse rivaling the Great Depression in magnitude."
~ memmel
Presumably, the reason no one uses ERoEI* is that no one has heard of it. I am too busy with my
better-than-hopeless projects to go around hyping ERoEI*, regarding which I began my latest attempt
to write a clear definitive discussion of sustainability as follows:
It is essential to realize that energy is the life blood of a society. Sustainability amounts
to providing a sustainable renewable energy technology, a technology that harvests energy (corrected
for entropy) from the sun in real time and that returns more energy than is consumed to install
it, operate it, maintain it, maintain its storehouses of natural material capital, prevent or
repair environmental damage including aesthetic damage, and support the community that it serves.
If we wish to define a ratio of Energy Returned over Energy Invested (ERoEI*) that will indicate
a sustainable alternative energy technology if and only if it is greater than 1.0, we must begin
to think of society as a system the purpose of which is to maintain the flow of high-grade renewable
energy. Let us begin with a thought experiment …
http://eroei.net/sustainability.htm
I'll get back to your comment later today, Thomas, but a little bit coincidentally, I just came
across these shocking numbers that are not even factored in apparently! (Which may make EROEI
an even more difficult subject.)
"Another indirect cost not accounted for in this study includes the cost of the loss of
the value of ecosystem services as a result of federal offshore energy production. Air and
water pollution attributed to the oil and gas industry are market externalities that in reality
have costs borne by society.
Ecosystem degradation in the form of wetland loss, partly as a result of oil and gas industry
infrastructure, has increased the risk of natural disasters to coastal communities. Batker
et al. carried out a partial assessment of the value of ecosystem services of the Mississippi
River delta. They reported an annual value of ecosystem services of $12 to $47 billion
and a minimum natural capital asset value of the delta of $330 billion to $1.3 trillion. [!?!!]
The damage to marine and coastal environments associated with the Macondo Prospect blowout
is substantial. Commercial fisheries production and economic losses to the coastal
tourism sector are expected to cost tens of billions of dollars. Including such costs in the
analysis would likely cause the Macondo Prospect EROI to be negative. Ecosystem service
values are largely outside the scope of the market economy, thereby discounting their importance
to society." ~ Matthew Moerschbaecher 1,2,* and John W. Day Jr., 'Ultra-Deepwater Gulf
of Mexico Oil and Gas: Energy Return on Financial Investment and a Preliminary Assessment of
Energy Return on Energy Investment'
"Caelan why are you such a downer these days?" ~
Aws
OIL AT $45 A BARREL PROVING NO SAVIOR AS BANKRUPTCIES PILE UP
"Three bankruptcies this week shows that $45 a barrel oil isn't enough to rescue energy companies
on the verge of collapse…
…Since the start of 2015, 130 North American oil and as producers and service companies have
filed for bankruptcy owing almost $44 billion, according to law firm Haynes & Boone. The tally
doesn't include Chaparral Energy Inc., Penn Virginia Corp. and Linn Energy LLC, which filed for
bankruptcy this week owing more than $11 billion combined."
Not surprising as some (most) of these firms were underwater @ $110/barrel.
They survived by selling shares, junk bonds and flipping leases against a background of relentless/stupid
hype. People were desperate to believe; finance lent and that was all that mattered … and matters
today.
A few more months of low(ish) prices and the hype will be unmasked as fraud. Two years = 730
tomorrows. How many more before utopia arrives … ?
Never. $45/barrel = too low for drillers yet it is still too high for (broke) customers who
would rather spend the spare change they have left on alcohol and beignets.
"... Total oil production in North Dakota Bakken fell to 1057 kb/d in March, a monthly drop of 8 kb/d. Decline in February-March was only 10 kb/d. Cumulative decline from December 2014 peak level is 107 kb/d (-9%). ..."
"... as Shallow Sand pointed out: "It surprised me that production in ND didn't fall much when Mr. Helms stated there would be a dramatic drop." ..."
Total oil production in North Dakota Bakken fell to 1057 kb/d in March, a monthly drop of 8
kb/d.
Decline in February-March was only 10 kb/d. Cumulative decline from December 2014 peak level is 107 kb/d (-9%).
The chart below shows that both the EIA Drilling Productivity Report and the EIA/DrillingInfo
monthly LTO production statistics tend to underestimate the resilience of tight oil production,
at least in the case of the Bakken. The EIA estimates for February and March will likely be revised
upward. I think that even bigger upward revisions will be done for the Eagle Ford.
Bakken oil production statistics: NDIC data vs. the EIA reports (kb/d)
Early March oil production numbers show that North Dakota will likely drop below 1.1 million
barrels per day for the first time since June 2014, the state's top oil regulator said.
An official update will be released next week, but Director of Mineral Resources Lynn Helms told
an oil industry group in Williston he expects to see a "severe" production drop.
"It's going to be bad," Helms told the Williston Basin chapter of the American Petroleum Institute
Tuesday night."
In fact, the decline was not as big as was expected and total ND oil production (incl. conventional)
in March was 1109 kb/d.
The chart below does not show any acceleration in monthly decline rates:
Year-on-year and month-on-month growth/decline rates in Bakken North Dakota oil production
(%)
"... We just did some work on the EIA/IHS report on well costs that came out a little while ago. We suspect that these longer peaking wells may be possible due to lower service costs. Operators have switched to natural sand, and lots of it. Not being an engineer, this is only an educated guess, but the general gist I can gather is that natural sand crushes more easily than artificial ceramic proppant, but is significantly cheaper. ..."
"... The decline after peak of new wells appears to be significantly steeper than previous years, so when companies claim 40% IP increase = 40% EUR increase, one should be extremely skeptical. By month 7 of production, the average 2014 well had produced 18% more oil than the average 2010 well at the same stage of its life – but by month 26, that difference was down to 7.6%. In month 3, the average 2014 well had produced nearly 9% more than the average 2013 well – by month 26, that was down to 2%. Those are total cumulative oil produced figures, btw. ..."
coming back to your comment at the end of last post:
" The chart below shows that both the EIA Drilling Productivity Report and the EIA/DrillingInfo
monthly LTO production statistics tend to underestimate the resilience of tight oil production,
at least in the case of the Bakken. The EIA estimates for February and March will likely be
revised upward. I think that even bigger upward revisions will be done for the Eagle Ford."
The small declines in Feb & March is indeed surprising. Based on the new well count, and on
2015 1H well profiles, I expected declines around 20-25kbo/d. It does appear that the average
well that started in the 2nd half of 2015 behaves quite differently, peaking for a few months
longer than usual. This is caused for a large part by wells from Burlington, XTO, CLR & QEP. That
has messed a bit with my projections, and probably also the EIA. If those wells had behaved more
like earlier wells, ND production would be at least 20 kbo/d lower in March.
Questions in my mind now are:
How will these "higher for longer" flow rates behave over the next couple of months?
Will we see the same behavior in all new wells?
Will we see something similar in other basins?
I think you could be right about those upward revisions. To me it shows that there is quite
some new uncertainty caused by these changing dynamics.
Thanks very much, that's really surprising. Perhaps they are using some new completion
techniques? Will try to find something in companies' presentations.
Great comment, Enno, as ever. It's important to remember that the EIA's forecasts seem to generally
be very "smooth", and their models are mostly done at an economic level, meaning they aren't working
from number of wells upwards. This meant they completely missed the beginning of the production
decline – their initial forecasts kept on adding ~30kbpd a month to Bakken until April15, for
example. Now they are a little to heavy to the downside.
We just did some work on the EIA/IHS report on well costs that came out a little while ago.
We suspect that these longer peaking wells may be possible due to lower service costs. Operators
have switched to natural sand, and lots of it. Not being an engineer, this is only an educated
guess, but the general gist I can gather is that natural sand crushes more easily than artificial
ceramic proppant, but is significantly cheaper.
Our assumption on the interests of operators like CLR and WLL is that they currently want to
maximise short-term production to boost revenue, and they care significantly less about maximising
recovery. Using lots of natural sand fits in with that – though the sand will be crushed more
quickly than if artificial proppant will be used, more fractures will be propped open in the short
term.
Many of these short term production gains may be given up shortly after any price increase,
as the service costs will also rise, and the short term revenue considerations will become less
important. That's the theory we're working under currently, anyway…
The decline after peak of new wells appears to be significantly steeper than previous years,
so when companies claim 40% IP increase = 40% EUR increase, one should be extremely skeptical.
By month 7 of production, the average 2014 well had produced 18% more oil than the average 2010
well at the same stage of its life – but by month 26, that difference was down to 7.6%. In month
3, the average 2014 well had produced nearly 9% more than the average 2013 well – by month 26,
that was down to 2%. Those are total cumulative oil produced figures, btw.
The EIA's International Energy Outlook 2016 is out today
The new projections imply 1% annual-average growth in global liquids consumption for the period
2012-2040, including virtually zero growth in the OECD countries and 1.9% annual average growth in
non-OECD countries.
World liquids consumption by region, Reference case (mb/d)
Thanks for the chart Alex. I fail to see any exponential growth in renewables, (other in this
case and that includes hydro and geothermal), or any exponential shrinkage in liquids. I think
the EIA would have a strong disagreement with Dennis. :-)
Ron,
Assuming that growth in hydro is very low, other renewables are likely to increase at a high rate,
but from a very low base. So fossil fuels will retain their dominating position in total energy
consumption. That's a common view among all key energy forecasting agencies
"I think the EIA would have a strong disagreement with Dennis."
"... Daniel Katzenberg, a senior analyst at Robert W. Baird, says investors aren't worried about profits as much as production. Quarter after quarter, the output of Pioneer's new horizontal wells has exceeded expectations, and that's why the stock price keeps rising. "What the market sees is that they're sitting on one of the most attractive and economic resource plays in the world," says Katzenberg. "Pioneer is tasked with proving their acreage is as good as the hype." ..."
"... I like this way of thinking: "investors aren't worried about profits as much as production". However absurd it sounds, that is true. There is a class of investors that aren't worried about profits. Same can be said about investors in Tesla: "investors aren't worried about profits as much as new EV technologies". ..."
"... New financing will be tough for survivors, and debt overhand will not dissipate any time soon. As for investors putting money into questionable companies (that Alex used as a counterargument) this is just throwing good money after bad. Most of those "new" investors are already up to the neck in this s**t and are afraid to write down holdings. So they decided to double down hoping that rising oil price will bail them out. ..."
"... Nothing new here. America became the nation of speculators, big and small, so a new sucker is born every minute. They expect that the rising tide will lift all boats. And they already forgot lessons of 2008: I do not think investors memory (as a class) lasts more then five years. So a new bubble and related fraud can have any period larger then five years. Almost eight year passed from previous crash, so it's about time to milk those suckers again :-) ..."
"... I think there will observable divergence between oil price rise and energy mutual funds/ETFs price rise. The latter will rise more slowly as bankruptcies might spoil the show. ..."
"... US Production is falling (substantially) and rigs are still declining so obviously "investors" are not interested in production either. So Mr Katzenberg is talking baloneys. There are no investors. This just last gasps of money printing. You can see the cracks everywhere. ..."
"... "If oil prices average $40 per barrel, U.S. shale oil production will likely decline by 3 million barrels per day between 2015 and 2020, and even if oil prices reach $60 per barrel, a decline is still imminent, according to the International Energy Agency (IEA). US shale production is not expected to halt the decline until we reach prices of $70 per barrel over the same period." ..."
"... There will be time in a year when EIA will report the same and Wall Street will proclaim "We are shocked. No one could have predicted this". Same old same old. ..."
US E&Ps were able to sell 10 billion not for the purpose of investing but for hiding the losses
for little bit longer. That shale business model is dead.
But investors don't think so.
Despite all those bankrupcies, they continue to invest in shale players, particularly in those
who continue to increase production volumes.
A good example is Pioneer, which is up almost 60% from 52-week lows.
Interesting quotes from an article in Bloomberg:
"The company, meanwhile, is spending a lot of money now in the belief that oil prices will
soon rise. Not everyone thinks it will pay off. Criticizing shale drillers at the Sohn Investment
Conference a year ago, David Einhorn singled out Pioneer, in which he has a short position, as
the "Mother-Fracker." Einhorn, president of Greenlight Capital, argued that Pioneer lost $12 for
every barrel it developed over the previous nine years. "That's like using $50 bills to counterfeit
$20s," he said.
…………………….. Daniel Katzenberg, a senior analyst at Robert W. Baird, says investors aren't worried about
profits as much as production. Quarter after quarter, the output of Pioneer's new horizontal wells
has exceeded expectations, and that's why the stock price keeps rising. "What the market sees
is that they're sitting on one of the most attractive and economic resource plays in the world,"
says Katzenberg. "Pioneer is tasked with proving their acreage is as good as the hype."
I like this way of thinking: "investors aren't worried about profits as much as production".
However absurd it sounds, that is true. There is a class of investors that aren't worried about
profits. Same can be said about investors in Tesla: "investors aren't worried about profits as
much as new EV technologies".
Dead - no. Severely squeezed - yes. New financing will be tough for survivors, and debt
overhand will not dissipate any time soon. As for investors putting money into questionable companies
(that Alex used as a counterargument) this is just throwing good money after bad. Most of those
"new" investors are already up to the neck in this s**t and are afraid to write down holdings.
So they decided to double down hoping that rising oil price will bail them out.
Nothing new here. America became the nation of speculators, big and small, so a new sucker
is born every minute. They expect that the rising tide will lift all boats. And they already forgot
lessons of 2008: I do not think investors memory (as a class) lasts more then five years. So a
new bubble and related fraud can have any period larger then five years. Almost eight year passed
from previous crash, so it's about time to milk those suckers again :-)
I think there will observable divergence between oil price rise and energy mutual funds/ETFs
price rise. The latter will rise more slowly as bankruptcies might spoil the show.
" Daniel Katzenberg, a senior analyst at Robert W. Baird, says investors aren't worried
about profits as much as production"
Alex,
" investors aren't worried about profits as much as production".
Is this America? Profits are not important? Well if investors are not worried about profits
than what is this? Charity, non-profit think-tank venture?
US Production is falling (substantially) and rigs are still declining so obviously "investors"
are not interested in production either. So Mr Katzenberg is talking baloneys. There are no investors.
This just last gasps of money printing. You can see the cracks everywhere.
Tesla is different. Tesla is still in hype 'stage" considering the number of vehicles sold..
You can run up Tesla stock so high just outside solar system and crash back and nobody will notice
a thing. Oil is different because all 7 billions of us are using it.
"If oil prices average $40 per barrel, U.S. shale oil production will likely decline by
3 million barrels per day between 2015 and 2020, and even if oil prices reach $60 per barrel,
a decline is still imminent, according to the International Energy Agency (IEA). US shale
production is not expected to halt the decline until we reach prices of $70 per barrel over the
same period."
IEA is completely disagreeing with anyone who is still claiming that shale has life below $70.
And you know what is interesting is that that 2 years ago IEA & EIA were singing the same song
but at this point IEA is splitting with that narrative because it is so obvious that you cannot
hide it anymore.
There will be time in a year when EIA will report the same and Wall Street will proclaim
"We are shocked. No one could have predicted this". Same old same old.
"... Linn Energy LLC filed for chapter 11 bankruptcy after reaching a deal with lenders to restructure its $8.3 billion debt load and obtain $2.2 billion in fresh financing. In its bankruptcy filing press release, Linn announced that the holders of more than 66 percent of its credit facility have agreed to the "broad terms" of a debt restructuring but didn't provide further details. ..."
"... energy producer Penn Virginia also filed for chapter 11 bankruptcy protection Thursday. And just like Linn, the Pennsylvania-based explorer and producer deals said it had reached a prepackaged agreement with holders of 87 percent, or $1.03 billion, ..."
In the first case, oil and gas producer Linn Energy LLC filed for chapter 11 bankruptcy after
reaching a deal with lenders to restructure its $8.3 billion debt load and obtain $2.2 billion in
fresh financing. In its bankruptcy filing press release, Linn announced that the holders of more
than 66 percent of its credit facility have agreed to the "broad terms" of a debt restructuring
but didn't provide further details. The lenders also agreed to let Linn Energy spend the cash
securing their debt, known as cash collateral, and to help fund a new $2.2 billion term loan.
... ... ...
In the day's second bankruptcy, energy producer Penn Virginia also filed for chapter 11
bankruptcy protection Thursday. And just like Linn, the Pennsylvania-based explorer and producer
deals said it had reached a prepackaged agreement with holders of 87 percent, or $1.03 billion,
of its total funded-debt obligations to restructure under chapter 11 protection and eliminate
long-term debt by more than $1 billion.
"... And just think. Linn Energy, only a month or two ago, maxed out their line of credit, paid the upper crust extra bonuses and 18 months pay. I wonder what they saw coming? So is this good luck or fraud? ..."
Linn Energy Files for Bankruptcy, SandRidge Misses Quarterly Filing
HOUSTON, May 11 (Reuters) – Linn Energy filed for bankruptcy on Wednesday, and SandRidge Energy
Inc said it could not file quarterly results in a timely manner, the latest sign of the turmoil
a deep price crash has caused among small firms in the U.S. oil and gas sector.
Linn's filing for creditor protection brings to about 60 the number of U.S. oil and gas
companies to go bankrupt since oil prices entered a slide in mid-2014.
And just think. Linn Energy, only a month or two ago, maxed out their line of credit, paid
the upper crust extra bonuses and 18 months pay.
I wonder what they saw coming? So is this good luck or fraud?
I shake my head sometimes, when it come to white collar crime, because this is just criminal
in any view of the law, other than the letter of the law!
This might be a new factor in US-Saudi relations, which indirectly might affect the price of oil....
Notable quotes:
"... Rep. Brad Sherman (D-Calif.) is criticizing the Obama administration as having tried to strong-arm a former senator who is pushing to declassify 28 pages of the 9/11 report dealing with Saudi Arabia. He recounted how Rep. Gwen Graham (D-Fla.) and her father, former Senate Intelligence Committee Chairman Bob Graham (D-Fla.), were detained by the FBI in 2011 at Dulles International Airport outside Washington. The message from the agents, according to the Grahams, was to quit pushing for declassification of the 28 pages. The FBI "took a former senator, a former governor, grabbed him in an airport, hustled him into a room with armed force to try to intimidate him into taking different positions on issues of public policy and important national policy, and the fact that he wasn't intimidated because he was calm doesn't show that they weren't trying to intimidate him," Sherman said in an interview with The Hill's Molly K. Hooper. ..."
"... If a nation expects to be ignorant & free, in a state of civilization, it expects what never was & never will be. The functionaries of every government have propensities to command at will the liberty & property of their constituents. There is no safe deposit for these but with the people themselves; nor can they be safe with them without information. Where the press is free and every man able to read, all is safe. ..."
"... The reason I believe the "28 pages" are so important is because it unquestionably demonstrates that senior members of the U.S. government care more about the public perception of Saudi Arabia, and protecting its terrorist spawn, than cares about the public interest. Indeed, focus on these pages is already beginning to achieve just that. ..."
"... A former Republican member of the 9/11 commission, breaking dramatically with the commission's leaders, said Wednesday he believes there was clear evidence that Saudi government employees were part of a support network for the 9/11 hijackers and that the Obama administration should move quickly to declassify a long-secret congressional report on Saudi ties to the 2001 terrorist attack. ..."
"... "There was an awful lot of participation by Saudi individuals in supporting the hijackers, and some of those people worked in the Saudi government," Lehman said in an interview, suggesting that the commission may have made a mistake by not stating that explicitly in its final report. "Our report should never have been read as an exoneration of Saudi Arabia." ..."
"... The 9/11 commission chairman, former Republican governor Tom Kean of New Jersey, and vice-chairman, former Democratic congressman Lee Hamilton of Indiana, praised Saudi Arabia as, overall, "an ally of the United States in combatting terrorism" and said the commission's investigation, which came after the congressional report was written, had identified only one Saudi government official – a former diplomat in the Saudi consulate in Los Angeles – as being "implicated in the 9/11 plot investigation". ..."
"... "Only one Saudi government official." Can you believe this? Meanwhile, that official was merely deported from the U.S. without ever being charged with a crime. More proof that the Saudis and bankers have been granted their own separate "justice" system. ..."
"... In the interview Wednesday, Lehman said Kean and Hamilton's statement that only one Saudi government employee was "implicated" in supporting the hijackers in California and elsewhere was "a game of semantics" and that the commission had been aware of at least five Saudi government officials who were strongly suspected of involvement in the terrorists' support network. ..."
"... The commissioner said the renewed public debate could force a spotlight on a mostly unknown chapter of the history of the 9/11 commission: behind closed doors, members of the panel's staff fiercely protested the way the material about the Saudis was presented in the final report, saying it underplayed or ignored evidence that Saudi officials – especially at lower levels of the government – were part of an al-Qaida support network that had been tasked to assist the hijackers after they arrived in the US. ..."
"... Zelikow fired a staffer, who had repeatedly protested over limitations on the Saudi investigation, after she obtained a copy of the 28 pages outside of official channels. Other staffers described an angry scene late one night, near the end of the investigation, when two investigators who focused on the Saudi allegations were forced to rush back to the commission's offices after midnight after learning to their astonishment that some of the most compelling evidence about a Saudi tie to 9/11 was being edited out of the report or was being pushed to tiny, barely readable footnotes and endnotes. The staff protests were mostly overruled. ..."
"... Zelikow, the commission's executive director, told NBC News last month that the 28 pages "provide no further answers about the 9/11 attacks that are not already included in the 9/11 commission report". Making them public "will only make the red herring glow redder". ..."
"... This from the guy who led the charge to intentionally whitewash the Saudi role and intentionally deceive the American public. Yet these people call Edward Snowden a traitor. ..."
"... But Kean, Hamilton and Zelikow clearly do not speak for a number of the other commissioners, who have repeatedly suggested they are uncomfortable with the perception that the commission exonerated Saudi Arabia and who have joined in calling for public release of the 28 pages. ..."
"... It's impossible to read the above and not conclude that senior U.S. government officials were, and continue to be, more interested in protecting their Saudi "allies" than providing justice for the thousands of innocents killed on 9/11 ..."
Rep. Brad Sherman (D-Calif.) is criticizing the Obama administration as having tried
to strong-arm a former senator who is pushing to declassify 28 pages of the 9/11 report dealing
with Saudi Arabia.
He recounted how Rep. Gwen Graham (D-Fla.) and her father, former Senate Intelligence
Committee Chairman Bob Graham (D-Fla.), were detained by the FBI in 2011 at Dulles International
Airport outside Washington. The message from the agents, according to the Grahams, was to quit
pushing for declassification of the 28 pages.
The FBI "took a former senator, a former governor, grabbed him in an airport, hustled
him into a room with armed force to try to intimidate him into taking different positions on issues
of public policy and important national policy, and the fact that he wasn't intimidated because
he was calm doesn't show that they weren't trying to intimidate him," Sherman said in an interview
with The Hill's Molly K. Hooper.
Critics of my repeated focus on highlighting the Saudi role in 9/11 claim that anything revealed
in the "28 pages" will be marginal at best, leaving many of the most important questions surrounding
the attacks shrouded in secrecy. I agree. What I disagree with is the conclusion
that aggressively pursuing a declassification of the 28 pages is therefore meaningless.
There's almost always a underlying reason behind my relentless pursuit of certain topics. One
of the key purposes of this website is to chronicle the myriad examples of U.S. government lies,
corruption and criminality on behalf of a handful of insiders at the expense of the citizenry. This
is because I agree wholeheartedly with Thomas Jefferson when he
wrote to Charles Yancey :
If a nation expects to be ignorant & free, in a state of civilization, it expects what
never was & never will be. The functionaries of every government have propensities to command
at will the liberty & property of their constituents. There is no safe deposit for these but with
the people themselves; nor can they be safe with them without information. Where the press is
free and every man able to read, all is safe.
The shadow government and its minions treat the general public as stupid malleable serfs, because
for the most large part, they are. This unfortunate state of affairs has been achieved over the decades
through absurd government propaganda slavishly peddled to the masses via mainstream media outlets.
The internet has allowed tens of millions to wake up, but hundreds of millions are necessary in order
to turn this thing around and bring forth an era of freedom, progress, creativity and spiritual renaissance.
This will never happen until people start to question and confront the unimaginably maniacal status
quo.
The reason I believe the "28 pages" are so important is because it unquestionably demonstrates
that senior members of the U.S. government care more about the public perception of Saudi Arabia,
and protecting its terrorist spawn, than cares about the public interest. Indeed, focus
on these pages is already beginning to achieve just that.
A former Republican member of the 9/11 commission, breaking dramatically with the commission's
leaders, said Wednesday he believes there was clear evidence that Saudi government employees were
part of a support network for the 9/11 hijackers and that the Obama administration should move
quickly to declassify a long-secret congressional report on Saudi ties to the 2001 terrorist attack.
The comments by John F Lehman, an investment banker in New York who was Navy secretary in the
Reagan administration, signal the first serious public split among the 10 commissioners since
they issued a 2004 final report that was largely read as an exoneration of Saudi Arabia, which
was home to 15 of the 19 hijackers on 9/11.
"There was an awful lot of participation by Saudi individuals in supporting the hijackers,
and some of those people worked in the Saudi government," Lehman said in an interview,
suggesting that the commission may have made a mistake by not stating that explicitly in its final
report. "Our report should never have been read as an exoneration of Saudi Arabia."
He was critical of a statement released late last month by the former chairman and vice-chairman
of the commission, who urged the Obama administration to be cautious about releasing the full
congressional report on the Saudis and 9/11 –
"the 28 pages" , as they are widely known in Washington – because they contained "raw, unvetted"
material that might smear innocent people.
The 9/11 commission chairman, former Republican governor Tom Kean of New Jersey, and vice-chairman,
former Democratic congressman Lee Hamilton of Indiana, praised Saudi Arabia as, overall,
"an ally of the United States in combatting terrorism" and said the commission's investigation,
which came after the congressional report was written, had identified only one Saudi government
official – a former diplomat in the Saudi consulate in Los Angeles – as being "implicated in the
9/11 plot investigation".
"Only one Saudi government official." Can you believe this? Meanwhile, that official was merely
deported from the U.S. without ever being charged with a crime. More proof that the Saudis and bankers
have been granted their own separate "justice" system.
Meanwhile, it's not even true…
In the interview Wednesday, Lehman said Kean and Hamilton's statement that only one
Saudi government employee was "implicated" in supporting the hijackers in California and elsewhere
was "a game of semantics" and that the commission had been aware of at least five Saudi government
officials who were strongly suspected of involvement in the terrorists' support network.
The commissioner said the renewed public debate could force a spotlight on a mostly unknown
chapter of the history of the 9/11 commission: behind closed doors, members of the panel's
staff fiercely protested the way the material about the Saudis was presented in the final report,
saying it underplayed or ignored evidence that Saudi officials – especially at lower
levels of the government – were part of an al-Qaida support network that had been tasked to assist
the hijackers after they arrived in the US.
In fact, there were repeated showdowns, especially over the Saudis, between the staff and the
commission's hard-charging executive director, University of Virginia historian Philip Zelikow,
who joined the Bush administration as a senior adviser to the secretary of state, Condoleezza
Rice, after leaving the commission. The staff included experienced investigators from the FBI,
the Department of Justice and the CIA, as well as the congressional staffer who was the principal
author of the 28 pages.
Zelikow fired a staffer, who had repeatedly protested over limitations on the Saudi
investigation, after she obtained a copy of the 28 pages outside of official channels. Other staffers described an angry scene late one night, near the end of the investigation,
when two investigators who focused on the Saudi allegations were forced to rush back to the commission's
offices after midnight after learning to their astonishment that some of the most compelling evidence
about a Saudi tie to 9/11 was being edited out of the report or was being pushed to tiny, barely
readable footnotes and endnotes. The staff protests were mostly overruled.
However, the commission's final report was still widely read as an exoneration, with a central
finding by the commission that there was "no evidence that the Saudi government as an institution
or senior Saudi officials individually" provided financial assistance to Osama bin Laden's terrorist
network. The statement was hailed by the Saudi government as effectively clearing Saudi officials
of any tie to 9/11.
Zelikow, the commission's executive director, told NBC News last month that the 28 pages "provide
no further answers about the 9/11 attacks that are not already included in the 9/11 commission
report". Making them public "will only make the red herring glow redder".
This from the guy who led the charge to intentionally whitewash the Saudi role and intentionally
deceive the American public. Yet these people call Edward Snowden a traitor.
But Kean, Hamilton and Zelikow clearly do not speak for a number of the other commissioners,
who have repeatedly suggested they are uncomfortable with the perception that the commission exonerated
Saudi Arabia and who have joined in calling for public release of the 28 pages.
It's impossible to read the above and not conclude that senior U.S. government officials were,
and continue to be, more interested in protecting their Saudi "allies" than providing justice
for the thousands of innocents killed on 9/11 . It should make everyone infinitely more
distrustful of our crooked government.
If that's all the "28 pages" drama achieves, I'd call that a success.
"... In the last decade, North America's $40-billion fracking industry has punctured uneconomic or "unconventional" rock formations from British Columbia to Texas with long lateral wells that extend for miles underground. ..."
"... Then they blast open the surrounding formation with injections of water, chemicals, sand, fluids, or hydrocarbons. But industry can't always control the direction of the fractures. ..."
A new Texas study has found that horizontal oil wells fractured by the injection of high
volumes of chemicals, sand, and water contaminate nearby water wells with a variety of heavy
metals and toxic chemicals that fluctuate over time.
In the last decade, North America's $40-billion fracking industry has punctured uneconomic
or "unconventional" rock formations from British Columbia to Texas with long lateral wells
that extend for miles underground.
Then they blast open the surrounding formation with injections of water, chemicals,
sand, fluids, or hydrocarbons. But industry can't always control the direction of the fractures.
"In our most recent study, we found that as more unconventional wells were drilled and stimulated,
more drilling-related contaminants were found in the groundwater," study author Zacariah L.
Hildenbrand told The Tyee.
"... Why someone was investing in those cash-negative companies at the bottom of the cycle? And why they will not be investing when oil price will rise to $50 with prospects of further growth? ..."
"... US E&Ps were able to sell 10 billion not for the purpose of investing but for hiding the losses for little bit longer. That shale business model is dead. ..."
US E&Ps were able to sell about $10 billion in equity in 1Q16, most of it in January-February,
when oil price was around $30 and Goldman Sachs and others were predicting $20. Why someone
was investing in those cash-negative companies at the bottom of the cycle? And why they will not
be investing when oil price will rise to $50 with prospects of further growth?
Cost deflation will not continue in 2017 as demand for drillling and fracking services will
start to gradually recover.
US E&Ps were able to sell 10 billion not for the purpose of investing but for hiding the losses
for little bit longer. That shale business model is dead.
"... Something just does not make sense to me. They are saying that at current production levels, they can supply oil for the next 165 years. So why do they have to diversify? I can almost see it if they said that they wanted more citizens to be employed. But, they are diversifying into industrial jobs. Chemical plant joint ventures. Their huge shipbuilding effort to produce tanker and "oil rigs," etc. Those jobs will be filled largely by foreign workers and robots. ..."
"... IMHO this young prince currently in power is a typical adventurist. He is an excellent illustration of the danger of absolute monarchy or any too high concentration of power in single hands :-) ..."
"... If so, why on Earth they are selling their strategic resource for peanuts? Is this kind of madness or what? Unless their plan is to move royal family to France. And even in this case it is a stupid plan. ..."
Something just does not make sense to me. They are saying that at current production levels,
they can supply oil for the next 165 years. So why do they have to diversify? I can almost see
it if they said that they wanted more citizens to be employed. But, they are diversifying into
industrial jobs. Chemical plant joint ventures. Their huge shipbuilding effort to produce tanker
and "oil rigs," etc. Those jobs will be filled largely by foreign workers and robots.
If they said that they were going to establish a "silicon valley" of the Mid-east, well, I
could see that. Teach their kids high-tech skills.
Since they have already "found" the oil, and have the infrastructure in place, it would be
highly likely that if the world reduced consumption to 10 million bbl/day, that it would all come
from Saudi Arabia. Their costs would just always be far below anyone else.
World demand is currently nearly 96 million barrels (oil and liquid fuels) per day or say 35 billion
barrels per year. Do you think it's likely world consumption can be reduced to 10 million bbl/day?
And, perhaps Saudi pronouncements are best taken with a grain of sand, sorry, salt.
Saudi pronouncements are best taken with a grain of sand, sorry, salt.
IMHO this young prince currently in power is a typical adventurist. He is an excellent
illustration of the danger of absolute monarchy or any too high concentration of power in single
hands :-)
Other then religious tourism (which brings less then 10 billion a year) all their efforts are
just reshuffling the chairs of the deck of Titanic. Remove oil and gas and they are bankrupt and
probably will not last long as an independent nation.
If so, why on Earth they are selling their strategic resource for peanuts? Is this kind
of madness or what? Unless their plan is to move royal family to France. And even in this case
it is a stupid plan.
Russia is bleeding hard currency but still its oil industry is the best shape among OPEC
nations, despite low oil prices and sanctions. It might well be that Russia will preserve the level
of oil production which it reached in 2015 in 2016.
While discussing major factors influencing the oil market at the Forum, the speakers agreed
the geopolitics have become an essential factor, although the condition of the world economy and
market forces along with the technological advancement seemed to still be taking a lead in
driving oil prices.
"We must understand that the oil prices cannot change drastically because we are now reaching the
projected output level that we set out to achieve with the investments that we historically made
six, five, four years ago, and the production cannot be curtailed," said Vagit Alekperov,
LUKoil's Chief Executive Officer. According to Alekperov, last year LUKoil spent 300 billion
rubles on investments in the industry, and 112 billion rubles of investments in the first quarter
of 2016.
Related: ISIS Working On Driverless Car Causes More Worry Than Necessary
Alekperov also said that the complex geopolitical situation in the Persian Gulf has caused the
OPEC members from the Middle East to compete harder for their share of the oil market.
"What we see here, is that amidst the oil prices slump the Persian Gulf countries attempt to
increase their production output to cover their budget deficits caused by slashed oil revenues,
including compensating for the part of budget they need for procuring arms", Alekperov noted.
However, LUKoil's CEO believes oil prices are passed their lowest point, and the equilibrium
price should fluctuate around $50 per barrel for the rest of 2016 and first half of 2017. Prices
should then rise in the second half of 2017 as demand begins to exceed supply.
The Chairman of the Russian Union of Industrialists and Entrepreneurs, Alexander Shohin,
described a litany of geopolitical issues affecting oil prices. "The fact that the Saudis
rejected freezing the output blaming it on Iran's absence from the negotiations and its refusal
to cooperate by announcing intention to raise the production back to pre-sanctions level of 5
million bpd plus a couple million bpd on top of that; turmoil in Libya's political situation, and
a lack of a legitimate government there ; let alone the conspiracy plots that impact oil prices
in countries that may be regarded as 'unfriendly'…all this definitely points to a high role of
geopolitics in global oil market," he said.
Some incoherent blah-blah-blah about Saudi "defending their market share" should be ignored, but
new "Margaret Thatcher of Saudi Arabia" is a gambler that pursue very risky policies. He endanger his
own county, by depleting currency reserved, he undermines OPEC. It is interesting what he is getting
in return and from whom.
The new oil minister is another step is Prince Mohammed attempt to take the full control over Saudi
oil
The elephant in the room is the level of depletion of Saudi oil reserves. land reserved probably
are in terminal stages of depletion, but off-shore might still be not. Iran ayatollahs also pursue
suicidal policy of oil production extraction despite low oil prices as if delay in six month really matter in
the longer scheme of things. So Saudi-Iran reginal rivalty was experty played and due to stupidity of
both sides that main winner is the USA, EU, China and Asian tigers.
Notable quotes:
"... Ali al-Naimi was also sympathetic to the concerns of other OPEC member nations in regards to low oil prices. Venezuela and Nigeria, among others, pressed hard for production cuts, or at a minimum, a freeze in output. Al-Naimi was open to this avenue, but Prince bin Salman is more hawkish, and seems to be much more content with a period of low oil prices. Naimi was able to countenance coordinated action with OPEC and non-OPEC producers, including Russia. The young prince is taking a tougher line, particularly when it comes to Iran. In fact, many view his opposition to a deal in Doha as at least in part motivated by the Saudi geopolitical rivalry with Iran. ..."
"... He doesn't feel the economic burden to have to cooperate with OPEC ..."
In a surprise move, Saudi Arabia sacked its long-time oil minister over the weekend, an event
that illustrates the near-total control that the new young Saudi prince has obtained over the country's
energy industry.
For many years, Ali al-Naimi, the outgoing Saudi oil minister, was the voice of Saudi Arabia's oil
industry and policy. Even seemingly insignificant remarks from al-Naimi could move oil prices up
or down. But the 80-year old oil minister has seen his power eclipsed by the 30-year old Deputy Crown
Prince Mohammed bin Salman. In April, when al-Naimi was forced to backtrack on the Doha oil freeze
deal, reportedly at the behest of the Deputy Crown Prince, it was clear that his time at the helm
was coming to an end.
Over the weekend, al-Naimi was pushed out in favor of Khalid al-Falih, the head of the state-owned
oil company Saudi Aramco. The swap was expected and had been previously announced, but the timing
came as a surprise. The move leaves the Deputy Crown Prince with undisputed control over Saudi Arabia's
energy strategy, as well as its broader economy.
... ... ...
Ali al-Naimi was also sympathetic to the concerns of other OPEC member nations in regards
to low oil prices. Venezuela and Nigeria, among others, pressed hard for production cuts, or at a
minimum, a freeze in output. Al-Naimi was open to this avenue, but Prince bin Salman is more hawkish,
and seems to be much more content with a period of low oil prices. Naimi was able to countenance
coordinated action with OPEC and non-OPEC producers, including Russia. The young prince is taking
a tougher line, particularly when it comes to Iran. In fact, many view his opposition to a deal in
Doha as at least in part motivated by the Saudi geopolitical rivalry with Iran.
"Mohammed bin Salman has changed everything," Helima Croft, head of commodities strategy at RBC Capital
Markets, told the WSJ. "He doesn't feel the economic burden to have to cooperate with OPEC."
"... From the Iranian side, I have no doubts that an increase of another 1m barrels a day is precisely what they hope will happen, but the reality will surely be different. For all oil production, whether it is from an independent oil company or a sovereign nation, capital expenditures will determine the increase or decrease that can be achieved. Iran has a decidedly arthritic oil infrastructure, slowed by the lack of Western technology and the impact of a decade of sanctions. Their own economy is too weak to generate anywhere near the capex required to increase another 1 million barrels in the next year, and their overtures to foreign oil companies for leases inside Iran has been met cooly by prime contenders Total (TOT) and Eni (E). There is a lagged amount of already developed barrels that Iran can push onto the global market – perhaps 300,000 barrels a day; but by my reckoning, already 150,000 of those barrels have been added – making their ultimate targets very unlikely indeed to be reached. ..."
"... It wouldn't be consistent to believe that for the last year and a half, the Saudis have been capable of increasing their production by another 20 percent, but have so far kept that potential under wraps. Instead, I am fully of the opinion that the Saudis are near, if not at their full production potential right now. ..."
"... The oil market seems to agree – in February, if the threat of another 3 million barrels of oil hitting the global market had been unleashed, oil might have reached below $20 a barrel; today, oil is getting very close to rallying towards $50 a barrel instead. ..."
In light of the missed opportunity at Doha to curb OPEC production, angry statements have emerged
from both Iran and Saudi Arabia on oil production – the Iranians saying that they cannot be stopped
in increasing their exports another 1m barrels a day in the next 12 months, the Saudi oil minister
in turn threatening to increase production another 2m barrels a day. Both of these statements need
to be taken with not a grain, but a 5-pound bag of salt.
From the Iranian side, I have no doubts that an increase of another 1m barrels a day is precisely
what they hope will happen, but the reality will surely be different. For all oil production, whether
it is from an independent oil company or a sovereign nation, capital expenditures will determine
the increase or decrease that can be achieved. Iran has a decidedly arthritic oil infrastructure,
slowed by the lack of Western technology and the impact of a decade of sanctions. Their own economy
is too weak to generate anywhere near the capex required to increase another 1 million barrels in
the next year, and their overtures to foreign oil companies for leases inside Iran has been met cooly
by prime contenders Total (TOT) and Eni (E). There is a lagged amount of already developed barrels
that Iran can push onto the global market – perhaps 300,000 barrels a day; but by my reckoning, already
150,000 of those barrels have been added – making their ultimate targets very unlikely indeed to
be reached.
The Saudis do not have any of the capex or technology problems that plague the Iranians. But the
question of how much capacity the Saudis actually do have comes into play when they threaten to increase
production by another 2 million barrels. For my entire career in oil, there has always been a dark
question on Saudi 'spare capacity' – How much could the Saudis ultimately pump, if they were willing
to open the spigots up fully? For years, the speculation from most oil analysts was near to 7.5m
or 8m barrels a day – a number that was blown out in the last two years as Saudi production rocketed
above 10m barrels a day.
But the strategy the Saudis have pursued has been clear – they have been working towards full
production and an aggressive fight for market share since the failure of the Vienna OPEC meeting
in November of 2014. It is very difficult to believe that the Saudis have had much, if any, remaining
capacity to easily put on the market since that time, or if any spare capacity could be developed
at all. It wouldn't be consistent to believe that for the last year and a half, the Saudis have been
capable of increasing their production by another 20 percent, but have so far kept that potential
under wraps. Instead, I am fully of the opinion that the Saudis are near, if not at their full production
potential right now.
The oil market seems to agree – in February, if the threat of another 3 million barrels of oil
hitting the global market had been unleashed, oil might have reached below $20 a barrel; today, oil
is getting very close to rallying towards $50 a barrel instead.
Unseasonably hot temperatures, extremely dry conditions and winds of up to 70km/h (44mph)
helped fuel the fire's spectacular growth to 101,000 hectares on Friday – an area more than 10
times the size of Manhattan – up from just 10,000ha earlier in the week.
With temperatures expected to hit 27C (80F) on Saturday, officials said the fire could double in
size by end of the day.
On Friday, Rachel Notley, the premier of Alberta, said Fort McMurray was still trapped in the
grip of the inferno. "The city of Fort McMurray is not safe to return to and this will be true
for a significant period of time," she told the thousands of evacuees scattered across the
province.
The extent of the destruction wreaked by the fire was evident in
a video
uploaded to YouTube on Thursday
. Apparently shot by a firefighter, the footage shows a
devastated landscape dotted with piles of blackened rubble and the burned out frames of pickup
trucks. A thick haze of smoke still hangs overhead, while small fires flare among the ruins.
"As more information comes in, it appears that the impact on production of
the wildfires in Alberta will be significant," said analysts at JBC Energy
in Austria. Analysts noted that Shell shut its Albian Sands mine and Suncor
shut its base plant, while producers Syncrude Canada and Connacher Oil &
also reduced output in the region.
"Taken together this amounts to some
0.5 million b/d of capacity that is currently offline. Infrastructure is
being affected too, with the 560,000 b/d Corridor pipeline shut down and
movement along the 140,000 b/d Polaris pipeline significantly curtailed. On
top of that, trains are not operating near Fort McMurray, according to the
Canadian National Railway," said the analysts.
But the most comprehensive answer so far comes from Morgan Stanley's
Benny Wong who estimates that the total number of offline capacity will be
anywhere between 400 and 500 mbbl/d, with the shut-in expected to last about
10 days, potentially reducing total market output by as much as 5 million
barrels.
"... Americans are driving more than ever before. Vehicle miles traveled (VMT) reached an all-time high of 3.15 trillion miles in February 2016 (Figure 2). VMT have increased 97 billion miles per month (3 percent) since the beginning of 2015 and gasoline sales have increased 187 kbpd (2 percent). The rates of increase are not proportional. ..."
Americans are driving more than ever before. Vehicle miles traveled (VMT) reached an all-time
high of 3.15 trillion miles in February 2016 (Figure 2). VMT have increased 97 billion miles per
month (3 percent) since the beginning of 2015 and gasoline sales have increased 187 kbpd (2 percent).
The rates of increase are not proportional.
... ... ...
From April 2015 to March 2016, oil production decreased 660 kbpd (-7 percent) but net crude oil
imports increased 800 kbpd (+10 percent) (Figure 5).
"... Last year, the seven biggest oil companies in the West only replaced 75 percent of their reserves. This is seriously bad news, especially combined with the fact that many new discoveries made in the last four years have disappointed. ..."
"... In the last four years the industry has seen disappointing - largely gas prone - exploration results, with the volume of liquids discovered annually falling from around 19 billion barrels between 2008 and 2011 to 8 billion barrels between 2012 and 2015 ..."
The third part of the problem is reserves replacement. New exploration is not just a form of art
for art's sake, or a means of expansion to boost bottom lines. It's an essential part of the operations
of an oil business. Oil is finite, and in order to stay profitable, an oil company needs to maintain
a consistent rate of reserves replacement.
And here's more bad news: Last year, the seven biggest oil companies in the West
only replaced 75 percent of their reserves. This is seriously bad news, especially combined with
the fact that many new discoveries made in the last four years have disappointed.
Wood Mac's exploration research vice-president told Offshore magazine that "In the last four years
the industry has seen disappointing - largely gas prone - exploration results, with the volume of
liquids discovered annually falling from around 19 billion barrels between 2008 and 2011 to 8 billion
barrels between 2012 and 2015."
"... Chevron Corp. shut down about 90,000 barrels a day of output following an attack on a joint-venture offshore platform that serves as a gathering point for production from several fields. Even before that strike on Wednesday night, Nigerian oil production had fallen below 1.7 million barrels a day for the first time since 1994, according to data compiled by Bloomberg. ..."
• Strike on Chevron platform cuts output by about 90,000 b/d
• Crude output fell in April to lowest in more than two decades
Nigeria is suffering a worsening bout of oil disruption that has pushed production to the lowest
in 20 years, as attacks against facilities in the energy-rich but impoverished nation increase
in number and audacity.
Chevron Corp. shut down about 90,000 barrels a day of output following an attack on a joint-venture
offshore platform that serves as a gathering point for production from several fields. Even before
that strike on Wednesday night, Nigerian oil production had fallen below 1.7 million barrels a
day for the first time since 1994, according to data compiled by Bloomberg.
"... Third parties like "Drilling Info", BTU Analytics, CERA, etc. provide their looks at the market for very high prices, and as such are much more granular than those from government data providers. As much as they try, they are still limited by the availability of international data and reporting time lags domestically, not to mention their own biases. ..."
"... Inevitably, we will have another price shock – or at minimum an upside surprise. It's unavoidable at this point. Oil never transitions smoothly. Just like all the oil bulls had to be run out during the declining price stage, all the price bears, like Dennis Gartman, will be run out when fundamentals hit them over the head. Gartman, to his credit, will change his tune 180 degrees when he sees the actual data shaping up. That's how he has survived so long and profitably as a trader. ..."
"... My prediction - $80/bbl in 18 months, but it won't last very long. I think $60 - $70/bbl is a healthy range. ..."
I follow oil pretty closely given our exposure. As such, I get frustrated with
many press and news show accounts of the commodity. It gets worse when the pundits
and writers should know better. Frequently inexact terminology leads to misconceptions
and sometimes I see outright falsehoods that completely distort the truth.
As a former oil analyst and professional energy investor, I feel compelled
to take those to task. As a realist, I see that all markets require a difference
of opinion and all investors talk their "book". For this reason, when Jeff Currie
at Goldman Sachs Commodities Group gets on CNBC and opines about future price
movements, I give little notice. Jeff is posturing for his customers' and GSs'
positions. Jeff can spin the story either way and chooses his statistics accordingly...That's
what he is paid very well to do.
Last week (March 28, 2016), I heard Dennis Gartman of the Gartman Letter,
a trader and investor that I respect and have learned much from, spout an outright
falsehood on CNBC. Everyone can have a bad day, but I've been hearing various
versions of this for months. Dennis said in essence that oil prices could not
rise very much because of "all the capped wells that could be brought on line
very rapidly". He predicted no more than $42/bbl this year. He estimated that
at current strip pricing, you could lock in $45/bbl in 12 months, making large
numbers of these "capped" wells profitable. The implication being that at current
prices, the market would be rapidly flooded with new oil.
I'll take the over on price, the under on production and bet all my capital
that I'm right. (Oh, I already did that...). Dennis should know better. For
fun though, I thought I'd like to take apart his thesis.
First, there are no "capped" wells in the U.S. To my knowledge not
one well has been capped due to low prices, especially relatively young horizontal
shale wells. Older wells are capped all the time when production is no longer
sufficient to pay operating expenses for the well. Generally, onshore wells
may cost something in the order of only $2,000 per month to operate. At $40
dollar oil, 3 barrels per day of production (gross) should cover operating costs.
What Dennis is likely referring to is the "Drilled Uncompleted" or DUC well
inventory in the various shale plays. Some estimates have shown as many as 4,000
of these DUCs exist and the numbers are rising. Many pundits cite these DUCs
as an effective ceiling on oil prices.
However, a DUC is very different from Gartman's implied "capped" well. There
are many reasons why a producer would drill and not complete a well. They may
have had a rig under contract, they may want to beat competitors, retain their
or their service companies' good employees, they may be able to hold expiring
acreage, they may just want to see what the rocks look like in a particular
area. However, the most likely reason is that the completion costs of these
wells can amount to over 60 percent of well cost maybe – $3 to $4 million per
well. As such, this investment is very difficult to recoup if a well's flush
initial production is sold at low prices. This is compounded when whole well
pads are completed at the same time to increase efficiency. If you don't like
the price one well gets, six wells coming on line at the same time is worse.
This also flows into the other reasons why this production will not flood
the market, namely the intersection of costs, timing and decline rates.
• Costs – 4,000 wells at even $3 million per well is $12
billion dollars. Given the upheaval among producers, where does Dennis suppose
the $12 billion will come from to "instantly" "uncap" these wells and increase
production? Not from the banks, the high yield market is tight, equity investors
have stepped up for some Permian and Eagle Ford producers, but $12 billion is
a lot of money.
• Time – Let's say that oil prices above $40/bbl equals
a green light for energy producers to attack their DUCs. (There appears to be
no factual basis for this, but let's pretend.) A quick look at C&J energy services,
which controls the country's third largest frac fleet as well as other completion
services, tells part of the story. Today, just over 50 percent of the companies'
fleet is working and the rest is "stacked" or to be retired. The people were
laid off months ago. Clearly, when they get the signal that their customers
want more completion services, they will begin to reactivate some of this idle
iron – one frac fleet at a time. The problem is the C&Js stock price is $1.46
and they have close to $1.2 billion in debt. Where will the money come from
to rehire people, and reactivate idle equipment? After that, will the people
return? Yes, but slowly and at a high cost. What about Baker and Schlumberger?
Both are in better financial shape but their fleets have been stacked also and
at this time, investors are in no mood to hear a company talk about adding capacity.
When these companies return fleets to active status, they will be competing
to hire a smaller pool of laid off workers.
• Decline rates – Wells producing from tight rock or shale
(wells that must be fracked) exhibit steep decline curves on the order of 75
percent during the first year of production. The implication is that producers
are on a never ending treadmill in order to maintain or grow production volumes.
That is, they must complete new wells in order replace the natural declines
from existing wells. There are two critical points associated with these steep
decline curves that pundits like Gartman don't appear to grasp. The first is
that based on current data, the four key liquids rich shale plays have declined
by over 600,000 bopd since their peak of production in March, 2015. This production
is gone. These wells have depleted. They can't be turned back on. The only way
to increase production again is new completions and new wells – in other words
massive new reinvestment. This is very different from past cycles when OPEC
dialed back production by idling a major field or two until demand rebounded.
These OPEC giant and super giant fields are a totally different animal. It's
all about the infrastructure, not the productivity of a single well. The entire
complex can be shut down, reworked, maintenance performed, etc. then turned
back on…more akin to a refinery than typical single or multiple well fields.
But that's another story. Bottom line – that 600,000 bopd is not magically coming
back. It took the onshore industry something like 12 months running flat out
to add those volumes. Given oil prices, it will be quite a while and it will
take higher prices before the industry even gets back to a steady walk, much
less a flat run.
Another key thing to understand about decline curves is that they are continuous
and right now declines are accelerating. However for example purposes, let's
look at the Eagle Ford. There are some 10,000 wells in the Eagle Ford producing
today, and they are all in decline. The EIA estimates the average Eagle Ford
well adds 800 bopd in its first month of production. Last month, Eagle Ford
production is estimated to have declined by 60,000 bopd. That implies that 75
new wells per month must be drilled and completed to just replace this 60,000
bopd. Assuming it takes 15 days to drill a well, that implies around 38 rigs
drilling and around 25 frac fleets running above what is running today! Today,
there are 42 rigs drilling for oil and we estimate 10 – 15 frac fleets running
in the Eagle Ford…so just to replace production, the industry would have to
increase rigs running by nearly 100 percent and frac fleets by 150 – 200 percent.
This would require a massive mobilization of capital and manpower. During this
whole mobilization process, production from existing wells is declining, month
after month. Don't get me wrong, I believe this will happen. However, I know
this won't happen quickly and won't happen at $40/bbl oil, making Gartman's
thesis and pricing argument completely false.
Production data, or lack thereof, is a primary hindrance to clear and transparent
oil fundamentals. The mechanics of the above discussion would be more obvious
if we could measure field production in real time. In fact, production data
in Texas takes some three months to even estimate, and these estimates are often
revised. The same goes for well completion data. The EIA tries to model this
through its "Drilling Productivity Report". However, there are no similar efforts
for the rest of the global oil industry, in fact, OPEC publications use third
party reporting not internal or "real" data from the companies themselves.
In Saudi Arabia, production statistics are a state secret. Not surprisingly,
many countries distort the data to suit their own needs. That's why the IEAs
look at G7 storage data is an important industry statistic. It is widely recognized
that both global demand and supply data is inaccurate, but changes in storage
inventories should reflect supply and demand changes. The only problem with
this approach is they only get data for around 2/3 of the global storage capacity.
This is what led to the recent headlines "800,000 bopd of oil is missing". Supply
estimates exceeded demand estimates by 800,000 bopd during the quarter, yet
storage didn't build, leaving the question of where did the oil go? The answer
is that there never was this extra oil…if it existed, it was burned. More than
likely, both supply and demand estimates were off by that amount.
Third parties like "Drilling Info", BTU Analytics, CERA, etc. provide
their looks at the market for very high prices, and as such are much more granular
than those from government data providers. As much as they try, they are still
limited by the availability of international data and reporting time lags domestically,
not to mention their own biases.
Generally it takes 18 months before the world has a decent picture of supply
and demand. This is little consolation to those trying to do real time analysis
on the direction of prices. That is why I can say categorically "the fix is
in". In other words, fields are declining, meaning investment is far below levels
required just to replace production. The only thing that will change the vector
of these declines is more spending, lots more spending, and the only thing will
spur lots more spending is higher prices. Significantly higher than $40/bbl.
In conclusion, we have a typical commodity price cycle. Prices have dropped
to levels destroying capital, bankrupting businesses, idling massive amounts
of equipment and manpower. The cycle is reversing now. The weekly EIA numbers
are showing steady declines in production (this is a balancing item – not real
production estimates) and also increasing demand – In the United States. The
IEA is showing the same thing in their monthly report that has a decent look
at the G7 countries and attempts to look at the G20. Between these two, there
is a large world with little accurate measurement. China for instance jailed
a Platts reporter for espionage when he tried to put together a fundamental
energy statistics database.
Inevitably, we will have another price shock – or at minimum an upside
surprise. It's unavoidable at this point. Oil never transitions smoothly. Just
like all the oil bulls had to be run out during the declining price stage, all
the price bears, like Dennis Gartman, will be run out when fundamentals hit
them over the head. Gartman, to his credit, will change his tune 180 degrees
when he sees the actual data shaping up. That's how he has survived so long
and profitably as a trader.
But by then it will be too late, the world will want incremental supplies
immediately – yet the industry cannot scale in real time. In order to motivate
producers to get busy and provide incremental supplies, prices must increase
sharply from current levels. My prediction - $80/bbl in 18 months, but it
won't last very long. I think $60 - $70/bbl is a healthy range.
"... In the US, all producers are feeling pain to varying degrees at Q1 prices, less so but still pain at current prices. ..."
"... For some reason investors are very accepting of US oil and gas losses, and only seem to get worried when there are signs that bank lines will be slashed below present balances and/or interest cannot be paid. ..."
"... It is not surprising that oil producers, both in and outside the U.S., "are feeling pain to varying degrees" at the bottom of the cycle. But most of conventional producers have much more affordable debt levels than the shale guys. ..."
"... Very true. And this is a big, I would say, decisive difference. ..."
"Money" suddenly stopped working and that is what market will realize. It is no coincidence
that same thing is happening at the same time to oil, gas, nuclear (it was article about that
on 35 billion Hinckley plant) or Tesla. We are running on fumes
In many "old" industries, "money" is still working. Companies are sticking to prudent financial
policies. BTW, this refers to most conventional oil producers.
Conventional is only losing less than shale per barrel. If they don't replace reserves as even
the most majors didn't last year than that it is just race to the bottom.
In the US, all producers are feeling pain to varying degrees at Q1 prices, less so
but still pain at current prices.
There are a lot of US industries that are showing good earnings. These are across a wide variety
of industries. Also, many of the smaller banks are also showing good results. I do not own large
banks, but have shares in some smaller regional banks, all posted record earnings.
For some reason investors are very accepting of US oil and gas losses, and only seem to
get worried when there are signs that bank lines will be slashed below present balances and/or
interest cannot be paid.
It is not surprising that oil producers, both in and outside the U.S., "are feeling pain
to varying degrees" at the bottom of the cycle.
But most of conventional producers have much more affordable debt levels than the shale guys.
"... that ND general stats show 13012 wells producing in Feb 2016 and 13212 in Oct 2016 (this is net i.e. wells added minus wells shut in), and 5) that taken together these do not indicate that there is any potential for a large production increase in the near or far future. ..."
"... I think we will have to see what happens when oil prices rise to $75/b or so, my expectation is that there will be at least 15,000 more wells completed in the Bakken/Three Forks in the next 10 years or so if oil prices rise to $75/b and remain at that level or higher. ..."
"... I expect ND Bakken/Three Forks output will increase gradually to maybe 1.22 Mb/d (only 60 kb/d above the previous peak) by about 2022 and then will gradually decline. This is under a scenario where the completion rate increases to 155 new wells per month and then gradually declines along with output. Total ERR of about 8.4 Gb and 27k total Bakken/Three Forks wells completed. The scenario requires high oil prices ($155/b in 2015$) by 2020, lower oil prices will mean less output. ..."
"... They know where it is because they searched heavily up to 2012. They didn't stop searching because of the price, or because they had so much acreage they didn't need any more. They stopped because they were hitting dry holes and ran out of places to look. That definitely does mean lack of success at the periphery. ..."
Dennis, I didn't look at well productivity, which is what you seem to be discussing. My points
were:
1) that there is no exploration drilling being conducted at present and that it declined quickly
after 2012 when prices were high, implying that there aren't any areas left worth looking at,
2) that 5 counties had high exploration success and these are the ones now responsible for
almost all production (and actually all in decline) and that the development in each county quickly
followed the exploration, suggesting core areas are key for overall production rates,
3) that other counties have been explored without success and are likely to be unproductive,
4) that ND general stats show 13012 wells producing in Feb 2016 and 13212 in Oct 2016 (this
is net i.e. wells added minus wells shut in), and 5) that taken together these do not indicate
that there is any potential for a large production increase in the near or far future.
If you think productivity increase is going to compensate for overall depletion and lack of
new exploration success then I think you are wrong.
They know where the oil is, there is not much need for exploration. I do not expect well productivity
to continue to increase, the chart was intended to show that there has been no productivity decrease
so far. I agree that at some point the sweet spots will be fully drilled and drilling will need
to move to less productive areas.
When that point is reached we will see new well productivity decrease.
Older low output wells from the non-Bakken formations have been shut in at faster rates due
to low prices, though some may be reactivated as oil prices rise. The NDIC seems to think there
are another 30,000 potential well locations, perhaps they are mistaken, the USGS also thinks there
are that many potential well sites and they could also be wrong.
I think we will have to see what happens when oil prices rise to $75/b or so, my expectation
is that there will be at least 15,000 more wells completed in the Bakken/Three Forks in the next
10 years or so if oil prices rise to $75/b and remain at that level or higher.
I also agree there won't be a large production increase (though we have not defined large).
I expect ND Bakken/Three Forks output will increase gradually to maybe 1.22 Mb/d (only
60 kb/d above the previous peak) by about 2022 and then will gradually decline. This is under
a scenario where the completion rate increases to 155 new wells per month and then gradually declines
along with output. Total ERR of about 8.4 Gb and 27k total Bakken/Three Forks wells completed.
The scenario requires high oil prices ($155/b in 2015$) by 2020, lower oil prices will mean less
output.
Exploration drilling in shale plays is important only in early stages of development. The
geology of the Bakken, Eagle Ford and the Permian is already very well known, and there is
no need for additional exploration. The fact that activity is currently concentrated in the
sweet spots does not mean lack of exploration success in the periphery. Resources are there,
but they are too costly to produce at current oil prices.
They know where it is because they searched heavily up to 2012. They didn't stop searching
because of the price, or because they had so much acreage they didn't need any more. They stopped
because they were hitting dry holes and ran out of places to look. That definitely does mean
lack of success at the periphery.
Chesapeake announced yesterday that it would sell around 42,000 acres in the Stack field in Oklahoma,
which currently produces around 3,800 barrels of oil equivalent per day.
The assets will go to
Newfield Exploration Co. for an estimated price of
$470 million.
Furthermore, due to low oil and gas prices, the company will seek to sell additional assets that
will bring between $500 million and $1 billion in its coffers by the end of the year.
"... It is very easy to destroy an industry. And neoliberals proved to be pretty adept in this task while fattening their valets. In this case the USA oil industry. Generally destruction is a much easier task that building/rebuilding something. Nothing new here, move on. ..."
"... "After me deluge" mentality might eventually lead to some neoliberals hanging from the lamp posts. They consider themselves to be aristocracy, so that will be pretty fitting. ..."
"... "Let them eat cakes" did not work too well in the past. Same with oil shortages. "History Does Not Repeat Itself, But It Rhymes" - Mark Twain. ..."
Judging from price action today there are efforts to kill oil rally. I think if banks profits
from oil trading can drop like a stone, we collectively will be better off. They desperately try
to preserve the unnatural and ultimately destructive level of rent extraction from the oil industry
they've managed to create.
First: Tesla is going to sell so many electric cars so soon, based on their CC from yesterday.
Second: Continental Resources announced a wonderful quarter, and apparently $30 oil and $1.75
natural gas is no big deal.
I need to stop reading conference call transcripts. Never have I seen so much happy talk from
two companies who are in debt up to their eyeballs and posting losses quarter after quarter.
Don't be so silly. Oil price below the cost of production is an anomaly and normalization is inevitable
despite all efforts by Wall Street, the US government and EU to slow down this process to preserve
neoliberal globalization, which is threatened by high oil prices.
They might have a year to run of fumes, but I doubt that more then that. And as a result of
their valiant efforts the normalization might happen at the level above $80/bbl. Then what?
It is very easy to destroy an industry. And neoliberals proved to be pretty adept in this
task while fattening their valets. In this case the USA oil industry. Generally destruction is
a much easier task that building/rebuilding something. Nothing new here, move on.
"After me deluge" mentality might eventually lead to some neoliberals hanging from the
lamp posts. They consider themselves to be aristocracy, so that will be pretty fitting.
"Let them eat cakes" did not work too well in the past. Same with oil shortages. "History
Does Not Repeat Itself, But It Rhymes" - Mark Twain.
Massive debt is now like the sword of Damocles hanging over the whole shale industry. And that
created qualitatively new situation with reaction of the industry on rising oil prices delayed
and more muted then at times of "carpet drilling". Even money to complete DUCs are now a scarce
commodity. Everything goes to debt repayment. In addition many companies will be forced to sell
assets like Chesapeake:
Prices have dropped to levels destroying capital, bankrupting businesses, idling massive
amounts of equipment and manpower. The cycle is reversing now. The weekly EIA numbers are showing
steady declines in production (this is a balancing item – not real production estimates) and
also increasing demand – In the United States.
The IEA is showing the same thing in their monthly report that has a decent look at the
G7 countries and attempts to look at the G20. Between these two, there is a large world with
little accurate measurement. China for instance jailed a Platts reporter for espionage when
he tried to put together a fundamental energy statistics database.
Inevitably, we will have another price shock – or at minimum an upside surprise. It's
unavoidable at this point.
Oil never transitions smoothly. Just like all the oil bulls had to be run out during the
declining price stage, all the price bears, like Dennis Gartman, will be run out when fundamentals
hit them over the head. Gartman, to his credit, will change his tune 180 degrees when he sees
the actual data shaping up. That's how he has survived so long and profitably as a trader.
But by then it will be too late, the world will want incremental supplies immediately
– yet the industry cannot scale in real time. In order to motivate producers to get busy and
provide incremental supplies, prices must increase sharply from current levels.
My prediction – $80/bbl in 18 months, but it won't last very long. I think $60 – $70/bbl
is a healthy range.
"... Suncor said evacuees were welcome at its Firebag oil sands facility, while Canadian Natural Resources Ltd (CNQ.TO) said it was working to ensure any affected CNRL workers and their families could use its camps. ..."
"... Shell Canada (RDSa.L) also said it would open its oil sands camp to evacuees and was looking to use its airstrip to fly out non-essential staff and accommodate displaced residents. ..."
"... Most oil sands facilities are to the north and east of the city. Representatives of Syncrude, CNOOC (0883.HK) subsidiary Nexen Energy and pipeline company Enbridge all said their operations were unaffected. ..."
Alberta is racing to evacuate thousands of people as an uncontrolled wildfire burns near Fort McMurray,
in the heart of Canada's oil sands region, forcing residents to flee north to safety on Tuesday.
Alberta appealed for help from other provinces and Ottawa to help fight the fire and airlift people
from the city. Authorities issued a mandatory evacuation order for all of Fort McMurray, which affects
the city's 80,000 residents.
The 2,650-hectare (6,540-acre) fire, which was discovered on May 1, shifted aggressively with
the wind on Tuesday afternoon to breach city limits. The blaze closed off the main southern exit
from the city, prompting residents to head north towards the oil sands camps
... ... ...
Suncor Energy (SU.TO), whose oil sands operations are closest to the city, said its main
plant, 25 km (16 miles) north of Fort McMurray, was safe, but it was reducing crude production in
the region to allow employees and families to get to safety.
Suncor said evacuees were welcome at its Firebag oil sands facility, while Canadian Natural
Resources Ltd (CNQ.TO) said it was working to ensure any affected CNRL workers and their families
could use its camps.
Shell Canada (RDSa.L) also said it would open its oil sands camp to evacuees and was looking to
use its airstrip to fly out non-essential staff and accommodate displaced residents.
... ... ...
Suncor said evacuees were welcome at its Firebag oil sands facility, while Canadian
Natural Resources Ltd (CNQ.TO) said it was working to ensure any affected CNRL workers and their
families could use its camps.
Shell Canada (RDSa.L) also said it would open its oil sands camp to evacuees and was looking
to use its airstrip to fly out non-essential staff and accommodate displaced residents.
... ... ...
Most oil sands facilities are to the north and east of the city. Representatives of
Syncrude, CNOOC (0883.HK) subsidiary Nexen Energy and pipeline company Enbridge all said their
operations were unaffected.
The fire is the second major one in the oil sands region in less than a year. Last May, wildfires
led to the evacuation of hundreds of workers from the region, and a 9 percent cut in Alberta's
oil sands output.
"... We could make a simple approximation of how much the decline will be in 2016: Production from wells starting in year 1, typically decline somewhere around 59% the next year. Older wells decline in total about 45%. ..."
"... Based on this I estimate that the wells in my dataset will do about ( 1400 * 41% + 1617 * 55% = ) 1463 kbo/d by Dec 2016. Add a little extra due to revisions, improved initial production, and maybe a somewhat slower drop in older production, and I would say that 1600-1800 is a close call, or a drop of about 1.4 mbo/d (not counting the output of any new completions in 2016). ..."
"... Last year, by December, total output from wells starting in 2015 was about that size (1.4 mbo/d). But the rate of completions is probably half (very roughly) the size this year, so the drop till 2016 Dec could be in the order of 700 kbo/d, just from the areas I'm looking at. ..."
U.S. shale producers are returning to unfinished business – completing previously drilled
wells – offering a ray of hope for oilfield service providers battered by the oil slump.
Halliburton Co and Baker Hughes Inc, the world's second and third-largest oilfield services
companies, indicated on Tuesday that they expected a drop in the large number of drilled-but-uncompleted
wells (DUCs) as crude oil prices steady.
Oil is hovering above the $40/barrel mark after having rallied 20 percent in the past month.
This has been enough for several producers to return to the thousands of unfinished wells that
dot shale fields across the United States – essentially to ready them for production.
Devon Energy Corp, Diamondback Energy Inc and SM Energy Co all said on post-earnings calls
on Wednesday that they were completing more wells.
There were 1,732 "abnormal" DUC wells in March – those that hadn't been completed within three
months of drilling – in the top five U.S. shale fields, including Eagle Ford in Texas and Bakken
in North Dakota, according to Alex Beeker, an analyst at energy consultant Wood Mackenzie.
That number is expected to consistently fall through the year.
Next month, for example, Beeker expects the number of such wells to drop by about 400. "We
don't see that volume (of DUCs) continuing to build; and in fact, it's being worked off in
the stream of work that's out there today," Halliburton President Jeff Miller said on Tuesday.
Baker Hughes said it expected oil producers to complete several hundred wells every month
as oil prices climb back into the mid-$50s.
… … …
To be sure, the fledgling recovery in spending won't mean the end of troubles for these
[oil services – AlexS] companies. "Even if DUCs come online, U.S. production will continue
to fall, and until output stops declining, it's going to be a challenging market for oilfield
service companies," said Rob Thummel, a portfolio manager at Tortoise Capital Advisors LLC.
"The number of new wells drilled in the United States has halved from 40,000, and the addition
of a thousand or two thousand wells will not do much to arrest steep declines in shale production."
The title of the article is misleading: "as more wells completed" => no, there will be less
wells completed compared with 2015, only more than are being drilled.
I just made an update on shale production in the US. What I found interesting to see is that
the legacy decline of wells > 1 year was about 50%, each year in the past few years (wells in
the non-Bakken basins decline much faster). For example, wells starting production before 2015,
dropped in total output from around 3.2 in Dec 2014, to 1.6 mbo/d by Dec 2015.
We could make a simple approximation of how much the decline will be in 2016:
Production from wells starting in year 1, typically decline somewhere around 59% the next year.
Older wells decline in total about 45%.
Based on this I estimate that the wells in my dataset will do about ( 1400 * 41% + 1617
* 55% = ) 1463 kbo/d by Dec 2016. Add a little extra due to revisions, improved initial production,
and maybe a somewhat slower drop in older production, and I would say that 1600-1800 is a close
call, or a drop of about 1.4 mbo/d (not counting the output of any new completions in 2016).
Last year, by December, total output from wells starting in 2015 was about that size (1.4
mbo/d). But the rate of completions is probably half (very roughly) the size this year, so the
drop till 2016 Dec could be in the order of 700 kbo/d, just from the areas I'm looking at.
This is not a prediction, just a rough guess at what might be in store.
"... "Mr Sechin warned last week that the current shale boom could be another "dotcom bubble" about to burst after drillers, loaded up on risky debt, and hedge funds piled in to make a quick buck over the last five years." Seems like he was prescient in that observation as well. ..."
"... The elephant in the room is the cost of production which for most countries including the USA and Canada is far higher then the current prices. That means that the wave of bankruptcies and drop in the USA production will continue unabated. The total loss might be above 1 Mb/d for the 2016. Canada also lost some production (currently 0.5 Mb/d due to fires) and needs about $80 for tar sand production to be profitable. Chances that oil price will reach this level in 2016 are slim, so the future of Canadian tar sand oil production is grim. ..."
"... Several oil producing countries are on the verge of bankruptcy (Nigeria, Venezuela, Iraq). Saudi are losing around 100 billion a year in currency reserves while still playing a role of Trojan horse of the West in oil markets. ..."
"... This situation is unsustainable and speculator/HFT driven suppression of oil prices at some point might break and will be replaced by a new price boom. It in highly probable that the price of oil will reach, at least temporary, the level of $55 this year. ..."
"... But oil is a strategic product and high oil prices mean stagnation of Western economies. The key problem is that high oil prices threaten neoliberalism as a social system and derail neoliberal globalization. So they will be fought tooth and nail by the US and the EU elites. That's why agreement to freeze oil production by OPEN was derailed. Another victory of western diplomacy. ..."
Perhaps Igor Sechin is right (Sechin is head of the Russian energy company Rosneft and a close
ally of Putin). In a Telegraph article on 2/2/15, discussing Sechin and the remarks he made at
an oil consortium, the author comments that, "However, the real "haymaker" punch he ( meaning
Sechin ) aimed at the global energy system came with the accusation that oil futures markets
in London and New York, which set the price of the world's most vital energy commodity, are essentially
being rigged by a feral cabal of speculators and traders." That would explain the obvious disconnect
discussed by the author here concerning the red herrings put out by the oil sector. Interesting
as well, in the article mentioned above the author also notes, "Mr Sechin warned last week
that the current shale boom could be another "dotcom bubble" about to burst after drillers, loaded
up on risky debt, and hedge funds piled in to make a quick buck over the last five years." Seems
like he was prescient in that observation as well.
The elephant in the room is the cost of production which for most countries including the
USA and Canada is far higher then the current prices. That means that the wave of bankruptcies
and drop in the USA production will continue unabated. The total loss might be above 1 Mb/d for
the 2016. Canada also lost some production (currently 0.5 Mb/d due to fires) and needs about $80
for tar sand production to be profitable. Chances that oil price will reach this level in 2016
are slim, so the future of Canadian tar sand oil production is grim.
Several oil producing countries are on the verge of bankruptcy (Nigeria, Venezuela, Iraq).
Saudi are losing around 100 billion a year in currency reserves while still playing a role of
Trojan horse of the West in oil markets.
This situation is unsustainable and speculator/HFT driven suppression of oil prices at
some point might break and will be replaced by a new price boom. It in highly probable that the
price of oil will reach, at least temporary, the level of $55 this year.
But oil is a strategic product and high oil prices mean stagnation of Western economies.
The key problem is that high oil prices threaten neoliberalism as a social system and derail neoliberal
globalization. So they will be fought tooth and nail by the US and the EU elites. That's why agreement
to freeze oil production by OPEN was derailed. Another victory of western diplomacy.
Arthur Berman was a very keen observer of shale bubble in the USA until recently. Then something
changed.
"... Iraq: Production at an oilfield near Kirkuk, in northern Iraq, has been stopped after unidentified gunmen set at least two wells on fire on Tuesday night. ..."
"... US: An official update will be released next week, but Director of Mineral Resources Lynn Helms told an oil industry group in Williston he expects to see a "severe" production drop. ..."
"... IPD's prediction comes on the heels of its quarterly sector survey, which estimated Venezuela's oil output tumbled 6.8 percent to 2.59 million bpd in the first quarter compared with the same period of 2015, due to drilling delays, insufficient maintenance, theft, and diluent shortfalls. ..."
"... …Morgan Stanley's Benny Wong … estimates that the total number of offline capacity will be anywhere between 400 and 500 mbbl/d, with the shut-in expected to last about 10 days, potentially reducing total market output by as much as 5 million barrels. ..."
"... Americans are driving more than ever before. Vehicle miles traveled (VMT) reached an all-time high of 3.15 trillion miles in February 2016 Figure 2). VMT have increased 97 billion miles per month (3 percent) since the beginning of 2015 and gasoline sales have increased 187 kbpd (2 percent). The rates of increase are not proportional. ..."
Canada: Taken together this amounts to some 0.5 million [barrels a day] of capacity that is
currently offline. Infrastructure is being affected too, with the 560,000 b/d Corridor pipeline
shut down and movement along the 140,000 b/d Polaris pipeline significantly curtailed.
Lybia: An official at the port told the news agency that tanks at Hariga were 7-10 days away
from hitting their full capacity. This means, Reuters reported, that with no tankers loading oil
at the port, Libya will be forced to shut in about 120,000 bpd of output, which is the export
capacity of the port.
Iraq: Production at an oilfield near Kirkuk, in northern Iraq, has been stopped after unidentified
gunmen set at least two wells on fire on Tuesday night.
US: An official update will be released next week, but Director of Mineral Resources Lynn Helms
told an oil industry group in Williston he expects to see a "severe" production drop.
And all of that is worth a $1.17 of increase on WTI/Brent in the last 24h!!! Really? :-)
Venezuela's oil output may fall to average some 2.35 million barrels-per-day this year, as
the South American OPEC country's cash crunch and shortages weigh on production, according to
energy consulting firm IPD Latin America.
IPD's prediction comes on the heels of its quarterly sector survey, which estimated Venezuela's
oil output tumbled 6.8 percent to 2.59 million bpd in the first quarter compared with the same
period of 2015, due to drilling delays, insufficient maintenance, theft, and diluent shortfalls.
That estimate is a whisker above the 2.53 million bpd Venezuela produced in the first quarter,
according to OPEC numbers. But it marks the first time since the third quarter of 2008 that production
fell in all districts, including the extra-heavy crude Orinoco Belt, IPD added.
"…Analysts noted that Shell shut its Albian Sands mine and Suncor shut its base plant, while
producers Syncrude Canada and Connacher Oil & also reduced output in the region."Taken together
this amounts to some 0.5 million b/d of capacity that is currently offline. Infrastructure
is being affected too, with the 560,000 b/d Corridor pipeline shut down and movement along
the 140,000 b/d Polaris pipeline significantly curtailed. On top of that, trains are not operating
near Fort McMurray, according to the Canadian National Railway," said the analysts.
…Morgan Stanley's Benny Wong … estimates that the total number of offline capacity will
be anywhere between 400 and 500 mbbl/d, with the shut-in expected to last about 10 days, potentially
reducing total market output by as much as 5 million barrels.
Americans are driving more than ever before. Vehicle miles traveled (VMT) reached an all-time
high of 3.15 trillion miles in February 2016 Figure 2). VMT have increased 97 billion miles
per month (3 percent) since the beginning of 2015 and gasoline sales have increased 187 kbpd
(2 percent). The rates of increase are not proportional.
…From April 2015 to March 2016, oil production decreased 660 kbpd (-7 percent) but net crude
oil imports increased 800 kbpd (+10 percent) (Figure 5).
JP Morgan reported that its non-performing loans jumped by 665 percent in the first quarter
from $0.2 to $1.7 billion with most of the bad loans coming from the oil and gas industry. Loans
considered to be a problem are now at $21.2 billion
"... "It's going to be bad," Helms told the Williston Basin chapter of the American Petroleum Institute Tuesday night. North Dakota saw a smaller than expected drop in oil production in February as more companies put fracking crews to work to complete wells and maintain cash flow. ..."
"... March figures, scheduled to be released May 12, are reflecting the more significant production drop Helms had been anticipating. "I think that's a significant milestone," ..."
"... The declining North Dakota oil production – down from the record 1,227,483 barrels per day set in December 2014 – is prompting Helms to reevaluate an earlier projection he made that the state could one day produce 2 million barrels of oil per day. ..."
"... "It's kind of taken away hope of getting to 2 million barrels per day," Helms said. ..."
"... Low oil prices are forcing operators to focus drilling activity only in the core areas of the Bakken where wells have the greatest production. As oil prices recover and drilling expands to other areas of the Bakken, those high-producing wells will be declining, Helms said. ..."
WILLISTON – Early
March oil production numbers show that North Dakota will likely drop below 1.1 million barrels
per day for the first time since June 2014, the state's top oil regulator said. An official update
will be released next week, but Director of Mineral Resources Lynn Helms told an oil industry
group in Williston he expects to see a "severe" production drop.
"It's going to be bad," Helms told the Williston Basin chapter of the American Petroleum
Institute Tuesday night. North Dakota saw a smaller than expected drop in oil production in February
as more companies put fracking crews to work to complete wells and maintain cash flow.
The state produced an average of 1,118,333 barrels of oil per day in February, a 0.4 percent
drop from January, according to preliminary figures released in April. But March figures,
scheduled to be released May 12, are reflecting the more significant production drop Helms had
been anticipating. "I think that's a significant milestone," Helms told the oil industry
group.
The declining North Dakota oil production – down from the record 1,227,483 barrels per
day set in December 2014 – is prompting Helms to reevaluate an earlier projection he made that
the state could one day produce 2 million barrels of oil per day.
"It's kind of taken away hope of getting to 2 million barrels per day," Helms said.
Low oil prices are forcing operators to focus drilling activity only in the core areas
of the Bakken where wells have the greatest production. As oil prices recover and drilling expands
to other areas of the Bakken, those high-producing wells will be declining, Helms said.
The surplus in early 2016 was closer to about 500,000 b/d, he says, and should continue to
fall. "The oversupply in the market is grossly overstated," King says.
A lag in output data is partly due to the high estimates, King says, and surpluses are likely to
be much lower in the coming months as surplus numbers begin to catch up with the real decreases
in supplies. "People are still suggesting it's one million or two million barrels per day-it's
nothing even close to that."
FirstEnergy sees prices for West Texas Intermediate averaging $55 for 2017, then rising to
$66.25 over 2018 and $74 in 2019, according to its quarterly market update. "In 2017 you'll start
to see things look a little bit better," King said. "The market in our view is reaching a
balanced position. Inventories are starting to roll over, demand is doing great and supplies are
coming off-the three basics you need for better pricing."
Some analysts have suggested the gradual rise in WTI prices could trigger a simultaneous rise in
U.S. shale oil production, which would ultimately offset any gains in prices. King said this
scenario was unlikely, as many producers have already locked in their 2016 spending programs, and
capital markets remain tight and the high-yield debt market continues to sputter.
"... Capital spending in the industry has fallen from around $35.7 billion in 2014 to $25 billion in 2015. The report says the only reason capital spending has remained as high as it has is because companies are focused on completing late-stage mining projects. It expects capital spending to drop off even further after 2018 once those projects are completed, with a forecast for 2010 of $17.9 billion. That's a decline of more than 50 per cent. ..."
PetroLMI, a division of Calgary-based Enform, projects the industry will lose between 16,530
and 24,425 jobs in 2016 alone due to the economic slowdown. That's on top of the 28,145 jobs, or
12 per cent, the firm says the industry lost in 2015.
... ... ...
The report blames the drop in capital spending in the industry, which it says is due to the
low oil price environment, for the decline in jobs. Capital spending in the industry has
fallen from around $35.7 billion in 2014 to $25 billion in 2015. The report says the only reason
capital spending has remained as high as it has is because companies are focused on completing
late-stage mining projects. It expects capital spending to drop off even further after 2018 once
those projects are completed, with a forecast for 2010 of $17.9 billion. That's a decline of more
than 50 per cent.
"... 72% of petroleum used is for transportation. 63% of that is light duty
vehicles. So of 90mbod, 40 million barrels are subject to potential substitution
by electric vehicles. The adoption curve need only stay ahead of the decline curve.
..."
"... As an ex Mack Trucks sales person. I always considered SUVs and pickups
as light duty. I agree they will be electrified but it's going to take a little
longer than passenger vehicles. Right now hybrids are much more feasible because
of the more extreme workload they preform. Towing a 10k trailer a couple of hundred
of miles is going to take a lot of juice. ..."
"... America already runs hybrid buses if you consider that electric. To get
were the world needs to be, we're going to need a lot of f'n batteries. Once the
world solves the battery issue, there is not much reason class 8's can't be electrified
starting with local delivery trucks. ..."
Differences of opinion are what make discussion interesting.
72% of petroleum used is for transportation. 63% of that is light
duty vehicles. So of 90mbod, 40 million barrels are subject to potential
substitution by electric vehicles. The adoption curve need only stay ahead
of the decline curve.
Why worry about Caterpillars first when transportation is the biggest
slice of the petroleum pie, and the most readily subject to supercession
by other energy sources?
Transition may be improbable, but that's different than impossible.
Assuming that an ICE is 20% as efficient as an EV, which seems reasonable
as one barrel of oil is energy equivalent to 1628.2kWh, and will produce
19 gallons of gasoline, and 12 gallons of diesel. Assuming 30 mpg economy
for each, the barrel of oil provides 930 miles of travel, while 1628.2 kWh
at 3mpkWh will provide 4,884 miles of travel.
So if the light duty transport fleet was replaced 100% with electric
vehicles, 40.8 mbo/day would require 13.3 TWh of electric power substitution.
We have increased global annual renewable power production by 3,250 TWh's
in the last decade, so to increase renewable power production by 2030 to
produce 13TWh/day to offset 40.8 MBO/day used in the transportation sector
would require that we accomplish in the next fifteen years what we have
accomplished in the last ten (+3,250TWhp/decade).
As for the vehicles, all we must do is replace 100% of the light duty
fleet with EV's in that same 15 years. Easy as pie, right? :-)
As an ex Mack Trucks sales person. I always considered SUVs and pickups
as light duty. I agree they will be electrified but it's going to take a
little longer than passenger vehicles. Right now hybrids are much more feasible
because of the more extreme workload they preform. Towing a 10k trailer
a couple of hundred of miles is going to take a lot of juice.
America already runs hybrid buses if you consider that electric.
To get were the world needs to be, we're going to need a lot of f'n batteries.
Once the world solves the battery issue, there is not much reason class
8's can't be electrified starting with local delivery trucks.
"... "I think we'll see more filings in the second quarter than in the first quarter," ..."
"... U.S. oil and gas companies sold about $350.7 billion in debt between 2010 and 2014, the peak years of the oil-and-gas boom, with junk bonds making up more than 50 percent of all issuance, according to Thomson Reuters data. ..."
LTO companies debt and energy junk bonds problem can't be swiped under the carpet. It is just
too big for that. We are talking about around 350 billion of debt with half on them in junk bonds.
That's probably half of the gain of the US economy from oil prices crash (and, of course, not
all this debt will convert into direct losses; recovery in the range of 20% is still possible).
What form the day of reckoning will take is very difficult to predict. Much depends on debt
repayment schedule and bond maturity dates. But this level of debt completely undermines chances
of quick revival of LTO production in case oil prices jump up, as new capital to finance drilling
will not be here. So any talk about quick revival of the US LTO production as a reaction on higher
oil prices does not take into account the fact that that it will be very difficult to finance
new mass drilling this time. And drilling 1000 wells is around 6 billion. 1500 - 9 billions.
The number of U.S. energy bankruptcies is closing in on the staggering 68 filings seen during
the depths of the telecom bust of 2002 and 2003, according to Reuters data, the law firm Haynes
& Boone and bankruptcydata.com. Charles Gibbs, a restructuring partner at Akin Gump in Texas,
said the U.S. oil industry is not even halfway through its wave of bankruptcies. "I think
we'll see more filings in the second quarter than in the first quarter," he said. Fifteen
oil and gas companies filed for bankruptcy in the first quarter.
… … …
Until recently, banks had been willing to offer leeway to borrowers in the shale sector, but
lately some lenders have tightened their purse strings. A widely predicted wave of mergers
in the shale space has yet to materialize as oil price volatility makes valuations difficult,
and buyers balk at taking on debt loads until target companies exit bankruptcy.
… … …
In the debt market, there are also signs that lots of money could be lost this time around,
especially in high-yield bonds. During its boom, U.S. oil and gas companies issued twice as
much in bonds as telecom companies did in the latter part of the 1990s through the early 2000s.
Between 1998 and 2002, about $177.1 billion in new bonds were sold in the U.S. telecommunications
sector; less than 10 percent were junk bonds. U.S. oil and gas companies sold about $350.7
billion in debt between 2010 and 2014, the peak years of the oil-and-gas boom, with junk bonds
making up more than 50 percent of all issuance, according to Thomson Reuters data.
"... As a warning to investors, EIA (Energy Information Administration) and IEA (International Energy Agency) data is reliable; however, their judgments are politically motivated. ..."
"... Also, there is no "glut" of oil. The market need is to power a 365-day food cycle. The reported "glut" is a storage problem of having 33.8 Days of Supply, 10 days more than the 24 Days of Supply typical for the past decade. ..."
As a warning to investors, EIA (Energy Information Administration) and IEA (International
Energy Agency) data is reliable; however, their judgments are politically motivated. Here is
a graph by the Dallas Federal Reserve on how, year after year, EIA forecasts repeatedly estimated
oil prices would drop as the 2008 economic collapse approached.
...As with failing to warn of higher oil costs in the ramp to the 2008 economic collapse, the
EIA is failing to warn the nation of the economic consequences of Peak Fracking. This provides investors
a knowledge gap.
... ... ...
To better understand oil geology and economics here are two links:
The mega-trends will force oil prices higher much faster than most believe.
Also, there is no "glut" of oil. The market need is to power a 365-day food cycle. The reported
"glut" is a storage problem of having 33.8 Days of Supply, 10 days more than the 24 Days of Supply
typical for the past decade. Economic fragility is created by not having 365 Days of Supply to meet
the needs of a 365-day food cycle; Examples: 1973 Oil Embargo, 1979 Iranian Revolution. Having 33.8
Days of Supply is only a 9% safety factor on a survival need. Take away the 18 Days of Supply required
to fill pipelines and there is a 4% safety margin on a non-elastic survival need. Fragility is extreme.
"... a true crisis is looming-and for the moment, there is no apparent way around it. ..."
"... Wood Mac's exploration research vice-president told Offshore magazine that "In the last four years the industry has seen disappointing - largely gas prone - exploration results, with the volume of liquids discovered annually falling from around 19 billion barrels between 2008 and 2011 to 8 billion barrels between 2012 and 2015." ..."
A
report by Wood Mackenzie has warned the world may face a daily oil shortage of 4.5 million barrels
by 2035. The amount represents around half of the global consumption
estimate of the International Energy Agency (IEA)
for 2016. In other words, a true crisis is looming-and for the moment, there is no apparent way around
it.
The most obvious reason is that energy companies don't want to spend money on exploration when
prices are so disappointingly low. Many of them simply can't afford to spend on exploration if they
want to survive in today's price environment. Ironically, their long-term survival can only be guaranteed
by further exploration spending.
A lot of costly projects have been shelved since the summer of 2014 when oil prices started falling,
with the initial investments basically written off. Reviving these projects will cost more money.
Where this money will come from is unclear-there is no certainty where oil prices are going in the
near term, let alone any longer period, and the European Commission today forecasted $41/barrel oil
for the rest of this year and just over $45 for 2017.
... ... ...
The third part of the problem is reserves replacement. New exploration is not just a form of art
for art's sake, or a means of expansion to boost bottom lines. It's an essential part of the operations
of an oil business. Oil is finite, and in order to stay profitable, an oil company needs to maintain
a consistent rate of reserves replacement.
And here's more bad news: Last year, the seven biggest oil companies in the West
only replaced 75 percent of their reserves. This is seriously bad news, especially combined with
the fact that many new discoveries made in the last four years have disappointed.
Wood Mac's exploration research vice-president told Offshore magazine that "In the last four years
the industry has seen disappointing - largely gas prone - exploration results, with the volume of
liquids discovered annually falling from around 19 billion barrels between 2008 and 2011 to 8 billion
barrels between 2012 and 2015."
"... Oklahoma-based Midstates Petroleum Company and Texas based Ultra Petroleum have now filed for bankruptcy, citing combined debts of more than US$5.8 billion blamed on a long run of low commodity prices that have led to irreparable financial damage ..."
"... According to a recent Deloitte analysis , which examined 500 oil and natural gas exploration and production companies worldwide, 175 of the companies (or around 35 percent) were at high risk of going bankrupt. Together, these companies have more than $150 billion in debt. The report added that the situation is "precarious" for 50 of these companies due to negative equity or leverage ratio above 100. ..."
Two more oil companies have filed for Chapter 11 bankruptcy protection, as crude oil prices
hover just above $45 per barrel and financial woes take their toll.
Oklahoma-based Midstates Petroleum Company and Texas based Ultra Petroleum have now filed for
bankruptcy, citing combined debts of more than US$5.8 billion blamed on a long run of low
commodity prices that have led to irreparable financial damage.
... ... ...
Since early last year, some 70 North American oil and gas companies have filed for bankruptcy.
The numbers aren't stark: They only account for about 1 percent of U.S. output, but there are
fears the trend could pick up pace.
According to a recent
Deloitte analysis , which examined 500 oil and natural gas exploration and production companies
worldwide, 175 of the companies (or around 35 percent) were at high risk of going bankrupt. Together,
these companies have more than $150 billion in debt. The report added that the situation is "precarious"
for 50 of these companies due to negative equity or leverage ratio above 100.
"... In a normal economic environment, we will see the price direction is rather upwards than downwards ..."
"... he low price that we saw in crude oil earlier this year may be the last time we see that for over a decade ..."
"... Even as some shale operators say that they may actually bring on rigs after we hit $50 a barrel, the truth is that many of the smaller operators will find it hard to bring rigs back on ..."
"Crude oil ended the month of April with the strongest monthly gain in 7 years, adding 22% to
the price. The low price caused "production destruction" and strong demand put the market on a
trajectory of market balance."
"We have said that oil prices have bottomed and the chief of the International Energy Agency
(IEA) agrees. "In a normal economic environment, we will see the price direction is rather upwards
than downwards," IEA Executive Director Fatih Birol said on Sunday during a G7 meeting of energy
ministers in Japan as reported by Reuters. He took the words right out of my mouth. Barring any
unforeseen economic catastrophes, the global oil market is at the low end of the cycle. We have
said for some time that now is the time to start positioning for a long term bullish move. The
low price that we saw in crude oil earlier this year may be the last time we see that for over
a decade. "
"Even as some shale operators say that they may actually bring on rigs after we hit $50 a barrel,
the truth is that many of the smaller operators will find it hard to bring rigs back on."
"... Mr Jarand Rystad told a forum yesterday that with oil companies cutting back heavily on investments, the crude oversupply will quickly turn into shortage and, in turn, drive prices up. ..."
"... In his keynote speech at the Offshore Marine Forum yesterday, Mr Rystad, managing director of Norwegian-based energy consulting firm Rystad Energy, added that oil could reach US$105 a barrel by 2020. ..."
"... "This is just a classic commodity cycle… not a structural shift," he said, noting that global oil consumption is still robust, while alternatives such as liquefied natural gas will likely have a visible impact on energy demand patterns only decades later. ..."
"... But the bigger worry, he warned, is that the massive investment cutbacks could lead to another period of cost inflation. "It is very dangerous to start to scale the industry," he said, citing how oil companies are adjusting their capacity to only a quarter of what it needs to be on a sustainable basis. ..."
Oil could rebound to US$60 to US$70 a barrel by the end of this year as increasing demand starts
to cut into the supply glut for the first time in years, according to an industry analyst.
Mr Jarand Rystad told a forum yesterday that with oil companies cutting back heavily on investments,
the crude oversupply will quickly turn into shortage and, in turn, drive prices up.
In his keynote speech at the Offshore Marine Forum yesterday, Mr Rystad, managing director of
Norwegian-based energy consulting firm Rystad Energy, added that oil could reach US$105 a barrel
by 2020.
"This is just a classic commodity cycle… not a structural shift," he said, noting that global
oil consumption is still robust, while alternatives such as liquefied natural gas will likely
have a visible impact on energy demand patterns only decades later.
But the bigger worry, he warned, is that the massive investment cutbacks could lead to another
period of cost inflation. "It is very dangerous to start to scale the industry," he said, citing
how oil companies are adjusting their capacity to only a quarter of what it needs to be on a sustainable
basis.
"Oil companies and oil service companies are laying off too many people. If you're starting to
scale, you will end up with far too low a capacity. Then you'll have to hire new people (when
the industry recovers) and then you're back to the problem of cost inflation."
"... rates are indeed down 30-35%, in some cases 40%. This fact, rather than technological improvements, largely explains lower upstream costs. And current rates are indeed unsustainable, so further cost cuts are very unlikely. ..."
"... I personally think that upstream capex and drilling activity will increase rather slowly and will not reach 2013-14 levels any time soon. Therefore, drilling/services rates will remain well below previous peak levels in the next few years. ..."
rates are indeed down 30-35%, in some cases 40%. This fact, rather than technological improvements,
largely explains lower upstream costs.
And current rates are indeed unsustainable, so further cost cuts are very unlikely.
But rates are down because of weak demand from the E&Ps. If demand surges, so will the
drilling/fracking rates.
I personally think that upstream capex and drilling activity will increase rather slowly
and will not reach 2013-14 levels any time soon. Therefore, drilling/services rates will remain
well below previous peak levels in the next few years.
And I agree that Rystad's LTO production forecast seems too optimistic.
I personally think that upstream capex and drilling activity
will increase rather slowly and will not reach 2013-14 levels any time soon. Therefore, drilling/services
rates will remain well below previous peak levels in the next few years.
I agree. Decisions to cut the US presence were made by some service companies and probably will
not be reversed "on the spot"
Oil price recovery will be gradual and probably slow. There are powerful forces behind "low oil
price forever" regime and they will counterattack sooner or later. This loss of control of oil price
by "paper oil" producers that we saw recently might be temporary. Any reversal will increase uncertainly
and low down recovery of drilling.
Please look at Art presentation - he predicts a leg down for oil prices "soon".
Surge of rates alone might well make $80 instead of $70 to be the minimum realistic price at which
mass drilling can be resumed for LTO. Now everybody is scared as hell (which is visible from rigs
dynamics).
And remember that LTO producers milked their best spots at a loss for more then a year now. Those
spots are gone. So to make modest profits they need higher prices now. As somebody said here that
reminds Toll Brothers strategy after subprime crisis.
"... The future decline rate will depend on many factors including the price of oil, my guess is that it will be between 1.1 percent/year and 4.7 percent/year. At 4.7 percent output in Texas would fall 210 kb/d over the next 12 months, the Bakken may fall about 200 kb/d, the rest of the lower 48 onshore maybe 100 kb/d, for a total decrease in U.S. L48 onshore C+C output of 500 kb/d in 2016. ..."
"... from Feb 2015 to Jan 2016, the decline rate is 7 percent/year, which would result in a 500 kb/d drop in U.S. L48 OS C+C output in the next 12 months if the decline rate remains 7 percent/year and Dean's estimate is correct for Texas. ..."
"... The decline rate from the peak in March 2015 is about 8.1 percent, if that trend continues for all of 2016, L48 OS C+C output will fall by 560 kb/d in 2016, increases in output in the Gulf of Mexico may offset this decline by 100 kb/d, if so U.S. C+C output would fall by 485 kb/d in 2016, assuming Alaska continues its 5 percent/year decline rate. ..."
The future decline rate will depend on many factors including the price of oil, my guess
is that it will be between 1.1 percent/year and 4.7 percent/year. At 4.7 percent output in Texas
would fall 210 kb/d over the next 12 months, the Bakken may fall about 200 kb/d, the rest of the
lower 48 onshore maybe 100 kb/d, for a total decrease in U.S. L48 onshore C+C output of 500 kb/d
in 2016.
An alternative estimate can be found by considering U.S. lower 48 onshore (L48 OS) C+C annual
decline rates.
The chart above replaces the EIA estimate for Texas C+C with Dean's "best guess" for Texas C+C
to estimate U.S. L48 OS C+C output from Feb 2015 to Jan 2016, the decline rate is 7
percent/year, which would result in a 500 kb/d drop in U.S. L48 OS C+C output in the next 12
months if the decline rate remains 7 percent/year and Dean's estimate is correct for Texas.
The decline rate from the peak in March 2015 is about 8.1 percent, if that trend continues
for all of 2016, L48 OS C+C output will fall by 560 kb/d in 2016, increases in output in the Gulf
of Mexico may offset this decline by 100 kb/d, if so U.S. C+C output would fall by 485 kb/d in
2016, assuming Alaska continues its 5 percent/year decline rate.
Prince Muhammad Bin Salman, 30, the deputy crown prince of Saudi Arabia laid out his vision
for Saudi Arabia on Monday in a plan called "Vision 2030." He wants to get Saudi Arabia off
its oil dependence in only 4 years, by 2020, and wants to diversify the economy into manufacturing
and mining.
…As long as Saudi Arabia produces so much petroleum, it is unclear how it can industrialize
in the sense of making secondary goods.
…It ran a $100 bn. budget deficit in 2015. Saudi Arabia has big currency reserves, but I
doubt it can go on like this more than five or six years.
…So it seems to me that the Vision for 2030 is mostly smoke and mirrors… Saudi Arabia probably
cannot replace the money it will lose if oil goes out of style and so is doomed to downward
mobility and very possibly significant instability. It has been a great party since the 1940s;
it is going to be a hell of a hangover.
Prince Muhammad
Bin Salman, 30, the deputy crown prince of Saudi Arabia
laid out his vision for Saudi Arabia on Monday
in a plan called
"Vision 2030." He wants to get Saudi Arabia off its oil dependence
in only 4 years, by 2020, and wants to diversify the economy into
manufacturing and mining.
In an interview with Al Arabiya,
the prince said the future of the kingdom would be based on:
1. Its possession of the Muslim shrine cities of Mecca and
Medina and the "Arab and Muslim depth" that position gave the
kingdom
2. The kingdom's geographical centrality to world commerce, with
30 percent of global trade passing through the 3 major sea routes
that Saudi Arabia bestrides (not sure what the third is, after the
Red Sea and the Persian Gulf).
3. The creation of a $2 trillion sovereign wealth fund through a
sale of 5 percent of shares in Aramco, the world's largest oil
company.
Prince Muhammad said Monday that he thought these assets would
allow the kingdom to cease its dependence on petroleum in the very
near future.
"The planned economic diversification also involved localizing
renewable energy and industrial equipment sectors and creating
high-quality tourism attractions. It also plans to make it easier
to apply for visas and hoped to create 90,000 job opportunities in
its mining sector."
Saudi Arabia's citizen population is probably only about 20
million, so it is a small country without a big domestic market. It
is surrounded in the general region by huge countries like Egypt
(pop. 85 million), Iran (pop. 75 million) and Turkey (75 million),
not to mention Ethiopia (pop. 90 million) Without petroleum, it is
difficult to see what would be distinctive about Saudi Arabia
economically.
The excruciatingly young prince, who was born in 1985, has a BA
in Law from a local Saudi university and his way of speaking about
the elements of the economy is not reassuring. Take his emphasis on
the maritime trade routes that flow around the Arabian Peninsula.
How exactly does Saudi Arabia derive a dime from them? The only
tolls I can think of are collected by Egypt for passage through the
Suez Canal. By far the most important container port in the region
is
Jebel Ali
in the UAE, which dwarfs Jedda. His estimate of 30
percent of world trade going through these bodies of water strikes
me as exaggerated. Only about 10 percent of world trade goes
through the Suez Canal.
As for tourism, in a country where alcohol is forbidden and
religious police report to the police unmarried couples on dates,
that seems to me a non-starter outside the religious tourism of
pilgrimage to Mecca. The annual pilgrimage
brought in $16.5 billion or 3 percent
of the Saudi GDP four
years ago, but that number appears to be way down the last couple
of years. Unless the prince plans to highly increase the 2-3
million pilgrims annually, religious tourism will remain a
relatively small part of the economy.
He also spoke about the new bridge planned from Saudi Arabia to
Egypt as likely to drive trade to the kingdom and to make it a
crossroads. But the road would go through the Sinai Peninsula,
which is highly insecure and in the midst of an insurrection. And
where do you drive to on the other side? You could maybe take
fruits and vegetables by truck from Egypt to countries such as
Qatar and the United Arab Emirates. Would Saudi Arabia collect
tariffs on these transit goods? I can't see how that generates all
that much money. The big opportunity for overland transport would
be to link Egypt to a major market like Iran (pop. 77 million), and
via Iran, Pakistan and India. But Prince Muhammad and his circle
are hardliners against Iran and unlikely to foster trade with it.
Saudi Arabia suffers from the Dutch disease, i.e. its currency
is artificially hardened by its valuable petroleum assets. They may
eventually not be worth anything if hydrocarbons are replaced by
green energy or even outlawed. But in 2016, they are still
valuable, and they make the riyal expensive versus other
currencies. The result is that anything made in Saudi Arabia would
be unaffordably expensive in India (the rupee is still a soft
currency). As long as Saudi Arabia produces so much petroleum, it
is unclear how it can industrialize in the sense of making
secondary goods.
As for the sovereign wealth fund, let's say the ARAMCO partial
IPO actually realizes $2 trillion. Let's say it gets 5 percent on
its investments after overhead and that all $2 trillion are
invested around the world. That would be $100 billion a year, or
1/6 of Saudi Arabia's GDP last year. It doesn't replace the oil.
Saudi Arabia's Gross Domestic Product in 2014 was $746 bn., of
which probably 70 percent was petroleum sales. In 2015 it was only
$653 bn., causing it to fall behind Turkey, the Netherlands and
Switzerland. It will be smaller yet in 2016 because of the
continued low oil prices.
All this is not to reckon with the profligate spending in which
the kingdom is engaged, with a direct war in Yemen and a proxy war
in Syria, neither cheap. (Both wars are pet projects of Prince
Muhammad bin Salman). It also has a lot of big weapons purchases in
the pipeline, one of the reasons for President Obama's humiliating
visit last week. It ran a $100 bn. budget deficit in 2015. Saudi
Arabia has big currency reserves, but I doubt it can go on like
this more than five or six years.
Yemen in particular has proved to be a quagmire, and the Houthi
rebels still hold the capital of Sanaa. The only new initiative is
that Saudi and local forces have kicked al-Qaeda in the Arabian
Peninsula out of the port of Mukalla. This campaign shows a sudden
interest in defeating al-Qaeda, which had been allowed to grow in
Yemen while the main target was the Shiite Houthis, which Riyadh
says are allied with Iran (the links seem minor).
So it seems to me that the Vision for 2030 is mostly smoke and
mirrors.... Saudi Arabia probably cannot replace the money it will
lose if oil goes out of style and so is doomed to downward mobility
and very possibly significant instability. It has been a great
party since the 1940s; it is going to be a hell of a hangover.
Based on OPEC figures Saudi had produced 136.5 billion through 2014, so about 142 to date and, assuming
no decline, 160 by the end of 2020. Obviously their reserves are unknown outside a select few, but
news does get out including upgrades on existing fields, some new non-associated gas fields coming
on line, development of shale gas, offshore exploration and some minor discoveries. But never reported
is a major new oil field discovery or development. Pretty much all onshore areas have been fully
explored, only deep sea remains, which appears to have been a disappointment from initial results.
From wiki and other places the URR for their giant fields (Ghawar, Safaniya, Shaybah, Abqaiq,
Berri, Manifa, Abu-Sa'fah, Khurais, Neutral Zone) is 190 billion barrels; if true they could be up
to 75% through, and should be well past peak, but are managing to retain a plateau. I think that
Matt Simmons got things mostly right that there would be a collapse, but missed their ability (technically
and economically with oil at $100 plus) and need to keep pushing the peak out.
So for Ghawar that would involve continuing with multilateral, intelligent wells, re-completions,
possibly tertiary EOR methods, and new drilling up-dip where needed etc. Assume Ghawar is 90% depleted
and its infrastructure suddenly disappeared, there would still be 7 to 10 billion barrels left, probably
still representing one of the more attractive development opportunities around.
For Safaniyah there was a major upgrade project in 2012 with a new platform, wellhead upgrades,
ESPs etc. Manifa is a complicated reservoir bought fully on line a few years ago. All the reservoirs
have the best available models to allow optimum management.
There may be minor declines in their main fields, but not what would be expected given their age
and depletion. They are expanding al Shaybah and Khurais by a total of 550,000 bpd over 4 to 5 years
to 2018, which would compensate for 1 to 1.5% overall decline; to compensate for the rest would have
to come from field management (e.g. using the intelligent wells) and in fill drilling. Between 2005
and 2014 they averaged 434 well completions per year, compared to 280 the previous 10 years, which
is probably connected with this. (Note Kuwait went from 120 in 2000 through 2010 to 560 average since
2010, I'm not sure what that represents).
Eventually they are going to run out of options, the more they push things out the faster the
crash is going to be. The signals seem to be that 2020 might be it.
Brine spills from oil development in western North Dakota are releasing toxins
into soils and waterways, sometimes at levels exceeding federal water quality
standards, scientists reported Wednesday. Samples taken from surface waters
affected by waste spills in recent years in the state's Bakken oilfield region
turned up high levels of lead, ammonium, selenium and other contaminants, Duke
University researchers said. Additionally, they found that some spills had tainted
land with radium, a radioactive element.
Long-term monitoring of waters downstream from spill sites is needed to determine
what risks the pollution might pose for human health and the environment, geochemistry
professor Avner Vengosh said. But the study revealed "clear evidence of direct
water contamination" from oil development using the method known as hydraulic
fracturing, or fracking, he said, describing the problem as "widespread and
persistent."
Wastewater spills are a longstanding yet largely overlooked side effect of
oil and gas production that worsened during the nation's recent drilling boom,
when advances in fracking technology enabled North Dakota's daily output to
soar from 4.2 million gallons in 2007 to 42 million gallons in 2014.
The Associated Press reported last year that data from leading oil- and gas-producing
states showed more than 175 million gallons of wastewater spilled from 2009
to 2014 in incidents involving ruptured pipes, overflowing storage tanks and
other mishaps or even deliberate dumping. There were some 21,651 individual
spills. The numbers were incomplete because many releases go unreported.
The wastewater is often much saltier than the oceans and kills nearly all
vegetation it touches, rendering sections of crop and ranch lands unusable.
It also contains toxic chemicals, some of which are injected during fracking
to release oil and gas from rock deposits and others that exist naturally underground.
In their report, published in the journal Environmental Science & Technology,
Vengosh and other Duke researchers said their findings were based on an analysis
of water samples from four areas affected by spills, two of which - in July
2014 and January 2015 - were the largest on record in North Dakota.
They identified unique chemical "fingerprints" that showed the contaminants
came from brine spills and not some other source, Vengosh said.
In most samples, toxic selenium was measured in concentrations up to 35 times
the level that the U.S. Environmental Protection Agency considers safe for freshwater
aquatic life, the report said. And other elements were found in concentrations
above the EPA limit for drinking water.
"The results of this study indicate that the water contamination from brine
spills is remarkably persistent in the environment, resulting in elevated levels
of salts and trace elements that can be preserved in spill sites for at least
months to years," the report said.
Dave Glatt, chief of North Dakota's environmental health section, said it
was well known that oilfield wastewater is laced with toxic substances. But
most spills don't endanger the public because they are quickly cleaned up and
don't reach waterways, he said. Work continues on three of the sites from which
the Duke researchers drew samples and drinking water has not been contaminated,
he said.
Kerry Sublette, a University of Tulsa chemical engineering professor and
expert on oilfield wastewater spills who wasn't involved with the Duke study,
said the team's methods could help other researchers establish clear links between
the spills and changes in stream chemistry.
Sublette recently completed a study that found toxins from spills in streams
flowing through Oklahoma's Tallgrass Prairie Preserve, which will disrupt food
chains by killing insects, worms and other small animals, he said.
"... Canada produces 7 million barrels of oil equivalent per day of bitumen, crude oil, natural gas liquids and natural gas, making it the fifth largest hydrocarbon-producing jurisdiction in the world. The country won't be going off the oil and gas business anytime soon, ..."
"... One of the attractions of Canada in recent years is foreign capital was welcome to develop massive, if expensive, oil reserves. Now Iran is said to be open for business. ..."
Canada produces 7 million barrels of oil equivalent per day of bitumen, crude
oil, natural gas liquids and natural gas, making it the fifth largest hydrocarbon-producing
jurisdiction in the world. The country won't be going off the oil and gas business
anytime soon, so keeping it going will remain good business and the largest
resource industry in Canada.
But the current mantra of "lower for longer" is wrong. This is only the price
of oil. In terms of the Canadian oil and gas industry [oil production] there
are multiple reasons it could be "lower for a long time, possibly forever."
For a country that performs all elements of producing still-essential hydrocarbons
as well or better than anyone else in the world – everything from broad economic
participation to worker safety to environmental protection – that is a tragedy.
... One of the attractions of Canada in recent years is foreign capital was
welcome to develop massive, if expensive, oil reserves. Now Iran is said to
be open for business. As is Mexico. Saudi Arabia wants to diversify its economy
away from oil and sell its refining operations to global investors. The Saudis
are talking bravely about an economy no longer dependent upon oil profits as
soon as 2030.
Western Canada is not the only oil-producing jurisdiction wondering about
its future. It is, however, the highest cost oil-producing jurisdiction wondering
about its future.
the fundamentally unsustainable pricing that we've seen for much of 2016, particularly after
the 2nd failed OPEC meeting, has been much more dependent upon speculative short positions in the
market, particularly from algorithmic momentum funds. We could track the speculative short
positions against the price of crude almost exactly as prices dropped below $40 the first time,
with long positions decreasing to their lowest levels in five years as crude dropped under $30 a
barrel.
I wonder what ShallowS thinks of EOG's new strategy? That is, to choose their very best of the
best projects, cut costs to the bone and hope that they can make a profit.
Good analogies are
hard to come by, but I will throw one out. In 2009, at the depths of the housing collapse, what
if the CEO of Toll Brothers proposed: "We are going to select our very best lots – the Crown Jewels
in our inventory. Then we are going to build some of our more modest houses on them, cutting costs
to the bone. We hope that we can then sell them for at least break even." Personally, if I owned
the stock, I would have sold immediately.
Clueless. You know what I think. And I do really like your Toll Brothers example. What I think
is more impressive than their current meme on $30 oil is how they cut their estimate of future
production costs from $52 billion at the end of 2014 to $32 billion at the end of 2015, without
a major proved reserve reduction.
But hey, Continental cut theirs from $26 billion to $11 billion. So no big deal.
We have decided to that we too need to reduce our future production costs by 60%. The electric
cooperative said no problem. So did the chemical company, our workers comp carrier , liability
insurance carrier. The steel manufacturers did too , so our tubing and rods dropped 60%. The down
hole and injection pump service providers were ok with that.
Hey Clueless, even our accountant said, "No problem! Since you need to compete with OPEC and
Russia, we are knocking 60% off our bill! Now go beat those Saudi's and Russians in this oil price
war! Show em who is boss!"
Seriously, we have seen some cost reductions, but nothing remotely near 40-60%. And, of course,
although we pay the most to the electric coop of anyone, they just don't seem too keen on lowering
rates for us.
OFM. Look up above. I mentioned three publicly traded companies whose combined BOE was 160K BOEPD
who shut in production in Q4, before the latest $10+ dollar drop.
Just about every word you post makes good sense to me.
I am wondering about something just a little different, that being mainly HOW FAST this other
companies follow after the three you wrote about.
Let's suppose the price of oil gets up to fifty bucks. How many producers are going to be not
only losing money, but bleeding cash on a day to day basis at fifty bucks? Or sixty or seventy
?
You keep a hotel open if you generate more cash than it costs to operate it,from one day to
the next, even if it is losing money overall. I am thinking most oil producers will continue to
produce as long as they are generating some cash, but not much longer after that.
Who has the highest day to day production costs in the entire industry ? Some deep water operators,
most likely. They may hang on a while waiting for higher prices, or avoiding shut down and plugging
expenses, but not forever.
How long can they possibly hold on, if it costs them fifty or sixty bucks to get a barrel out
of the well and to shore?
So far as I can see, oil markets will remain COMPETITIVE.Nobody is going to pay a dime more
for a liter of gasoline or diesel fuel than necessary.
The price of oil WILL NOT go up, until either the economy picks up a good bit, or the amount
of oil coming to market drops off a a little.
All this talk about TRADERS controlling the price of oil is bullshit so far as I am concerned,
until somebody shows me HOW THEY CONTROL the production and distribution of oil.
IF the world economy actually does start going downhill, there are enough desperate for cash
oil producers out there for the cutthroat pricing to continue for a long time.
OFM. The way to look at production being shut in is not on a companywide level, but on a well
by well level.
A good well goes down with a failure, you pull it and get it back going. A not
so good well goes down with a failure, you leave it. Or, you have wells that are so out of the
money you just put a good coat of chemical down hole and then shut them in.
We have wells that we would run at $10, not many, but we do. Others do not work at $60. They
produce out of the same zone and can even be right next to each other.
For example, we have a lease where one well makes almost straight oil, about 3 barrels per
day, I think the pumping unit just makes six strokes per minute. The well just 330′ away makes
maybe 1/2 barrel of oil per day and about 30 barrels of water per day. Furthermore, the good well
is a straight hole. Bought the lease in 2005, have changed the pump twice and fixed a tubing leak
once in eleven years. The not so good well has been pulled 14 times, mostly due to tubing leaks.
Likely a crooked hole.
So when not so good well goes off, at $25 oil, its stays off. If the good well goes off, it
is repaired ASAP.
Companies don't just shut everything down, unless they are very small. Normally, if they go
bankrupt, the trustee will find a contractor to pump the good wells until sold, in a Chapter 7
anyway.
"... According to Professor Michael Jefferson, who spent nearly 20 years at Shell in various senior roles from head of planning in Europe to director of oil supply and trading, "the five major Middle East oil exporters altered the basis of their definition of 'proved' conventional oil reserves from a 90 percent probability down to a 50 percent probability from 1984. The result has been an apparent (but not real) increase in their 'proved' conventional oil reserves of some 435 billion barrels." ..."
"... Global reserves have been further inflated, he wrote in his study, by adding reserve figures from Venezuelan heavy oil and Canadian tar sands – despite the fact that they are "more difficult and costly to extract" and generally of "poorer quality" than conventional oil. This has brought up global reserve estimates by a further 440 billion barrels. ..."
"... Jefferson's conclusion is stark: "Put bluntly, the standard claim that the world has proved conventional oil reserves of nearly 1.7 trillion barrels is overstated by about 875 billion barrels. Thus, despite the fall in crude oil prices from a new peak in June, 2014, after that of July, 2008, the 'peak oil' issue remains with us." ..."
An extensive new scientific
analysis published in Wiley Interdisciplinary Reviews: Energy & Environment says that proved
conventional oil reserves as detailed in industry sources are likely "overstated" by half.
According to standard sources like the Oil & Gas Journal, BP's Annual Statistical Review of World
Energy, and the US Energy Information Administration, the world contains 1.7 trillion barrels of
proved conventional reserves.
However, according to the new study by Professor Michael Jefferson of the ESCP Europe Business
School, a former chief economist at oil major Royal Dutch/Shell Group, this official figure which
has helped justify massive investments in new exploration and development, is almost double the real
size of world reserves.
Wiley Interdisciplinary Reviews (WIRES) is a series of high-quality peer-reviewed publications
which runs authoritative reviews of the literature across relevant academic disciplines.
According to Professor Michael Jefferson, who spent nearly 20 years at Shell in various senior
roles from head of planning in Europe to director of oil supply and trading, "the five major Middle
East oil exporters altered the basis of their definition of 'proved' conventional oil reserves from
a 90 percent probability down to a 50 percent probability from 1984. The result has been an apparent
(but not real) increase in their 'proved' conventional oil reserves of some 435 billion barrels."
Global reserves have been further inflated, he wrote in his study, by adding reserve figures from
Venezuelan heavy oil and Canadian tar sands – despite the fact that they are "more difficult and
costly to extract" and generally of "poorer quality" than conventional oil. This has brought up global
reserve estimates by a further 440 billion barrels.
Jefferson's conclusion is stark: "Put bluntly, the standard claim that the world has proved conventional
oil reserves of nearly 1.7 trillion barrels is overstated by about 875 billion barrels. Thus, despite
the fall in crude oil prices from a new peak in June, 2014, after that of July, 2008, the 'peak oil'
issue remains with us."
That spells big trouble for the USA oil production in 2017 and 2018...
Notable quotes:
"... I see the only bright spot in the rig count, is the long forgotten Barnett. It appears it is no longer a gas play, but is now seen as a oil play. There are 6 oil rigs working, increasing one per week all through April. It seems to be the only area that has more rigs drilling this year, than last. ..."
"... I think the rigs per "play" is geography more than geology. There are not that many rigs drilling haynesille shale wells ..."
"... I assume that possibly there have been improvements (technological, etc.) that make newer vintage wells more productive? Keep in mind these wells cost in the $7-9 million dollar ballpark to drill, complete and equip. ..."
I see the only bright spot in the rig count, is the long forgotten Barnett. It appears it is
no longer a gas play, but is now seen as a oil play. There are 6 oil rigs working, increasing
one per week all through April. It seems to be the only area that has more rigs drilling this
year, than last.
Based on what I can tell, here is a distribution for horizontal Spraberry wells with first
production on or before 7/2014. There appear to be 715 active wells.
First, cumulative oil through 1/16:
2% 200,000 bo or more
7% 150,000-199,999 bo
26% 100,000-149,999 bo
41% 50,000-99,999 bo
17% 25,000-49,999 bo
7% 1-24,999 bo
Next, most recent monthly production (1/16) for these wells:
9% 3,100 bo or more
32% 1,530-3,099 bo
30% 775-1,529 bo
29% 1-774 bo
I assume that possibly there have been improvements (technological, etc.) that make newer vintage
wells more productive? Keep in mind these wells cost in the $7-9 million dollar ballpark to drill, complete and equip.
Enno has a post coming out soon on the Permian, interested to see what it reveals.
"... But it can deflate in 3 years if there is no capital as we are watching it right now. And you are left just with debt on the end of cycle. For big majors to go into shale and do that kind of investment that is solely based on market timing it is equivalent of individual investors picking individual stocks based on market timing and going in and out. That is equivalent to suicide in long run and no one who even remotely understands how market works would do that kind of thing. ..."
"... Which would require another 30,000 shale wells at an estimated total cost of 250 billion more dollars. The first 30,000 shale oil wells have not been paid for yet and short of 100 dollars a barrel, sustained, won't. Besides, it looks like a game of Pixie Stix out there in sweet spots now, where might these other 30,000 wells get drilled? If off on the flanks, it will take 50,000 shale wells to get back to 4 MBOPD, and 400 billion more dollars. Much longer laterals, oodels more sand and horsepower, much poorer wells, you see. ..."
"... Shale fell out or favor for Wall Street if we look at which rates and on what terms credit lines are rotated. So this hypothesis about re-appearance of "available capital" with "proper" oil prices is weaker then it looks. ..."
"... Loosing a couple of billion dollars provide (a temporary) lesson for a bank. Let's say for three years (may be slightly longer - five years). After that they again are ready to break their neck running for better profits :-). So "reckless" capital might not be available for shale before 2020. ..."
"... In other words, "carpet drilling" is a feat that is difficult to repeat unless something fundamentally changes in shale technologies or world oil production picture. ..."
Alex, But it can deflate in 3 years if there is no capital as we are watching it right now. And
you are left just with debt on the end of cycle. For big majors to go into shale and do that kind
of investment that is solely based on market timing it is equivalent of individual investors picking
individual stocks based on market timing and going in and out. That is equivalent to suicide in
long run and no one who even remotely understands how market works would do that kind of thing.
Which would require another 30,000 shale wells at an estimated total cost of 250 billion more
dollars. The first 30,000 shale oil wells have not been paid for yet and short of 100 dollars
a barrel, sustained, won't. Besides, it looks like a game of Pixie Stix out there in sweet spots
now, where might these other 30,000 wells get drilled? If off on the flanks, it will take 50,000
shale wells to get back to 4 MBOPD, and 400 billion more dollars. Much longer laterals, oodels
more sand and horsepower, much poorer wells, you see.
By the time the shale oil industry admits it needs help and wants to sell assets to majors,
or bigger companies, or anybody with new credit, it will be too late. Those "assets" will have
already depleted 50% of their exaggerated EUR's, the remaining 50% will take 20 more years to
realize, maybe, and be nothing more than stripper wells. Buyers will not be paying a lot of money
for 'de-risked' acreage and PUD's when all the wells nearby have already proven themselves grossly
unprofitable. There is a reason major integrated companies did not get into shale oil plays in
the first place. They are not going to change their minds because the price of oil is now 40,
instead of 100.
This M&A stuff is more shale oil hope. Like 50 dollar oil will supposedly put them all back
cranking out the wells again and everything will be peachy.
Shale fell out or favor for Wall Street if
we look at which rates and on what terms credit lines are rotated. So this hypothesis about re-appearance
of "available capital" with "proper" oil prices is weaker then it looks.
It might not be available before, say, $100 per bbl and before 2020. And even in this case
amount will be less then in the past and conditions less favorable.
Loosing a couple of billion dollars provide (a temporary) lesson for a bank. Let's say
for three years (may be slightly longer - five years). After that they again are ready to break
their neck running for better profits :-). So "reckless" capital might not be available for shale
before 2020.
In other words, "carpet drilling" is a feat that is difficult to repeat unless something
fundamentally changes in shale technologies or world oil production picture.
Looks like "Go to Iran my friend to drill" is the slogan now :-)
"... I have been discussing this play with Mike, he has knowledge of the area. He says that, despite the low volume, the vertical wells (which are 7-10,000′ deep) are profitable because of the low produced water volume. ..."
"... I really think what is happening here is very simple, the hz wells just pull out a lot more oil up front, but likely by years 3 and on, they really do not produce much, if any, more than the vertical Spraberry wells. ..."
"... Therefore, it appears to me the 1-1.25 million BOE EUR type curves are vastly overstated. ..."
"... There are exceptions, PXD's wells on the ET O'Connor and Donald Hutt leases are very strong. There are a few others. There are also exceptions with regard to the vertical wells, but, like the hz, those appear to be few and far between, less of those on a percentage basis than Parshall and Grail in the Bakken, for example. ..."
"... In summary, I question whether allowing tightly spaced horizontal wells in the Spraberry is in the best interests of both economics and conservation practices? I am not qualified to delve into that, but I think someone should. ..."
"... I am concerned that Mike is exactly right, that the horizontal well boom, and the lack of spacing rules for those wells, is leading to significant waste, that is going to bite us in a few years. ..."
"... Really surprising that the spacing rules are being ignored for short term gain? I guess that is what the US stock markets are all about, so no surprise at all. After all, who is going to get excited about $1 million vertical Spraberry wells that IP 150 bopd, cum. 75,000 barrels of oil in the first couple or three years, and then produce 1,500 – 7,500 barrels of oil for the next 40 years? 3,000 BOE IP's and 1.25 million BOE EUR type curves sell so much better, I suppose. ..."
"... Thanks for information Shallow, and this is a bit off topic but you follow the financials of these companies. I see these companies touting that they can make money with a 30-50% ROI drilling these wells. I assume this is for the first year. How in the hell are they making money on these wells that deplete at the rate they do, with only a 30% ROI in the first year. ..."
"... In other words this is a new way of infill drilling ..."
I have been studying the Spraberry horizontal wells in the Permian basin, which appear to be
the most favored LTO well by Wall Street at the present time.
It appears to me that there is no magic, so to speak. The Spraberry was first developed on
large scale in 1950-51. The vertical wells of that era came in with very high IP, but rapidly
fell off.
There was tremendous activity in the Spraberry with vertical wells in the last ten years, when
oil made its rapid climb.
Little paid attention to when PXD is discussed, is that they operate over 6,500 vertical Spraberry
wells in the Permian Basin. Of those, almost 6,000 have attained "stripper well status" of 15
barrels of oil per day, or less. It appears the wells settle out in a range of 5-15 barrels per
day, and produce around 2-3 barrels of water for every barrel of oil. The wells also tend to produce
minor amounts of gas.
I have been discussing this play with Mike, he has knowledge of the area. He says that, despite
the low volume, the vertical wells (which are 7-10,000′ deep) are profitable because of the low
produced water volume.
Basically, it seems the vertical wells are only pumped a few days per month. I am not from
the PB, but have been through Midland and Upton Co. TX, and have seen scores of very large (160K
pound and greater) pump jacks, most of them idle.
When I look at the older (2+ years, so not really that old, but just in relative terms) hz
Spraberry wells, I see the same thing, very low volumes. Almost none of PXD's hz wells still produce
100+ bopd after two years, most are already below 50 bopd after two years.
I really think what is happening here is very simple, the hz wells just pull out a lot more
oil up front, but likely by years 3 and on, they really do not produce much, if any, more than
the vertical Spraberry wells.
Therefore, it appears to me the 1-1.25 million BOE EUR type curves are vastly overstated.
There are exceptions, PXD's wells on the ET O'Connor and Donald Hutt leases are very strong.
There are a few others. There are also exceptions with regard to the vertical wells, but, like
the hz, those appear to be few and far between, less of those on a percentage basis than Parshall
and Grail in the Bakken, for example.
One other interesting thing I noted. Summit Petroleum is a decent sized private company which
has been drilling, completing and operating Spraberry wells for many years. I noticed that they
have only drilled 3 horizontal Spraberry wells, or at least that is all I can find producing as
of 1/16. It appears they continued to drill vertical wells in 2015, albeit at a much slower pace
than prior years.
In summary, I question whether allowing tightly spaced horizontal wells in the Spraberry is
in the best interests of both economics and conservation practices? I am not qualified to delve
into that, but I think someone should.
I am concerned that Mike is exactly right, that the horizontal well boom, and the lack of spacing
rules for those wells, is leading to significant waste, that is going to bite us in a few years.
Really surprising that the spacing rules are being ignored for short term gain? I guess that
is what the US stock markets are all about, so no surprise at all. After all, who is going to
get excited about $1 million vertical Spraberry wells that IP 150 bopd, cum. 75,000 barrels of
oil in the first couple or three years, and then produce 1,500 – 7,500 barrels of oil for the
next 40 years? 3,000 BOE IP's and 1.25 million BOE EUR type curves sell so much better, I suppose.
Again, would be interested in comments on this from those who have better technical background
than me. In particular, would like to hear from horizontal proponents, but seems coffee is the
only one that lurks around here. Coffee, what do you think?
Thanks for information Shallow, and this is a bit off topic but you follow the financials of
these companies.
I see these companies touting that they can make money with a 30-50% ROI drilling these
wells. I assume this is for the first year. How in the hell are they making money on these
wells that deplete at the rate they do, with only a 30% ROI in the first year.
"... "Schlumberger-after posting its first North American operating loss since at least the turn of the century, according to Barclays Plc-is evaluating whether it's worth temporarily shuttering its business in the region. Baker Hughes said Wednesday it has decided to limit its exposure to unprofitable onshore fracking work in North America because of the unsustainable pricing. ..."
"... This indicates there will be no quick return to high volume horizontal fracking on a large scale in North America. ..."
"HOUSTON (Bloomberg) - Two of the three largest oil rig operators and frackers are considering
pulling back from the North American market as losses mount.
"Schlumberger-after posting its first North American operating loss since at least the turn
of the century, according to Barclays Plc-is evaluating whether it's worth temporarily shuttering
its business in the region. Baker Hughes said Wednesday it has decided to limit its exposure to
unprofitable onshore fracking work in North America because of the unsustainable pricing.
"It's the first time in at least a decade that those companies and Halliburton Co., the big
3 in oil services, all lost money in the region during the first three months of the year, according
to Bloomberg Intelligence."
Has any upstream division of any operator so far reporting 1Q16 shown a profit? ExxonMobil,
BP, and Statoil had profits overall but only because of downstream and marketing operations.
This indicates there will be no quick return to high volume horizontal fracking on a large
scale in North America.
I am not aware on any company in the E & P upstream focused in North America that has positive
earnings for Q1, 2016, but I have not made an exhaustive look.
IMF expects $500B revenue loss for Mideast oil exporters
April 26, 2016
AYA BATRAWY | Associated Press
DUBAI, United Arab Emirates (AP) - Oil exporting countries in the Middle
East lost a staggering $390 billion in revenue due to lower oil prices last
year, and should brace for even deeper losses of around $500 billion this
year, the International Monetary Fund said Monday.
The fund had projected in October that oil exporting countries in the
region would see revenue losses of $360 billion in 2015, but oil prices
took a tumble by year's end and the drop in revenue amounted to $30
billion more.
In a revised economic outlook report released Monday, the
IMF said these countries will see revenues from oil exports drop even
more in 2016, to between $490 billion to $540 billion compared to 2014,
when oil prices were higher. Oil prices plunged to around $30 a barrel in
January compared to $115 in mid-2014.
IMF Director for Middle East and Central Asia Masood Ahmed said these
losses translate into budget deficits and slower economic growth,
particularly for countries like Saudi Arabia that are still heavily
dependent on oil to finance their spending. Though the kingdom has been
working on plans to overhaul its economy, oil still accounted for 72
percent of total revenue last year and Saudi Arabia projects a budget
deficit of nearly $90 billion this year.
The report said that economic growth in the six Gulf Cooperation
Council countries of Saudi Arabia, Kuwait, Qatar, Bahrain, Oman and the
United Arab Emirates will slow from 3.3 percent in 2015 to 1.8 percent
this year. Saudi Arabia, the region's biggest economy, will see growth at
just above 2 percent.
The IMF has encouraged reforms that would limit public spending on
welfare programs and handouts that citizens in the Gulf have become
accustomed to, such as lifting subsidies and tightening public sector
wage bills to offset the impact of declining revenues. Already, most GCC
countries have raised fuel, water, and electricity prices. Outside the
GCC, oil exporter Algeria recently hiked fuel, electricity, and natural
gas prices, and Iran increased fuel prices.
"Oil prices are likely to improve from where they are, but they're not
going to go back to the figures that we saw in 2013 and 2014 for a long,
long time, so this means that many of them have to cut back spending and
they also have to try to raise revenue outside the oil sector," Ahmed
told The Associated Press.
The IMF warns that just among oil exporters in the region, 10 million
young people are expected to enter the workforce by 2020, yet 3 million
of them will find themselves without jobs at the current pace of
development. Young people's frustration at their lack of prospects was a
key driver of the Arab Spring uprisings that rocked the Middle East in
2011.
The report said the war in Syria has had a negative spillover effect
on the economies of neighboring Jordan and Lebanon. From October and
March alone, more than 600,000 people fled Syria due to the fighting,
bringing the total number of refugees to almost 5 million. The size of
Syria's economy today, the IMF said, is less than half of what it was
before the war erupted in 2011.
In Egypt, political turmoil has held back growth due to concerns over
security. However, lower oil prices have reduced energy subsidy bills
there.
Though Iran's growth was at zero in 2015, its economy is expected to
grow 4 percent in 2016 and 3.7 percent in 2017 as it ramps up oil
production and looks to increase trade and investment with the easing of
international sanctions.
The U.S. Shale Boom Was Financed By Low Interest Rates
The hunt for yield in the era of lower to zero interest rates leads
to peculiar investment decisions. In 2008 the collapse of the
housing bubble – driven by an endless investor appetite for
high-yield mortgage bonds of questionable quality – was said to
cause the global recession. This precipitated the collapse of major
financial institutions like Lehman Brothers and the bailout of many
more. Regulators frowned and tried to bring in policies to ensure
it would not happen again.
The great light tight oil (LTO) or shale boom in the U.S. since
2010 has all the hallmarks of a similar asset bubble. Exploration
and production (E&P) companies were able to finance significant
drilling through the sale of subordinated bonds with an attractive
yield of 6 percent or more. They were for the most part
interest-only and due in several years. The problem with drilling
high decline LTO wells with high-yield debt is by the time the
bonds mature, the production from the wells the debt paid for has
declined to the point the assets are only worth a fraction of the
leverage outstanding. Many companies in the U.S. are already broke
and more will follow. Much analysis has been done to show some of
the top LTO drillers in the U.S. spent $2 on drilling for every $1
of cash flow prior investments had generated. The difference was
made up by seemingly limitless capital inflows.
This has created two problems for Canada's oil future. The first
is even if commodity prices rise and transportation issues are
solved, the ability of companies to raise cheap debt will be
impaired for some time, perhaps forever, depending on what happens
to interest rates. Historical E&P spending has almost always
exceeded cash flow providing investment, jobs and opportunity that
would not exist otherwise. External capital inflows are essential
to feed the machine.
The other is the impact debt-financing has had on oilfield
services (OFS) sector balance sheets. As has been written on these
pages before, in 2014 and 2015 alone 21 diversified Canadian OFS
operators invested $37 billion adding new rigs, frack spreads,
camps, processing plants, midstream facilities and pipelines for a
growing North American oilpatch. Three large Canadian pressure
pumpers alone carried a combined $2.6 billion in debt and one has
gone broke. A lot of E&P demand was financed by debt, which is no
longer available. Now OFS is overbuilt and many operators
over-levered. It will take some recovery to clean this up.
Why Middle East producers do what they do remains a mystery. But
whatever the plan or strategy, the cash cost of finding and
producing the next barrel in this region remains the lowest in the
world. In the past it seemed Middle East oil strategy was about
price with oil sales assured. Now it looks like volume and market
share.
The Middle East may soon be the world's most active market for
drilling rigs. According to the Baker Hughes worldwide rig count,
the only area of the world (Latin America, Europe, Africa, Middle
East, Asia Pacific, U.S., Canada) still operating about the same
number of rigs in 2016 as it was in 2014 is the Middle East. The
only region that has increased its active rig count from 2013 and
2012 and its share of the global active drilling rigs is the Middle
East.
(Click to enlarge)
Source: Baker Hughes Worldwide Rig Count April 22, 2016,
average rigs operating for the period
Why? Because they can, and to sustain output, they must.
Whatever the financial situation may be for the governments in
charge, there is clearly sufficient cash flow from existing
production to fund more drilling. With the Baker Hughes U.S. total
active rig count for April 22 down to 471, the average 403 rigs
drilling in the Middle East in the first three months of 2016 make
it the second-busiest region in the world. Unless prices recover
soon, it could become number one.
Looks like you was right about timing of peak oil. The trend of production down is becoming
more clear with each month. It might be disrupted by some noise (end of Libya civil war, etc),
but still with no new major deposits discovered I do not see factors that can change it.
Higher oil prices might change things and that chart is US only.
IEA expects non-OPEC output to fall 750 kb/d in 2016, some of this may be made up by increases
in Iranian, Iraqi, and Libyan output. On an annual basis 2016 may be pretty close to average annual
output in 2015 for C+C. It will be interesting to see how things play out, I still like the plateau
scenario which I will define as World C+C output remaining between 79 and 81 Mb/d on average for
any 12 month period from now until 2025.
Higher oil prices might change things and that chart is US only.
I understand that the chart is the US only but it is the harbinger of things to come globally.
As for higher oil prices, they need to get into $70-$80 range first where high cost oil projects
including US LTO became profitable to change the current trend. Before that "recovery of oil prices"
does not change much for non conventional oil producers. For some (for example the USA) conventional
oil producers the lower range you provided before might be OK, but most oil producing countries
with national oil companies could not balance budget below $90.
IMHO prices below $70-$80 mean for non conventional producers the continuation of "survival
mode" or "extend and pretend". With the only difference that the dates of renewal of credit lines
coming closer. And that magic range of prices $70-$80 probably will not be reached this year.
So I would say your expectations are too optimistic.
When you cite IEA it make sense to provide some information of their track record of production
forecasting accuracy during previous sharp reversals of oil prices trends. My impression is that
they are way too "linear extrapolation" type of animal.
This conclusion strengthen considerably if we take into account that this is 50% propaganda
agency which needs to support "low oil price forever" regime as a part of their institutional
agenda. In other words this an agency that is serving G7 countries interested in low oil prices.
That creates certain limits on what they can say so it is natural for them to try to downplay
any possible drop in oil production. It would extremely stupid to expect from them any other behavior.
So IMHO you can safely double their estimates in such cases.
Reality is pretty grim now for oil producers and you need to understand that a lot of skeletons
in the closet (including financial skeletons) remain hidden. So actual situation can be much worse
then we assume and another quarter of low prices by which I mean prices below which conventional
oil production in the USA is unprofitable (let's say $55) might be the straw that broke the camel's
back.
So there is a hope that neoliberals lose control over oil prices at some point.
I agree with you about wild cards like Iran and Libya. But the US is ambivalent about allowing
Iran to recover oil production and there are moves directed at confiscation part of their "frozen"
funds without which this is almost impossible with the current prices. But still we can expect
that both of those cards be played to slow down price recovery (and ayatollahs proved to be extremely
stupid, if you ask me; not much different from Wahhabis sheiks. why they did not cooperate with
oil price freeze (for six months; only six months!) is beyond me. But even Iran ayatollahs arrogant
stupidity can't change general trend, which is down.
Iraq can't meaningfully increase production right now as this is an almost bankrupt by civil
war country and chances to restore peace this year are slim. Saudis and friends continue to finance
Sunni insurgency. It was inertia from "good old times" that drove their production up in 2015.
This is over.
Shale card was already played once (and it was played very well) but that's it. Now "carpet
drilling" trick will not be repeated again even if price reach magic level of $80: unlimited financing
of shale drilling is gone for good.
My impression is that there are powerful forces that are not interested in oil price recovery
and do not care about negative long term consequences of waiting so much oil instead of extending
conservation technologies.
Unless those forces (of neoliberalism) are somehow suppressed I doubt that prices can recover
to the level that allow expansion of production. And in oil prices world the tail still wags the
dog: Wall Street still determine oil prices in a sense that it is able vastly amplify the moves
via HFT.
Also oil producers also now are disorganized mob unable to protect their own interests, so
I would not expect meaningful actions from OPEC unless there is a coup d'état in KSA that removes
the young gambler prince who almost halved country currency reserves.
…found in the third group of experiments (see the scenarios for an unequal society in section
5.3), where we introduced economic stratification. Under such conditions, we find that
collapse is difficult to avoid , which helps to explain why economic stratification
is one of the elements consistently found in past collapsed societies. Importantly, in the
first of these unequal society scenarios, 5.3.1, the solution appears to be on a sustainable
path for quite a long time, but even using an optimal depletion rate () and starting with a
very small number of Elites, the Elites eventually consume too much, resulting in a famine
among Commoners that eventually causes the collapse of society. It is important to note that
this Type-L collapse is due to an inequality-induced famine that causes a loss of workers,
rather than a collapse of Nature. Despite appearing initially to be the same as the sustainable
optimal solution obtained in the absence of Elites, economic stratification changes the final
result: Elites' consumption keeps growing until the society collapses . The
Mayan collapse -in which population never recovered even though nature did recover- is an example
of a Type-L collapse, whereas the collapses in the Easter Island and the Fertile Crescent -where
nature was depleted- are examples of a Type-N collapse.
In scenario 5.3.2, with a larger depletion rate, the decline of the Commoners occurs faster,
while the Elites are still thriving, but eventually the Commoners collapse completely, followed
by the Elites. It is important to note that in both of these scenarios, the Elites -due to
their wealth- do not suffer the detrimental effects of the environmental collapse until much
later than the Commoners. This buffer of wealth allows Elites to continue 'business
as usual' despite the impending catastrophe . It is likely that this is an important
mechanism that would help explain how historical collapses were allowed to occur by elites
who appear to be oblivious to the catastrophic trajectory (most clearly apparent in the Roman
and Mayan cases). This buffer effect is further reinforced by the long, apparently sustainable
trajectory prior to the beginning of the collapse. While some members of society might
raise the alarm that the system is moving towards an impending collapse and therefore
advocate structural changes to society in order to avoid it, Elites and their supporters, who
opposed making these changes, could point to the long sustainable trajectory 'so far' in support
of doing nothing."
-------------–
"It is well known that Americans consume far more natural resources and live much less sustainably
than people from any other large country of the world. 'A child born in the United States will
create thirteen times as much ecological damage over the course of his or her lifetime than
a child born in Brazil', reports the Sierra Club's Dave Tilford, adding that the average American
will drain as many resources as 35 natives of India and consume 53 times more goods and services
than someone from China.
Tilford cites a litany of sobering statistics showing just how profligate Americans have
been in using and abusing natural resources. For example, between 1900 and 1989 U.S. population
tripled while its use of raw materials grew by a factor of 17. ' With less than 5 percent
of world population, the U.S. uses one-third of the world's paper, a quarter
of the world's oil, 23 percent of the coal , 27 percent of the aluminum, and 19 percent
of the copper', he reports. 'Our per capita use of energy, metals, minerals, forest products,
fish, grains, meat, and even fresh water dwarfs that of people living in the developing world.'.
He adds that… Americans account for only five percent of the world's population
but create half of the globe's solid waste.
Americans' love of the private automobile constitutes a large part of their poor
ranking . The National Geographic Society's annual Greendex analysis of global consumption
habits finds that Americans are least likely of all people to use public transportation-only
seven percent make use of transit options for daily commuting. Likewise, only one in three
Americans walks or bikes to their destinations… the U.S. remains the per capita consumption
leader for most resources.
Overall, National Geographic's Greendex found that American consumers rank last of 17 countries
surveyed in regard to sustainable behavior. Furthermore, the study found that U.S. consumers
are among the least likely to feel guilty about the impact they have on the environment…" ~
Scientific American
"The American way of life is not up for negotiation." ~ George Bush Sr.
Yes but China is burning that coal to make all of the "stuff" that the US buys so you could argue
that the US is consuming that coal. I may even be greater than 23%.
exactly Jef. this whole globalization is just a buzzword to hide what is really trashing the mother
earth by the global 1%. Pointing fingers who trash more is illusion fed to us so we can chew on
it and be distracted because the real game is played between 1% versus 99% no matter where they
live.
U.S. gasoline consumption, averaged over four weeks, rose 3.9 percent from
a year earlier to 9.39 million barrels a day through April 15, Energy Information
Administration data show. Demand this summer will increase 1.4 percent to a
record, the EIA said April 12. Americans drove 232.2 billion vehicle miles in
February, up 5.6 percent from a year earlier, Transportation Department data
show.
"Gasoline demand is quite strong and that's all price driven," said Thomas
Finlon, director of Energy Analytics Group LLC in Wellington, Florida. "Demand
for gasoline should provide support for crude."
The average price of regular gasoline at the pump nationwide was $2.136 a
gallon on Sunday, down 15 percent from a year earlier, according to data from
Heathrow, Florida-based AAA, a national federation of motor clubs.
Speculators' net-long position in WTI gained by 30,357 futures and options
combined to 245,987, CFTC data show. Long positions, or bets that prices will
rise, increased 4.8 percent, while shorts tumbled 19 percent.
In other markets, net bullish bets on Nymex gasoline climbed 15 percent to
23,357 contracts. Gasoline futures declined 3.5 percent in the period. Net bearish
wagers on U.S. ultra low sulfur diesel decreased 11 percent to 7,773 contracts,
the least since June as futures slipped 1 percent.
"... "There is a realization among many Saudis that the economic challenges that the kingdom is facing are daunting," said Fahad Nazer, who worked at the Saudi embassy in Washington and is now a political analyst at JTG Inc. "Given the fact that some 70 percent of Saudis are under the age of 30, Prince Mohammed's penchant for making quick decisions and holding officials accountable for their performance – or lack thereof - does have wide support among Saudis. ..."
"... "The foremost challenge Mohammed bin Salman faces over time is the inevitable need to restructure the Al Sauds' relationship with the Wahhabis," ..."
"... "Within Saudi Arabia, the main challenges MbS will face will involve not the substance of oil policy but rather resistance within the royal family to so much power being concentrated in the hands of one prince of his generation," he said. ..."
After decades of talk of diversification, more than 70 percent of Saudi government revenue came from
oil in 2015 and the state still employs two-thirds of Saudi workers. Foreigners account for nearly
80 percent of the private-sector payroll.
"The issue really is how to get the Saudi private sector
to hire locals, how to make the numbers on that right, since so much of the Saudi private sector
has had business models based on lower-wage foreign labor," said Gause.
In response to the country's weakened fiscal position, Prince Mohammed's plan is to raise non-oil
revenue by $100 billion by 2020. The government announced cuts in utility and gasoline subsidies
in December. Including future reductions, authorities expect the restructuring to generate $30 billion
a year by 2020.
"There is a realization among many Saudis that the economic challenges that the kingdom is
facing are daunting," said Fahad Nazer, who worked at the Saudi embassy in Washington and is now
a political analyst at JTG Inc. "Given the fact that some 70 percent of Saudis are under the age
of 30, Prince Mohammed's penchant for making quick decisions and holding officials accountable for
their performance – or lack thereof - does have wide support among Saudis."
Past rulers of Saudi Arabia have largely avoided seeking additional revenue from their citizens.
As water prices surged after the reduction in subsidies, Saudis turned to social media to express
their anger at the government. King Salman fired the water minister on Saturday.
Saudi leaders also have unique social challenges that other nations implementing economic changes
didn't have to manage. While steps have been taken to get women into the workforce, the kingdom still
prohibits them from driving. The country's feared religious police, despite having their powers to
arrest curbed this month, still enforce gender segregation and prayer times.
"The foremost challenge Mohammed bin Salman faces over time is the inevitable need to restructure
the Al Sauds' relationship with the Wahhabis," said James Dorsey, a senior fellow in international
studies at Nanyang Technological University in Singapore. "This restructuring is inevitable both
to be able to truly reform the economy and because the increasing toll identification with the puritan
sect is taking on Saudi Arabia's international reputation."
His efforts to shake up the economy come against the backdrop of mounting domestic security threats
and regional turmoil, with the Sunni-ruled kingdom bogged down in a war in Yemen against Shiite rebels
it says are backed by Iran. He has also consolidated more power than anyone in his position since
the founding of the kingdom.
"Within Saudi Arabia, the main challenges MbS will face will involve not the substance of
oil policy but rather resistance within the royal family to so much power being concentrated in the
hands of one prince of his generation," he said.
So perhaps the spiking money-market rates are more indicative of the potential for social unrest?
"... To me it sounds like Crown Prince Mohammed bin Salman is preparing his citizens for the day of reckoning. Why is bringing up this topic right now - probably because Saudi oil production is peaking right now. And whatever "transforming the economy away from oil" entails, the Saudi population won't like it. ..."
"... Well if KSA were going to sell wall-to-wall carpet for all these decades, maybe they can start selling the vacuum cleaners for it… and continue to put disaster capitalism to work for the kings and princes… ..."
"... "Here at Your Kingdom of Saudi Arabia™, we have just the right kind of nice soft sand for your sea-level-rise beach-replenishment projects. We also offer special discounts for all our low-lying island archipelago customers. Let us help you fill the holes that you dig yourselves out of. Wallahi, let it be YKSA." ..."
Riyadh (AFP) – Saudi Arabia said Monday it would create the world's largest sovereign investment
fund and sell shares in state energy giant Aramco under a vast plan unveiled to transform its
oil-dependent economy.
"We will not rest until our nation is a leader in providing opportunities for all through
education and training, and high quality services such as employment initiatives, health, housing
and entertainment," Mohammed wrote in an 84-page booklet outlining the plan.
If it works, Saudi Arabia "can live without oil by 2020".
To me it sounds like Crown Prince Mohammed bin Salman is preparing his citizens for the
day of reckoning. Why is bringing up this topic right now - probably because Saudi oil production
is peaking right now. And whatever "transforming the economy away from oil" entails, the Saudi
population won't like it.
Well if KSA were going to sell wall-to-wall carpet for all these decades, maybe they can start
selling the vacuum cleaners for it… and continue to put disaster capitalism to work for the kings
and princes…
"Here at Your Kingdom of Saudi Arabia™, we have just the right kind of nice soft sand for
your sea-level-rise beach-replenishment projects. We also offer special discounts for all our
low-lying island archipelago customers. Let us help you fill the holes that you dig yourselves
out of. Wallahi, let it be YKSA."
"We will not rest until our nation is a leader in providing opportunities for all through education
and training*, and high quality services such as employment initiatives**, health, housing and
entertainment***,"
* except for women and shiites
** for imported Indian and Pakistanis who live in slave-like conditions
*** And DON'T forget the entertainment! Maybe they could introduce NASCAR.
My wife, teaching a course in mathematical physics in a Swedish university, tossed a pair of
Saudi students out of her class (permanently) owing to their utter disrespect: constant disruptive
and insulting comments. In the end the Saudi embassy tried to intervene but the university stood
firm. The incident might have adversely affected Swedish-Saudi relations for awhile but the fact
remains: respect for women by Saudis doesn't exist; even a modicum of respect for a female teacher
is an impossible concept for them.
"... The US political system is dysfunctional and fully captured by neoliberals. That means that kicking the can down the road in economics requires low oil prices. So the US neoliberal elite will fight tooth and nail any substantial oil price increase from the current level, as this threaten neoliberal economic model and neoliberal globalization more then anything else. With oil around $100 shipping a 40-foot container from Shanghai to the U.S. costs around $8,000, compared to $3,000 if oil is in the $30-40 range. This increased shipping cost is the equivalent of a 9 percent tariff on all global trade, according to Canadian investment bank, CIBC World Markets. ..."
"... This reaction of neoliberal elite is one of the main reasons why the current oil price slump is so deep and so prolonged. It is like injection of steroids into ailing neoliberal economic organism. The Last Hurrah of neoliberal globalization, if you wish. Saudis at the end of the day are vassals of the USA and if the US elite really cared about the US shale industry and conventional oil producers, oil price would never dropped below $70-$60. ..."
"... That triple-digit oil prices will reverse globalization and bring about the re-emergence of local economies. In the kind of world that we'll soon be facing, distance costs money. In many cases, not in every case, moving your production to China and then importing those goods back to Western Europe or North America will be foolish. In other words, what you will save on labor costs you will more than lose on transport costs. Are your views controversial? ..."
Global economy tanks due to high oil prices but the solution to a sluggish economy is high oil
prices. Does anyone believe that there is a goldilocks price range that satisfies all factions?
Second point;
So for the history of humanity it has been a constant move to add larger quantities of cheaper,
easier to produce, more convenient to use energy sources but now all of a sudden industrial civilization
is supposedly going to continue on by "transitioning" to a highly complex, expensive, inconvenient,
toxic, sporadic, resource dependent "renewable energy"?
Jef, Does anyone believe that there is a goldilocks price range that satisfies all factions?
Good question.
My impression is that goldilocks price range for oil now is $80-160. One argument in favor
of this range is that it will allow more or less smooth transition of the US passenger car fleet
to more economic models. It will also stimulate switch of public transit transport and short range
trucks to natural gas. That also will provide stimulus for funding new technologies that might
help to increase fuel economy for example truck start blusters using pneumatics, better aerodynamics,
you name it. $5-a-gallon gasoline in the United States can do wonder with fuel economy in the
USA. And $7-a-gallon gasoline means total switch to hybrids in passenger car sector and death
of the current US infatuation with SUVs as personal transportation to work. It also might help
to cure a lot of stupid things that the global economy currently is suffering from like an Atlantic
salmon caught off the coast of Norway, then moves from that country to Germany, then to China
for filleting, and finally to a supermarket in North America. With $10 per gallon gasoline small
North America cities will be revitalized as commuting long distances by car to metropolitan centers
becomes unaffordable for all but the wealthy. Large suburban shopping centers will also wither.
That might revive smaller shops in the USA and spells trouble for Wal-Mart and Amazon.
But it is impossible to satisfy all factions. The USA neoliberal elite (which now dominated
both Democratic and Republican Parties - which as a result is, in effect, a single party exactly
like it was in the USSR, but with a nice brainwashing twist that convinces lemmings that there
are still two parties and provides a nice, extremely impressive spectacle when two preselected
by the elite candidates compete for the POTUS position; the trick that communists for some reason
did not use) needs to be dragged kicking and screaming to this range.
The US political system is dysfunctional and fully captured by neoliberals. That means
that kicking the can down the road in economics requires low oil prices. So the US neoliberal
elite will fight tooth and nail any substantial oil price increase from the current level, as
this threaten neoliberal economic model and neoliberal globalization more then anything else.
With oil around $100 shipping a 40-foot container from Shanghai to the U.S. costs around $8,000,
compared to $3,000 if oil is in the $30-40 range. This increased shipping cost is the equivalent
of a 9 percent tariff on all global trade, according to Canadian investment bank, CIBC World Markets.
That also spells deep troubles for China, so Chinese neoliberal elite is united with the USA
neoliberal elite in pushing oil prices down. In an ironic demonstration of the power of globalization,
China's troubles from high oil prices will be felt worldwide.
This reaction of neoliberal elite is one of the main reasons why the current oil price
slump is so deep and so prolonged. It is like injection of steroids into ailing neoliberal economic
organism. The Last Hurrah of neoliberal globalization, if you wish. Saudis at the end of the day
are vassals of the USA and if the US elite really cared about the US shale industry and conventional
oil producers, oil price would never dropped below $70-$60.
Globalization will soon be over, and it's the rising price of oil that will fuel this change.
So, at least, argues Jeff Rubin, former chief economist at CIBC World Markets, the investment
banking arm of the Canadian Imperial Bank of Commerce, in his new book, Why Your World Is About
to Get a Whole Lot Smaller: Oil and the End of Globalization. Rubin recently spoke with U.S.
News about the future of the world's energy habits and the implications for the globalized
economy. Excerpts:
What's the central argument of your book?
That triple-digit oil prices will reverse globalization and bring about the re-emergence
of local economies. In the kind of world that we'll soon be facing, distance costs money. In
many cases, not in every case, moving your production to China and then importing those goods
back to Western Europe or North America will be foolish. In other words, what you will save
on labor costs you will more than lose on transport costs. Are your views controversial?
I guess they're controversial in the sense that I'm saying the world we're soon going
to face isn't just about one variable-the wage rate-and that when you stop to consider what's
really required to have a globalized economy, it's very cheap oil prices and very cheap transport
costs. The controversial part of that is, in part, my argument that triple-digit oil prices
are going to become a permanent feature of our economy and not just a blip. How will the new
economy change global politics?
A lot of long-lost jobs are going to be coming home. Triple-digit oil prices in a perverse
sort of way is going to breathe new life into the rust belt. We already started to see
that just before the recession hit with a whole renaissance in industries like U.S. furniture
and U.S. steel, where transport costs were starting to make domestic producers competitive
again.
"... Lifting of the sanctions has given a major lift to Iran's economy. Last week the IMF reported that it expects Tehran's economy to grow by 4 percent this year. Iran is making an effort to collect the oil revenues from those countries that continued to take Iranian oil during the sanctions but were unable to transfer money to Tehran. Some 6.5 billion euros are said to be owing. ..."
Iran: The Iranians are now saying that their oil production will reach
pre-sanctions levels of 4 million b/d by June of this year, up from the 3.5
million b/d they claim to have produced in March. The addition of another 500,000
b/dwithin two months is certainly faster than anybody anticipated, but some
analysts are now saying it is possible. India's Reliance Industries recently
announced a long-term oil deal with Tehran.
Among the problems Iran would have in increasing production by 500,000 b/d
in the next few months is the lack of ships to move the oil to customers, if
they can find them. Many of the worlds' tankers are tied up in massive queues
at import and export terminals that are at loading and unloading capacity. Lingering
issues about US sanctions have left some tanker owners reluctant to get involved
with Tehran for fear they could be banned from doing business with the US. Much
of Iran's tanker fleet no longer meets safety standards and must be overhauled
before visiting foreign ports.
Lifting of the sanctions has given a major lift to Iran's economy. Last
week the IMF reported that it expects Tehran's economy to grow by 4 percent
this year. Iran is making an effort to collect the oil revenues from those countries
that continued to take Iranian oil during the sanctions but were unable to transfer
money to Tehran. Some 6.5 billion euros are said to be owing.
Tehran's final problem in increasing its oil export is to find foreign investors
willing to put money into its aging oil industry. While it may be possible to
increase oil production by the 500,000 b/d that Tehran is aiming for, further
production increases will require massive amounts of investment that will have
to be raised from foreign sources. Arguments in Tehran about how much foreigners
should be allowed to profit from exploiting Iranian oil continue. Iran's latest
revisions to proposed contracts for foreign oil companies are so unfavorable
that some doubt there will be many offers.
About 70 percent of the population of Saudi Arabia is under 30, and more
than 30 percent of that is unemployed. Five million new jobs would mean one
new job for roughly every six people in the country.
Riedel said he
expects to see just the outline of a plan. "They will announce a cautious
series of reforms, including opening up Aramco a little bit. They will
announce probably some cutbacks in subsidies." He said it's unclear whether
there will be any further detail on the sovereign wealth fund yet.
... ... ...
Since the sharp drop in oil prices, Saudi Arabia has been running
deficits and has dipped into its foreign reserves to cover shortfalls. It
has also floated debt, and this week it borrowed $10 billion from a
consortium of global banks in its first international loan deal in a quarter
century. The bank deal was seen as a step toward an international bond deal.
Prior to the oil price collapse, Saudi Arabia needed about $100 a barrel to
meet its budget, and that number has only dipped slightly.
Bin Salman has a great deal invested in the plan to broaden the kingdom's
revenue base while reducing unemployment and curbing subsidies. Second in
line to the throne, he has been seen as a rival to his cousin, Crown Prince
Muhammad bin Nayef, the heir apparent to 80-year-old King Salman.
"I think about this transformation plan. It makes him the center of
everything. It really does make him the most powerful person in that
country," Croft said.
Bin Salman has been seen as acquiring more power than his cousin, but
he's viewed as unpredictable.
"I think the longer this goes on, the more time he has to entrench
himself, the more power he amasses, the more he becomes inevitable. I find
his political skill craft genius. Just the sheer ability to consolidate
power with tremendous speed. He's like Frank Underwood on steroids," said
Croft, referring to the central figure in Netflix's "House of Cards," who
schemed his way into the presidency.
Bin Salman is different than other Saudi leaders in that he was educated
in the kingdom. He wears traditional dress and is popular with young Saudis.
"They see in Mohammad bin Salman someone of their own generation moving
up the ladder very quickly. He has a certain degree of popularity. He's
also grated a lot of people in the family who see him as abrasive,
inexperienced, undisciplined, impulsive," said Riedel. "In the long
run, the way Saudi Arabia works is it's more important to be important in
the family than it is in the street. This is an absolute monarchy."
... ... ...
Oppenheimer energy analyst Fadel Gheit said he is skeptical that
investors will see the transparency they would like when Aramco ultimately
comes to market. "It's going to be an enigma surrounded by secrecy," he
said. "Why would I invest in Aramco, if I could buy Shell, BP where there's
democracy, transparency." Gheit said he doubts much information on Aramco
compensation or capital spending authorization would become public.
"The reason they want to do this IPO is it will give them another window
in the global capital markets," he said. "I do not take this as a sign of a
healthy economy."
The kingdom has named JP Morgan and Michael Klein as advisors on the
Aramco deal.
"... All of them are already in decline, as well as fields discovered in the sixties and seventies. There are a few exception – fields discovered several decades ago, but developed only recently (Manifa in Saudi Arabia, Kashagan in Kazakhstan). ..."
"... Rystad Energy estimates that only 9 Billion boe were discovered during 2015. This is 30% down from 2014 which was an all-time low. For comparison, world oil production is in the order of 30+ billion barrels each year. ..."
"... only 19% of the produced conventional resources were replaced by new discovered volumes last year, says Nils-Henrik Bjurstrøm, Senior Project Manager, in Rystad Energy ..."
"... Regrettably, the negative trend continues. In January 2016, only 250 million boe were discovered (in comparison, the Goliath field in the Barents Sea has reserves of approximately 200 MMbo), indicating a possibility for an even lower exploration result in 2016, says Bjurstrøm. ..."
"... So potentially going from just 9 billion BOE in 2015 to maybe 3 billion BOE in 2016. When will the oil markets take notice of this? Also, wonder how much of that is natural gas and condensate? ..."
"... Nobody is arguing that "all the supergiants" will come off their plateaus at the same time. That's a cheap straw man argument. Plus it's meaningless because there's no sense of that "at the same time" means. ..."
"... We don't need all of the super giants to go into decline all at the same time - two or three going into decline within a five year period would suffice. Or just one - Gawhar - would do. I think the probability of several super giants going into decline more or less at the same time is quite possible. But since nobody knows what the probabilities are, making any statements about the probabilities is pointless. ..."
"... I agree. Furthermore, I think everyone here realizes most oil comes from oilfields discovered prior to 1970 and almost all oilfields that still produce an average of over 500,000 barrels per day are 70-ish years old. So, ignoring Ghawar, Burgan and Daquing, oilfields that HAD a productive capacity exceeding one million barrels a day include Samotlor (1965), Prudhoe Bay (1968) and Cantarell (1976). That's not a flush but it is three of a kind. ..."
"... And all of those 1mb/d+ supergiants are already in decline (the most recent – Daquing) ..."
From a statistics perspective the chances of all the supergiants coming off their plateaus
at about the same time is quite an unrealistic assumption. Do you guys get a lot of straight flushes
when you play poker (no wild cards)? I have played a little poker and have never seen a straight
flush in real life, only in the movies.
You are no doubt correct that the old supergiants won't all go into terminal decline together,
but it does seem reasonable to assume that most of them will peak and begin to go downhill within
some particular time frame measured from first production.
Now I am going to pull some numbers out of thin air to illustrate my point, and then maybe
somebody who knows more can elaborate on the significance of it.
Let us suppose that the really big oil fields mostly peak between say thirty and forty years
from first production.
It is my impression as a casual observer rather than a numbers cruncher or hands on investor
that just about all the really big oil fields were discovered and put into production at least
that long ago.
So taken as a group, they will probably begin going into decline AS A GROUP all together over
about the same time frame as they were discovered as a group.
Fields discovered and first produced in the fifties, if I am right about this, will probably
mostly all go into decline together over a period of about a decade or so, by way of example.
Basically what I am trying to say is that oil fields probably have a statistically predictable
life span, and that most of the really big ones are probably all roughly about the same age, in
terms of being produced. Nearly all of them will probably peak with in ten to fifteen more years,
since all of them are getting to be up around thirty or forty years of production history.
IIRC, it's been a hell of a long time since somebody discovered a new super giant or giant
field.
Somebody like Fernando ought to be able to take this observation and run with it.
"Fields discovered and first produced in the fifties, if I am right about this, will probably
mostly all go into decline together over a period of about a decade or so, by way of example."
All of them are already in decline, as well as fields discovered in the sixties and seventies.
There are a few exception – fields discovered several decades ago, but developed only recently
(Manifa in Saudi Arabia, Kashagan in Kazakhstan).
As I understand, the main sources of growth in global proved oil reserves in the past 10 years
were:
1) Rising oil prices, which enabled to include Venezuela's ultra-heavy oil from the Orinoco
belt and some other high-cost resources into proved reserve category;
2) New discoveries (which, as you say, are now much smaller than in previous decades);
3) Upward revisions of reserve estimate of the already developed fields due to reserves extension,
new reservoir discoveries in old fields, use of improved recovery techniques or equipment, etc.;
4) Inclusion of part of LTO resources into proved reserve category.
The contribution of new discoveries was actually a secondary factor.
The year 2015 was a global all-time low in terms of conventional oil and gas discoveries, says
Nils-Henrik Bjurstrøm in Rystad Energy.
Rystad Energy estimates that only 9 Billion boe were discovered during 2015. This is 30%
down from 2014 which was an all-time low. For comparison, world oil production is in the order
of 30+ billion barrels each year.
– As a result, only 19% of the produced conventional resources were replaced by new discovered
volumes last year, says Nils-Henrik Bjurstrøm, Senior Project Manager, in Rystad Energy ,
to geo365.no.
Regrettably, the negative trend continues. In January 2016, only 250 million boe were discovered
(in comparison, the Goliath field in the Barents Sea has reserves of approximately 200 MMbo),
indicating a possibility for an even lower exploration result in 2016, says Bjurstrøm.
Note: 9 Billion boe discovered during 2015 and 250 mboe discovered in 1Q16 are oil and gas.
And the discovered volumes are not immediately included in proved reserve category
So potentially going from just 9 billion BOE in 2015 to maybe 3 billion BOE in 2016. When
will the oil markets take notice of this? Also, wonder how much of that is natural gas and condensate?
Note: XOM produces over 4 million BOEPD. In 2015 proved reserves fell 24%. First time they
didn't replace 100% of reserves since 1990s.
Yes, I understand price has something to do with that. But still?
Exxon's total liquids proved reserves actually increased from 13713 million barrels on December
31, 2014 to 14724 million barrels on December 31, 2015
(source: 10-k)
There was a sharp downward revision in nat gas proved reserves, reflecting lower gas prices.
ExxonMobil Corp. added 1 billion boe of proved oil and gas reserves in 2015, replacing just
67% of production during the year compared with 115% over the past 10 years.
In 2014, the firm replaced 104% of its production by adding proved oil and gas reserves totaling
1.5 billion boe.
The 2015 total includes a 219% replacement ratio for crude oil and other liquids.
However, proved reserves of natural gas were reduced by 834 million boe primarily in the US, reflecting
the change in gas prices. The company expects this gas to be developed and booked as proved reserves
in the future.
At yearend, ExxonMobil's proved reserves totaled 24.8 billion boe. Liquids represented 59% of
proved reserves, up from 54% in 2014. ExxonMobil's reserves life at current production rates is
16 years.
Reserves during the year were added in Abu Dhabi, Canada, Kazakhstan, and Angola. Liquid additions
totaled 1.9 billion bbl.
ExxonMobil added 1.4 billion boe to its resource base through by-the-bit exploration discoveries,
undeveloped resource additions, and strategic acquisitions.
The firm's exploration activity in 2015 included the Liza oil discovery offshore Guyana (OGJ
Online, May 20, 2015), and additional discoveries in Iraq, Australia, Romania, and Nigeria. Strategic
unconventional resource additions were made in the Permian basin, Canada, and Argentina.
Overall, the company's resource base totaled more than 91 billion boe at yearend 2015, taking
into account field revisions, production, and asset sales. The resource base includes proved reserves,
plus other discovered resources that are expected to be ultimately recovered.
Really Dennis? From a statistics perspective? Assuming what probability distribution and correlation
matrix?
Nobody is arguing that "all the supergiants" will come off their plateaus at the same time.
That's a cheap straw man argument. Plus it's meaningless because there's no sense of that "at
the same time" means.
We don't need all of the super giants to go into decline all at the same time - two or
three going into decline within a five year period would suffice. Or just one - Gawhar - would
do. I think the probability of several super giants going into decline more or less at the same
time is quite possible. But since nobody knows what the probabilities are, making any statements
about the probabilities is pointless.
I agree. Furthermore, I think everyone here realizes most oil comes from oilfields discovered
prior to 1970 and almost all oilfields that still produce an average of over 500,000 barrels per
day are 70-ish years old. So, ignoring Ghawar, Burgan and Daquing, oilfields that HAD a productive
capacity exceeding one million barrels a day include Samotlor (1965), Prudhoe Bay (1968) and Cantarell
(1976). That's not a flush but it is three of a kind.
I was responding to a comment by George Kaplan, he said:
…all the supergiants have been developed with extensive IOR/EOR methods and may come off
plateau and collapse production at about the same time (for me this sudden high decline rate,
more than the actual peak is what is going to destroy the world economy if we don't do something
– in fact a lot – beforehand).
So based on the excellent comments by AlexS and Rune Likvern, we know that most of the supergiant
fields are already declining, but the question would be is it very likely they all begin a "collapse
in production" at about the same time time.
I believe the probability is low and I interpret "about the same time" as within 5 years and
"collapse in production" as a field decline of 10% or more.
It would be interesting in hearing other opinions on how likely this scenario is, I would guess
it is less than 5%.
Hi Doug,
Using the Wikipedia list of giant oil fields there are 59 fields that have a URR of 5 Gb or
more. The point is that the most notable "collapse" has been Cantarell, as long as the "collapse"
doesn't happen "at about the same time" in all 59 fields we are unlikely to see a steep decline
in World output, as long as there is adequate demand for oil to keep oil prices at a level where
it continues to be profitable to develop reserves.
If there is an economic collapse due to excessive debt, or some other reason (high oil prices
maybe), then decline might be steeper, essentially this will depend on the extent of the economic
downturn. That is difficult to predict.
"... The interview was presumably meant to be reassuring to the outside world, but instead it gives an impression of naivety and arrogance. There is also a sense that Prince Mohammed is an inexperienced gambler who is likely to double his stake when his bets fail. This is the very opposite of past Saudi rulers, who had always preferred, so to speak, to bet on all the horses. ..."
"... This is the second area in which Prince Mohammed's interview suggests nothing but trouble for the Saudi royal family. He suggests austerity and market reforms in the Kingdom, but in the context of Middle East autocracies and particularly oil states this breaches an unspoken social contract with the general population. People may not have political liberty, but they get a share in oil revenues through government jobs and subsidised fuel, food, housing and other benefits. Greater privatisation and supposed reliance on the market, with no accountability or fair legal system, means a licence to plunder by those with political power. ..."
"... This was one of the reasons for the uprising in 2011 against Bashar al-Assad in Syria and Muammar Gaddafi in Libya. So-called reforms that erode an unwieldy but effective patronage machine end up by benefiting only the elite. ..."
German intelligence memo shows the threat from the kingdom's headstrong defence minister
At the end of last year the BND, the German intelligence agency, published a remarkable one-and-a-half-page
memo saying that Saudi Arabia had adopted "an impulsive policy of intervention". It portrayed Saudi
defence minister and Deputy Crown Prince Mohammed bin Salman – the powerful 29-year-old favourite
son of the ageing King Salman, who is suffering from dementia – as a political gambler who is destabilising
the Arab world through proxy wars in Yemen and Syria.
Spy agencies do not normally hand out such politically explosive documents to the press criticising
the leadership of a close and powerful ally such as Saudi Arabia. It is a measure of the concern
in the BND that the memo should have been so openly and widely distributed. The agency was swiftly
slapped down by the German foreign ministry after official Saudi protests, but the BND's warning
was a sign of growing fears that Saudi Arabia has become an unpredictable wild card. One former minister
from the Middle East, who wanted to remain anonymous, said: "In the past the Saudis generally tried
to keep their options open and were cautions, even when they were trying to get rid of some government
they did not like."
The BND report made surprisingly little impact outside Germany at the time. This may have been
because its publication on 2 December came three weeks after the Paris massacre on 13 November,
when governments and media across the world were still absorbed by the threat posed by Islamic State
(IS) and how it could best be combatted. In Britain there was the debate on the RAF joining the air
war against IS in Syria, and soon after in the US there were the killings by a pro-IS couple in San
Bernardino, California.
It was the execution of the Shia cleric Sheikh Nimr al-Nimr and 46 others – mostly Sunni jihadis
or dissenters – on 2 January that, for almost the first time, alerted governments to the extent to
which Saudi Arabia had become a threat to the status quo. It appears to be deliberately provoking
Iran in a bid to take leadership of the Sunni and Arab worlds while at the same time Prince Mohammed
bin Salman is buttressing his domestic power by appealing to Sunni sectarian nationalism. What is
not in doubt is that Saudi policy has been transformed since King Salman came to the throne last
January after the death of King Abdullah.
The BND lists the areas in which Saudi Arabia is adopting a more aggressive and warlike policy.
In Syria, in early 2015, it supported the creation of The Army of Conquest, primarily made up of
the al-Qaeda affiliate the al-Nusra Front and the ideologically similar Ahrar al-Sham, which won
a series of victories against the Syrian Army in Idlib province. In Yemen, it began an air war directed
against the Houthi movement and the Yemeni army, which shows no sign of ending. Among those who gain
are al-Qaeda in the Arabian peninsula, which the US has been fruitlessly trying to weaken for years
by drone strikes.
None of these foreign adventures initiated by Prince Mohammed have been successful or are likely
to be so, but they have won support for him at home. The BND warned that the concentration of so
much power in his hands "harbours a latent risk that in seeking to establish himself in the line
of succession in his father's lifetime, he may overreach".
The overreaching gets worse by the day. At every stage in the confrontation with Iran over the
past week Riyadh has raised the stakes. The attack on the Saudi embassy in Tehran and its consulate
in Mashhad might not have been expected but the Saudis did not have to break off diplomatic relations.
Then there was the air strike that the Iranians allege damaged their embassy in Sana'a, the capital
of Yemen.
None of this was too surprising: Saudi-Iranian relations have been at a particularly low ebb since
400 Iranian pilgrims died in a mass stampede in Mecca last year.
But even in the past few days, there are signs of the Saudi leadership deliberately increasing
the political temperature by putting four Iranians on trial, one for espionage and three for terrorism.
The four had been in prison in Saudi Arabia since 2013 or 2014 so there was no reason to try them
now, other than as an extra pinprick against Iran.
Saudi Arabia has been engaging in something of a counter attack to reassure the world that it
is not going to go to war with Iran. Prince Mohammed said in an interview with The Economist: "A
war between Saudi Arabia and Iran is the beginning of a major catastrophe in the region, and it will
reflect very strongly on the rest of the world. For sure, we will not allow any such thing."
The interview was presumably meant to be reassuring to the outside world, but instead it gives
an impression of naivety and arrogance. There is also a sense that Prince Mohammed is an inexperienced
gambler who is likely to double his stake when his bets fail. This is the very opposite of past Saudi
rulers, who had always preferred, so to speak, to bet on all the horses.
A main reason for Saudi Arabia acting unilaterally is its disappointment that the US reached an
agreement with Iran over Tehran's nuclear programme. Again this looks naive: close alliance with
the US is the prime reason why the Saudi monarchy has survived nationalist and socialist challengers
since the 1930s. Aside from the Saudis' money and close alliance with the US, leaders in the Middle
East have always doubted that the Saudi state has much operational capacity. This is true of all
the big oil producers, whatever their ideological make-up. Experience shows that vast oil wealth
encourages autocracy, whether it is in Saudi Arabia, Iraq, Libya or Kuwait, but it also produces
states that are weaker than they look, with incapable administrations and dysfunctional armies.
This is the second area in which Prince Mohammed's interview suggests nothing but trouble for
the Saudi royal family. He suggests austerity and market reforms in the Kingdom, but in the context
of Middle East autocracies and particularly oil states this breaches an unspoken social contract
with the general population. People may not have political liberty, but they get a share in oil revenues
through government jobs and subsidised fuel, food, housing and other benefits. Greater privatisation
and supposed reliance on the market, with no accountability or fair legal system, means a licence
to plunder by those with political power.
This was one of the reasons for the uprising in 2011 against Bashar al-Assad in Syria and
Muammar Gaddafi in Libya. So-called reforms that erode an unwieldy but effective patronage machine
end up by benefiting only the elite.
Oil states are almost impossible to reform and it is usually unwise to try. Such states should
also avoid war if they want to stay in business, because people may not rise up against their rulers
but they are certainly not prepared to die for them.
"... Since King Salman succeeded to power in January, Saudi Arabia has orchestrated a military coalition to intervene in neighbouring Yemen to limit Iranian influence, increased support for Syrian rebels and made big changes in the royal succession. ..."
"... Germany's BND pointed to efforts by the two rivals to shape events in Syria, Lebanon, Bahrain and Iraq, with Saudi Arabia increasingly prepared to take military, political and financial risks to ensure it does not lose influence in the region. ..."
"... Iran, a major ally of Assad, denies having expansionist aims and accuses Saudi Arabia of undermining regional stability through its backing of Syrian rebels and intervention in Yemen. ..."
"... It pointed to risks stemming from the concentration of power in Prince Mohammad, who it said could get carried away with efforts to secure the royal family succession in his favour. ..."
"... Saudi Arabia faces a budget deficit that economists estimate could total $120 billion or more this year. This has led the Finance Ministry to close its national accounts a month early to control spending. ..."
"... Prince Mohammed, who is second-in-line to rule, is also the Saudi defence minister and head of a supercommittee on the economy. The young prince has enjoyed a dizzying accumulation of powers since his father became king and placed him in the line of succession ahead of dozens of cousins. ..."
BERLIN (Reuters) - Germany's BND foreign intelligence agency, in an unusual public statement issued
on Wednesday, voiced concern that Saudi Arabia was becoming impulsive in its foreign policy as powerful
young Deputy Crown Prince Mohammad bin Salman asserts himself.
The BND also said that with Saudi Arabia - the world's No. 1 oil exporter - losing confidence
in the United States as a guarantor of Middle East order, Riyadh appeared ready to take more risks
in its regional competition with Iran.
Since King Salman succeeded to power in January, Saudi Arabia has orchestrated a military coalition
to intervene in neighbouring Yemen to limit Iranian influence, increased support for Syrian rebels
and made big changes in the royal succession.
Riyadh has long viewed Iran as aggressive and expansionary and regarded its use of non-state proxies
such as Lebanon's Hezbollah and Iraqi Shi'ite militias as aggravating sectarian tensions and destabilising
the region. But under Salman, it has moved more assertively to counter its regional foe.
Germany's BND pointed to efforts by the two rivals to shape events in Syria, Lebanon, Bahrain
and Iraq, with Saudi Arabia increasingly prepared to take military, political and financial risks
to ensure it does not lose influence in the region.
"The thus far cautious diplomatic stance of the elder leaders in the royal family is being replaced
by an impulsive interventionist policy," the BND said, adding the Saudis remain committed to the
removal of Syrian President Bashar al-Assad.
Iran, a major ally of Assad, denies having expansionist aims and accuses Saudi Arabia of undermining
regional stability through its backing of Syrian rebels and intervention in Yemen.
The BND issued the 1-1/2 page report, entitled "Saudi Arabia - Sunni regional power torn between
foreign policy paradigm change and domestic policy consolidation", to some German media. Reuters
also obtained a copy.
It pointed to risks stemming from the concentration of power in Prince Mohammad, who it said could
get carried away with efforts to secure the royal family succession in his favour.
The BND said there was a risk he would irritate other royal family members and the Saudi people
with reforms, while undermining relations with friendly, allied states in the region.
Saudi Arabia faces a budget deficit that economists estimate could total $120 billion or more
this year. This has led the Finance Ministry to close its national accounts a month early to control
spending.
Prince Mohammed, who is second-in-line to rule, is also the Saudi defence minister and head of
a supercommittee on the economy. The young prince has enjoyed a dizzying accumulation of powers since
his father became king and placed him in the line of succession ahead of dozens of cousins.
(Reporting by Andreas Rinke; Writing by Paul Carrel; Editing by Noah Barkin/Mark Heinrich)
King Salman's son Mohammad seems to be piloting Saudi
Arabia into a series of ever more risky adventures.
In the past year, the Kingdom of Saudi Arabia has abandoned the cautious
fence-sitting that long characterised its diplomatic style in favour of an
unprecedented, hawkish antagonism. That this transformation coincides with the
meteoric rise of a previously little known prince – 30 year-old Mohammad bin Salman –
is no accident; it seems that the prince is now the power behind the throne.
Since the death of the first king of modern Saudi Arabia, Abdulaziz, in 1953, the
kingdom has been ruled by an increasingly elderly succession of six of his 45 sons;
the last incumbent, Abdullah, died last January aged 90 and was replaced by the
present king, Salman, who is 81 and rumoured to be suffering from dementia. The
youthful, sabre-rattling Prince Mohammad, insiders say, is Salman's favourite son by
his third and favourite wife, Fahda.
Salman has one remaining brother – 75 year-old Muqrin – who would normally have
been next in line for the throne. Whether alone, or at the instigation of others,
Salman
removed Muqrin from the succession three months after he became king. Prince
Mohammad now moved up the line of succession to become 'deputy Crown Prince', with
only his 56 year-old cousin, Mohammad bin Nayef between him and the throne.
King Salman then bestowed an astonishing array of portfolios and titles on his
inexperienced son, making him Defence Minister and Deputy Prime Minister – the very
same posts Salman himself occupied prior to inheriting the throne – as well as head
of the Economic Guidance Council and Chief of the Royal Court. Within weeks, bin
Nayef's court was merged with the Royal Court, now supervised by Prince Mohammad, and
one of his closest advisers was removed from the ruling cabinet.
No wonder Prince Mohammad feels mandated to pilot the kingdom into a series of
ever more risky adventures, earning himself the unofficial nickname 'Reckless'
and unfavourable comparisons with his highly intelligent half-brother, 56 year-old
Prince Sultan bin Salman, who became the first Arab astronaut in 1986 and is
currently languishing in obscurity as head of the Saudi Tourist Board.
At the heart of all Sunni Saudi Arabia's current woes is its longstanding
sectarian and political rivalry with the Shi'a republic of Iran. The toppling of the
Shah by the 1979 Islamic revolution struck fear into the Saudi royals' hearts and
consolidated Riyadh's political and military dependence on the west.
Just as King Salman got comfortable on the throne,
everything started to go wrong.
Until very recently, Iran was isolated and under heavy sanctions, the bête
noire of the west, harbouring nuclear ambitions and an aggressive attitude
towards 'the great Satan', America, and its client state, Israel. Meanwhile, Saudi
Arabia could do no wrong – despite its appalling
human
rights record,
oppression of women and rampant
corruption. Pliable and
passive in its regional politics, Washington's willing ally eagerly swapped billions
of petro-dollars for sophisticated military hardware, aircraft and weapons. Margaret
Thatcher had a special department for pushing through the
al-Yamamah
arms deal which involved record amounts of dollars and corruption. This 'special
relationship' endured: the flag over Buckingham Palace flew at half-mast when King
Abdullah passed on in January last year and David Cameron, Barack Obama and François
Hollande were among many world leaders who travelled to Riyadh for the late monarch's
memorial.
But just as King Salman got comfortable on the throne, everything started to go
wrong for the desert kingdom.
First, the west suddenly woke up to how deeply entrenched the Islamic State (IS)
had become on both sides of the Iraq/Syria border as it set about building its
'Caliphate'; this problem now replaced the removal of Syrian President Bashar
al-Assad as regional priority number one. Before this complication, alignment in
Syria had been relatively simple and along sectarian fault lines: the Alawite (a
branch of Shi'ism) Assad regime was backed by Iran, Iraq, Russia and China, while the
mainly Sunni opposition was championed by Saudi Arabia, most Gulf states, Turkey, the
US, UK and several European countries.
Recognising the growing predominance of Islamic extremists within the opposition
(a situation actively fostered by Saudi Arabia) the west now preferred a political
solution to the Syrian civil war and reluctantly conceded – largely under Russian
pressure – that this could not be achieved without Iran. Furthermore, it looked
increasingly likely that IS could not be defeated without the co-operation of the
Syrian army, transforming Assad – temporarily at least – from the problem to part of
the solution.
To the dismay of the Saudis, Washington began to court Tehran, creating a vehicle
for rapprochement by bump-starting the
nuclear limitation agreement which had been stalled for thirteen years but now
accelerated to the finishing line in a matter of months. Concluded in July, it was
finally signed by President Obama in October last year and Tehran was invited to the
Vienna conference on Syria the same month. In addition, Iranian assets were unfrozen
and sanctions lifted.
Not only did the Saudis feel betrayed, but they now faced another problem as a
result. Since November 2014, they had been exerting their considerable influence on
OPEC to keep pumping oil at levels
above the agreed ceiling, despite falling prices. Ostensibly aimed at pricing the
American fracking industry out of the market, it was also political, intended to harm
the economies of oil-rich Iran and Russia – both under international sanctions at the
time. Tehran now called Saudi Arabia's bluff, announcing that as soon as sanctions
were lifted it would
pump a million extra barrels a day. Suddenly the tables were turned and it was
the Saudi economy that was at risk, with the
IMF warning in October 2015 that the nation would bankrupt itself within five
years – despite its gargantuan sovereign funds – if it did not reverse its policy.
Nor is this the only drain on Saudi finances. Since March it has been bombarding
the Iranian-backed Houthi rebels
in Yemen, presumably at the instigation of Prince Mohammad (with his defence
minister hat on). Saudi Arabia has no history or experience of unilateral armed
intervention – it sent 3,000 soldiers to each of the major Arab-Israeli wars and a
few more to the first Gulf War – yet the prince believed that the Houthis would be
defeated in a matter of days. Ten months on, with no plan B and no exit strategy,
nothing has been achieved but the devastation of the poorest country in the Middle
East and the deaths of thousands of innocent civilians. Analysts estimate that the
financial cost of this adventure has already topped $60 billion. With oil revenues at
rock bottom, the Saudi treasury has sold billions of dollars' worth of European
stocks to meet the ongoing costs of this unwinnable war.
The question is why, when the world stands at the
brink of a catastrophic conflict, take any side at all?
Things took an even more hawkish turn last week when the Saudi regime took the
decision to behead a well-known dissident Shi'a cleric,
Sheikh Nimr al-Nimr. There were riots in Tehran where the
Saudi Embassy was set on fire; Riyadh immediately cut all
diplomatic ties with Iran and shortly afterwards a Saudi
airstrike damaged the Iranian embassy in Sanaa, Yemen. The resulting tension has
sent shock-waves through the region, with many fearing a war between the two powers
as the Saudis seek to enlist the support of fellow Sunni nations.
With the headstrong Prince Mohammad at the helm, backing down does not appear to
be an option… and if the war-chest runs out, contingencies are in place. In an
interview last week with The
Economist, Prince Mohammad revealed a plan to float Aramco – the trillion
dollar nationalised oil company and the country's most valuable asset – on the
international markets and sell billions worth of nationally-owned prime land for
private development. In addition, subsidies for the needy will be slashed and the
education and healthcare systems privatised, putting them out of reach for the
poorest members of society.
In Gulf countries, autocratic systems are generally tolerated due to an unspoken
contract between government and the people that everyone benefits from the nation's
wealth (albeit extremely unequally); Prince Mohammad's Thatcherite vision, if
implemented, risks widespread civil unrest. In addition, the restive Shi'a population
in the east is sitting on top of the country's largest oil fields and distribution
centres.
Saudi influence abroad has always been predicated on its wealth and can be
expected to diminish along with its coffers. Nevertheless, Prince Mohammad adopted
the diplomatic style of George W. Bush in his search for allies: 'Who's not with us
is against us'. The right wing press has apparently already made its decision: the
Daily Telegraphdeclared that "Britain Must Side With Saudi Arabia",
whileRoger
Boyesin The Timesopined "execution by sword is
brutal but Riyadh remains our best hope for peace in the Middle East"… well that's
not what they say about the Islamic State. In fact, the past year saw a record number
of beheadings in Saudi Arabia and 157 executions in all.
None of this is to say that Iran is any better – both theocracies are intolerant,
oppressive and cruel. The question is why, when the world stands at the brink of a
catastrophic conflict, take any side at all? Shouldn't Britain and America,
supposedly 'developed' countries claiming to be beacons of progress and democracy, be
brokering the rapprochement between these two extremist regimes that is key to
regional peace, and a political solution to the Syrian crisis? Shouldn't the west be
exercising the undoubted influence it still possesses in the Royal Palace to urge
more caution, more debate?
If the west persists, instead, in following a deluded prince into an unwinnable
battle against a fabricated monster, it might as well champion Don Quixote tilting at
windmills and declaring "a righteous war and the removal of so foul a brood from off
the face of the earth is a service God will bless".
Teapot refiners continue to show ability to process additional volumes of oil, which suggest that
a Chinese economy might be turning a corner
Notable quotes:
"... In the first quarter of this year China diverted about 787,000 barrels per day into its strategic stockpile, the highest rate since Bloomberg has been tracking the data in 2004. Overall, as of March, China was importing around 7.7 million barrels per day. ..."
"... These so-called "teapot refineries," with capacities of around 20,000 to 100,000 barrels of production per day, struggled under the old restrictions, producing at only 30 to 40 percent of capacity because of an inability to import oil. That has changed, and domestic refining production is set to rise, and with it, so are imports. ..."
In the first quarter of this year China diverted about 787,000 barrels per day into its strategic
stockpile, the highest rate since Bloomberg has been tracking the data in 2004. Overall, as of March,
China was importing around 7.7 million barrels per day.
... ... ...
Another source of additional demand comes from a policy change in the downstream sector. The central
government recently
loosened the rules on oil imports, allowing smaller refineries to import more crude oil.
These so-called "teapot refineries," with capacities of around 20,000 to 100,000 barrels of production
per day, struggled under the old restrictions, producing at only 30 to 40 percent of capacity because
of an inability to import oil. That has changed, and domestic refining production is set to rise,
and with it, so are imports.
"... 'There's an interesting theory – called the 'green paradox' – that low oil prices are in part the reaction of an industry fearful of the impacts of climate change policy on its future revenues. ..."
"... The German economist Hans-Werner Sinn has argued that "if suppliers feel threatened by a gradual greening of economic policies.. they will extract their stocks more rapidly" thus pushing their prices down' ..."
There's a new parliamentary group in UK on Limits to Growth that had it's
first meeting this week.
'A 2015 analysis of the remaining fossil fuel resources in China, USA,
Canada and Australia, which includes unconventional resources, suggests
that overall oil production is in fact peaking already'
I hadn't heard this before:
'There's an interesting theory – called the 'green paradox' – that
low oil prices are in part the reaction of an industry fearful of the impacts
of climate change policy on its future revenues.
The German economist Hans-Werner
Sinn has argued that "if suppliers feel threatened by a gradual greening
of economic policies.. they will extract their stocks more rapidly" thus
pushing their prices down'
"... Oil discoveries have dropped to being almost insignificant over the last 5 years, ..."
"... There is very little reserve growth on discoveries over the last 10 years ..."
"... The arctic is at least 25 years away or never the Atlantic and Pacific coasts are off limits, ..."
"... The current CAPEX collapse is going to be extremely disruptive ..."
"... Once investors see oil companies repeatedly unable to replace reserves they will pull all their money, ..."
"... All the supergiants have been developed with extensive IOR/EOR methods and may come off plateau and collapse production at about the same time ..."
"... Spot on George. The only thing I might have included in your list is Reservoir Creaming whereby horizontal production holes are put across the caps of oil pools to maintain high production rates at the expense of increasing depletion rates. This seems to have become standard practice ..."
"... All your six points are true (although point 5 needs clarification - you need stable oil price and diminishing reserves for this to happen; otherwise speculative forces will drive stock prices up in anticipation of higher oil prices). ..."
I think things will be worse than Jeffersons study indicates for several
reasons:
Oil discoveries have dropped to being almost insignificant over
the last 5 years,
There is very little reserve growth on discoveries over the
last 10 years (technology is so good now at estimating the oil
in place, projects are so expensive that the operators need to know
exactly what they will recover before investing, and putative drilling
in deep sea is too expensive),
The arctic is at least 25 years away or never the Atlantic and
Pacific coasts are off limits,
The current CAPEX collapse is going to be extremely disruptive
(the GoM curve above stops just at the point when production is going
to collapse as there will be very few new projects being completed and
the surge of projects that came online over the last 2 to 3 years will
suddenly come off their short plateaus and go into 10% plus decline
rates,
Once investors see oil companies repeatedly unable to replace
reserves they will pull all their money,
All the supergiants have been developed with extensive IOR/EOR
methods and may come off plateau and collapse production at about the
same time (for me this sudden high decline rate, more than the
actual peak is what is going to destroy the world economy if we don't
do something – in fact a lot – beforehand).
Spot on George. The only thing I might have included in your list is
Reservoir Creaming whereby horizontal production holes are put across the
caps of oil pools to maintain high production rates at the expense of increasing
depletion rates. This seems to have become standard practice.
All your six points are true (although point 5 needs clarification
- you need stable oil price and diminishing reserves for this to happen;
otherwise speculative forces will drive stock prices up in anticipation
of higher oil prices).
So the main efforts now should be in oil conservation area and to start
those we heed high (as in over $100 per barrel) oil price. And I think it
is coming.
"... As for OPEC reserves, I have no clue how those are arrived at, same as I seriously doubt Kuwait is producing almost 3 million BOPD from less than 2,000 oil wells, especially as the major field, Burgan, had first production 70 years ago. ..."
"... I would note your chart ends in 2014. The average oil price in 2014 was about $95 WTI. ..."
"... As Warren Buffet is fond of saying, it's only when the tide goes out that you find out who's been swimming naked. It should be obvious to anyone that countries with static reserve numbers are not being truthful. But there is a willingness among analysts and news providers to accept the published numbers. What else can they do? They can't make up their own numbers or rely on guesses from gadfly oil watchers. When production from these coutries starts going into steady decline, the truth will be known. ..."
"... Venezuela Orinoco Belt accounted for 68% of the increase in the world proved oil reserves between 2005-14, according to BP's estimate. This is entirely due to higher oil prices. Interestingly, according to BP's estimate, Canada' oil reserves actually declined in the past 10 years. ..."
Given that proved reserves are largely a function of price it is inevitable that reserves would
significantly drop as price dropped. The only reasons proved reserves have grown over the last
ten years when very few new discoveries have been made has been refined drilling techniques (fracking)
and high prices.
Andrew, although proven reserves are reserves that must be "economically recoverable" and that
would change somewhat if the price of oil changes drastically, you will find that no oil company
or nation changes their reserves up or down with the price of oil. It is assumed that what is
economically recoverable will average out as the oil price moves up and down over the years.
So no, proven reserves are not largely a function of the price of oil as you put it.
Proven reserves should decline as the oil is extracted and only about one fourth of the extracted
oil is replaced with new discoveries. But neither nations nor oil companies change their stated
proven reserves in response to the changes in the price of oil.
Publically traded oil companies are obliged to change the value of their proven reserves
up or down according to the price of oil however, but not the amount in barrels.
Ron: SEC rules do require reserve changes as oil prices change. This is reflected in the standard
measure forms. However, we can change opex and do have other considerations….for example, when
prices drop we cover the required reserve drop with performance increases (if we can back it up).
It's all done in a back office ceremony we do while wearing black robes and golden masks. So I
can't discuss it any more.
Reserves calculated per SEC guidelines definitely are affected by oil prices, although as Fernando
seems to imply, especially when there has been such a large crash in price, some magic is performed.
As for OPEC reserves, I have no clue how those are arrived at, same as I seriously doubt
Kuwait is producing almost 3 million BOPD from less than 2,000 oil wells, especially as the major
field, Burgan, had first production 70 years ago.
I would note your chart ends in 2014. The average oil price in 2014 was about $95 WTI.
As Warren Buffet is fond of saying, it's only when the tide goes out that you find out who's
been swimming naked. It should be obvious to anyone that countries with static reserve numbers
are not being truthful. But there is a willingness among analysts and news providers to accept
the published numbers. What else can they do? They can't make up their own numbers or rely on
guesses from gadfly oil watchers. When production from these coutries starts going into steady
decline, the truth will be known.
Venezuela Orinoco Belt accounted for 68% of the increase in the world proved oil reserves
between 2005-14, according to BP's estimate. This is entirely due to higher oil prices. Interestingly,
according to BP's estimate, Canada' oil reserves actually declined in the past 10 years.
World proved oil reserves (billion barrels)
source: BP Statistical Review of World Energy 2015
"... So when you read about the Dallas Fed telling wildcatters with billions in outstanding high yield debt to hide their losses the implication of this is that the Fed has their back. It's choreography. Eduardo Quince , April 23, 2016 at 12:29 pm I think you give the Fed way too much credit. The Fed is a one-trick pony with tunnel vision, blind to the fact that it's policies are deflationary. So when you read about the Dallas Fed telling wildcatters with billions in outstanding high yield debt to hide their losses the implication of this is that the Fed has their back. No, I'd say that the implication is that the Fed is trying to maintain confidence in the Potemkin economy. ..."
The author blames the oil patch bust on a geophysical crisis. There is some truth to this argument
but by far the biggest driver of the bust is Fed policy. Artificially cheap debt financing led
to overcapacity and a vicious cycle of continued overproduction as drillers desperately try to
avoid defaulting.
There is method to central bank madness. It has been apparent for 40 years that we were on
a collision course with survival. Exxon knew it in the 70s. This article raises the question,
Will the end of fossil fuels take down the economy? The answer is no. Because the economy came
to a screeching halt in 2007 already. Everything since then is ersatz – not based on fossil fueled
capitalism at all. And as we can see it is working, albeit it to most people's frustration.
As Hillary said, "We are taking down coal and oil" and using natgas as a bridge fuel until
renewables replace natgas too. Is it possible that the Fed doesn't know this? What a funny thought.
So when you read about the Dallas Fed telling wildcatters with billions in outstanding high
yield debt to hide their losses the implication of this is that the Fed has their back. It's choreography.
I think you give the Fed way too much credit. The Fed is a one-trick pony with tunnel vision,
blind to the fact that it's policies are deflationary.
So when you read about the Dallas Fed telling wildcatters with billions in outstanding
high yield debt to hide their losses the implication of this is that the Fed has their back.
No, I'd say that the implication is that the Fed is trying to maintain confidence in the Potemkin
economy.
"As the source close to Riyadh advances, "the real nuclear option for
the Saudis would be to cooperate with Russia in a new alliance to cut back oil production
20% for all of OPEC, in the process raising the oil price to $200.00 a barrel to make up
for lost revenue, forced on them by the United States." This is what the West fear like
the plague. And this is what the perennial vassal, the House of Saud, will never have the
balls to pull off. "
That's silly. He is definitely a leftee,
but, in case you do not know, Pravda no longer exists.
And that does not disqualifies him any more then Bloomberg shilling for Saudi and
all other disingenuous "low oil price forever" MSM. We should be able to filter out outright
propaganda, aren't we?
I am more interested in new facts that he reports and which might well be true, like
A famous 3 am call did take place in Doha on Sunday. The young Salman called the
Saudi delegation and told them the deal was off. Every other energy market player
was stunned by the reversion.
So, if true, it looks like somebody played young gambler prince card again to prevent/slow
down the process of normalization of oil prices.
That makes it more difficult to deny that the collapse of oil prices was not, at least
in part, an engineered event.
"... "U.S. Secretary of State John Kerry sidestepped the issue (of a US-Saudi plot) after a trip to Saudi Arabia in September. Asked if past discussions with Riyadh had touched on Russia's need for oil above $100 to balance its budget, he smiled and said: "They (Saudis) are very, very well aware of their ability to have an impact on global oil prices." ( Saudi oil policy uncertainty unleashes the conspiracy theorists , Reuters) ..."
"... Of course, they're in bed together. Saudi Arabia is a US client. It's not autonomous or sovereign in any meaningful way. It's a US protectorate, a satellite, a colony. They do what they're told. Period. True, the relationship is complex, but let's not be ridiculous. The Saudis are not calling the shots. The idea is absurd. Do you really think that Washington would let Riyadh fiddle prices in a way that destroyed critical US domestic energy industries, ravaged the junk bond market, and generated widespread financial instability without uttering a peep of protest on the matter? ..."
"... Dream on! If the US was unhappy with the Saudis, we'd all know about it in short-order because it would be raining Daisy Cutters from the Persian Gulf to the Red Sea, which is the way that Washington normally expresses its displeasure on such matters. The fact that Obama has not even alluded to the shocking plunge in prices just proves that the policy coincides with Washington's broader geopolitical strategy. ..."
"... It happened again in 1986, when Saudi Arabia-led OPEC allowed prices to drop precipitously, and then in 1990, when the Saudis sent prices plummeting as a way of taking out Russia, which was seen as a threat to their oil supremacy. In 1998, they succeeded. When the oil price was halved from $25 to $12, Russia defaulted on its debt. ..."
"... Bottom line: Falling oil prices and the plunging ruble are not some kind of free market accident brought on by oversupply and weak demand. That's baloney. They're part of a broader geopolitical strategy to strangle the Russian economy, topple Putin, and establish US hegemony across the Asian landmass. It's all part of Washington's plan to maintain its top-spot as the world's only superpower even though its economy is in irreversible decline. ..."
"Saudi oil policy… has been subject to a great deal of wild and inaccurate conjecture in recent
weeks. We do not seek to politicize oil… For us it's a question of supply and demand, it's purely
business."
– Ali al Naimi, Saudi Oil Minister
"There is no conspiracy, there is no targeting of anyone. This is a market and it goes up and
down."
– Suhail Bin Mohammed al-Mazroui, United Arab Emirates' petroleum minister
"We all see the lowering of oil prices. There's lots of talk about what's causing it. Could
it be an agreement between the U.S. and Saudi Arabia to punish Iran and affect the economies of
Russia and Venezuela? It could."
Are falling oil prices part of a US-Saudi plan to inflict economic damage on Russia, Iran and
Venezuela?
Venezuelan President Nicolas Maduro seems to think so. In a recent interview that appeared in
Reuters, Maduro said he thought the United States and Saudi Arabia wanted to drive down oil prices
"to harm Russia."
Bolivian President Evo Morales agrees with Maduro and told journalists at RT that: "The reduction
in oil prices was provoked by the US as an attack on the economies of Venezuela and Russia. In the
face of such economic and political attacks, the nations must be united."
Iranian President Hassan Rouhani said the same thing,with a slightly different twist: "The main
reason for (the oil price plunge) is a political conspiracy by certain countries against the interests
of the region and the Islamic world … Iran and people of the region will not forget such … treachery
against the interests of the Muslim world."
US-Saudi "treachery"? Is that what's really driving down oil prices?
Not according to Saudi Arabia's Petroleum Minister Ali al-Naimi. Al-Naimi has repeatedly denied
claims that the kingdom is involved in a conspiracy. He says the tumbling prices are the result of
"A lack of cooperation by non-OPEC production nations, along with the spread of misinformation and
speculator's greed." In other words, everyone else is to blame except the country that has historically
kept prices high by controlling output. That's a bit of a stretch, don't you think? Especially since–according
to the Financial Times - OPEC's de facto leader has abandoned the cartel's "traditional strategy"
and announced that it won't cut production even if prices drop to $20 per barrel.
Why? Why would the Saudis suddenly abandon a strategy that allowed them to rake in twice as much
dough as they are today? Don't they like money anymore?
And why would al-Naimi be so eager to crash prices, send Middle East stock markets into freefall,
increase the kingdom's budget deficits to a record-high 5 percent of GDP, and create widespread financial
instability? Is grabbing "market share" really that important or is there something else going on
here below the surface?
The Guardian's Larry Elliot thinks the US and Saudi Arabia are engaged a conspiracy to push down
oil prices. He points to a September meeting between John Kerry and Saudi King Abdullah where a deal
was made to boost production in order to hurt Iran and Russia. Here's a clip from the article titled
"Stakes are high as US plays the oil card against Iran and Russia":
"…with the help of its Saudi ally, Washington is trying to drive down the oil price by flooding
an already weak market with crude. As the Russians and the Iranians are heavily dependent on oil
exports, the assumption is that they will become easier to deal with…
John Kerry, the US secretary of state, allegedly struck a deal with King Abdullah in September
under which the Saudis would sell crude at below the prevailing market price. That would help
explain why the price has been falling at a time when, given the turmoil in Iraq and Syria caused
by Islamic State, it would normally have been rising.
The Saudis did something similar in the mid-1980s. Then, the geopolitical motivation for a
move that sent the oil price to below $10 a barrel was to destabilize Saddam Hussein's regime.
This time, according to Middle East specialists, the Saudis want to put pressure on Iran and to
force Moscow to weaken its support for the Assad regime in Syria… (Stakes
are high as US plays the oil card against Iran and Russia, Guardian)
That's the gist of Elliot's theory, but is he right?
Vladimir Putin isn't so sure. Unlike Morales, Maduro and Rouhani, the Russian president has been
reluctant to blame falling prices on US-Saudi collusion. In an article in Itar-Tass, Putin opined:
"There's a lot of talk around" in what concerns the causes for the slide of oil prices, he
said at a major annual news conference. "Some people say there is conspiracy between Saudi Arabia
and the US in order to punish Iran or to depress the Russian economy or to exert impact on Venezuela."
"It might be really so or might be different, or there might be the struggle of traditional
producers of crude oil and shale oil," Putin said. "Given the current situation on the market
the production of shale oil and gas has practically reached the level of zero operating costs."
(Putin says oil market price conspiracy
between Saudi Arabia and US not ruled out, Itar-Tass)
As always, Putin takes the most moderate position, that is, that Washington and the Saudis may
be in cahoots, but that droopy prices might simply be a sign of over-supply and weakening demand.
In other words, there could be a plot, but then again, maybe not. Putin is a man who avoids passing
judgment without sufficient evidence.
The same can't be said of the Washington Post. In a recent article, WP journalist Chris Mooney
dismisses anyone who thinks oil prices are the result of US-Saudi collaboration as "kooky conspiracy
theorists". According to Mooney:
"The reasons for the sudden (price) swing are not particularly glamorous: They involve factors
like supply and demand, oil companies having invested heavily in exploration several years ago
to produce a glut of oil that has now hit the market - and then, perhaps, the "lack of cohesion"
among the diverse members of OPEC." (Why
there are so many kooky conspiracy theories about oil, Washington Post)
Oddly enough, Mooney disproves his own theory a few paragraphs later in the same piece when he
says:
"Oil producers really do coordinate. And then, there's OPEC, which is widely referred to in
the press as a "cartel," and which states up front that its mission is to "coordinate and unify
the petroleum policies" of its 12 member countries…. Again, there's that veneer of plausibility
to the idea of some grand oil related strategy." (WP)
Let me get this straight: One the one hand Mooney agrees that OPEC is a cartel that "coordinates
and unify the petroleum policies", then on the other, he says that market fundamentals are at work.
Can you see the disconnect? Cartels obstruct normal supply-demand dynamics by fixing prices, which
Mooney seems to breezily ignore.
Also, he scoffs at the idea of "some grand oil related strategy" as if these cartel nations were
philanthropic organizations operating in the service of humanity. Right. Someone needs to clue Mooney
in on the fact that OPEC is not the Peace Corps. They are monopolizing amalgam of cutthroat extortionists
whose only interest is maximizing profits while increasing their own political power. Surely, we
can all agree on that fact.
What's really wrong with Mooney's article, is that he misses the point entirely. The debate is
NOT between so-called "conspiracy theorists" and those who think market forces alone explain the
falling prices. It's between the people who think that the Saudis decision to flood the market is
driven by politics rather than a desire to grab "market share." That's where people disagree. No
denies that there's manipulation; they merely disagree about the motive. This glaring fact seems
to escape Mooney who is on a mission to discredit conspiracy theorists at all cost. Here's more:
(There's) "a long tradition of conspiracy theorists who have surmised that the world's great
oil powers - whether countries or mega-corporations - are secretly pulling strings to shape world
events."…
"A lot of conspiracy theories take as their premise that there's a small group of people who
are plotting to control something, to control the government, the banking system, or the main
energy source, and they are doing this to the disadvantage of everybody else," says University
of California-Davis historian Kathy Olmsted, author of "Real Enemies: Conspiracy Theories and
American Democracy, World War I to 9/11″. (Washington Post)
Got that? Now find me one person who doesn't think the world is run by a small group of rich,
powerful people who operate in their own best interests? Here's more from the same article:
(Oil) "It's the perfect lever for shifting world events. If you were a mad secret society with
world-dominating aspirations and lots of power, how would you tweak the world to create cascading
outcomes that could topple governments and enrich some at the expense of others? It's hard to
see a better lever than the price of oil, given its integral role in the world economy." (WP)
"A mad secret society"? Has Mooney noticed that - in the last decade and a half - the US has only
invaded nations that have huge natural resources (mainly oil and natural gas) or the geography for
critical pipeline routes? There's nothing particularly secret about it, is there?
The United States is not a "mad secret society with world-dominating aspirations". It's a empire
with blatantly obvious "world-dominating aspirations" run by political puppets who do the work of
wealthy elites and corporations. Any sentient being who's bright enough to browse the daily headlines
can figure that one out.
Mooney's grand finale:
"So in sum, with a surprising and dramatic event like this year's oil price decline, it would
be shocking if it did not generate conspiracy theories. Humans believe them all too easily. And
they're a lot more colorful than a more technical (and accurate) story about supply and demand."
(WP)
Ah, yes. Now I see. Those darn "humans". They're so weak-minded they'll believe anything you tell
them, which is why they need someone as smart as Mooney tell them how the world really works.
Have you ever read such nonsense in your life? On top of that, he gets the whole story wrong.
This isn't about market fundamentals. It's about manipulation. Are the Saudis manipulating supply
to grab market share or for political reasons? THAT'S THE QUESTION. The fact that they ARE manipulating
supply is not challenged by anyone including the uber-conservative Financial Times that deliberately
pointed out that the Saudis had abandoned their traditional role of cutting supply to support prices.
That's what a "swing state" does; it manipulates supply keep prices higher than they would be if
market forces were allowed to operate unimpeded.
So what is the motive driving the policy; that's what we want to know?
Certainly there's a strong case to be made for market share. No one denies that. If the Saudis
keep prices at rock bottom for a prolonged period of time, then a high percentage of the producers
(that can't survive at prices below $70 per barrel) will default leaving OPEC with greater market
share and more control over pricing.
So market share is certainly a factor. But is it the only factor?
Is it so far fetched to think that the United States–which in the last year has imposed harsh
economic sanctions on Russia, made every effort to sabotage the South Stream pipeline, and toppled
the government in Kiev so it could control the flow of Russian gas to countries in the EU–would coerce
the Saudis into flooding the market with oil in order to decimate the Russian economy, savage the
ruble, and create favorable conditions for regime change in Moscow? Is that so hard to believe?
Apparently New York Times columnist Thomas Freidman doesn't think so. Here's how he summed it
up in a piece last month: "Is it just my imagination or is there a global oil war underway pitting
the United States and Saudi Arabia on one side against Russia and Iran on the other?"
It sounds like Freidman has joined the conspiracy throng, doesn't it? And he's not alone either.
This is from Alex Lantier at the World Socialist Web Site:
"While there are a host of global economic factors underlying the fall in oil prices, it is
unquestionable that a major role in the commodity's staggering plunge is Washington's collaboration
with OPEC and the Saudi monarchs in Riyadh to boost production and increase the glut on world
oil markets.
As Obama traveled to Saudi Arabia after the outbreak of the Ukraine crisis last March, the
Guardian wrote, "Angered by the Soviet invasion of Afghanistan in 1979, the Saudis turned on the
oil taps, driving down the global price of crude until it reached $20 a barrel (in today's prices)
in the mid-1980s… [Today] the Saudis might be up for such a move-which would also boost global
growth-in order to punish Putin over his support for the Assad regime in Syria. Has Washington
floated this idea with Riyadh? It would be a surprise if it hasn't." (Alex Lantier,
Imperialism
and the ruble crisis, World Socialist Web Site)
And here's an intriguing clip from an article at Reuters that suggests the Obama administration
is behind the present Saudi policy:
"U.S. Secretary of State John Kerry sidestepped the issue (of a US-Saudi plot) after a trip to
Saudi Arabia in September. Asked if past discussions with Riyadh had touched on Russia's need for
oil above $100 to balance its budget, he smiled and said: "They (Saudis) are very, very well aware
of their ability to have an impact on global oil prices." (Saudi
oil policy uncertainty unleashes the conspiracy theorists, Reuters)
Wink, wink.
Of course, they're in bed together. Saudi Arabia is a US client. It's not autonomous or sovereign
in any meaningful way. It's a US protectorate, a satellite, a colony. They do what they're told.
Period. True, the relationship is complex, but let's not be ridiculous. The Saudis are not calling
the shots. The idea is absurd. Do you really think that Washington would let Riyadh fiddle prices
in a way that destroyed critical US domestic energy industries, ravaged the junk bond market, and
generated widespread financial instability without uttering a peep of protest on the matter?
Dream on! If the US was unhappy with the Saudis, we'd all know about it in short-order because
it would be raining Daisy Cutters from the Persian Gulf to the Red Sea, which is the way that Washington
normally expresses its displeasure on such matters. The fact that Obama has not even alluded to the
shocking plunge in prices just proves that the policy coincides with Washington's broader geopolitical
strategy.
And let's not forget that the Saudis have used oil as a political weapon before, many times before.
Indeed, wreaking havoc is nothing new for our good buddies the Saudis. Check this out from Oil Price
website:
"In 1973, Egyptian President Anwar Sadat convinced Saudi King Faisal to cut production and
raise prices, then to go as far as embargoing oil exports, all with the goal of punishing the
United States for supporting Israel against the Arab states. It worked. The "oil price shock"
quadrupled prices.
It happened again in 1986, when Saudi Arabia-led OPEC allowed prices to drop precipitously,
and then in 1990, when the Saudis sent prices plummeting as a way of taking out Russia, which
was seen as a threat to their oil supremacy. In 1998, they succeeded. When the oil price was halved
from $25 to $12, Russia defaulted on its debt.
The Saudis and other OPEC members have, of course, used the oil price for the obverse effect,
that is, suppressing production to keep prices artificially high and member states swimming in
"petrodollars". In 2008, oil peaked at $147 a barrel." (Did
The Saudis And The US Collude In Dropping Oil Prices?, Oil Price)
1973, 1986, 1990, 1998 and 2008.
So, according to the author, the Saudis have manipulated oil prices at least five times in the
past to achieve their foreign policy objectives. But, if that's the case, then why does the media
ridicule people who think the Saudis might be engaged in a similar strategy today?
Could it be that the media is trying to shape public opinion on the issue and, by doing so, actually
contribute to the plunge in oil prices?
Bingo. Alert readers have probably noticed that the oil story has been splashed across the headlines
for weeks even though the basic facts have not changed in the least. It's all a rehash of the same
tedious story reprinted over and over again. But, why? Why does the public need to have the same
"Saudis refuse to cut production" story driven into their consciousness day after day like they're
part of some great collective brainwashing experiment? Could it be that every time the message is
repeated, oil sells off, and prices go down? Is that it?
Precisely. For example, last week a refinery was attacked in Libya which pushed oil prices up
almost immediately. Just hours later, however, another "Saudis refuse to cut production" story conveniently
popped up in all the major US media which pushed prices in the direction the USG wants them to go,
er, I mean, back down again.
This is how the media helps to reinforce government policy, by crafting a message that helps to
push down prices and, thus, hurt "evil" Putin. (This is called "jawboning") Keep in mind, that OPEC
doesn't meet again until June, 2015, so there's nothing new to report on production levels. But that
doesn't mean we're not going to get regular updates on the "Saudis refuse to cut production" story.
Oh, no. The media is going to keep beating that drum until Putin cries "Uncle" and submits to US
directives. Either that, or the bond market is going to blow up and take the whole damn global financial
system along with it. One way or another, something's got to give.
Bottom line: Falling oil prices and the plunging ruble are not some kind of free market accident
brought on by oversupply and weak demand. That's baloney. They're part of a broader geopolitical
strategy to strangle the Russian economy, topple Putin, and establish US hegemony across the Asian
landmass. It's all part of Washington's plan to maintain its top-spot as the world's only superpower
even though its economy is in irreversible decline.
"... By Nafeez Ahmed,s an investigative journalist and international security
scholar. He writes the System Shift column for VICE's Motherboard, and is the winner
of a 2015 Project Censored Award for Outstanding Investigative Journalism for his
former work at the Guardian. He is the author of A User's Guide to the Crisis of
Civilization: And How to Save It (2010), and the scifi thriller novel Zero Point,
among other books. Originally published at AlterNet ..."
"... I'm not a huge Rolling Stones fan, but whenever I see a complex economic
analysis like this, I'm reminded of what Mick Jagger said when they asked him why
he dropped out of the London School of Economics: "There's too many variables."
..."
"... It's a lot more complicated even than that, it really depends on where
you draw the boundaries of the system. Prieto and Hall did an analysis of Spanish
solar that was probably the most comprehensive yet, including things like the truck
trips to lay the gravel for the surface roads, maintenance trips to clean the panels,
etc, and got a much lower EROEI figure than is typically given for solar. ..."
"... The carbon-energy situation needs to be placed in a context of the slow
burn debt deflation we are experiencing, which at a minimum is usually death for
the financial performance of commodities and any long term debt supported business.
NC has well documented the issues this poses for actuarial based investments (life
insurance, think Japan in the early '90s, pensions, etc.). ..."
"... Last thought, the debt situation is likely much worse in the short run
as the decline in oil revenues are likely already causing local and regional recessions
(e.g., Bakken, Houston) and correlated impact on commercial real estate, home values,
mortgages, etc. plus are we facing a sovereign debt crisis in such countries as
Venezuela (which used PDVSA to massively borrow on the countries behalf), Brazil,
Russia, etc. ..."
"... This short term glut will probably accentuate the coming problems because
it gives the impression that there is no peak oil. People have trouble understanding
that there are short-term cycles within a long-term cycle. This bad signal is giving
us the impetus to continue investing in energy intensive projects instead of reshaping
our economy. And this will make things even worse in 5-10 years. ..."
"... If the total cost of extraction is more than 40$ and consumers are paying
$40 or less, then somewhere along the way, someone is subsidizing the cost. It could
be low tax rates, eZ money, growing deficits, underfunded pensions, underfunded
restoration funds, etc. ..."
"... There is no glut. All the oil is being bought. The problem is that there
in not yet enough of a shortage to drive the price up. A small distinction but huge
ramifications if you understand it. And by the way higher prices is not a solution
to what ails us. ..."
"... The way I see it is that you have convinced yourself that you will be on
the winning side when calamity strikes. Whether you are is another matter… just
like the slowest bug does not get to the field on time to get exterminated by the
sprayed pesticides, work and efficiency do not guarantee anything. ..."
"... The author blames the oil patch bust on a geophysical crisis. There is
some truth to this argument but by far the biggest driver of the bust is Fed policy.
Artificially cheap debt financing led to overcapacity and a vicious cycle of continued
overproduction as drillers desperately try to avoid defaulting. ..."
Yves here. The strength and weakness of this article is the range of information
it covers. That comes at points at the expense of providing context. For instance,
it describes how 65% of the independent oil and gas companies are at risk of
going bankrupt. But it doesn't tell you how large the independents are relative
to the "majors". Similarly, it appears to switch two paragraphs later to the
total debt of oil and gas companies, which is $2.5 trillion. So one should read
this with some attention to definitions and context.
By Nafeez Ahmed,s an investigative journalist and international
security scholar. He writes the System Shift column for VICE's Motherboard,
and is the winner of a 2015 Project Censored Award for Outstanding Investigative
Journalism for his former work at the Guardian. He is the author of A User's
Guide to the Crisis of Civilization: And How to Save It (2010), and the scifi
thriller novel Zero Point, among other books. Originally published at
AlterNet
It's not looking good for the global fossil fuel industry. Although the world
remains heavily dependent on oil, coal and natural gas-which today supply around
80 percent of our primary energy needs-the industry is rapidly crumbling.
This is not merely a temporary blip, but a symptom of a deeper, long-term
process related to global capitalism's escalating overconsumption of planetary
resources and raw materials.
New scientific research shows that the growing crisis of profitability facing
fossil fuel industries is part of an inevitable period of transition to a post-carbon
era.
But ongoing denialism has led powerful vested interests to continue clinging
blindly to their faith in fossil fuels, with increasingly devastating and unpredictable
consequences for the environment.
Bankruptcy Epidemic
In February, the financial services firm Deloitte
predicted [3] that over 35 percent of independent oil companies worldwide
are likely to declare bankruptcy, potentially followed by a further 30 percent
next year-a total of 65 percent of oil firms around the world. Since early last
year, already 50 North American oil and gas producers have filed bankruptcy.
The cause of the crisis is the dramatic drop in oil prices-down by two-thirds
since 2014-which are so low that oil companies are finding it difficult to generate
enough revenue to cover the high costs of production, while also repaying their
loans.
Oil and gas companies most at risk are those with the largest debt burden.
And that burden is huge-as much as
$2.5 trillion [4] , according to The Economist. The real figure is probably
higher.
At a speech at the London School of Economics in February, Jaime Caruana
of the Bank for International Settlements
said [5] that outstanding loans and bonds for the oil and gas industry had
almost tripled between 2006 and 2014 to a total of $3 trillion.
This massive debt burden, he explained, has put the industry in a double-bind:
In order to service the debt, they are continuing to produce more oil for sale,
but that only contributes to lower market prices. Decreased oil revenues means
less capacity to repay the debt, thus increasing the likelihood of default.
Stranded Assets
This $3 trillion of debt is at risk because it was supposed to generate a
3-to-1 increase in value, but
instead [6] -thanks to the oil price decline-represents a value of less
than half of this.
Worse, according to a Goldman Sachs
study [7] quietly published in December last year, as much as $1 trillion
of investments in future oil projects around the world are unprofitable; i.e.,
effectively stranded.
Examining 400 of the world's largest new oil and gas fields (except U.S.
shale), the Goldman study found that $930 billion worth of projects (more than
two-thirds) are unprofitable at Brent crude prices below $70. (Prices are now
well below that.)
The collapse of these projects due to unprofitability would result in the
loss of oil and gas production equivalent to a colossal 8 percent of current
global demand. If that happens, suddenly or otherwise, it would wreck the global
economy.
The Goldman analysis was based purely on the internal dynamics of the industry.
A further issue is that internationally-recognized climate change risks mean
that to avert dangerous global warming, much of the world's remaining fossil
fuel resources cannot be burned.
All of this is leading investors to question the wisdom of their investments,
given fears that much of the assets that the oil, gas and coal industries use
to estimate their own worth could consist of resources that will never ultimately
be used.
The Carbon Tracker Initiative, which analyzes carbon investment risks, points
out that over the next decade, fossil fuel companies risk wasting up to $2.2
trillion of investments in new projects that could turn out to be "uneconomic"
in the face of international climate mitigation policies.
More and more fossil fuel industry shareholders are pressuring energy companies
to stop investing in exploration for fear that new projects could become worthless
due to climate risks.
"Clean technology and climate policy are already reducing fossil fuel demand,"
said James Leaton, head of research at Carbon Tracker. "Misreading these trends
will destroy shareholder value. Companies need to apply 2C stress tests to their
business models now."
In a prescient report published last November, Carbon Tracker identified
the energy majors with the greatest exposures-and thus facing the greatest risks-from
stranded assets: Royal Dutch Shell, Pemex, Exxon Mobil, Peabody Energy, Coal
India and Glencore.
At the time, the industry scoffed at such a bold pronouncement. Six months
after this report was released-a week ago-Peabody went bankrupt. Who's next?
The Carbon Tracker analysis may underestimate the extent of potential losses.
A new paper just out in the journal Applied Energy, from a team at Oxford University's
Institute for New Economic Thinking,
shows [8] that the "stranded assets" concept applies not just to unburnable
fossil fuel reserves, but also to a vast global carbon-intensive electricity
infrastructure, which could be rendered as defunct as the fossil fuels it burns
and supplies to market.
The Coming Debt Spiral
Some analysts believe the hidden trillion-dollar black hole at the heart
of the oil industry is set to trigger another global financial crisis, similar
in scale to the Dot-Com crash.
Jason Schenker, president and chief economist at Prestige Economics,
says [9] : "Oil prices simply aren't going to rise fast enough to keep oil
and energy companies from defaulting. Then there is a real contagion risk to
financial companies and from there to the rest of the economy."
Schenker has been ranked by Bloomberg News as one of the most accurate financial
forecasters in the world since 2010. The US economy, he forecasts, will dip
into recession at the end of 2016 or early 2017.
Mark Harrington, an oil industry consultant, goes further. He believes the
resulting economic crisis from cascading debt defaults in the industry could
make the 2007-8 financial crash look like a cakewalk. "Oil and gas companies
borrowed heavily when oil prices were soaring above $70 a barrel," he
wrote [6] on CNBC in January.
"But in the past 24 months, they've seen their values and cash flows erode
ferociously as oil prices plunge-and that's made it hard for some to pay back
that debt. This could lead to a massive credit crunch like the one we saw in
2008. With our economy just getting back on its feet from the global 2008 financial
crisis, timing could not be worse."
Ratings agency Standard & Poor (S&P) reported this week that 46 companies
have defaulted on their debt this year-the highest levels since the depths of
the financial crisis in 2009. The total quantity in defaults so far is $50 billion.
Half this year's defaults are from the oil and gas industry, according to
S&P, followed by the metals, mining and the steel sector. Among them was coal
giant Peabody Energy.
Despite public reassurances, bank exposure to these energy risks from unfunded
loan facilities remains high. Officially, only 2.5 percent of bank assets are
exposed to energy risks.
But it's probably worse. Confidential Wall Street sources
claim [10] that the Federal Reserve in Dallas has secretly advised major
U.S. banks in closed-door meetings to cover-up potential energy-related losses.
The Federal Reserve denies the allegations, but refuses to respond to Freedom
of Information requests on internal meetings, on the obviously false pretext
that it keeps no records of any of its meetings.
According to Bronka Rzepkoswki of the financial advisory firm Oxford Economics,
over a third of the entire U.S. high yield bond index is vulnerable to low oil
prices, increasing the risk of a tidal wave of corporate bankruptcies: "Conditions
that usually pave the way for mounting defaults-such as growing bad debt, tightening
monetary conditions, tightening of corporate credit standards and volatility
spikes – are currently met in the U.S."
The End of Cheap Oil
Behind the crisis of oil's profitability that threatens the entire global
economy is a geophysical crisis in the availability of cheap oil. Cheap here
does not refer simply to the market price of oil, but the total cost of production.
More specifically, it refers to the value of energy.
There is a precise scientific measure for this, virtually unknown in conventional
economic and financial circles, known as Energy Return on Investment-which essentially
quantifies the amount of energy extracted, compared to the inputs of energy
needed to conduct the extraction. The concept of EROI was first proposed and
developed by Professor Charles A. Hall of the Department of Environmental and
Forest Biology at the State University of New York. He found that an approximate
EROI value for any energy source could be calculated by dividing the quantity
of energy produced by the amount of energy inputted into the production process.
Therefore, the higher the EROI, the more energy that a particular source
and technology is capable of producing. The lower the EROI, the less energy
this source and technology is actually producing.
A new peer-reviewed
study [11] led by the Institute of Physics at the National Autonomous University
of Mexico has undertaken a comparative review of the EROI of all the major sources
of energy that currently underpin industrial civilization-namely oil, gas, coal,
and uranium.
Published in the journal Perspectives on Global Development and Technology,
the scientists note that the EROI for fossil fuels has inexorably declined over
a relatively short period of time: "Nowadays, the world average value EROI for
hydrocarbons in the world has gone from a value of 35 to a value of 15 between
1960 and 1980."
In other words, in just two decades, the total value of the energy being
produced via fossil fuel extraction has plummeted by more than half. And it
continues to decline.
This is because the more fossil fuel resources that we exploit, the more
we have used up those resources that are easiest and cheapest to extract. This
compels the industry to rely increasingly on resources that are more difficult
and expensive to get out of the ground, and bring to market.
The EROI for conventional oil, according to the Mexican scientists, is 18.
They estimate, optimistically, that: "World reserves could last for 35 or 45
years at current consumption rates." For gas, the EROI is 10, and world reserves
will last around "45 or 55 years." Nuclear's EROI is 6.5, and according to the
study authors, "The peak in world production of uranium will be reached by 2045."
The problem is that although we are not running out of oil, we are running
out of the cheapest, easiest to extract form of oil and gas. Increasingly, the
industry is making up for the shortfall by turning to unconventional forms of
oil and gas-but these have very little energy value from an EROI perspective.
The Mexico team examine the EROI values of these unconventional sources,
tar sands, shale oil, and shale gas: "The average value for EROI of tar sands
is four. Only ten percent of that amount is economically profitable with current
technology."
For shale oil and gas, the situation is even more dire: "The EROI varies
between 1.5 and 4, with an average value of 2.8. Shale oil is very similar to
the tar sands; being both oil sources of very low quality. The shale gas revolution
did not start because its exploitation was a very good idea; but because the
most attractive economic opportunities were previously exploited and exhausted."
In effect, the growing reliance on unconventional oil and gas has meant that,
overall, the costs and inputs into energy production to keep industrial civilization
moving are rising inexorably.
It's not that governments don't know. It's that decisions have already been
made to protect the vested interests that have effectively captured government
policymaking through lobbying, networking and donations.
Three years ago, the British government's Department for International Development
(DFID) commissioned and published an in-depth
report [12] , "EROI of Global Energy Resources: Status, Trends and Social
Implications." The report went completely unnoticed by the media.
Its findings are instructive: "We find the EROI for each major fossil fuel
resource (except coal) has declined substantially over the last century. Most
renewable and non-conventional energy alternatives have substantially lower
EROI values than conventional fossil fuels."
The decline in EROI has meant that an increasing amount of the energy we
extract is having to be diverted back into getting new energy out, leaving less
for other social investments.
This means that the global economic slowdown is directly related to the declining
resource quality of fossil fuels. The DFID report warns: "The declining EROI
of traditional fossil fuel energy sources and its eventual effect on the world
economy are likely to result in a myriad of unforeseen consequences."
Shortly after this report was released, I met with a senior civil servant
at DFID familiar with its findings, who spoke to me on condition of anonymity.
I asked him whether this important research had actually impacted policymaking
in the department.
"Unfortunately, no," he told me, shrugging. "Most of my colleagues, except
perhaps a handful, simply don't have a clue about these issues. And of course,
despite the report being circulated widely within the department, and shared
with other relevant government departments, there is little interest from ministers
who appear to be ideologically pre-committed to fracking."
Peak Oil
The driving force behind the accelerating decline in resource quality, hotly
denied in the industry, is 'peak oil.'
An extensive
scientific analysis [13] published in February in Wiley Interdisciplinary
Reviews: Energy & Environment lays bare the extent of industry denialism. Wiley
Interdisciplinary Reviews (WIRES) is a series of high-quality peer-reviewed
publications which runs authoritative reviews of the literature across relevant
academic disciplines.
The new WIRES paper is authored by Professor Michael Jefferson of the ESCP
Europe Business School, a former chief economist at oil major Royal Dutch/Shell
Group, where he spent nearly 20 years in various senior roles from Head of Planning
in Europe to Director of Oil Supply and Trading. He later became Deputy Secretary-General
of the World Energy Council, and is editor of the leading Elsevier science journal
Energy Policy.
In his new study, Jefferson examines a recent 1865-page "global energy assessment"
(GES) published by the International Institute of Applied Systems Analysis.
But he criticized the GES for essentially ducking the issue of 'peak oil."
"This was rather odd," he wrote. "First, because the evidence suggests that
the global production of conventional oil plateaued and may have begun to decline
from 2005."
He went on to explain that standard industry assessments of the size of global
conventional oil reserves have been dramatically inflated, noting how "the five
major Middle East oil exporters altered the basis of their definition of 'proved'
conventional oil reserves from a 90 percent probability down to a 50 percent
probability from 1984. The result has been an apparent (but not real) increase
in their 'proved' conventional oil reserves of some 435 billion barrels."
Added to those estimates are reserve figures from Venezuelan heavy oil and
Canadian tar sands, bringing up global reserve estimates by a further 440 billion
barrels, despite the fact that they are "more difficult and costly to extract"
and generally of "poorer quality" than conventional oil.
"Put bluntly, the standard claim that the world has proved conventional oil
reserves of nearly 1.7 trillion barrels is overstated by about 875 billion barrels.
Thus, despite the fall in crude oil prices from a new peak in June, 2014, after
that of July, 2008, the 'peak oil' issue remains with us."
Jefferson believes that a nominal economic recovery, combined with cutbacks
in production as the industry reacts to its internal crises, will eventually
put the current oil supply glut in reverse. This will pave the way for "further
major oil price rises" in years to come.
It's not entirely clear if this will happen. If the oil crisis hits the economy
hard, then the prolonged recession that results could dampen the rising demand
that everyone projects. If oil prices thus remain relatively depressed for longer
than expected, this could hemorrhage the industry beyond repair.
Eventually, the loss of production may allow prices to rise again. OPEC estimates
that investments in oil exploration and development are at their lowest level
in six years. As bankruptcies escalate, the accompanying drop in investments
will eventually lead world oil production to fall, even as global demand begins
to rise.
This could lead oil prices to climb much higher, as rocketing demand-projected
to grow 50 percent by 2035-hits the scarcity of production. Such a price spike,
ironically, would also be incredibly bad for the global economy, and as happened
with the 2007-8 financial crash, could feed into inflation and
trigger another spate [14] of consumer debt-defaults in the housing markets.
Even if that happens, the assumption-the hope-is that oil industry majors
will somehow survive the preceding cascade of debt-defaults. The other assumption,
is that demand for oil will rise.
But as new sources of renewable energy come online at a faster and faster
pace, as innovation in clean technologies accelerates, old fossil fuel-centric
projections of future rising demand for oil may need to be jettisoned.
Clean Energy
According to another
new study [15] released in March in Energy Policy by two scientists at Texas
A&M University, "Non-renewable energy"-that is "fossil fuels and nuclear power"-"are
projected to peak around mid-century … Subsequent declining non-renewable production
will require a rapid expansion in the renewable energy sources (RES) if either
population and/or economic growth is to continue."
The demise of the fossil fuel empire, the study forecasts, is inevitable.
Whichever model run the scientists used, the end output was the same: the almost
total displacement of fossil fuels by renewable energy sources by the end of
the century; and, as a result, the transformation and localisation of economic
activity.
But the paper adds that to avoid a rise in global average temperatures of
2C, which would tip climate change into the danger zone, 50 percent or more
of existing fossil fuel reserves must remain unused.
The imperative to transition away from fossil fuels is, therefore, both geophysical
and environmental. On the one hand, by mid-century, fossil fuels and nuclear
power will become obsolete as a viable source of energy due to their increasingly
high costs and low quality. On the other, even before then, to maintain what
scientists describe as a 'safe operating space' for human survival, we cannot
permit the planet to warm a further 2C without risking disastrous climate impacts.
Staying below 2C, the study finds, will require renewable energy to supply
more than 50 percent of total global energy by 2028, "a 37-fold increase in
the annual rate of supplying renewable energy in only 13 years."
While this appears to be a herculean task by any standard, the Texas A&M
scientists conclude that by century's end, the demise of fossil fuels is going
to happen anyway, with or without considerations over climate risks:
… the 'ambitious' end-of-century decarbonisation goals set by the G7
leaders will be achieved due to economic and geologic fossil fuel limitations
within even the unconstrained scenario in which little-to-no pro-active
commitment to decarbonise is required… Our model results indicate that,
with or without climate considerations, RES [renewable energy sources] will
comprise 87–94 percent of total energy demand by the end of the century.
But as renewables have a much lower EROI than fossil fuels, this will "quickly
reduce the share of net energy available for societal use." With less energy
available to societies, "it is speculated that there will have to be a reprioritization
of societal energetic needs"-in other words, a very different kind of economy
in which unlimited material growth underpinned by endless inputs of cheap fossil
fuel energy are a relic of the early 21st century.
The 37-fold annual rate of increase in the renewable energy supply seems
unachievable at first glance, but new data just released from the Abu Dhabi-based
International Renewable Energy Agency shows that clean power is well on its
way, despite lacking the massive subsidies behind fossil fuels.
The data reveals that last year, solar power capacity rose by 37 percent.
Wind power grew by 17 percent, geothermal by 5 percent and hydropower by 3 percent.
So far, the growth rate for solar power has been exponential. A Deloitte
Center for Energy Solutions
report [16] from September 2015 noted that the speed and spread of solar
energy had consistently outpaced conventional linear projections, and continues
to do so.
While the costs of solar power is consistently declining, solar power generation
has doubled every year for the last 20 years. With every doubling of solar infrastructure,
the production costs of solar photovoltaic (PV) has dropped by 22 percent.
At this rate, according to analysts like Tony Seba-a lecturer in business
entrepreneurship, disruption and clean energy at Stanford University-the growth
of solar is already on track to go global. With eight more doublings, that's
by 2030, solar power would be capable of supplying 100 percent of the world's
energy needs. And that's even without the right mix of government policies in
place to support renewables.
According to Deloitte, while Seba's forecast is endorsed by a minority of
experts, it remains a real possibility that should be taken seriously. But the
firm points out that obstacles remain:
"It would not make economic sense for utility planners to shutter thousands
of megawatts of existing generating capacity before the end of its economic
life and replace it with new solar generation."
Yet Deloitte's study did not account for the escalating crisis in profitability
already engulfing the fossil fuel industries, and the looming pressure of stranded
assets due to climate risks. As the uneconomic nature of fossil fuels becomes
evermore obvious, so too will the economic appeal of clean energy.
Race against time
The question is whether the transition to a post-carbon energy system-the
acceptance of the inevitable death of the oil economy-will occur fast enough
to avoid climate catastrophe.
Given that the 2C target for a safe climate is widely recognized to be inadequate-scientists
increasingly argue that even a 1C rise in global average temperatures would
be sufficient to trigger dangerous, irreversible changes to the earth's climate.
According to a 2011 report by the National Academy of Sciences, the scientific
consensus
shows [17] conservatively that for every degree of warming, we will see
the following impacts: 5-15 percent reductions in crop yields; 3-10 percent
increases in rainfall in some regions contributing to flooding; 5-10 percent
decreases in stream-flow in some river basins, including the Arkansas and the
Rio Grande, contributing to scarcity of potable water; 200-400 percent increases
in the area burned by wildfire in the US; 15 percent decreases in annual average
Arctic sea ice, with 25 percent decreases in the yearly minimum extent in September.
Even if all CO2 emissions stopped, the climate would continue to warm for
several more centuries. Over thousands of years, the National Academy warns,
this could unleash amplifying feedbacks leading to the disappearance of the
polar ice sheets and other dramatic changes. In the meantime, the risk of catastrophic
wild cards "such as the potential large-scale release of methane from deep-sea
sediments" or permafrost, is impossible to quantify.
In this context, even if the solar-driven clean energy revolution had every
success, we still need to remove carbon that has already accumulated in the
atmosphere, to return the climate to safety.
The idea of removing carbon from the atmosphere sounds technologically difficult
and insanely expensive. It's not. In reality, it is relatively simple and cheap.
A new book by Eric Toensmeier, a lecturer at Yale University's School of
Forestry and Environmental Studies, The Carbon Farming Solution, sets out in
stunningly accessible fashion how 'regenerative farming' provides the ultimate
carbon-sequestration solution.
Regenerative farming is a form of small-scale, localised, community-centred
organic agriculture which uses techniques that remove carbon from the atmosphere,
and sequester it in plant material or soil.
Using an array of land management and conservation practices, many of which
have been tried and tested by indigenous communities, it's theoretically possible
to scale up regenerative farming methods in a way that dramatically offsets
global carbon emissions.
Toensmeier's valuable book discusses these techniques, and unlike other science-minded
tomes, offers a practical toolkit for communities to begin exploring how they
can adopt regenerative farming practices for themselves.
According to the
Rodale Institute [18] , the application of regenerative farming on a global
scale could have revolutionary results:
Simply put, recent data from farming systems and pasture trials around
the globe show that we could sequester more than 100 percent of current
annual CO2 emissions with a switch to widely available and inexpensive organic
management practices, which we term 'regenerative organic agriculture'…
These practices work to maximize carbon fixation while minimizing the loss
of that carbon once returned to the soil, reversing the greenhouse effect.
This has been widely corroborated. For instance, a 2015
study [19] part-funded by the Chinese Academy of Sciences found that "replacing
chemical fertilizer with organic manure significantly decreased the emission
of GHGs [greenhouse gases]. Yields of wheat and corn also increased as the soil
fertility was improved by the application of cattle manure. Totally replacing
chemical fertilizer with organic manure decreased GHG emissions, which reversed
the agriculture ecosystem from a carbon source… to a carbon sink."
Governments are catching on, if slowly. At the Paris climate talks, 25 countries
and over 50 NGOs signed up to the French government's '4 per 1000' initiative,
a
global agreement [20] to promote regenerative farming as a solution for
food security and climate disaster.
The Birth of Post-Capitalism
There can be no doubt, then, that by the end of this century, life as we
know it on planet earth will be very different. Fossil fueled predatory capitalism
will be dead. In its place, human civilization will have little choice but to
rely on a diversity of clean, renewable energy sources.
Whatever choices we make this century, the coming generations in the post-carbon
future will have to deal with the realities of an overall warmer, and therefore
more unpredictable, climate. Even if regenerative processes are in place to
draw-down carbon from the atmosphere, this takes time-and in the process, some
of the damage climate change will wreak on our oceans, our forests, our waterways,
our coasts, and our soils will be irreversible.
It could take centuries, if not millennia, for the planet to reach a new,
stable equilibrium.
But either way, the work of repairing and mitigating at least some of the
damage done will be the task of our childrens' children, and their children,
and on.
Economic activity in this global society will of necessity be very different
to the endless growth juggernaut we have experienced since the industrial revolution.
In this post-carbon future, material production and consumption, and technological
innovation, will only be sustainable through a participatory 'circular economy'
in which scarce minerals and raw materials are carefully managed.
The fast-paced consumerism that we take for granted today simply won't work
in these circumstances.
Large top-down national and transnational structures will begin to become
obsolete due to the large costs of maintenance, the unsustainability of the
energy inputs needed for their survival, and the shift in power to new decentralized
producers of energy and food.
In the place of such top-down structures, smaller-scale, networked forms
of political, social and economic organization, connected through revolutionary
information technologies, will be most likely to succeed. For communities to
not just survive, but thrive, they will need to work together, sharing technology,
expertise and knowledge on the basis of a new culture of human parity and cooperation.
Of course, before we get to this point, there will be upheaval. Today's fossil
fuel incumbency remains in denial, and is unlikely to accept the reality of
its inevitable demise until it really does drop dead.
The escalation of resource wars, domestic unrest, xenophobia, state-militarism,
and corporate totalitarianism is to be expected. These are the death throes
of a system that has run its course.
The outcomes of the struggles which emerge in coming decades-struggles between
people and power, but also futile geopolitical struggles within the old centers
of power (paralleled by misguided struggles between peoples)-is yet to be written.
Eager to cling to the last vestiges of existence, the old centers of power
will still try to self-maximize within the framework of the old paradigm, at
the expense of competing power-centers, and even their own populations.
And they will deflect from the root causes of the problem as much as possible,
by encouraging their constituents to blame other power-centers, or worse, some
of their fellow citizens, along the lines of all manner of 'Otherizing' constructs,
race, ethnicity, nationality, color, religion and even class.
Have no doubt. In coming decades, we will watch the old paradigm cannibalize
itself to death on our TV screens, tablets and cell phones. Many of us will
do more than watch. We will be participant observers, victims or perpetrators,
or both at once.
The only question that counts, is as follows: amidst this unfolding maelstrom,
are we going to join with others to plant the seeds of viable post-carbon societies
for the next generations of human-beings, or are we going to stand in the way
of that viable future by giving ourselves entirely to defending our 'interests'
in the framework of the old paradigm?
Whatever happens over coming decades, it will be the choices each of us make
that will ultimately determine the nature of what survives by the end of this
pivotal, transitional century.
And one such solution is at hand. People. Too many people to subsist
in a crazed-fossil-fueled capitalists world means there will be changes.
If the MIT professor is correct and the solution is decentralized regenerative
farming, aka organic farming on a vast scope, then we've certainly got the
people power to do it. It's always good to hear that China understands these
things. I'm sure India does too.
Thanks, Yves, for posting this information rich and pertinent article.
Your curation is impeccable.
The cited documents are lengthy and I intend to read further. At a glance,
I was surprised to learn that, despite years of Peak Oil investigations:
1) EROI is virtually unknown in conventional economic and financial circles.
2) Lack of institutional awareness and disinterest at DFID is widespread,
such that research isn't influencing policy. The essence of irony!
3) Experts remain focused on comparitively high energy solutions (such as
underground carbon capture technologies) over low energy biological solutions
(such as carbon sequestration by soil organisms, trees and plants).
I'm heartened, though, to see some regenerative farming citations. Eric
Toensmeier and the Rodale Institute are wonderful. Bill Mollison, David
Holmgren, Brad Lancaster, Geoff Lawton and Darren J. Doherty are also excellent
resources. BTW, the 60999 EROI Global Energy Resources pdf cites a Lambert,
et al 2013. Is that THE Lambert?
A broader understanding of energy is and will remain critical in a post-capitalism,
post-carbon future. Currently, work is neglected because "it doesn't pay"
to do it. That is a tragic squandering of available resources. By any meaningful
metric, it pays to liberate latent energy to do the work of restoring the
environment.
There was a lively discussion this week about community building. I'm
happy to spend my days installing earthworks, natural building, growing
yummy stuff…
Thx for highlighting the regenerative agriculture references. An important
resource I'd add to the list regarding regenerative agriculture and large
scale carbon sink benefits is the
Savory Institute . Their
website is constantly adding links to recent research.
I'm not a huge Rolling Stones fan, but whenever I see a complex economic
analysis like this, I'm reminded of what Mick Jagger said when they asked
him why he dropped out of the London School of Economics: "There's too many
variables."
Fascinating article. One niggling question about EROI. I get how it's
relatively easy to calculate the EROI of a barrel of oil - the barrel holds
a specific number of gallons and each gallon is capable of producing X amount
of energy. But what about renewables? You know the production cost of a
wind turbine, for instance, but the energy it produces over its lifetime
is much more open-ended. So the Energy Return for it must be the total expected
energy returned over the turbine's projected service life, right? If so,
the longer it lasts, the higher it's EROI.
It's a lot more complicated even than that, it really depends on
where you draw the boundaries of the system. Prieto and Hall did an analysis
of Spanish solar that was probably the most comprehensive yet, including
things like the truck trips to lay the gravel for the surface roads, maintenance
trips to clean the panels, etc, and got a much lower EROEI figure than is
typically given for solar. As far as wind goes, turbines tend to fail
at a higher frequency than manufacturers estimate (go figure) so the best
way to measure things like turbine lifespan is to look at those in the field.
The article is generally correct that renewable EROEI tends to be lower
than that of fossil fuels, although it seems not to contemplate that there
is a lower bound on EROEI beyond which these systems can't/won't be sustained
anyway. It's not just that less energy is available for non-energy production
use but that there is an EROEI return below which you probably can't operate
the infrastructure necessary to mine/smelt materials for renewables on the
scale being contemplated here (total replacement of FF-burning infrastructure)
It's best to think of these as order-of-magnitude comparisons with each
other. Local conditions provide huge variability on energy generated by
renewables. Likewise fossil fuel extraction.
I've invested in LED lighting for a long time. Output per unit increases
by a rule-of-thumb called Haitz's law, about a factor of 20 per decade.
Many bulbs tout a lifetime of 20 years, but haven't been around that long,
so that's an extrapolation, and I have the dead bulbs to prove the point.
So when someone talks about LED efficiency, it's not a static number, but
it's still useful for discussion.
A factor that I believe is missing from EROI is cost of clean up or,
lacking clean up, the cost of consequences, which should be determined taking
into account the negative effects of our propensity for corruption, personal
gain at the expense of the whole, (which is why nuclear should have a stratosphericly
high cost, for ex.). For oil, coal and uranium, this is a high cost that
should be subtracted from EROI. For solar and wind, the cost is
much less, except possibly in the manufacture of components that convert
sun/wind into electricity. Life span is supposed to be around 30 years so
the clean up/consequence cost of manufacture should be divided by that number.
I am quite a bit disappointed with this "article". First off, we have
to acknowledge that other than meteorologists (and yes demographics) we
have we skill at forecasting the future. So to me this article reads as
though it started from a future condition than constructed a series of facts
and thesis that get you there. The reality is we don't know and one may
as well flip a coin.
That said, there is clearly right now much to be concerned about. Humans
seem to be internally wired to be short-term based. "Tell me where my next
meal is coming from is all I care about". So, tackling issues like climate
change is not something we're good at; and there is no historic precedent
I can think of for all of mankind collaborating to solve a problem.
The carbon-energy situation needs to be placed in a context of the
slow burn debt deflation we are experiencing, which at a minimum is usually
death for the financial performance of commodities and any long term debt
supported business. NC has well documented the issues this poses for actuarial
based investments (life insurance, think Japan in the early '90s, pensions,
etc.).
Last thought, the debt situation is likely much worse in the short
run as the decline in oil revenues are likely already causing local and
regional recessions (e.g., Bakken, Houston) and correlated impact on commercial
real estate, home values, mortgages, etc. plus are we facing a sovereign
debt crisis in such countries as Venezuela (which used PDVSA to massively
borrow on the countries behalf), Brazil, Russia, etc.
This short term glut will probably accentuate the coming problems
because it gives the impression that there is no peak oil. People have trouble
understanding that there are short-term cycles within a long-term cycle.
This bad signal is giving us the impetus to continue investing in energy
intensive projects instead of reshaping our economy. And this will make
things even worse in 5-10 years.
If the total cost of extraction is more than 40$ and consumers are
paying $40 or less, then somewhere along the way, someone is subsidizing
the cost. It could be low tax rates, eZ money, growing deficits, underfunded
pensions, underfunded restoration funds, etc.
A country's most important asset is energy and historically, countries
have never willingly cut total energy consumption. They might increase efficiencies
but the total does not drop. This means that most countries, as long as
there exist other sectors that can be squeezed, will continue to subsidize
the energy sector squeezing out these sectors that are deemed less important
or simply those with less clout.
It is quite obvious that our lives are even more energy dependent than
they were when this monetary cycle started in the early 70s. And our system
is still based on growing this even more. With NIRP, we are getting very
close to the end of this cycle.
There is no glut. All the oil is being bought. The problem is that
there in not yet enough of a shortage to drive the price up. A small distinction
but huge ramifications if you understand it. And by the way higher prices
is not a solution to what ails us.
A few thoughts:
-time scale – this thing we are in will roll on for thousands of years –
the K-T mass extinction took 2-3 million years before species started to
increase again;
-They (we) will keep the oil flowing as long as they can – look how ugly
the coal industry's slow death is getting – until climate events are overwhelming
and require extraordinary efforts just to mitigate. My money's on sea level
rise focusing all attention;
-billions of humans will die – many in climate change-triggered wars
and famines – the Four Horsemen are saddling up;
-like it or not, people in the developed world, less densely populated
parts, anyway (USA, Canada, e.g.) once they are over the necessities like
lower standards of living (no more trinkets and geegaws ) and hard physical
labor in sustainable agriculture, are way better off than over-populated
places. However, it will get ugly at the borders, as Europe is experiencing
right now.
-expect more authoritarian governments – the human response to crisis.
Tribalism will rule.
-and the doom-and-gloomers can fuck off they are useless, unable to adapt
or evolve, and are just scaring the stupid unnecessarily. The living planet
will adapt and evolve as it has always done – and humans in some form or
other also. DO you really think the most adaptable species, inhabiting every
biome, will not?
No my strategy is hard work. Respectful of the planet's living processes.
And honesty.
Most doomers are at an early stage of consciousness of the magnitude
of our society's death spiral. My aim is to shake them out of their (totally
understandable) depression – work is the cure. COllective efforts on a large
scale but managed locally – resilient ecology requires complexity – monocultures
are doomed.
The way I see it is that you have convinced yourself that you will
be on the winning side when calamity strikes. Whether you are is another
matter… just like the slowest bug does not get to the field on time to get
exterminated by the sprayed pesticides, work and efficiency do not guarantee
anything.
The doomers are those who are not convinced they will be spared. Maybe
they can place themselves in the winning group with positive thinking and
hard work, but maybe not so in such a case they need help deluding themselves
so they can become perma-optimists.
Well I'm glad you have that insight into my thinking! Not!
I see it rather that my own death is inevitable, and that of my lineage
and tribe as having a probability of greater than 0. Luck (divine providence?)
counts for a lot, as you note.
Deluded optimists can be organized to do useful work. Better than idle
pessimists.
I utterly reject the "winning side" as a useful concept – there is only
living struggle through the generations.
I have to wonder, if it is really so easy to clean up the carbon and
other toxins we have polluted the atmosphere and oceans with, then why bother
to stop producing oil, coal and nuclear other than that they come to be
less economical?
i strongly doubt the projected ease of such a clean up whether it be
the biological feasibility or the willingness of humans to work together
for common goals – extinction seem to be almost an afterthought – (or conversely,
the more realistic "Hillary" element in people to work feverishly for personal
gain at the expense of others). Going from coal to sunlight is easy. Going
from Clinton to Sanders, not so much.
Well President Trump will make the thing go faster and expose the failings
of fossil-fueled society as he has the corruption of our fundamentally racist
nation. By being the bad thing.
All major cultures are in terminal decline, which should be expected,
and is not to say that they will not be replaced or that some will not recover,
which is neither good nor bad.
The geneticists and psychologists are snakeoil salesmen. All the geneticists
have proven is that you have the same basic gene set as a worm, making up
about 2% of your DNA. They haven't begun to decipher the 98% if then feedback
code. Science tells you that the last thing you want to do is inject everyone
with the same mitochondrial DNA, but medicine isn't about science; its about
printing money on fear.
What the psychologists learned is that an irrational majority can be
conditioned to do whatever you want. Ironically, in America you are an unfit
parent if you have a scientific mind or believe in others, as a Christian,
leaving the majority, which lives in fear, to raise children, which doesn't
bode well except for the morons running the show, for now.
Projecting the future on biased data is a waste of time, the status quo.
Too funny, critters who have never developed seed debating corporate versus
yuppie farming techniques.
Medicine will never understand synaptic response, immunological adaptation,
intercellular signalling or blood clotting / mRNA feedback, because it is
not paid to do so. You are nature's test tube, and the majority fears the
unknown, as conditioned by the cave people running public education.
As a carbon based life form, it is in your interest to learn how that
carbon chain is popped on and off the stack to maintain event horizons.
That last line is too funny, but I agree with you.
Getting out there and doing something now that we understand what is
going on is probably a better use of our time than trying to protect the
current economic structure. Build a new energy paradigm that better fits
our ecosystem and see what kind of economic, social, and political structures
begin to develop around that.
Surely, whatever develops will model what has come before it but it needs
to be rooted in the physical environment, which clearly it is not currently.
The author blames the oil patch bust on a geophysical crisis. There
is some truth to this argument but by far the biggest driver of the bust
is Fed policy. Artificially cheap debt financing led to overcapacity and
a vicious cycle of continued overproduction as drillers desperately try
to avoid defaulting.
"... Jean Laherrere's graph confirms that inflection point happened around 1980, roughly 20 years after the peak in discoveries. This puts a 40 year lag between the peak in discoveries and the peak in production, the latter being scheduled for about the year 2000. ..."
"... We are now at the peak of that much broader and flatter curve (which has been frequently mis-characterized as an "undulating plateau") with conventional global annual production well below 40 Gb and looking very much like it is finally on its way down. This despite the giant pump and dump scheme otherwise known as the "shale revolution". ..."
Jean Laherrere's graph is particularly interesting.
Anyone familiar with Hubbert's full statistical analysis knows that the peak of proved reserves
roughly corresponds to the same point in time when the production curve crosses the discovery
curve (also backdated), which is roughly the halfway point between the peaks of the discovery
and production curves.
Jean Laherrere's graph confirms that inflection point happened around 1980, roughly 20 years
after the peak in discoveries. This puts a 40 year lag between the peak in discoveries and the
peak in production, the latter being scheduled for about the year 2000.
All of which is perfectly consistent with Hubbert's 1972 Congressional analysis of global discoveries
and production which he put at about 2 trillion bbl URR and a production peak of about 40 Gb per
year in 1995 or thereabouts.
What happened, you may ask, to the production peak? The years 1995 and 2000 have come and gone.
Simple, the global geopolitics of oil. The Arab oil embargo and Iranian revolution of the 70's
but a huge crimp in the global production curve and pushed a significant portion of the area under
the curve into the future by a decade or two.
In Jean Laherrere's world discoveries and production graph above you can clearly see the inflection
point in 1980, before which the world was clearly on the "ideal" Hubbert curve that would have
reached 40 Gb per year in 2000. After 1980 the reality of the geopolitics of oil and energy set
in and constrained global production which visibly flattened out the curve.
Something which Hubbert himself fully acknowledged could happen, both in his analysis and in
subsequent interviews.
We are now at the peak of that much broader and flatter curve (which has been frequently mis-characterized
as an "undulating plateau") with conventional global annual production well below 40 Gb and looking
very much like it is finally on its way down. This despite the giant pump and dump scheme otherwise
known as the "shale revolution".
"... "They (Saudis) have the ability to raise output significantly. But so do we," Russian Energy Minister Alexander Novak told journalists on the sidelines of an international energy conference in Moscow. ..."
"... He said Russia was "in theory" able to raise production to 12 or even 13 million bpd from current record levels of close to 11 million bpd. ..."
"... Russian oil output has repeatedly surprised on the upside over the past decade, rising from as low as 6 million bpd at the turn of the millennium. Oil experts have repeatedly predicted an unavoidable decline but it has yet to happen. ..."
"... we are headed for some incredibly rough times. We need for oil to be just like Goldilock's porridge, not to hot, not too cold, not too plentiful and cheap, not too scarce and expensive, for at least another couple of decades. ..."
Russia said on Wednesday it was prepared to push oil production to new historic highs, just
days after a global deal to freeze output levels collapsed and Saudi Arabia threatened to flood
markets with more crude.
The deal had been meant to help the market rebalance by removing a large chunk of oversupply
and a stockpile glut.
But Saudi Arabia said it could jack up output instead – by as much as 2 million barrels per
day (bpd) to over 12 million, which would allow it to overtake Russia as the world's largest producer.
"They (Saudis) have the ability to raise output significantly. But so do we," Russian
Energy Minister Alexander Novak told journalists on the sidelines of an international energy
conference in Moscow.
He said Russia was "in theory" able to raise production to 12 or even 13 million bpd from
current record levels of close to 11 million bpd.
Russian oil output has repeatedly surprised on the upside over the past decade, rising
from as low as 6 million bpd at the turn of the millennium. Oil experts have repeatedly predicted
an unavoidable decline but it has yet to happen.
"Oil experts have repeatedly predicted an unavoidable decline but it has yet to happen."
This is a "WHEN" question, rather than an "if" question. Let's hope and pray to the Sky Daddy
or Sky Mommy of our choice that the supply of oil holds up well enough, long enough, for the renewables
and electric car industries to grow up.
Otherwise, we are headed for some incredibly rough times. We need for oil to be just like
Goldilock's porridge, not to hot, not too cold, not too plentiful and cheap, not too scarce and
expensive, for at least another couple of decades.
"... The increase of 4 has not been paid for yet. America has its entire energy future invested in the worse rock imaginable; shale decline rate is horrific and it costs upwards (CLR and Concho) of 90 dollars a barrel to find it. It is unprofitable to produce at anything less than about 60 dollars a barrel. If anyone thinks unconventional shale resources can ultimately go to 20 MBOPD, and another 65,000 shale wells drilled… cut the BS and tell us how it's going to get paid for. ..."
"... Because the shale industry cannot stand on it's own two feet. It is totally reliant on credit. To all of you oil analysts out there so intent on predicting the future, stop ignoring the reality of unprofitability and debt that can never be paid back. Who is going to PAY for the shale oil abundance miracle? ..."
"... With Globalization enabling nothing but poverty for everyone except for the 1%ers, the jobless "consumer" cannot afford anything so your question is silly. ..."
"... The answer: The Fed. So you don't pay it back? As long as people get food shipped, who would declare it a failure? ..."
"... So we would need to multiply by how many factors the number of rigs and fracking crews to get the USA to 20 million barrels per day? I suppose we need $300 WTI sustained for that to occur? ..."
"... He has at least admitted they don't have 2 mmbpd spare capacity immediately available, contrary to usually quoted figures. With enough money and stupidity you could get 20 mmbpd out of a 20 million barrel reservoir, but next day there would be a lot of expensive scrap metal around. To add enough to get there for Saudi would cost all of their remaining wealth fund as of today (and which only has three years left at current draw rate anyway). ..."
I can't believe I agree with you. If the USA can go from 5 million to 9 million in less than 5
years. I wouldn't be surprised if 20 mbd with time and investmentime was possible.
The increase of 4 has not been paid for yet. America has its entire energy future invested
in the worse rock imaginable; shale decline rate is horrific and it costs upwards (CLR and Concho)
of 90 dollars a barrel to find it. It is unprofitable to produce at anything less than about 60
dollars a barrel. If anyone thinks unconventional shale resources can ultimately go to 20 MBOPD,
and another 65,000 shale wells drilled… cut the BS and tell us how it's going to get paid for.
Because the shale industry cannot stand on it's own two feet. It is totally reliant on
credit. To all of you oil analysts out there so intent on predicting the future, stop ignoring
the reality of unprofitability and debt that can never be paid back. Who is going to PAY for the
shale oil abundance miracle?
With Globalization enabling nothing but poverty for everyone except for the 1%ers, the jobless
"consumer" cannot afford anything so your question is silly.
In the short run the fed can play money games. When the laws of physics show up, they are in
trouble. I agree that desperation would lead to money printing from a bunch of clueless apes (humans).
I won't be lending my pitiful money at 1% interest if peak oil strikes. If that basic commonsense
idea is accurate, than where is the capital to run the economy going to come from???
So we would need to multiply by how many factors the number of rigs and fracking crews
to get the USA to 20 million barrels per day? I suppose we need $300 WTI sustained for that
to occur?
It took close to $100 sustained from 2007 to 2014, with a financial crisis and $100+ drop
in the price, followed by a remarkably quick run up, to get USA from 5 million to 9.7 million.
I figure $300 sustained for 8-10 years could get us to 15-17 million, for a short time. Drill
the heck out of everything, everywhere. LOL!! Please note, I am not serious. Just trying to
get real on this 20 million bopd idea.
He has at least admitted they don't have 2 mmbpd spare capacity immediately available,
contrary to usually quoted figures. With enough money and stupidity you could get 20 mmbpd
out of a 20 million barrel reservoir, but next day there would be a lot of expensive scrap
metal around. To add enough to get there for Saudi would cost all of their remaining wealth
fund as of today (and which only has three years left at current draw rate anyway).
Dennis, I did not read the referenced link; I thought the discussion was relative to the BP
bunk. My apologies. That the KSA could increase its daily production to 20 MBOPD is almost
as absurd as the US LTO industry finding some place to drill another 65,000 shale wells. We
just had over 31,000 shale wells drilled in the US and the LTO industry has not made a dime
of profit yet.
I agree KSA will never get to 20 Mb/d, but it is more likely than the US ever getting to
that level.
On the shale wells, the NDIC has forecast between 40,000 and 55,000 shale wells in the North
Dakota Bakken/Three Forks, lets be conservative and say it will be 35k, there have been 11,000
wells drilled already so that gives us 24,000 wells, if we assume another 19,000 wells in the
Eagle Ford (30,000 total) and 19,000 in the Permian basin, that is about 62,000 wells in the
big 3 plays. I agree that sounds like too many, it may be only half that number. Most of the
30k wells have been drilled over a 5 year period at roughly 6000 wells per year.
So 5 more years at that rate (when oil prices are over $90/b) gets us to 30k wells and 10 years
to 60 k. I think the real number will be somewhere between 30k and 60k and will depend on all
the factors you list, if demand is low and supply high it will be closer to 30k due to low
oil prices and if the reverse is true it will be closer to 60k.
What is your guess for future LTO wells completed, as I assume you don't expect that there
will be no more LTO wells completed (we have an LTO DUC count of 3000 to 4000, so I would think
this would be the minimum)?
At higher oil prices the debt can be paid back. If oil prices remain low forever, there
will be defaults. If the assumption by me and many others that oil prices will rise is incorrect,
there will not be 50,000 more wells drilled in the Bakken and Eagle Ford.
Looking at Rune Likvern's work, it seems cash flow was positive just before the crash in
oil prices. Since that time well costs have fallen, so perhaps $90/b will be enough to make
the LTO plays profitable (so that the annual rate of return is 10% or higher). Higher rates
would be better, if oil supply is short oil prices may be north of $115/b. In that case the
economics will work and we will see 50,000 more stinking shale wells in the Bakken and Eagle
Ford (and maybe another 30,000 combined in other plays such as the Permian and Niobrara).
It all depends on oil prices, and nobody knows what they will be.
It is possible the debt will not be paid back. If that is the case, I would expect interest
rates for shale drilling will rise or it will not be available.
Let us assume that by 2018 that peak oil has arrived (if it has not already), under those
conditions oil prices will rise to $120/b or more. The cash flow for the average LTO well gets
pretty high at those oil prices, perhaps the oil companies that are still operating will be
a little smarter about how fast they accumulate debt in the next boom phase.
You do think there will be a peak, I assume.
What do you think will happen to oil prices?
You may assume there would be an immediate recession, but from 2011 to 2014 we had high
oil prices with slow World growth (2 to 3% per year in constant dollars).
A combination of slow supply growth (or a plateau in output) with reduced demand through
better fuel efficiency might keep prices from rising to a point that causes a recession, at
least for a couple of years. Eventually output will start to fall and the economy will not
be able to adjust and there will be an economic crisis.
My WAG is that this arrives between 2025 and 2030.
DC Wrote:
"Let us assume that by 2018 that peak oil has arrived (if it has not already), under those
conditions oil prices will rise to $120/b or more."
Its extremely unlikely that the world could support sustained prices above $100. From roughly
2005 to 2008 (Western economic debt bubble) and from roughly 2010 to 2015 (Asian/BRIC debt
bubble) it could temporarily support higher energy prices. During both periods credit became
very cheap and available.
At this point both the East and West are saturated in debt and deflation is the dominate
economic factor in the global economy. The cheap and easy credit days are gone for at least
a generation.
Perhaps at some point the world's central banks will collaborate, or currency war, to induce
a global currency devaluation (race to the bottom) that results in a commodity price rebound.
Short of a global wide currency devaluation, its unlikely that Oil will bounce anywhere near
$120/bbl because of deflationary forces. Even if Oil does breach $120/bbl I doubt it would
trigger another drilling boom, since the costs for everything else will also be very expensive:
very high interest rates for most borrowers, expensive materials (ie steel, pipe). High energy
prices will also lead to demand destruction. Consider that QE and currency devaluation almost
always results in wage reductions (adjusted for inflation). The QE in the US/EU, never trickled
down to the working class. All we ended up is asset & commodity price inflation.
I also think global demand for oil will decline, due to a combination of demographics (boomers
retiring), declining wages (wages & worker hours per employer are falling), and much more automation
(leading to the elimination of jobs). Most of the replacement jobs after 2009 have been part-time
and are low-wage service jobs. There is already an over capacity of factories, housing, etc,
leading to less construction demand for perhaps a generation or more.
My guess is that Oil prices will likely be very unstable, with dramatic swings been high
prices and very low prices. In this environment, Drillers are unlikely to make any long term
investments, as they fear the bottom could fall out at any time.
Possibly demand will fall faster than supply, but I doubt it.
Why do interest rates rise in your scenario.
In a deflationary scenario with lower aggregate demand, not a lot of demand for liquidity.
So basic theory suggests low interest rates will continue in the scenario you present.
DC asked:
"Why do interest rates rise in your scenario"
Gov't bonds will never rise except for small weak nations (ie Brazil) or nations that can't
borrow in their own currencies. I think Interest rates on US bonds, Japan and a select few
EU nations will remain low to negative for quite some time.
On the flip side, I expect borrowing cost for weak nations such as Brazil and other So.
American nations, EU PIGS (portugal, Spain, etc) to rise.
Borrowing costs for consumers will rise as the the risk of defaults increase, even in the
EU and the US. (ie the default premium). More and more business and consumers will be downgraded
to subprime borrowers forcing them to pay for much higher rates if they choose to borrow.
DC wrote:
"Possibly demand will fall faster than supply, but I doubt it."
I suspect demand will become volatile, swinging between a tight market (rising prices) and
demand destruction. To unstable for driller to make long term investments. The Oil production
will likely adjust to falling demand.
Supply is unlikely to ever outpace demand, except for short periods during periods of economic
contraction (ie the economy falls faster than the Oil market can adjust).
Dennis, the future of shale oil development does not simply depend on oil prices. It will depend
on hydrocarbon demand, the role the KSA will have in the future in manipulating oil prices
to keep the US shale industry on the floor and not let it back up, it will depend on rising
extraction costs, public sentiment, politics (anti-frac'ing, climate change, fresh water usage),
the availability of financing and what the new costs will be for that financing. And finally
it will depend on Mother Nature says about it all. Do not confuse technically recoverable with
recoverable; it is naive of you are anybody else to assume that all unconventional resource
plays are one big homogenous ATM machine.
Jeffrey Brown and I once decided that fewer than 35% of LTO wells in the US would ever pay
back drilling and completion costs. After reviewing Enno's 114,000 average BO per shale oil
well drilled since 2007, I think we were being far too optimistic. Shallow is correct, most
of the outstanding debt now owned by the shale oil industry will never be paid back.
Making predictions based on the "hope" crude oil prices will rise, and stay high, is a mistake.
If you need an example of that, we're in the middle of it.
Adios from S. Texas where the Eagle Ford shale play is in hospice care now. Watch what happens
to rig counts, and production, the next 8 weeks and don't get caught standing behind it. It
will suck you plumb off your feet.
As I said if oil prices remain low forever, you will be correct.
I wouldn't bet on that. Let's say oil prices remain at $60/b or less forever as shallow
sand hopes for.
Do you think there will be adequate oil supply at that price?
I have serious doubts that oil supply will meet demand in 2020 if oil prices remain $60/b
or less from 2016 to 2020.
There certainly won't be a lot of LTO wells drilled at those prices, probably about 2400
wells per year in Bakken, Eagle Ford and Permian combined or roughly 10,000 wells over that
4 year period.
It will be interesting to see what happens, maybe oil demand growth will be more modest
than the EIA and IEA believe and supply will be more resilient.
No not 2400 in the Bakken, that is the total for all three plays and is an assumed average
over a 4 year period if oil prices average $60/b, is too optimistic. I was thinking 60 wells
per month in the Bakken and 70 wells per month in both the Eagle Ford and Permian basin, for
200 wells per month for all 3 plays.
720 wells per year is too high, thank you for pointing out this error.
If we maintain a rig count of 25 rigs and get 1.3 wells drilled per rig each month, that
would be 32 wells per month, if we take the SPUC count of 1000 and divide by 48 months we would
have 20 wells per month, probably 10 per month would be more reasonable as this count may not
approach zero, so maybe 42 wells per month or 500 wells completed per year is more reasonable.
1500 wells completed per year for all of the US LTO sector at oil prices of $60/b or less
would be my minimum guess and 2400 wells completed per year for all of the US is not realistic.
Looking at your recent post it seems 35 to 45 wells per month can be financed, if we call
it 40, that would be only 480 new wells per year so 1500 wells for the total US LTO sector
might be reasonable (or at least closer to a reasonable number).
Thanks for your insight.
The $60/b was WTI, I think this was shallow sand's number and the 720 wells was the number
completed only (some of these would be wells that had already been drilled but had not yet
been completed.
Dennis. I hope I didn't say forever. I think I said a long time. I'll clarify a long time by
it being 2-3 years.
And I didn't mean less. A $55-65 WTI price range would be just fine for 2016, 2017 and 2018.
Maybe longer if costs do not increase substantially.
A $55-65 WTI price band puts Bakken oil around $50 for an average? So if an average well,
net of royalties, generates 120K barrels of oil in 3 years, that is just $6 million of revenue,
not to mention the taxes, LOE, G & A, transport and interest expense.
So, I'm with Rune. Who would be loaning on that, especially to companies already several
billion in debt?
No you did not say forever, you didn't say how long. The average Bakken/Three forks well
has cumulative output of 152 kbo in 3 years (2008-2013 average well), so that is 7.6 million
in revenue just from the oil.
Now let's say I have some DUCs which will cost 5 million for completion. I get 100 kbo in
the first year, maybe I complete the DUCs to keep the lights on, as I have already spent 2.7
million to drill the well and its not helping me at all to leave it uncompleted. I would think
those that are cash strapped would stop drilling and focus on their DUCs, Enno estimates there
are 1000 wells that have been spud but not completed, at 500 per year that would be two years
worth of wells (if the SPUC count can ever go to zero). Also lease costs have been spent and
G+A will not change much by completing another well, the question is will the company have
more money by completing these SPUCs or not. If they will have less money, they should leave
the well as is (as a DUC).
For some reason wells continue to be completed, so perhaps these businesses think it is
in their interest to do so. Or there is some other explanation I have not heard.
"No you did not say forever, you didn't say how long. The average Bakken/Three forks well
has cumulative output of 152 kbo in 3 years (2008-2013 average well), so that is 7.6 million
in revenue just from the oil."
Is 152 kbo gross extracted?
Is the $7.6 M based on $50/bo gross at the wellhead?
Dennis, I said net of royalty, so I was off by less than you note.
156 x .80 NRI (assumed) is 124.8K barrels.
So $6.248 million.
However there would also likely be another $200-300K of natural gas revenue?
I would say wells continue to "keep the lights on". If all wells stop, frack companies shutter
their offices. If all wells stop, company exploration personnel are laid off. If there is absolutely
any money to keep doing something, these last few companies are going to do it, even if it
is a money loser. I assume shutting down the in house exploration unit in the Bakken results
in a much larger writedown than losing on a few wells? Add to that none of the companies can
believe this is a permanent situation, $30 oil or lower, so they are going to keep doing the
minimum in hopes for a rebound.
The problem, of course, is the rebound needs to be more than $55-$65 WTI for the business
model to be valid, as Mike, Rune and I (and many others) have argued for quite awhile.
Sorry, I missed "the net of royalties", which I guess is 20%, so yes 122 net barrels, if
we figure 9% taxes as well, we would be at 108 kb net. So at WH we would have about $45/b,
if the price you suggest is WTI. If LOE is $9/b, we are left with $36/b and net revenue of
$3.9 million, if we assume interest expense and G+A are covered by wells already completed.
So this well would not meet the 36 month payout standard (not even close).
I agree $60/b is not enough, probably $85/b is needed. I am surprised that there has been
as many wells completed in the past year as there has been. At the oil price it doesn't seem
to make sense.
Dennis wrote; "….if we assume interest expense and G+A are covered by wells already completed."
Dennis, can you point to any company where such a thing (assume interest expense and G&A
are covered by wells already completed) is SOP (Standard Operating Procedure)?
FWIIW, estimates show that in aggregate for Bakken $0,4 – $0.5B above cash flow was used
in Bakken in both Jan and Feb-16.
Dennis, there is no net cash flow anymore to drill 200 wells a month, in any shale play, anywhere.
There is no more deferring interest payments, there is no more chingling service providers
and suppliers on 120-180 day terms; how many more reverse splits do you think these public
shale companies can undertake? CLR is the jefe of shale oil development; as Shallow so poignantly
points out, at the end of 2015 CLR had only enough liquidity to drill 1 1/2 more shale wells.
There is no more money, Dennis. Its gone.
Respectfully, may I suggest you read the little words at the bottom of every shale oil earnings
report, or stock tout, that goes something like past performance is not an indication of future
results.
I am simply trying to understand how wells continue to be completed at such low oil prices.
At $50/b at the well head and borrowing for 15 years at 12 % interest an equal number of SPUCs
and drilled and completed wells will have a NPV of $63,000 at a discount rate of 14% over the
20 year life of the well.
If the Bakken continues at 60 wells per month with half coming from SPUCs, the SPUC inventory
falls to 500 if 30 wells are spud each month. Although not very profitable, it keeps the lights
on.
Maybe this kind of thinking is the reason wells continue to be completed at a low rate.
Do you want to make accurate oil price predictions?
(1) The oil price *floor* is set by the marginal cost of production. This varies by volume
transacted, of course. Excursions below the floor are possible but will last less than two
years, as they end when companies run out of cash to sink into a money-losing business.
(2) The oil price *ceiling* is set by the cost of alternatives, such as electricity for electric
cars or heating, or natgas for industrial processes. Excursions above the ceiling are possible
but won't last more than a few months - that's how long it takes industries to retool, how
long it takes for people to buy new cars, etc.
If you want to know the ceiling you need to look at the price of alternatives. In 2018,
electric cars will have purchase-price parity in the upper half of the US car market. Electricity
averages 12 cents per kwh and the cars average 300-350 wh/mile. This is 3.6 to 4.2 cents per
mile.
In very expensive electricity markets, the price of electriciy is being capped by the price
of home solar panels - which of course also varies geographically by amount of sunlight, but
it's under 12 cents per kwh in most of the expensive-electricity markets I know about.
The most efficient gasoline cars are hybrids which get 50 mpg. For these to be cost-effective
vs. an electric car with purchase price parity, given the above electricity prices, gasoline
has to be below $1.80/gallon. (Technically the best are 55 mpg, and this seems to be the theoretical
limit - this would give a gas price of $1.98/gallon.)
This sets a… fairly aggressive ceiling on oil prices. Using a rough calculator to convert
gas price to oil price, basically they can't rise above $55/bbl or maybe $60/bbl for very long.
They could rise higher prior to 2018 (because electric cars don't reach purchase price parity
until then). They could rise higher because electric cars will have trouble manufacturing fast
enough to meet customer demand, but that would be a very short-lived phenomenon.
Or oil prices could rise higher *after automobiles are no longer the main users of crude
oil*, at which point a different calculation applies (what alternatives are there for oil for
airplanes? for factories? how much do they cost?) But at that point, the volume of crude oil
sold would have dropped so massively that all the shale plays would be dead - the volume would
presumably be supplied by easier fields.
In fact, since most gasoline cars do not get 50 mpg and the ones which do carry a price
premium, I expect that the effective cap on the price of oil will actually be below $55, though
I expect excursions as high as $65 due to the lag times involved (several months) for consumers
to respond to oil prices by buying different cars, etc.
Oil's currently around $45; at this price, only hybrids with 41+ mpg can compete on fuel
costs with electric cars (non-hybrids basically can't get better than 40 mpg). Even switching
to hybrids will cut oil usage. The result is that the gasoline car will die quite fast and
the reduction in sales volume for oil will keep pushing the price down. But not until 2018.
I'm going to stake a solid prediction here, and I'm going to be conservative about it. We
will not see oil prices above $60/bbl for more than 9 months at a time, starting in April of
2018 (by which time the electric cars will be very firmly on the market and mass produced).
You can rely on that oil price ceiling prediction until automotive use stops being the major
demand for oil.
The shale producers claim to have breakevens below $45, but most of them are lying - they're
lying in order to try to get more funding, I suspect. A few sweet spots do seem to have lower
breakevens. The drilled-but-uncompleted wells probably have cheaper breakevens (considering
the drilling a sunk cost) so they'll probably be completed.
As oil demand drops, the most expensive marginal producers disappear first (typically) which
lowers the floor on oil prices.
"If the USA can go from 5 million to 9 million in less than 5 years. I wouldn't be surprised
if 20 mbd with time and investmentime was possible."
To add to Mike's Financial description of the problem which is spot on, there is also the
problem of availability. There are only a few locations where shale drilling is possible (sweet
spots). The current locations have been know for a long time in some cases more than 50 years.
Shale drilling is likely a one time deal since they will eventually be depleted.
There is also the problem of the "Red Queen" factor, which would likely have been breached
either this year or in 2017, if the price of Oil hadn't collapsed. Since Shale Wells decline
quickly drillers have to ever increase the pace and the number of wells they drill to continue
expanding production. At some point it becomes physically impossible to drill fast enough to
continue expanding production.
So far EUR has not decreased. It will at some point we do not know when.
At 150 wells completed per month the Bakken would still be increasing. The only problem
is low oil prices. Your basic description is correct but at $100/b oil the peak occurs in 2022
and decline begins due to decreasing EUR.
"Your basic description is correct but at $100/b oil the peak occurs in 2022"
I have doubts we will see Oil back up near $100 anytime soon. Nearly the entire globe has
reached debt saturate, unable to take on more debt. Thus limiting the economy to supporting
much higher energy prices. As I stated in a previous post. High Oil prices occured during the
two recent debt bubbles. The first being the US housing bubble, and the latter, the BRICs Debt
bubble.
Can you foresee another debt bubble happening anytime soon?
There will be another debt bubble (there always is one!) but it's going to be in renewable
energy (the hot new sector!) and it'll give precisely *no money at all* to fossil fuel companies.
"... It was US intervention in the Middle East, say the Saudis, that led us to create first al-Qaeda and then ISIS. The US attack on Iraq tipped the balance in the region in favor of Iran and counter-measures needed to be taken. ..."
"... This is nothing new. The CIA helped create and back the Mujahideen in Afghanistan to counter the 1979 Soviet invasion. And the CIA knew about (at the least) Saudi plans to counter Iran's rise in the region and the uncertainty produced by US-instigated "Arab Spring" beginning in 2011. ..."
It was US intervention in the Middle East, say the Saudis, that led us to create first
al-Qaeda and then ISIS. The US attack on Iraq tipped the balance in the region in favor of Iran
and counter-measures needed to be taken.
This is nothing new. The CIA helped create and back the Mujahideen in Afghanistan to
counter the 1979 Soviet invasion. And the CIA knew about (at the least) Saudi plans to counter
Iran's rise in the region and the uncertainty produced by US-instigated "Arab Spring" beginning
in 2011. The lesson? Interventionism has consequences, some intended and some unintended.
Usually counter to the stated objectives. Trying to order the world, the central planners have
only created chaos.
Blast from the past (this article was published in april 2014 -- two years ago)
Notable quotes:
"... To decrease oil and gas prices significantly, which would be a serious blow to Russia's state treasury, and to achieve substantial reductions in the consumption of Russian oil and gas by the West. ..."
"... However, the rulers of the KSA want much more, and above all, they want Assad's regime to be destroyed, and American help in order to stop the growing influence of Iran, as well as to form a "Shiite Arc" in the region. Only then can Riyadh recover from the strongly shaken position of the kingdom in the Islamic world. And the overthrow of Assad and capturing Damascus by the pro-Saudi Islamist opposition in Damascus are the only things that can strengthen the position of Saudi Arabia as a leader among the Arab states. This would allow the implementation of its plans for further regional expansion – from establishing a Jordanian-Palestinian federation to the formation of an anti-Shiite league from the Arabian Peninsula to India. ..."
"... Thus, while B. Assad stays in power, the construction of the gas pipeline from Qatar to the Mediterranean coast of Syria is impossible. Energy experts calculated back in 2009-2010, that if Sunnis came to power in Syria, instead of the Alawite regime of Bashar Assad, the gas pipeline 'Qatar – Saudi Arabia – Jordan – Syria – Turkey' would be built in two years. This would result in huge financial losses for Russia, whose gas cannot compete with Qatari gas, due to the extremely low cost of the latter. Hence, Saudi Arabia is trying to subdue Qatar, through a conflict within the GCC, in order to cut off another option – the construction of a gas pipeline from Iran (South Pars) through Iraq and Syria, which could be a joint project with Russia. Doha would play only a secondary, supporting role, being dependent on Tehran. ..."
"... Earlier, American billionaire George Soros said that the U.S. strategic oil reserves are more than twice larger than the required level, and the sale of a part of these reserves would allow exerting pressure on Russia. That is, the blows would hit Moscow from two directions – from the United States and from the Persian Gulf. However, later on, the U.S. Secretary of Energy denied this possibility. ..."
"... However, there is the question: Did the U.S. President manage to agree with Saudi Arabia to increase oil supplies to the world market to bring down prices? Does the KSA have a possibility to offer significant volumes of oil on the world market, for example up to 3-4 million b/d? ..."
"... The fact is that the price of $110 per barrel is just the thing that Saudi Arabia needs, because the leadership of the kingdom has extensive socio-economic obligations. And if the standard of living of the Saudis decreases somewhat, due to the fall in oil prices and due to the fall of oil income, the country would be very much at risk to fall into the situation of the "Arab Spring", like it was the case in Tunisia, Libya, Egypt. And the Saudis are afraid of a repetition of the Arab revolutions ..."
"... Alexander Orlov, political scientist, expert in Oriental Studies, exclusively for the online magazine "New Eastern Outlook" . http://journal-neo.org/2014/04/02/rus-zachem-obama-priezzhal-v-e-r-riyad/ ..."
The deterioration of the situation in Ukraine made substantial changes in the agenda of talks
of U.S. President Obama with Saudi leadership in Riyadh on March 28 this year. The main subject of
the discussion included the situation around Ukraine, possible joint steps to decrease energy prices,
in order to weaken Russia's economy, promotion of Iran's moving to a more pro-Western position, to
weaken Tehran's cooperation with Moscow, and only then about Syria and the situation in the GCC.
Obama's support of the coup in Ukraine and the tough American opposition towards Russia in Ukrainian
affairs, led to Washington developing the idea of urgent mobilization of the resources of its rich
Arab allies – to oppose Moscow. This is because it turned out that the U.S. and its allies in NATO
and the EU had no financial or political leverage, for exerting pressure on Russia.
That is why the White House's decision, urgently to revive its relations with those major Arab
partners, with whom they have not been good recently, seems logical. The more so that, although Riyadh
and Washington had differences in the approaches to some international and regional issues, the two
countries reduced neither their energy nor military cooperation, as well as intelligence interaction
was not stopped in the war being conducted by the United States and the Kingdom of Saudi Arabia against
Iran and Syria. In addition, the White House decided to try to form a united front with the leading
country in the Arab world against Moscow, and to neutralize Tehran at the same time.
As it became known, in the course of the conversation, Obama suggested that the ruling Saudi dynasty
"take vengeance" on Russia for Crimea, by making strikes on three fronts. In Syria, in order to take
it out of the orbit of influence of Moscow and Tehran, and to put the whole Levant under the U.S.
and Saudi control. To provide financial assistance to the new government in Kiev, in order to make
Ukraine an outpost of anti-Russian activities in Eastern Europe. To decrease oil and gas prices
significantly, which would be a serious blow to Russia's state treasury, and to achieve substantial
reductions in the consumption of Russian oil and gas by the West.
Washington is well aware that Obama cannot act in any of these areas without Riyadh, especially
in terms of using the "energy weapon" against Moscow. In exchange, Obama offered to "give a free
hand" to the KSA in the Middle East and the Persian Gulf. The more so, that Riyadh has been granted
the right to build a special relationship with Egypt, after the overthrow of Mursi's government.
In general, the U.S. and the West have turned a blind eye to the harsh crushing of the protests of
Shiites in Bahrain and the Eastern Province of the KSA. The Saudis received the right to carry out
an operation to "subdue" Qatar and to defeat the Muslim Brotherhood. Moreover, the White House has
admitted Riyadh to work on the question that is the most important issue for it and Israel, i.e.,
the Israeli-Palestinian settlement, by giving the Saudis a "green light" to work with Jordan, which
now has a special role in the new scheme to settle the Palestinian issue.
However, the rulers of the KSA want much more, and above all, they want Assad's regime to
be destroyed, and American help in order to stop the growing influence of Iran, as well as to form
a "Shiite Arc" in the region. Only then can Riyadh recover from the strongly shaken position of the
kingdom in the Islamic world. And the overthrow of Assad and capturing Damascus by the pro-Saudi
Islamist opposition in Damascus are the only things that can strengthen the position of Saudi Arabia
as a leader among the Arab states. This would allow the implementation of its plans for further regional
expansion – from establishing a Jordanian-Palestinian federation to the formation of an anti-Shiite
league from the Arabian Peninsula to India.
In addition, the Saudis have their own logic here – since Syria can play a key role in supplying
Qatari gas to Europe. In 2009-2011, Damascus was the main obstacle to the implementation of a project
for the construction of a pipeline from Qatar's North Field to the EU, which would have allowed a
strike at "Gazprom", via a sharp increase in supplies of cheap Qatari gas to Europe. For various
reasons, Damascus did not consent to laying of a gas pipeline through its territory from Qatar to
Turkey and the Mediterranean coast of the SAR for further transit to the EU. Thus, while B. Assad
stays in power, the construction of the gas pipeline from Qatar to the Mediterranean coast of Syria
is impossible. Energy experts calculated back in 2009-2010, that if Sunnis came to power in Syria,
instead of the Alawite regime of Bashar Assad, the gas pipeline 'Qatar – Saudi Arabia – Jordan –
Syria – Turkey' would be built in two years. This would result in huge financial losses for Russia,
whose gas cannot compete with Qatari gas, due to the extremely low cost of the latter. Hence, Saudi
Arabia is trying to subdue Qatar, through a conflict within the GCC, in order to cut off another
option – the construction of a gas pipeline from Iran (South Pars) through Iraq and Syria, which
could be a joint project with Russia. Doha would play only a secondary, supporting role, being dependent
on Tehran.
Therefore, in Obama's negotiations with the Saudi rulers, the latter sought U.S. consent to a
large increase in the comprehensive assistance provided to Syrian rebels. In particular, to supply
heavy weapons and man-portable air defense systems (MANPADS), which would reduce to naught the superiority
of the Syrian government forces in terms of firepower, and its complete superiority in the air, and
thereby change the military balance in favor of "the anti-Assad opposition". After that, it would
be possible to act under the tested scheme: the creation of no-fly zones near Turkish and Jordanian
borders, turning this area into a stronghold of militants, supplying arms and sending large mercenary
forces there and the organization of a march on Damascus. In this case, according to the logic of
the Saudis, Iran would be forced to move to a strategic defense, which would satisfy Riyadh at this
stage, before the next move – arranging a coalition aimed at stifling the Islamic regime in Tehran.
Obama asked the Saudis to give $15 billion, in return for all that, in order to support current Ukrainian
authorities, explaining that the KSA would be compensated for these financial costs and a temporary
drop in oil prices later, by the energy "isolation" of Russia and Iran.
The more so, that there was a precedent for this, when President Reagan and Saudi King caused
a sharp decline in oil prices by the dumping of Saudi oil on the world market in the mid-1980s, because
Soviet troops were sent into Afghanistan, which ultimately led to the disintegration of the Soviet
Union, because of the subsequent economic problems. Today, a much smaller decrease in oil prices
– from the current $107 per barrel to around 80-85 dollars – would be enough to make Russia suffer
huge financial and economic damages. This would allow the U.S. president not only to get revenge
for Crimea, but also to undermine significantly the economy of the Russian Federation, which would
be followed by negative domestic political consequences for the current Russian government.
Earlier, American billionaire George Soros said that the U.S. strategic oil reserves are more
than twice larger than the required level, and the sale of a part of these reserves would allow exerting
pressure on Russia. That is, the blows would hit Moscow from two directions – from the United States
and from the Persian Gulf. However, later on, the U.S. Secretary of Energy denied this possibility.
However, there is the question: Did the U.S. President manage to agree with Saudi Arabia to
increase oil supplies to the world market to bring down prices? Does the KSA have a possibility to
offer significant volumes of oil on the world market, for example up to 3-4 million b/d?
The fact is that the price of $110 per barrel is just the thing that Saudi Arabia needs, because
the leadership of the kingdom has extensive socio-economic obligations. And if the standard of living
of the Saudis decreases somewhat, due to the fall in oil prices and due to the fall of oil income,
the country would be very much at risk to fall into the situation of the "Arab Spring", like it was
the case in Tunisia, Libya, Egypt. And the Saudis are afraid of a repetition of the Arab revolutions.
Apparently, the Saudis are not going to offer additional oil on the market in order to bring down
the price, just due to the hatred of the United States for the Russian Federation – as this is not
profitable for them at all. They could agree on other things, including Qatari gas, Syria and Iran.
In addition, the available production capacity of the KSA is not engaged now. This is about 4 million
barrels per day. However, it would be impossible to do this quickly. It could take up to one month
to increase the production. This is about as much as Iran produced at one time. However, now Iran
is going to increase its production, due to lifting a part of the sanctions, and the Saudis are likely
not to increase, but to reduce their production to keep oil prices high. And the prices will remain
within the range they have been for quite a long time already. They will be in the range from 100
to 110, as this is the most comfortable range for both consumers and producers. Many countries, especially
those that can influence the prices, via some manipulations with supply, are extremely interested
in having high level of prices. Socio-economic programs are carried out in Venezuela at a price level
of about $120 per barrel. In Iran, this figure is 110, and the same in Saudi Arabia. Thus, no one
is interested in bringing down prices.
As for Iran, only one thing is clear for the time being: President Barack Obama has reassured
Saudi King Abdullah that he would not agree to a "bad deal" with Iran on the nuclear issue. That
is, Riyadh did not get what it wanted even on the Iranian issue. After the two leaders discussed
their "tactical disagreements", they both agreed that their strategic interests coincide, said an
administration official. The statement of the White House on the results of the two-hour talks reads
that Obama reaffirmed the importance for Washington of strong ties with the world's largest oil exporter.
At the same time, the administration official said that the parties had no time to discuss the situation
with human rights in Saudi Arabia during their negotiations. In addition, a trusted source in the
U.S. State Department said that Washington and Riyadh also discussed the conflict in Syria. According
to him, the two countries carried out good joint work aimed at reaching a political transition period,
and the support of moderate factions of the Syrian opposition. As for a possible supply of man-portable
air defense systems to opposition militants, an informed source in Washington said that the U.S.
still was concerned regarding the provision of such weapons to the rebels. However, there is information
that Obama's administration is considering the possibility of lifting the ban on the supply of MANPADS
to the Syrian opposition. According to this source, the recent successes of the Syrian Army against
the opposition forces may force the U.S. president to change his point of view.
Apparently, Obama and King Abdullah failed to reach clear and specific agreements on all issues
on the agenda. There are differences, and the financial and economic interests are more important
to Saudi Arabia than helping Washington in implementing its "revenge" on Russia for Crimea. Riyadh
is well aware that Moscow and its partners on energy matters have things with which to respond to
Saudi Arabia if the kingdom is blindly led on a string by the White House. And it is aware even more
that Moscow has levers of political influence in the Middle East and the Persian Gulf. The U.S.,
in turn, is not ready to resume its confrontation with Iran, especially when Tehran is fulfilling
agreements to freeze its nuclear uranium enrichment program. In addition, Washington cannot work
actively on Syrian affairs now, in the conditions of ongoing tensions in Ukraine. In addition, the
chemical arsenal of the SAR has been half destroyed. And, apparently, Obama saw for himself during
his, albeit short, stay in the kingdom that great changes are coming there, associated with the upcoming
replacement of the current elderly generation of rulers by another one, which might be accompanied
by unpredictable internal perturbation in the KSA. Hence, there is almost complete absence of victorious
statements about the "historical" success of the U.S. President's visit to Saudi Arabia.
"... The level of effort dedicated to overcoming challenges will depend in part on sustained high oil prices to encourage sufficient investment in and demand for alternatives. ..."
The U.S. economy depends heavily on oil, particularly in the transportation sector. World oil production
has been running at near capacity to meet demand, pushing prices upward. Concerns about meeting increasing
demand with finite resources have renewed interest in an old question: How long can the oil supply
expand before reaching a maximum level of production--a peak--from which it can only decline? GAO
(1) examined when oil production could peak, (2) assessed the potential for transportation technologies
to mitigate the consequences of a peak in oil production, and (3) examined federal agency efforts
that could reduce uncertainty about the timing of a peak or mitigate the consequences. To address
these objectives, GAO reviewed studies, convened an expert panel, and consulted agency officials.
Most studies estimate that oil production will peak sometime between now and 2040. This range of
estimates is wide because the timing of the peak depends on multiple, uncertain factors that will
help determine how quickly the oil remaining in the ground is used, including the amount of oil still
in the ground; how much of that oil can ultimately be produced given technological, cost, and environmental
challenges as well as potentially unfavorable political and investment conditions in some countries
where oil is located; and future global demand for oil. Demand for oil will, in turn, be influenced
by global economic growth and may be affected by government policies on the environment and climate
change and consumer choices about conservation. In the United States, alternative fuels and transportation
technologies face challenges that could impede their ability to mitigate the consequences of a peak
and decline in oil production, unless sufficient time and effort are brought to bear. For example,
although corn ethanol production is technically feasible, it is more expensive to produce than gasoline
and will require costly investments in infrastructure, such as pipelines and storage tanks, before
it can become widely available as a primary fuel.
Key alternative technologies currently supply the
equivalent of only about 1 percent of U.S. consumption of petroleum products, and the Department
of Energy (DOE) projects that even by 2015, they could displace only the equivalent of 4 percent
of projected U.S. annual consumption. In such circumstances, an imminent peak and sharp decline in
oil production could cause a worldwide recession. If the peak is delayed, however, these technologies
have a greater potential to mitigate the consequences. DOE projects that the technologies could displace
up to 34 percent of U.S. consumption in the 2025 through 2030 time frame, if the challenges are met.
The level of effort dedicated to overcoming challenges will depend in part on sustained high oil
prices to encourage sufficient investment in and demand for alternatives. Federal agency efforts
that could reduce uncertainty about the timing of peak oil production or mitigate its consequences
are spread across multiple agencies and are generally not focused explicitly on peak oil. Federally
sponsored studies have expressed concern over the potential for a peak, and agency officials have
identified actions that could be taken to address this issue.
For example, DOE and United States
Geological Survey officials said uncertainty about the peak's timing could be reduced through better
information about worldwide demand and supply, and agency officials said they could step up efforts
to promote alternative fuels and transportation technologies. However, there is no coordinated federal
strategy for reducing uncertainty about the peak's timing or mitigating its consequences.
There's a new parliamentary group in UK on Limits to Growth that had it's first meeting this week.
'A 2015 analysis of the remaining fossil fuel resources in China, USA, Canada and Australia, which
includes unconventional resources, suggests that overall oil production is in fact peaking already'
I hadn't heard this before:
'There's an interesting theory – called the 'green paradox' – that low oil prices are in part
the reaction of an industry fearful of the impacts of climate change policy on its future revenues.
The German economist Hans-Werner Sinn has argued that "if suppliers feel threatened by a gradual
greening of economic policies.. they will extract their stocks more rapidly" thus pushing their
prices down'
"... I recall a geophysics professor equating what he called the "Red Queen Effect" to self-organized criticality, a property of certain dynamical systems that have a critical point as an attractor ..."
"... There is also another element to the Red Queen effect (also caused by the rapid decline in extraction and over time poorer acreage [story of lowest hanging fruits]) and that is funding [and profitability, but I will leave this now]. ..."
"... What I did not expect/foresee back in late 2012, was the extensive use of external funding, primarily debt. The model used a funding feedback and constrained debt leverage. ..."
"... Most of the oil companies went on a debt fueled spending spree expecting the oil price to have reached a permanent high level. And few of these oil companies acknowledge anything about peak oil. Financial dynamics and realities also apply to shale activities. The near future developments in the shales are now all about financials and debt service and many companies will find this reality much harsher than most of the physical realities they so far has encountered. ..."
"Bakken Three/Forks data shown in chart above (NDIC Data) with a Red Queen Model (based
on Rune Likvern's original work) using data gathered from the NDIC by Enno Peters to develop
well profiles."
Was that the first reference to Red Queen in Sep 2012 by Rune?
Unfortunately I did not call it Red Queen, but the more historically accepted terms of Gold
Rush and boom-bust cycle. These things have happened in the past with respect to other resources,
but the only difference with the Bakken is that it now has a different name. Yet the name is just
a name and what is important is the mathematics and physics behind the behavior.
I recall a geophysics professor equating what he called the "Red Queen Effect" to self-organized
criticality, a property of certain dynamical systems that have a critical point as an attractor.
That would've been in the mid-1960s. However, other than when reading Lewis Carroll's Through
the Looking-Glass to my kids I haven't heard the phrase used regularly until encountering Rune
employing the expression here. Googling it, apparently biologist Van Valen developed a "Red Queen
Effect" hypothesis whereby species have to "run" or evolve in order to stay in the same place
or remain extant. That was in the early 1970s. Whatever, it's a rather nice metaphor that seems
to fit LTO production perfectly.
Doug – There's a pretty good book called 'The Red Queen Effect: Sex and the Evolution of Human
Nature', although I'm not that keen on the author, Matt Ridley, who owns the last open cast coal
mine in UK and writes the most condescending op-ed crap in the Times.
WebHubbleTelescope – Red Queen, as I understand it, is having to run faster and faster to stay
in the same place, that doesn't conjure up the same image as boom-bust (moving up and then down)
or gold rush (which I've never heard as a metaphor for anything except what it was, the madness
of crowds attracted to a new resource play).
The Red Queen effect was in reference only to shale oil drilling. Because the wells
decline so fast they must keep drilling faster and faster to stay in the same place. At some point,
not yet reached when the term was first used, the decline will be so great that drillers will
not be able to even stay in the same place. That was the point Rune was making even though that
point had not been reached then . But his point was that point would eventually be reached.
And that is the case even if the bust had never happened.
You are correct. As far as the Bakken and applying the idea of an average well profile multiplied
by the number of completed wells,
there is Mason in Feb 2012, your work in May and July 2012,and then Rune Likvern's work.
Sorry for not giving you credit, I got mixed up because I read Rune Likvern's work before finding
yours and I wrote up this post too quickly without checking back. My mistake.
There is also another element to the Red Queen effect (also caused by the rapid decline
in extraction and over time poorer acreage [story of lowest hanging fruits]) and that is funding
[and profitability, but I will leave this now].
In one piece I alluded to that a slower pace of shale developments would also reduce risk of
exposure to lower prices, reduce cost inflation and as we have learnt, better support a higher
oil price by better balancing supplies and demand [shales are very responsive].
What I did not expect/foresee back in late 2012, was the extensive use of external funding,
primarily debt. The model used a funding feedback and constrained debt leverage.
Most of the oil companies went on a debt fueled spending spree expecting the oil price
to have reached a permanent high level. And few of these oil companies acknowledge anything about
peak oil. Financial dynamics and realities also apply to shale activities. The near future developments
in the shales are now all about financials and debt service and many companies will find this
reality much harsher than most of the physical realities they so far has encountered.
Rune's was the first study I saw that used actual well by well data to develop a well profile
along with the number of new wells added per month. I guess I tend to remember Rune Likvern's
work because he made this rather famous with his work at the Oil Drum.
There was a piece by James Mason in Feb 2012, your piece in May 2012 and a follow up in July
2012, Rune Likvern's work was first published in Norwegian in early Sept 2012.
My apologies to James Mason and Webhubbletelescope, the "Red Queen" name is very catchy, but
the original idea for modelling the Bakken/Three Forks in this way was in James Mason's work.
Dennis, You are right. James Mason was the first. From Mason's PDF "Oil Production Potential
of the North Dakota Bakken":
"Attention is now turned to an evaluation of North Dakota Bakken oil production rates. Because
of the continuous declines in well production over time, new wells have to be brought into
production to make-up the production declines in order to maintain a constant oil production
level. Based on an average well production profile for wells with a 500 Mbbl EUR, the number
of wells to sustain 1.0, 1.5, and 2.0 MMbbl/d oil production rates for thirty years is 27,000
wells, 41,000 wells, and 55,000 wells respectively. The question explored is the timing of
when the land development area becomes saturated with well development."
It's important to cite previous work and give credit where credit is due, otherwise repetition
will work to rewrite history … like I just about did, forgetting that I missed Mason's work the
first time through.
You did cite Mason in your July 2012 blog post and perhaps you had not seen Mason's work before
your May 2012 blog post (it was accepted for publication in Feb 2012, but was published in April
2012).
I always had trouble commenting at The Oil Drum. I think the moderator ( Leanne?) was very
capricious about what comments of mine she would decide to delete. And if I ever complained about
her moderating policies, that was it and I would be banned from commenting for a period of time.
"... A famous 3 am call did take place in Doha on Sunday. The young Salman called the Saudi delegation and told them the deal was off. Every other energy market player was stunned by the reversion. ..."
US President Barack Obama landed in Saudi Arabia for a GCC petrodollar summit and to proverbially
"reassure Gulf allies" amidst the oiliest of storms.
The Doha summit this past weekend that was supposed to enshrine a cut in oil production by OPEC,
in tandem with Russia – it was practically a done deal – ended up literally in the dust.
The City of London – via the FT – wants to convey the impression to global public opinion that
it all boiled down to a dispute between Prince Mohammed bin Salman – the conductor of the illegal
war on Yemen - and Saudi Oil Minister Ali Al-Naimi. The son of - ailing - King Salman has been dubbed
"the unpredictable new voice of the kingdom's energy policy."
A famous 3 am call did take place in Doha on Sunday. The young Salman called the Saudi delegation
and told them the deal was off. Every other energy market player was stunned by the reversion.
Yet the true story, according to a financial source with very close links to the House of Saud,
is that "the United States threatened the Prince that night with the most dire consequences if he
did not back down on the oil price freeze."
So – predictably - this goes way beyond an internal Saudi matter, or the Prince's "erratic" behavior,
even as the House of Saud is indeed racked by multiple instances of fear and paranoia, as I analysed
here .
As the source explains, an oil production cut would have "hindered the US goal of bankrupting
Russia via an oil price war, which is what this is all about. Even the Prince is not that erratic."
Iran had made it more than clear that after the lifting of sanctions it does not have any reason
to embark on a production cut. On the contrary; oil contributes to 23% of Iran's GDP. But as far
as the House of Saud is concerned – feeling the pain of a budget deficit of $98 billion in 2015 -
a moderate cut was feasible, along with most of OPEC and Russia, as Al-Naimi had promised.
Another key variable must also be taken into account. Not only the whole saga goes way beyond
an internal Saudi dispute; no matter what Washington does, the
oil price has not crashed as expected. This would indicate that the global surplus of oil has
been largely sopped up by falling supply and increasing demand.
As a GCC-based oil market source reveals, "have you noticed how much attention Kerry and Obama
have been giving Saudi Arabia out of all proportion to the past to keep that oil price down? Yet
WTI is up and holding over $40.00 a barrel. That's because oil demand and supply is tightening."
The oil market source notes, "oil surplus is now probably less than a million barrels a day." So
the only way, in the short to medium term, is up.
Blowback from His Masters' Voice?
The House of Saud, by flooding the market with oil, believed it could accomplish three major feats.
1) Kill off competition – from Iran to the US shale oil industry.
2) Prevent the competition from stealing market share with key energy customer China.
3) Inflict serious damage to the Russian economy. Now it's blowback time – as it could come from
none other than His Masters' Voice.
The heart of the whole matter is that Washington has been threatening Riyadh to freeze Saudi assets
all across the spectrum if the House of Saud does not "cooperate" in the oil price war against Russia.
That reached the tipping point of the Saudis shaking the entire turbo-capitalist financial universe
by issuing
their own counter threat ; the so-called $750 billion response.
The - burning - issue of freezing all Saudi assets across the planet has come up with the US Congress
considering a bill exposing he Saudi connection to 9/11.
The declassification and release of those
notorious 28 pages would do little to rewrite recent history; 9/11 – with no serious investigation
- was blamed on "Islamic terror", and that justified the invasion of Afghanistan and the bombing/invasion/occupation
of Iraq, which had no connection to 9-11 nor any weapons of mass destruction.
The 28 pages did intimidate the House of Saud and Saudi intelligence though. Especially because
the odd sharp brain in Riyadh could make the connection; the 28 pages were being paraded around in
Western corporate media before the OPEC meeting to keep the Saudis in line on the oil war against
Russia. That may have been yet another Mafia-style "offer you can't refuse"; if the House of Saud
cuts oil production, then it will be destroyed by the release of the 28 pages.
So we are now deep into Mutually Assured Threat (MAT) territory, more than Mutually Assured Destruction
(MAD).
No one really knows how much Saudi Arabia has tied up in US Treasuries – except for a few insiders
in both Riyadh and Washington, and they are not talking. What is known is that the US Treasury bundles
Riyadh's holdings along with other GCC petrodollar monarchies. Together, that amounted to $281 billion
two months ago.
Yet the Saudis are now saying they would get rid of a whopping $750 billion. A New York investment
banker advances that "six trillion dollars would be more like it." Earlier this year,
I revealed on Sputnik how the House of Saud was busy unloading at least $1 trillion in US securities
on the market to balance its increasingly disastrous budget. The problem is no one was ever supposed
to know about it.
The fact is the US and the West froze $80 billion in assets that belonged to the deposed head
of the Egyptian snake, Mubarak. So a freeze tied up with framing Saudi Arabia for terrorism would
not exactly be a hard sell.
The nuclear option
For all the pledges of eternal love, it's an open secret in the Beltway that the House of Saud
is the object of bipartisan contempt; and their purchased support, when push comes to shove, may
reveal itself to be worthless.
Now picture a geopolitical no exit with a self-cornered House of Saud having both superpowers,
the US and Russia, as their enemies.
Obama's visit is a non-event. Whatever happens, Washington needs to sell the fiction that the House
of Saud is always an ally in the "war on terra", now fighting ISIS/ISIL/Daesh (even if they don't.)
And Washington needs Riyadh for Divide and Rule purposes – keeping Iran in check. This does not mean
that the House of Saud may not be thrown under the bus in a flash, should the occasion arise.
As the source close to Riyadh advances, "the real nuclear option for the Saudis would be to cooperate
with Russia in a new alliance to cut back oil production 20% for all of OPEC, in the process raising
the oil price to $200.00 a barrel to make up for lost revenue, forced on them by the United States."
This is what the West fear like the plague. And this is what the perennial vassal, the House of Saud,
will never have the balls to pull off.
"... Historically, feuding within the royal family has weakened its grip on power, and it was familial infighting that caused the second Saudi state's collapse in the late 1800s. ..."
"... The prince – whose age seems to be a well protected state secret, but lies somewhere between 27 and 34 years – has few merits. Through the appointment, Salman violates a number of key royal norms: all previous kings have promoted their own sons in terms of power and wealth, but within reasonable limits. ..."
"... Salman's tough and militaristic foreign policy – known as the "Salman Doctrine" – can be seen in light of his consolidation of power. ..."
"... The decision to bomb the Huthis was arguable partly driven by the king's desire to consolidate the position of Muhammad bin Salman, who, besides being deputy crown prince, is the world's youngest minister of defence. ..."
On April 29th 2015 the official Saudi Press Agency announced a royal decree stating that
the king's half-brother, Muqrin, had been replaced as the new heir apparent by Muhammad bin
Nayif, the king's nephew and interior minister. At the same time Muhammad bin Salman, son of
King Salman, was appointed deputy crown prince, while Foreign Minister Prince Sa'ud al-Faysal
was replaced by Adil al-Jubayr, the Saudi ambassador to the U.S. King Salman's reshuffling
will arguably not bring more stability to Saudi Arabia, but rather increase the long-term risk
of political instability. It underpins the notion that the Al-Sudayri clan of the royal family
has carried out a "palace coup". The survival of a dynastic regime like the Al-Sa'ud depends
on unity within the elite. Because of Salman's reshuffling of key positions the Sudayris are
now on their own at the helm of the kingdom. The new king's ultimate goal seems to be to
consolidate the succession within his branch of the family and for his favourite son. Salman's
recent appointments will probably trigger considerable dissatisfaction within the royal
family, and nurture future rivalry and potential conflicts among the various family factions.
In particular, the appointment of Muhammad bin Salman is likely to be a source of discord.
On April 29th 2015 the official Saudi Press Agency announced a royal decree stating that the
king's half-brother, Muqrin, had been replaced as the new heir apparent by Muhammad bin Nayif,
the king's nephew and interior minister. Salman relieved Crown Prince Muqrin of his post
reportedly "upon his own request". This is the first time that a grandson of the founder of the
modern kingdom, King 'Abd al-'Aziz (Ibn Sa'ud) rather than a son has been appointed crown prince,
marking a generational change at the top of the ruling house. At the same time Muhammad bin
Salman, King Salman's son, was appointed deputy crown prince, while Foreign Minister Prince Sa'ud
al-Faysal, who had held this important ministerial post since 1975, was replaced by Adil al-Jubayr,
who is not a member of the royal family, but has served as the Saudi ambassador to the U.S.
King Salman's reshuffling of top posts might increase the long-term risk of political
instability in Saudi Arabia. It underpins the notion that the Al-Sudayri clan of the royal family
has carried out a "palace coup". Although none of the members of the family has aired any
discontent publicly, with the exception of a single tweet by the notorious loose cannon Prince
Talal, it is highly likely that King Salman's recent moves have created considerable tension
within the royal family. The reshuffling alters the balance between the various family fractions.
Historically, feuding within the royal family has weakened its grip on power, and it was
familial infighting that caused the second Saudi state's collapse in the late 1800s.
It is not surprising that Muqrin was deposed as crown prince – given that he has a weak
personal power base and that his mother was a concubine of Yemeni descent. The need for King 'Abd
Allah to explicitly stipulate in the decree appointing Muqrin that the decision could not be
altered or changed in the future by any party clearly indicates that the late king was aware that
the appointment of his half-brother would be met with resistance from within the family. That
said, Salman's prompt decision to sideline Muqrin challenges established norms within the royal
house: it is neither common that a new king sets aside the heir apparent appointed by his
predecessor nor that he overrules a royal decree issued by the late king. Neither did it come as
a surprise that Muhammad bin Nayif was promoted to crown prince, although his appointment as
deputy crown prince in January was controversial within the royal family. He is one of the
seniors among Ibn Sa'ud's grandsons and has a reputation as a skilled leader. However, what came
as a surprise was the appointment of the young wunderprince Muhammad bin Salman as deputy crown
prince.
The prince – whose age seems to be a well protected state secret, but lies somewhere
between 27 and 34 years – has few merits. Through the appointment, Salman violates a number of
key royal norms: all previous kings have promoted their own sons in terms of power and wealth,
but within reasonable limits.
In 1964 King Sa'ud was deposed by his own brothers partly because he sought to amass power in
the hands of himself and his sons at the expense of other powerful members of the royal family.
Age, experience and kingly qualities have always been the basis for the choice of a successor to
the throne. According to the "Basic Law", which is the closest Saudi Arabia comes to a
constitution, each of Ibn Sa'ud's grandsons has the right to be king, and they number around 200.
By appointing his own son Salman has bypassed numerous other royals who are both older and far
more experienced. After Salman became king 'Abd Allah's family branch and the former king's
allies have lost political influence. Khalid al-Tuwaijri, the former head of the royal court, was
the first one to be deposed. Two sons of 'Abd Allah, who were deposed as governors of the key
provinces of Riyadh and Mecca, followed him. Currently Mitab bin 'Abd Allah, who is minister and
commander of the Saudi Arabian National Guard, is the only one among the late king's sons who has
retained an important position, and it will not come as a huge surprise if he too has his
political wings clipped. Muqrin, the now-deposed crown prince, was also among the late king's
closest aides.
One should not read too much into the replacement of Sa'ud al-Faysal, who was first appointed
in 1975, making him the world's longest-serving foreign minister, and who has struggled with
health problems. Faysal "asked to be relieved of his duties due to his health conditions", said
the royal decree, which may well be correct. However, it is known that there was disagreement
between Faysal and the younger princes Muhammad bin Nayif and Muhammad bin Salman over the
decision to bomb the Huthi rebels in Yemen, with Faysal arguing for a diplomatic rather than a
military approach.
Salman's tough and militaristic foreign policy – known as the "Salman
Doctrine" – can be seen in light of his consolidation of power.
The decision to bomb the Huthis was arguable partly driven by the king's desire to consolidate
the position of Muhammad bin Salman, who, besides being deputy crown prince, is the world's
youngest minister of defence.
Throughout the military campaign Saudi media loyal to the king have
painted a picture of the young prince as a decisive military commander. In Saudi Arabia rumours
are saying that Prince 'Abd al-'Aziz bin Salman, the fourth son of King Salman, could soon
replace the current oil minister, 79-year-old technocrat 'Ali al-Na'imi. If this happens, the
prince, who was promoted from assistant oil minister to deputy oil minister earlier this year,
would be the first member of the royal family to run this important ministry – another move that
arguably would strengthen the king's line.
Former kings have appointed non-royals to this ministerial post to avoid creating the notion
that one family branch controls the country's main source of income and the source of the royal
family's wealth. The survival of a dynastic regime like the Al-Sa'ud depends on unity within the
elite. King Salman and former king 'Abd Allah were known for having a rather bad relationship on
a personal level. Because of Salman's reshuffling of key positions the Sudayris are now on their
own at the helm of the kingdom. The new king's ultimate goal seems to be to consolidate the
succession within his branch of the family and for his favourite son. Salman's recent moves to
enhance the power of his own line will probably trigger considerable dissatisfaction within the
royal family, and nurture future rivalry and potential conflicts among the various family
factions. In particular, the appointment of Muhammad bin Salman is likely to be a source of
discord, and he will find it very difficult to become a respected and unifying figure within the
family. Time will show how long it will take for a backlash to occur, which might be when the
king and his Sudayri companions are facing such a dire situation that they will need the support
of the rest of the Al-Sa'ud.
The royal decree that announced the promotion of Muhammad bin Salman underlines the young
prince's qualifications, the needs of the state and the support of the majority of the members of
the Allegiance Council, in addition to the granting of a month's extra pay to all military and
civilian security personnel. The fact that these details are included probably reflects some
anticipation by King Salman that the appointment might be met with scepticism both within and
outside the royal elite. In February and March there was a drop of as much as $36 billion dollars
in the kingdom's net foreign currency reserves, equivalent to around 5% of the total, the largest
recorded two-month decline ever, which was partly due to the extra pay. Besides "buying the
support" of the people, the king has sought backing from conservative elements within the clergy
– who were sidelined by late king 'Abd Allah – by appointing conservative clerics to important
positions and reinvigorating his predecessor's efforts to crush the Muslim Brotherhood in Egypt.
Finally, it is ironic that Salman is the one making these controversial appointments, which
eventually might upset the stability of Saudi Arabia.
For five decades – when he was governor of Riyadh Province – Salman played an important role
in terms of maintaining unity within the royal family; it was often him the royals turned to when
they needed to resolve family conflicts or deal with other family matters.
Stig Stenslie is assistant deputy general and head of the Asia Division of the Norwegian
Defence Staff. He has held visiting fellowships at, among others, the Norwegian Institute for
Defence Studies in Oslo, the National University in Singapore and Columbia University in New
York. He holds a doctorate on royal family politics in Saudi Arabia from the University of Oslo.
He is the author of several publications on the contemporary Middle East and China, the most
recent being, with Marte Kjær Galtung, 49 Myths about China (Rowman & Littlefield, 2014), Regime
Stability in Saudi Arabia: The Challenge of Succession (Routledge, 2011) and, with Kjetil Selvik,
Stability and Change in the Modern Middle East (IB Tauris, 2011). Disclaimer The content of this
publication is presented as is. The stated points of view are those of the author and do not
reflect those of the organisation for which he works or NOREF. NOREF does not give any
warranties, either expressed or implied, concerning the content. THE AUTHOR The Norwegian
Peacebuilding Resource Centre Norsk ressurssenter for fredsbygging Email: [email protected] -
Phone: +47 22 08 79 32 The Norwegian Peacebuilding Resource Centre (NOREF) is a resource centre
integrating knowledge and experience to strengthen peacebuilding policy and practice. Established
in 2008, it collaborates and promotes collaboration with a wide network of researchers,
policymakers and practitioners in Norway and abroad. Read NOREF's publications on
www.peacebuilding.no and sign up for notifications. Connect with NOREF on Facebook or @PeacebuildingNO
on Twitter
Poor President Barack Obama flew to Saudi Arabia this past week but its
ruler, King Salman, was too busy to greet him at Riyadh's airport.
This snub was seen across the Arab world as a huge insult and violation of traditional desert
hospitality. Obama should have refused to deplane and flown home.
Alas, he did not. Obama went to kow-tow to the new Saudi monarch and his hot-headed son, Crown
Prince Muhammed bin Nayef. They are furious that Obama has refused to attack Iran, Hezbollah in Lebanon,
and Syria's Assad regime.
They are also angry as hornets that the US may allow relatives of 9/11 victims to sue the Saudi
royal family, which is widely suspected of being involved in the attack.
Interestingly, survivors of the 34 American sailors killed aboard the USS Liberty when it was
attacked by Israeli warplanes in 1967, have been denied any legal recourse.
The Saudis, who are also petrified of Iran, threw a fit, threatening to pull $750 billion of investments
from the US. Other leaders of the Gulf sheikdoms sided with the Saudis but rather more discreetly.
Ignoring the stinging snub he had just suffered, Obama assured the Saudis and Gulf monarchs that
the US would defend them against all military threats – in effect, reasserting their role as western
protectorates. So much for promoting democracy.
Saudi Arabia and the Gulf states have been de facto US-British-French protectorates since the
end of World War II. They sell the western powers oil at rock bottom prices and buy fabulous amounts
of arms from these powers in exchange for the west protecting the ruling families.
As Libya's late Muammar Kadaffi once told me, "the Saudis and Gulf emirates are very rich families
paying the west for protection and living behind high walls."
Kadaffi's overthrow and murder was aided by the western powers, notably France, and the oil sheiks.
Kadaffi constantly denounced the Saudis and their Gulf neighbors as robbers, traitors to the Arab
cause, and puppets of the west.
Many Arabs and Iranians agreed with Kadaffi. While Islam commands all Muslims to share their wealth
with the needy and aid fellow Muslims in distress, the Saudis spent untold billions in casinos, palaces
and European hookers while millions of Muslims starved. The Saudis spent even more billions for western
high-tech arms they cannot use.
During the dreadful war in Bosnia, 1992-1995, the Saudis, who arrogate to themselves the title
of 'Defenders of Islam" and its holy places, averted their eyes as hundreds of thousands of Bosnians
were massacred, raped, driven from their homes by Serbs, and mosques blown up.
The Saudi dynasty has clung to power through lavish social spending and cutting off the heads
of dissidents, who are routinely framed with charges of drug dealing. The Saudis have one of the
world's worst human rights records.
Saudi's royals are afraid of their own military, so keep it feeble and inept aside from the air
force. They rely on the National Guard, a Bedouin tribal forces also known as the White Army. In
the past, Pakistan was paid to keep 40,000 troops in Saudi to protect the royal family. These soldiers
are long gone, but the Saudis are pressing impoverished Pakistan to return its military contingent.
The US-backed and supplied Saudi war against dirt-poor Yemen has shown its military to be incompetent
and heedless of civilian casualties. The Saudis run the risk of becoming stuck in a protracted guerilla
war in Yemen's wild mountains.
The US, Britain and France maintain discreet military bases in the kingdom and Gulf coast. The
US Fifth Fleet is based in Bahrain, where a pro-democracy uprising was recently crushed by rented
Pakistani police and troops. Reports say 30,000 Pakistani troops may be stationed in Kuwait, the
United Arab Emirates and Qatar.
Earlier this month, the Saudis and Egypt's military junta announced they would build a bridge
across the narrow Strait of Tiran (leading to the Red Sea) to Egypt's Sinai Peninsula. The clear
purpose of a large bridge in this remote, desolate region is to facilitate the passage of Egyptian
troops and armor into Saudi Arabia to protect the Saudis. Egypt now relies on Saudi cash to stay
afloat.
But Saudi Arabia's seemingly endless supply of money is now threatened by the precipitous drop
in world oil prices. Riyadh just announced it will seek $10 billion in loans from abroad to offset
a budget shortfall. This is unprecedented and leads many to wonder if the days of free-spending Saudis
are over. Add rumors of a bitter power-struggle in the 6,000-member royal family and growing internal
dissent and uber-reactionary Saudi Arabia may become the Mideast's newest hotspot.
Eric S. Margolis is an award-winning, internationally syndicated columnist. His articles have
appeared in the New York Times, the International Herald Tribune the Los Angeles Times, Times of
London, the Gulf Times, the Khaleej Times, Nation – Pakistan, Hurriyet, – Turkey, Sun Times Malaysia
and other news sites in Asia. http://ericmargolis.com
"... the Arabian peninsula now accounts for nearly 30 percent of all active rigs outside North America, up from less than 18 percent when the slump began ..."
"... Does this not sound exactly like the red queen situation? I think it completely supports Ron's contention that they are producing flat out - and having trouble keeping their current production level up. ..."
"The rig count has increased by 50 since oil prices started to fall in mid-2014 and has almost
doubled over the last five years"
"As a result, the Arabian peninsula now accounts for nearly 30 percent of all active rigs
outside North America, up from less than 18 percent when the slump began "
Does this not sound exactly like the red queen situation? I think it completely supports Ron's
contention that they are producing flat out - and having trouble keeping their current production
level up.
"... In response to continued low oil prices, onshore crude oil production in the Lower 48 states is expected to decline from an average of 7.41 million barrels per day (b/d) in 2015 to 6.46 million b/d in 2016 and to 5.76 million b/d in 2017. ..."
"... In my view we will see actually a massive decline in wells due to plugging of wells. ..."
"... So, a 33% decline of production is realistic and probably even too conservative. ..."
"... It is difficult for me to check how big these wells are. However, the main point here is about a huge sea change (see below chart) in net wells. Add the dramatic decline in use of proppant, the drop in rig counts (natural gas rigs are just at 88 versus 1600 in 2008)….. I can see the writing on the wall. ..."
"... US production will be declining dramatically over the next months. Even the CEO of Pioneer and the IEA admit the decline. The only difference is that I think the decline will last much farther than Sep 2016 and will last well into 2017. ..."
"... Looking at the Bakken, the decline rate from June 2015 to July 2016 will be close to 20% per year if the completed wells fall to 50 new wells per month on average for the rest of 2016, so decline is pretty steep, just not 33%/year. After July 2016 if the completion rate levels off at about 40 completions per month the decline rate moderates to about 10% per year for July 2016 to July 2017. ..."
"... I do think, however, US conventional will continue to drop because there are very few vertical oil rigs running, far lower than even in 1998-1999. Also, I do not think a price increase will result in many conventional rigs coming back to the field this year. Balance sheets must be healed first. Conventional producers do not have a shocking decline like the LTO companies, so skipping another year of new wells is not as big of a problem. ..."
In response to continued low oil prices, onshore crude oil production in the Lower 48 states
is expected to decline from an average of 7.41 million barrels per day (b/d) in 2015 to 6.46 million
b/d in 2016 and to 5.76 million b/d in 2017.
The number of active onshore drilling rigs in the Lower 48 states fell 78% (from 1,876 to 412)
between the weeks ending on October 31, 2014, and April 15, 2016. The decline in active rigs and
well completions is projected to result in month-over-month onshore oil production declines of
120,000 b/d through September 2016.
EIA projects that the number of operating rigs in the Lower 48 states will continue to decrease
through mid-2016 before beginning to slowly increase. However, expected Lower 48 production will
continue to decline-although at a slowing rate-throughout 2017.
EIA's April STEO forecasts Brent crude oil prices averaging $35/b in 2016 and $41/b in 2017,
with the December 2017 price averaging $45/b.
In contrast to the forecast of declining Lower 48 onshore production through 2017, federal
Gulf of Mexico oil production is projected to increase from 1.54 million b/d in 2015 to 1.66 million
b/d and to 1.82 million b/d in 2016 and 2017, respectively. Alaska's oil production is projected
to slightly decrease from 0.48 million b/d in 2015 to 0.47 million b/d in 2016 and to 0.46 million
b/d in 2017.
Increased production from the federal Gulf of Mexico (GOM) is not enough to offset those declines,
with total projected U.S. production falling from 9.43 million b/d in 2015 to 8.04 million b/d
in 2017.
Eyeballing the decline of Q1 2015, onshore : it appears to drop from about 7.5 to 5.0 in 1
year time (33%). That's an even higher decline rate than I expected. Looks like not only the production
I'm tracking is declining at a rapid rate.
I'm curious to see if we indeed will see the projected pick up in rig count this summer already.
Your charts for the Bakken and some other sources show that LTO output drops by some 35% in
12 months if no new wells are completed.
Given that the EIA chart for Lower 48 onshore includes conventional production and still assumes
that new wells are drilled and completed, a 33% decline indeed looks too big.
Apparently, they assume continuing decline in conventional output, primarily due to shut-down
of the stripper wells. BTW, according to the EIA, between April 2015 and January 2016, US conventional
onshore production was down 300 kb/d (bigger in relative terms than the drop in LTO output).
In addition, the EIA's oil projections are too low, in my view. Therefore, they may assume
a small number of well completions
The plugged wells are stripper wells with output of 5 b/d or less.
So if 1000 of these wells are plugged each month that's 5 kb/d lower output each month or a 60
kb/d total decrease over 12 months. Not really much of a factor.
It is difficult for me to check how big these wells are. However, the main point here is
about a huge sea change (see below chart) in net wells. Add the dramatic decline in use of proppant,
the drop in rig counts (natural gas rigs are just at 88 versus 1600 in 2008)….. I can see the
writing on the wall.
US production will be declining dramatically over the next months. Even the CEO of Pioneer
and the IEA admit the decline. The only difference is that I think the decline will last much
farther than Sep 2016 and will last well into 2017.
So far decline in Texas has been relatively modest at an annual decline rate of 8%.
There are still a lot of horizontal oil rigs operating in the Texas Permian Basin (over 100),
and the horizontal wells produce much more oil than the vertical wells in that Basin.
I am talking about oil only here, I don't follow natural gas as closely, at some point gas
output will fall and natural gas prices will rise, no idea when that will happen though.
The permits minus plugged is not really very useful. Oil wells completed relative to wells
plugged is of greater interest. Every well completed (average of about 250 kb/d for first year)
covers about 50 plugged stripper wells (with an average of under 5 b/d). So about 20 completed
wells will make up for 1000 plugged wells.
The first 3 months of 2016 there were 2482 new drill oil completions in Texas and 1453 oil
wells plugged. The plugged wells are equivalent to taking away 29 of the new wells drilled, so
the net new wells would be 2453 new wells or about 818 new wells per month for the first 3 months
of the year. In March about 300 of these wells were in districts 1 and 2 (Eagle Ford most likely)
and about 450 wells in Districts 7C, 8 and 8A (Permian Basin).
There has continued to be quite a lot of activity in Texas at least through March 2016.
Are you accounting for possible incomplete data in Texas?
Are you seeing 33% decline rates outside of Texas?
I am talking at the field level, rather than individual wells or counties. So for the Niobrara,
or New Mexico Permian, the decline is certainly not 33% in the north Dakota Bakken, or not through
February at least. Based on Dean's data for Texas and even the EIA data for Texas, the statewide
decline rate is not anywhere close to 33% per year.
Using EIA data, TX decline rate is 9% from March to Jan 2015. Using Dean's data from March
2015 to Dec 2015 the decline is 6.1% (Jan was anomalous so I threw it out, if it is included the
decline rate is 4.2%)
Looking at the Bakken, the decline rate from June 2015 to July 2016 will be close to 20% per
year if the completed wells fall to 50 new wells per month on average for the rest of 2016, so
decline is pretty steep, just not 33%/year. After July 2016 if the completion rate levels off
at about 40 completions per month the decline rate moderates to about 10% per year for July 2016
to July 2017.
I think the EIA is overestimating the decline because they are underestimating the oil price.
With the DUCs available, the decline for the rest of 2016 in the LTO plays could be as little
as 350 kb/d. The EIA is estimating almost a 1 Mb/d drop for the rest of 2016, the conventional
L48 onshore was about 3300 kb/d in Jan 2016, a 650 kb/d drop in output from L48 onshore conventional
would be a 20% drop, if we assume an 8% drop, that would be about 270 kb/d, for a total of 620
Kb. The EIA is also underestimating Texas output, if Dean's estimates are correct. If we assume
no acceleration in the decline rate for L48 onshore, we get the following, with 2017 output about
6200 kb/d for L48 onshore.
The EIA has a long record of underestimating US oil production, not only during the shale boom,
but also during the current downturn. In particular, they have been underestimating volumes produced
in Texas. But I think that the most recent Dean's estimate for Texas may be too high.
TRRC is now receiving production data from operators in electronic form, which may have shortened
the reporting time. Hence, the underreported volumes for the most recent months are probably less
in relative terms than previously. My conclusion is that historical numbers are somewhere in between
Dean's and the EIA's estimates.
As regards projections for the rest of this year and 2017, I agree that the EIA's price assumptions
are too low. Higher prices may result in higher volumes.
That said, I do not expect a quick rebound in drilling/completion activity as most shale companies
are in a difficult financial situation and will not rush to increase capex. And even in the shale
industry, with its short investment cycle, there is a time lag between a decision to increase
capex and first production.
The EIA's projections may be too low, but I still do not expect a quick rebound in the US C+C
output.
Although maybe not moving the needle much, I think US stripper well production may not decline
as much as it has recently because of:
A. If prices continue to stay above $40 WTI, wells shut in may be put back on production.
B. As winter is over, it is more likely that low volume wells will be returned to production.
Actually many times both A. & B. apply. We have some wells that must be shut in when the temperature
drops below a certain level. Shutting in requires some work, as does resumption of production.
When oil prices were high, we would only shut in during the cold weather. This past winter, we
just shut in at the first sign of cold weather, and did not start up until winter was over.
I do think, however, US conventional will continue to drop because there are very few vertical
oil rigs running, far lower than even in 1998-1999. Also, I do not think a price increase will
result in many conventional rigs coming back to the field this year. Balance sheets must be healed
first. Conventional producers do not have a shocking decline like the LTO companies, so skipping
another year of new wells is not as big of a problem.
"... This short term glut will probably accentuate the coming problems because it gives the impression that there is no peak oil. People have trouble understanding that there are short-term cycles within a long-term cycle. This bad signal is giving us the impetus to continue investing in energy intensive projects instead of reshaping our economy. And this will make things even worse in 5-10 years. ..."
"... A country's most important asset is energy and historically, countries have never willingly cut total energy consumption. They might increase efficiencies but the total does not drop. This means that most countries, as long as there exist other sectors that can be squeezed, will continue to subsidize the energy sector squeezing out these sectors that are deemed less important or simply those with less clout. ..."
"... It is quite obvious that our lives are even more energy dependent than they were when this monetary cycle started in the early 70s. And our system is still based on growing this even more. With NIRP, we are getting very close to the end of this cycle. ..."
"... There is no glut. All the oil is being bought. The problem is that there in not yet enough of a shortage to drive the price up. A small distinction but huge ramifications if you understand it. And by the way higher prices is not a solution to what ails us. ..."
"... The author blames the oil patch bust on a geophysical crisis. There is some truth to this argument but by far the biggest driver of the bust is Fed policy. Artificially cheap debt financing led to overcapacity and a vicious cycle of continued overproduction as drillers desperately try to avoid defaulting. ..."
This short term glut will probably accentuate the coming problems because it gives the impression
that there is no peak oil. People have trouble understanding that there are short-term cycles
within a long-term cycle. This bad signal is giving us the impetus to continue investing in energy
intensive projects instead of reshaping our economy. And this will make things even worse in 5-10
years.
If the total cost of extraction is more than 40$ and consumers are paying $40 or less, then
somewhere along the way, someone is subsidizing the cost. It could be low tax rates, eZ money,
growing deficits, underfunded pensions, underfunded restoration funds, etc.
A country's most important asset is energy and historically, countries have never willingly
cut total energy consumption. They might increase efficiencies but the total does not drop. This
means that most countries, as long as there exist other sectors that can be squeezed, will continue
to subsidize the energy sector squeezing out these sectors that are deemed less important or simply
those with less clout.
It is quite obvious that our lives are even more energy dependent than they were when this
monetary cycle started in the early 70s. And our system is still based on growing this even more.
With NIRP, we are getting very close to the end of this cycle.
There is no glut. All the oil is being bought. The problem is that there in not yet enough of a shortage to drive the price up. A small distinction
but huge ramifications if you understand it. And by the way higher prices is not a solution to what ails us.
The author blames the oil patch bust on a geophysical crisis. There is some truth to this argument
but by far the biggest driver of the bust is Fed policy. Artificially cheap debt financing led
to overcapacity and a vicious cycle of continued overproduction as drillers desperately try to
avoid defaulting.
Saudi Arabia single-handedly ruined the Doha meeting, knowing beforehand that Iran would not participate.
The Russians and others agreed to proceed without Iran, planning to include them at a later date. Why
did the Saudi's take a huge risk of alienating from Russia and the OPEC community?
Was it simply stupid yong gambler at the help? Or was it hostility toward Iran?
Notable quotes:
"... saudi arabia has 268 billion barr ..."
"... Nothing is proven in this figure. The real figure is a state secret. Most probably this estimate is a plain vanilla propaganda like a lot of other Saudi statistics. Saudis oil deposits are extremely depleted and they definitely entered the phase of Red Queen Race, when they need to drill more and more wells just to keep the output from falling. With this new reckless young prince they also depleted their currency reserves. That's why they are now talking about converting their economy away from oil. One of the key problems with the absolutism that one misfit on the throne can take the country down, unless promptly deposed or killed. Saudi oil sector now is facing deep uncertainty in the wake of sweeping changes to the governance of the oil ministry and the state energy company Saudi Aramco by King Salman, who ascended to the throne in January, 2015 and delegated much of his power on his 30 year old son Prince Mohammed Bin Salman: Naive, Arrogant Saudi Prince Is playing With Fire ( http://www.mintpressnews.com/prince-mohammed-bin-salman-naive-arrogant-saudi-prince-is-playing-with-fire/212660/ ) ..."
"... My impression is that all this talk about lessening KSA dependence of oil is a pipe dram: KAS is built on oil and will not be able to restructure on something else without dramatic drop of standard of living and elimination of Saudi monarchy. ..."
saudi arabia has 268 billion barrels of 'proved' reserves.
Nothing is proven in this figure. The real figure is a state secret. Most probably this estimate
is a plain vanilla propaganda like a lot of other Saudi statistics. Saudis oil deposits are extremely
depleted and they definitely entered the phase of Red Queen Race, when they need to drill more
and more wells just to keep the output from falling. With this new reckless young prince they
also depleted their currency reserves. That's why they are now talking about converting their
economy away from oil. One of the key problems with the absolutism that one misfit on the throne
can take the country down, unless promptly deposed or killed. Saudi oil sector now is facing deep
uncertainty in the wake of sweeping changes to the governance of the oil ministry and the state
energy company Saudi Aramco by King Salman, who ascended to the throne in January, 2015 and delegated
much of his power on his 30 year old son Prince Mohammed Bin Salman: Naive, Arrogant Saudi Prince
Is playing With Fire (
http://www.mintpressnews.com/prince-mohammed-bin-salman-naive-arrogant-saudi-prince-is-playing-with-fire/212660/
)
At the end of last year the BND, the German intelligence agency, published a remarkable one-and-a-half-page
memo saying that Saudi Arabia had adopted "an impulsive policy of intervention". It portrayed
Saudi defence minister and Deputy Crown Prince Mohammed bin Salman – the powerful 29-year-old
favourite son of the ageing King Salman, who is suffering from dementia – as a political gambler
who is destabilising the Arab world through proxy wars in Yemen and Syria.
My impression is that all this talk about lessening KSA dependence of oil is a pipe dram:
KAS is built on oil and will not be able to restructure on something else without dramatic drop
of standard of living and elimination of Saudi monarchy. Despite BBC claims:
"But talk of the collapse of the House of Saud seems premature. It is after all a huge structure,
with an estimated 7,000 princes."
"... An unresolved question remains whether a listing will include the division of Aramco that includes its vast reserves of crude oil. It manages, but doesn't own, the kingdom's 260 billion barrels of reserves, the most in the world. ..."
"... I don't think it will ever happen, not even 5%. 5% of ARAMCO would have to include 5% of reserves. And there would have to be confirmation that those reserves actually exist. And of course they do not exist, not 266 billion barrels of reserves anyway. ..."
"... I have had exactly the same thought. How can KSA "cash in" on ARAMCO without the public disclosure required? But maybe they will find a way. Maybe they can sucker investors into believing their reserve numbers? Maybe they can do their offering in a country with less stringent regulations? I don't know much about how that works and I could be way off base, but I do know that where there's a will (and tons of money) there often is a way. And KSA has a BIG TIME desire to cash in, which should tell anyone all they need to know about the state of their economy. ..."
"... Bloomberg does seem rather cozy with the Saudis lately. ..."
"... Smoke and mirrors … they are burning massive amounts of money today, they have about 3-4 years left at the current burn rate. And Saudi invests have been such great things as growing wheat in the desert, destroying their aquifers. ..."
still no mention of "if" any partial float would include reserves ?
potentially – this could enable the game to be played a little longer ?
Saudi Aramco IPO Could Be 5% of Value
22/04/2016 03:05AM AEST
PARIS-Saudi Arabian Oil Co., the largest energy firm in the world, is considering listing up
to 5% of its value on a stock exchange in New York within the next year, a top Saudi oil official
said Thursday.
By listing even a tiny fraction of the company, known as Saudi Aramco, the offering would create
one of the world's most valuable energy firms. Estimates of Saudi Aramco's value have varied,
but using a conservative number of $2.5 trillion, a 5% listing would give it a potential value
of $125 billion-bigger than BP PLC and French oil titan Total SA.
The Saudis are considering listing Aramco at a time when the kingdom is trying to raise cash
during a period of sharply lower oil prices and transition to a world that is less dependent on
oil. Deputy Crown Prince Mohammed bin Salman is overseeing a "National Transformation Plan" to
promote private-sector growth and reduce government reliance on petroleum revenues.
New York has emerged as the leading place for an Aramco listing, but London and Hong Kong are
also being considered, said Ibrahim Muhanna, a top adviser at the Saudi oil ministry. Mr. Muhanna
said the kingdom wouldn't list the company only on Saudi Arabia's bourse, the Tadawul, because
it was too small.
"The Saudi market cannot take a company like this," Mr. Muhanna said on the sidelines of a
conference in Paris.
He didn't disclose which firms were working on the listing for Aramco. He said a price for
the stock was still being determined and that it may take another year for a listing to be completed.
Pricing "has to be decided by international markets," Mr. Muhanna said. "It has to be competitive."
An unresolved question remains whether a listing will include the division of Aramco that
includes its vast reserves of crude oil. It manages, but doesn't own, the kingdom's 260 billion
barrels of reserves, the most in the world.
Saudi Aramco Chairman Khalid al-Falih has sent conflicting signals about whether the reserves
will be include. Mr. Muhanna didn't address the issue.
A number of Saudi experts and insiders have said Saudi Arabia wouldn't include its production
assets in any listing. Aramco is essentially an instrument of state policy, and its methods and
reserves tantamount to state secrets.
The company produces more than 10% of the world's oil supply every day and controls a large
chain of refineries and petrochemical facilities to complement its exploration and production
operations.
I don't think it will ever happen, not even 5%. 5% of ARAMCO would have to include 5% of reserves.
And there would have to be confirmation that those reserves actually exist. And of course they
do not exist, not 266 billion barrels of reserves anyway.
Ron Wrote:
"I don't think it will ever happen, not even 5%. 5% of ARAMCO would have to include 5% of reserves.
And there would have to be confirmation that those reserves actually exist. And of course they
do not exist, not 266 billion barrels of reserves anyway."
I think they will fangle a way around the reserve reporting problem. Didn't Brazil's Petrobras
over state its reserves, yet was able to raise over $100 billions in capital.
Jan 29, 2016:
"Brazil's state-controlled oil producer Petrobras slashed its oil and natural gas reserves 20
percent on Friday, hit by a plunge in energy prices, a heavy debt load, high costs and a corruption
scandal."
I have had exactly the same thought. How can KSA "cash in" on ARAMCO without the public disclosure
required? But maybe they will find a way. Maybe they can sucker investors into believing their
reserve numbers? Maybe they can do their offering in a country with less stringent regulations?
I don't know much about how that works and I could be way off base, but I do know that where there's
a will (and tons of money) there often is a way. And KSA has a BIG TIME desire to cash in, which
should tell anyone all they need to know about the state of their economy.
There are people with money willing to believe just about anything.
Eight unprecedented hours with "Mr. Everything," Prince Mohammed bin Salman.
Peter Waldman, Bloomberg, April 21, 2016
For two years, encouraged by the king, the prince had been quietly planning a major restructuring
of Saudi Arabia's government and economy, aiming to fulfill what he calls his generation's
"different dreams" for a postcarbon future .
from your link: "The likely future king of Saudi Arabia says he doesn't care if oil prices
rise or fall. If they go up, that means more money for nonoil investments, he says. If they go
down, Saudi Arabia, as the world's lowest-cost producer, can expand in the growing Asian market."
Smoke and mirrors … they are burning massive amounts of money today, they have about 3-4 years
left at the current burn rate.
And Saudi invests have been such great things as growing wheat in the desert, destroying their
aquifers.
"... I'm not a huge Rolling Stones fan, but whenever I see a complex economic analysis like this, I'm reminded of what Mick Jagger said when they asked him why he dropped out of the London School of Economics: "There's too many variables." ..."
"... Prieto and Hall did an analysis of Spanish solar that was probably the most comprehensive yet, including things like the truck trips to lay the gravel for the surface roads, maintenance trips to clean the panels, etc, and got a much lower EROEI figure than is typically given for solar. ..."
"... The article is generally correct that renewable EROEI tends to be lower than that of fossil fuels, although it seems not to contemplate that there is a lower bound on EROEI beyond which these systems can't/won't be sustained anyway. It's not just that less energy is available for non-energy production use but that there is an EROEI return below which you probably can't operate the infrastructure necessary to mine/smelt materials for renewables on the scale being contemplated here (total replacement of FF-burning infrastructure) ..."
"... A factor that I believe is missing from EROI is cost of clean up or, lacking clean up, the cost of consequences, which should be determined taking into account the negative effects of our propensity for corruption, personal gain at the expense of the whole, (which is why nuclear should have a stratosphericly high cost, for ex.) ..."
Thanks, Yves, for posting this information rich and pertinent article. Your curation is impeccable.
The cited documents are lengthy and I intend to read further. At a glance, I was surprised
to learn that, despite years of Peak Oil investigations:
1) EROI is virtually unknown in conventional economic and financial circles.
2) Lack of institutional awareness and disinterest at DFID is widespread, such that research isn't
influencing policy. The essence of irony!
3) Experts remain focused on comparitively high energy solutions (such as underground carbon capture
technologies) over low energy biological solutions (such as carbon sequestration by soil organisms,
trees and plants).
I'm heartened, though, to see some regenerative farming citations. Eric Toensmeier and the
Rodale Institute are wonderful. Bill Mollison, David Holmgren, Brad Lancaster, Geoff Lawton and
Darren J. Doherty are also excellent resources. BTW, the 60999 EROI Global Energy Resources pdf
cites a Lambert, et al 2013. Is that THE Lambert?
A broader understanding of energy is and will remain critical in a post-capitalism, post-carbon
future. Currently, work is neglected because "it doesn't pay" to do it. That is a tragic squandering
of available resources. By any meaningful metric, it pays to liberate latent energy to do the
work of restoring the environment.
There was a lively discussion this week about community building. I'm happy to spend my days
installing earthworks, natural building, growing yummy stuff…
Thx for highlighting the regenerative agriculture references. An important resource I'd add
to the list regarding regenerative agriculture and large scale carbon sink benefits is the
Savory Institute . Their website is constantly
adding links to recent research.
I'm not a huge Rolling Stones fan, but whenever I see a complex economic analysis like this,
I'm reminded of what Mick Jagger said when they asked him why he dropped out of the London School
of Economics: "There's too many variables."
Fascinating article. One niggling question about EROI. I get how it's relatively easy to calculate
the EROI of a barrel of oil - the barrel holds a specific number of gallons and each gallon is
capable of producing X amount of energy. But what about renewables? You know the production cost
of a wind turbine, for instance, but the energy it produces over its lifetime is much more open-ended.
So the Energy Return for it must be the total expected energy returned over the turbine's projected
service life, right? If so, the longer it lasts, the higher it's EROI.
It's a lot more complicated even than that, it really depends on where you draw the boundaries
of the system. Prieto and Hall did an analysis of Spanish solar that was probably the most
comprehensive yet, including things like the truck trips to lay the gravel for the surface roads,
maintenance trips to clean the panels, etc, and got a much lower EROEI figure than is typically
given for solar.
As far as wind goes, turbines tend to fail at a higher frequency than manufacturers estimate
(go figure) so the best way to measure things like turbine lifespan is to look at those in the
field. The article is generally correct that renewable EROEI tends to be lower than that of
fossil fuels, although it seems not to contemplate that there is a lower bound on EROEI beyond
which these systems can't/won't be sustained anyway. It's not just that less energy is available
for non-energy production use but that there is an EROEI return below which you probably can't
operate the infrastructure necessary to mine/smelt materials for renewables on the scale being
contemplated here (total replacement of FF-burning infrastructure)
It's best to think of these as order-of-magnitude comparisons with each other. Local conditions
provide huge variability on energy generated by renewables. Likewise fossil fuel extraction.
I've invested in LED lighting for a long time. Output per unit increases by a rule-of-thumb
called Haitz's law, about a factor of 20 per decade. Many bulbs tout a lifetime of 20 years, but
haven't been around that long, so that's an extrapolation, and I have the dead bulbs to prove
the point. So when someone talks about LED efficiency, it's not a static number, but it's still
useful for discussion.
A factor that I believe is missing from EROI is cost of clean up or, lacking clean up,
the cost of consequences, which should be determined taking into account the negative effects
of our propensity for corruption, personal gain at the expense of the whole, (which is why nuclear
should have a stratosphericly high cost, for ex.).
For oil, coal and uranium, this is a high cost that should be subtracted from EROI.
For solar and wind, the cost is much less, except possibly in the manufacture of components that
convert sun/wind into electricity. Life span is supposed to be around 30 years so the clean up/consequence
cost of manufacture should be divided by that number.
"... In response to continued low oil prices, onshore crude oil production in the Lower 48 states is expected to decline from an average of 7.41 million barrels per day (b/d) in 2015 to 6.46 million b/d in 2016 and to 5.76 million b/d in 2017. ..."
"... EIA's April STEO forecasts Brent crude oil prices averaging $35/b in 2016 and $41/b in 2017, with the December 2017 price averaging $45/b. ..."
"... In contrast to the forecast of declining Lower 48 onshore production through 2017, federal Gulf of Mexico oil production is projected to increase from 1.54 million b/d in 2015 to 1.66 million b/d and to 1.82 million b/d in 2016 and 2017, respectively. Alaska's oil production is projected to slightly decrease from 0.48 million b/d in 2015 to 0.47 million b/d in 2016 and to 0.46 million b/d in 2017. ..."
"... Increased production from the federal Gulf of Mexico (GOM) is not enough to offset those declines, with total projected U.S. production falling from 9.43 million b/d in 2015 to 8.04 million b/d in 2017. ..."
"... Eyeballing the decline of Q1 2015, onshore : it appears to drop from about 7.5 to 5.0 in 1 year time (33%). That's an even higher decline rate than I expected. Looks like not only the production I'm tracking is declining at a rapid rate. ..."
"... In my view we will see actually a massive decline in wells due to plugging of wells. The latest RRC report for March 2016: http://www.rrc.state.tx.us/oil-gas/research-and-statistics/well-information/monthly-drilling-completion-and-plugging-summaries/ shows already a net decline of 1000 wells per month. So, a 33% decline of production is realistic and probably even too conservative. ..."
"... The plugged wells are stripper wells with output of 5 b/d or less. So if 1000 of these wells are plugged each month that's 5 kb/d lower output each month or a 60 kb/d total decrease over 12 months. Not really much of a factor. ..."
"... US production will be declining dramatically over the next months. Even the CEO of Pioneer and the IEA admit the decline. The only difference is that I think the decline will last much farther than Sep 2016 and will last well into 2017. ..."
"... The permits minus plugged is not really very useful. Oil wells completed relative to wells plugged is of greater interest. Every well completed (average of about 250 kb/d for first year) covers about 50 plugged stripper wells (with an average of under 5 b/d). So about 20 completed wells will make up for 1000 plugged wells. ..."
"... Using EIA data, TX decline rate is 9% from March to Jan 2015. Using Dean's data from March 2015 to Dec 2015 the decline is 6.1% (Jan was anomalous so I threw it out, if it is included the decline rate is 4.2%) ..."
"... As regards projections for the rest of this year and 2017, I agree that the EIA's price assumptions are too low. Higher prices may result in higher volumes. That said, I do not expect a quick rebound in drilling/completion activity as most shale companies are in a difficult financial situation and will not rush to increase capex. And even in the shale industry, with its short investment cycle, there is a time lag between a decision to increase capex and first production. ..."
"... The EIA's projections may be too low, but I still do not expect a quick rebound in the US C+C output. ..."
In response to continued low oil prices, onshore crude oil production in the Lower 48 states
is expected to decline from an average of 7.41 million barrels per day (b/d) in 2015 to 6.46 million
b/d in 2016 and to 5.76 million b/d in 2017.
The number of active onshore drilling rigs in the Lower 48 states fell 78% (from 1,876 to 412)
between the weeks ending on October 31, 2014, and April 15, 2016. The decline in active rigs and
well completions is projected to result in month-over-month onshore oil production declines of
120,000 b/d through September 2016.
EIA projects that the number of operating rigs in the Lower 48 states will continue to decrease
through mid-2016 before beginning to slowly increase. However, expected Lower 48 production will
continue to decline-although at a slowing rate-throughout 2017.
EIA's April STEO forecasts Brent crude oil prices averaging $35/b in 2016 and $41/b in 2017,
with the December 2017 price averaging $45/b.
In contrast to the forecast of declining Lower 48 onshore production through 2017, federal
Gulf of Mexico oil production is projected to increase from 1.54 million b/d in 2015 to 1.66 million
b/d and to 1.82 million b/d in 2016 and 2017, respectively. Alaska's oil production is projected
to slightly decrease from 0.48 million b/d in 2015 to 0.47 million b/d in 2016 and to 0.46 million
b/d in 2017.
Increased production from the federal Gulf of Mexico (GOM) is not enough to offset those declines,
with total projected U.S. production falling from 9.43 million b/d in 2015 to 8.04 million b/d
in 2017.
Eyeballing the decline of Q1 2015, onshore : it appears to drop from about 7.5 to 5.0 in 1
year time (33%). That's an even higher decline rate than I expected. Looks like not only the production
I'm tracking is declining at a rapid rate.
I'm curious to see if we indeed will see the projected pick up in rig count this summer already.
Your charts for the Bakken and some other sources show that LTO output drops by some 35% in
12 months if no new wells are completed.
Given that the EIA chart for Lower 48 onshore includes conventional production and still assumes
that new wells are drilled and completed, a 33% decline indeed looks too big.
Apparently, they assume continuing decline in conventional output, primarily due to shut-down
of the stripper wells. BTW, according to the EIA, between April 2015 and January 2016, US conventional
onshore production was down 300 kb/d (bigger in relative terms than the drop in LTO output).
In addition, the EIA's oil projections are too low, in my view. Therefore, they may assume
a small number of well completions
The plugged wells are stripper wells with output of 5 b/d or less.
So if 1000 of these wells are plugged each month that's 5 kb/d lower output each month or a 60
kb/d total decrease over 12 months. Not really much of a factor.
It is difficult for me to check how big these wells are. However, the main point here is about
a huge sea change (see below chart) in net wells. Add the dramatic decline in use of proppant,
the drop in rig counts (natural gas rigs are just at 88 versus 1600 in 2008)….. I can see the
writing on the wall.
US production will be declining dramatically over the next months. Even the CEO of Pioneer
and the IEA admit the decline. The only difference is that I think the decline will last much
farther than Sep 2016 and will last well into 2017.
Everyone agrees there will be some decline. Some estimates are more reasonable than others. So far decline in Texas has been relatively modest at an annual decline rate of 8%. There are still a lot of horizontal oil rigs operating in the Texas Permian Basin (over 100),
and the horizontal wells produce much more oil than the vertical wells in that Basin. I am talking about oil only here, I don't follow natural gas as closely, at some point gas
output will fall and natural gas prices will rise, no idea when that will happen though.
The permits minus plugged is not really very useful. Oil wells completed relative to wells
plugged is of greater interest. Every well completed (average of about 250 kb/d for first year)
covers about 50 plugged stripper wells (with an average of under 5 b/d). So about 20 completed
wells will make up for 1000 plugged wells.
The first 3 months of 2016 there were 2482 new drill oil completions in Texas and 1453 oil
wells plugged. The plugged wells are equivalent to taking away 29 of the new wells drilled, so
the net new wells would be 2453 new wells or about 818 new wells per month for the first 3 months
of the year. In March about 300 of these wells were in districts 1 and 2 (Eagle Ford most likely)
and about 450 wells in Districts 7C, 8 and 8A (Permian Basin).
There has continued to be quite a lot of activity in Texas at least through March 2016.
Are you accounting for possible incomplete data in Texas?
Are you seeing 33% decline rates outside of Texas?
I am talking at the field level, rather than individual wells or counties. So for the Niobrara,
or New Mexico Permian, the decline is certainly not 33% in the north Dakota Bakken, or not through
February at least. Based on Dean's data for Texas and even the EIA data for Texas, the statewide
decline rate is not anywhere close to 33% per year.
Using EIA data, TX decline rate is 9% from March to Jan 2015. Using Dean's data from March
2015 to Dec 2015 the decline is 6.1% (Jan was anomalous so I threw it out, if it is included the
decline rate is 4.2%)
Looking at the Bakken, the decline rate from June 2015 to July 2016 will be close to 20% per year
if the completed wells fall to 50 new wells per month on average for the rest of 2016, so decline
is pretty steep, just not 33%/year. After July 2016 if the completion rate levels off at about
40 completions per month the decline rate moderates to about 10% per year for July 2016 to July
2017.
I think the EIA is overestimating the decline because they are underestimating the oil price.
With the DUCs available, the decline for the rest of 2016 in the LTO plays could be as little
as 350 kb/d. The EIA is estimating almost a 1 Mb/d drop for the rest of 2016,
the conventional L48 onshore was about 3300 kb/d in Jan 2016, a 650 kb/d drop in output from L48
onshore conventional would be a 20% drop, if we assume an 8% drop, that would be about 270 kb/d,
for a total of 620 Kb. The EIA is also underestimating Texas output, if Dean's estimates are correct.
If we assume no acceleration in the decline rate for L48 onshore, we get the following, with 2017
output about 6200 kb/d for L48 onshore.
The EIA has a long record of underestimating US oil production, not only during the shale boom,
but also during the current downturn.
In particular, they have been underestimating volumes produced in Texas.
But I think that the most recent Dean's estimate for Texas may be too high.
TRRC is now receiving production data from operators in electronic form, which may have shortened
the reporting time. Hence, the underreported volumes for the most recent months are probably less
in relative terms than previously.
My conclusion is that historical numbers are somewhere in between Dean's and the EIA's estimates.
As regards projections for the rest of this year and 2017, I agree that the EIA's price assumptions
are too low. Higher prices may result in higher volumes.
That said, I do not expect a quick rebound in drilling/completion activity as most shale companies
are in a difficult financial situation and will not rush to increase capex. And even in the shale
industry, with its short investment cycle, there is a time lag between a decision to increase
capex and first production.
The EIA's projections may be too low, but I still do not expect a quick rebound in the US C+C
output.
AlexS. Although maybe not moving the needle much, I think US stripper well production may not
decline as much as it has recently because of:
A. If prices continue to stay above $40 WTI, wells shut in may be put back on production.
B. As winter is over, it is more likely that low volume wells will be returned to production.
Actually many times both A. & B. apply. We have some wells that must be shut in when the temperature
drops below a certain level. Shutting in requires some work, as does resumption of production.
When oil prices were high, we would only shut in during the cold weather. This past winter, we
just shut in at the first sign of cold weather, and did not start up until winter was over.
I do think, however, US conventional will continue to drop because there are very few vertical
oil rigs running, far lower than even in 1998-1999. Also, I do not think a price increase will
result in many conventional rigs coming back to the field this year. Balance sheets must be healed
first. Conventional producers do not have a shocking decline like the LTO companies, so skipping
another year of new wells is not as big of a problem.
"... "There can be no doubt, then, that by the end of this century, life as we know it on planet earth will be very different. Fossil fueled predatory capitalism will be dead. In its place, human civilization will have little choice but to rely on a diversity of clean, renewable energy sources." ..."
"... My quibble is that predatory capitalism will be dead. The Machiavellian ideology arrived prior to fossil fuels of any sort, and I think likely will be around quite a bit longer. ..."
"... Large top-down national and transnational structures will begin to become obsolete due to the large costs of maintenance, the unsustainability of the energy inputs needed for their survival, and the shift in power to new decentralized producers of energy and food. ..."
"... The end of cheap oil probably means end of neoliberalism. It is still unclear what will replace it as a dominant social system. ..."
This article seems to me to be an attempt at taking a long term look at a huge issue – humanities
future over the next 85-years or so. Given the available text space (no doubt many volumes could
cover a small fraction of the subject) Ahmed does a great job of summarizing and provides some
promising links to sources.
One quick quibble, Ahmed writes,
"There can be no doubt, then, that by the end of this century, life as we know it on
planet earth will be very different. Fossil fueled predatory capitalism will be dead. In its
place, human civilization will have little choice but to rely on a diversity of clean, renewable
energy sources."
Of course, I agree life will be different in 2100. I also agree that we are witnessing the
fossil fuel end game (as Amory Lovins at RMI would say), and certainty if one looks at current
rates of investment in various energy technologies, renewable sources are the future. My quibble
is that predatory capitalism will be dead. The Machiavellian ideology arrived prior to fossil
fuels of any sort, and I think likely will be around quite a bit longer.
Granted, Ahmed makes some caveats in the article about how difficult the next few decades will
be. He then writes,
" Large top-down national and transnational structures will begin to become obsolete
due to the large costs of maintenance, the unsustainability of the energy inputs needed for
their survival, and the shift in power to new decentralized producers of energy and food.
In the place of such top-down structures, smaller-scale, networked forms of political, social
and economic organization, connected through revolutionary information technologies, will be
most likely to succeed. For communities to not just survive, but thrive, they will need to
work together, sharing technology, expertise and knowledge on the basis of a new culture of
human parity and cooperation."
Imagine the Sanders campaign working on issues outside electoral politics, run by occupy wall
street organizers for example. I suspect there is some truth in Ahmed's speculations. Enough to
be hopeful about. It may just come down to a choice – despair in business as usual, or taking
a leap to hope, and work for, the success of some rational changes for the better.
likbez, April 23, 2016 at 3:51 pm
The end of cheap oil probably means end of neoliberalism. It is still unclear what will
replace it as a dominant social system.
"... My guess at this point is sometime between 2018 & 2020 we will begin to see substantial declines of 3% to 7% per year (slow at first, but increasing over time). The current investment in CapEx isn't sufficient to prevent much higher depletion rates. ..."
"The scenario I think most likely is and undulating plateau in C+C output to about 2021 and then
gradual decline of under 1.5% though about 2027 and by 2030 that declining output will cause an
economic crisis and a World recession."
I have serious doubts that infill drilling will hold
out anywhere near that long. if it wasn't for infill drilling scraping the bottom of depleted
fields, we would already be in a serious decline, even with the shale bubble. How long can infill
drilling last, I don't know, but its not-sustainable.
My guess at this point is sometime between 2018 & 2020 we will begin to see substantial declines
of 3% to 7% per year (slow at first, but increasing over time). The current investment in CapEx
isn't sufficient to prevent much higher depletion rates.
DC Wrote:
"By that time it will be clear that peak oil has been reached and perhaps policy measures will
be aggressively implemented to alleviate the problem."
It will be to late by then. Its already too late now. I expect when production problems develop.
the World gov't will turn to the same old tactics that make the problems worse: Price Controls,
Rationing, even more excessive gov't regulation, cronyism, and of course, more war.
DC wrote:
"An economic crisis (such as the 1930s in some parts of the World) can lead to positive social
changes, they can also be very negative."
I cannot recall a single period in history that an economic crisis lead to positive social
change. Its only after a wave of bloodshed and destruction that civilization makes a change. However,
never in history did the world experience a economic collapse rife with revolution/social change,
armed with nuclear weapons and nuclear power plants. Whatever remains of humanity in the aftermath,
will likely be another 1000 years of the dark ages (ie the fall of Rome)
Also consider in most cases it was war that made the economy better. Since the beginning of
the industrial revolution, war has create a rapid progress in technology. For instance, WW1 paved
the way for rapid use of machinery (farm tractors, trucks, cars, etc). The factories built to
make tanks, trucks, etc during the war, started mass producing consumer goods after the war, and
increase worker productivity. WW2 create the electronic revolution (computers, development of
broad antibiotics, new materials: Plastics, etc).
Unfortunately nuclear weapons rules out future tech revolutions since our weapons can now destroy
civilization and damage the global environment for hundreds to thousands of years. A nuclear war
will be over in a matter of a few days perhaps as long as few weeks, killing billions and there
will be no time to develop new technologies. Nuclear weapons are the Apex of war developed tech.
We've become the Suicide race.
DC Wrote:
"Hopefully we will not forget our history."
We already did! See the rise of socialism in the West as a prime example. The lessons of war and
politcican follies are lost after the last generation that suffered the horrors dies off. The
WW 2 generation is nearly gone, Thus ushering in a new wave of folly.
"The rig count has increased by 50 since oil prices started to fall in mid-2014 and has almost
doubled over the last five years"
"As a result, the Arabian peninsula now accounts for nearly 30 percent of all active rigs outside
North America, up from less than 18 percent when the slump began"
Does this not sound exactly like the red queen situation? I think it completely supports Ron's
contention that they are producing flat out - and having trouble keeping their current production
level up.
"... A study by Wood Mackenzie (chart = h/t @WoodMacKenzie ) highlights that the trend of lower investment is set to persist. Their study projects $91 billion in capex cuts across 121 upstream companies this year: ..."
"... EIA has analyzed the annual reports of 40 publicly-traded U.S. oil producers, highlighting the significant differences in their financial situations. The group as a whole saw combined losses of $67 billion last year, although these losses varied wildly from company to company. ..."
IEA's chief Fatih Birol has chimed in on the topic today, highlighting low oil
prices have
cut investment
by about 40 percent over the past two years, and how the sharpest falls
have been in the U.S., Canada, Latin America and Russia.
4) A study by
Wood Mackenzie (chart = h/t @WoodMacKenzie)
highlights that the trend of lower investment is set to persist. Their study
projects $91 billion in capex cuts across 121 upstream companies this year:
... ... ...
6) Finally, the EIA has analyzed the annual reports of 40 publicly-traded U.S. oil producers,
highlighting the significant differences in their financial situations. The
group as a whole saw combined losses of $67 billion last year, although these
losses varied wildly from company to company.
Eighteen of the forty companies experienced losses in 2015 in excess of 100
percent of their equity (termed as high loss companies – HGLs). The driving
force behind the HLG's deteriorating financial conditions was leverage; their
long-term debt-to-shareholder equity ratio averaged 99 percent, compared to
the non-HLGs whose debt was at much-lesser level of 58 percent of shareholder
equity.
Not only were the HLGs the most leveraged, but their assets were revised
down the most too. Last year the 18 HLGs saw a 21 percent reduction in proved
oil reserves, while the non-HLG group saw a drop of just 6 percent. The lower
reserves for the HLG group caused impairment charges, decreasing the value of
their assets. This lower asset value is ultimately reflected in lower credit
availability to these companies.
"... non-OPEC production would fall this year by the most in a generation. ..."
"... IEA chief Fatih Birol said low oil prices had cut investment about 40 percent over the past two years, with sharp falls in the United States, Canada, Latin America and Russia. ..."
Oil rose in early trade after the International Energy Agency (IEA) said
non-OPEC production would fall this year by the most in a generation.
IEA chief Fatih Birol said low oil prices had cut investment about 40
percent over the past two years, with sharp falls in the United States,
Canada, Latin America and Russia.
This is a typical Council of Foreign Relations propaganda. Omissions (Yemen
problem, oil price problems for the US shale industry were not even mentioned),
foreign policy recommendations has definite neocon
focus... As
Daniel Larison aptly said on April 21, 2016, 3:16 PM "Keeping
the Saudis happy isn't worth the price of enabling war crimes and implicating
the U.S. in the senseless devastation and starvation of an entire country
(Yemen)." Compare with "the lowbrow whores at the Brookings Institute are always
willing to take Gulf money" -
Mr. Obama goes to Riyadh: Why the United States and Saudi Arabia still need each
other
The Saudis are the major money behind the war on Syria. They are building
ISIS and Al-Qaeda not only in Syria but also
in Yemen and elsewhere. A former Saudi foreign minister, quoted in
in
yesterdays Financial Times (see
here), admitted this fact: "Saud al-Feisal, the respected Saudi foreign
minister, remonstrated with John Kerry, U.S. secretary of state, that "Daesh
[ISIS] is our [Sunni] response to your support for the Da'wa" - the Tehran
aligned Shia Islamist ruling party of Iraq." See also
America's War for the Greater Middle East A Military History Andrew J. Bacevich
Notable quotes:
"... The Saudis would like a commitment from Obama to defang Iran, change the balance of power in the Syrian civil war to the detriment of Bashar Assad and resolve the Israeli-Palestinian conflict. ..."
"... Beyond that, Obama comes armed with no real new U.S. Middle East policy, apart from the latest developments in the Iran nuclear deal-which is not anything the Tehran-phobic Saudis want to talk about. ..."
"... America has no desire for nation-building even among nations it helped to destroy such as Iraq and Libya. ..."
"... As far as containing Iran, while America may not go as far as resuming ties with Iran as the Gulf regimes fear, it is not beyond reaching tactical accommodations with Tehran in places such as Iraq and on issues such as dealing with the Islamic State. ..."
"... Ray Takeyh is a Senior Fellow at the Council on Foreign Relations and the co-author of The Pragmatic Superpower: Winning the Cold War in the Middle East. ..."
Barack Obama traveled to Saudi Arabia on Tuesday in what could be his
last-and likely most futile-visit as president. It's not just that there's
bad blood over Congress' effort to make Riyadh liable for lawsuits from the
families of 9/11 victims. These days, when the United States and Saudi
Arabia look at the region, they see two completely different landscapes and
conflicting sets of interests. Riyadh sees a series of conflicts that the
United States must resolve and a series of failing states that it must
rehabilitate. The Saudis would like a commitment from Obama to defang
Iran, change the balance of power in the Syrian civil war to the detriment
of Bashar Assad and resolve the Israeli-Palestinian conflict.
... ... ...
Beyond that, Obama comes armed with no real new U.S. Middle East
policy, apart from the latest developments in the Iran nuclear deal-which is
not anything the Tehran-phobic Saudis want to talk about. Obama, who
recently expressed his pique over U.S. allies he called "free riders,"
plainly is not eager to get any more embroiled in the region than he already
is; he has expressed a vague desire that Iran and Saudi Arabia should "share
the neighborhood" without saying how he hopes that will be accomplished. And
after much investment, the administration seems disinclined to resume its
peacemaking efforts between Israel and the Palestinian entity. America
has no desire for nation-building even among nations it helped to destroy
such as Iraq and Libya.
As far as containing Iran, while America may not go as far as
resuming ties with Iran as the Gulf regimes fear, it is not beyond reaching
tactical accommodations with Tehran in places such as Iraq and on issues
such as dealing with the Islamic State. For the Obama administration,
its nuclear agreement with Iran is truly a landmark achievement, testifying
to benefits of reaching out to an ideologically implacable adversary. It is
perhaps the first time that America does not seem to object to the Islamic
Republic's aggrandizement in the strategically vital Persian Gulf.
... ... ...
The Saudis see in the latest congressional effort to grant the families
of 9/11 victims the opportunity to sue the kingdom as another indication
that Washington no longer values the alliance (despite a veto threat from
the White House). By threatening to withdraw their assets from the United
States in retaliation they are sending their own message that they will be
prone to act in a manner that shows as little disregard for the alliance as
that they feel America is demonstrating.
Ray Takeyh is a Senior Fellow at the Council on Foreign Relations and
the co-author of The Pragmatic Superpower: Winning the Cold War in the
Middle East.
"... With respect to the longer term, however, capital expenditure cuts are slowly becoming visible. Non-OPEC supply growth (year-over-year) stood at 2.9 million barrels per day at the end of 2014. Supply did not grow in December and January and preliminary data indicate large year-on-year declines in February and March 2016. Low oil prices curbed capital spending worldwide by an estimated 24 percent last year and could trim another 20 percent from capex this year. ..."
Giovanni Staunovo, commodities analyst at UBS Wealth Management
Oil prices are under pressure following the failure of OPEC and major
non-OPEC producers to agree on a production freeze at Sunday's meeting in
Doha.
We expect Brent crude prices to drop toward $30 a barrel during the
current quarter but recover to $55 a barrel in 12 months as the oversupply
of oil dissipates towards the end of this year.
... ... ...
With respect to the longer term, however, capital expenditure cuts
are slowly becoming visible. Non-OPEC supply growth (year-over-year) stood
at 2.9 million barrels per day at the end of 2014. Supply did not grow in
December and January and preliminary data indicate large year-on-year
declines in February and March 2016. Low oil prices curbed capital spending
worldwide by an estimated 24 percent last year and could trim another 20
percent from capex this year.
Incredible joy in Western MSM due to the fact that OPEC did not agree to freeze oil prices, with
KAS playing the role of a spoiler. And here is GS with its "talking your own book" forecasts...
Notable quotes:
"... Goldman said on Monday that it was maintaining its fourth-quarter 2016 forecast of $45 a barrel for WTI crude and said that its full-year 2017 average WTi forecast was $58 a barrel ..."
Global oil prices and stock markets tumbled on Monday after major oil producers failed to agree
on a deal to freeze output, but analysts are insisting that no deal is actually the best possible
outcome for markets.
... ... ...
Despite the collapse of talks, oil market watchers said the lack of a "Doha deal" would be better
in the long term and would mean that a rebalancing process of supply and demand can continue to its
natural conclusion.
... ... ...
Goldman said on Monday that it was maintaining its fourth-quarter 2016 forecast of $45 a barrel
for WTI crude and said that its full-year 2017 average WTi forecast was $58 a barrel, Reuters
reported. In the short-term it said its forecast for $35 a barrel for WTI in the second quarter was
now "more likely" following the decision not to freeze production.
The founder and CEO of
Continental Resources, who previously told CNBC that "the fundamentals of
supply and demand were really close," reiterated during a
"Power Lunch"
interview on Monday that this year's third-quarter will absorb most of the excess
oil supply, which in turn will lead to "stronger pricing."
The billionaire
suggested that oil is past an inflection point and prices have surged 50 percent
from previous lows. Hamm foresees crude prices soaring to $60 a barrel by the
end of the year, as lower oil prices are unsustainable. He contends, however,
that even when the oil "overhang goes away," ramping up production will take
U.S. producers a long time, as rig counts are at an all-time low.
He added that U.S. rig counts "are down 77 percent."
...Hamm
argued that oil producers in the Middle East are "pretty much tapped out."
"... Emerging market economies will increase global oil demand about 1.4 percent a year through 2020, stronger than the past decade, Bernstein analysts said in a research note e-mailed today. ..."
"... The world is well supplied with oil, which will keep the average price between $60 and $70 a barrel through the end of the decade, Bernstein said ..."
"... Emerging economies will spur global oil demand growth from 94.6 million barrels a day last year to 100 million by 2020 and 108 million between 2030 and 2035. In developed countries, crude demand is beginning to shrink amid improvements in energy efficiency and as consumers switch to alternative fuels, outweighing expanding populations and economic growth. ..."
Emerging market economies will increase global oil demand about 1.4 percent
a year through 2020, stronger than the past decade, Bernstein analysts said
in a research note e-mailed today. Demand will peak between 2030 and 2035, creating
a window for one final spike in prices before the fossil fuel begins its inexorable
slide to irrelevance amid greater fuel efficiency and more electric vehicles.
"We still believe that there could be one more super-cycle in oil before
demand peaks in 2030-35," Bernstein said in its note. "Assuming tight oil peaks
out before demand does, it could result in another period of supply tightness
as OPEC becomes a dominant force in supply, just as it did in the 1970s."
The world is well supplied with oil, which will keep the average price between
$60 and $70 a barrel through the end of the decade, Bernstein said. The relatively
low prices will lead to more use, with demand growth from 2016-2020 expected
to be the highest since 2001-2005.
Emerging economies will spur global oil demand growth from 94.6 million barrels
a day last year to 100 million by 2020 and 108 million between 2030 and 2035.
In developed countries, crude demand is beginning to shrink amid improvements
in energy efficiency and as consumers switch to alternative fuels, outweighing
expanding populations and economic growth.
If U.S. shale oil production peaks before demand does, the world will have
to go back to higher cost oil production, such as deepwater and Canadian oil
sands, necessitating higher prices to justify investment. In previous super-cycles
in the 1970s and 2000s, inflation-adjusted oil prices rose about tenfold, Bernstein
said.
In the long run, oil demand will peter out to about 20 million barrels a
day by 2100 as the world becomes more energy efficient and switches to lower-carbon
energy sources. As that happens, the intensity of oil decreases and economic
growth no longer creates crude demand growth.
"... The severance and extraction tax takes 10% off the top. So call it $20. Then look at company 10K for LOE, gathering and transportation, G & A. Also, look at the interest expense. Keep in mind those figures are in BOE. ..."
"... Bakken well produces 3,000 barrel of oil and 3,000 mcf of gas. Assume 20% royalty (in TX I'd say assume 25% royalty). Net is 2,400 barrel of oil and 2,400 mcf of gas. Divide the gas production by six and we get 2,800 BOE. Assume $22 oil price and $1.50 gas price at the well. So we sold $52,800 of oil and $3,600 of gas. So if my math is correct, the $ realized per BOE is $20.14. 10%, or $2.01 comes off the sales, in state severance and extraction taxes, so now down to $18.13. Then subtract the rest. There couldn't have been much, if any cash flow for CAPEX. I will say the larger companies likely received closer to $25-26 per barrel of oil in Q1. ..."
"... Hedging will make a tremendous difference in Q1 2016. ..."
"... http://www.theoildrum.com/node/9821 A good discussion from yesteryear worth reviewing. 10,898 wells at 6 million each is a major investment. The more than 64 billion dollar gamble. No different than launching a satellite into space, flying it by wire to Mars then it crashes into the Martian surface because you forgot to change from miles to kilometers. Everybody makes mistakes. ..."
Of course, if you have any skin in the game, the most important statistic
in the post is that the average posted price for oil in the Williston Basin
for the last three months is $22.
The severance and extraction tax takes 10% off the top. So call it
$20. Then look at company 10K for LOE, gathering and transportation, G &
A. Also, look at the interest expense. Keep in mind those figures are in
BOE.
A typical Bakken producer had $8 LOE, $3 of G & A, $2 of gathering and
transport and $5 of interest expense, all on a BOE basis.
I have looked at the earnings forecasts for Q1, WOW!! Reno Hightower
,
04/16/2016 at 9:30 am
So with a 20% royalty (I have no idea what their nets are) they are
getting back $16 before you take out the $8 LOE, $3 G&A, $2 gathering
and $5 interest for a loss of $2 per barrel produced. All before you
factor in the Drilling and Completion and acreage costs.
Reno. US companies report BOE produced after payment of royalties.
Example:
Bakken well produces 3,000 barrel of oil and 3,000 mcf of gas. Assume
20% royalty (in TX I'd say assume 25% royalty). Net is 2,400 barrel of oil
and 2,400 mcf of gas. Divide the gas production by six and we get 2,800
BOE. Assume $22 oil price and $1.50 gas price at the well. So we sold $52,800
of oil and $3,600 of gas. So if my math is correct, the $ realized per BOE
is $20.14. 10%, or $2.01 comes off the sales, in state severance and extraction
taxes, so now down to $18.13. Then subtract the rest. There couldn't have
been much, if any cash flow for CAPEX. I will say the larger companies likely
received closer to $25-26 per barrel of oil in Q1.
http://www.theoildrum.com/node/9821
A good discussion from yesteryear worth reviewing. 10,898 wells at 6 million
each is a major investment. The more than 64 billion dollar gamble. No different
than launching a satellite into space, flying it by wire to Mars then it
crashes into the Martian surface because you forgot to change from miles
to kilometers. Everybody makes mistakes.
It forecasts that "After a brief retrenchment due to low prices and falling
investment, US tight oil production is now expected to plateau in the 2030s
at nearly 8 Mb/d, accounting for almost 40% of total US oil production."
US shale gas is expected to grow by around 4% p.a. over the Outlook.
This causes US shale gas to account for around three-quarters of total US
gas production in 2035 and almost 20% of global output.
An alternative scenario implies that tight oil and shale gas have even
greater potential.
"North American tight oil output increases to 16 Mb/d by 2035, nearly twice
its level in the base case, with its share of global liquids output reaching
14%. "
North American shale gas production is around 72 Bcf/d higher by 2035,
with North American shale gas accounting for almost a third of global gas
supplies in the 'stronger shale' case.
----------–
What do they know about shale oil and gas that we don't know?
And what has changed since BP's last year's forecast?
Base case U.S. tight oil forecast vs. previous years' projections
"... Minsky famously quipped that everyone can create new money; the problem is to get it accepted as such by others. ..."
"... But even money-proper is not the same for everyone. Central banks create the money in which banks pay each other, while private banks create money for households and firms. Money is hierarchical , and moneyness is a question of immediate convertibility without loss of value (at par exchange, on demand). ..."
"... To convert shadow money into settlement money in case of default, repo lenders sell collateral. An intricate collateral valuation regime, consisting of haircuts, mark-to-market, and margin calls, maintains collateral's exchange rate into (central) bank money. ..."
"... What makes repos money – at par exchange between "cash" and collateral – is what makes finance more fragile in a Minskyan sense. ..."
"... Liquid markets become more fragile, he argued, by giving investors the "illusion" that they can exit before prices turn against them. This is a crucial insight for crises of shadow money. ..."
"... Criminality and corruption is embedded at the top of the financial food chain, by law. ..."
"... Motion seconded: Government sanctioned counterfeiting. ..."
"... …and does anyone remember the triumph of the desk slaves of the Crimson Permanent Assurance? Monty Python understood something about political economies and how one might achieve more fairness in outcomes… https://vimeo.com/111458975 ..."
"... Shadow money sounds to me like fictional capital by another name. And contractual based deposits sounds like counterfeiting. With the distinction that the man with counterfeit printing press robs the train, while the man who runs the Wall St Investment bank repo trading desk robs the whole railroad. ..."
"... Therefore, Money becomes a victim of the ontological argument for God by St Anselm. If God does not exist, an all powerful, all knowing, all present infinitely great in all categories of Supreme Being could not be written or spoken about, lacking the quality of existence. The fact that we CAN speak about an Omnipotent Supreme Deity means that one in fact exists, due to existence is part and parcel of Omnipotence. But of course, because we can talk or write about something, does not make it real. ..."
"... It can become socially acceptable as in the case of shadow money, but it is fictional capital, a shadow of the real thing. Time to get out of the cave of finance with its shadows dancing from the light of the fires and walk eyes wide open in the bright light of sunshine! ..."
"... Money is actually the easiest thing to write about, because it's formless energy. It's not that the phenomenon is shadow money, it's shadow assets. ..."
"... You have to be able to separate in your mind the ideas of 1) Quantity and 2) Form. That's why economics is a mental disorder, because it doesn't separate quantity and form. If you can't or don't, then yes, it's diabolically hard to write about because you're writing about two different things simultaneously without realizing it. Money is a quantity that is infinite and continuous, but form is an idea that is discontinuous and finite. People do what the forms tell them to do. The money is just like electricity that powers the animation of the forms. Repo is a form it's not money. It's existence results in a certain ordering of social relations, that's also a form. But money is just the energy that makes the forms potent. ..."
"... I guess that's why they used to call it "political economy" before the mental disorder fully usurped the power of perception and reasoning. ..."
"... Marx failed to acknowledge that supposedly hard-headed Capitalism is actually all about living beyond your means and mortgaging the future. ..."
"... It was designed from the Fuggars' and the Medici's to be about debt and fractional reserves and interest. A system based on a finite supply of money is going to grow not much faster, at best, than the money available allows. ..."
"... Capitalism allows explosive growth by supplying explosive amounts of credit. All this shadow banking activity is designed to get around reserve requirements; nothing else I can see calls all this complexity into existence. The banks always need more, because lending is how they make their money, so they want an infinite amount to lend in order to drive their profits towards the infinite. ..."
"... This article I think defines shadow money alright as starting where bank deposits leave off but as the above comments suggest seems to miss some key points. I think a major problem with the article is seeing central banks as separate from the state rather than seeing the central bank along with the Treasury as the state itself. ..."
"... The article gets Treasury debt wrong by seeing it as the central bank funding the state rather than as actually coming from the state. This leads to wrong policy choices such as this state money being used to bail out useless financial transactions and asset appreciation rather than the public purpose. I think crazyman has it right. We left behind the power of perception and reasoning by not realizing the importance of political economy . ..."
"... This is reminscent of Gramsci's idea that the state and civil society are to be distinguished only for purposes of exposition. ..."
By Daniela Gabor, associate professor in economics at the University of the West of England,
Bristol, and Jakob Vestergaard, senior researcher at the Danish Institute for International Studies.
Originally published at the Institute for New Economic Thinking
website
Struggles over shadow money today echo 19th century struggles over bank deposits.
Money, James Buchan once
noted , "is diabolically hard to write about." It has been described as a promise to pay, a social
relation,
frozen
desire , memory, and fiction. Less daunted, Hyman Minsky was interested by promises of unknown
and changing
properties
. "Shadow" promises would have
fascinated him. Indeed, Perry Mehrling, Zoltan
Pozsar , and
others argue that in shadow banking, money begins where bank deposits end. Their insights are
the starting point for the first paper of our Institute for New Economic Thinking
project on shadow money. The footprint of shadow money, we argue,* extends well beyond opaque
shadow banking, reaching into government bond markets and regulated banks. It radically changes central
banking and the state's relationship to money-issuing institutions.
Minsky famously quipped that everyone can create new money; the problem is to get it accepted
as such by others.
General acceptability relies on the strength of promises to exchange for proper money, money
that settles debts. Banks' special role in money creation, Victoria Chick
reminds us, was sealed
by states' commitment that bank deposits would convert into state money (cash) at par. This social
contract of convertibility materialized in bank regulation, lender of last resort, and deposit guarantees.
But even money-proper is not the same for everyone. Central banks create the money in which
banks pay each other, while private banks create money for households and firms. Money is
hierarchical , and moneyness is a question of immediate convertibility without loss of value
(at par exchange, on demand).
Using a money hierarchy lens, we define shadow money as repurchase agreements (repos), promises
to pay backed by tradable collateral. It is the presence of collateral that confers shadow money
its distinctiveness. Our approach advances the debate in several ways.
First, it allows us to establish a clear picture of modern money hierarchies. Repos are nearest
to money-proper, stronger in their moneyness claims than other short-term shadow
liabilities . Repos rose in money hierarchies as finance sidestepped the state, developing its
own convertibility rules over the past 20 years. To convert shadow money into settlement money
in case of default, repo lenders sell collateral. An intricate collateral valuation regime, consisting
of haircuts, mark-to-market, and margin calls, maintains collateral's exchange rate into (central)
bank money.
Second, we put banks at the center of shadow-money creation. The growing shadow-money literature,
however original in its insights, downplays banks' activities in the shadows because its empirical
terrain is U.S. shadow banking with its institutional peculiarities. There, hedge funds issue shadow
money to institutional cash pools via the balance sheet of securities dealers. In
Europe or
China , it's also banks issuing shadow money to other banks to fund capital market activities.
LCH Clearnet SA, a pure shadow bank, offers a glimpse into this world. Like a bank, it backs money
issuance with central bank (Banque de France) money. Unlike a bank, LCH Clearnet only issues shadow
money.
Third, we explore the critical role of the state beyond simple guarantor of convertibility. Like
bank money, shadow money relies on sovereign structures of authority and credit worthiness. Shadow
money is mostly issued against government bond collateral, because liquid securities make repo convertibility
easier and cheaper. The legal right to re-use (re-hypothecate) collateral allows various (shadow)
banks to issue shadow money against the same government bond, which becomes akin to a
base asset with "velocity." Limits to velocity place demands on the state to issue debt, not
because it needs cash but because shadow money issuers need collateral.
With finance ministries unresponsive to such demands, we note two points in the historical development
of shadow money in the early 2000s. In the United States, persuasive lobbying exploited concerns
that U.S. Treasury debt would fall to dangerously
low levels
to relax regulation on repos collateralized with asset and mortgage-backed
securities
. In Europe, the ECB used the mechanics of monetary policy implementation to the same end. When
it lent reserves to banks via repos, the ECB used its collateral valuation practices to generate
base-asset privileges for "periphery" government bonds, treating these as
perfect substitutes for German
government bonds, with the
explicit
intention of powering market liquidity.
Fourth, we introduce fundamental uncertainty in modern money creation. What makes repos money
– at par exchange between "cash" and collateral – is what makes finance more fragile in a
Minskyan sense. Knightian uncertainty bites harder and faster because convertibility depends
on collateral-market liquidity.
The collateral valuation regime that makes repos increasingly acceptable ties securities-market
liquidity into appetite for leverage. Here, Keynes' concerns with the social benefits of private
liquidity become relevant. Keynes voiced strong doubts about the idea of "the more liquidity the
better" in stock markets (concerns now routinely
voiced by central banks for securities markets). Liquid markets become more fragile, he argued,
by giving investors the "illusion" that they can exit before prices turn against them. This is a
crucial insight for crises of shadow money.
A promise backed by tradable collateral remains acceptable as long as lenders trust that collateral
can be converted into settlement money at the agreed exchange rate. The need for liquidity may become
systemic once collateral falls in market value, as repo issuers must provide additional collateral
or cash to maintain at par. If forced to sell assets, collateral prices sink lower, creating a liquidity
spiral
. Converting shadow money is akin to climbing a ladder that is gradually sinking: The faster
one climbs, the more it sinks.
Note that sovereign collateral does not always stop the sinking, outside the liquid world of U.S.
Treasuries. Rather, states can be dragged down with their shadow-money issuing institutions. As Bank
of England
showed , when LCH Clearnet tightened the terms on which it would hold shadow money backed with
Irish and Portuguese sovereign collateral, it made the sovereign debt crisis worse. Europe had its
crisis
of shadow money, less visible than the Lehman Brothers demise, but no less painful. "Whatever
it takes" was a
promise
to save the "shadow" euro with a credible commitment to support sovereign collateral values.
Shadow money also constrains the macroeconomic policy options available to the state. That's because
what makes shadow liabilities money also greatly complicates its stabilization: it requires a radical
re-think of many powerful ideas about money and central banking. The first point, persuasively made
by Perry
Mehrling , and more recently by
Bank of England , is that central banks need a (well-designed) framework to backstop markets
, not only institutions . Collateralized debt relationships can withstand a systemic need
for liquidity if holders of shadow money are confident that collateral values will not drop sharply,
forcing margin calls and fire sales. Yet such overt interventions raise
serious moral hazard issues.
Less well understood is that central banks need to rethink lender of last resort. Their collateral
framework can perversely destabilize shadow money. Central banks cannot mitigate convertibility
risk for shadow money
when they use the same fragile convertibility practices. Rather, central banks should lend unsecured
or
without seeking to preserve collateral parity.
We suggest that the state, as base-asset issuer, becomes a de facto shadow central bank.
Its fiscal policy stance and debt management matter for the pace of (shadow) credit expansion and
for financial stability. Yet, unlike the central bank, the state has no means to stabilize shadow
money or protect itself from its fragility. It has to rely on its central bank, caught in turn between
independence and shadow money (in)stability, which may require direct interventions in government
bond markets.
The bigger task that follows from our analysis, is to define the social contract between the three
key institutions involved in shadow money: the state as base collateral issuer, the central bank,
and private finance. In the new
FSB
or Basel III provisions, we
are witnessing a struggle over shadow money with many echoes from the long struggle over bank money.
The more radical options, such as disentangling sovereign collateral from shadow money, were never
contemplated in regulatory circles. Even a partial disentanglement has proven
difficult
because states depend on repo markets to support
liquidity in government bond markets. Our next step, then, will be to map how the crisis has
altered the contours of the state's relation to the shadow money supply, comparing the cases of the
U.S., the Eurozone, and China.
Financial anarchy is my interpretation of shadow banking.
. . . The legal right to re-use (re-hypothecate) collateral allows various (shadow) banks
to issue shadow money against the same government bond , which becomes akin to a base asset
with "velocity." Limits to velocity place demands on the state to issue debt, not because it
needs cash but because shadow money issuers need collateral .
---- The bigger task that follows from our analysis, is to define the social contract between the
three key institutions involved in shadow money: the state as base collateral issuer, the central
bank, and private finance .
Who does shadow banking serve? It is so far from capitalism, it should be illegal.
Bernie Sanders: The business of Wall Street is fraud and greed.
Well…yes and no. There is real "need" for some shadow banking services. However, the idea of
having Central Banks (issuers of money, or whatever) loaning based on … nothing?
Less well understood is that central banks need to rethink lender of last resort. Their
collateral framework can perversely destabilize shadow money. Central banks cannot mitigate
convertibility risk for shadow money when they use the same fragile convertibility practices.
Rather, central banks should lend unsecured or without seeking to preserve collateral parity.
"Europe had its crisis of shadow money, less visible than the Lehman Brothers demise, but
no less painful. "Whatever it takes" was a promise to save the "shadow" euro with a credible
commitment to support sovereign collateral values."
Yes, but Lehman was not a taxing authority (although to be fair, Ireland et.al. were not money-issuing
sources).
I am having a hard time understanding all of this–but as far as I can tell, the authors are
basically suggesting that sovereign governments should be backing up the shadow banking system.
However, I have not seen them suggest any reason for it except that the entire house of cards
could come falling down. Boo hoo for the banksters–tell them to do things out of the "shadows".
Why is there a need for 'shadow money' in the first place?
Afaik, banks create money when they loan and central banks(especially the Fed) issues the most
secure assets, their securities, which are used as collateral.
Thanks Yves for sharing Gabor…what a Mess! towards the end of 2012 the US shadow banking was
said to be around
67 Trillion …did something get baked-in? 2014 the IMF has a much smaller 'account'…(Japan
being the worst laughing stock). the gaps are no small detail:
The IMF's latest Global Financial Stability Report analyzes the growth in shadow banking in
recent years in both advanced and emerging market economies and the risks involved.
According to the report, shadow banking amounts to between 15 and 25 trillion dollars in the
United States, between 13.5 and 22.5 trillion in the euro area, and between 2.5 and 6 trillion
in Japan-depending on the measure- and around 7 trillion in emerging markets. In emerging markets,
its growth is outpacing that of the traditional banking system.
https://www.imf.org/external/pubs/ft/survey/so/2014/pol100114a.htm
That sure seems a Rx for destabilizing the world currencies to precipitate a collapse. Track
and publicize the visits of Congressmen and Senators to the BIS and COL to start. Why are they
making these visits under cover? Who are they meeting with? Are they being prepared as to what
to expect a deliberate world currency crash? . Our political elite are so beholden to the bankers
to allow for the theft of the wealth of nations for unattainable expanding growth and skimming
of millions. Is it possible in regard the corporate banks to have the strings attached on the
use of shadow money at time of chartering or in the case of the do over at time of bankruptcy?.
How is this done? I'd also like to know a good proposal for the private investment boutique banks.
Have any bills at state and federal levels been proposed and if not, why not? What would the main
sections of such a bill look like. Thanks.
A derivative promise made by a Wall Street prostitute, ultimately contingent upon the ability
to liquidate the very users of the instrument, with currency debasement, and war to restock.
Paying people to buy stuff from others being paid to buy stuff, with the full faith and credit
of dependent seniors in a collapsing actuarial ponzi, with nothing more than made for TV mercenaries,
isn't likely to end well.
Craps, the bank moves to the next suckers, with nothing more than the promise of an exotic
vacation, billed to someone else.
– Limits to velocity place demands on the state to issue debt, not because it needs cash but
because shadow money issuers need collateral.
There's a dirty linchpin. Even if the diabolical multiplier from cnchal's quote were removed,
and the dollar was hard-pinned to a pound of silver to pay the sheriff with, infinite debt issuance
can step in to the feed the hungry beast.
Promises to pay kept mercenaries in line during the city-states. If you didn't win you didn't
get paid. Unless you turned around and took your employers gold instead. Which is a bit like capturing
the central banks.
Still, debt can be put to good uses. Infrastructure, maybe. Basic necessities and health. 'When
the people are strong, the nation is strong.' Instead, the gearing seem like the machine in Princess
Bride, sucking time from peoples lives.
Ask any highway patrolman, the faster the speed limit, the worse the accidents.
On the famed autobahns of Europe, the no speed limit means that when an accident occurs, the
results are likely to be catastrophic.
And I really love the observation that central banks need a mechanism to backstop the market.
Reminds me of the main problem with the famous Vincent Black Shadow motorcycle, it could attain
speeds close to 200 mph, but brake designs at the time didn't work at those speeds, so as Hunter
S. Thompson remarked;
"If you rode the Black Shadow at top speed for any length of time, you would almost certainly
die."
Wall $treet wants to go fast, the faster the better, but they haven't got any brakes, and worse
than that, we're all along for the ride whether we like it or not.
Oh, says Red Molly to James, "That's a fine motorbike
A girl could feel special on any such like"
Says James to Red Molly, "My hat's off to you
It's a Vincent Black Lightning, 1952"
[James gets shot in a robbery]
When she came to the hospital, there wasn't much left
He was running out of road, he was running out of breath
But he smiled to see her cry
And said I'll give you my Vincent to ride
Oh, he reached for her hand then he slipped her the keys
He said, "I've got no further use for these
I see angels on Ariels, in leather and chrome
Swooping down from heaven to carry me home"
And he gave her one last kiss and died
And he gave her his Vincent to ride
It was sorta like that when Bernanke handed J-Yel the keys to his QE penny farthing bike.
The Bernanke and J-Yel witnessed the header that Greenspan took on that bike, and decided to
leave it standing against the wall. When you consider the fact that neither of them could reach
the pedals, let alone mount the thing and ride, that was probably a good idea.
When did the central banks' framework to backstop markets morph into an organized effort to
push the value of repo collateral relentlessly upward forever?…
What about increasing the relentless decline in the Velocity of Money by gradually increasing
interest rates? Yes, that might be a catalyst to trigger a "liquidity spiral". So what? We now
have moral hazard in spades and at some point will have to cross the Rubicon, whether willingly
or not.
i am reading one of the
links from the post titled "Regulating money creation after the crisis", and it's even worse
than government approved fraud. I am only part way through it, but here is a gem.
On page 10
. . . Instead, OLA was designed to preserve the value of the assets of failed financial
firms until they are liquidated, a worthy aim, but a very different one. At the same time,
the Dodd-Frank Act has imposed significant new limitations on the government's freestanding
panic-fighting tools . These limitations, absent future congressional action, would render
next to impossible the kind of aggressive government rescue operation that was staged
during the recent crisis.
Criminality and corruption is embedded at the top of the financial food chain, by law.
Before we complicate the issue, it is fairly obvious no one understands conventional money
and it is one of the best kept secrets on the planet.
Learn how normal money works and how its mismanagement has led to many of today's problems.
Banks create money out of nothing to allow you to buy things with loans and mortgages (fractional
reserve banking).
After years of lobbying the reserve required is often as good as nothing. Mortgages can be
obtained with the reserve contained in the fee.
After the financial crisis there were found to be £1.25 in reserves for every £100 issued on
credit in the UK.
Having no reserve shouldn't be a problem with prudent lending.
Creating money out of nothing is the service they really provide to let you spend your own
future income now.
They charge interest to cover their costs, for the risk involved and the service they provide.
Your repayments in the future, pay back the money they created out of nothing.
The asset bought covers them if you default, they will repossess it and sell it to recover
the rest of the debt unpaid.
At the end all is back to square one.
The bank has received the interest for its service.
You have paid for the asset you have bought plus the interest to the bank for its service of
letting you use your own money from the future.
Today's massive debt load is all money borrowed from the future for things already bought.
It can also go wrong another way, when banks lend into asset bubbles that collapse very quickly.
The repossessed asset doesn't cover the outstanding debt and money gets destroyed on the banks
balance sheets.
When banks lend in large amounts, on margin, into stock markets, the bust shreds their balance
sheets (1929).
When banks lend in large amounts on mortgages into housing markets, the bust shreds their balance
sheets (2008).
If banks don't lend prudently you are in trouble.
Then they developed securitisation …… oh dear (no need to lend prudently now).
Housing booms and busts around the world …… oh dear.
All that money borrowed from the future and already spent …… oh dear.
This is so interesting. It seems to be approaching the subject that Wray speculated about a
while back – that we should give central banks fiscal responsibility. Because otherwise a sovereign
state has no control over its sovereign money? It seems to me that money itself becomes a rehypothecated
asset by virtue of being invested over and over again – if it is well allocated and under good
fiscal control all is well. If not we get the Great Recession.
So let the state become the defacto shadow central bank so it had direct control of its own
money. Instead of hanging on to the old gold standard mindset of top down management, why not
think of people, not collateral, as the root of the system – the grass roots. How much money does
a system – a sovereign country – need per person. And then establish a sovereign central bank
to deal directly, bringing the shadows into the sunlight of fiscal control.
…and does anyone remember the triumph of the desk slaves of the Crimson Permanent Assurance?
Monty Python understood something about political economies and how one might achieve more fairness
in outcomes… https://vimeo.com/111458975
Moneyness, like doggitas, you just can't scratch behind its ears. If shadow money is distinguished
by its relationship to collateral, as opposed to money issued by the state, with the entire human
enterprise of civilization as its basis, it still seems to me that at the top of the money hierarchy
is fiat money, the real money by the real social order empowered by the social forms of power
that sustain human life in all of its aspects, not just the financial conveniences. Shadow
money sounds to me like fictional capital by another name. And contractual based deposits sounds
like counterfeiting. With the distinction that the man with counterfeit printing press robs the
train, while the man who runs the Wall St Investment bank repo trading desk robs the whole railroad.
Am I right or Am I right. What a bunch of Losers!!!
And if there is any doubt about the fictional quality of $Trillions and $ Trillions of dollars,
physicists can not find anything naturally occurring in the universe beyond billions and billions.
Money, simply a numbered record, a counting or cardinal number, transforms into money in name
only, MINO, when it refers to fictional amount that can only appear contractually as words, and
do not count how much economic activity or output has been produced.
Therefore, Money becomes a victim of the ontological argument for God by St Anselm. If
God does not exist, an all powerful, all knowing, all present infinitely great in all categories
of Supreme Being could not be written or spoken about, lacking the quality of existence. The fact
that we CAN speak about an Omnipotent Supreme Deity means that one in fact exists, due to existence
is part and parcel of Omnipotence. But of course, because we can talk or write about something,
does not make it real.
It can become socially acceptable as in the case of shadow money, but it is fictional capital,
a shadow of the real thing. Time to get out of the cave of finance with its shadows dancing from
the light of the fires and walk eyes wide open in the bright light of sunshine!
I don't know about this one. It seems to me to be some pretty queasy thinking. It kind of wanders
around in circles of confusion. "my existence led by confusion boats, mutiny from stern to bow".
That's pretty funny somebody would say that money is diabolically hard to write about. That's
pretty funny.
Money is actually the easiest thing to write about, because it's formless energy. It's
not that the phenomenon is shadow money, it's shadow assets.
You have to be able to separate in your mind the ideas of 1) Quantity and 2) Form. That's
why economics is a mental disorder, because it doesn't separate quantity and form. If you can't
or don't, then yes, it's diabolically hard to write about because you're writing about two different
things simultaneously without realizing it. Money is a quantity that is infinite and continuous,
but form is an idea that is discontinuous and finite. People do what the forms tell them to do.
The money is just like electricity that powers the animation of the forms. Repo is a form it's
not money. It's existence results in a certain ordering of social relations, that's also a form.
But money is just the energy that makes the forms potent.
The primary challenge is to come up with an ordered way of thinking about the forms themselves.
That's frankly not easy. The ideal would be to understand them in the manner in which Euclid understood
geometrical ideas. If you can get the vision, then you can see all the possibilities for structure
and ordered relationships. there's really no triangle in reality and there's no point and there's
no line and there's no plane. They just made them up to approximate physical reality. Then they
thought to themselves "Holy shit! These ideas interrelated in an astounding range of symmetries
and causations." Then they became a lens or a framework through which physical reality was interpreted.
But they didn't confuse the idea of "number" with the idea of "triangle" or "circle".
Certainly in math the algebraic interpretation doesn't rely completely on the geometrical interpretation.
But if there is no geometrical interpretation and it's only algebra, then so much is missing,
so much is lost. I guess that's why they used to call it "political economy" before the mental
disorder fully usurped the power of perception and reasoning.
Certainly in math the algebraic interpretation doesn't rely completely on the geometrical
interpretation. But if there is no geometrical interpretation and it's only algebra, then so
much is missing, so much is lost.
With that firmly in mind, I think it's necessary to mention the fact that the " study
" of "economics" relies on calculus, wherein we are introduced to the notion of change over
time, volume, motion, acceleration, rates of change, vectors, etc.
Algebra and geometry are, as you point out, obvious abstractions, but once you add volume motion,
and rates of change, the models become very seductive, and it's easy to see how one can be convinced
that they are approaching an understanding of 'reality'.
The trouble is of course, that the egg-heads busy trying to describe economic "reality" with
calculus, are, for the most part in the employ of savages who will forever cling to a simple arithmetic
where their only interest is in "having it all".
Genius employed to make excuses for demented indifference.
'Central banks should lend unsecured … we suggest that the state, as base-asset issuer,
becomes a de facto shadow central bank.' - Daniela "Zsa Zsa" Gabor
This statement desperately needs Walter Bagehot's qualifications: "to solvent institutions"
and "at a penalty rate."
Otherwise, we're just talking about another squalid round of "TARP for Jamie," as we peasants
reach for our pitchforks.
It should however be pointed out that the idea of shadow banking is not remotely new. The
concept was presaged well over a century ago by Walter Bagehot, the legendary English banker,
essayist, and theorist. In 1873, Bagehot wrote Lombard Street: A Description of the Money Market,
his canonical work on the money market and central banking. In it, he observed that the great
London banks were accompanied by a parallel set of financial firms, known as "bill brokers," which
in many ways resembled modern-day securities dealers. Like today's dealers, these bill-brokers
financed themselves with borrowings that, Bagehot informs us, were "repayable at demand, or at
very short notice."
Formally speaking these firms were not banks but to Bagehot they might as well be. "The London
bill brokers," he observes, "do much the same [as banks]. Indeed, they are only a special sort
of bankers who allow daily interest on deposits, and who for most of their money give security
[i.e., collateral]. But we have no concern now with these differences of detail." At times, Bagehot
is careful to note that the short-term obligations of bill-brokers were not technically deposits;
he observes that the maturing of these liabilities "is not indeed a direct withdrawal of money
on deposit," although "its principal effect is identical."
Other times, however, Bagehot dispenses even with this distinction: "It was also most natural
that the bill-brokers should become, more or less, bankers too, and should receive money on deposit
without giving any security for it." Here we have an unambiguous identification of the shadow
banking phenomenon about 140 years ago .
I would posit that there are two types of money
A – money of the 0.001% – if they walk into a casino, real estate transaction, or any asset for
that matter they can NOMINALLY lose money – in fact the 0.001% NEVER lose any of THEIR money,
they just lose your money. All winnings, of anybody doing anything anywhere, belong to them.
B – money of everybody else – this money nominally is yours to do with as you see fit, but it
ALL belongs to the 0.001%. The collateral that backs it up is everything you earn and own and
when necessary your, and your family's, internal organs…
"The nation [England] was not a penny poorer by the bursting of these soap bubbles of nominal
money capital. All these securities actually represent nothing but accumulated claims, legal titles
to future production. Their money or capital value either does not represent capital at all …
or is determined independently of the real capital value they represent."
– Marx
Banking Capital's Component Parts
Capital: Volume Three
James Levy , April 17, 2016 at 6:07 am
Marx failed to acknowledge that supposedly hard-headed Capitalism is actually all about
living beyond your means and mortgaging the future.
It was designed from the Fuggars' and the Medici's to be about debt and fractional reserves
and interest. A system based on a finite supply of money is going to grow not much faster, at
best, than the money available allows.
Capitalism allows explosive growth by supplying explosive amounts of credit. All this shadow
banking activity is designed to get around reserve requirements; nothing else I can see calls
all this complexity into existence. The banks always need more, because lending is how they make
their money, so they want an infinite amount to lend in order to drive their profits towards the
infinite.
A sovereign can create its own currency, but theoretically couldn't it create any currency?
Couldn't Greece for example click a few key boards put some ones and zeros in and say, "oh our
account with $1,000,000 US is actually $10,000,000,000 US?
This article I think defines shadow money alright as starting where bank deposits leave
off but as the above comments suggest seems to miss some key points. I think a major problem with
the article is seeing central banks as separate from the state rather than seeing the central
bank along with the Treasury as the state itself.
The article gets Treasury debt wrong by seeing it as the central bank funding the state
rather than as actually coming from the state. This leads to wrong policy choices such as this
state money being used to bail out useless financial transactions and asset appreciation rather
than the public purpose. I think crazyman has it right. We left behind the power of perception
and reasoning by not realizing the importance of political economy.
Some issues with the piece and questions for the authors (and fellow NCers):
I really wish such analyses would use the more-precise term "credit-money" in reference to
money creation by banks, to distinguish it from government money creation, which similarly may
have repayment requirements attached (bonds), but need not be so. The "need not be so" may occur
via outright fiat emission, but more commonly appears in form of a public debt stock which continually
increases with time, at least in nominal terms.
The legal right to re-use (re-hypothecate) collateral allows various (shadow) banks to
issue shadow money against the same government bond, which becomes akin to a base asset with
"velocity."
Fine, but what about that other crucial element of modern bank credit-money creation, leverage?
Are there any practical limits on shadow banks' issuance of multiple units of shadow money against
the same government-bond money unit? If so, how are they enforced (if at all)? Note also the key
concept of "implied leverage" inherent in such schemes, where the leverage ratio may fluctuate
drastically with the mark-to-market valuation of the collateral. Banks play endless games with
"fictional reserves"; it would be naive to imagine that non-bank shadow lenders don't do similarly
with their alleged collateral.
The first point, persuasively made by Perry Mehrling, and more recently by Bank of England,
is that central banks need a (well-designed) framework to backstop markets, not only institutions.
Erm, markets are the *only* thing the government should be committed to ensuring functioning
of - we have overwhelming evidences from multiple boom-bust-crisis episodes over the last 3 decades
of the toxic results of governments backstopping hyperleveraged fraud-riddled institutions and
the crooks running same.
"... There is a LOT of food for thought in it. Russia may soon peak as as oil producer, but gas production is another story. Russia may now turn out to be the swing producer in some respects. ..."
"... I read that the Russian government is selling a 19.5% stake in Rosneft and looking for a "non-greedy" partner for the interest. Russia also says do not expect prices to rise after Doha meeting. I believe we discussed this back in February. The goal is not necessarily to return prices back to 2011-14 levels, but to stop the speculators driving the prices into the $20s and below. ..."
"... I wish they shale guys would say they need $70 to survive. Then OPEC and Russia would be ok with $60, and $60 WTI would be just fine by us for quite awhile. ..."
"... Wait, you're playing the speculator card? I thought those HFT engines were all that was putting it at $110. ..."
This link is a longer one ( not for sound bite fans ) going into some substantial detail concerning
Russia as an energy exporting country, and what it means to the rest of the world politically
and economically.
Read it for insight. There is a LOT of food for thought in it. Russia may soon peak as as oil
producer, but gas production is another story. Russia may now turn out to be the swing producer
in some respects.
Russia can sell pipeline gas cheaper than we yankees can sell LNG overseas for instance.
I read that the Russian government is selling a 19.5% stake in Rosneft and looking for a "non-greedy"
partner for the interest. Russia also says do not expect prices to rise after Doha meeting. I
believe we discussed this back in February. The goal is not necessarily to return prices back
to 2011-14 levels, but to stop the speculators driving the prices into the $20s and below.
I wish they shale guys would say they need $70 to survive. Then OPEC and Russia would be
ok with $60, and $60 WTI would be just fine by us for quite awhile.
"... He is bluffing. His remarks are aimed at financiers of higher cost non-conventional production. Saudis and Russians are not afraid of other conventional producers they are terrified by the possibility of higher cost non-conventional oil flooding the market using debt-fueled growth. ..."
"... In order to keep banks in check, Prince takes to the media to warn of consequences, but in essence he is bluffing. Saudis cannot increase and sustain production above current levels. ..."
"... Saudi Arabia has told the Obama administration and members of Congress that it will sell off hundreds of billions of dollars' worth of American assets held by the kingdom if Congress passes a bill that would allow the Saudi government to be held responsible in American courts for any role in the Sept. 11, 2001, attacks. ..."
The KSA prince say they could increase output to 11.5 million barrels a day immediately and go to
12.5 million in six to nine months "if we wanted to".
Is he: 1. Dreaming 2. Confused 3. Just playing around and bs everyone 4. Thinking it can be done
5. Don't know the what the hell he is talking about
I know there as been dissuasion here on how the actual reserves look like. Whats your thoughts?
He is bluffing.
His remarks are aimed at financiers of higher cost non-conventional production. Saudis and Russians
are not afraid of other conventional producers they are terrified by the possibility of higher cost
non-conventional oil flooding the market using debt-fueled growth.
In order to keep banks in check, Prince takes to the media to warn of consequences, but in essence
he is bluffing. Saudis cannot increase and sustain production above current levels.
"WASHINGTON - Saudi Arabia has told the Obama administration and members of Congress that it will
sell off hundreds of billions of dollars' worth of American assets held by the kingdom if Congress
passes a bill that would allow the Saudi government to be held responsible in American courts
for any role in the Sept. 11, 2001, attacks."
What the chance we will see the conclusions before Oil exports fro KSA tank?
"... At the rate the rig count is dropping we should be negative territory around October. (ba da bump) But seriously folks, from January to February dropped 23%, from February to March dropped 20%. How low can you go. ..."
"... I know this has been discussed, but I'm still not clear how much of it takes to get those 9,000 odd uncompleted wells completed. How much more do they have to spend to complete a well and how does that compare to the total cost of the well? I'm kind of stunned that they are drilling at all with a back log that big. ..."
"... It does make you wonder how many are actually dry holes. Maybe not completely dry but not worth completing and fracking. I could see where a company would not want to admit that their investment had turned into a liability and would require scarce money to P&A. ..."
"... I feel with this little up tick in oil price, may have kept a few rigs out there a little longer than expected. It seems from H&P, there are still rigs with on going long term contracts, which will cost money to get out of. I suspect XTO with all their support can afford to ride the oil price out, and at least get some value out contracted rigs, where the more cash strapped companies just have to write off cancellation fees as a bad call. ..."
At the rate the rig count is dropping we should be negative territory around October. (ba da bump) But seriously folks, from January to February dropped 23%, from February to March dropped 20%.
How low can you go.
I know this has been discussed, but I'm still not clear how much of it takes to get those 9,000
odd uncompleted wells completed. How much more do they have to spend to complete a well and how
does that compare to the total cost of the well? I'm kind of stunned that they are drilling at
all with a back log that big.
It does make you wonder how many are actually dry holes. Maybe not completely dry but not worth
completing and fracking.
I could see where a company would not want to admit that their investment had turned into a liability
and would require scarce money to P&A.
Shallow Sands, laboriously went through all the annual reports, and counted low to mid 20's
of rigs the oil companies expected to have working during the year in ND. The early drop in the
rig count this year, is just aliening the count with their 2016 budgets.
The thing to watch is whether the recent uptick in the oil price, allows any of them to put rigs
back to work, or whether the April bank loan reviews puts a total clamp on their operations?
Toolpush. The wild card on rigs from the 10K was XTO. No mention in XOM's 10K of specifics that
i recall. If I am reading it right, their production was up significantly in February. At least that
is the way it looked to me on Enno's site. The others that I am not sure about, or may have messed up were Statoil and Hess. Statoil I
am not sure of. I thought Hess was dropping down to two, but they haven't yet.
It looks like one of Statoil's rigs is drilling an SWD well. I thought rigs would bottom around
26. Pretty close now. I'd say more relevant are/will be completion of DUC's.
BH is actually showing 26 for ND. As you say SWD well. Burlinton has a 20 thousand well. Most
likely a workover/re-frac, that will not be counted by BH, so you are getting pretty close to
the money.
I feel with this little up tick in oil price, may have kept a few rigs out there a little longer
than expected. It seems from H&P, there are still rigs with on going long term contracts, which
will cost money to get out of. I suspect XTO with all their support can afford to ride the oil
price out, and at least get some value out contracted rigs, where the more cash strapped companies
just have to write off cancellation fees as a bad call.
You should be getting close to throwing the red pen away, well at least putting in back in
the draw, and buying a brand new black one?
"... The FED production index for oil and gas came also out today. It covers production data for March. The crude oil index fell year over year 6% at a monthly rate of close to 3%. ..."
"... The year over year production change leads the production index quite strictly by 9 month. So, if this correlation holds, production will be down around 30% by year end. ..."
The FED production index for oil and gas came also out today. It covers production data for
March. The crude oil index fell year over year 6% at a monthly rate of close to 3%.
The year over year production change leads the production index quite strictly by 9 month.
So, if this correlation holds, production will be down around 30% by year end.
"... The Telegraph has a story indicating Chinese oil imports are jumping from 6.7 million barrels per day in 2015 to 8 million barrels per day in 2016. Estimated to be 10 million barrels per day in 2018. Barclays estimates. Chinese production is set to fall slightly in 2016. ..."
"... US production looks to fall to 8 million bopd by end of 2016. US oil demand is also rising. ..."
"... Yeah I'm biased. I'm sick of sub $40 in the field. We have been below $40 in the field since 7/15. Haven't seen above $55 in the field since 11/14. Havent seen these oil prices since 2003-2004. ..."
"... Oil is still very low, yet gasoline has popped up over $2. Low here was $1.29. ..."
"... Refining friends say US gasoline demand will be very high this summer. Their turnaround is winding down, they are going to refine a record number of barrels this year. Just observations. ..."
The Telegraph has a story indicating Chinese oil imports are jumping from 6.7 million barrels
per day in 2015 to 8 million barrels per day in 2016. Estimated to be 10 million barrels per day
in 2018. Barclays estimates.
Chinese production is set to fall slightly in 2016.
US production looks to fall to 8 million bopd by end of 2016. US oil
demand is also rising.
Yeah I'm biased. I'm sick of sub $40 in the field. We have been below $40 in the field since
7/15. Haven't seen above $55 in the field since 11/14. Havent seen these oil prices since 2003-2004.
Great weather here today. People driving all over the place in our little burg. Didnt see one
electric
car today. Still know of one Tesla in town. There is, however, also one
used Leaf. That is new in the past
year. It is driven by a teenager to and from school. Her father has an F350 diesel, her mother
has a Chevy Suburban. The Tesla owner also has two gasoline powered vehicles.
Oil is still very low, yet gasoline has popped up over $2. Low here was $1.29.
Refining friends say US gasoline
demand will be very high this summer. Their turnaround is winding
down, they are going to refine
a record number of barrels this year. Just observations.
"... This could be a really big deal. First sign that the people of the GCC are not going to take reduced living standards easily. ..."
"... Good! I will go with Ron. They are all maxed out anyway. If they had signed a freeze agreement, then everyone would say that the price is rigged and blame the oil companies. I am willing [lost my ass on a lot of oil stock investments] to just wait and see how everything plays out without artificial agreements, that, in my opinion, would have meant nothing. ..."
"... Clueless. I understand where you are coming from. Given early signs from Kuwait, there may be no need for a cut or freeze. Assuming Kuwait just went down about 2 million, wouldn't it be prudent for the rest to wait and see what happens? I think austerity in the kingdoms maybe is not going so smoothly? ..."
"... As for us, we are kind of like Russia, don't want to see another sub $30 test. Would like to get to $55-60 WTI and see how shale, tar sands, etc react. So, if freeze talk is why we had a bounce, and we drop back below $30 WTI, we wont be happy campers about no freeze deal. ..."
Kuwait Oil Company (KOC) has lowered crude output to 1.1 million barrels per day (bpd) from its
normal production level of about 3 million bpd, company spokesman Saad Al-Azmi said in a posting
on the KOC Twitter account.
Now thats a cut to write home about. So not sure about that how much the "glut" is but if they
take of 2mb/d does it mean we are below daily demand now.
Some talk about freeze – the are definitely not talking, :-)
Oh sorry. Just copied a slice of the article and missed that vital information.
Anyway, let the market party start. It will definitely test the fundamentals of the oil market.
Words vs. Supply
DOHA OIL PRODUCERS MEETING ENDS WITHOUT AN AGREEMENT
"A summit in Doha between the world's largest oil producing countries ended without an agreement
on Sunday, as country leaders failed to strike a deal to freeze output and boost sagging crude
prices."
Good! I will go with Ron. They are all maxed out anyway. If they had signed a freeze agreement,
then everyone would say that the price is rigged and blame the oil companies. I am willing [lost
my ass on a lot of oil stock investments] to just wait and see how everything plays out without
artificial agreements, that, in my opinion, would have meant nothing.
Clueless. I understand where you are coming from.
Given early signs from Kuwait, there may be no need for a cut or freeze. Assuming Kuwait just went down about 2 million, wouldn't it be prudent for the rest to wait
and see what happens? I think austerity in the kingdoms maybe is not going so smoothly?
As for us, we are kind of like Russia, don't want to see another sub $30 test. Would like to
get to $55-60 WTI and see how shale, tar sands, etc react. So, if freeze talk is why we had a
bounce, and we drop back below $30 WTI, we wont be happy campers about no freeze deal.
In retrospect, costs got out of hand at $100 oil. Pretty much everything is cheaper now, except
for electricity.
$55-60 WTI would be wonderful. It would better if the market achieves it than through a cut.
However, history is that a cut is necessary to get the traders to dump their shorts.
There are a lot of John Kilduff's out there who are almost maniacal in their desire to drive
WTI back below $26.
I long ago quit trying to figure out why oil trades like it does, or how it can get so high
or low for periods of time.
I'd say the new Saudi prince who is apparently now in charge seems to be taking a different
approach than his predecessors.
"... Another possibility is differences between Saudi officials themselves on how to approach Doha. Doubts over a potential success in Doha surfaced in recent weeks following comments from Saudi Arabia's Deputy Crown Prince Mohammed bin Salman, who laid out Saudi Arabia's position not to freeze without Iran following suit. He reiterated those comments three days before the meeting. "If all major producers don't freeze production, we will not freeze production," Prince Salman said on April 14. "If we don't freeze, then we will sell at any opportunity we get." ..."
One possibility is that Saudi Arabia had at least some intention of signing
up to the freeze, but let its antipathy towards Iran get in the way at the last
minute. "The fact that Saudi Arabia seems to have blocked the deal is an indicator
of how much its oil policy is being driven by the ongoing geopolitical conflict
with Iran," Jason Bordoff, the director of the Center on Global Energy Policy
at Columbia University,
told Bloomberg.
Another possibility is differences between Saudi officials
themselves on how to approach Doha. Doubts over a potential success in Doha
surfaced in recent weeks following comments from Saudi Arabia's Deputy Crown
Prince Mohammed bin Salman, who laid out Saudi Arabia's position not to freeze
without Iran following suit. He reiterated those comments three days before
the meeting. "If all major producers don't freeze production, we will not freeze
production," Prince Salman said on April 14. "If we don't freeze, then we will
sell at any opportunity we get." Much of the world, including many negotiators,
again thought that this was bluster.
The Wall Street Journal
hinted at the fact that Saudi Arabia's delegation to Doha, led by the
iconic oil minister Ali al-Naimi, had quite a different tone from the
powerful young prince. As late as Saturday, the Saudi delegation appeared to
be "willing to sign a deal despite what they described as political
statements from Prince Salman," the WSJ wrote, based on comments from its
sources familiar with the talks. On Sunday, al-Naimi unexpectedly
backtracked, and the Doha negotiations dragged on for hours before
ultimately falling apart. Although it is unclear what caused the change, one
would have to wonder if Prince Salman ultimately prevailed over his
country's delegation to take a hard line over Iran.
Separately, Kuwait's oil workers could do more for the markets than any
OPEC production freeze. While oil traders are focusing on the failed Doha
talks, Kuwait's oil production dropped by half this weekend because of a
worker strike. Kuwait Oil Company reported that its oil production
fell to a staggering 1.1 mb/d after workers began a strike over wages.
The world's major oil producing nations failed to strike an agreement on Sunday
night to freeze production, saying they needed more time to agree a deal to
try to buoy the price of oil.
What producers had hoped would be the
first deal in 15 years ran into difficulty after
Saudi Arabia
– the largest exporter of oil – demanded that Iran join an
agreement to freeze output.
Iran
has been reluctant to agree to hold back on oil production while it
attempts to return its market share to pre-sanction levels.
The meeting in Doha had been called on Sunday for 18 countries to sign off
on a deal that would helped to put a floor on the price of crude oil which,
at
$45 a barrel
, has risen 60% from its lows in January.
But Reuters quoted sources saying that Saudi Arabia wanted all
Opec
members to attend talks, despite insisting earlier on excluding Iran,
its political rival in the region, because Tehran had refused to freeze production.
If a deal cannot be struck soon, it is possible that recent rises in the
price of oil will stall.
Economists at French bank Société Générale said: "When it comes to oil, the
principle of Goldilocks applies in full. Too low a price raises fear of a vicious
circle of default, spillover to bank balance sheets, eroding financial conditions
and a new headwind for the real economy.
"Too high a price, on the other hand, erodes the welcome boost to purchasing
power. But, if higher oil prices are driven by stronger demand, then this is
good news."
They noted that a recent report by the
International Energy Agency
warned that a mere production freeze would have
a limited effect on physical oil supply.
Even so, expectations had been high before the Sunday meeting that a deal
could be struck between Opec and non-Opec oil producers to hold output at January's
levels until October. Reuters was reporting that producers were instead agreeing
to freeze oil production at "an agreeable level" as long as all Opec countries
and major exporting nations participated.
"If there is no deal today, it will be more than just Iran that Saudi Arabia
will be targeting. If there is no freeze, that would directly affect North American
production going forward, perhaps something Saudis might like to see," Natixis
oil analyst Abhishek Deshpande told Reuters.
So here is where I start to sense that OPECs monthly oil market report
and reality have, let's say, diverged onto different paths. OPEC details how
production is essentially falling all over the world after achieving strong
growth in 2015. In particular, non-OPEC supplies grew by 1.5 mb/d to reach
57.1 mb/d in 2015. In 2016, noting the aforementioned large drop in CAPEX
and the corresponding rig count, non OPEC production is expected to fall by
nearly 800,000 bpd.
In both cases, U.S. tight oil is leading the way. In particular, U.S.
tight oil volumes are falling the fastest. They note that in March, these
volumes are expected to be down over 700,000 bpd from their peak in the
first quarter of 2015. They also note the falling rig count as a major
driver, possibly leading to increasing rates of production declines during
2016. Got it – rig counts drop to the lowest levels since the 1980s,
production falls hard. Especially in tight oil where new wells typically
decline by 75 percent in their first year of production. No brainier there.
Most analysts have realized this.
However, what about the current oversupply you ask? Are they not just
saying that the market will just absorb the excesses of a currently
oversupplied market? Yes. However, based on their own estimates, the market
is basically in balance today. As such, here is where their projections
start to deviate from logic – or to suggest a rebound is upon us. Below is
OPEC's forecast of non-OPEC production by quarter. The group notes that the
world has seen a sharp drop in oil production during the first quarter of
2016. Various sources have already reported much of this information.
Importantly, OPEC is predicting larger decreases in production in the second
quarter of 2016 as the drop in activity that accelerated last December,
really starts to impact production. Once again, this is starting to be
accepted by those that pay attention to the data. These declines have
recently garnered some press attention and I believe played a role in the
recent oil price rebound.
This is all as expected – the global oil industry cannot grow volumes in
a $30/bbl oil world. In fact, at that price, cash flows are insufficient to
warrant investment even to the levels necessary to replace production – much
less grow volumes. Many have been saying this and dropping production is the
evidence that they are correct.
... ... ...
Sober analysts have been downgrading production estimates almost
universally for the past few months. Likewise, service companies have been
steadily lowering revenue estimates for the second quarter and the remainder
of the year. As such, what changes in the third and fourth quarters? We are
in mid-April now. The fourth quarter is only a short 5 months away – the
industry better get going.
... ... ...
While the industry is getting more and more efficient, the laws of large
numbers are immutable. With tens of thousands of horizontal wells declining
daily, several thousand new wells are required to replace these volumes, and
there is no evidence of any rebound yet.
... ... ...
...assuming flat OPEC volumes, based on this chart, supply and demand are
effectively in balance in 3Q 2016. In fact, demand slightly exceeds supply
implying that high global inventories begin to drop. This is the point where
prices stabilize and begin to rebound.
... ... ...
In reality, what is likely to happen is the third quarter call on OPEC
will be about 1 mb/d above supply, resulting in strong inventory draws. This
will push oil prices to the highest levels seen at least over the past 12
months. Given this signal, the industry will start to put capital back to
work.
However, this will take a while – most of those laid off last year and
this have found other jobs. Remember the 6-9 month lag between increases in
rig count and volume growth? It could be even longer before volumes are
truly growing again. If not in the U.S., certainly in the most of the rest
of the world.
As such, let's say fourth quarter is flat with our revised third quarter.
Then the call on OPEC would be around 1.5 mb/d, resulting in further
reductions in global inventories. In addition, oil prices would likely head
higher and the strip would enter backwardation, prompting further draws from
inventories. Under this scenario, non-OPEC volumes are unlikely to grow
sufficiently to meet global demand until the second half of 2017. To achieve
this, rising oil prices are just around the corner.
In every cycle, analysts and pundits try to make sense of the current
environment. When oil prices were above $100/bbl, many argued such high
prices were necessary because global F&D costs had risen to that point.
Likewise, at the bottom, many have argued that $30/bbl is the new price
level and given OPEC's low marginal costs, prices could not rise. Neither
was true. Prices and supplies are cyclical and the oil market is
self-correcting. Wells decline daily. Cash must be invested in large
quantities just to keep production flat and even in larger quantities to
grow production
... ... ...
we can recognize that the correction process is happening. But the
rebound in investment is nowhere in sight making it unlikely that volume
declines suddenly stop and then reverse in the second half of 2016. What
this really tells me is that prices got out of control, dropped much further
than the cartel expected, but they couldn't reverse course without losing
credibility. Maybe we all will be better off when they just leave markets
alone.
Another myth is the drilling efficiencies being touted by E&Ps. Yes,
drilling has gotten better, but most of the price gains touted by E&P management
are related to pricing concessions extracted from the OFS sector. OFS operators
simply are fighting for survival and are doing what it takes to keep customers
- cutting prices as much as they can and even taking losses. Once activity
begins to pick up, OFS pricing mostly will reverse, he said.
"The fact remains that the industry's technical and financial performance
was already challenged with oil prices at $100/bbl, as seen by the fading
cash flow and profitability of both the IOCs and independents in recent
years," Kibsgaard said.
"Over the past decade, our industry has simply not progressed sufficiently
in terms of total system performance to enable cost-effective development
of increasingly complex hydrocarbon resources. This can be seen by the escalating
industry cost per barrel."
The U.S. land rig count peaked in October 2014, and the "rate of disruption"
across the energy sector has led to a "full-scale cash crisis."
"The latest data points have, in recent weeks, sent the oil price up
toward $40/bbl, and we would expect the upward trend to continue as the
physical balances tighten further in the coming quarters," said Kibsgaard.
"In spite of this, we maintain our view that there will be a noticeable
lag between higher oil prices and higher E&P investments given the fragile
financial state of our customer base, which means that there will be no
meaningful improvement in our activity until 2017" .
"... Looks more like while they initialed the price slump, they were quickly taken for a ride by "paper oil producers", who promptly assume control and drove the price to the current price band. And intend to maintain it as long as possible (look at all "low oil price forever" propaganda in Western MSM). ..."
…..Why would a price spike above $40 be a bad thing for Saudi Arabia?
Because it would provide a life support to American frackers who have undermined the pricing
power of the Kingdom these days, as was discussed in a previous piece here.
The predatory pricing initiated by KSA in mid 2014 was not directed against the USA frackers and
in no way directed at establishing $30-40 per barrel price band. They viewed US frackers as a
useful balancing mechanism (and this was stressed several times by high level Saudi officials),
that allow to establish and maintain $70-$80 or so price range. and that probably was their initial
intention. But they quickly lost control to Wall Street, which has other plans.
And they think that this price range is also OK for the world economy. I can't find quotes
now but there were such quotes by Saudi oil minister.
Looks more like while they initialed the price slump, they were quickly taken for a ride by
"paper oil producers", who promptly assume control and drove the price to the current price band.
And intend to maintain it as long as possible (look at all "low oil price forever" propaganda
in Western MSM).
That's why Saudis were forced to ally with Russia in "freezing production" scheme.
likbez – "Looks more like while they initialed the price slump, they were quickly taken for a
ride by "paper oil producers", who promptly assume (sic) control and drove the price to the current
price band." This theory makes the "paper oil producers" God like.
Since the early 1970's I have heard almost nothing except that the "paper oil producers" have
artificially made oil much more expensive than it should be. Of course, during that same period
of time, with respect to farm products, all I heard was that the "paper farmers" were artificially
making farm product prices cheaper than they should be. They must all be Gods.
Thus, I have never paid attention to what "paper" people are doing. Rather, I try to look at
the fundamentals. For example, assume that we are "paper" traders [with access to billions of
$'s], and we think that the price of oil should be $70. But, we get together and hatch a plan.
At $70 we will sell short billions of $ of oil contracts and that will force the market down and
force Saudi Arabia and Russia to keep cutting their prices and we will make a fortune. That sounds
like a reasonable plan – NOT!!
It is like when oil got to $70, you bet me a billion $'s that prices would go down and I took
your bet, thinking that they would not go down. So you told OPEC and Russia about our bet and
they took your side.
"All oil producing countries … now started accelerated development of petrochemical industry.
This is probably the most important consequence of this oil price slump.
They all want to export more refined products and products with substantial added value (plastics,
composites)."
This process started at least 10 years ago and has nothing to do with the drop in oil prices.
See, for example, the chart below:
Russia's crude oil and refined products exports (million tons)
Not so fast. I remember that Sechin on one of International conferences had proudly pumped
his chest explaining how good a player Russia is in a sense that they are just exporting raw oil
instead of refined products. This guy dumped huge amount of money into Arctic shelf instead of
building refineries and other chemical plants which would help enormously in 2015.
Can you please compare that with KSA dynamics. Because that will tell us how backward in this
respect Russians were up to this day in comparison with Arab sheikhs.
The recent refinery built in KSA (0.4 Mb/d):
Yanbu Aramco Sinopec Refining Company (YASREF) Ltd. King Salman and Chinese President Xi
Jinping inaugurate YASREF Refinery Riyadh, Saudi Arabia, January 20, 2016 The Custodian of
the Two Holy Mosques King Salman bin Abdulaziz Al Saud, the King of Saudi Arabia and His Excellency
Xi Jinping, the President of the People's Republic of China today jointly inaugurated the Yanbu
Aramco Sinopec Refining Company (YASREF)refinery.
https://lnkd.in/eCBZ4PZ W.J
I do not know what you remember, but there are statistical facts.
The share of refined products in Russia's oil and product exports increased from 25-30% in 2000-2005
to 41-42% in 2014-2015.
In volume terms, exports of refined products increased by 174% (almost 3 times) between 2000 and
2015.
Given that Russia has sufficient primary distillation capacity, there was an intensive modernization
program.
Saudi Arabia has also been developing refining capacity and currently covers all its domestic
needs. In 2015, refining products accounted for 13% of total crude and products exports.
Saudi Arabia's crude and refined product exports (mb/d)
source: JODI
As you mentioned Sechin, here is a brief summary of Rosneft's refinery modernization program:
"Rosneft is implementing the most ambitions modernization program in RF: more than 30 construction
projects, reconstruction of re-refinery units. The Company's refineries are implementing the modernization
program that implies significant increase of the refining depth and improvement of the produced
petroleum products (all motor fuels will correspond to the European environmental class Euro-5).
The capacity of the modernization program projects:
primary processing – 12.0 million tons/year;
conversion processes – 23.6 million tons/year;
reforming processes – 35.9 million tons/ year.
At present, within the framework of implementation of the program, reconstruction and construction
works are being performed with respect of the following:
reforming, isomerization, alkylation plants for production of high-octane gasoline components;
catalytic cracking plants for production of high-quality gasoline components and oil conversion
rate increase;
hydrocracking plants for production of high-quality diesel fuel components, jet fuel and oil conversion
rate increase;
hydrotreatment plants for compliance with the requirements of the Technical Regulations of the
Customs Union in terms of sulfur content in the products."
Lenders including JPMorgan Chase & Co., Wells Fargo & Co. and Bank of America Corp. are slashing
credit lines for struggling energy companies. It's a tacit acknowledgment that energy prices aren't
coming back, and represents an abrupt turnaround from last year when banks were lenient on struggling
drillers in the hope that better times were coming.
Since the start of 2016 lenders have yanked $5.6 billion of credit from 36 oil and gas producers,
a reduction of 12 percent, making this the most severe retreat since crude began tumbling in mid-2014,
according to data compiled by Bloomberg.
And it isn't over yet. Banks are in the middle of a twice-yearly review of energy loans, where
they decide how much credit they are willing to extend to junk-rated companies based on the value
of their oil and gas reserves. With crude hovering near $40 a barrel, drillers' assets are worth
far less than they were two years ago.
Banks are cutting their oil and gas exposure in part because they are facing pressure from
regulators and investors to rein in risk.
"The banks are walking a tightrope," said Spencer Cutter, a credit analyst with Bloomberg Intelligence.
"They don't want to push the companies into bankruptcy, but on the other hand they're getting
a lot of heat from regulators and investors. They can't keep kicking the can down the road like
they did last year."
A bank that denies credit to a company could find itself liable for damage to the borrower,
said David Feldman, a restructuring lawyer at Gibson Dunn & Crutcher LLP.
"Lenders are very torn because it's a difficult call," Feldman said.
Borrowers are feeling the pinch. At least 15 companies have seen their credit lines cut, including
Whiting Petroleum Corp., Rex Energy Corp., and Halcon Resources Corp. Goodrich Petroleum Corp.'s
lenders cut its credit line in January to $40.3 million from $75 million, limiting how much the
cash-starved company could draw. The oil and gas driller gave creditors until May 6 to vote on
a reorganization plan.
Last month, in exchange for waiving Energy XXI Ltd.'s loan covenants, lenders led by Wells
Fargo cut the company's credit line to $377.7 million, the amount the oil producer had already
borrowed under what had been a $500 million facility. The lenders also required Energy XXI to
cash out its oil hedges and use the money to pay down the loan, according to Securities and Exchange
Commission filings.
Banks are setting aside more money to cover losses on energy loans. Wells Fargo, which had
$17.4 billion in outstanding oil and gas loans at the end of 2015, set aside $1.2 billion to cover
potential losses. JPMorgan, which had $14 billion in outstanding oil and gas loans, said in a
February presentation that it will boost its energy loan loss reserves to $1.3 billion in the
first quarter, a $500 million increase from the end of the year.
Goldman Sachs, Morgan Stanley, JPMorgan, Bank of America and Citigroup could need an additional
$9 billion to cover souring oil and gas loans in the worst-case scenario, Moody's Investors Service
said in an April 7 report. Still, the lenders would be able to absorb such losses out of one quarter's
earnings.
Thanks AlexS, great article. I think this comes under the general heading of closing the barn
door after the cows are gone. Which is normal operating procedure for banks. I laugh at the idea
that banks are walking a tightrope. Of course they are - they built the tightrope and jumped onto
it happily. The only question for the banks at this point is how do you unwind this thing without
killing it, and themselves, in the process.
"... In any case, the USA shale industry is now against the wall and without government intervention they will be decimated no matter what will be the form of price curve in 2016 and 2017. The forces that try to prolong "low oil price forever" regime are still quite strong and will not give up without a fight. ..."
"... Shale is in a position of zugzwang, as they say in chess since November 2014. That is, whatever action it takes it will be wrong. ..."
"... Their "race to sweet spots" is mainly prolonging agony for everyone else and not solving their model if it ever existed. ..."
"... The deflation of a bubble is clearly a zugzwang style situation. Great insight -- Thank you. ..."
Looks like you discovered a yet another variant of Red Queen race: race for sweet spots :-)
In any case, the USA shale industry is now against the wall and without government intervention
they will be decimated no matter what will be the form of price curve in 2016 and 2017. The forces
that try to prolong "low oil price forever" regime are still quite strong and will not give up
without a fight.
China's exports jumped 11.5%, the most in a year, and declines in imports narrowed to 7.6%
, adding to evidence of stabilization in the world's second-biggest economy.
(b) continuing growth in vehicle sales, supporting strong growth in gasoline consumption
"Vehicle sales in China rose 8.8 percent in March from a year earlier to 2.4 million, the China
Association of Automobile Manufacturers said on Tuesday, supporting strong gasoline demand in
the country." http://www.reuters.com/article/us-global-oil-idUSKCN0X800I
Average oil demand in the world's second-largest crude consumer is expected to grow by 420,000
barrels a day this year, the bank [Standard Chartered] said, adding that apparent oil product
demand expanded 6.2 percent last year to 9.4 million barrels a day. China will account for 37
percent of global demand growth this year, Standard Chartered estimates.
http://www.bloomberg.com/news/articles/2016-03-25/china-seen-sustaining-strong-crude-imports-on-refining-reserves
2/ Falling domestic oil production (for the first time in many years)
"China Petroleum and Chemical Corp, or Sinopec Corp., plans to … cut crude production by 5%
in 2016 as a result of cutting capital expenditures by 10.6% from 2015"
"Total upstream production last year fell 1.7% to 471.91 million barrels of oil equivalent, with
crude output down 3.1%"
[ Hong Kong (Platts)–30 Mar 2016
http://www.platts.com/latest-news/oil/hongkong/chinas-sinopec-expects-steady-throughput-5-lower-27408416
]
"PetroChina Co. sees oil and gas output falling the first time in 17 years as it shuts high-cost
fields that have "no hope" of making profits at current prices."
"PetroChina forecasts crude production this year at 924.7 million barrels, down 4.9 percent."
"China's output in 2016 will decline as much as 5 percent from last year's record 4.3 million
barrels a day, according to estimates last month from Nomura Holdings Inc. and Sanford C. Bernstein
& Co. That would be the first drop in seven years, and the biggest in records going back to 1990."
5/ Strong refining margins, which encourage increasing processing volumes and contribute to
increasing oil product exports (which means that the increase in net imports was less than gross
imports)
They are owed almost a billion. I wonder how that works. They say if you owe a bank a million
and can't pay, you have a problem. If you owe a billion, the bank has a problem. I wonder if they
will actually pull out or be forced to continue to provide services to protect their receivables.
Maduro has been alleging that the US is seeking to scrap the OPEC freeze plan.
"... So by the end of this year or beginning of next year when the price is $50-55 the wells that could have been drilled at that price are already have been drilled. At that time they will announce the next target of $70 when they will pull the rigs from the yard and so on. So they will never reach the desirable price where the rigs will be back because target price will always be ahead of prospective wells that are available. ..."
"... At this point it is hard for them to do anything with such high declining wells. ..."
"... Looks like you discovered a yet another variant of Red Queen race: race for sweet spots :-) ..."
"... In any case, the USA shale industry is now against the wall and without government intervention they will be decimated no matter what will be the form of price curve in 2016 and 2017. The forces that try to prolong "low oil price forever" regime are still quite strong and will not give up without a fight. ..."
"But they are very cautious: the price trigger is $50, not $40-45, like many experts were predicting."
Alex,
I think what is happening is that wells that were borderline at $40-45 have been relentlessly
drilled in the last 2 years when we had oil between $26-$40. And that wells are gone now, so now
they are progressively moving drilling target between $50-60. But as of now someone is still drilling
these $50-60 borderline wells when price barely reached $42 and with significant help of freeze
talk.
So by the end of this year or beginning of next year when the price is $50-55 the wells
that could have been drilled at that price are already have been drilled. At that time they will
announce the next target of $70 when they will pull the rigs from the yard and so on. So they
will never reach the desirable price where the rigs will be back because target price will always
be ahead of prospective wells that are available.
But what else they can say to the gullible investors during investors call or conference except
we are cautious because we know what we are doing :-)
At this point it is hard for them to do anything with such high declining wells.
Looks like you discovered a yet another variant of Red Queen race: race for sweet spots :-)
In any case, the USA shale industry is now against the wall and without government intervention they
will be decimated no matter what will be the form of price curve in 2016 and 2017. The forces
that try to prolong "low oil price forever" regime are still quite strong and will not give up
without a fight.
"... The weekly decline stands now at -31 kb/d which is annualized 1.6 mill b/d. In my view decline rates will now accelerate until oil prices – and more importantly drilling – are up. So, it is also my opinion that the next rise in US liquid hydrocarbon production will not be up before summer 2017. ..."
The weekly decline stands now at -31 kb/d which is annualized 1.6 mill b/d. In my view
decline rates will now accelerate until oil prices – and more importantly drilling – are up. So,
it is also my opinion that the next rise in US liquid hydrocarbon production will not be up before
summer 2017.
Interesting also that 'other supply' (including fuel ethanol and processing gains) is down
70 kb/d. So, the market works and lays the foundation of a price recovery.
The EIA's latest
Drilling Productivity Report has US shale oil production down by 114,000
barrels per day in May. On an annualized basis that is 1,368,000 barrels
per day. That is huge.
Notice that the rate of decline is now increasing every month. It took
a while, until December 2015, for the decline to really get started in earnest.
But now it is clearly underway. It appears that the decline will now clearly
be far greater than a lot of people estimated. Well, that is if the EIA
has any idea of what they are talking about.
I more and more suspect that geology is a significant part of the LTO production
decline. The production curves for each major shale and total of all US
LTO play (ref. Enno Peter's
http://shaleprofile.com/
) are starting to look like bell curves. Also, top producer EOG seemed
to stop its growth in June 2014 and that's before the oil price decline.
Rune Likvern in his recent post @ fractionalflow mentions that some sweet
spots in Bakken are becoming satured with wells. In fact it looks like Bakken
stopped the production increase between July – Nov 2015 which in my eyes
is a bit too early to blame it solely on the oil price.
Maybe Verwimp and Paztec are right? Now it is probably a combination
of oil price and geology, but to me it seems that geology is a significant
part of it.
Oil traders see the bottom for crude prices. After nearly two years of a down
market, oil traders are growing confident that we have passed the low point. "The down market is
behind us," Torbjorn Tornqvist, CEO of Gunvor Group Ltd.,
said on Tuesday at the FT Global Commodities Summit in Lausanne. "It is the beginning of the
end of that for sure." Although there will be a lot of volatility for quite a while, Tornqvist
said that "from here on, the trend is up." The CEO of Trafigura Jeremy Weir
echoed that sentiment at the commodities summit. "I believe we've seen the bottom unless there is
some sort of catastrophic situation political or otherwise," he said. Glencore's (LON:
GLEN) top executive was a little more cautious, arguing that a rebound would not be
quick because of the large stockpiles of oil that need to be worked through.
... ... ...
U.S. banks hit by energy. Major U.S. banks are set to report earnings this
week, and many are facing regulatory pressure from the Federal Reserve, the Federal Deposit
Insurance Corporation and the Office of the Comptroller of the Currency to reduce their exposure
to risky energy companies. Most banks insist that energy is a small part of their portfolio, but
the FT
reports that the banks' trading and investment banking units could report their worst quarter
since the financial crisis in 2009, although much of that is likely due to turmoil in global
financial markets. Still, credit re-determinations are wrapping up, and many analysts expect cuts
of 15 to 20 percent on average to the credit line for oil and gas companies.
"... Researchers at Bernstein expect global oil demand to increase at a mean annual rate of 1.4 percent between 2016 and 2020, compared with annual growth of 1.1 percent over the past decade. ..."
Researchers at Bernstein expect global oil demand to increase at a mean annual rate of 1.4
percent between 2016 and 2020, compared with annual growth of 1.1 percent over the past decade.
"We expect oil markets to rebalance by the end of 2016. This will allow prices to recover towards
the marginal cost of $60 per barrel," Bernstein said, adding that it expects global demand to
reach 101.1 million bpd by 2020, from the current 94.6 million bpd.
"... Producers are not just shrinking production; they are also laying off staff in the thousands. Over the short-term, this will help them, or at least some of them, to survive. In the medium-term, however, production curbs and layoffs will benefit the energy industry in another way: it will make them temporarily less capable of responding to the growing demand for oil and gas. ..."
"... A report from Bernstein puts the mean growth rate for oil demand at 1.4 percent annually for the next five years, up from 1.1 percent for the last decade. The International Energy Agency expects average annual demand growth of 1.3 percent, much of which will come from non-OECD economies. ..."
There's not much money in new well drilling these days. In fact, the latest
figures from the American Petroleum Institute (API) reveal a 70 percent annual decline in new
natural gas well completions along with a staggering 90 percent drop in new oil wells as of the start
of April.
The drop hardly comes as a surprise, especially in the light of the continual
reduction in active drilling rigs across the U.S. as
reported on a
weekly basis by Baker Hughes.
As of April 8, there were 354 active oil rigs-8 fewer than the week before, and 406 fewer than
a year ago. The number of active gas rigs was 89, down from 225 on April 8, 2016.
Given the low oil and gas prices that have pushed many energy firms to the brink of bankruptcy,
these developments were only to be expected, although they are certainly worrying with regard to
the resilience of some players in the sector. Yet, gloomy as the news seems, its implications for
the future are rather positive.
Prices of crude oil and natural gas are at multi-year lows. Producers are not just shrinking
production; they are also laying off staff in the thousands. Over the short-term, this will help
them, or at least some of them, to survive. In the medium-term, however, production curbs and layoffs
will benefit the energy industry in another way: it will make them temporarily less capable of responding
to the growing demand for oil and gas. And demand will grow.
A report from Bernstein puts the mean growth rate for
oil demand at 1.4 percent
annually for the next five years, up from 1.1 percent for the last decade. The International Energy
Agency expects average annual demand growth of 1.3 percent, much of which will come from non-OECD
economies.
"... even if LTO output starts to recover, its annual growth rate will never return to previous high growth rate of 1 mb/d. ..."
"... Potential 300-400 kb/d annual growth in LTO output will be much less than 1.2mb/d projected growth in global demand. ..."
"... I do not dispute Russian companies are cash flow positive. My point is, what do Russian oil and gas industry workers make in salary and benefits, in relation to their US peers? If it is substantially less, is this why, in part, Russian oil and gas companies are still cash flow positive? ..."
"... Yes, salaries in Russia are generally much lower than in the U.S., not just in the oil industry. Especially, if they are measured in dollar-terms, rather than in real purchasing power. Locally produced equipment, pipes, other materials, electricity, services, etc. are also much less expensive, especially after the depreciation of the local currency. ..."
"... Finally, and particularly important, Russia produces higher volume of C+C with a much less number of wells. The number of new wells drilled annually is also several times less than in the U.S. ..."
"... Old conventional onshore fields are on average less mature. There is almost no stripper wells. There is much less (high-cost) deep offshore production. And almost no LTO output. ..."
"... I do not know a lot about Russian oil and gas production, but it does appear to me that a combination of lower costs, and less mature fields, is keeping Russian oil and gas companies generally profitable, despite the downturn. ..."
"... Maybe too simplistic, but there was a time, from 1986-2004, where we would have been cheering $40 WTI. A combination of lower production volumes, combined with much higher costs, make $40 WTI a money loser in most onshore US fields, or at least not enough for new wells. I guess maybe Russia is just where the US was 30 years ago? 30 years ago, $40 WTI would have been very profitable in most US onshore fields. ..."
"I read Russian companies are still making money, but the purchasing power of their currency is
much less than it was."
shallow sand,
Their revenues are mostly in dollars, and 90% of costs are in rubles. So the decline of the
ruble's rate versus the dollar is very positive for the Russian companies, as it partially mitigates
the negative effect of low oil prices.
Which means that OPEC decision not to cut output was correct. One year more of relatively low
oil prices ($40-50) and LTO will not be a threat to other producers.
The excess supply will be eliminated by that time. And even if LTO output starts to recover,
its annual growth rate will never return to previous high growth rate of 1 mb/d.
Potential 300-400 kb/d annual growth in LTO output will be much less than 1.2mb/d projected
growth in global demand.
I do not dispute Russian companies are cash flow positive. My point is, what do Russian
oil and gas industry workers make in salary and benefits, in relation to their US peers? If it
is substantially less, is this why, in part, Russian oil and gas companies are still cash flow
positive?
I do not know the answer, maybe you could provide some information in that regard?
Yes, salaries in Russia are generally much lower than in the U.S., not just in the oil
industry. Especially, if they are measured in dollar-terms, rather than in real purchasing power.
Locally produced equipment, pipes, other materials, electricity, services, etc. are also much
less expensive, especially after the depreciation of the local currency.
Finally, and particularly important, Russia produces higher volume of C+C with a much less
number of wells. The number of new wells drilled annually is also several times less than in the
U.S.
Old conventional onshore fields are on average less mature. There is almost no stripper
wells. There is much less (high-cost) deep offshore production. And almost no LTO output.
Thanks. I always appreciate your comments on this site.
I do not know a lot about Russian oil and gas production, but it does appear to me that
a combination of lower costs, and less mature fields, is keeping Russian oil and gas companies
generally profitable, despite the downturn.
Maybe too simplistic, but there was a time, from 1986-2004, where we would have been cheering
$40 WTI. A combination of lower production volumes, combined with much higher costs, make $40
WTI a money loser in most onshore US fields, or at least not enough for new wells. I guess maybe
Russia is just where the US was 30 years ago? 30 years ago, $40 WTI would have been very profitable
in most US onshore fields.
Fernando, I also agree on the spending part, but I doubt you will find many places more consumer
spending driven than the US. But I am going to refrain from further comment on this topic, as
last time I discussed it, I put both feet in my mouth. And we need to stick to the oil topic.
LOL!
"... ...calculations suggest that while there was a modest boost in spending in the second half of 2014 and first half of 2015, it was significantly less than would have been predicted from the historical relation between spending and energy prices. Moreover, any boost seems to have completely vanished by this point, with actual consumption even a little below what would have been predicted had there been no drop in energy prices at all ..."
"... there can be little debate that lower oil prices have meant a major hit to the incomes of U.S. oil producers. One place that this is starting to show up in the GDP numbers is in capital expenditures. Spending on mining exploration, shafts, and wells was contributing $146 B at an annual rate to U.S. GDP in the second and third quarters of 2014. By the end of 2015 that number was down to $65 B, a drop of about half a percent of GDP. ..."
...calculations suggest that while there was a modest boost in spending in the second half
of 2014 and first half of 2015, it was significantly less than would have been predicted from the
historical relation between spending and energy prices. Moreover, any boost seems to have
completely vanished by this point, with actual consumption even a little below what would have
been predicted had there been no drop in energy prices at all.
A study of individual credit and debit card transactions by JP Morgan Chase Institute found that
at the individual level, consumers did seem to be spending most of the windfall on other items.
Their evidence for this was that if you compared the spending of an individual who had formerly
had a big share of their budget going to gasoline with someone who did not, you saw the spending
by the first person rise relative to the second by almost the full amount of the first person's
gain. The reconciliation between this micro evidence, which suggests that consumers did spend
much of the windfall, and the macro evidence, which shows no evidence of a significant increase
overall, is that there were other factors besides oil prices that were holding everybody's
consumption back, such as slower income growth and more precautionary saving. Spending by
households with big gasoline expenses may have risen relative to other households at the same
time that the average spending by all households came in close to trend. These aggregate factors
show up as part of the "error term" in regression models like Edelstein and Kilian's. If that's
the right way to interpret this, it means that aggregate consumption spending did get a boost
from lower oil prices in the sense that we would have seen much more anemic growth of spending
had oil prices not come down so dramatically.
On the other hand, there can be little debate that lower oil prices have meant a major hit
to the incomes of U.S. oil producers. One place that this is starting to show up in the GDP
numbers is in capital expenditures. Spending on mining exploration, shafts, and wells was
contributing $146 B at an annual rate to U.S. GDP in the second and third quarters of 2014. By
the end of 2015 that number was down to $65 B, a drop of about half a percent of GDP.
"... KSA is the primary driver into the turmoil in Syria. KSA is sitting on vast NatGas fields underneath their oil fields. However, producing NatGas from these fields would cause severe Oil production issues, so they won't tap the NatGas until their Oil fields are tapped out. KSA needs to path to get its NatGas into Europe, which requires a pipeline through Syria. So if they are pressing to remove Assad from power, I suspect that KSA production problems aren't too far into the future. ..."
"... Iran & KSA appear to be gearing up for war. Both nations are buying military equipment and are running multiple proxy wars. I believe KSA is now has the 4 or 5 biggest military budget for 2016. Both KSA and Iran also have a limited number of nuclear weapons. Should the proxy wars turn into a hot war, then it really doesn't matter how much oil is left to be produced. ..."
"... I have wondered this for awhile too. They appear to handle so much water. As I have stated, handling water is a major expense in producing oil. I wonder how much chemical KSA has to use and as well how much electricity. I also wonder what pressure is required on the injected water. There are very few water floods in the US with LOE much under $15 per BOE. Most are well over $20. Same applies to steam floods, CO2 and polymer floods. ..."
"... What happens as the "old" big fields that provided decades of oil comes to an end of their economic life, shortened by the collapse in the oil price and the lasting low oil price? Generally the discoveries that wait in line for development are smaller, so to keep the level and/or grow becomes THE Red Queen race. Then throw in that several of the majors have had a Reserves Replacement Ratio (RRR) of less than 100%, meaning reserves are depleted faster than they are being replaced. ..."
"... Let's say Ghawar begins to decline, that is one field, I imagine that you believe it is unlikely that all the large fields in the World will begin their decline phase simultaneously. So let's assume they do not. For simplicity we will assume Ghawar produces about 5 Mb/d and that it will decline at 3%/ year (similar to US before LTO production started from 1985-2004), we will also assume each year the equivalent of one Ghawar begins to decline until all World production is eventually declining at 3% per year. For simplicity we will assume all fields decline at 3% (in reality some will be more than this and some will be less and the rate won't be constant over time. This is a very simple model. ..."
"... I expect than when the Oil column dips some where between 10 feet and 3 feet, Production is going to collapse at a much faster rate than 3% per year, Perhaps as high 10 to 20% per year. I think as the remaining Oil column shrinks its going to be much harder to extract oil since it will be difficult to steer laterals to follow the uneven remaining oil column. The water cut will grow increasing problematic, and drilling will need to increase to keep laterals on near the top of the oil column. ..."
"... My understanding average large fields are declining at a rate of 5% to 7% per year. Horizontal and other advance drilling\extraction tech has prevented significant production declines so far, but this trend isn't sustainable. At some point I believe we will see shocking decline rates no matter what tech is developed, or how much the Price of Oil increases into. ..."
"... Yes. But I think KSA would likely go to war first as a diversion to internal unrest. Ron Patternson would be a better source than me, since I never visited or worked in KSA. Ron has. So far KSA is using brutal tactics to prevent protests and uprisings. ..."
"... Will economic and social problems become a crisis before Oil production collapses begin? Lots of nations are downing in debt, have aging population with no or inadequate retirement savings, and younger labor pools unequipped (educated/skilled) to meet the needs of businesses. I can't image that the global economy can be sustained for much longer (EU, Asia & South America in recession & the US teetering on the end of another recession). Since when in history have major industrial powers have negative interest rates? ..."
"... I believe the most of the Ghawar formation has a profile where its narrow at the bottom and much wider at the top. There is more volume at the top of the formation than at the bottom. So the decline in oil column depth is not linear. ..."
"... "The 2009 study focused on 331 giant oil fields from a database previously created for the groundbreaking work of Robelius mentioned above. Of those, 261 or 79 percent are considered past their peak and in decline." "The average annual production decline for those 261 fields has been 6.5 percent. " ..."
"... "Now, here's the key insight from the study. An evaluation of giant fields by date of peak shows that new technologies applied to those fields have kept their production higher for longer only to lead to more rapid declines later. As the world's giant fields continue to age and more start to decline, we can therefore expect the annual decline in their rate of production to worsen. Land-based and offshore giants that went into decline in the last decade showed annual production declines on average above 10 percent." ..."
"... The increased use of in-fill drilling (e.g. moving horizontal producers up dip) and IOR/EOR techniques was foreseen with it's effect on prolonging the plateau, we are yet to see if the sudden collapse that was also predicted. The thing that was missed in the predictions around 2009 to 2013 was a flood of free money and with it the ability of the oil industry to ramp up non-conventional production, and I'd also say for Iraq. ..."
"... Great post George: an excellent summary of PO describing rapid ongoing production decline from most key fields that has been temporarily deferred by enormous pulse of infill drilling and EOR paid for via free money leading to current situation. What else do we need to know? ..."
"... As I have repeated many times on this blog, Saudi has been able to mask the decline of its old giant oil fields by bringing old oil previously mothballed fields back on line. These fields are Shaybah, Khurais and Manifa. ..."
"... to even suggest that Ghawar might go into decline is preposterous. Ghawar has long been into decline. I am shocked that you are ignorant of that fact. ..."
"... I have no idea what Ghawar's current production numbers are because it is a Saudi state secret. But I would guess somewhere in the neighborhood of 3 million barrels per day. But if it were not a state secret and Saudi were proud of the numbers, then it would be in the neighborhood of 5 million barrels per day. ..."
"... "Although Saudi Arabia has about 100 major oil and gas fields, more than half of its oil reserves are contained in eight fields in the northeast portion of the country…The Ghawar field has estimated remaining proved oil reserves of 75 billion barrels" ..."
"... The EIA estimates Saudi Arabia's oil production capacity (ex NGLs) at around 12 mb/d, including ~300kb/d in the Saudi part of the Neutral zone. The latest estimate by the IEA is 12.26 mb/d ..."
"... Alex, Ghawar can in no way produce anywhere near 5.8 million barrels per day. But then if you believe anything that is printed on the internet then….. ..."
"... Incidentally, the EIA agrees with Saudi Arabia on their proven reserves of 266 billion barrels. Which says nothing other than "We take Saudi's word for everything. ..."
"... The recent increase in Saudi Arabia's oil production was largely due to higher utilization of production capacity. The last large increase in capacity was in 2009, when Khurais field capacity was increased to 1.2 mb/d. The start of the Manifa field in 2013 and its ramp-up in 2014 largely offset declining production at the mature fields. ..."
"... If we assume a 6.5% annual decline rate since 2009 we would be at 3.4 Mb/d in 2015. At some point Saudi Arabia as a whole will begin to decline, when this will happen I do not know. Just as in the US where there has been extensive infill drilling and secondary, tertiary recovery methods employed and decline rates have remained under a 3% annual rate, the same is likely to be true of other large producing nations with a combination of on shore and offshore projects. ..."
"... The best analogy for Ghawar is probably Cantarell, they have both been developed with the best available secondary and tertiary recovery methods. Cantarell production dropped like a stone once those techniques were exhausted (about 15% per year in 2006 to 2008). My guess is Ghawar will go (or is going) even faster as the IOR/EOR techniques and software models available for its development are more advanced and it is onshore, making their application easier. Daqing might go the same way. Samotlor has been declining at around 5%. ..."
"... I know this is probably an impossible question but how long do you think it will take to deplete the remaining oil column? If it is correct that it took 10 years to drop from 100 to 25 feet (assuming this is correct too) then that doesn't bode well for future production from Ghawar over the next decade. ..."
"... The next five years should tell a lot if the oil column is now that thin. 5 mbopd can't continue forever, nor can 3% decline in a permeable reservoir under water flood. When the water mostly reaches the top, the oil stained water becomes too expensive to separate out and production stops at greater than a 3% rate. ..."
1. Ghawar started with a Oil column of ~1300. I believe by 2005, the Oil column shrunk to about
100 feet. Today its about 20-25 feet. The remaining Oil is floating on water and KSA is using
horizontal drilling to extract it. In some regions of Ghawar they are on their second or third
string of horizontal wells as the water column flood above the wells, and they had to drill above
to get back into the Oil column.
2. KSA restarted production in existing wells that have already been depleted decades ago.
Better tech and mapping information permitted them to sweep up trapped oil in these wells.
3. KSA is now using advanced Oil recovery in Ghawar and other fields (CO2/Nitrogen injection)
in order to free up trapped oil.
4. Saudi Americo, posts tech articles (quarterly) on their website. They usually don't include
which fields they are discussing, but with a little bit of effort, its not to difficult to determine
which fields discussed. This is where I found the three above items. I posted excerpts on this
blog over the past couple of years from SA tech articles.
5. KSA is the primary driver into the turmoil in Syria. KSA is sitting on vast NatGas fields
underneath their oil fields. However, producing NatGas from these fields would cause severe Oil
production issues, so they won't tap the NatGas until their Oil fields are tapped out. KSA needs
to path to get its NatGas into Europe, which requires a pipeline through Syria. So if they are
pressing to remove Assad from power, I suspect that KSA production problems aren't too far into
the future.
FWIW: Its just not KSA that is the problem. Most of the global production has been maintained
from old depeleted wells, using new tech to sweep up trapped oil. Obviously this can't be continued
indefinitely. I fear that at some point all of the major fields will begin to see sharp declines
as remains of trap oil is extracted, an newer technology isn't going to extract Oil that doesn't
exist. With the extremely low oil prices, no one is developing any new fields (deep water, arctic,
etc). By the time oil prices recover that makes it profitable resume these expensive projects
it will be too late and there will likely be permanent crisis. It may take 5 to 7 years to develop
new project to produce Oil. 5 to 7 years is a long lag time, which depletion continues to march
on.
That said, its possible that other problems trump Oil production problems, such as, the Debt
crisis or the demographic crisis (aging populations). We are very close to another major debt
crisis as gov'ts start going bankrupt (ie rest of the PIGS – Portugal, Spain, Italy), China, Japan,
Most of South America, and perhaps a lot of US cities and even US states (Puerto Rico, Illinois,
Pennsylvania, West Virginia, and perhaps California).
Iran & KSA appear to be gearing up for war. Both nations are buying military equipment
and are running multiple proxy wars. I believe KSA is now has the 4 or 5 biggest military budget
for 2016. Both KSA and Iran also have a limited number of nuclear weapons. Should the proxy wars
turn into a hot war, then it really doesn't matter how much oil is left to be produced.
I have wondered this for awhile too. They appear to handle so much water. As I have stated,
handling water is a major expense in producing oil. I wonder how much chemical KSA has to use
and as well how much electricity. I also wonder what pressure is required on the injected water.
There are very few water floods in the US with LOE much under $15 per BOE. Most are well over
$20. Same applies to steam floods, CO2 and polymer floods.
What happens as the "old" big fields that provided decades of oil comes to an end of their
economic life, shortened by the collapse in the oil price and the lasting low oil price? Generally
the discoveries that wait in line for development are smaller, so to keep the level and/or grow
becomes THE Red Queen race. Then throw in that several of the majors have had a Reserves Replacement
Ratio (RRR) of less than 100%, meaning reserves are depleted faster than they are being replaced.
Let's say Ghawar begins to decline, that is one field, I imagine that you believe it is
unlikely that all the large fields in the World will begin their decline phase simultaneously.
So let's assume they do not. For simplicity we will assume Ghawar produces about 5 Mb/d and that
it will decline at 3%/ year (similar to US before LTO production started from 1985-2004), we will
also assume each year the equivalent of one Ghawar begins to decline until all World production
is eventually declining at 3% per year. For simplicity we will assume all fields decline at 3%
(in reality some will be more than this and some will be less and the rate won't be constant over
time. This is a very simple model.
Chart below has World C+C output in Mb/d on left axis and annual decline rate (dashed line)
on right axis. It is assumed in this scenario that a nuclear war in the middle east does not occur.
I expect than when the Oil column dips some where between 10 feet and 3 feet, Production
is going to collapse at a much faster rate than 3% per year, Perhaps as high 10 to 20% per year.
I think as the remaining Oil column shrinks its going to be much harder to extract oil since it
will be difficult to steer laterals to follow the uneven remaining oil column. The water cut will
grow increasing problematic, and drilling will need to increase to keep laterals on near the top
of the oil column.
My understanding average large fields are declining at a rate of 5% to 7% per year. Horizontal
and other advance drilling\extraction tech has prevented significant production declines so far,
but this trend isn't sustainable. At some point I believe we will see shocking decline rates no
matter what tech is developed, or how much the Price of Oil increases into.
That said I don't have a crystal ball or a time machine that shows me what is going to happen.
George Kaplan Asked:
"Do you think there is a significant risk of internal disruption"
Yes. But I think KSA would likely go to war first as a diversion to internal unrest. Ron
Patternson would be a better source than me, since I never visited or worked in KSA. Ron has.
So far KSA is using brutal tactics to prevent protests and uprisings.
"Based upon your thoughts, what do you think that the average cost per barrel is for KSA oil?"
I don't have a clue. I would imagine production costs are constantly rising.
Rune rhetorically asked:
"What happens as the "old" big fields that provided decades of oil comes to an end of their
economic life, shortened by the collapse in the oil price and the lasting low oil price?
yes, that was the point I was leading to. That said: Will economic and social problems
become a crisis before Oil production collapses begin? Lots of nations are downing in debt, have
aging population with no or inadequate retirement savings, and younger labor pools unequipped
(educated/skilled) to meet the needs of businesses. I can't image that the global economy can
be sustained for much longer (EU, Asia & South America in recession & the US teetering on the
end of another recession). Since when in history have major industrial powers have negative interest
rates?
Dave P asked:
"I know this is probably an impossible question but how long do you think it will take to deplete
the remaining oil column?"
I don't' have a clue. I believe the most of the Ghawar formation has a profile where its
narrow at the bottom and much wider at the top. There is more volume at the top of the formation
than at the bottom. So the decline in oil column depth is not linear.
"The 2009 study focused on 331 giant oil fields from a database previously created for
the groundbreaking work of Robelius mentioned above. Of those, 261 or 79 percent are considered
past their peak and in decline." "The average annual production decline for those 261 fields has
been 6.5 percent. "
"Now, here's the key insight from the study. An evaluation of giant fields by date of peak
shows that new technologies applied to those fields have kept their production higher for longer
only to lead to more rapid declines later. As the world's giant fields continue to age and more
start to decline, we can therefore expect the annual decline in their rate of production to worsen.
Land-based and offshore giants that went into decline in the last decade showed annual production
declines on average above 10 percent."
The increased use of in-fill drilling (e.g. moving horizontal producers up dip) and IOR/EOR
techniques was foreseen with it's effect on prolonging the plateau, we are yet to see if the sudden
collapse that was also predicted. The thing that was missed in the predictions around 2009 to
2013 was a flood of free money and with it the ability of the oil industry to ramp up non-conventional
production, and I'd also say for Iraq.
Great post George: an excellent summary of PO describing rapid ongoing production decline
from most key fields that has been temporarily deferred by enormous pulse of infill drilling and
EOR paid for via free money leading to current situation. What else do we need to know?
Dennis, Ghawar is not one oil field, it is five. That is not even counting Fazran. There are
Ain Dar, Shedgum, Uthmaniyah,
Hawiyah, and Haradh. Four of the five Gahwar fields are in decline and the fifth, Haradh,
is on a plateau.
To even suggest that Ghawar "might" begin to decline shows an astonishing ignorance of Saudi
oil production capabilities.
As I have repeated many times on this blog, Saudi has been able to mask the decline of
its old giant oil fields by bringing old oil previously mothballed fields back on line. These
fields are Shaybah, Khurais and Manifa.
Dennis, for God's sake, to even suggest that Ghawar might go into decline is preposterous.
Ghawar has long been into decline. I am shocked that you are ignorant of that fact.
I have no idea what Ghawar's current production numbers are because it is a Saudi state
secret. But I would guess somewhere in the neighborhood of 3 million barrels per day. But if it
were not a state secret and Saudi were proud of the numbers, then it would be in the neighborhood
of 5 million barrels per day.
But it is a state secret and it is not, in my estimation, anywhere near 5 million barrels
per day.
"Although Saudi Arabia has about 100 major oil and gas fields, more than half of its oil
reserves are contained in eight fields in the northeast portion of the country…The Ghawar field
has estimated remaining proved oil reserves of 75 billion barrels"
The EIA estimates Saudi Arabia's oil production capacity (ex NGLs) at around 12 mb/d, including
~300kb/d in the Saudi part of the Neutral zone.
The latest estimate by the IEA is 12.26 mb/d
more than half of its oil reserves are contained in eight fields in the northeast portion of
the country
More than half no less. Well hell, I cannot argue with that.
Alex, all your listed fields come to 11.75 million barrels per day. And that is more than
half. Wow! Alex, do you really believe that shit?
That does not include Berri? How could they not count Berri? Or Safah? Or any of the
other fields that would be giant fields in any other country? If you add them all up it would
likely come to at least 15 to 20 million barrels per day. Which is a joke of course. Saudi is
now producing flat out.
Alex, Ghawar can in no way produce anywhere near 5.8 million barrels per day. But then
if you believe anything that is printed on the internet then…..
If 11.75 is more than half then they likely figure around 20 million barrels per day
is possible. Yeah right!
Incidentally, the EIA agrees with Saudi Arabia on their proven reserves of 266 billion
barrels. Which says nothing other than "We take Saudi's word for everything.
Ron, I am actually rather skeptical about EIA's international statistics. Obviously, I'm not saying
that those numbers are correct.
Do you think they may have included NGLs (given that KSA produces more than 2 mb/d of NGLs)?
Alex, the EIA does have a tendency to include NGLs in their estimates. That is likely here since
Saudi is producing nowhere near what they say their their major fields are capable of.
But no one has any idea what each individual field in Saudi is producing. They have only Saudi's
word for it. Which is worth about the same as a bucket of warm spit.
The recent increase in Saudi Arabia's oil production was largely due to higher utilization
of production capacity. The last large increase in capacity was in 2009, when Khurais field capacity
was increased to 1.2 mb/d. The start of the Manifa field in 2013 and its ramp-up in 2014 largely
offset declining production at the mature fields.
Saudi Arabia's oil production and capacity (mb/d)
source: IEA (capacity), JODI (production)
I do not know the output of Ghawar, nor it's decline rate as we have no data. If the output
is 3 Mb/d, it is less of a factor than if output was 5 Mb/d. Yes there are several fields that
are grouped together and called Ghawar. All fields will decline eventually, the "might" is only
about when those declines occur. The simple illustrative model is to show what happens
when all fields don't start their decline at one moment in time. The 5 Mb/d was chosen simply
because at one time "Ghawar" supposedly produced 5 Mb/d in 2009 (according to the Wikipedia article).
What is your source for your 3 Mb/d estimate?
If we assume a 6.5% annual decline rate since 2009 we would be at 3.4 Mb/d in 2015. At
some point Saudi Arabia as a whole will begin to decline, when this will happen I do not
know. Just as in the US where there has been extensive infill drilling and secondary, tertiary
recovery methods employed and decline rates have remained under a 3% annual rate, the same is
likely to be true of other large producing nations with a combination of on shore and offshore
projects.
A lower URR oil shock model (3000 Gb including 500 Gb oil sands) still has an annual decline
rate under 2%/year.
Your analogy of the USA with Ghawar is not applicable. Aggregates of differently aged individuals
do not behave like an oversized average of those individuals. A country does not represent a basin,
a basin does not represent a field and a field does not represent an individual well.
The best analogy for Ghawar is probably Cantarell, they have both been developed with the
best available secondary and tertiary recovery methods. Cantarell production dropped like a stone
once those techniques were exhausted (about 15% per year in 2006 to 2008). My guess is Ghawar
will go (or is going) even faster as the IOR/EOR techniques and software models available for
its development are more advanced and it is onshore, making their application easier. Daqing might
go the same way. Samotlor has been declining at around 5%.
Burgan is probably the best placed of the super giants as it has natural water drive and didn't
use secondary recovery until 2010, and still not much, so there is a lot of potential to accelerate
production and arrest the decline (at the expense of rapid decline later of course). Note however
that wiki indicates 14% decline there, but with no citation so maybe just a guess.
I am comparing US with Saudi Arabia. I expect when Saudi Arabia begins to decline the annual
rate of decline will be 3% per year or less.
Cantarell was pushed much harder than Ghawar, relative to reserves and is an exceptional case.
In any case I do not know what will happen to the fields that make up Ghawar, I don't have any
data so I will not speculate any further. World output will be determined by the output of all
fields, Ghawar is important, but if Ron's estimate is correct, it is 4% of World output.
The 3000 Gb scenario above with 2500 Gb of C+C less oil sands (or extra heavy oil) and 500
Gb of extra heavy (XH) oil is based on Jean Laherrere's 2013 estimate of XH oil and a Hubbert
Linearization of C+C-XH from 1993 to 2015 in chart below.
Dennis – you state "For simplicity we will assume Ghawar produces about 5 Mb/d and that it will
decline at 3%/ year (similar to US before LTO production started from 1985-2004)", and then say
"I am comparing US with Saudi Arabia. I expect when Saudi Arabia begins to decline the annual
rate of decline will be 3% per year or less.". Which one is it, because they aren't both correct?
"Cantarell was pushed much harder than Ghawar" Please provide details of how you know this.
Thanks Techguy, that was an interesting post. I know this is probably an impossible question
but how long do you think it will take to deplete the remaining oil column? If it is correct that
it took 10 years to drop from 100 to 25 feet (assuming this is correct too) then that doesn't
bode well for future production from Ghawar over the next decade.
Much as I love Dennis' charts, I just don't see his 3% continuing very long, if Ghawar is indeed
down to a thin layer of oil over water. There could just be a clunk as the field is shut down
after a short period of steeper decline.
The next five years should tell a lot if the oil column is now that thin. 5 mbopd can't
continue forever, nor can 3% decline in a permeable reservoir under water flood. When the water
mostly reaches the top, the oil stained water becomes too expensive to separate out and production
stops at greater than a 3% rate.
There will be fields that decline more than 3% and fields that will decline less, the average
will roughly match the US decline (the most mature large oil producing nation) from 1986 to 2004
which was less than 3% per year.
Ghawar is several fields, Tech Guy's comments probably do not apply to all the fields of Ghawar.
People also seem to forget that new fields will continue to be developed and infill drilling
and EOR will continue in many fields. These factors will reduce the rate of decline for overall
World C+C output.
5. KSA is the primary driver into the turmoil in Syria. KSA is sitting on vast NatGas fields
underneath their oil fields. However, producing NatGas from these fields would cause severe Oil
production issues,
I assume you are referring to the Kluff nat gas field under lying the Ghawar oil field. I know
the Kluff field was being produced, but not sure if it was near its potential or very restricted
flow. I remember a discussion with some Exxon reservoir people, on the liquids being produced,
and how to define them. Oil or condensate. The Saudis chose condensate as they were not counted
in the export quotas at the time.
Are you saying that Kluff is in communication the Ghawar? If they were surely there would be
pressure issues in the upper field.
I believe there is communication in the water table between Burgan and Safaniya, but that is
a different issue.
It is hard to see where the production of an under lying gas field would affect an over lying
oilfield, apart from a few drilling issues of under pressure thief zones, which can be dealt with
by casing design, mud properties, and maybe even a little managed pressure drilling if required.
"Are you saying that Kluff is in communication the Ghawar? If they were surely there would
be pressure issues in the upper field."
I was just referred to what I read in Saudi Americo's tech articles. If I recall, correctly,
several fields in KSA had NatGas reserves. The article(s) I recall reading referred to delaying
production of NatGas to avoid impacting Oil production. I don't recall the exact details, and
I don't believe that the article(s) mention which fields they are delaying NatGas Production.
These Saudi Americo tech articles do not disclose which fields they are about.
Toolpush wrote:
"It is hard to see where the production of an under lying gas field would affect an over
lying oilfield, apart from a few drilling issues of under pressure thief zones"
I would image drawing down the NatGas would alter the levels were the Oil is located. Since
most of the Oil is now extracted via horizontal wells. I am speculating on how it impacts production.
Perhaps there are more details in the articles than I recall. You can read them as the are publicly
available on SA's website.
Thanks for the feedback. Do you have a link to where these reports are located?
As for gas communication. If the reservoir has a gas cap, then this gas cap can't be drawn
down without effecting the pressure in the reservoir, and therefore oil production. The fact that
most if not all the fields have water injection to maintain well bore pressure, we can assume
pressure maintenance is at a premium.
Now if as you described and I know the Kluff field conforms to this line. The gas is in a separate
trap, separated by it's own cap rock from the oil, then there can't be any communication. If there
was, the gas would ride to the high oil reservoir, and as the gas in at a greater depth than the
oil, is will also have a pressure. If this higher pressure was allowed to communicate with the
upper reservoir, then the upper reservoir would become over pressured, and this over pressure
would have been discovered in the exploration wells.
So I will be very interested to read their explanation to gas production being held back from
under lying gas reserves, rather than any gas bubbles sitting on top of the oil currently being
produced.
Regarding ToolPush Question about NatGas reserves in Oil Fields:
Yes, you have the correct link. I don't recall which article had discuss delaying natGas production
from their oil fields, I read through over a dozen their Tech Publications.
I have found where Kluff has been widely discussed, but not other gas fields, though I have
only scratched the surface. I can see I have a lot of reading to do, but I know I will learn a
lot by the time i am finished.
One little point I noticed. The unconventional gas they talk about, seems to be in carbonates!
Yet to see any shale mentioned, but i will keep going. Closer to Austin Chalk than Eagle Ford.
"... However, if there is no deal, oil could trade lower immediately. West Texas Intermediate crude futures settled just above $40 per barrel Monday, and Brent was just under $43. Blanch expects Brent to trade at around $47 per barrel this summer and above $50 at year-end. ..."
"... This is a clear and present danger, if they don't get oil prices higher. Maybe Mohammed bin Salman doesn't care, but these other GCC countries care ..."
"... If Saudi Arabia does not agree to a freeze, the prince could find himself at odds with Putin. Russia has said it would support a freeze, and it is reported to be interested in brokering a deal between Saudi Arabia and Iran ..."
"... The gambler prince has crashed the Saudi economy and is too arrogant to change course ..."
"... 30 years old = he did not earn his power and position, he inherited it. That's about the biggest slap in the face I can imagine. Knowing no one around you really respects you, and that the only reason you matter on a planet of 6 billion people is because of who your daddy is. ..."
"... House Minority Leader Nancy Pelosi on Sunday said she wants 28 redacted pages declassified from a 2003 congressional report on the intelligence community's prepaparedness for and response to the 9/11 attacks. ..."
"... Seems like a huge number of paragraphs to simply confirm the general consensus on SA's position. All wrapped up in "wild card" grabbers that mean...nothing. ..."
"... I used to pad reports in school to meet word count requirements. But I did a much better job. ..."
In a five-hour interview with Bloomberg, bin Salman recently laid out his position on a freeze
deal, saying Saudi Arabia would participate only if major producers, including Iran, also participate.
... ... ...
Iran has said it would participate in the Doha meeting this weekend, but it will not freeze production.
Iran is working to return oil to market, now that it is no longer under sanctions for its nuclear
program, and its goal is to bring back 1 million barrels in a year.
"If all countries including Iran, Russia, Venezuela, OPEC countries and all main producers freeze
production, we will be among them," bin Salman told Bloomberg. He also said that Saudi Arabia was
not threatened by the drop in oil prices. Analysts say that comment signaled a willingness to persevere
with low prices as long as it takes to end the supply glut.
... ... ...
"It's going to require creativity this week. I think the effort will be made ... you have the
Kuwaitis out there, saying 'We're going to get a deal.' You have these other GCC (Gulf Cooperation
Council) countries still holding out hope. I think they're invested in trying to get this thing done,"
said Croft. "I think what they're looking to do is close their fiscal gap ... they are all concerned
about increased borrowing costs."
... ... ...
Francisco Blanch, Bank of America Merrill Lynch's head of global commodities and derivatives research,
said he sees a slight chance Iran could agree to something, possibly a production cap just slightly
above its current 3.2 million barrels a day output.
... ... ....
"The downside risk is the Doha meeting ends up being another big disappointment, like the previous
OPEC meetings have been. There is risk of that. We know there's a proposal on the table. We know
the market has bounced somewhat on that proposal. It's also somewhat on the back of other seasonal
factors that are driving prices higher. I still think even if we get some kind of freeze agreement
and OPEC stops talking the market down, that leaves us where we are," said Blanch.
However, if there is no deal, oil could trade lower immediately.
West Texas Intermediate crude futures settled just above $40 per barrel Monday, and Brent was
just under $43. Blanch expects Brent to trade at around $47 per barrel this summer and above $50
at year-end.
... ... ...
Croft said the message from Saudi Arabia has changed, with more conciliatory comments previously
from Saudi Oil Minister Ali al-Naimi, now overshadowed by bin Salman's remarks. But Morse said Naimi
left the door open to disagree when he said the Saudis would supply any customers who are looking
for oil.
"This is a clear and present danger, if they don't get oil prices higher. Maybe Mohammed bin Salman
doesn't care, but these other GCC countries care," said Croft.
She said Russia is also looking for a deal. "I think the Russians, they're incentivized to get
this done from the standpoint of a fiscal position," she said. "Russia's been pretty adamant about
getting this done."
If Saudi Arabia does not agree to a freeze, the prince could find himself at odds with Putin.
Russia has said it would support a freeze, and it is reported to be interested in brokering a deal
between Saudi Arabia and Iran, but Morse said a deal could have come over Syria but that could
prove elusive since the Russians have pulled out of Syria.
Or... Saudi Arabia stands alone as the only holdout and Russia pushes them out of OPEC. Something
is going to happen at this meeting, because all of the other OPEC members are really hurting really
bad.
Don't assume things remain status quo. That is a huge mistake.
There you go assuming things stay status quo. Russia produces as much oil as the Saudis. If you
understand how and why OPEC was created, you will understand where I'm going with this.
xdir
The gambler prince has crashed the Saudi economy and is too arrogant to change course,
the price Saudi Arabia paid to "kill" shale has to be the biggest phyrric victory in business,
they spent around a $Trillion to hurt their competition and achieved nothing.
INSERTSCREENNAMEHERE
30 years old = he did not earn his power and position, he inherited it. That's about
the biggest slap in the face I can imagine. Knowing no one around you really respects you, and
that the only reason you matter on a planet of 6 billion people is because of who your daddy
is.
DreWhite
House Minority Leader Nancy Pelosi on Sunday said she wants 28 redacted pages
declassified from a 2003 congressional report on the intelligence community's prepaparedness
for and response to the 9/11 attacks.
Obama Under Pressure to Declassify the 9/11 Report's Secret 28 Pages
The 28 pages are believed to expose a number of links between various officials in Saudi
Arabia and the 9/11 hijackers
I wonder if Obama will bow before the King again.....hmmm
Andylit
Seems like a huge number of paragraphs to simply confirm the general consensus on SA's
position. All wrapped up in "wild card" grabbers that mean...nothing.
I used to pad reports in school to meet word count requirements. But I did a much better
job.
…..Why would a price spike above $40 be a bad thing for Saudi Arabia?
Because it would provide a life support to American frackers who have undermined the pricing
power of the Kingdom these days, as was discussed in a previous piece here.
But there's another, more important problem: high crude prices can help Russia and Iran raise
the funds they need to support insurgent movements that threaten the Kingdom's regime………
Saudi Arabia and Russia are by no means at the end of their finances as can be seen from their
still unabated drilling activity, buying refineries in the US, investing in Europe…:
Heinrich, your assertion that I am trying to prevent people from expressing their opinion is insulting
as well as misplaced. I did nothing of the sort. Also, I certainly don't consider Forbes to be
good company on pretty much any subject. SA's foreign exchange reserves dropped from about $740
billion in Oct 2014 to about $590 billion today, having dropped $9 billion in February alone.
I'm not saying they are on the ropes yet, but the Kingdom is scaling back on social welfare payments.
They are running a massive budget deficit. Anyone who thinks this is part of some brilliant strategy
is misguided.
Your assertion that unabated drilling activity is a sign of financial strength is not supported
by the link you provided. That's about investing in LNG facilities. What does that have to do
with oil production?
…..Why would a price spike above $40 be a bad thing for Saudi Arabia?
Because it would provide a life support to American frackers who have undermined the pricing
power of the Kingdom these days, as was discussed in a previous piece here.
The predatory pricing initiated by KSA in mid 2014 was not directed against the USA frackers and
in no way directed at establishing $30-40 per barrel price band. They viewed US frackers as a
useful balancing mechanism (and this was stressed several times by high level Saudi officials),
that allow to establish and maintain $70-$80 or so price range. and that probably was their initial
intention. But they quickly lost control to Wall Street, which has other plans.
And they think that this price range is also OK for the world economy. I can't find quotes
now but there were such quotes by Saudi oil minister.
Looks more like while they initialed the price slump, they were quickly taken for a ride by
"paper oil producers", who promptly assume control and drove the price to the current price band.
And intend to maintain it as long as possible (look at all "low oil price forever" propaganda
in Western MSM).
That's why Saudis were forced to ally with Russia in "freezing production" scheme.
"... I don't get Dennis' contention that only an outside event such as a world
war can create a Seneca cliff. Of course, a definition of what comprises a Seneca
cliff would be useful. Let's get away from that and just talk about what rate of
decline in oil production would be sufficient to throw the world into a tizzy. I
think something as low as 3% annually would be enough. After a few years at that
rate we would be in a bad situation. Doesn't require a huge drop. ..."
"... I believe we have entered the end game. ..."
"... Geology – drillers need prospects and as more and more fields go dry they
aren't going to drill them again. It took $100 oil to get Bakken going, I think
it will take even more than that as sweet spots are tapped out. And once oil gets
to that level, the economy will push demand back down. ..."
"... It's hard for me to imagine money flowing back into drilling the way it
did in the past few years. Wall Street follows fads and the tight oil fad has run
its course. There will still be money for selected investments, but the terms will
be tougher, the scrutiny will be greater, and the opportunities fewer. ..."
"... Exactly. "Carpet drilling" can't return without return of "loan abundance"
regime. And the latter is gone for good. The trend in production is not their friend
anymore. As Arthur Berman said "EIA forecasts that [natural] gas prices will increase
to $3.31 by the end of 2017 but that is overly conservative because it assumes an
immediate and improbable return to production growth once the supply deficit and
higher prices are established. " ..."
"... The same thinking is applicable to subprime oil. ..."
Also, I don't get Dennis' contention that only an outside event such
as a world war can create a Seneca cliff. Of course, a definition of what
comprises a Seneca cliff would be useful. Let's get away from that and just
talk about what rate of decline in oil production would be sufficient to
throw the world into a tizzy. I think something as low as 3% annually would
be enough. After a few years at that rate we would be in a bad situation.
Doesn't require a huge drop.
And with rig counts declining as fast as they are, I could imagine such
a drop. And furthermore, I don't see the rigs coming back as quickly as
they are being dropped even if prices do recover to the $100 level.
I can't see any compelling that drilling wouldn't pick up quickly again
if oil went back to a hundred bucks and supplies got chancy with inventories
declining fast.
The biggest two problems would be the hands on guys retiring, but enough
money will entice them to work again, if not actually pulling levers and
turning wrenches, then standing over trainees, one on one if necessary.
The other thing would be the money. In a real pinch, governments will provide
emergency financing or loan guarantees to drillers and steam roller some
environmental regs.
But I do think peak oil is either here now, or will be here within the
next two or three years.
It might take a while for exploratory drilling to pick up again, I am
thinking about new wells in producing fields and fields already explored
but not yet well developed.
Drilling will increase at higher prices, no argument there. But I don't
see rig counts going up as fast as they are now coming down. Two reasons:
1. Geology – drillers need prospects and as more and more fields
go dry they aren't going to drill them again. It took $100 oil to get Bakken
going, I think it will take even more than that as sweet spots are tapped
out. And once oil gets to that level, the economy will push demand back
down.
2. Finances – It's hard for me to imagine money flowing back into
drilling the way it did in the past few years. Wall Street follows fads
and the tight oil fad has run its course. There will still be money for
selected investments, but the terms will be tougher, the scrutiny will be
greater, and the opportunities fewer.
There will still be money for selected investments, but the terms
will be tougher, the scrutiny will be greater, and the opportunities
fewer.
Exactly. "Carpet drilling" can't return without return of "loan abundance"
regime. And the latter is gone for good. The trend in production is not
their friend anymore. As Arthur Berman said "EIA forecasts that [natural]
gas prices will increase to $3.31 by the end of 2017 but that is overly
conservative because it assumes an immediate and improbable return to production
growth once the supply deficit and higher prices are established. "
"... Looks like this is what the West wants Russia to want, not what Russia wants :-). I think in reality Russia wants $80 or higher, but with capex reduced most Russian oil companies for some short period might be content with $50-$60 range. ..."
"... If we are talking about a fair price of oil globally, I believe this is $80 per barrel. Keep in mind that a significant part of oil – about a third – is produced offshore, where the cost can be high. And there is a deep-water shelf, for example, in Brazil, where one of the first well cost more than $300 million. Subsequent wells would of course cost less, around the half the price, but still very expensive. ..."
Russia and Saudi Arabia gave signals that they want to have a price of no more than USD 45
per barrel as this prevents high cost oil to gain market share for some time.
Thus, Saudi Arabia prefers to export 10 mill bbl/d at USD 45 per barrel rather than 5 mill
bbl/d at USD 90 per barrel. Saudi Arabia has still 2 mill bbl/d as reserve capacity, which will
take some time to come to the market, yet I think the Saudis are ready to use this. USD 45 per
barrel is a comfortable price for Saudi Arabia and Russia.
As a conclusion, it could take – depending on the Saudis – a long time until prices can go
up again, which is clearly a disadvantage for shale. It is now up to the shale production to reduce
capacity and bring prices up again.
Russia and Saudi Arabia gave signals that they want to have a price of no more than USD
45 per barrel as this prevents high cost oil to gain market share for some time.
Looks like this is what the West wants Russia to want, not what Russia wants :-). I think
in reality Russia wants $80 or higher, but with capex reduced most Russian oil companies for some
short period might be content with $50-$60 range. See interview of the President of the Union
of oil and gas Industrialists of Russia Gennady Shmal (
http://peakoilbarrel.com/open-thread-petroleum-oil-natural-gas/#comment-565010 ):
A: If we are talking about a fair price of oil globally, I believe this is $80 per barrel.
Keep in mind that a significant part of oil – about a third – is produced offshore, where the
cost can be high. And there is a deep-water shelf, for example, in Brazil, where one of the
first well cost more than $300 million. Subsequent wells would of course cost less, around
the half the price, but still very expensive. Therefore, the capex of this oil extraction
is high enough. The breakeven price of our oil production without taxes is around $10 per barrel,
nationally. But when we include taxes, we get around $30 per barrel. But this cost is not no
tragedy for us. I remember a time when a barrel of oil was less than $10. Then we dreamed about
the price rising to $20.
When the three-year average cost of oil was above $100 per barrel, we got too used to it.
But the high price has one big drawback – it can negatively affect demand and stimulates production.
And that's what basically happened.
Therefore, now our oil companies might be now content with the price around $50-60 per barrel.
And I think in general, globally it would be OK price for both producers and consumers.
Even for the United States that would be an acceptable price. Canadians with their oil sands
would need a higher price – up to $80. But as the Canadian oil going to the United States,
anyway, losses can be compensated with the domestic shale production and they would have to
come to a common denominator.
I have to laugh at the argument that today's low oil prices are something Saudi Arabia wants in
order to (1) punish LTO producers in the U.S or (2) punish Russia or (3) punish other OPEC producers
or (4) punish (insert country name here). There is no way SA wants low prices and their economy
is suffering. They are burning through their foreign reserves. So why are the continuing to produce
flat out as Ron insightfully informs us?
Because they have no choice! They need every dollar they can get and they don't control the
price of oil. If they export less the price of oil will go up somewhat, of course, but not enough
to increase their net take. In other words, their profitability would go up but their total profit
would decrease.
Now it's true that SA has made statements that make it look like this is part of some strategy,
but I believe that is all just public relations. Putting lipstick on a pig, if you will (apologies
to Muslim readers). If prices remain low we could be looking at some big time internal and regional
disruption as poor Saudi's (and there are lots of them) become desperate and the privileged Saud
class finds their standard of living declining. Saudi Arabia has been a pillar of stability (yes,
repressive stability) in the mid east for decades. If that changes many bad things could happen.
But please, stop with the talk that SA wants low oil prices.
If KSA cut production by 3 million barrels per day (for example), I'd bet my life savings that
oil prices would at least double to say 70 or even 80 USD per barrel – and I think that is being
conservative. That cut would totally eliminate the current rate of oversupply.
That sacrifice would reduce their volume of oil exported by about 30%, but revenue from that
oil would double – with that production providing greater profit margins as well for the same
given revenue.
I don't think it is accurate to say that a) they couldn't control the price of oil at least
directionally, and b) that their total profit would decrease – it simply wouldn't, it would increase.
How else did OPEC work in the past if that was not the case?
Well, you can make your bet and I'd make mine. When I say control the price of oil I mean CONTROL
the price - not just influence it. Any producer can influence the price at some marginal level.
But Saudi Arabia is seen by many as holding the key to world prices. So your assertion is that
KSA could cut back and increase the price sufficiently to more than make up for the lost exports.
So why aren't they? To hurt the US frackers? To hurt Russia? To hurt Iran? I just don't but it.
They are burning through their foreign exchange reserves at a blistering pace. And if they someday
decide to cut production and increase world prices, won't that just bring back the other producers?
It's all my opinion, of course, and we are all entitled to one, but I don't see how KSA is
operating on some kind of brilliant strategy.
I have to laugh at the argument that today's low oil prices are
something Saudi Arabia wants in order to (1) punish LTO producers in the U.S or (2) punish Russia
or (3) punish other OPEC producers or (4) punish (insert contry name here). There is no way SA
wants low prices and their economy is suffering. They are burning through their foreign reserves.
So why are the continuing to produce flat out as Ron insightfully informs us?
KSA used predatory pricing to drive down oil prices. This is undisputable. It takes two for
tango and they were supported by growth of US shale production and the heavy artillery of the
USA MSM claiming "Oh my God, oil glut, oil glut !" as well as disingenuous statistics from EIA
and IEA (both controlled by the same people).
It looks that oil glut did occurred, mainly due to condensate overproduction for the second
half of 2014 and the first half of 2015 and this fact was used to drive oil prices from over $100
to below $30 or three times. Wall Street guys are called "masters of the universe" for a reason.
That put most oil producing nations in a very precarious situation with several countries balancing
of the wedge of bankruptcies. This also was equivalent to huge monetary stimulus for the Western
and Asian economies. For the USA it was equivalent to the continuation of the Fed stimulus program.
Probably around 600 billion per year worldwide were redistributed from oil producing nations
to oil consuming nations.
KSA actions also created tensions between two groups of OPEC nations - Gulf monarchies and
everybody else to the extent that OPEC now exists only formally (not withstanding that cheating
OPEC quotas was widespread practice even before).
In February the situation looked really grim for oil producing nations and Russians became
really concerned that Wall Street manipulators (aka paper oil producers) will manage to drive
oil to $20 (you can almost sense the level of panic in Sechin speech in London
http://www.rosneft.com/attach/0/57/51/pdf_10022016_en.pdf
)
Our message about the gap between the financial instruments of the oil market which, in
fact, determine the prices and specifics of the actual industry development has been clearly
confirmed. The financial market observes its own interests, and they are often abstracted from
the problems of sustainable development of the industry. In this market, prices can both fall
to the "bottom" where any development or stable functioning are impossible, and climb to unreasonably
high levels.
Financial players have tools that allow them making profit on both rise and fall in prices.
Today, the financial technique implies that decisions are often made by robots at the trading
platforms, and the programs managed by them impersonally respond instantly to such short-term
changes of the situation or information on the oil reserves movements;
Link of the price dynamics with the parameters of production is primarily important to the
producers who have a long-term horizon of decision-making, investment and implementation of
major projects, and the consumers who are also interested in predictability. In the past year,
we saw developments in which producers were split up, and some of them announced a "price war"
setting up a mission to oust "ineffective" suppliers from the market and take their place at
the market, in fact, this price war should have determined who is "ineffective".
In these circumstances, it is quite expected that the financial market players went bears
while the related (if not affiliated) think tanks helpfully prompted lower and lower price
benchmarks to the market.
Who was the main beneficiary of the current crisis? Apparently, not consumers because the
retail prices fell by less than 20% on average, but rather financial players who, by the way,
have not redirected $250-300 bln investments released from oil sector into projects in other
sectors of the economy so far.
Slide 5. Explosive growth of shale oil production in the US in 2013-2014 ceased in 2015
As we know, the explosive growth of shale production in the US in 2013-2014 became another
crucial factor, and even the "trigger" of the crisis.
In 2013-2014, this growth was probably unprecedented in the world history in terms of its
scale and pace. We have already noted that this reflected the advantage of the developed
US market with its financial instruments (large-scale hedging of risks, availability of cheap
investment, propensity of investors to take prompt decisions, use of land pledge and encumbrances,
etc.), and its capacities in drilling, service and transportation.
In late 2014, some of the leading oil producers from the Middle East followed the example
of the US strategy in increasing oil production.
As the result, the problems of excess oil on the market, long-time decline in oil prices,
falloff in capacity of commercial shale oil production in the US have become worse.
Slide 6. OPEC actions gave backing to imbalance in the oil market
There is every reason to believe that these producers have deliberately created and continue
to maintain a surplus of supply over demand claiming their commitment to the policy of low
prices. The consequences of this policy, even if it is changed or adjusted, will have affect
for a certain time.
Slide 7. Positions of major speculators in the oil futures markets
We have to admit we underestimated the fact that the financial market players have no restrictions
in dealing with their sheer financial objectives and are ready to "test" any price levels –
for example, 27$ in January – down to $10 per barrel as it was recently announced by a reputable
investment structure. What is it if not "an invitation to the irresponsible game" for an unlimited
price drop?
That's why all those talks about freeze started in February - this was a meek attempt of damage
control of KSA reckless gambit from which other oil producing nations suffered greatly (and Saudis
decided to get on board of this initiative for a simple reason that events got out of control
and they also feel really threatened by the possibility of $20 oil).
The most interesting is the fact that Saudis cooperated with Russia (whom they consider their
enemy). Russia in turn decided to cooperate with KSA not out of good will toward KSA. They consider
Wahhabism a mortal threat for Russia and you can get in jail if you just get Wahhabi literature
in Russia, to say nothing about openly declaring yourself to be adherent of this dominant in KSA
sect (it is considered to be criminal organization in Russia). That tells us something about the
precarious situation in which oil producing nations has found themselves in February.
In any case, in February it looked like oil producing nations will be taken for a ride by Wall
Street for 2016 and probably 2017. And financially raped.
That's why this freeze agreement was announced and it helped to push prices slightly higher
even before it full ratification which might occur in late April despite all the efforts by the
West to torpedo the agreement (and somewhat duplicitous behavior of Iran, which it seems does
not understand that producing 4 Mb/day at $30 is equivalent to producing 2 Mb/d at $60).
Russia also launched a national program of development of their petrochemical industry which
will eventually reduce the amount of oil available for export, even if production remains flat.
Saudis did the same and actually on much larger scale. So their internal consumption will be
rising faster then their production capacities.
To get out this KSA induced fiasco with oil prices this cocky and impulsive new Saudi prince
is now trying to save his butt pretending to be Margaret Thatcher of Saudi Arabia. He is trying
to launch the program of privatization of state assets including part of Aramco to lessen the
draw of foreign reserves due to budget deficit (currently around $100 billion a year; KAS needs
around $90 per barrel to balance the budget; Russia needs around $60).
So either with gentle encouragement of Obamoids or on their own initiative this new prince
( who actually rules the county instead of his father king who is suffering from dementia ) essentially
destroyed around one third of the country foreign reserves, engaged in destructive war in Yemen,
deteriorated relations with the major geopolitical rivals such as Iran (via war in Yemen and the
execution of Shiite cleric) and Russia (by supporting and financing (indirectly) Syria jihadists)
and got nothing in return.
Moreover he managed even to cool relations with the USA - the major beneficiary of his actions.
That clearly demonstrates the grave danger inherent in absolute monarchy - a lot depends on
the man at the top.
…..Why would a price spike above $40 be a bad thing for Saudi Arabia?
Because it would provide a life support to American frackers who have undermined the pricing
power of the Kingdom these days, as was discussed in a previous piece here.
But there's another, more important problem: high crude prices can help Russia and Iran raise
the funds they need to support insurgent movements that threaten the Kingdom's regime………
Saudi Arabia and Russia are by no means at the end of their finances as can be seen from their
still unabated drilling activity, buying refineries in the US, investing in Europe…:
Heinrich, your assertion that I am trying to prevent people from expressing their opinion is insulting
as well as misplaced. I did nothing of the sort. Also, I certainly don't consider Forbes to be
good company on pretty much any subject. SA's foreign exchange reserves dropped from about $740
billion in Oct 2014 to about $590 billion today, having dropped $9 billion in February alone.
I'm not saying they are on the ropes yet, but the Kingdom is scaling back on social welfare payments.
They are running a massive budget deficit. Anyone who thinks this is part of some brilliant strategy
is misguided.
Your assertion that unabated drilling activity is a sign of financial strength is not supported
by the link you provided. That's about investing in LNG facilities. What does that have to do
with oil production?
"... This is a typical Bloomberg "low oil price forever" propaganda trick. BTW Saudi Arabia produced on average 11.6 million bbl/d of total petroleum liquids in 2013. ..."
"... The question is who and when in Aramco said that (taking into account their growing depletion rate and changes in quality of extracted oil - trend toward producing more of heavy oil) ? And what will be NGL share in this new production? Actually oil is only 9.5 of 10 Mb/d total KSA CC+NLG production ..."
"... There are currently no plans to increase oil production capacity. Saudi Arabia's long-term goal is to further develop its lighter crude oil potential and maintain current levels of production by offsetting declines in mature fields with newer fields. ..."
"…State-owned Saudi Aramco says this will let it ease pumping from older fields yet maintain a
production capacity of more than 12 million barrels per day, 2 million barrels above its current
rate.
For Kuwait and the U.A.E., the goals are even higher. Kuwait plans to raise production capacity
by 5 percent from 3 million barrels a day by the third quarter, and to reach 4 million barrels
by 2020. Abu Dhabi means to lift production capacity to 3.5 million barrels a day by 2017 from
about 3 million."
"…State-owned Saudi Aramco says this will let it ease pumping from older fields yet maintain
a production capacity of more than 12 million barrels per day, 2 million barrels above its current
rate.
This is a typical Bloomberg "low oil price forever" propaganda trick. BTW Saudi Arabia produced
on average 11.6 million bbl/d of total petroleum liquids in 2013.
The question is who and when in Aramco said that (taking into account their growing depletion
rate and changes in quality of extracted oil - trend toward producing more of heavy oil) ? And
what will be NGL share in this new production? Actually oil is only 9.5 of 10 Mb/d total KSA CC+NLG
production now:
http://www.saudiaramco.com/en/home/about/key-facts-and-figures.html
Production and reserves
•Recoverable Crude Oil & Condensate (billions of barrels): 261.1
•Recoverable Gas (Associated and Nonassociated) (trillions of standard cubic feet): 294.0
•Crude Oil Production (annual/billions of barrels): 3.5; (daily/millions of barrels): 9.5
•Crude Oil Exports (millions of barrels): 2,544
•Delivered Sales Gas and Ethane Gas (trillions of standard cubic feet): 4.1; (trillions of
Btu, British thermal unit per day) Sales Gas: 8.4; Ethane Gas: 1.4
•NGL from Hydrocarbon Gases (millions of barrels): 471.3
•Raw Gas to Gas Plants (billions of standard cubic feet per day): 11.3, up 3% compared to 2013
•Refined Products Production (millions of barrels): 561
•Refined Products Exports (millions of barrels): 168
According to EIA Saudi Arabia consumed 2.9 million barrels per day (bbl/d) of oil in 2013,
almost double the consumption in 2000 (in three years). Chief Executive Officer of Saudi Aramco,
Khalid al-Falih, said that domestic liquids demand was on pace to reach more than 8 million bbl/d
of oil equivalent by 2030 if there were no improvements in energy efficiency.
There are currently no plans to increase oil production capacity. Saudi Arabia's long-term
goal is to further develop its lighter crude oil potential and maintain current levels of production
by offsetting declines in mature fields with newer fields.
There are too few new projects being sanctioned by non-state oil companies to offset the
inevitable decline in output from existing fields and to meet additional demand. This is expected
to increase by 1.2 million barrels a day each year for the rest of the decade. New fields due to
start producing this year and next are the result of investment decisions taken when oil was
about $100 and expected to stay there.
The collapse in company spending is illustrated perfectly by the level of drilling activity.
After all, if you don't drill, you can't get the oil out of the ground.
Baker Hughes updated its monthly international drilling statistics last week. Unsurprisingly,
they showed another steep drop in rigs drilling for oil, a 12 percent decline between February
and March. There were 1,551 rigs active last month in the countries covered by Baker Hughes, the
least since September 1999 and down nearly 60 percent in little more than a year.
"... Refiners are already complaining that so-called "blended crudes" contain too much lease condensate, and they are seeking out better crudes straight from the wellhead. Brown has dubbed all of this the great condensate con. ..."
"... Exactly how much of America's and the world's presumed crude oil production is actually condensate remains a mystery. The data just aren't sufficient to separate condensate production from crude oil in most instances. ..."
"... Brown explains: "My premise is that U.S. (and probably global) refiners hit in late 2014 the upper limit of the volume of condensate that they could process" and still maintain the product mix they want to produce. That would imply that condensate inventories have been building faster than crude inventories and that the condensate is looking for an outlet. ..."
"... Brown believes that worldwide production of condensate "accounts for virtually all of the post-2005 increase in C+C [crude plus condensate] production." What this implies is that almost all of the 4 million-barrel-per-day increase in world "oil" production from 2005 through 2014 may actually be lease condensate. And that would mean crude oil production proper has been nearly flat during this period--a conjecture supported by record and near record average daily prices for crude oil from 2011 through 2014 . Only when demand softened in late 2014 did prices begin to drop. ..."
"... "Oil traders are acting on fundamentally flawed data," Brown told me by phone. Often a contrarian, Brown added: "The time to invest is when there's blood in the streets. And, there's blood in the streets." ..."
"... He explained: "Who of us in January of 2014 believed that prices would be below $30 in January of 2016? If the conventional wisdom was wrong in 2014, maybe it's similarly wrong in 2016" that prices will remain low for a long time. ..."
"... Brown points out that it took trillions of dollars of investment from 2005 through today just to maintain what he believes is almost flat production in oil. With oil companies slashing exploration budgets in the face of low oil prices and production declining at an estimated 4.5 and 6.7 percent per year for existing wells worldwide, a recovery in oil demand might push oil prices much higher very quickly. ..."
lease condensate which
gets carelessly lumped in with crude oil? And, why is this important to understanding the true state
of world oil supplies?
In order to answer these questions we need to get some preliminaries out of the way.
Lease condensate consists of very light hydrocarbons which condense from gaseous into liquid form
when they leave the high pressure of oil reservoirs and exit through the top of an oil well. This
condensate is less dense than oil and can interfere with optimal refining if too much is mixed with
actual crude oil. The oil industry's own engineers classify oil as hydrocarbons having an API gravity
of less than 45--the higher the number, the lower the density and the "lighter" the substance.
Lease condensate
is defined as hydrocarbons having an API gravity between 45 and 70. (For a good discussion about
condensates and their place in the marketplace, read
"Neither Fish nor Fowl – Condensates Muscle in on NGL and Crude Markets.")
Brown points out that U.S. net crude oil imports for December 2015 grew from the previous December,
according to the
U.S. Energy Information Administration (EIA), the statistical arm of the U.S. Department of Energy.
U.S. statistics for crude oil imports include condensate, but don't break out condensate separately.
Brown believes that with America already awash in condensate, almost all of those imports must have
been crude oil proper.
Brown asks, "Why would refiners continue to import large--and increasing--volumes of actual crude
oil, if they didn't have to--even as we saw a huge build in [U.S.] C+C [crude oil plus condensate]
inventories?"
Part of the answer is that U.S. production of crude oil has been
declining since mid-2015. But another part of the answer is that what the EIA calls crude oil
is actually crude plus lease condensate. With huge new amounts of lease condensate coming from America's
condensate-rich tight oil fields--the ones tapped by hydraulic fracturing or fracking--the United
States isn't producing quite as much actual crude oil as the raw numbers would lead us to believe.
This EIA chart
breaking down the API gravity of U.S. crude production supports this view.
Exactly how much of America's and the world's presumed crude oil production is actually condensate
remains a mystery. The data just aren't sufficient to separate condensate production from crude oil
in most instances.
Brown explains: "My premise is that U.S. (and probably global) refiners hit in late 2014 the
upper limit of the volume of condensate that they could process" and still maintain the product mix
they want to produce. That would imply that condensate inventories have been building faster than
crude inventories and that the condensate is looking for an outlet.
That outlet has been in blended crudes, that is heavier crude oil that is blended with condensates
to make it lighter and therefore something that fits the definition of light crude. Light crude is
generally easier to refine and thus more valuable.
Trouble is, the blends lack the characteristics of nonblended crudes of comparable density (that
is, the same API gravity), and refiners are discovering to their chagrin that the mix of products
they can get out of blended crudes isn't what they expect.
Here it is worth mentioning that when oil companies talk about the price of oil, they are referring
to the price quoted on popular futures exchanges--prices which reflect only the price of crude oil
itself. The exchanges do not allow other products such as condensates to be mixed with the oil that
is delivered to holders of exchange contracts. But when oil companies (and governments) talk about
oil supply, they include all sorts of things that cannot be sold as oil on the world market including
biofuels, refinery gains and natural gas plant liquids as well as lease condensate.
Which leads to a simple rule coined by Brown: If what you're selling cannot be sold on the world
market as crude oil, then it's not crude oil.
The glut that developed in 2015 may ultimately be tied to some increases in actual, honest-to-god
crude oil production. The accepted story from 2005 through 2014 has been that crude oil production
has been growing, albeit at a significantly slower rate than the previous nine-year period--15.7
percent from 1996 through 2005 versus 5.4 percent from 2005 through 2014 according to the EIA.
If Brown is right, we have all been victims of the great condensate con which has lulled the world
into a sense of complacency with regard to actual oil supplies--supplies he believes have been barely
growing or stagnant since 2005.
"Oil traders are acting on fundamentally flawed data," Brown told me by phone. Often a contrarian,
Brown added: "The time to invest is when there's blood in the streets. And, there's blood in the
streets."
He explained: "Who of us in January of 2014 believed that prices would be below $30 in January
of 2016? If the conventional wisdom was wrong in 2014, maybe it's similarly wrong in 2016" that prices
will remain low for a long time.
Brown points out that it took trillions of dollars of investment from 2005 through today just
to maintain what he believes is almost flat production in oil. With oil companies slashing exploration
budgets in the face of low oil prices and production declining at an estimated
4.5 and 6.7 percent per year for existing wells worldwide, a recovery in oil demand might push
oil prices much higher very quickly.
That possibility is being obscured by the supposed rise in crude oil production in recent years
that may just turn out to be an artifact of the great condensate con.
"... Looks like China is importing a lot of oil as there is also a traffic jam in Qingdao, China. ..."
"... A surge in oil buying by China's newest crude importers has created delays of up to a month for vessels to offload cargoes at Qingdao port, imposing costly fees and complicating efforts to sell to the world's hottest new buyers. ..."
"... China's independent refiners, freed of government constraints after securing permission to import just last year, have gorged on plentiful low-cost crude in 2016. This has created delays for tankers that have quadrupled to between 20 to 30 days at Qingdao port in Shandong province, the key import hub for the plants, known as teapots, according to port agents and ship-tracking data. ..."
China has recently allowed imports of crude oil by small independent "teapot"
refineries. So tanker jams do not necessarily mean an increase in final
demand.
From Reuters:
China teapot refiner oil buying spree creates tanker jam at Qingdao
A surge in oil buying by China's newest crude importers has created
delays of up to a month for vessels to offload cargoes at Qingdao port,
imposing costly fees and complicating efforts to sell to the world's hottest
new buyers.
China's independent refiners, freed of government constraints after
securing permission to import just last year, have gorged on plentiful low-cost
crude in 2016. This has created delays for tankers that have quadrupled
to between 20 to 30 days at Qingdao port in Shandong province, the key import
hub for the plants, known as teapots, according to port agents and ship-tracking
data.
Moscow isn't sowing Middle East chaos to drive up oil prices.
Russia's leaders certainly do care about oil prices, and with good reason. Plunging oil prices
decrease the ruble's value, which closely follows oil prices. Oil exports are important to Russia's
federal budget and to its overall balance of trade. Indeed, when monthly average Brent oil prices
peaked at about $125 per barrel in March 2012, the ruble was close to its own peak, at approximately
twenty-nine rubles to every U.S. dollar. When Brent prices fell to $30.70 per barrel in January 2016,
the ruble had fallen to about eighty rubles to the dollar. It is easy to examine this currency-resource
correlation by comparing U.S. Energy Information Administration oil price data with Russian Central
Bank ruble values. As a result, the Russian government has imposed sweeping budget cuts that will
now affect defense expenditures as well as social programs and other areas.
... ... ...
On the contrary, Russia has been working with Riyadh to contain prices and announcing a withdrawal
from Syria and a new focus on peace talks there. If Russia were determined to play the oil card,
it could do so in many different ways. For example, one option might be to step up support for Assad's
government to win a comprehensive military victory over its foes. If Russia looked seriously at this
option, the changing conditions could draw Saudi Arabia and other supporters of the Syrian opposition
more deeply into the conflict and perhaps expand it. This is much more likely to raise oil prices
than what Moscow has done in the past. But Syria is not a major oil producer or exporter. So perhaps
Russia's policy in Syria is not oil centric, but its approach to other problems could. Unfortunately,
there is not much evidence to support this argument either.
One of the strongest counterarguments to the oil-price theory of Russian foreign policy is
the recent Iran nuclear agreement, known as the Joint Comprehensive Plan of Action (JPCOA). If higher
oil prices were Russia's principal goal in dealing with Iran-which has the world's fourth-largest
proven oil reserves-why facilitate the JPCOA at all? It would be far better to block the agreement
in hopes of forcing a showdown between Washington and Tehran, possibly including U.S. military action.
Alternatively, Russia could have agreed to Western proposals to tighten sanctions on Iran's
energy sector, further limiting oil supplies. Or Moscow could have delayed the talks, hoping that
this would create sufficient uncertainty to raise oil prices. Instead, at a time when Russia was
already suffering economically from low oil prices and from Western economic sanctions, President
Vladimir Putin decided to support an agreement that would only further decrease oil prices.
... ... ...
...Russia did much less to oppose U.S. and NATO air strikes in Libya in 2011-so maybe this proves
that Moscow wanted disorder there to increase oil prices? It doesn't look that way. First, then-president
Dmitry Medvedev agreed to accept the strikes after intense pressure from President Obama and appeared
to do so in large part to appease the United States. Second-perhaps more importantly-then-prime minister
Putin criticized Medvedev's decision to order Russian diplomats to abstain in United Nations Security
Council vote, prompting a rebuke from Medvedev. Since Putin has been controlling Russian foreign
policy for most of the last sixteen years, Medvedev's move was likely an exception rather than the
rule. Finally, oil prices were already quite high in early 2011 when Medvedev made his choice. Even
if moving oil prices upward was a top priority in Russian foreign policy, it would have been much
less necessary at this specific time.
While oil prices are important for Russia, they are generally not a driving factor of Russian
leaders' key decisions. Thus, Russia does seek to shape oil prices, but does so through routine diplomatic
processes. There are many reasons for this, but one of the most significant is that Russia sees
critical national-security interests in the Middle East that override its concerns over oil prices.
In fact, in each of the above cases-Syria, Iran and Iraq-President Putin has pursued policies that
appear intended to produce stability. So Russia's supposed secret plans to boost oil prices
may produce entertaining conversation, but they don't lead to much else.
Paul J. Saunders is Executive Director at the Center for the National Interest and a Research
Scientist at CNA Corporation.
Borgþór Jónsson > Guest
You are correct,except the US wars are not so secret.
They are there for everyone to see.
Sinbad2 > Borgþór Jónsson
Americans don't see their wars. The US Government keeps the American people in a cocoon of
ignorance.
O_Pinion > Guest
Who needs secret wars when you can have secret bank accounts?
So the US fracking oil boom never happened, iraq's oil output didn't increase to an all time
high, there are no macroeconomic forces cooling demand and the law of supply and demand is a fiction.
it is all simply a grand conspiracy cooked up by Saudi Arabia and the US.
Serge Krieger > Sinbad2
It is very complex topic. I think too many things came together to create this perfect
storm. Frankly, new oil reserves are not profitable at anything below $70.
I guess it was both market overproduction with Canadian sands and US fracking and Saudis and
possibly even Russian oil production that caused this. I do not think Saudis alone would be capable
of such fit.
Sensible analysis, its much more likely Russia is just preparing the way to make sure it doesn't
end up with an American boot stamping on its face forever.
Because of this Russia is in the cross hairs of the Anglo-Zionists who can only survive if they
tear apart Russia and take control of its vast resources.
China and the US who are the 2 biggest purchasers of energy in the world, have been doubling
their investments in renewable energy!
Castlerock58
The US,Turkey and Saudi Arabia are promoting the instability in the Middle East.
Bankotsu
"Moscow isn't sowing Middle East chaos...."
I think the writer confused Russia with U.S.
Pacemaker4
Russia oil and gas industry accounts for 15% of their GDP.... that fact is lost on the
author.
Kalinin Yuri > HotelQuebec
All the vessels in the ocean instead of Diesel should use some nuclear reactors, right? The
trucks that move all the goods - also batteries? Has anybody calculated emissions from power
stations in order to charge a car that runs 80 km? Also how much does it cost to recycle the
batteries?
Sinbad2 > Kalinin Yuri
The silicon used in solar panels, is one of the dirtiest refining processes on the planet.
Hippies are well meaning critters, but not very smart.
Gregory Anbreit
Oh wow, so it was Russia who started all the chaos in the Middle East? Is this a joke? Who
invaded Iraq in 2003? Who has destroyed Libya? Who was supporting "Arab springs"? Who sends
weapons to AQ and ISIS in Syria?
But yeah, blame Russia.....how typical.
deadman449
Russia exports two things. Oil and weapons. If you think about it, it makes sense to cause
mischief in other countries near oil production. Question is, then why is the oil price so
low?
Andre
If Russia really wanted to use conflict to raise oil prices and achieve irridentist
ambitions at the same time, it would launch a Crimean/Donbas-type dirty war in northern
Kazakhstan with a view to annexing the Russian-inhabited areas. Kazakhstan occupies a similar
position with respect to oil production as Libya did in 2011 and its cost of production is not
too much more than many Gulf Arab states. Kazakhstan is also non-aligned and quite frankly
indefensible. From a geopolitical standpoint I see this move as much more likely than some
dangerous play in the Baltics which would yield little in terms of added Russian citizens or
resources.
Andre
If Russia really wanted to use conflict to raise oil prices and achieve irridentist ambitions at
the same time, it would launch a Crimean/Donbas-type dirty war in northern Kazakhstan with a view
to annexing the Russian-inhabited areas. Kazakhstan occupies a similar position with respect to
oil production as Libya did in 2011 and its cost of production is not too much more than many
Gulf Arab states. Kazakhstan is also non-aligned and quite frankly indefensible. From a
geopolitical standpoint I see this move as much more likely than some dangerous play in the
Baltics which would yield little in terms of added Russian citizens or resources.
Roman Lvovskiy > Andre
you're like Tom Clancy reborn, honestly
Andre > Roman Lvovskiy
Tom Clancy was remarkably prescient among techno-thriller writers, although some works were much
better than others, particularly "The Hunt for Red October", "Red Storm Rising" and "SSN".
You may consider my opinions fanciful, but look at the academic debate: there is an assumption
that Russian military intervention in Georgia and Ukraine poses a threat to NATO, and that the
Syrian adventure merely compounds this.
In comparison, I maintain the view that while Putin can be reckless - a common human flaw - his
aggression has been highly targeted to interests that have been articulated for many years,
including prior to his presidency e.g. absorbing the ethnic Russian diaspora bordering the RF,
halting NATO expansion, regaining global prestige.
Both Georgia and Ukraine were non-aligned countries when he invaded, and there is every
indication that he is aware of the distinction between NATO and non-NATO members. Therefore, if
he is planning on intervening anywhere, I would expect that country to: (a) be a "core interest",
(b) be non-aligned and (c) feature developments that challenge Russian interests. Belarus and
Kazakhstan both meet all these criteria, as each is drifting away from Russia. In Kazakhstan's
case, the recent policies concerning the official use of Kazakh and Russian are increasingly
discriminatory toward Russian-speakers, more so than any policies even contemplated by the
post-Maidan Ukrainian government. Unlike Belarus, Kazakhstan features immense natural resources
and many more ethnic Russians...
Roman Lvovskiy > Andre
i suspect it, that 'Red Storm Rising' is your fave. i like it as well, despite the fact that it's
hardly accurate when it comes to wording out actual features possessed by the Soviet hardware of
that period, described thereby.
one thing that eludes you always is that Putin can not afford to subjugate anyone. that would be
stretching beyond capacity, both financially and politically. also, there's hardly that much of
anyting that is in Kazakhstan's possession presently or in short-to-midterm perspective to make
Putin even think about considering the risks.
so i'm guessing it's just your wishful thinking. i'd also suggest reading something more
profound, like something by Vonnegut or Trumbo. there's more to American culture than your garden
variety of trash usually presented on TV, sadly - less and less with each passing year.
Andre > Roman Lvovskiy
You're correct that Putin can't afford a grinding counter-insurgency, and he seems to have taken
in the Soviet experience in occupying East-Central Europe, as well as the quagmires in
Afghanistan and Chechnya. Interestingly, as soon as it became apparent that support for union
with Russia was not as warm in Donbas as Crimea, the Novorossiya project was quietly buried.
But Putin certainly has his eye on Belarus and Kazakhstan, and Astana's been taking an
increasingly independent line. There is a demographic and economic case, as I've laid out in
prior comments. But this is not a "call", after all, Crimea was annexed 20 years after analysts
were worried about it.
I'll be honest with you - I've never read a Clancy book all the way through - I've read many
papers on military technology and strategy, but I still find Clancy too dry. There are more
contemporary American authors that are great, McCarthy being one.
dennis powell
There seems to be a lot of russian supporters , who are seeing the world thru rose colored
glasses , commenting here. Russia would love nothing more then to see oil higher. Inside their
own country the fall of the ruble isn't as much a big deal as it is when they try and conduct
business outside of russia.
They are paying for their actions in the ukraine. The annexation of
crimea was a just move to take back what should have never been given away. Their mistake was in
how it was done. Their move into syria wasn't about right and wrong but about protecting their
military interests. Any one who says anything different is being foolish. Their subsequent
withdrawal is an indication that they have satisfied that end. It also , I suspect , is to
contain the costs of such an operation. Russia is a gas station parading as a country.
Their only
claim to significance is their nuclear arsenal. They have an overblown view of themselves which
masks their deep paranoia. Take away their nuclear arsenal and they wouldn't be anymore
significant then brazil.
Frank Blangeard > dennis powell • 6 days ago
The last three lines of your comment seem to apply more to the United States than to Russia.
Randal > dennis powell • 7 days ago
"They are paying for their actions in the ukraine."
How
have Russia's actions in the Ukraine caused the oil price to fall
dramatically? The US sphere sanctions are an irrelevant pinprick in
comparison.
"The annexation of crimea was a just move to take back what
should have never been given away. Their mistake was in how it was
done."
I'd love to hear how you think it could possibly have been done
any other way.
"Their move into syria wasn't about right and wrong but about
protecting their military interests. Any one who says anything
different is being foolish."
What military interests? Surely you aren't talking about the
Tartus base? Have you actually seen it? Apart from that they had
almost zero military interests in Syria before the commencement of
the regime change attempt there.
"Their subsequent withdrawal is an indication that they have
satisfied that end. It also , I suspect , is to contain the costs
of such an operation."
Given the trivial costs in Russian budgetary terms of their
relatively small operation in Syria, how do you justify claiming
that would be an overwhelming factor in their decision making?
"Russia is a gas station parading as a country."
That pretty much discredits you terminally as any kind of
objective observer on Russia, I think.
"Their only claim to significance is their nuclear arsenal.
They have an overblown view of themselves which masks their deep
paranoia. Take away their nuclear arsenal and they wouldn't be
anymore significant then brazil."
Oh, really? Do feel free to explain exactly how their nuclear
arsenal enabled them to intervene successfully in Syria, in stark
contrast to the US regime's repeated failures. And while you are
about it, feel free also to explain the utility of their nuclear
arsenal in recovering the Crimea, or any of Russia's other recent
activities.
Presumably you think Brazil could have done both, if it only had
a nuclear arsenal like Russia's.
Borgþór Jónsson > dennis powell
Of course Putin went to Syria to protect the bases,but there are also several other
reasons.
Putin wanted to protect the sovereignty of Syria.
He did not want a state similar to Libya so close to his boarders.
That is exactly what would have happened if he did not intervene.
It would have happened ,because that is what the US wanted. They wanted to grow a terrorist
state close to Russia borders.
Putin also went to Syria because he wanted to fight terrorism in area where they would be
easier to defeat than in Caucasus.
Imagine the trouble it had cost him if he had a terrorist state in Syria constantly supplying
terrorists and weapons to the Caucasus.
That was one of the aims of the US,that is the reason they fed the terrorists with weapons.
The final goal was that they would later use those weapons against Russian people.
Same goes for the Ukraine.
The final goal there is that the Ukrainian Nasis will finally attack Russia.That is the
reason for the Us cooperation with Ukrainian nationalists. Ukrainian nationalists are violent
idiots on par with ISIS as you know.
You are not the only person that are obsessed with that misunderstanding that Russia is a
gas station. This misunderstanding is the reason the US sanctioned Russia. But it does not
work,because after all, the oil is only 12% of the Russian GDP. It is uncomfortable because it
is so big part of the export, but Russia is in no way going to collapse because of it.
In fact the Russian economy is exceptionally strong,I believe that no other nation on
earth would have been able to withstand such hardship as the sharp fall of their export and at
the same time sanctions from the western powers.
Later this year or next year their economy will most likely start growing again. Well
done Russia.
Borgþór Jónsson > Borgþór Jónsson
I forgot to address another misunderstanding of yours. Russia has not left Syria.
In the beginning Russia used SU 24 and SU 25 plains for strategic bombing. What it means is
that they were used for taking out the oil business of the terrorists and also their weapons
depots,their control stations and training facilities. That is now over and those plains are
sent home.
Now they have the SU 34 And SU 35 that are more suitable for assisting the Syrian Army in
their offence. On top of that they have the MI 28 attack helicopters and of course the
the dreaded KA 52. All those plains and helicopters played a vital role in the liberation of
Palmyra.
The Russians are not home yet,they will stay in Syria and fight the terrorists till the end.
Valhalla rising
its not the jewish NeoCohens and liberal Hawks that destabilized the Middle East.Nope the
Russians are goyim -- The Russians are evil goyim -- Czar Putin shuts us down --
The Russians disposed Muhammad Gaddafi --
The Russians supported the Muslim Brotherhood in egypt --
The Russians supported the islamic onslaught against Assad --
... ... ...
http://www.dailystormer.com/gl...
"... Despite the recent oil price collapse, the analysis shows that equity investors appear to be throwing caution to the wind , piling back into the sector with some $8.9 billion of equity issued already in the first quarter of this year – a more than 10-fold increase on the final three months of 2015, and the highest quarterly level since 2011 at least. ..."
The flaws in the business models of some of the largest US shale producers are becoming
clear. Growing levels of debt are unsustainable, and there is a risk that investors could face
a bumpy ride as sector equity finance surges in 2016.
Plunging hedging revenues, coupled with high net debt and falling output, have punished
struggling US shale oil and gas companies, with stragglers more likely to default on debt under
a longer period of low oil prices.
Despite the recent oil price collapse, the analysis shows that equity investors appear
to be throwing caution to the wind, piling back into the sector with some $8.9 billion
of equity issued already in the first quarter of this year – a more than 10-fold increase on
the final three months of 2015, and the highest quarterly level since 2011 at least.
"... My impression is that the US elite is now really afraid that the level of world control reached after the dissolution of the USSR might escape from their hands. Also like British people in the past the US people now started suffering from the economic consequences of their elite imperial policies. And that makes the USA less governable by the old neocon elite (simplifying, Bush and Clinton families) that were in power since 1980th. Emergence of Trump and Sanders as viable candidates for POTUS are just two sides of the same coin. ..."
"... Low oil prices represents a powerful sanctions regime against "resource nationalists" who oppose neoliberal globalization such as Russia. In this sense pathological animosity of the USA elite toward Russia is just another variant of desire to knock down one of the last remaining opposing forces for neoliberal globalization, or as they used to say in Rome "Carnage should be destroyed". ..."
"... In fact, the present dramatic fall in the price of oil might well be a part of a long-term plan to force the 'nationalist' part of the Russian elite to submit to the Transnational Elite's (TE) rule, despite the aspirations of the overwhelming majority of the Russian people… This was clearly shown when this majority enthusiastically welcomed the only real counter-attack so far against the continuing and intensifying attack by the TE against Russia, i.e. the re-integration of Crimea. ..."
"... Two of the most common words found in accounts of the events leading to 2008 financial collapse are avarice and hubris. Usually these are used to refer to individual malfeasance, but the more interesting possibility that they also define the neoliberal economic culture. The same words apply to the shale boom. In more ways that one, this was a subprime oil boom. ..."
What was not discussed here is the importance of low oil price regime for maintaining neoliberal
"status quo". I think it is important for all members of this forum to understand the connection
between "cheap oil regime" and neoliberalism.
Among issues that make low oil price regime of paramount
importance we can mention:
Cheap oil reverses the flow of capital toward Western countries
representing a steroid injection that keeps Western economies from
sliding into another phase of the "Great Recession". The US oil industry is
just a collateral damage here. In other words the current low oil price
regime might be viewed as a desperate attempt to reverse "Secular
Stagnation" of Western economies. To reignite growth via low oil prices
as "financialization" does not work anymore. See also:
High oil prices represent a direct threat to neoliberal globalization. It directly threatens
transnationals shipment of goods and oil prices above $80 make some goods production in China
less profitable (office furniture) due to shipment costs. To save fuel ships are running at lower
speed when oil prices are high adding delays in transatlantic shipments (several days). Also the
aero transportation of fresh fruits and vegetables became more expensive as well, which destroys
the competitive
advantage of globalizing fruit production.
My impression is that the US elite is now really afraid that the level of world control reached
after the dissolution of the USSR might escape from their hands. Also like British people in the
past the US people now started suffering from the economic consequences of their elite imperial
policies. And that makes the USA less governable by the old neocon elite (simplifying, Bush and
Clinton families) that were in power since 1980th. Emergence of Trump and Sanders as viable candidates
for POTUS are just two sides of the same coin.
Low oil prices represents a powerful sanctions regime against "resource nationalists"
who oppose neoliberal globalization such as Russia. In this sense pathological animosity of the USA
elite toward Russia is just another variant of desire to knock down one of the last remaining
opposing forces for neoliberal globalization, or as they used to say in Rome "Carnage should be
destroyed". Nothing personal, this is strictly business. It also increases chances of regime change
in Russia although currently there is no such powerful fifth column as Western Ukrainian nationalists
represented in Ukraine (and who ensured the success of the coup to overthrow corrupt Yanukovich
government, replacing it with no less corrupt Poroshenko government; "As in Franklin Roosevelt
famous quote "
He May Be An SOB But He's Our SOB" ),
The fifth column which could ensure the success of a "color revolution".
In fact, the present dramatic fall in the price of oil might well be a part of a long-term
plan to force the 'nationalist' part of the Russian elite to submit to the Transnational Elite's
(TE) rule, despite the aspirations of the overwhelming majority of the Russian people… This
was clearly shown when this majority enthusiastically welcomed the only real counter-attack
so far against the continuing and intensifying attack by the TE against Russia, i.e. the re-integration
of Crimea.
… … …
As Engdahl put it, "we now see as evidence that clearly indicates there was a CIA coup d'état
backing Boris Yeltsin to be the man of Washington, so as to dismantle the Russian economy entirely
after 1990".[10] It was in this sense that one may talk of a collapse of the USSR, … which
led to the destruction not only of the socialist revolution but of the Russian economy itself.
Two of the most common words found in accounts of the events leading to 2008 financial collapse
are avarice and hubris. Usually these are used to refer to individual malfeasance, but the more
interesting possibility that they also define the neoliberal economic culture. The same words apply
to the shale boom. In more ways that one, this was a subprime oil boom.
This is weak. The energy factor is completely missing from the discussion. Also the crisis of neoliberalism
due to redistribution of wealth up, which suppress the growth is never mentioned. But what you can expect
from a such a stalwart neoliberal publication as Economist.
Notable quotes:
"... the record of industrial countries over the last 15 years is profoundly discouraging as to the prospect of maintaining substantial growth with financial stability ..."
"... Why have so many bubbles built up recently? One key factor seems to be the decline in the level of real interest rates (this is the focus of the Summers essay); lower real rates have encouraged investment in financial assets for all sorts of reasons. ..."
here has been much talk in recent months of "secular stagnation" after the former Treasury secretary
Larry Summers
made a speech on the issue in February. As you can see the problem for the developed world has
not arisen overnight. The chart shows the rolling 10-year growth rate for leading economies in both
real and nominal terms. This smooths out the effect of the economic cycle. Either way, the trend
is clear; nominal GDP growth has slowed below 4% a year, real GDP growth below 2% (in Italy, it is
negative).
There are many potential explanations for this shift, but the most plausible relates to demography.
Growth was rapid in the aftermath of the Second World War, as Europe was reconstructed, and some
of the benefits of pre-war technological change filtered through to the economy; then from the mid-1960s
onwards, the baby boomers joined the workforce. But the birth rate fell and the baby boomers are
retiring. Below are the numbers from the OECD for the old age support ratio, the number of workers
aged 20-64 relative to those aged over 65.
1950 1980 2010 2050 (projected)
US 6.97 5.04 4.59 2.53
UK 5.58 3.74 3.59 2.14
Germany 6.26 3.68 2.91 1.54
France 5.13 3.96 3.50 2.04
Italy 6.99 4.21 3.00 1.46
Japan 9.98 6.67 2.57 1.27
As you can see, things are going to get a lot worse, rather than better. Why is old age dependency
a problem? After all, a lower birth rate means there are fewer dependent children. Yes, but the cost
to society of old people is greater, once you factor in pensions, healthcare, nursing home care and
increased longevity (a 65 year old can expect to live for 20 years or more).
Crucially, the workforce is no longer growing; indeed it is expected to shrink in Italy, Germany
and Japan. The EU is
set to lose 40m workers over the next 40 years; without immigration, that would be a 96m decline.
Economic growth consists of having more workers and making them work more efficiently (productivity).
Even if one is not as
pessimistic as Robert Gordon about technological change, one can see that productivity will have
to work very hard indeed to offset demography.
What about the other factors? Larry Summers noted that those periods which tended to have rapid
economic growth were also marked by the build-up of debt and asset bubbles, or as he put it
the record of industrial countries over the last 15 years is profoundly discouraging as
to the prospect of maintaining substantial growth with financial stability
Sometimes bubbles can have positive economic impacts; the railways and canals were built in a
flurry of speculation in the 19th century. Many investors lost money but the economy gained from
the increased capacity and lower transport costs. The economic benefits of property booms are not
as great, especially if the effect is to create derelict apartments and houses (eg Ireland and Spain).
Why have so many bubbles built up recently? One key factor seems to be the decline in the
level of real interest rates (this is the focus of the Summers essay); lower real rates have encouraged
investment in financial assets for all sorts of reasons.*
Summers argues that a number of factors have pushed down real rates: companies have reduced demand
for debt, in part because the new breed of tech companies has less need for capital investment; slower
population growth is associated with lower real rates; wider inequality means more income in the
hands of the rich, who save more than the poor and central banks have also accumulated vast reserves
(a greater supply of savings means a lower real rate, other things being equal).
The U.S. saw oil production fall by 14,000 barrels last week. The U.S. oil industry has posted
consistent declines in recent months, and while the weekly data from the EIA is sometimes inaccurate,
the best guess is that the U.S. is producing 9.008 million barrels per day right now. While it could
take weeks or months to know conclusively, the U.S. could be about to drop below the key threshold
of 9 million barrels per day in oil production.
... ... ...
A massive fire hit ExxonMobil's (NYSE: XOM) refinery in Baytown, Texas on April 7, spewing black
smoke into the air. The fire was extinguished and there were no injuries reported.
The Russian energy ministry sees the very real possibility that Russian oil production enters
long-term decline, possibly even falling by half by 2035. Russia's major oil fields are decades
old, so it will be increasingly difficult to prevent output from falling. At the same time,
Russian oil companies are not discovering new sources of supply that could replace that lost
output. The Arctic offers one area where very large reserves could be exploited, but western
sanctions have blocked the participation of major international oil companies, which could help
Russian companies pull off the expensive and tricky Arctic drilling operations.
Meanwhile, Russia's natural resources minister said in late March – with an eye on the Doha
meeting – that Rosneft will likely lower its output this year. Rosneft actually did not comment
on his remarks, but the minister's comments were likely meant to demonstrate Russia's willingness
to cooperate with OPEC in Doha.
... ... ....
Russian output is expected to decline by 20,000 barrels per day on average this year,
according to OPEC's latest assessment.
"... Your point on the Marcellus displacing production from the other less productive basins is fair enough. That said I don't really see how anyone is making money in the Marcellus. ..."
"... I am reminded of what Rex Tillerson said about gas producers a number of years ago, "Everyone is losing their shirts. It's all in the red." ..."
"... As a conventional oil and natural gas producer who is suffering financially at the moment because of overleveraged shale oversupply, Mr. Coffee might rightfully suggest that I am bias against the shale industry. Truthfully, I want the shale industry to succeed but it must do so by standing on it's own feet, without borrowing money from outside sources it cannot pay back. It must develop it's remaining reserves from net cash flow, in a manner that is commensurate with worldwide supply/ demand fundamentals, at a reasonable, rational pace that will ensure price stability, not price volatility. It must find a way to do that AND pay back it's indebtedness. ..."
"... America has 2.8 million BOPD of conventional oil production that is getting hammered right now largely because of an LTO industry who has had, for the most part, no finding costs the past nine years. There are thousands of shale gas wells in the App Basin that were drilled with borrowed money that have been shut in for years with no takeaway capacity. I can find no success story in that kind of stupidity. ..."
"... Another summary on the investing disaster in shale here, it all comes down greed, corruption and stupidity in the end: ..."
"... My main argument that production potential of all shale plays in the U.S. has been vastly exaggerated for political and propaganda reasons is unchanged and now supported by sufficient data. ..."
"... And for economic reasons too. The principal question here is "Whether deferred adjustment to higher oil prices is beneficial to the USA economy in a long run?". They were definitely beneficial to "team Obama", but this might well be "after us deluge" type of thinking. ..."
Tad Patzek makes a wise point in a
reply to Coffeeguyzz in his post above.
My main argument that production potential of all shale plays in
the U.S. has been vastly exaggerated for political and propaganda reasons
is unchanged and now supported by sufficient data. While the overall
resource is giant, the recovered fraction will remain small because
of the generally poor quality of this resource. For the record, let
me restate the obvious: Some operators in the small sweet spots in all
plays will make a lot of money; most others will lose money and go bankrupt.
In the old fashioned reservoir engineering practiced by people of
my age, these sweet spots are called reservoirs.
I think the most 'agreeable' point Mr. Patzek and I may hold is the inclination
to embrace, promote and disseminate data that reinforces our already held
positions.
If you read Mr. Patzek's piece, and the comments I made in reply on his
blog site, you would see how I questioned virtually everything he presented
as being , at best, skewed.
Now, anyone following would be strongly inclined to favor a professional,
published-numerous-times and highly regarded in his field such as Mr. Patzek,
over some anonymous commenter.
That's natural.
But how in the heck could Mr. Patzek virtually dismiss the Marcellus'
output, ignore the Utica, mischaracterize the current Pennsylvania reporting
parameters and MOST importantly, NOT recognize that the decline in output
from the other formations is a direct consequence of being displaced by
the much bigger, more economic Appalachian Basin?
I claim no special insight. I acknowledge my partiality to fossil fuel
use/consumption now and for the foreseeable future. I would suggest that
those who feel/think otherwise are not so immune from cognitive bias as
they would wish to be.
What prompted me to post was how Patzek characterized sweet spots. From
what I understood in Patzek's post was that he felt there really wasn't
enough data to honestly assess the Marcellus. Which is why he gave it an
optimistic fudge factor. Your point on the Marcellus displacing production
from the other less productive basins is fair enough. That said I don't
really see how anyone is making money in the Marcellus.
I am reminded of what Rex Tillerson said about gas producers a number
of years ago, "Everyone is losing their shirts. It's all in the red."
Btw, you may have a pseudonym, but I don't consider you anonymous. You
are familiar enough to no longer appear anonymous. :-)
Coffee, it took nuts to stir up Tad Patsek's oatmeal on some stinking shale
gas play; I'll give you that. He is a renown reservoir engineer having taught
at one of the best, if not THE best petroleum engineering schools in the
entire world. He is a "distinguished" member of the Society of Petroleum
Engineers. The SPE does not hand those out to anyone. I have set in on his
lectures, and his talks; he is a good man and I can assure you he has only
the need for truth in his heart about the future of hydrocarbons.
You, on the other hand, are anonymous and won't say why exactly you are
such a adamant cheerleader for the shale industry. You "claim no special
insight" in shale matters yet you are willing to go toe to toe with a reservoir
engineer who taught tens of thousands of petroleum engineers to deal with
facts, the science of the rock and how to extract the hydrocarbons from
that rock…profitably. Forgive me, but you appear to simply be using stuff
you glean from the internet, most of which is put there by shale companies
themselves.
You cannot credibly root for an industry based on MCF's, or monster IP's,
and not dollars, sir. It has to make money. For instance, 16.5 BCF wells
in 3 years are war horses, for sure; at 5 dollar gas. At 70 cent gas those
cherry picked wells of yours still have not paid out and might themselves,
in yet another 3-4 years, but won't ever help pay back the sorry wells the
same company drilled nearby. Tight shale gas formations in the App basin
are displacing other gas production in the US by natural decline, not because
they are more economic. That statement put the b in bias.
For instance, 16.5 BCF wells in 3 years are war horses, for sure; at
5 dollar gas. At 70 cent gas those cherry picked wells of yours still have
not paid out and might [pay] themselves in yet another 3-4 years, but won't
ever help [to] pay back the sorry wells the same company drilled nearby
The issue of "ultimate profitability" brings us back to the "cheap, abundant
money supply" theme. Or more correctly the Feb induced regime of "cheap
credit for shale" that existed for the last 7 years. When anybody with a
rig could get loans or sell bonds because banks were flush with the Fed
money and wanted to put them to work somewhere, even if this "somewhere"
was extremely risky (somewhat similar to subprime mortgages). Add to this
the political pressure from Obama administration (energy independence theme)
and we get a unique environment for shale producers that existed probably
until the second half of 2015. This regime of abundant credit lines and
junk bond issuance for now is over.
With enough money you can make pigs fly, but you better do not stand
at the place where they are going to land.
This is the issue that Coffeeguyzz and Co fail to understand.
As a conventional oil and natural gas producer who is suffering financially
at the moment because of overleveraged shale oversupply, Mr. Coffee might
rightfully suggest that I am bias against the shale industry. Truthfully,
I want the shale industry to succeed but it must do so by standing on it's
own feet, without borrowing money from outside sources it cannot pay back.
It must develop it's remaining reserves from net cash flow, in a manner
that is commensurate with worldwide supply/ demand fundamentals, at a reasonable,
rational pace that will ensure price stability, not price volatility. It
must find a way to do that AND pay back it's indebtedness.
America has 2.8 million BOPD of conventional oil production that
is getting hammered right now largely because of an LTO industry who has
had, for the most part, no finding costs the past nine years. There are
thousands of shale gas wells in the App Basin that were drilled with borrowed
money that have been shut in for years with no takeaway capacity. I can
find no success story in that kind of stupidity.
The shale industry must find a way to make shale oil and shale gas extraction
profitable or it will play NO role in the energy future of America. The
first place to start, in my humble opinion, is to quit lying to the America
public about it's sustainability. I detest that BS. As I do cheerleading
for an industry who is about to financially implode. Thank you likbiz, and
Mr. Leopold.
I really hope that in a year or 2, we can climb out of the bunker, pat
one another on the back and say we made it through this mess. If we do…..adult
beverages are on me. Anywhere in Texas that is.
I'd just like to get to $55 WTI, because then we can go back to normal
and we could see how well LTO will do at that price.
I suspect that would not do them any good other than get some more money
out of investors, especially into the Permian companies. Share issuance,
but likely not much more debt issuance.
I hope $55 works for you. I don't think it will be enough to save the
debtor class in the oil patch. $55 won't be enough to make the PE/HF crowd
whole so I think you are right. Those days are gone.
It is going to be fascinating to watch the secured and unsecured creditors
carve up the carcasses in the LTO & shale gas. Where is all that off balance
sheet financing going to land?
Carrion and dead carcasses everywhere. We are going to need a lot of
vultures to clean up the dead and dying.
The IRS is standing at the head of the line to get its cut. A lot of
liens are going to be filed and bank accounts frozen.
As I peck away here, creditors are putting in lock boxes to intercept
account receivable payments. Debtors are intercepting the lock boxes to
keep funds away from creditors. Local bank accounts are being closed and
funds are redirected to the home office (some out of the country)
Ever tried to secure a place in line with the other creditors when the
debtor files for bankruptcy outside the USA?
My main argument that production potential of all shale plays
in the U.S. has been vastly exaggerated for political and propaganda
reasons is unchanged and now supported by sufficient data.
And for economic reasons too. The principal question here is "Whether
deferred adjustment to higher oil prices is beneficial to the USA economy
in a long run?". They were definitely beneficial to "team Obama", but this
might well be "after us deluge" type of thinking.
"... What matters for a company's bottom line is the average output of all there wells. I imagine if you take a close look at the 10k you can determine how many producing wells they have and what their total output is, pretty sure it is going to be about 5 to 10% of that monster well, maybe less. Talk of the best well is a red herring. ..."
"... Don't understand why they don't recognize this and just complete their DUCs (if it will not result in cash burn, at current oil prices it will) once prices make it profitable to do so. Enno Peters has more data so perhaps he sees something that I do not. ..."
"... According to Enno, the average productivity for Pioneer's wells in the Permian is much lower than what the company shows in the presentation. ..."
"... Enno Peters' numbers for 629 Pioneer's wells that started production in Spraberry formation in 2015 show ~34 kbo average cumulative production for the first 3 months. Pioneers's numbers for 11 wells in 4Q15 show ~60kboed (48 kbo, assuming 80% oil)As in all shale companies' presentations, the numbers for individual wells is simply cherry picking ..."
"... Anyway, a likely reason for the increased productivity for the well is much due to the fact the the wells are drilled longer. I have a source (unfortunately not in English) saying that 1st generation fracking wells were 200-300m long, second generation wells up to 2-3km, with increased number of explosions. No wonder the well productivity goes up. ..."
"... I suspect that the parameter "Production/area" would be more meaningful and most likely not show such a large an increase, maybe even a decrease. ..."
"... Remember an oil man really doesn't care about the oil produced, it is the dollars produced that is the aim. So to the oil company oil per unit area is not something they would really consider. They are really interested in the oil produced per dollar spent, but most interested in the profits produced. Often the higher productivity wells are more expensive to complete (more frack stages, more proppant, or longer laterals), if they spend 10% more on the D+C and get 15% more output from the well (especially if the extra output happens early in the life of the well) that is money worth spending. ..."
"... Usually they figure out the optimum setup after 2 or 3 years, eventually sweet spots will run out of room and well productivity will decrease, so far there is little evidence of well productivity decrease in the Bakken or Eagle Ford. ..."
"... I still think the 2015 average Permian well will have an EUR over 180 months of under 210 kb, similar to the average Eagle Ford well and at $8 million per well and current oil prices, these wells should not be drilled. ..."
"... Pioneer does have a few big Sprayberry wells, but most will never produce more than 300-400K barrels of oil, absent refracks or EOR breakthroughs. Most seem to really tail off after hitting 75-150K BO, and will produce the remainder over the next 20-40 years. At least that is what I see generally. ..."
Richard Zeits raised some eyebrows with his latest Seeking Alpha post
projecting Cabot's Susquehanna county wells (northeast PA) with putting
out 27 Bcf EUR … a seemingly preposterous number for an $8 million well.
Thing is, their #1 producer in the Marcellus, the T Flower 2, has ALREADY
produced 16 1/2 Bcf in three years time.
What matters for a company's bottom line is the average output of
all there wells. I imagine if you take a close look at the 10k you can determine
how many producing wells they have and what their total output is, pretty
sure it is going to be about 5 to 10% of that monster well, maybe less.
Talk of the best well is a red herring.
Pioneer's average well in 2015 looks like it has high output for 10 months
and then looks like it will revert to the average 2011 well profile from
months 12 to shut in. I would estimate the EUR on these wells is about 160
kbo at most, adding in 20% natural gas would get the well to maybe 200 kboe
of oil, NGL, and natural gas (in boe) for a URR. The return on these wells
will be negative.
Don't understand why they don't recognize this and just complete
their DUCs (if it will not result in cash burn, at current oil prices it
will) once prices make it profitable to do so. Enno Peters has more data
so perhaps he sees something that I do not.
I have also looked at Enno Peters' recent post on the Permian.
According to Enno, the average productivity for Pioneer's wells in
the Permian is much lower than what the company shows in the presentation.
Enno's numbers are for total wells, and the presentation mentions only
those wells that were completed in 2015. There were obviously improvements
in average productivity in the past few years, but I doubt that they were
that big.
I know Enno cautions on reading too much into the the last couple months
data, as it can wriggle around a bit, but if PDX's 2015 wells continue as
shown in your graph, it may just mean that PDX were just trying a little
too hard to get good production figure from the Sprayberry, and potentially
are going to pay the price for this over production with long under performance
of the well.
Enno Peters' numbers for 629 Pioneer's wells that started production
in Spraberry formation in 2015 show ~34 kbo average cumulative production
for the first 3 months. Pioneers's numbers for 11 wells in 4Q15 show ~60kboed
(48 kbo, assuming 80% oil)As in all shale companies' presentations, the
numbers for individual wells is simply cherry picking
Anyway, a likely reason for the increased productivity for the well
is much due to the fact the the wells are drilled longer. I have a source
(unfortunately not in English) saying that 1st generation fracking wells
were 200-300m long, second generation wells up to 2-3km, with increased
number of explosions. No wonder the well productivity goes up.
But I wonder how meaningful this parameter is. I suspect that the
parameter "Production/area" would be more meaningful and most likely not
show such a large an increase, maybe even a decrease.
Remember an oil man really doesn't care about the oil produced, it
is the dollars produced that is the aim. So to the oil company oil per unit
area is not something they would really consider. They are really interested
in the oil produced per dollar spent, but most interested in the profits
produced. Often the higher productivity wells are more expensive to complete
(more frack stages, more proppant, or longer laterals), if they spend 10%
more on the D+C and get 15% more output from the well (especially if the
extra output happens early in the life of the well) that is money worth
spending.
Usually they figure out the optimum setup after 2 or 3 years, eventually
sweet spots will run out of room and well productivity will decrease, so
far there is little evidence of well productivity decrease in the Bakken
or Eagle Ford. In the Permian in 2015 it looks like high output in
the first 13 months has hurt the well productivity for months 15 and later
bringing the well to the level of the 2011 or 2012 wells after month 13.
It is also possible that the last data point (month 13 for the 2015 wells)
is based on too few wells to be reliable and may be statistical noise.
I still think the 2015 average Permian well will have an EUR over
180 months of under 210 kb, similar to the average Eagle Ford well and at
$8 million per well and current oil prices, these wells should not be drilled.
I have a data subscription and have finally broken down and paid a little
$$ to satisfy myself about both the Permian hz wells, and also the OK hz
wells.
I cannot legally reproduce the data, but my view is:
A. Enno's data is trustworthy re Permian.
B. The OK hz wells are generally gas wells, with associated liquids,
which rapidly deplete. Will not impact US oil production in a meaningful
way. Some prolific gas wells, however.
Pioneer does have a few big Sprayberry wells, but most will never
produce more than 300-400K barrels of oil, absent refracks or EOR breakthroughs.
Most seem to really tail off after hitting 75-150K BO, and will produce
the remainder over the next 20-40 years. At least that is what I see generally.
Now compare what is said about those excellent wells IPs, EURs and D&C costs
with Pioneer's actual 2015 results.
With annual average WTI oil price of $48.66 + hedges, the company posted
net loss of $273 million.
Oil and gas revenues were $2 178 million,
Net derivative gains: $ 879 million;
Net gain on disposition of assets: $782 million.
So, without hedges and gains on asset sales, Pioneer's net loss would be
much bigger.
Now look at their cash flow statement:
Net cash provided by operating activities: $1 248 million
Cash capex: $2 393 million;
Negative free cashflow: $1 145 million.
Not surprisingly, they had to borrow almost $1bn and sell assets for
$553 miilion.
And this is one of the leaders in the shale sector!
CLR and WLL have ceased completing oil wells. They are projected to lose
major $$.
BTW, it looks like CLR Red River wells will wind up being a much better
investment at $30 oil than their Bakken and TFS wells are. Those Red River
wells cost a fraction of the Bakken/TFS and will wind up producing similar,
if not superior cumulative oil per well.
What happens if it is nationalized? The shareholders might get, say,
a 10% premium over market price for their shares (making them happy), paid
for with printed money.
The employees get gov't benefit packages and the executives even have
a bonus plan like AMTRAK or USPS.
Oilprice.com: The IEA has been accused of overestimating global supplies. The WSJ says that
somewhere around 800,000 barrels per day are unaccounted for, meaning they are not consumed nor
have they ended up in storage. Are these "missing" barrels a big deal?
Mike Rothman: The issue has not been one of the IEA over-estimating supply, but rather
under-estimating demand. There are basically two ways to arrive at figures for global oil demand.
The IEA methodology is built on an estimate of GDP and an assumed ratio of oil demand growth to
GDP growth.
... ... ...
OP: The oil industry is making massive cuts in investment. Should we be bracing ourselves
for a price shock at some point in time? If yes when do you see this occurring?
MR: You cannot cut CAPEX and reduce upstream activity and somehow think future production growth
goes unaffected. We forecast non-OPEC supply to contract this year for the first time since 2008.
That was a way-out-of-consensus call to make a year-ago when most pundits vigorously argued
non-OPEC production would still expand even with the drop in oil prices. What we've communicated
to our clients – and those we deal with directly in OPEC – is that the spike down in oil prices
is basically setting up an eventual spike up.
OP: Will bankruptcies in the U.S. shale industry do anything to balance the market?
MR: We expect that it will feed into the contraction we forecast for U.S. output. We also see the
credit availability issue as likely being a limiting factor moving forward, sort of like what we
saw in 1986 and then again in 1999.
... ... ...
OP: Lenders to the oil and gas industry have been fairly lenient with companies. Do you
believe that the banks will start to tighten the screws a bit more as the periodic credit
redetermination period finishes up?
MR: The old joke is that bankers are the guys who will lend you an umbrella and then ask to have
it returned as soon as it starts to rain. Yes, we think lending will become much more highly
scrutinized and financing less readily available.
"... The shale industry must find a way to make shale oil and shale gas extraction profitable or it will play NO role in the energy future of America. The first place to start, in my humble opinion, is to quit lying to the America public about it's sustainability. I detest that BS. As I do cheerleading for an industry who is about to financially implode. Thank you likbiz, and Mr. Leopold. ..."
As a conventional oil and natural gas producer who is suffering financially at the moment because
of overleveraged shale oversupply, Mr. Coffee might rightfully suggest that I am bias against
the shale industry. Truthfully, I want the shale industry to succeed but it must do so by standing
on it's own feet, without borrowing money from outside sources it cannot pay back. It must develop
it's remaining reserves from net cash flow, in a manner that is commensurate with worldwide supply/
demand fundamentals, at a reasonable, rational pace that will ensure price stability, not price
volatility. It must find a way to do that AND pay back it's indebtedness.
America has 2.8 million BOPD of conventional oil production that is getting hammered right
now largely because of an LTO industry who has had, for the most part, no finding costs the past
nine years. There are thousands of shale gas wells in the App Basin that were drilled with borrowed
money that have been shut in for years with no takeaway capacity. I can find no success story
in that kind of stupidity.
The shale industry must find a way to make shale oil and shale gas extraction profitable or
it will play NO role in the energy future of America. The first place to start, in my humble opinion,
is to quit lying to the America public about it's sustainability. I detest that BS. As I do cheerleading
for an industry who is about to financially implode. Thank you likbiz, and Mr. Leopold.
I really hope that in a year or 2, we can climb out of the bunker, pat one another on the back
and say we made it through this mess. If we do…..adult beverages are on me. Anywhere in Texas
that is.
I'd just like to get to $55 WTI, because then we can go back to normal and we could see how
well LTO will do at that price.
I suspect that would not do them any good other than get some more money out of investors,
especially into the Permian companies. Share issuance, but likely not much more debt issuance.
I hope $55 works for you. I don't think it will be enough to save the debtor class in the oil
patch. $55 won't be enough to make the PE/HF crowd whole so I think you are right. Those days
are gone.
It is going to be fascinating to watch the secured and unsecured creditors carve up the carcasses
in the LTO & shale gas. Where is all that off balance sheet financing going to land?
Carrion and dead carcasses everywhere. We are going to need a lot of vultures to clean up the
dead and dying.
The IRS is standing at the head of the line to get its cut. A lot of liens are going to be
filed and bank accounts frozen.
As I peck away here, creditors are putting in lock boxes to intercept account receivable payments.
Debtors are intercepting the lock boxes to keep funds away from creditors. Local bank accounts
are being closed and funds are redirected to the home office (some out of the country)
Ever tried to secure a place in line with the other creditors when the debtor files for bankruptcy
outside the USA?
My main argument that production potential of all shale plays in the U.S. has been vastly exaggerated
for political and propaganda reasons is unchanged and now supported by sufficient data.
And for economic reasons too. The principal question here is "Whether deferred adjustment to
higher oil prices is beneficial to the USA economy in a long run?". They were definitely beneficial
to "team Obama", but this might well be "after us deluge" type of thinking.
NEW ORLEANS (CN) – A federal judge has granted final approval to a $20 billion settlement related
to the 2010 Deepwater Horizon disaster.
The settlement approved by U.S. District Judge Carl Barbier on Monday includes $5.5 billion in
Clean Water Act penalties and almost $5 billion to the five states along the Gulf affected by
the oil spill - Louisiana, Texas, Mississippi, Alabama and Florida.
The settlement also requires BP to pay $8.1 billion in natural resource damages, with funds
going toward Gulf restoration projects that include restoration of coastal wetlands and wildlife.
An additional $600 million will cover other costs related to state and federal reimbursement claims,
and up to $1 billion will be given to local governments to settle claims for economic damage from
the spill. The spill was the result of the April 20, 2010, explosion and sinking of the Deepwater
Horizon oil rig 50 miles offshore from Louisiana. The blast killed 11 workers, injured numerous
others and unleashed one of the worst oil spills in history.
The agreement accepted by Judge Barbier calls for the money to be paid out over a 16-year period.
"... Oil price collapse basically ended. Oil price recovery started. Shale industry collapse just started. ..."
"... I'm not so sure the oil price collapse has ended. I agree the shale industry collapse has started and it will continue to snowball. ..."
"... In any market, when the top is in, it is hard to see. Also, when the bottom is in it is hard to see. I always read financial "news" with a skeptical view. Tonight, Bloomberg says the number of oil shorts is up – probably because the proposed production "freeze" will not work. ..."
"... So, where is any net increase in production going to come from? Score one for Iran. But, how about the rest? Such as USA, SA, Russia, Iraq, Canada, Angola, Nigeria, Venezuela, Libya, North Sea, Brazil, Mexico, Kuwait. So, a production "freeze" agreement is pointless anyway. ..."
"... Oil shorts have life so good. Iran, KSA and Russia just keep taking turns saying unhelpful things. Where does it end? ..."
"... We are reading Western MSM which tend to distort things that those countries representatives are saying. This is especially true for Iran. ..."
"Of course there is going to be much more carnage in the oil patch. After all, a decade
of coordinated money printing by most of the world's central bank eventually generated spectacular
levels of excess capacity and malinvestment in the global oil and gas patch."
"Instead, the current massive overhang of surplus stocks and excess production capacity
is owing to the drastic mispricing of capital and the temporary bubble in petroleum demand
that pushed prices into an artificial and unsustainable triple digit range.
Accordingly, the present oil price collapse is just getting started. It will be subtracting
from CapEx and production levels in the US and around the world for years to come."
In any market, when the top is in, it is hard to see. Also, when the bottom is in it is hard to
see.
I always read financial "news" with a skeptical view. Tonight, Bloomberg says the number of oil
shorts is up – probably because the proposed production "freeze" will not work. So, let's all
agree that a production freeze is not going to be agreed to.
So, where is any net increase in
production going to come from? Score one for Iran. But, how about the rest? Such as USA, SA, Russia,
Iraq, Canada, Angola, Nigeria, Venezuela, Libya, North Sea, Brazil, Mexico, Kuwait. So, a production
"freeze" agreement is pointless anyway.
"... What's critical to note is how the media, and surprisingly most analysts, see global oil merely through the prism of U.S. independent shale players. To me, this is the critical grave mistake they make. Recent lease outcomes in the Gulf of Mexico, problems in Brazil and the likely end of spending for all new Russian oil projects are just a few of the other gargantuan gaps in global production we're likely to see after 2016. ..."
"... the shale players, even with their low well drilling costs and backlog of 'drilled but uncompleted wells' (DUCs) cannot in any way repeat their frantic production increases they achieved from 2012-2014 ever again. I believe this because of financing constraints and the lack of quality acreage among other reasons – but I don't have to even "win" this predictive argument. ..."
"... Chevron estimated in 2013 that oil companies would have to spend a minimum of $7-10 trillion dollars to 2030 to merely keep up with demand growth and the natural decline of current wells. And this was without factoring in the drop in exploration spending that is occurring now and throughout the next two years. Severe capex cuts from virtually every oil company and state-run producer over the last two years has put this necessary spending budget way behind schedule. ..."
"... You can see why I tend to have a much more radical view of the decline line in production beginning in late 2016 and lasting, in my view, at least until the middle of 2018, when production again only begins to get the funding (and time) it needs to try and "catch up". ..."
...most analysts agree that the sharp drop in Capex budgets, not just among shale producers, will
have its effect on sharply lowering production this year and putting growth in reverse, efficiencies
and well cost reductions notwithstanding. What's critical to note is how the media, and surprisingly
most analysts, see global oil merely through the prism of U.S. independent shale players. To me,
this is the critical grave mistake they make. Recent lease outcomes in the Gulf of Mexico, problems
in Brazil and the likely end of spending for all new Russian oil projects are just a few of the other
gargantuan gaps in global production we're likely to see after 2016.
... ... ...
While the EIA and most other analysts agree that sharp capex drops will begin to have their halting
effects on oil production, they tend to argue over when those production drops come and how steep
they will be. In all cases, they argue that any drop in production will be answered by a rally in
oil prices, to the degree that U.S. shale players again 'turn on the spigots' and reestablish the
gluts that have kept us under $50 a barrel for most of the last year. In this scenario, production
never – or at least exceedingly slowly – rebalances to match demand.
I see it much differently. I could argue that the shale players, even with their low well drilling
costs and backlog of 'drilled but uncompleted wells' (DUCs) cannot in any way repeat their frantic
production increases they achieved from 2012-2014 ever again. I believe this because of financing
constraints and the lack of quality acreage among other reasons – but I don't have to even "win"
this predictive argument.
Longer-term projects from virtually all other conventional and non-conventional sources that have
not been funded for the past two years will see their results, in that there won't be the oil from
them that was planned upon. Chevron estimated in 2013 that oil companies would have to spend
a minimum of $7-10 trillion dollars to 2030 to merely keep up with demand growth and the natural
decline of current wells. And this was without factoring in the drop in exploration spending that
is occurring now and throughout the next two years. Severe capex cuts from virtually every oil company
and state-run producer over the last two years has put this necessary spending budget way behind
schedule.
You can see why I tend to have a much more radical view of the decline line in production beginning
in late 2016 and lasting, in my view, at least until the middle of 2018, when production again only
begins to get the funding (and time) it needs to try and "catch up".
"... Thanks for the analysis and forecast of Norwegian crude oil production. Figure 01 shows that combined output of the currently producing fields will drop from 1.57mb/d in 2015 to around 250 kb/d in 2030. That implies an average annual decline rate of 11.5%. ..."
"... Looking at the total production from fields started as of 2004 and 2012 these had a year over year decline of more than 15% from 2014 to 2015. ..."
"... This illustrates how many smaller fields with short plateaus and steep declines influences the total decline rate and until Johan Sverdrup starts to flow, these smaller fields' portion of total extraction will grow. ..."
"... The low oil price recently caused the Vette development to be scrapped. All things equal this makes for a steeper decline in total extraction than what is now reflected in my forecast. ..."
"... I am [and have for some years been] firmly in the camp that think it will take a loooooong time before we again see a sustained $100+/b [$2016], even as the present supply overhang from whatever reasons comes to an end. ..."
Thanks for the analysis and forecast of Norwegian crude oil production.
Figure 01 shows that combined output of the currently producing fields will
drop from 1.57mb/d in 2015 to around 250 kb/d in 2030. That implies an average
annual decline rate of 11.5%.
Decline for the fields that were producing in 2001 during the period
to 2013 was about 9% per year. Is this projected acceleration due to the
rising share of the small deepwater fields with higher decline rates? What
are combined decline rates for the old mature fields?
What are your oil price assumptions? Do you think that potential sharp
increase in oil prices after 2020 may slow production decline, like in 2014-15?
For several of the mature fields that still contributes meaningfully,
the developments of discoveries within their business areas (like Gullfaks,
Oseberg) and infill drilling [made commercial/profitable from a higher oil
price] makes it now difficult to pull out/estimate their [call it "underlying"]
decline rates [from data in the public domain] post these developments.
The reserves added from these developments and infill drilling are reported
within the business areas [reserve growth].
For all fields started before 2002;
From 2012 to 2013 the decline slowed to 2 %/a.
From 2013 to 2014 extraction grew about 3%/a.
From 2014 to 2015 extraction grew about 2%/a.
Several of the decisions that led to this reversal was made while the oil
price was high and thus funding available.
Looking at the total production from fields started as of 2004 and
2012 these had a year over year decline of more than 15% from 2014 to 2015.
(Grane [reserves 900+Mb] started in 2003 and saw a slowdown in its decline
in 2015.) This illustrates how many smaller fields with short plateaus
and steep declines influences the total decline rate and until Johan Sverdrup
starts to flow, these smaller fields' portion of total extraction will grow.
As alluded to in the text I have not made any oil price assumptions for
the forecast [which is based on sanctioned developments]. Presently, several
fields are planned plugged and abandoned (P&A) as the lasting, low oil price
has shortened their economic life. Plans now call for Jette, Varg, Volve
to be P&A later this year.
More will follow according to various sources.
The low oil price recently caused the Vette development to be scrapped.
All things equal this makes for a steeper decline in total extraction than
what is now reflected in my forecast.
I am [and have for some years been] firmly in the camp that think
it will take a loooooong time before we again see a sustained $100+/b [$2016],
even as the present supply overhang from whatever reasons comes to an end.
Interesting post. Presumably "Expectations" = Crude Oil Futures
Contracts. If so, who controls the price of Oil futures contracts and made
the decision to throw the Bakken under the bus, along with more than a few
sovereign nations who rely to a significant degree on oil exports
economically and to maintain domestic political stability?
Role of demand suppression from high levels of consumer debt, China's
economic slowdown, ongoing fallout from the 2008 financial collapse,
neoliberal government austerity policies, improvement in energy efficiency,
emergence of renewables, and other factors were understated here IMO.
In the past here has also been a variable time lag between low oil prices
and rising levels of economic activity.
But maybe this development is overall not such a bad thing given global
warming considerations.
CG, I was thinking something similar, that "expectations" is the
euphemism for speculation in the futures markets, which, as most know
from this site, is now dominated by investor-speculators. The model they
used refers to Killian who is one of the handful of academics who try to
refute anyone who argues speculators have influenced oil (and other
commodity) prices.
My own take (anyone interested can read it
here) is there was a series of bubbles generated from the futures
market that created the belief higher oil prices were here to stay.
Noted your article was written before the Central Banks-Primary
Dealer cartel renewed pumping equities on February 11 IMHO. Jury is
out on whether they've jumped the shark. Also, whether they care.
'The observed drop in oil prices should have a slightly positive
impact on the EU economy.'
Probably true. But likely there's a "J-curve effect."
That is, the initial deflationary shock hikes corporate bond spreads
(driven by the energy sector) and feeds recession fears. Such fears
encourage investors to seek the safe haven of government bonds, at the
expense of stocks and credit bonds.
Later as confidence returns, the beneficial effect of lower energy costs
(including bolstered consumer demand) can actually be realized.
Arguably, Jan-Feb 2016 constituted the bottom of the "J." We'll see.
"... At some point people realize that the emperor has no clothing. ..."
"... And that also gives an explanation to Dennis' supposition that rigs will fly at $50 oil (or maybe pigs will fly). Using the same numbers at $50, you get a negative return on a well that produces 148k over 36 months. Who can afford to wait 36 months in this environment, anyway? ..."
"... They have been completing wells at $40/b or less, I agree nobody is making money at these prices, but if you have already spent $2 million to drill and case a well, that horse has left the barn. Now the question is do you spend another $3.5 million to frack and complete the well so you can generate some cash flow to keep the lights on. ..."
"... When these companies are losing money, which I am confident was the case in 2015, and will likely be the case in 2016 also, income tax is zero, I think. Perhaps 30% would be a better number for royalties and taxes in Texas, 27% was a guess on my part. ..."
"... Note that 148 kb is the average cumulative output over the first 36 months of the average 2013 to 2015 Eagle Ford Shale(EFS) oil well. ..."
"... I think the rule of thumb is that the payout in 36 months means the well is acceptable for Mike who is conservative, the shale players are not very conservative financially so 36 months would be outstanding as far as they were concerned. If the well cost was $6.5 million simple interest would be $325,000 at 5% and would be covered by the well in our example above, land and development costs might be covered by associated gas, I don't have numbers on that. ..."
"... Let's assume no associated gas (unlikely to be the case) and using Reno's land numbers from below say land and development costs are $350k/well, then we would need $83/b for the well to pay out in 36 months for the average well. ..."
"... So if we need $83 to payout in 36 months, the current price is $38 and the NYMEX strip for 36 months is well below $50 WTI, why are there any wells being drilled and completed in the EFS? ..."
"... Commodity markets can remain irrational longer than many can stay solvent, unfortunately. ..."
"... I am getting a little more conservative in my price predictions seeing maybe $50/b by Dec 2016 and maybe $80/b by Dec 2017, but the faster output falls the quicker the turnaround in oil prices will be. ..."
"... The main and probably only reason they are drilling in non-sweet spots in the Eagle Ford, now, is to hold the lease. I think, even the DUCs that are being completed now fall into that category. Or, in some cases, like Dennis says, the completion cost as current year capex would be covered. The only reason a company would drill with a three year payout, is if they had adequate lending or capital resources. Otherwise, they well should mainly pay for itself the first year, or they lose the capex for next year in cash flow loss. ..."
"... Most of the revenue is in the first year, about 63% of the oil flows in the first year. For the well to pay out in the first year would take an oil price of $117/b, but after a few years of wells you have cash flow not just from this years wells but the cash flow from previous years as well, this is why the 36 month rule probably works, to get the operation started you would need to borrow some money, but if you do it right you pay off those loans after 5 years or so and then work from cash flow and never need to borrow money, if you do it right and don't have oil prices in the toilet for a couple of years. ..."
"... Why are the shale guys given massive lines of credit based on the" assets" that are still in the ground and essentially worthless in today's market? ..."
"... "Analysts" are projecting a 30% haircut on the shale guys lines of credit in April, why only 30%? How about 100%? ..."
"... I just don't see the hyped OK plays adding much crude, based on available data. Would be neat if all states had ND data. ..."
At some point people realize that the emperor has no clothing.
Quick question on Eagle Ford.
Assume
transport cost= $5/b
royalty and taxes=27% of wellhead revenue
OPEX+ water disposal=$6/b
downhole maintenance+repair=$10,000/month
cumulative output=148 kb over 36 months
well cost=$6.5 million
refinery gate oil price=$77/b
With the assumptions above the net revenue per barrel is $44.13/b and
the cost of the well is covered in 36 months (with no discounting).
Mike has often said he wants his wells to "pay out" in 36 months at minimum
(he prefers 24 months, I would prefer 12 months :- ). At $77/b at the refinery
gate and 148 kb cumulative in 36 months, does the well meet those requirements
under the assumptions I have given?
How might you revise the assumptions to make them more realistic? What
am I missing, if it does not require a book length answer :-) ?
Assume $11 LOE, water disposal, transport cost = $1,302,400.00
Assume $10K per month of "maintenance CAPEX" = $360,000.00
Subtract those two figures from our net oil = $6,816,224.00
You payout in 36 months, assuming no interest expense. Also, need to
allocate lease acquisition cost, seismic, permitting etc., to our well.
On the plus side, we need to also figure in the gas/natural gas liquid revenues.
Also, need to see how income taxes figure in. Also, not sure if LOE is correct,
does it include county ad valorem taxes?
So in 36 months, we still need to pay our interest expense, our up front
land and development costs. Maybe some income tax, maybe we need to add
ad valorem taxes.
Oh, also, where is our G & A allocation? Or is that included up there
somewhere? That seems to be running about $2-4 per BOE (note not BO, and
likewise, all other expenses are always set forth as BOE, so we need to
know our GOR to adjust for that maybe?)
Finally, should we factor in time value of money, or if we add actual
interest expense does that solve the problem? I agree interest rates are
super low, maybe we should us PV8 or PV7? Rune and I have discussed this
some.
I assume this is a pretty darn good EFS well? I guess just need to look
at shaleprofile.com don't we?
Dennis. I suppose your example is close to what will be the "average" EFS
well in 2016.
One thing to remember, the EFS has different "windows" and many areas produce
all, or mostly gas.
Sánchez Energy is a prime example. Only 37% of 2015 production was oil.
Their Catarina area is mostly gas and natural gas liquids, yet it is their
primary field, and well costs are much lower.
Sánchez plans on completing 55 net wells, 36 in Catarina. This compares
to 116 well completions in 2015, companywide. Cost for all wells will be
$180-220 million, only 3 net DUC wells from 15, rest are new drills. Plan
on spending another $20-30 million on facilities.
Just some EFS company info that might interest some.
I suggest looking at Sánchez Energy's 2015 10K. Very detailed.
One area they reported was royalty burdens. Those range from 20.9% to
30.5%. I think royalty burdens are more onerous in EFS than Bakken, I think
25% is very common, and 30+% is not unheard of.
Despite a high percentage of gas, Sánchez production expenses (which
appear to include gathering and transport) were $8.16 per BOE. Production
and ad valorem taxes were$1.40 per BOE on realized per BOE of $24.80. DD
&A was $17.96 per BOE, interest expense was $6.60 per BOE, G & A $2.89 per
BOE, and impairments were $71.15 per BOE.
Sánchez has $435 million of cash, $1.75 billion of long term debt, PV10
of $593.5 billion, PDP PV10 of $465.5 billion.
They have two large acreage areas where they have no present plans for
new wells, very few currently producing wells, and almost no PV10, being
EFS Marquis area, and in the Tuscaloosa Marine Shale.
To achieve the above stated PV10, future production cost estimates were
slashed from $2.635 billion as of 12/31/14 to $1.745 billion as of 12/31/15.
Another interesting thing I noted that Sánchez reported, that few others
do, is that they have a NOL carry forward of $765.9 million. More interesting
is they adopted some type of plan to keep a hostile acquirer from obtaining
benefits of this NOL. Clueless, if you are out there, would love to hear
your comments on this.
Sánchez has an interest in 621 gross, 504.6 net wells.
Despite being in EFS, their oil sold for an average price of $42.98 per
barrel, well below WTI.
Their production really increased, from 43,893 boepd in Q4 14 to 58,115
boepd in Q4 15. They completed more wells in 2015 than in any prior year,
and do not appear to have DUC's.
And that also gives an explanation to Dennis' supposition that rigs
will fly at $50 oil (or maybe pigs will fly). Using the same numbers at
$50, you get a negative return on a well that produces 148k over 36 months.
Who can afford to wait 36 months in this environment, anyway?
They have been completing wells at $40/b or less, I agree nobody
is making money at these prices, but if you have already spent $2 million
to drill and case a well, that horse has left the barn. Now the question
is do you spend another $3.5 million to frack and complete the well so you
can generate some cash flow to keep the lights on.
All the G&A, land acquisition and development costs and so forth have
been allocated to other producing wells, income tax is not an issue because
last I checked you don't pay taxes when you are losing money.
When we do the calculation using all the same assumptions as before and
look only at the fracking and completion cost of $3.5 million, that cost
is paid in 36 months at $50/b.
Perhaps that is why some wells continue to be completed at $50/b, the
$40/b completions may be the best well locations that have higher than average
EUR.
EFS is tougher to get a handle on, because it is much more variable than
the Bakken in terms of GOR and well depth.
I would note SM Energy still has two rigs going in Divide Co., ND. Apparently
the wells there aren't as costly as in the core of McKenzie Co. Other than
that, seems like Bakken activity right now is centered in one area, where
things are similar.
I don't know a whole lot about EFS, but do know that some areas, like
Catarina, are almost all gas and liquids, little to no oil. Pioneer seems
to have the gassy acreage, thus zero rigs running.
I have focused on oil wells and ignore the gas and condensate wells.
In the most recent 12 months about 80% of the C+C output is from oil wells
and 20% is condensate from gas wells.
When these companies are losing money, which I am confident was the
case in 2015, and will likely be the case in 2016 also, income tax is zero,
I think. Perhaps 30% would be a better number for royalties and taxes in
Texas, 27% was a guess on my part.
The 36 month payout rule that Mike uses, would be a company that operates
by using cash flow, so interest expense would be zero, the associated gas
of the average oil well in the EFS I am not sure about, but the gas and
NGL might offset some of the LOE. I was assuming all taxes and royalties
would be covered by the 27% of wellhead revenue, does that seem too low,
maybe 30% would be more realistic?
Note that 148 kb is the average cumulative output over the
first 36 months of the average 2013 to 2015 Eagle Ford Shale(EFS) oil well.
When the 36 month payout rule is used, I thought the discount rate was
left out of the calculation. Also note that the land and development costs
is spread over many wells, what would your estimate be for these costs per
well, I have no clue.
See my Sánchez Energy post re their royalty burden and production and
ad valorem taxes per bbl.
Some acreage went for over $50K per acre. So if we are on 100 acre spacing,
that would be $5 million per well? I agree, that is extreme. So use $10K
per acre, 60 acre spacing, still $600K per well. Not insignificant. I do
not know what seismic shoots were costing, you have the bill to the land
man, and the attorney. So much of the shale plays have severed minerals,
so landowner had to be paid. Plus, look at the division of interests on
some of these shale units, usually over 100 separate mineral owners, all
have to be contacted to sign. And the land men had to run the records in
the remote county court houses to figure all of this out, very costly, leasing.
Just because Mike doesn't borrow doesn't mean shale doesn't. Wouldn't
the fact that shale borrows means they need a quicker payout than Mike,
who pays cash?
The gas in EFS is much more relevant than Bakken.
Dennis, would really help you to read some 10K. On EFS, I highly recommend
Sánchez for starters, as they are solely EFS (TMS insignificant) and have
acreage in different EFS windows, yet they break out a lot of detail on
each.
I think the rule of thumb is that the payout in 36 months means the
well is acceptable for Mike who is conservative, the shale players are not
very conservative financially so 36 months would be outstanding as far as
they were concerned. If the well cost was $6.5 million simple interest would
be $325,000 at 5% and would be covered by the well in our example above,
land and development costs might be covered by associated gas, I don't have
numbers on that.
Let's assume no associated gas (unlikely to be the case) and using
Reno's land numbers from below say land and development costs are $350k/well,
then we would need $83/b for the well to pay out in 36 months for the average
well.
Dennis, sounds good. And right now the app on my phone says WTI is $38.51.
So if we need $83 to payout in 36 months, the current price is $38
and the NYMEX strip for 36 months is well below $50 WTI, why are there any
wells being drilled and completed in the EFS?
For example, Sanchez, who has $1.75 billion of long term debt with PDP
PV10 of just $450 million, plans on spending over $200 million of CAPEX
in the EFS in 2016. They do have hedges, but they really do not help much.
See why this stuff frustrates the heck out of people like Mike and me?
It is like throwing cash in a burn barrel.
I gave an example above for why someone might complete a DUC at $50/b
for an average well.
So find your better DUCs that might produce in the 75th percentile and
maybe completing the well makes sense at $38/b, I really don't know desperate
times call for desperate measures I guess. Every oil company is secretly
hoping they can outlast the other company so that output goes down and prices
go up, this is a game of last man standing as far as I can tell.
Dennis. Pretty much all are in dire straits, I agree.
Looks like ND rig count is ready to drop below 30, at 30 today with one
to stack.
I like that you see a quick rebound in oil prices, but I think you have
been saying that for awhile.
Commodity markets can remain irrational longer than many can stay
solvent, unfortunately.
The same game is going on in the grains, there is supposedly a glut there
too, but, like oil, a world wide price trades heavily on US government inventory
estimates, with little data on stocks in huge chunks of the world.
Unfortunately, sentiment is so much more important than it should be
in the commodity markets.
I am getting a little more conservative in my price predictions seeing
maybe $50/b by Dec 2016 and maybe $80/b by Dec 2017, but the faster output
falls the quicker the turnaround in oil prices will be.
I hope for the sake of the oil guys and the environment, that oil prices
get to $85/b sooner rather than later, but you are correct that I am wrong
on oil prices more than I am right.
The reason I have been wrong is that I have expected a steep decline
in LTO output that has not occurred, when it finally happens then within
6 to 12 months we will see oil prices rise, perhaps very quickly.
Nobody knows what oil prices will be unless a huge range is chosen ($10
to $200/b for the next 5 years would probably be right, but far from useful).
The internal accounting standards that I use to drill wells, for instance
ROI and time to payout, were actually taught to me nearly a half century
ago by numerous oilmen before me. I think there is a reason that those standards
have been passed down over generations. They work. They essentially enable
an operator to be, for lack of a better term, "self sufficient." By that
I mean reserve inventory that is being liquidated can be replaced with net
cash flow, and not borrowed funds. Well costs, oil prices and risk affect
those accounting standards and when and if to pull the trigger, sure. The
same standards SHOULD apply to the shale oil industry but of course they
haven't and profitability has taken a back seat to reserve growth, which
now of course, has proven to be a dumb mistake also. Along with a half dozen
other dumb mistakes.
I won't speculate on DUC wells and when and why they would become profitable
to complete; I think perhaps it might be a mistake to assume there will
be enough money to borrow to complete those wells. I see a lot of DUC wells
being completed in the EF; in fact that is all I see being done in the EF.
Myself and others believe the rig count in the EF is grossly over exaggerated.
EF production is going to nose dive now to the rest of the year.
S. Texas is a very mature producing province and mineral owners very
savvy; 25% royalty burdens are the norm and many of those leases are burdened
with additional ORRI's. Severance taxes are 4.6% of gross revenue and ad
valorem taxes generally another 2.4% of net revenue to the WI.
Sanchez put all of its eggs in the Catarina basket several years ago
and they are under one of the most onerous drilling commitment provisions
I have ever seen. They drill it, or they lose it. That stuff is in the liquids
rich gas interface window, and close to Mexico; they appear to have a plan
of some kind. Others still drilling anything unconventional right now, anywhere,
have no plan whatsoever. They are doing stupid things with borrowed money
they will never be able to pay back at anything less than 100 dollar oil
prices, sustained. The "breakeven" metric is now even more irrelevant because
for a shale oil company to survive they must generate sufficient cash flow
to replace very high decline rate wells… AND pay back massive amounts of
accumulated debt. That ain't gonna happen and all of them, with few exceptions,
are now in Hospice care.
Not sure how to translate 2.4% of net revenue of working interest for
the ad valorem tax.
Lets take the example where Mike owns the well with a 25% royalty and
gets $40/b at the wellhead for any oil he sells, lets assume the well produced
1000 barrels yesterday and OPEX+ water disposal+ G+A+ land and development
costs + the stuff I don't know about is $15/b.
How much money does Mike take home in this example (I am unsure about
how the ad valorem tax works)?
Before taxes it looks like $25/b times 750 barrels so $18,750 of revenue,
the severance tax would be $1380, is the ad valorem only on the $15,000
of net revenue? That would be $360 at 2.4% of $15,000 net revenue. So I
think the take home (before income taxes) would be $17,010.
Probably that is wrong, I am not good at accounting.
The net revenue would be $25/b times 750 barrels or 18750 and at 2.4%
that would be $450 for the ad valorum tax, so taxes would be 1380+450=$1830
and before income tax the take home would be $16920. If the marginal income
is taxed at 35%, then the take home pay would be $10,998 if I did it correctly
this time. :-)
On that nosedive in the Eagle Ford, does Enno Peters estimate of about
60 completions per month in the Eagle Ford in 2016 sound right? The past
3 months (Nov to Jan) the completion rate has been about 145 wells per month
and for all of 2015 it was about 185 wells completed per month. So a rate
of 60 per month in 2016 would be about 1/3 of the 2015 completion rate.
I expect something like 90 wells per month, but my guesses are usually not
very good.
From your comment above I am thinking that you might choose something
like 40 completions per month, maybe lower.
The main and probably only reason they are drilling in non-sweet spots
in the Eagle Ford, now, is to hold the lease. I think, even the DUCs that
are being completed now fall into that category. Or, in some cases, like
Dennis says, the completion cost as current year capex would be covered.
The only reason a company would drill with a three year payout, is if they
had adequate lending or capital resources. Otherwise, they well should mainly
pay for itself the first year, or they lose the capex for next year in cash
flow loss.
Most of the revenue is in the first year, about 63% of the oil flows
in the first year. For the well to pay out in the first year would take
an oil price of $117/b, but after a few years of wells you have cash flow
not just from this years wells but the cash flow from previous years as
well, this is why the 36 month rule probably works, to get the operation
started you would need to borrow some money, but if you do it right you
pay off those loans after 5 years or so and then work from cash flow and
never need to borrow money, if you do it right and don't have oil prices
in the toilet for a couple of years.
Maybe Hamm has better contacts on Wall Street? That's all it takes, remember
that there are different rules and laws for the regular citizens and for
those that fund campaigns. It is what it is.
Why are the shale guys given massive lines of credit based on the"
assets" that are still in the ground and essentially worthless in today's
market?
Why did the federal reserve step in during the redetermination period
last year and tell the bankers to encourage the sale of assets rather than
call the loans?
Why are some people forced to mark to market while others skate?
Why aren't guys like me and you given say a 20 million line of credit?
I wouldn't sell my soul to those assholes anyway, so no need to answer that.
"Analysts" are projecting a 30% haircut on the shale guys lines of
credit in April, why only 30%? How about 100%?
If you and I were running a pretend business, would they loan us a lot
of money and then look the other way when it all heads south on us? They
would if Wall Street has figured out how to make big bucks and on it.
One thing some argue is that CLR has so much acreage that they got so cheap.
My response to that is go look at how much they have expiring. They are
not completing any wells in Bakken, meaning all of their acreage in ND and
MT is very uneconomic at Q1 prices.
So we are left with the mostly gassy OK acreage, with wells that are
more costly than, but far less productive than the Marcellus. Again, we
really need better info, but CLR companywide went from 70% oil 30% gas in
2014 to projected 60%/40% in 2016.
Their BOE is poised to drop 10% in 2016, but oil will drop much more
steeply.
I just don't see how under $2 gas works, although they do have some gas
hedged, unlike oil.
So if an OK well produces 70% gas and ngls, hypothetically, with wellhead
oil of $35 and gas of $1.75, per BOE is just $17.85. Over the life of the
well, ignoring all other expenses, you are looking at just under $20 million
of gross revenue using their EUR of 1.1 million BOE. That is over 30 plus
years, I assume.
I don't get SCOOP and STACK attractiveness. Devon did pay big $$ for
acreage there recently, another head scratcher, especially given their enormous
Barnett shale exposure, which right now is likely negative on an operating
basis. DVN used to be cream of the crop independent, but have to wonder?
OK C + C production per day per EIA has fallen from a peak of 473K in
3/15 to 400K in 12/15, very steep, and even steeper when you consider there
is a stripper production C + C base of 130-150K per day (although it likely
declined at least 10% as well during the same timeframe).
I do agree, part of the collapse is due to Mississippian activity falling
off the table. See SD and CHK, for example.
I just don't see the hyped OK plays adding much crude, based on available
data. Would be neat if all states had ND data.
"... The Environmental Protection Agency (EPA) has not collected specific inspection and complete or consistent enforcement information, or consistently conducted oversight activities, to assess whether state and EPA-managed Underground Injection Control (UIC) class II programs are protecting underground sources of drinking water, ..."
"... to conduct specific activities to ensure that the state and EPA-managed programs are protecting underground sources of drinking water. ..."
"... the information EPA collects is at a summary level and not specific enough to assess whether states are meeting inspection goals established to protect underground sources of drinking water. ..."
A report from the Government Accountability Office (GAO) found that
regulators at the Environmental Protection Agency (EPA) have not been
keeping tabs on whether or not wastewater from fracking is seeping
into drinking water.
"
The Environmental Protection Agency (EPA) has not collected
specific inspection and complete or consistent enforcement
information, or consistently conducted oversight activities, to assess
whether state and EPA-managed Underground Injection Control (UIC)
class II programs are protecting underground sources of drinking
water,
" a February
report
from the GAO found.
This is not the first time the EPA
was found to be negligent of its duties, the report noted. The GAO has
discovered the occurrence of similar problems since 2014.
The EPA's current method of protecting drinking water has largely left
the ball in the states' courts. States are allowed to oversee the
regulation of their injection sites, provided that they meet EPA
criteria regulated by the Underground Injection Control (UIC) program.
Forty states are currently approved to have primary responsibility for
maintaining their injection sites, leaving 10 states to be managed by
five EPA regional offices. However, the report notes that the EPA is
still obligated "
to conduct specific activities to ensure that the
state and EPA-managed programs are protecting underground sources of
drinking water.
"
Despite this, the GAO found that the EPA has not collected
inspection and enforcement information to determine whether or not the
programs they either oversee or approve have been protecting drinking
water from fracking wastewater.
Fracking wastewater is a combination of heavy metals – such as arsenic
or mercury – and salt water and various other unnamed chemicals.
Despite the alarm bells that introducing arsenic to groundwater should
set off, the GAO's report states, "
the information EPA collects is
at a summary level and not specific enough to assess whether states
are meeting inspection goals established to protect underground
sources of drinking water.
"
The information that the EPA has
been providing does not seem to be helpful, either. It hasn't been
specific enough to track the progress states have made towards meeting
EPA standards. For example, Pennsylvania is reported to have 7,788
active wells in the state but the EPA's data showed that they had no
data for the following inspections: emergency and complaint response,
mechanical integrity tests witnessed, enforcement, well pluggings
witnessed, well constructions, witnessed or routine inspections.
A non-profit investigative news organization, Public Herald,
reported
that Pennsylvania's Department of Environmental
Protection (DEP) has received 2,309 water complaints from 17 of 40
counties where fracking took place. Vox
reported
that 18 cities in Pennsylvania have lead levels even
higher than those recorded in Flint, Michigan, where a state of
emergency has been declared by President Obama due to water
contamination.
\Blatant lies are in blue. Libya can't rump up production as civil war is
still ongoing and there is no signs ofreconsiliation betwtnn two major pforces
with ISIS as a third force, a spoler.
By the end of 2015, Saudi Arabia supplied 8.1 percent of the global oil
demand, which is higher than the 2014 figure of 7.9 percent, but still well
below its 8.5 percent global market share in 2013.
Saudi Arabia realized that the price war was not helping it to increase
its market share, instead, the price was taking a toll on revenue due to
plummeting crude oil prices. Ballooning budget deficits, depleting foreign
reserves, and the necessity of introducing unpopular measures brought about
memories of the
Arab
Spring.
Similarly, Russia, which is pumping at close to its peak capacity, is
worried about losing its market share in
Europe to Saudi Arabia.
The other nations participating in the meeting are also pumping near
maximum limits. With a production freeze, most nations will retain their
existing clients without worrying about losing them to the competitors.
This excludes Iran and Libya, which will
not take part in the production freeze talks, as both are in the process
of ramping up production.
Initially, this all started out as a price war with U.S. shale oil drillers
as the Saudi's feared they would lose their dominant hold over the oil markets.
But the outcome was not what the Saudi's expected. The Saudi's found themselves
isolated with no support from the U.S., fearing alienation if they continued
to oppose the majority demand of the OPEC nations to cut production.
See an interesting interview (slightly edited Google translation). Looks like the new oil reserves
in Russia are very expensive, on par with the US shale and the old are mostly depleted.
The President of the Union of oil and gas Industrialists of Russia Gennady Shmal told "Izvestia"
about what oil price is needed for Russia and when the industry will overcome dependence on imported
equipment
Q: OPEC believe that soon the price of oil should stabilize at a "normal", but not a too
high level. What do you think, what level of oil prices can be considered normal for Russia today?
A: If we are talking about a fair price of oil globally, I believe this is $80 per barrel.
Keep in mind that a significant part of oil – about a third – is produced offshore, where the
cost can be high. And there is a deep-water shelf, for example, in Brazil, where one of the first
well cost more than $300 million. Subsequent wells would of course cost less, around the half
the price, but still very expensive. Therefore, the capex of this oil extraction is high enough.
The breakeven price of our oil production without taxes is around $10 per barrel, nationally.
But when we include taxes, we get around $30 per barrel. But this cost is not no tragedy for us.
I remember a time when a barrel of oil was less than $10. Then we dreamed about the price rising
to $20.
When the three-year average cost of oil was above $100 per barrel, we got too used to
it. But the high price has one big drawback – it can negatively affect demand and stimulates production. And that's
what basically happened.
Therefore, now our oil companies might be now content with the price around $50-60
per barrel.
And I think in general, globally it would be OK price for both producers and consumers. Even
for the United States that would be an acceptable price. Canadians with their oil sands would
need a higher price – up to $80. But as the Canadian oil going to the United States, anyway,
losses can
be compensated with the domestic shale production and they would have to come to a common denominator.
Q: You're talking about this level of prices, without taking into account the Arctic shelf
projects?
A: Arctic shelf – it is quite another matter. My point of view on this issue is different from
the most popular view that exists today. I believe that we need to engage the shelf in terms of
prospecting, exploration. We generally do not even know that there, how much oil we have on the
shelf. We have so far only preliminary estimates of reserves – C2, C3 (preliminary estimated reserves,
potential reserves). And in order to have A, B, C1 (proven reserves), it is necessary to drill.
I am sure that we are not ready to work on the Arctic shelf both technically and technologically,
nor economically.
We do not have qualified people for that too. First of all, we need several platforms. One
platform for "Prirazlomnoe" that we now have been built for more than 15 years, and we sank into
it about $4 billion
And this one is not a new one, this is a second hand equipment. In order to seriously develop
the shelf, we need not one, but dozens of platforms, support vessels. Also offshore operations
must have the regulatory framework.
That means all the necessary technical regulations, standards. We have nothing. But the main
thing – the cost effectiveness of this oil: it is necessary to consider how profitable in today's
environment to produce Arctic oil. So, I think we now have enough things to do on land – in Eastern
Siberia, for example, before we need to jump with two legs into arctic oil extraction.
Q: How record oil production that Russian oil companies demonstrate in the past few years,
affects the structure of the Russian economy?
A: First of all, I believe that there are no records. Yes, we produced 534 million tons. But
in 1987 the Russian Federation has produced 572 million tons. Compared to the 1990s there is a
certain growth in recent years, but I would not talk about records. Second, the question about
optimal production volumes is a very complex one. The main question to which I have no answer
today: how much oil we need to extract?
Without answer on this question it is impossible to say whether we produced too little oil
or too much. If we consider that in 2015 we extracted more then 246 million tons, then, I would
say
we produced too much. This is not the way this business should be run. The fact is that Russia
can not influence the world oil price too much because we make only 19-20% of the market. But
we can and should make the country less dependent on raw oil price fluctuations. We could process
all extracted oil and export mainly gasoline and diesel fuel, as well as products with high added
value in the form of chemicals, petrochemicals, composite materials.
That means that we need to adopt a different approach to the structure of our industrial production.
For example, China in the last twenty years has built a series of petrochemical plants, and
today they have the chemical products sector with total value of production about $1.4 trillion,
or around 20% of China GDP. It should be noted that China's GDP is eight times more than ours.
Our chemical sector production is around $80 billion – 1.6% of Russia's GDP. In 2014 alone BASF
Chemicals (which is a single German company) produced 1.5 times more than all the chemical enterprises
of Russia. Petrochemicals may be the critical link, pulling which we could change the whole structure
of industrial production in Russia.
Q: If we talk about production prospects, what we levels of production we can expect in
the future, based on our today's oil reserves
structure?
A: Unfortunately, today we do not have a reliable statistics. According to some estimates,
of
those oil reserves that are under development, about 70% are so-called hard-to-extract oil. That
is, stocks, where oil production is complicated mining and geological, geographical conditions.
In these fields there might be tight reservoirs, reservoirs with low permeability, viscous
oil, etc. By the way, today we have no any clear definition of hard-to-extract inventory, although
this defines the benefits that can be granted to companies to work on the fields with such
reserves. Therefore we need serious work on the classification and definition of reserves that
will be put into the hard-to-extract category.
By the way, the current production mostly (about
70%) relies on the old fields, which now have a high water content, high percentage of
depletion of reserves. Of course, they will not last forever. Therefore, sooner or later, will
have to enter the development of the fields with hard to recover reserves.
Q: Extraction of hard inventory requires new technologies, which in Russia does not fully
have. What are the tools the government has to encourage their development?
A: The state has a lot of tools to stimulate those technological developments. Our tax
system can perform stimulating role along with fiscal and re-distributive functions. However,
our tax system currently performs mostly fiscal function and only slightly – re-distributive
function. Simulative
function is not yet here. As an illustration, take Texas, USA: if the well there gives 500 liters
of oil per day, it is considered a cost-effective – this way the tax system is built. For us a
well, which gives 4000 liters per day, is already viewed as unprofitable, and is moved into the
idle fund. Now, of course, some work is being done in respect of incentives for low producing
wells – MET rates introduced.
But I believe that the future of our oil industry is largely dependent on whether we are
able to create the technology of oil production from the Bazhenov Formation or not. Because the
geological reserves of the Bazhenov Formation in Western Siberia are more than 100 billion tons
of oil. Even at a conservative estimate, if it is possible to extract around 40-60 billion tones
of oil with the current technologies.
And please remember that all we have in Russia today, all C2 stocks, are just around 28
billion tons So if we find the necessary technology that can be applied to the
Bazhenov Formation,
the peak oil production issue for Russia can be resolved for a sufficiently long period of time.
And in respect of the help from the state it could be such measures such as tax holidays, tax
exemption, reduction in mineral extraction tax, etc.
But currently the Ministry of Finance is interested only in filling the budget. We need to
make sure that taxes are fair. For this, they must be applied to the end result of production.
In our country today we have taxes on earnings – up to 65-70% of the average withdrawal. Norway,
for example, has high taxes too, but they are levied on profits.
Taxes should be applied to profits, not revenue, the latter for us looks like the absolutely
wrong approach.
Q: According to various estimates, in the Russian oil and gas industry today up to 45-50%
of the equipment are imported. Will Russian oil companies to move away from this dependence
in view of sanctions. And what should be role of the state in achieving this results?
A: At the request of "Lukoil" we did last year such a study. We've got that on average
53% of drilling equipment in Russia is imported. Of course, we must bear in mind that, for
example, pipes, with rare exceptions, we can produce domestically. But today there are some
technological segments where there is a high dependence of Russian oil from foreign suppliers.
Those segments include: software control, automation and remote control.
Today, the Ministry of Energy to the Ministry of Industry set up working groups that
are engaged in import substitution. And we have already been there for some equipment that is
competitive with foreign models. So, one of the factories in Perm began to produce excellent pumps,
which match in quality the best foreign analogues. Some factories in Bashkortostan started the
production of valves, cut-offs switches and other fittings for any type of drilling. But it is
not necessary to replace all the foreign oil production equipment. And, of course, we can not
do this.
We make good tanks, but we do not produce luxury cars like Mercedes. We just don't produce
them. I believe that if we had a dependence on imports in the range of 20-25%, it would be acceptable
and probably close to optimal.
Today we can get rigs from China. Our experts say that they are of a sufficient level of quality.
We also have a factory, which in 1990 produced drilling rigs – "Uralmash". Then, the plant produced
365 sets of drilling equipment per year. In the past year – only 25.
Therefore we need to rely on the Chinese oil extracting equipment, as they have learned to
make a decent drilling equipment. And for the price, no one can match them. I believe that we
need to very clearly define few areas of oil extraction equipment, which are critical for us.
and then pay close attention and allocate resources to those areas. We do not need to cover everything.
And I am sure that before the end of 2020 Russia could reduce this dependence on foreign equipment
to 25-30%.
"... there is one thing I do know, that is if oil prices remain in the region of $39 a barrel then production will definitely continue to fall and fall rather dramatically. And that is not just in the USA but around the world. ..."
"... A prolonged price of $39 dollars a barrel would be devastating for the oil industry. ..."
"... they will have to rise to a lot higher than $39 a barrel, or even $50 a barrel. $50 a barrel will not be high enough to cause world production to start to increase again. ..."
"... That is because oil at above $100 a barrel did not cause oil in the rest of the world, outside the US and Canada to increase in the last five years. Well, that is outside of OPEC. OPEC, or Persian Gulf OPEC, is another matter. That is because politics come into play here and not just geology. ..."
"... I would be surprised if we had not reached $100/b by then unless there is a severe global recession between 2016 an 2018. ..."
WTI averaged $30/b for the month of February. Do you believe oil prices will remain under $40/b
for the remainder of 2016? I do not. Output will fall by 700 kb/d in the US to 8450 kb/d by the
end of the year and oil prices will rise, to $50/b or more in my opinion.
Dennis, I have no idea where oil prices will remain for the remainder of 2016. But there is
one thing I do know, that is if oil prices remain in the region of $39 a barrel then production
will definitely continue to fall and fall rather dramatically. And that is not just in the USA
but around the world.
A prolonged price of $39 dollars a barrel would be devastating for the oil industry.
Yes, I do believe oil prices will rise. But they will have to rise to a lot higher than
$39 a barrel, or even $50 a barrel. $50 a barrel will not be high enough to cause world production
to start to increase again.
Any increase in production caused by an increase in price to above $50 a barrel would have
to come from the US and Canada. That is because oil at above $100 a barrel did not cause oil
in the rest of the world, outside the US and Canada to increase in the last five years. Well,
that is outside of OPEC. OPEC, or Persian Gulf OPEC, is another matter. That is because politics
come into play here and not just geology.
I agree, $39/b will not cause the decline in output to stop, but my guess is that the decline
would be faster at $30/b than at $40/b and faster at $40/b than it would be at $50/b. In fact
at $50/b the decline might stop eventually, but I agree with Guy who suggested $60/b will be needed
to get drilling to increase and probably more like $80/b for 6 months before any noticeable increase
in US and Canadian output. That might not occur until 2018, it will depend on the World economy
and demand for oil. I would be surprised if we had not reached $100/b by then unless there
is a severe global recession between 2016 an 2018.
"... That honestly sounds like a difficult way to make a living, but I guess oil-industry networking is so lucrative that it drives people to crime. ..."
"... Right now there is an aura of fear among the general population and even the expats in Saudi. The police throw people in jail for the slightest provocation. No one dares to protest or even speak against the regime. They could be jailed or even publically whipped. But if things get really bad and enough people lose their fear of the police, then all hell could break loose. ..."
"... Then there are the mullahs. They have authority over the populace which the authorities allow in order to keep the peace, and to keep the people in their place. I have seen them hit people with a cane for window shopping during prayer time. All stores must close during prayer time. ..."
"... Saudi Arabia is basically a police state with the mullahs acting as if they are part of the police. But there is a deep resentment among the people with little money and no power. It is a powder keg that could blow if things get really bad. And when oil production starts to slide things could get bad very fast. ..."
Saudi Arabia may be preparing for a post-oil world now, but back in 2014 the oil industry
was so hot that the founder of an oil-industry networking site allegedly hacked into another
oil-industry networking site (that he had also founded!) to steal customer information, solicit
new customers, and ultimately sell his new company to his old company. That honestly sounds
like a difficult way to make a living, but I guess oil-industry networking is so lucrative
that it drives people to crime.
Alleged crime. Was so lucrative. Anyway here is the criminal
case against the founder, David Kent, who founded Rigzone in 2000, sold it to DHI Group in
2010 "for what ended up being about $51 million," founded Oilpro after his non-compete expired,
and allegedly hacked into Rigzone to get customers.
Outside of the oil industry - by which
I mean, "on Finance Twitter" - Oilpro is perhaps best known for its delightful Instagram account,
which I hope will be maintained regardless of the outcome of this case.
Saudi Arabia is getting ready for the twilight of the oil age by creating the world's
largest sovereign wealth fund for the kingdom's most prized assets.
Over a five-hour conversation, Deputy Crown Prince Mohammed bin Salman laid out his vision
for the Public Investment Fund, which will eventually control more than $2 trillion and help wean
the kingdom off oil. As part of that strategy, the prince said Saudi will sell shares in Aramco's
parent company and transform the oil giant into an industrial conglomerate. The initial public
offering could happen as soon as next year, with the country currently planning to sell less than
5 percent.
"IPOing Aramco and transferring its shares to PIF will technically make investments the source
of Saudi government revenue, not oil," the prince said in an interview at the royal compound in
Riyadh that ended at 4 a.m. on Thursday. "What is left now is to diversify investments. So within
20 years, we will be an economy or state that doesn't depend mainly on oil." Almost eight decades since the first Saudi oil was discovered, King Salman's 30-year-old son is
aiming to transform the world's biggest crude exporter into an economy fit for the next era. As
his strategy takes shape, the speed of change may shock a conservative society accustomed to decades
of government handouts.
Buying Buffett and Gates
The sale of Aramco, or Saudi Arabian Oil Co., is planned for 2018 or even a year earlier,
according to the prince. The fund will then play a major role in the economy, investing at home
and abroad. It would be big enough to buy Apple Inc., Google parent Alphabet Inc., Microsoft Corp.
and Berkshire Hathaway Inc. - the world's four largest publicly traded companies.
I would bet that Deputy Crown Prince Mohammed bin Salman is a believer in peak oil.
I bet they think the political risk of being invested in a nation loaded with would be terrorists
is too high. They plan to park a chunk of cash offshore and wait for the shoe to drop. I wouldn't
invest in Aramco given this reality.
There can never be a transition from oil in Saudi Arabia. When the oil starts to seriously decline
there will be turmoil in Saudi.
Right now there is an aura of fear among the general population and even the expats in Saudi.
The police throw people in jail for the slightest provocation. No one dares to protest or even
speak against the regime. They could be jailed or even publically whipped. But if things get really
bad and enough people lose their fear of the police, then all hell could break loose.
Then there are the mullahs. They have authority over the populace which the authorities allow
in order to keep the peace, and to keep the people in their place. I have seen them hit people
with a cane for window shopping during prayer time. All stores must close during prayer time.
Saudi Arabia is basically a police state with the mullahs acting as if they are part of the
police. But there is a deep resentment among the people with little money and no power. It is
a powder keg that could blow if things get really bad. And when oil production starts to slide
things could get bad very fast.
"... Maybe they know they're peaking and this is a big psy-op/economic warfare to confuse the competition, maybe it's a tumultuous power transition that lacks strategic continuity and the new king/clique is not a good strategist ..."
"... This hypothesis along with "hurt Russia" hypothesis (which simultaneously hurt their main regional rival Iran) are the most plausible IMHO. Please note that KSA is a vassal of the USA. So by extension it looks like "team Obama" is not a good strategist either. ..."
"... A recent WikiLeaks revelation cited a warning from a senior Saudi government oil executive telling that the kingdom's crude oil reserves may have been overstated by as much as 300bn barrels, or by nearly 40%!" the American political analyst underscores. ..."
"... "Where Americans' interests are concerned, while President Obama has been parlaying trendy terms like 'renewable energy' and his supposed climate change agenda, the fact is petroleum still powers 96% of all transportation in America," Butler emphasizes. ..."
"... To paraphrase the old song, oil makes the world go round… ..."
Does anybody have any insight or interesting ideas on Saudi Arabia? I believe they are disingenuous
with their 'market share' explanation…. I'm just using made up numbers here but my point is that
they have sacrificed 90 billion in profit to get 30 billion in market share. Last time I checked
business was about profits not about market share. If the IMF report I saw is correct then SA
needs $106/barrel to balance the national budget (not sure how that works at $106/barrel when
their 2015 budget was $229 billion but expenditures in 2015 ended up being $260 billion
http://www.bloomberg.com/news/articles/2015-12-28/a-breakdown-of-the-2016-saudi-budget-and-its-implications
). For the sake of argument lets call their national budget 'corporate overhead'. I suspect
SA is at a crossroads of some kind. Drilling rigs are up quite a bit the last couple years but
production is up slightly/wobbly.
Maybe they know they're peaking and this is a big psy-op/economic warfare to confuse the
competition, maybe it's a tumultuous power transition that lacks strategic continuity and the
new king/clique is not a good strategist….. I could go on. The intrigue could be deep or
shallow. Anybody have a good theory or read on where SA is at and going to? My guess is 30 million
people soon to be on foot headed for Europe.
The World C+C output has either peaked (in 2015) or will do so within 10 years, we will have
to wait 10 years to find out. Oil guys such as Fernando Leanme have claimed that a rise in oil
prices to $150/b (in 2015$) will make a lot more of existing oil resources profitable to produce,
whether this is enough to offset depletion is an open question as is the level of oil prices that
the World economy can afford.
On oil prices we can do the following back of napkin estimate. World real GDP at market exchange
rates about $80T 2015$ and assume 2% real GDP growth for the next 5 years which would bring us
to about $88T real GWP in 2015$ in 2020. Let's assume the world can only spend 4% of GWP on oil
without causing a recession and that C+C output remains at 80 Mb/d in 2020 (29 Gb/year).
The 4% of 88T is $3520B and we divide by 29B and get $121/b in 2020. An oil price of $150/b would
be close to 5% of GWP and would likely cause a recession.
I will let the oil guys comment on whether $120/b is enough to bring on adequate oil supply
to avoid a recession, a crisis will eventually occur as I expect that demand will eventually outrun
supply in the short term (next 10 years) and oil prices will spike above $150/b and lead to a
global recession. At that point the peak may finally be clear to all and a transition away from
oil will begin in earnest.
maybe it's a tumultuous power transition that lacks strategic continuity and the new king/clique
is not a good strategist
This hypothesis along with "hurt Russia" hypothesis (which simultaneously hurt their main
regional rival Iran) are the most plausible IMHO. Please note that KSA is a vassal of the USA.
So by extension it looks like "team Obama" is not a good strategist either.
A recent WikiLeaks revelation cited a warning from a senior Saudi government oil executive
telling that the kingdom's crude oil reserves may have been overstated by as much as 300bn
barrels, or by nearly 40%!" the American political analyst underscores.
Butler refers to a phenomenon called "peak oil." According to M. King Hubbert's theory,
peak oil is the point in time when the maximum rate of extraction of petroleum is reached and
the crude capacity will only decline.
Whether one likes it or not, peak oil has been reached, the analyst underscores.
However, while the global oil reserves are decreasing steadily, Riyadh has been pumping
its crude faster than anyone.
And here is the root cause of Saudi Arabia's warmongering. To maintain its status quo, the
Saudi kingdom has established an alliance with
Turkey , planning to
seize Syria and Iraq's
oil fields.
Still, it's only half the story, since the global economy also remains petroleum-centered.
"Where Americans' interests are concerned, while President Obama has been parlaying
trendy terms like 'renewable energy' and his supposed climate change agenda, the fact is petroleum
still powers 96% of all transportation in America," Butler emphasizes.
To paraphrase the old song, oil makes the world go round…
The question then arises, whether we are on the doorstep of new "energy wars."
In terms of a C&C peak pushed out for 10 years my question would be "Where's the oil?" even at
$120 per barrel.
Apologies that the following is too long, with no charts for many (or any) to read all the
way but some parts may be of interest.
The last few years have shown declining oil discoveries since 2010. What has been found is
more often than not deep water and relatively small. Such fields generally have short plateaus
and steep decline rates (not much better of those seen in LTO for fields less than about 150 million
barrels). The larger basins found offshore have been in the 5 to 10 mmboe range rather than around
50 found in the earlier days.
I don't have access to IHS or Rystad databases but picking amongst recent press releases I'd
say 2013 was about eight billion, 2014 nine or so and 2015 four or five. This year maybe only
three discoveries with a significant amount of oil – Kuwait might be significant. More gas than
oil is being found
There has been a noticeable reduction in development times for projects in GoM and North Sea
in recent years from around 7 years down to as low as 3. That to me indicates a dearth of good,
large projects to choose from.
Of some of the main producers:
Saudi; 50% increase in rig count since 2012 to keep production just about steady, announced
"the most fields discovered" in 2012 or 2013 but a combination of oil and gas and they didn't
give quantities, have spoken of developing tight gas and solar to allow increased oil exports.
Russia; some conflicting announcements but it looks like a decline next year, largest recent
find was by Repsol at about 240 mmboe. Sanctions have had an impact and may continue to do so,
especially offshore.
Canada; very little drilling activity, four fields coming on over the next 2 to 3 years will
add up to 400,000 bpd, but then nothing planned and at least 4 year lead times for tar sands projects.
Tar sands projects have long plateaus but it appears some of the earliest mining operations are
starting to see thinner seams so decline will become more evident.
Brazil; cut backs in developments and may start to decline next year, they have mostly deep
water production with high decline rates and rely on continuous stream of new projects to maintain
production – the oil price, 'carwash' scandal, debt/bankruptcy problems and (maybe) just running
out of suitable projects have stopped this, expect 6 to 10% decline through 2017.
Mexico; EOR developments seem to have run out of steam and not much interest in their opening
up the industry to outsiders, expect at least 4% per year decline.
USA; discussed a lot here, some expansion in GoM through 2017, unknown response to LTO drillers
depending on price and credit availability, liquids from gas have been another significant and
rapid boost to production recently which EIA indicate are still rising (mostly for NGLs), but
surely must run out of steam sometime soon. Possibly some shut in stripper wells won't be worth
restarting.
China; reliant on EOR recently to maintain plateau (including a lot of steam flood from the
EIA report) but predicting 5% decline next year, no great success on offshore discoveries.
North Sea; saw a spate of projects recently, mostly heavy oil, with a few more to come over
the next two years and then Johan Sverdrup and Johan Castberg but these only delay decline for
2 or 3 years, recent discoveries especially in UK sector have been very poor.
Offshore Africa; Nigeria and Angola have a number of projects this year and next ( a bit more
oil than gas), but after that I'm not clear, political unrest might be particularly important
here as well. That said recent exploration success has been relatively good in Africa overall
(e.g. Kenya, Ghana).
Venezuela; not sure if their numbers can be trusted but they seem to be in decline, I know
little of their particular technical issues but assume that in order to increase extra heavy oil
production they would need new upgraders and possibly a source of natural gas, like Canada, and
possibly dedicated refineries to handle the heavy metal content (and assuming they can find willing
creditors and EPC partners).
Iran and, possibly, Iraq and Kuwait look like the only likely areas that can show some increase,
but Iran is developing South Pars gas field more than oil and Iraq/Kurdistan might have run out
of impetus. Burgan field in Kuwait looks in better shape than other aging super giants and Kuwait
has an active exploration and development program. And of course maybe US LTO takes off again,
$80 appears a threshold but that is for WTI, ND oil has a $10 discount, the lighter LTO oil everywhere
may be lower still and overall away from the sweet spots above $100 might be nearer the mark.
The seven largest oil majors have shown declining reserves of 1 and then 2 billion barrel equivalent
over the last two years – this may be purely price related, but I'm not so sure especially with
BP, Shell and Chevron looking to sell assets, also I don't have the figures but I'd guess that
they have lost more in oil reserves as some of their big finds have been for gas.
To ramp up of production is going to be dependent on a work force which was aging and retiring
in 2014 and now has been decimated by layoffs and recruitment cut backs. Increasing prominence
of environmental issues may hinder both future recruitment efforts and the pace at which projects
can be developed. Significant new oil, including reserve growth, has to come from deep water –
those rigs are complicated and very expensive to run, a lot are currently being stacked.
Ramp up also needs the main stakeholders to regain their acceptance of financial risk, which
is currently as low as I can remember, and significantly higher sustained prices. The other side
to the equation for prices is demand. The world economy doesn't look great to me, we're due a
recession based on approximate 8 year cycles, TPTB have chucked everything but the kitchen sink
at it and industrial output is definitely in decline or growing only slowly (I don't know how
energy use is split for service versus manufacturing but I'd guess it's of smaller relative importance
in the service sector). A relatively small oil price increase might be enough to kick a recession
off properly.
Hubbert Linearization of C+C less oil sands suggests about 2500 Gb for a URR, in the past this
method has tended to underestimate the URR, we have produced about half of this so far. There
is also about 600 Gb of URR in the oil sands of Canada and Venezuela. The USGS estimates TRR of
C+C less oil sands at about 3100 Gb, I use the average of the HL estimate and USGS estimate with
a URR of 2800 for C+C less oil sands and oil sands URR of 600 Gb. Total C+C URR is 3400 Gb in
my medium scenario. If extraction rates continue to grow at the rate of the past 6 years and then
level off we get the scenario below.
Model based on Webhubbletelescope's Oil Shock Model.
I personally believe Saudi Arabia's oil production strategy since 2014 has 3 pillars:
1. Maintaining market share: This is Saudi Arabia's primary asset – the ability to exert power
over other countries via its oil supply. Saudi Arabia has the power to cripple rivals by flooding
the market, and can also cripple OECD countries by limiting supply. Without the PERCEPTION that
this is true Saudi Arabia's only genuine political leverage evaporates.
2. Group Think: The behavior of the new Saudi King Salman, the revolt within the Royal Family
as a result of his policies, and the breaking of tradition to name his "ambitious" 31 year old
son as the heir apparent all suggest a breakdown of technocratic, informed policy. Say what you
will about Saudi Arabia, but its political structure was technocratic until January 2015. Since
then I believe there is a significant influence of Group Think, and there's consensus that the
young son if currently deciding policy, and often chooses against the advice of experienced council.
This 31 year old who doesn't listen to expert advice, who has caused a revolt within the House
of Saud, may very well believe that Saudi oil fields can produce any quantity of oil, for however
long he demands without consequence or depletion issues. It's important to note that the previous
King and Council decided on the current "market share" strategy, and deep animosity toward Iran
as it re-enters the market may influence SA's strategy to their own detriment.
3. There were several long-term projects such as Manifa and Khurais that were coming online
regardless of a glut. These mega-projects were guaranteed to put a floor under production numbers.
In concert with the sustained high rig counts to win the "maintain market share" strategy SA's
production reached record levels.
It is important to note that it took a truly herculean effort, record rig counts, and re-developing
several mathbolled fields to raise production from 9.5 mbpd in 2008 to 10.25 mbpd in 2015. They
threw in the kitchen sink and got 750,000 bpd of extra production.
That is telling in and of itself.
SA has followed an explicit strategy of maintaining market share i.e. producing every barrel
they possibly can. SA took on a multi-year effort to push their production as high as possible.
We now know SA's maximum possible production, and the incredible effort required to maintain it.
I personally do not believe SA will ever be capable of producing 11 mbpd.
It is not at all unknown for an aggressive minded political leader to bite off more than he can
chew, and choke on it, due to being unwilling to listen to expert advice.
Hitler almost for sure could have won a substantial empire and Germany could probably have
kept control of it for a quite a long time, if he had been ten percent as talented in military
terms as he was in political terms ( not to mention being a world class evil character of course)
IF he had LISTENED to his very capable senior military guys.
Brian is probably right. This young SA guy, King Salman , may be in the process of making the
same mistake, namely failing to listen to his technical guys.
Even if Salman realizes he is not going to be able to increase production much if any, or even
maintain it at current levels mid to long term, he may still be full of testosterone, and willing
to bet his kingship, and potentially his entire country, on his current policies.
It is well known, a trusim or cliche, that one of the best ways a leader in trouble can maintain
and consolidate his power is to go to war, and SA is (obviously in the opinion of many observers
) fighting an economic war with rival oil producing countries.
I have long believed that SA is a powder keg awaiting a spark. One serious mistake on the part
of the leadership could set it off. One random event could set it off. The House of Saud has made
many a bargain with the devil in the guise of the super conservative priesthood which enables
it ( SO FAR! ) to maintain control of the country without resorting to the business end of rifles.
Radical change is coming to SA, because it information moves too freely in the modern world
to keep the people in the dark much longer. Too many privileged young folks are traveling, and
doing to suit themselves, and too many poor people are growing more radical by the day. Too many
outsiders are working in the country.
If it weren't for oil, and to a much lesser extent, some other mineral wealth, the rest of
the world would barely notice even the existence of that mostly desolate patch of sand.
This is purely anecdotal. For the past three years, we have rented our unused bedrooms to several
Saudi students, here to study in the US. They first go to a language school, and then on to a
university. In just this brief time, they speak of the Saudi government no longer footing the
bill for this. This means that the student's families must send money. For some, this is clearly
not a problem, but for many it is.
The young guy is Mohammed bin Salman, second in line to the throne last I looked, Defense Minister,
in charge of an overlook body for Saudi Aramco, and other things. He may, as you say, not be listening
to his technical advisors–may in fact be a loose cannon–and he is widely considered to be the
power behind the throne.
He isn't the king, though. That's Salman himself, and he is often said not always to know where
he is or what he has just said. Scary situation there, you bet.
There was an interesting documentary on Saudi Arabia last night on Frontline.
Lots of Saudis living in poverty, women begging in the street to feed their families, while
very nice cars drive by. Shiite minorities in the eastern (oil-producing) region protesting and
being repressed by the government.
There was hidden-camera footage inside a shopping mall - much like a mall in the US, with a
Cinnabon, Victoria's Secret, high-end makeup counter, etc, but very few people. But what the mall
also had was religious police beating people who buy the stuff, and it showed them beating what
appeared to be a plump middle-aged housewife, covered head-to-toe in a black burqa, who was buying
makeup. So the government is simultaneously allowing the mall to sell this stuff and paying religious
police to beat those who buy it.
It very much looked like a powder keg that could blow at any time.
Frontline documentaries are a personal favorite of mine. Always stellar, genuine investigative
news journalism. Even on subjects I think I am fairly knowledgeable about I always come away having
learned a lot.
It is 2nd only to Ken Burns' documentaries, but it's hard to compare since his documentaries
are history documentaries and Frontline is investigative news.
"... The last few years have shown declining oil discoveries since 2010. What has been found is more often than not deep water and relatively small. Such fields generally have short plateaus and steep decline rates (not much better of those seen in LTO for fields less than about 150 million barrels). The larger basins found offshore have been in the 5 to 10 mmboe range rather than around 50 found in the earlier days. ..."
"... There has been a noticeable reduction in development times for projects in GoM and North Sea in recent years from around 7 years down to as low as 3. That to me indicates a dearth of good, large projects to choose from. ..."
In terms of a C&C peak pushed out for 10 years my question would be "Where's the oil?" even at
$120 per barrel.
Apologies that the following is too long, with no charts for many (or any) to read all the
way but some parts may be of interest.
The last few years have shown declining oil discoveries since 2010. What has been found is
more often than not deep water and relatively small. Such fields generally have short plateaus
and steep decline rates (not much better of those seen in LTO for fields less than about 150 million
barrels). The larger basins found offshore have been in the 5 to 10 mmboe range rather than around
50 found in the earlier days.
I don't have access to IHS or Rystad databases but picking amongst recent press releases I'd
say 2013 was about eight billion, 2014 nine or so and 2015 four or five. This year maybe only
three discoveries with a significant amount of oil – Kuwait might be significant. More gas than
oil is being found
There has been a noticeable reduction in development times for projects in GoM and North Sea
in recent years from around 7 years down to as low as 3. That to me indicates a dearth of good,
large projects to choose from.
Of some of the main producers:
Saudi; 50% increase in rig count since 2012 to keep production just about steady, announced
"the most fields discovered" in 2012 or 2013 but a combination of oil and gas and they didn't
give quantities, have spoken of developing tight gas and solar to allow increased oil exports.
Russia; some conflicting announcements but it looks like a decline next year, largest recent
find was by Repsol at about 240 mmboe. Sanctions have had an impact and may continue to do so,
especially offshore.
http://uk.reuters.com/article/uk-russia-oil-rosneft-idUKKCN0WV1I3
Canada; very little drilling activity, four fields coming on over the next 2 to 3 years will
add up to 400,000 bpd, but then nothing planned and at least 4 year lead times for tar sands projects.
Tar sands projects have long plateaus but it appears some of the earliest mining operations are
starting to see thinner seams so decline will become more evident.
Brazil; cut backs in developments and may start to decline next year, they have mostly deep
water production with high decline rates and rely on continuous stream of new projects to maintain
production – the oil price, 'carwash' scandal, debt/bankruptcy problems and (maybe) just running
out of suitable projects have stopped this, expect 6 to 10% decline through 2017.
http://oilprice.com/Energy/Crude-Oil/Future-Of-Brazils-Oil-Industry-In-Serious-Doubt.html
USA; discussed a lot here, some expansion in GoM through 2017, unknown response to LTO drillers
depending on price and credit availability, liquids from gas have been another significant and
rapid boost to production recently which EIA indicate are still rising (mostly for NGLs), but
surely must run out of steam sometime soon. Possibly some shut in stripper wells won't be worth
restarting.
http://www.theenergycollective.com/u-s-production-of-hydrocarbon-gas-liquids-expected-to-increase-through-2017/
China; reliant on EOR recently to maintain plateau (including a lot of steam flood from the
EIA report) but predicting 5% decline next year, no great success on offshore discoveries.
North Sea; saw a spate of projects recently, mostly heavy oil, with a few more to come over
the next two years and then Johan Sverdrup and Johan Castberg but these only delay decline for
2 or 3 years, recent discoveries especially in UK sector have been very poor.
Offshore Africa; Nigeria and Angola have a number of projects this year and next ( a bit more
oil than gas), but after that I'm not clear, political unrest might be particularly important
here as well. That said recent exploration success has been relatively good in Africa overall
(e.g. Kenya, Ghana).
http://www.offshore-technology.com/projects/region/africa/
Venezuela; not sure if their numbers can be trusted but they seem to be in decline, I know
little of their particular technical issues but assume that in order to increase extra heavy oil
production they would need new upgraders and possibly a source of natural gas, like Canada, and
possibly dedicated refineries to handle the heavy metal content (and assuming they can find willing
creditors and EPC partners).
Iran and, possibly, Iraq and Kuwait look like the only likely areas that can show some increase,
but Iran is developing South Pars gas field more than oil and Iraq/Kurdistan might have run out
of impetus. Burgan field in Kuwait looks in better shape than other aging super giants and Kuwait
has an active exploration and development program. And of course maybe US LTO takes off again,
$80 appears a threshold but that is for WTI, ND oil has a $10 discount, the lighter LTO oil everywhere
may be lower still and overall away from the sweet spots above $100 might be nearer the mark.
The seven largest oil majors have shown declining reserves of 1 and then 2 billion barrel equivalent
over the last two years – this may be purely price related, but I'm not so sure especially with
BP, Shell and Chevron looking to sell assets, also I don't have the figures but I'd guess that
they have lost more in oil reserves as some of their big finds have been for gas.
To ramp up of production is going to be dependent on a work force which was aging and retiring
in 2014 and now has been decimated by layoffs and recruitment cut backs. Increasing prominence
of environmental issues may hinder both future recruitment efforts and the pace at which projects
can be developed. Significant new oil, including reserve growth, has to come from deep water –
those rigs are complicated and very expensive to run, a lot are currently being stacked.
Ramp up also needs the main stakeholders to regain their acceptance of financial risk, which
is currently as low as I can remember, and significantly higher sustained prices. The other side
to the equation for prices is demand. The world economy doesn't look great to me, we're due a
recession based on approximate 8 year cycles, TPTB have chucked everything but the kitchen sink
at it and industrial output is definitely in decline or growing only slowly (I don't know how
energy use is split for service versus manufacturing but I'd guess it's of smaller relative importance
in the service sector). A relatively small oil price increase might be enough to kick a recession
off properly.
Hubbert Linearization of C+C less oil sands suggests about 2500 Gb for a URR, in the past this
method has tended to underestimate the URR, we have produced about half of this so far. There
is also about 600 Gb of URR in the oil sands of Canada and Venezuela. The USGS estimates TRR of
C+C less oil sands at about 3100 Gb, I use the average of the HL estimate and USGS estimate with
a URR of 2800 for C+C less oil sands and oil sands URR of 600 Gb. Total C+C URR is 3400 Gb in
my medium scenario. If extraction rates continue to grow at the rate of the past 6 years and then
level off we get the scenario below.
Model based on Webhubbletelescope's Oil Shock Model.
"... Any forecasts of oil (and gas) demand/supplies and oil price trajectories are NOT very helpful if they do not incorporate forecasts for changes to total global credit/debt, interest rates and developments to consumers'/societies' affordability. ..."
Any forecasts of oil (and gas) demand/supplies and oil price trajectories are NOT very
helpful if they do not incorporate forecasts for changes to total global credit/debt, interest rates
and developments to consumers'/societies' affordability.
The permanence of the global supply overhang could be prolonged if consumption/demand developments
soften/weakens and it is not possible to rule out a near term decline.
Recent demand/consumption data for total US petroleum products supplied show signs of saturation
which provides headwinds for any upwards movements in the oil price.
While prices were high many oil companies went deeper into debt in a bid to increase production
of costlier oil. Many responded to the price collapse with attempts to sustain/grow production
in efforts to moderate cash flow declines and thus ease debt service.
If the forward [futures] curve moves from a present weak contango (ref also figure
02) to backwardation, this would erode support for the oil price.
Some suggest that growth from India will take over as China's growth slows.
Looking at the data from the Bank for International Settlements (BIS) there is nothing there that
now suggests India (refer also figure 05) has started to accelerate its debt expansion.
The Indian Rupee has depreciated versus the US dollar, thus offsetting some of the stimulative
consumption effects from a lower oil price.
The recent weeks oil price volatility has likely been influenced by several factors like short
squeezes, rumors and fluid sentiments.
Near term factors that likely will move the oil price higher.
Continued growth in debt primarily in China and the US. {This will go on until
it cannot!}
Another round with concerted efforts of the major central banks with lower interest rates
and quantitative easing.
"... Your prediction looks sensible to me. A few years with oil prices below $70/b will reduce supply, let's say until 2018, then maybe by 2019 oil prices rise to $100/b or more, if they remained under $125/b for 5 years (and more than $100/b) the World might be able to muddle along at slow growth of 1% to 2%, but that scenario does seem far fetched. ..."
Loooong is less than 100 years, but several years. Several years
with oil prices, say below $70/b, will affect the supply side.
In this context a sustained oil price [$100+/b] lasts more than 5
years.
Sorry, I think it is difficult to be more precise as everything
increasingly now seems to become fluid.
I appreciate your answer, that clarifies your statement
a lot. I agree predictions in this environment are difficult,
yours would be much better than mine, in my opinion.
Your prediction looks sensible to me. A few years with
oil prices below $70/b will reduce supply, let's say until 2018,
then maybe by 2019 oil prices rise to $100/b or more, if they
remained under $125/b for 5 years (and more than $100/b) the
World might be able to muddle along at slow growth of 1% to 2%,
but that scenario does seem far fetched.
More likely is a spike in oil prices by 2022 or sooner to
over $150/b (2016$) and then a severe recession within a year or
two which will bring oil prices below $100/b.
This may not be what you have in mind, but it roughly matches
a few years under $100/b and less than 5 years at more than
$100/b and seems moderately plausible, at least to me.
Lenders to the oil and gas industry have been extraordinarily lenient
amid the worst downturn in decades,
allowing indebted companies
to survive a little while longer in hopes of a rebound in oil prices. But
the screws are set to tighten just a bit more as the periodic credit
redetermination period finishes up.
Banks reassess their credit lines to oil and gas firms twice a year,
once in the spring and once in the fall. While the lending arrangements
vary from bank to bank and from borrower to borrower, lenders largely
punted
on both redetermination periods last year, providing a grace
period for drillers to wait out the bust in prices. But oil prices have
not rebounded much since the original crash in late 2014.
Time could run out for companies that have been hanging on by
a thread.
Debt was not seen as a big problem in the past, as triple-digit oil
prices had both lenders and borrowers eager to see drilling accelerate
and spread to new frontiers. Indeed, debt rose even when oil prices
exceeded $100 per barrel. According to The Wall Street Journal,
the
net debt
of publically-listed global oil and gas companies grew
threefold over the past decade
, hitting a high of $549 billion
last year. In fact, debt accumulated in the sector at a faster rate
between 2012 and 2015 – a period when oil prices were exceptionally high
– than in previous years.
With oil prices down more than 60 percent from the 2014 peak, piling
on ever more debt to a loss-making operation looks increasingly
untenable.
Distressed energy loans – loans in danger of default –
account for
more than half
of the energy portfolio at several major banks.
"When oil was at $100 a barrel, debt was easy to get," Simon Thomson,
CEO of Cairn Energy, told the WSJ in an interview.
"What
we're seeing today is a number of people suffering the hangover of having
secured that debt and now possibly having trouble servicing it."
About 51 oil and gas companies from North America have filed for
bankruptcy since early 2015, but there are 175 more that are in danger of
not being able to meet debt payments. For context, 62 oil and gas
companies fell into bankruptcy during the financial crisis in 2008 and
2009.
Companies struggling with debt payments and shrinking revenue could
see the taps shut off or at least reduced.
Some analysts see cuts
to credit lines on the order of 20 to 30 percent.
Whiting Petroleum, for instance,
announced
in early March that its credit line would be slashed by
more than $1 billion, a reduction that could be one of the industry's
largest. Whiting had a $2.7 billion loan revolver at the end of 2015, and
the company's CEO expects to have "at least $1.5 billion" left after this
spring redetermination.
Regulators are also pressing banks for more scrutiny, and lenders are
increasingly using the metric of classifying loans to companies with debt
exceeding four times EBITDA as "substandard" or lower. According to
Oil & Gas 360
,
banks are moving loans with a debt-to-EBITDA
ratio exceeding 4x to their workout units.
"This has the makings of a gigantic funding crisis,"
the head of Deloitte's restructuring department, William Snyder, told the
WSJ.
Oil & Gas 360 says that banks are also marketing their troubled debt
to hedge funds, marking down distressed debt to cents on the dollars.
Hedge funds could buy up discounted debt in hopes of repayment.
Meanwhile, although the credit markets are squeezing drillers,
equity markets remain open, at least to some.
Reuters
reported
last week that about 15 companies have announced new equity
offerings in 2016, and most have not been adversely impacted. Most of the
15 companies issuing new stock have performed better than an oil and gas
producer index by about 3 percent on average. Of course, only relatively
strong firms have decided that the equity markets would be open to them.
Around $10 billion in fresh equity has been issued so far this year.
The credit redeterminations are currently wrapping up and the
details of many of them could soon be released.
The deeper banks
cut their credit facilities, the more likely struggling oil and gas
companies could be forced into bankruptcy.
So basically Yellen is behind the scenes sucking off bankers to
hold off on O&G companies. I'm guessing we will get some sort of QE
plan starting by June whereby the FRB will buy up the loans off the
banks books. It has to be soon as mark-to-market is actually going to
be implimented again...well until TPTB find out how shitty the books
and market are, then be promptly suspended again.
Any good insider sources for bank lending exposure in O&G? I have a
good friend at a major bank who swears most of the majors have
syndicated or otherwise laid off almost all of their risk.
Just another demonstration of the failures of "free market"
economics. Sound companies MUST borrow as much as they can get their
hands on, in order to withstand competitors who borrow and spend on
rapid growth. He who lags last, no matter how sound his management,
is eliminated from the competition by those who get bigger feeding on
funny money. Then the funny money goes away and the entire industry
collapses. Big Banking eventually destroys any industry they touch,
but it's always blamed on wayward executives and mismanagement. In
fact the system forces management to make decisions which are
guaranteed to be unsound in the long term, in order to assure
short-term survival (and the size of their own retirement funds for
when it all goes bust).
Strict banking regulation is a NECESSARY component of any
large-scale market, as nations from ancient Babylon to Ancien Regime
France have proven, each in their own ways. It's not optional;
failure to keep bankers in their places leads to economic collapse
each and every time it's tried, while well-regulated nations such as
Ptolomaic Egypt or Tokugawa Japan are stable and prosperous.
For just and obvious reasons, it's illegal under U.S. law for
foreign governments to finance individual candidates or political
parties.
Unfortunately, this doesn't stop them from
bribing politicians and bureaucrats using other opaque channels.
About half of the oil produced in the continental United States last year
came from wells drilled after January 2014,
according to the U.S. Energy Information Administration. The data
provides insight into the importance of short-cycle shale production and
advances in oil industry technologies.
Many companies are targeting
short-cycle investments, lower-cost projects that take months, rather
than years, to come online.
... ... ...
With a large number of short-cycle wells, the EIA expects average U.S. production to fall
7.4 percent in 2016 – about 700,000 barrels a day. Despite an increase in shale oil
production during the past few years, individual wells have steep decline rates, losing
nearly 70 percent of initial production in the first year.
Those confirmed so far are Saudi Arabia, Russia, Kuwait, the United Arab Emirates, Venezuela,
Nigeria, Algeria, Indonesia, Ecuador, Bahrain, Oman and Qatar.
The collapse in oil prices has demolished investment in new projects,
the results of which will be felt in the 2018 to 2021 timeframe, due to
multiyear lead times
Oil production in the UK actually
increased a bit in 2015, after about two decades of steady declines.
The additional 100,000 barrels per day came from new offshore oil projects
that were initiated in 2012 when oil prices were much higher, plus extra
oil squeezed out from existing fields.
The collapse in oil prices has demolished investment in new projects,
the results of which will be felt in the 2018 to 2021 timeframe, due to
multiyear lead times. The number of new projects greenlighted in 2015 was
less than half of the level seen in 2013 and 2014.
As a result, beginning in 2018, the UK could see more severe production
declines.
Oil prices have hovered at $40 per barrel for much of the last week, as the
markets try to avoid falling back after the strong rally since February.
Investors
see shale production falling and demand continuing to rise, which point to the
ongoing oil market balancing.
But it is unclear at this point if the rally from
$27 per barrel in February to today's price just below $40 per barrel is here
to stay. Fundamentals, while trending in the right direction, are still weak.
India consumed 4.2 million barrels per day (mb/d) in 2016, overtaking Japan as the world's third largest oil consumer. The Indian
government is hoping to incentivize domestic oil production to help meet rising demand.
"... Fact that drilling activity has increased by about 35% since April 2014, while production seems to have been in decline since September suggests that there may be field decline issues. ..."
"... If this turns out to be more than just a temporary maintenance related production decline, we may be getting close to the beginning of a sustained oil price rally. ..."
While it is suspected that Saudi Arabia is looking to pump as much oil as it can in order to
push down prices, fact is that production is in decline.
Fact that drilling activity has increased by about 35% since April 2014, while production seems
to have been in decline since September suggests that there may be field decline issues.
If this turns out to be more than just a temporary maintenance related production decline,
we may be getting close to the beginning of a sustained oil price rally.
"Three years after an eruption of 10,000 barrels of melted bitumen contaminated the boreal
forest and groundwater near Cold Lake, Alberta, the provincial energy regulator has now officially
blamed hydraulic fracturing, or the pressurized injection of steam into the ground for fracturing
nearby rock."
Sub-$40 oil claimed more than 1,100 jobs across Texas in recent weeks, the Texas Workforce Commission
detailed on Tuesday.
The lost jobs included 500 jobs in Harris County at international supermajor BP, 608 positions
at the tank car division of Trinity Rail in Gregg and Harrison counties in East Texas, 60 jobs at
Cudd Energy Services in Bexar County and 65 at Rotary Drilling Tools in Fort Bend County.
BP spokesman Jason Ryan said the cuts were part of the about 4,000 upstream jobs its plans to eliminate
in 2016. The company is also aiming to trim about 3,000 downstream jobs by the end of 2017.
... ... ...
BP has taken around $1.5 billion in restructuring charges over the past five quarters and expects
the total to approach $2.5 billion by the end of 2016. The company has also sold $10 billion in assets
since October 2013 and plans to sell an additional $3-5 billion during 2016.
Overall, the company said it has lowered the cash costs its controls by $3.4 billion in 2015 compared
to 2014, and said it expects to hit $7 billion in savings by 2017.
Mar 29, 2016
Allen Kitchen
So why has the price of Gas shot up so much in the last couple of weeks? 50% jump while the
price of the oil is unchanged?
Refineries are switching to summer blend. Typical this time of the year. It will peak around
Memorial Day, if no other purprises. Be grateful it's still under $2.
Science-liberation For-all
Typical corporate America earning record profits but laying off people. These people getting
layoffs are the same that vote republican so no real sympathy.
"... The problem for the international community is while destroying ISIS is their stated priority, both Libya's rival camps see each other as the greater threat. ISIS is a threat, but neither camp believes it is an existential threat, so the priority for both camps is fighting each other. ..."
The problem for the international community is while destroying ISIS is their stated priority,
both Libya's rival camps see each other as the greater threat. ISIS is a threat, but neither camp
believes it is an existential threat, so the priority for both camps is fighting each other.
Shale Euphoria: The Boom and Bust of Sub Prime Oil and Natural Gas
Introduction
The aim of this article is to show that the shale industry, whether extracting oil or gas,
has never been financially sustainable. All around the world it has consistently disappointed
profit expectations. Even though it has produced considerable quantities of oil and gas, and enough
to influence oil and gas prices, the industry has mostly been unprofitable and has only been able
to continue by running up more and more debt. How could this be? It seems paradoxical and defies
ordinary economic logic. The answer is to be found in the way that the shale gas sector has been
funded. It is part of a bubble economy inflated by monetary policy that has kept down interest
rates. This has made investors "hunt for yield". These investors believed that they had found
a paying investment in shale companies – but they were really proving that they were susceptible
to wishful thinking, vulnerable to hype and highly unethical practices that enabled Wall Street
and other bankers to do very nicely. Those who invested in fracking are going to lose a lot of
money.
"America's tradition of anti-intellectualism puts a low premium on careful thinking, allowing
the substitution of slogans for analysis. The current presidential campaign should be evidence
enough of how true this is.
But there is another reason for resistance to careful thinking; it can be difficult and distressing,
especially if it leads to conclusions that are uncomfortable or contrary to our current beliefs.
Which brings us back to John Kenneth Galbraith who once said: "The conventional view serves to
protect us from the painful job of thinking."
Conventional thinking is all we are likely to get out of polls and explains why serious energy
policy thinkers continue to run up against opposition to what for a long time has been sensible
energy policy, namely, dramatically reducing energy use through efficiency and conservation measures
and rapidly switching to renewable sources such as wind and solar–sources that do not create the
triple threat of depletion, pollution and climate change posed by fossil fuels."
Props to
Saudi Arabia.
Unlike other producers, including U.S. shale
producers, it maintained financial strength and flexibility during the
last boom.
When it began to shift the paradigm of global supply,
the kingdom was explicit about its goal - market share - even if it
didn't always trumpet the proactive steps it was taking towards that
goal.
The now-evident objective of low prices, having been
achieved and sustained, begs the question of why Saudi Arabia defended
its market share.
The position of Saudi Arabia among producers in 2014 resembled
the position of Germany in the European Union in prior years.
Both had maintained financial strength despite the prodigal habits of
other members, and both were called upon to make unique sacrifices to
rescue their neighbors. Germany had closer ties to its partners and
seemed to see the ultimate benefit of helping. Perhaps because it didn't
have such ties, Saudi seems to have weighed the benefits differently.
Indeed, Saudi had no moral obligation or economic need to
sacrifice itself in order to redirect wealth to other producers.
Their actions suggest that they
intended to drive prices toward a basement price
-stepping supply up
when prices reached the $60s, slowly tuning it down when prices hit the
$40s and below, and increasing its capacity for production even as prices
fell. The recent address of Saudi Oil Minister Ali Al-Naimi in Houston
was straightforward and polite, but it might be crudely paraphrased as,
"Get used to the low prices. Adapt or die."
The possibility of his bluffing is belied by historical
actions.
As recently as Monday, the OPEC report on monthly
volumes showed the kingdom continuing to produce more than half a million
barrels a day above its rates in late 2014.
Saudi Arabia has had
the will and means to drive prices, giving market forces some push.
As oil has been its only resource and industry of value, the kingdom
has treated the business as the treasure that it is.
The
centuries-long fate of the royal family and its kingdom depends upon how
they manage themselves during the era of oil, particularly the epoch of
increasing demand.
Surely, the highly intelligent, disciplined
and motivated planners knew the short-term consequences of the actions
which the rest of the world is just beginning to appreciate fully.
And even last month, Minister Al-Naimi professed the acceptability of $20
oil.
Normally the benefit of market share is obvious-increased
revenue and increased performance.
This assumes, however, stable
prices and economies of scale. If one maintains market share, or even
gains a few percent, but prices drop by 50 or 70 percent, then revenue
drops to half or a third of what it had been. Said differently, the
Saudis could have absorbed all of the increasing production from the rest
of the world, dropped their production by half to about 5 million barrels
per day (mb/d) and still have had the same or more revenue than they have
enjoyed during this transition.
Market share is not its own
reward. Evidently Saudi Arabia has some strategic plan that results in
its making more money in the long run than it is losing in the short run.
Perhaps the Saudis view 'market share' not just in terms of
oil production but in terms of total energy use.
By 2014 shale
oil had posted an acute rise in supply, and other high-cost sources like
oil sands were building momentum. Natural gas and renewables were
tracking their own, chronic ascent. Moreover, the high cost of oil
created incentives toward alternatives, both unconventional oil and
non-oil forms, and global demand growth for liquid oil was forecast to
grow below historical trends due to conservation and lesser economic
activity. Minister Al-Naimi has said that oil demand would peak long
before supply.
Before the current price crash, that peak demand
was within sight, perhaps 2040 give or take a decade. High prices were
slowly killing the goose that lays the golden eggs.
If the strategic focus on market share does not involve increased
revenue or efficiencies,
then the market power is the only
compelling explanation for the strategy.
With power they can
perhaps maximize their own decades-long revenue stream rather than
passively treat their national treasure as a cash cow, perhaps exerting
some control over their own destiny rather than ceding to less
economically rational sources.
The new paradigm of supply/demand balance seems to have at least two
major tenants:
Price should be low enough to discourage
run-away supply and perhaps to encourage the use of oil.
Saudi Arabia may cooperate but will not unilaterally support prices.
Around these pillars are two routes back to prices which can sustain
long-term supply: slow rebalancing as supply slides and demand creeps,
with cooperation for widespread cuts. Or prices could recover by a
challenge to the new paradigm, namely conflict to threaten or to
interrupt even a small portion of supply.
A freeze in production growth as headlined in the last month
would be a mostly irrelevant step on the first route or a minor step
towards the second route.
The large majority of OPEC production
comes from countries not able or not inclined to increase production.
With Iran still adamantly and publicly opposed, the idea of a freeze in
supply growth is more publicity than policy change. Perhaps the most
important take-away is that Saudi Arabia has signaled that its floor
price is somewhere above $30.
Even if cooperation cannot be achieved, the rest of the world
may not remain a hapless victim of Arabian pricing power.
Oil
consumers may appreciate the drop, but countries like Russia and Iran do
not. T
hey also have motives and objectives similar to those
of Saudi Arabia; they desperately need oil revenue. Only they have
different forms of power at their disposal to influence oil price.
We have seen before that the numbers provided for production do not
match the numbers for oil in storage. There is less oil in storage
than there should be if the production numbers were true. What Saudi
Arabia is doing is they tell the world they are producing a certain
amount and they actually produce much less. They get to slam the
price of oil down as everyone goes off the headline numbers of massive
production growth but in truth Saudi Arabia keeps their real oil for
after their competitors go out of business and the price of oil goes
back up. There was an article on ZH about the differences in
Production and Storage numbers and "no one" can figure out what is
happening. Saudi Arabia is playing chess on the oil fields.
Russia's oil output hit a post-Soviet record of 10.9 mb/d in January 2016, but that could be a
ceiling as the country's massive oil fields face decline. The bulk of Russia's oil output
comes from its aging West Siberian fields, which require ever more investment just to keep output
stable. The depreciation of the ruble has helped a bit, lowering the real cost of spending on
production and allowing Russian companies to increase investment by one-third this year. However,
some long-term projects are being pushed off due to the financial squeeze from western sanctions
and low oil prices. An estimated 29 projects, amounting to 500,000 barrels per day in new
production, have been delayed. With most of Russia's large oil fields having been under
production since the Soviet era, and with precious few new sources of supply, Russia is facing
long-term decline.
Short sellers have begun
targeting Texas banks with ties to the energy industry, betting that damaged oil and gas
drillers will impair their lenders as well. Short bets on regional banks in Texas increased by 35
percent so far this year. Energy loans typically make up only a small portion of most banks'
lending portfolio. But for banks where energy makes up more than 4 percent of their portfolio,
their share prices have plunged more than 22 percent.
"... "There is a clear risk for a pull-back in Brent crude oil with a return to deeper contango again. Long positioning in Brent is at record high and vulnerable for a bearish repositioning." ..."
"... Barclays said in a note on Monday net flows into commodities totaled more than $20 billion in January-February, the strongest start to a year since 2011, and prices could fall 20 to 25 percent if that were reversed. ..."
OPEC and other major suppliers, including Russia, are to meet on April 17 in Doha to discuss
an output freeze aimed at bolstering prices.
But with ballooning global inventories, signs some OPEC members are losing market share, plus
little evidence of a strong pick-up in demand, analysts said oil is likely to trade in a range.
"There is a rebalancing on the way, but we are still running a surplus and stocks are building up
as far as we can see," SEB commodities analyst Bjarne Schieldrop said.
"There is a clear risk for a pull-back in Brent crude oil with a return to deeper contango
again. Long positioning in Brent is at record high and vulnerable for a bearish repositioning."
Data on Monday from the InterContinental Exchange showed speculators hold the largest net long
position in Brent futures on record. [O/ICE]
U.S. commercial crude oil stockpiles were expected to have reached record highs for a seventh
straight week, while refined product inventories likely fell, a preliminary Reuters survey showed
late on Monday.
Barclays said in a note on Monday net flows into commodities totaled more than $20 billion in
January-February, the strongest start to a year since 2011, and prices could fall 20 to 25
percent if that were reversed.
While the recent surge of oil seems to have run into a wall at $40, one thing seems to be in
place. The market lows appear to have been put in with the drop into the mid-$20s and subsequent
bounce back, and at least one top firm we cover here at 24/7 Wall St. thinks the low for the
cycle is in.
A new Jefferies research note says that for the first time in history global capital expenditures
in the energy industry will have fallen for two consecutive years. In addition, a combination of
demand growth and non-OPEC production declines could very well set the stage for a $50 price
handle by the end of this year.
"... But Saudi Arabia is also prioritizing refined product exports, which fetch higher prices. It hopes to double refining capacity to 10 mb/d. Additionally, while Saudi Arabia may have lost market share in some places, it is also taking stakes in large refineries around the world, helping it to lock in customers for its crude. ..."
Over the past three years, Saudi Arabia has lost market share in nine out of the top 15 countries
to which it exports oil, according to the
FT. That comes despite a ramp up in production since November 2014. For example, Saudi Arabia's
share of China's oil imports declined from 19 percent in 2013 to near 15 percent in 2015. Likewise,
Saudi Arabia saw its market share in the U.S. drop from 17 to 14 percent over the same timeframe.
But Saudi Arabia is also prioritizing refined product exports, which fetch higher prices. It hopes
to double refining capacity to 10 mb/d. Additionally, while Saudi Arabia may have lost market share
in some places, it is also taking stakes in large refineries around the world, helping it to lock
in customers for its crude.
Meanwhile, according to the latest data, Saudi Arabia's cash reserves
dwindled to $584 billion as of February as the oil kingdom tries to keep its economy afloat and
preserve its currency. That is down from a peak of $737 billion in August 2014.
"... Iraq war and its aftermath failed to stop the beginning of peak oil in 2005 ..."
"... I think the Iraq war was instigated by an alliance of neocon/Israel lobby plus oil/service company and weapons complex interests. But the overriding interest seems to have been the neocon strategy to get the USA tangled in Middle East wars. This in turn would weaken Israel's enemies and increase animosity between the Muslim and Christian worlds. Such animosity plays very well if it leads to all out war between "the West" and Muslims. As long as the USA keeps behaving as an Israeli puppet the conflict will intensify. ..."
"... What I outlined above is a distilled version of writings/books by former CIA analyst Michael Scheuer, former CIA operatives, and books such as "Fiasco" by Thomas E. Ricks. I've also incorporated recent material written about ISIS and its birthing at the US Army's Camp Bucca. ..."
I think the Iraq war was instigated by an alliance of neocon/Israel lobby plus oil/service company
and weapons complex interests. But the overriding interest seems to have been the neocon strategy
to get the USA tangled in Middle East wars. This in turn would weaken Israel's enemies and increase
animosity between the Muslim and Christian worlds. Such animosity plays very well if it leads
to all out war between "the West" and Muslims. As long as the USA keeps behaving as an Israeli
puppet the conflict will intensify.
What I outlined above is a distilled version of writings/books by former CIA analyst Michael
Scheuer, former CIA operatives, and books such as "Fiasco" by Thomas E. Ricks. I've also incorporated
recent material written about ISIS and its birthing at the US Army's Camp Bucca.
"... Oil production from the Eagle Ford shale basin in Texas was relatively unchanged in January, decreasing about 11,000 barrels per day (b/d), or less than 1%, vs. the previous month, the latest analysis showed. This marks the sixth month since June 2015 that the Eagle Ford shale has continued its trend of decline. Similarly, crude oil production in the North Dakota section of the Bakken shale formation of the Williston Basin dipped slightly. It was down 12,000 b/d, or just over 1%, on a month-over-month basis in January. This continued the trend of marginal decline that began last summer. ..."
"... "A number of major producers (outside the Northeast) have stated that they will reduce capital spending and cut their drilling programs significantly in some instances," said Yahya. "Those producers will have to complete their DUCs in order to sustain their production levels. Efficiency gains are not enough anymore to help keep production volumes afloat." ..."
"... I agree Eagle Ford output has declined, especially from March 2015 to August 2015. The rate of decline has slowed since then by a factor of 2. I agree that Texas output may not have increased in Jan, I think it was probably flat to down slightly from Dec 2015. ..."
The EIA has been underestimating oil production in Texas in 2015, and had to revise upwards its
numbers when it changed its methodology, which is now based on producers' surveys. I do not exclude
that the numbers for Texas production in 2015 can again be slightly revised, but:
I still think that there was a downward trend in EFS last year;
I doubt that production in the Eagle Ford and Texas in general has increased in January 2016.
Apart from the DPR, EIA regular monthly production statistics (based on producers' surveys); the
numbers from DrillingInfo (see one of my charts) and some other sources still show a declining trend.
This includes statistics from Bentek Energy (apologies for a long quote):
Report: Production in Bakken, Eagle Ford drops slightly in January
Production in the Eagle Ford and Bakken shale plays dropped slightly in January vs. December 2015,
according to Platts Bentek, an analytics and forecasting unit of Platts.
Oil production from the Eagle Ford shale basin in Texas was relatively unchanged in January,
decreasing about 11,000 barrels per day (b/d), or less than 1%, vs. the previous month, the latest
analysis showed. This marks the sixth month since June 2015 that the Eagle Ford shale has continued
its trend of decline. Similarly, crude oil production in the North Dakota section of the Bakken shale
formation of the Williston Basin dipped slightly. It was down 12,000 b/d, or just over 1%, on a month-over-month
basis in January. This continued the trend of marginal decline that began last summer.
The average oil production from the South Texas, Eagle Ford basin in January was 1.4 million barrels
per day. On a year-over-year basis, that was down about 200,000 barrels per day, or about 13%, from
January 2015, according to Sami Yahya, Platts Bentek energy analyst. The average crude oil production
from the North Dakota section of the Bakken in January was 1.2 million b/d, about 3% lower than year
ago levels, he said.
"Current internal rates of return in both the Eagle Ford and Bakken shales are weak, under 10%,"
said Yahya. "And producers need to continue generating cash flow for their operations. The number
of active rigs in those basins has gotten so low that it is almost a certainty that producers are
dipping into their inventory of drilled but uncompleted wells. Those wells are cheaper to complete
since the drilling costs are already sunk."
Yahya pointed to the new analysis conducted by Platts/Bentek of the drilled but uncompleted (DUC)
wells for many of the major shale basins. According to the results, current DUC inventories total
831 wells in the Williston Basin. In the Eagle Ford Basin, there are approximately 1,022 wells that
are awaiting completion. These figures refer to wells drilled between the start of 2014 and October
2015. These well inventories disregard more recent wells because of the difficulty in distinguishing
between wells that have been intentionally left uncompleted and wells that are simply in the process
of being completed.
"A number of major producers (outside the Northeast) have stated that they will reduce capital
spending and cut their drilling programs significantly in some instances," said Yahya. "Those producers
will have to complete their DUCs in order to sustain their production levels. Efficiency gains are
not enough anymore to help keep production volumes afloat."
It is important to not that the discrepancy between various estimates of oil production in the
Eagle Ford is partly due to differences in the geographical area included in EFS.
The number of Texas counties included in EFS area varies from 14 to 30.
I agree Eagle Ford output has declined, especially from March 2015 to August 2015. The
rate of decline has slowed since then by a factor of 2. I agree that Texas output may not have
increased in Jan, I think it was probably flat to down slightly from Dec 2015.
First month delinquent leases dropped from 9048 in NOV to 5014 by January 16. Second month delinquent
leases dropped from 1292 for Oct 15 to 817 for Dec 15.
Texas seems to be doing something to get the data in quicker. This may mean that the reported
increase is due to better reporting of declining production. It is hard to say without a lease
by lease analysis.
The drop in Eagle Ford oil output, when we account for incomplete data is from about 1300 kb/d
in March 2015 to 1140 kb/d in Aug 2015, since then the decline has been modest to about 1070 kb/d
by Nov 2015. I used your awesome website to get the RRC numbers for the Eagle Ford and then assumed
the amount of "missing" data is uniform throughout Texas, the assumption may not be valid. When
I have used this method in the past it has given fairly good estimates. The estimate actually
matches the DPR estimate fairly well through Nov 2015. The December and January estimates are
higher than the DPR, based on my Eagle Ford Model, I think the DPR estimate is too low. Time will
tell.
The numbers for Eagle Ford are slightly lower than in the DPR, as the DPR data includes some
conventional production in the "Eagle Ford region". Both sources show a visible declining trend
in output from the peak in March 2015.
The EIA/DrillingInfo estimate for January 2016 is 1230.3 kb/d vs. 1332.5 kb/d in the latest
issue of the DPR.
Hey guys, Kind of busy right now, but taking a quick look.
I suggest comparing specific company EFS production on the RRC site to what is reported in
the company's 2015 10K's and/or press releases.
For example, I took a quick look at MRO's 10K and press release. They break down production
by region and have EFS broken out separately.
Two issues to keep in mind. First, the production amounts in the 10K, etc are net of royalties.
Second, hard to know how many company operated wells have non-operated working interest owners,
plus how many non-operated working interests they own that would show up under a different operator
on RRC website.
However, comparing 10K/press release to RRC data may offer some clues. Also, companies typically
report number of completions by area/basin also. Could compare to RRC data also.
The LTO production drop appears to offset the offshore project increases forecasted for 2016.
Remember the EIA forecasts from last year? They were forecasting beefier USA production, weren't
they?
I'll be damned, I could swear that plot you show confirms my point. Thus far it sure looks like
the offshore won't make up the losses, 2016 will be down about 0.5 mmbopd versus 2015. Time will
tell if it can reverse the decline. It depends on the oil price later this year, I suppose.
Through quarter 1 of 2016 Fernando's statement is roughly correct, remember that all forecasts
tend to be incorrect.
Chart below has a revised Eagle Ford model using data from Enno's website to construct a well
profile used from July 2014 forward, I used my old well profile for Jan 2010 to June 2014. From
Jan 2016 to Dec 2016 the model assumes 146 new wells are completed per month. The 2014 well profile
was used for first 25 months and then the old well profile from months 26 to 139. EUR is 131 kb
at 24 months, 173 kb at 60 months and 209 kb at 139 months when the well is shut in at 10 b/d.
Latest rig count : 37
Even if the rig efficiency improved over the last year, like we've seen in the Bakken, say to
1.5, that would still be a far cry from 146.
There are DUCs. The rig count can increase.
What is your estimate for wells completed in 2016?
I have tended to underestimate, I agree 146 may be optimistic but over 200 wells were added
to the schedule in February 2016. There have been times when wells completed were 2x the rigs
I have no clue, but I expect it to be << 146 wells/month.
One indication is EOG :
In 2016, "
EOG plans to complete approximately 150 net wells in the Eagle Ford, compared to 329 net wells
completed in 2015″
EOGs output (not corrected for net revenue interest) was a little over 20% of EFs output in
October. As a very simple rough estimate I therefore would take something like 5 * 150 = 750 wells
= just over 60 wells / month. So, somewhere between 40 – 90 wells / month?
the chart below shows that the number of well completions in the Eagle Ford in December 2015
was around 125.
Since then, the rig count dropped significantly.
The number of well completions may have not declined as much due to the DUCs. But 146 completions
on average for 2016 seems too high.
It depends on oil prices. I doubt oil prices will remain low in February 200 oil wells were
added to the schedule. Note that the total wells reported on February 1 was similar to Enno's
count.
The drillinginfo data is better, but still relies on RRC data which is incomplete.
The "oil wells on schedule data" may also be incomplete, but so far the well completion rates
through Feb 2016 have not slowed much in the Eagle Ford. Output has declined less than 100 kb/d
since Aug 2015 in my estimation.
"My guess is that the data processing in Texas has been improving dramatically over the past 7
months." Where have I heard that before? Oh, yeah, I said it several months ago, and got roundly
pooh, poohed.
It has gotten to be a small town since they were completing 2200 wells a month in 2014. Of
course it has gotten faster, and there is not going the huge increases expected on prior months
that had been anticipated. The producers are faster, and so is RRC.
Let's talk about the great and mighty "drilling efficiency". I admit there has been a measurable
amount of drilling efficiency, but what they are mainly deriving the most recent number from is
from mainly drilling in the sweet spots. Duh, yes it looks more efficient overall, because of
heavy drilling in areas that may get 250,000+ barrels the first year. That is not the norm for
the Eagle Ford, for sure. From what I can tell from looking, is that the DUCs are accumulating
in the areas that get less than 120,000 barrels the first year. Some of those are significantly
less than 120k, so they may be completed to keep the leases before price gets to $70, but it will
have to be offset by the sweet spots to keep cash flow intact. Only what they have to.
Bad energy debt to exceed good energy debt. The number of
energy loans that are in danger of default could jump above 50 percent this year, according to The
Wall Street Journal, presenting some problems for several major banks. Lenders are starting to back
away from new loans, declining to renew credit, and selling off bad debt. That could slash the available
credit lines for some struggling oil and gas producers this year, potentially raising some liquidity
pressure on E&P companies. (Coming to the Oil Patch: Bad Loans to Outnumber the Good
)
An estimated 51 oil and gas companies have fallen into bankruptcy since
early 2015. The periodic credit redetermination period is coming up, which could result in credit
lines offered to energy companies being reduced by 20 to 30 percent. The total debt in the entire
oil and gas sector hit $3 trillion in 2014, or about three times higher than 2006 levels.
... ... ...
Oil
industry still able to access capital. Despite posting record losses in potentially seeing
credit lines cut, several oil companies have returned to the equity markets, where they are still
being welcomed with open arms. Reuters reports that at least 15 oil companies have
announced
new offerings in 2016, with minimal damage to their share prices. The companies surveyed have
outperformed an oil and producers index by 3 percent on average.
But another way of looking at that statistic is that only well-positioned companies have issued
new stock.
Companies like Pioneer Natural Resources (NYSE: PXD), Callon Petroleum Co (NYSE: CPE),
and Oasis Petroleum (NYSE: OAS) have performed better than some of their peers since announcing new
stock offerings. Shareholders seem willing to provide companies with new cash infusions.
"People
would rather they have money in their pocket and survive," Irene Haas, analyst at Wunderlich Securities,
told Reuters. "They'll worry about dilution later." U.S. oil and gas exploration companies have issued
a combined $10 billion in new equity this year.
Just
over three months after the authorities lifted the four-decade ban on crude oil exports, the U.S.
has actually exported less this year than it did over the same period the year before, when the ban
was still in place.
According to Clipper Data market intelligence cited by the
Financial Times , we've seen a 5 percent decline in U.S. crude oil export volumes since the beginning
of this year. The data suggests that on average we are exporting (waterborne) 325,000 barrels per
day now, compared to 342,000 barrels per day during the first months of 2015.
And there's no official data yet-not since the beginning of this year, when the U.S. Energy Information
Administration (EIA) noted that during the
week ending 22 January , the U.S. had exported just shy of 400,000 barrels of oil, which again
was 25 percent less than what was exported for the same week in 2014.
An oil tanker that reached a French port in January was the first post-ban delivery of U.S. crude
oil, but things haven't really picked up pace since then.
January's cargoes, totaling about 11.3 million barrels, marked a 7 percent decline from U.S. crude
exports in December, according to data by the
U.S. Census Bureau . Shipments during January went to Curacao and France, in addition to Canada,
the primary destination. The total number of tankers that have set sail with U.S. crude oil will
not be known until comprehensive data on February's shipments is released by the U.S. Census Bureau.
The immediate beneficiaries of the ban suspension are gas and oil companies such as Chevron and
Exxon Mobil-among the most tireless lobbyers against the ban-and oil trading giants such as Vitol
Group BV and Trafigura Ltd Pet.
Europe and Asia are flooded with oil from Russia and the Middle East, though the first two shipments
to leave the U.S. post-export ban went to Europe: one to Germany and the other to France, to be used
in a
refinery in Switzerland . Dutch media outlets
reported in January that a tanker from Houston had reached Rotterdam port, but this remains just
a drop in the global export bucket.
In Asia, even China's state-run Sinopec-the world's second-largest refiner-has imported a consignment
of U.S. oil, according to a
Reuters source . Japan's Cosmo Oil was the first Asian buyer of U.S. oil, purchasing some 300,000
barrels of U.S. crude in mid-January, which will be delivered to its refineries in mid-April.
The current market turmoil has created a once in a generation opportunity for savvy energy investors.
Whilst the mainstream media prints scare stories of oil prices falling through the floor smart investors
are setting up their next winning oil plays.
The very first South American country that will import U.S. crude oil is Venezuela. In early February,
Venezuela's state-run oil company PDVSA imported a 550,000-barrel cargo of West Texas Intermediate
(WTI) through its U.S.-based
Citgo
Petroleum affiliate . Venezuela started importing foreign crudes in 2014 amid a fall in its own
production - buying mostly Angolan and Nigerian light grades.
WTI is also expected to be exported to
Israel, where Swiss commodities house Trafigura will ship some 700,000 barrels. Atlantic Trading
& Marketing, the U.S. trading unit of French Total SA, has been planning an export cargo of U.S.
crude from Cushing.
Also, earlier this month, Exxon
became the first U.S. oil company to export U.S. crude, sending a tanker from Texas to a refinery
it owns in Italy.
However, storage is now at the highest level in at least a decade.
U.S., crude storage levels
hit 487 million barrels in early November, closing in on the 80-year high of 518 million barrels
in the last week of February.
According to the EIA ,
about 60 percent of the U.S. working storage capacity is filled.
Globally, the picture isn't much better, with the International Energy Agency (IEA) saying that
1 billion barrels were added to storage in 2015 alone. OPEC has reported that crude oil stockpiles
in OECD countries currently exceed the running five-year average by 210 million barrels.
By
Irina Slav
Posted on Sat, 26 March 2016 00:00 |
0
After the slow and
painful death of Canadian oil exports - helped along by crashing
oil prices, a global supply glut, and the languishing Keystone XL
Pipeline - Canada has opened up some other outlets for exporting
its crude oil to refineries on the U.S. Gulf Coast, experiencing a
two-fold increase since 2014.
According to new data,
Canadian crude oil exports to U.S. Gulf Coast refineries
topped
389,000 barrels per day last year-double the amount in
2014-and it was all made possible by new pipelines that came on
stream over the course of last year.
The three new pipelines to the Gulf Coast-Seaway, Southern
Access, and Cushing Marketlink-added a combined throughput capacity
of 1.85 million bpd to the transport system for crude between
Canada and the U.S., said Canada's National Energy Board's market
analyst Melissa Merrick.
All in all, Canada exported most of its 3.87 million bpd output,
or 3.035 million barrels. Of this, 3.009 million barrels went to
the U.S.
In the
first week of January
, Canadian crude oil exports to the U.S.
reached an all-time record of 3.4 million barrels per day,
according to preliminary data from the U.S. Energy Information
Administration (EIA).
However, while this is good news for Canada, the figures aren't
quite as sensational as the headlines tend to be. The actual amount
heading to the U.S. Gulf Coast is a relatively small portion of
overall Canadian crude exports to its southern neighbor. The bulk
goes to the U.S. Midwest, which received 1.916 million bpd last
year from Canada.
At the same time, oil imports also
increased
, to 736,000 bpd, of which crude from down south
accounted for 62.4 percent, or almost 500,000 bpd, up from around
340,000 bpd in 2014.
What's more, according to Beth Lau from the Canadian Association
of Petroleum Producers, the twofold increase is unlikely to be
repeated this year because there is not enough throughput capacity.
This brings us back around to Keystone XL, which could have
added 830,000 bpd of throughput capacity to the pipelines carrying
crude to the Gulf Coast refineries had it not been cancelled by the
Obama administration in November 2015. That's not an insignificant
amount of oil capacity, given the fact that Western Canadian Select
(WCS) is trading at a substantial discount to WTI. The May contract
for the Canadian crude closed at a bit over $13 per barrel on March
24, while WTI is well over $30 at the moment.
The current market
turmoil has created a once in a generation opportunity for
savvy energy investors.
Whilst the mainstream media prints scare stories of oil
prices falling through the floor smart investors are
setting up their next winning oil plays.
WCS is a real bargain for U.S. refineries. But it's not going to
come through Keystone.
But the absence of Keystone simply means that Canadian crude has
to find other routes, both rail and alternative pipelines.
TransCanada
, the would-be operator of Keystone XL, has now
agreed to buy Houston-based Columbia Pipeline Group Inc. for $10.2
billion, which owns some 15,000 miles of gas pipeline running from
New York to the Gulf of Mexico, along with one of the biggest
underground storage systems in the U.S.
At the end of the day, some believe that Canadian export figures
indicate that Canada is gaining U.S. market share as a result of
the oil price crisis, and as U.S. shale production gets shut in,
waiting for better days.
"That's the one piece of puzzle you don't hear too much about -
the market share Canada is gaining in the U.S.," said Carl Evans,
senior crude oil analyst at energy research firm Genscape,
told the Financial Post
.
But you don't hear too much about it because it's a bit of a red
herring.
According to Platts
, Alberta's crude is selling at a major
discount because it doesn't have enough export outlets. That means
that if it wants to get overseas, it's got to go through the U.S.
for the most part, and even then, pipeline space is limited and
more expensive (and dangerous) rail is often the only option.
"In 2015, the seven biggest publicly traded Western energy companies, including Exxon Mobil Corp.
and Royal Dutch Shell PLC, replaced just 75% of the oil and natural gas they pumped, on average,
according to a Wall Street Journal analysis of company data. It was the biggest combined drop
in inventory that companies have reported in at least a decade."
"... That should give some thoughts to shale enthusiasts. In 2020 the shale industry has to pay back over USD 200 bn. The total revenue is currently less than 100 bn per year. Even if the industry can roll over debt, how will it get more debt for new production in 2020? ..."
"... Still this is "too late to drink mineral water to cure your liver, damaged by binge drinking" type of the situation. ..."
That should give some thoughts to shale enthusiasts. In 2020 the shale industry has to
pay back over USD 200 bn. The total revenue is currently less than 100 bn per year. Even if the
industry can roll over debt, how will it get more debt for new production in 2020?
@ Dennis,
I was out in the woods last weekend, so I didn't have the opportunity to respond to your questions
in last Ronpost.
Dennis: "if you think that LTO output of 4.5 Mb/d can go to zero and OPEC, Canada, and Russia
can make up that difference, I believe you are incorrect."
I believe LTO output of 4.5 Mb/d will go to (nearly) zero rather soon (5 or 6 years, so 2021 or
2022), but I do not believe OPEC, Canada and Russia can make up that difference.
"Is that your assumption? Do you believe OPEC will fill that 4.5 Mb/d gap"
No. My assumption is that gap will not be filled. My assumption is the world will encounter Peak
Oil very soon (if not yet).
"What are your assumptions about the future price of oil?"
That's a tough one. Despite the model provided above by Ian Schindler. Let me take a wild guess:
WTI in the $70-$80 range by december 2016. $110 by mid 2017 followed by another collapse of the
price, due to real problems in China or India.
"Do you think the Brent oil price will be $35/b in Dec 2016 (STEO forecast)?"
See above: Brent versus WTI will vary within a 15% margin from eachother – mayby Brent being the
cheaper one during 2016. (If you ask why?: This is just gut feeling.)
Thank you for your input. Very interesting considerations, that actually correlate with my
own thoughts on the subject. Especially possible return to recession in the second half of 2017
. I also feel that Brent might be very close to WTI from now on. Lifting export ban eliminated
premium. Unless "artificial WTI" shipments spoil the broth.
One question. If we assume that is the return to recession in the second half 2017, will it
necessary cause another collapse in oil prices; or may be downturn in oil prices will be more
muted ?
One feature of the return to recession is the collapse of junk bond market, which makes financing
of both shale and oil sands more difficult. And it typically happens before the actual economic
downturn. That will make ramping up shale oil production in 2017 extremely challenging. High oil
prices will be only of limited help, as there is no return to "good old days" of Ponzi financing
of shale.
Even speculative financing (revolving credit, aka evergreen loans) is already under threat
and will remain in this condition for the foreseeble future.
So shale players might have no money to re-start "carpet drilling" again.
I think difficult days are coming for US shale/LTO players and even temporary return to above
$100 price range might not restore previous financing bonanza for them - with enough financial
thrust you can make pigs fly, but you better do not stand in the place where they are going to
land.
Of course they may be propped by the next administration for strategic reasons. Who knows…
I don't know. Really. I'm just trying to get grip on things like most of us. I't been a tough
day in here in Belgium today. A lot of game changers might come to surface very soon. I mean very
soon.
This is not investment advice, but I think both of you are correct.
I've been working from an old Deutsche Bank analysis which expects big swings in the price
of oil. The high prices cause demand to drop and the low prices prevent exploration from happening.
Result: total oil production declines continuously.
Citing the "dramatic decline in oil prices, the continued low prices of oil and natural gas,
and the general uncertainty in the energy markets," another Denver energy company has filed for
bankruptcy protection.
Emerald Oil Inc. ( NYSE: EOX) said it's filed voluntary Chapter 11 petitions in the U.S.
Bankruptcy Court for the District of Delaware. Its oil and gas operations are located in the
Williston Basin of North Dakota and Montana.
... ... ...
Emerald headquarters are at 200 Columbine St. in Denver and the company has 42 employees,
according to YahooFinance.
It's the second Denver energy company bankruptcy filing this month: On March 18, Venoco Inc., an
oil and gas company focused on pumping oil in southern California, filed a voluntary petition for
Chapter 11 bankruptcy protection.
"... The contango, as the structure is known, narrowed to $5.82 on Monday, its lowest in almost nine months, and down nearly two thirds from about a month ago. ..."
"... Surely they don't. They think that the oil price rally is not sustainable, so they want to lock in prices in low $40s, for 2016 and $45-50 for 2017-18. ..."
"... Locking in through 2017 scores of wells completed in 2015 that will never payout. ..."
"... "locking in the high side at these levels also locks in a long period of little cash flow " Exactly. That's why I think they will hedge only a small part of their sales at current prices. According to IHS, as of the beginning of 2016, North American E&Ps have hedged just 14% of their total oil production volumes for 2016 and 2% for 2017. ..."
"... Sub $50 WTI simply doesn't work for US onshore lower 48 production to any significant scale. There is a big media disconnect between LOE and CAPEX. Although a broad generalization, the lower the current LOE, the newer the well and the higher the decline rate in the next year, etc. ..."
"... I have been looking at Q1 2016 earnings estimates for US E&P, as well as FY 2016 earnings estimates. Horrible. Two years in a row of record losses are coming, with year 2 worse than year 1. ..."
Struggling U.S. shale producers have scrambled to sell future output at their fastest pace in
about six months in recent weeks, curbing a rebound in prices and potentially prolonging the oil
market's worst rout in a generation, traders say. As spot prices of crude rallied almost 60 percent
from 12-year lows touched in mid-Feb, turnover in the long-dated oil contracts has soared to record
highs, as producers started to lock in prices in the $40s, traders have said. Turnover in the U.S.
crude contracts for December 2017 surged to record highs of over 30,000 lots this past Friday while
volumes in the December 2016 delivery touched an all-time high of nearly 94,000 lots. Combined, that equates to almost 125 million barrels of oil worth over $5 billion, a small portion
of overall daily volume in U.S. crude futures, but enough to catch traders' attention.
Now, brokers and traders say that has turned into execution, with some producers willing to hedge
in the high $30s or low $40s in 2016 and between $45-50 next year, levels that are just about breakeven
for many.
That is also below the $50 psychological threshold that many had thought would be necessary to
prompt producers to seek price protection, suggesting drillers have accepted a new reality of lower-for-longer
prices as
"The cost of production has declined to the point where at mid-40s they can hedge actively to
remain viable." Piling on hedges could prevent prices rallying through $45 a barrel while the extra
protection may delay further U.S. production cuts, seen as key to eroding the glut
The impact of the pickup in hedging activity was most conspicuous in longer dated oil contracts.
The 2017 WTI price strip has risen only about 15 percent over the past six weeks, much lower than
the prompt contract's gains, while the selling has almost erased the far forward contract's premium
over spot.
The contango, as the structure is known, narrowed to $5.82 on Monday, its lowest in almost
nine months, and down nearly two thirds from about a month ago.
John Saucer, vice president of research and analysis at Mobius Risk Group in Houston, said he
saw a "material" increase in producer hedging, with most action in this and next year's contracts,
but extending through the whole of 2018.
Lack of forward buying by major consumers, like the airlines, has also meant prices have not received
any boost as producers have been selling, adding to the pressure on prices.
To be sure, many hope for prices to go even higher.
"If prices recovered to that range north of $60, we'll be seriously considering hedging," billionaire
wildcatter Harold Hamm said on a conference call.
Do they really make money on these prices, since most of them where barely profitable at 100$+
oil?
Or do they just log in to make profit by pumping from their already drilled holes while ignoring
front load costs? If they would make money after hedging, why isn't there a new boom where everybody drills like
mad?
Surely they don't. They think that the oil price rally is not sustainable, so they want
to lock in prices in low $40s, for 2016 and $45-50 for 2017-18.
One wonders if much of the hedging is being required by banks.
Hedges at these levels likely locks in enough cash flow to pay LOE, taxes, G &A and interest.
However, locking in the high side at these levels also locks in a long period of little cash flow
for CAPEX and/or retiring debt principal.
An interesting exercise once the hedges are fully disclosed would be to insert the resulting
revenue number into cash inflows in the SEC 10K, and then calculating both undiscounted and discounted
future net cash flows.
Also, assume we have a Bakken well that produces 120,000 barrels after royalties, that was
completed 1/1/15 and has been hedged at an average price of $47 WTI for 2015-17.
A $7 discount puts us at $40. 10% severance puts us at $36.
Our $6-9 million well has only grossed $4.3 million in its first three years. Hedging at these
levels locks in many wells to no hope of payout, as we will likely need to subtract another $6-8
per barrel, or more for LOE and $2-3 more for G & A. Oh yes, and another $4-7 more per barrel
of interest expense.
Locking in through 2017 scores of wells completed in 2015 that will never payout.
Sub $50 WTI simply doesn't work for US onshore lower 48 production to any significant
scale. There is a big media disconnect between LOE and CAPEX. Although a broad generalization,
the lower the current LOE, the newer the well and the higher the decline rate in the next year,
etc.
For example, California Resources corporation has LOE around $20 per barrel, yet lower decline
rates, while US LTO is around $6-9 per barrel, but has high decline rates. Further, CRC LOE will
be more stable over time. Without addition of substantial new wells, US LTO LOE will surpass that
of companies like CRC in less than 5 years IMO.
Again, I am speaking in broad terms, each well is different from every other, and each varies
over time.
My view is Bakken wells producing under 1000 barrels net of royalties per month have LOE of
$15+ generally.
I do apologize for mixing up OPEX and LOE over the last year plus.
I guess OPEX includes royalties, lifting costs and severance taxes?
LOE is lifting and operating expense. Same is calculated on net barrels, after royalties are
paid. Expenses such as severance taxes, interest and general and administrative expenses are not
included in LOE.
Further, always be aware that LOE is calculated in BOE, so gas and NGLs are included. Gas is
on a 6 to 1 ratio with oil.
Many US LTO are touting reduced LOE, when the reality is the company wide gas to oil ratio
is increasing. One BOE of gas is selling for $6-10 at the well head right now.
CLR is a good example. Their gas to oil ratio has went from 30:70 to 40:60 in about three years.
So, part of the LOE per BOE is directly offset by lower realized per BOE prices. Further, gas
is usually cheaper to produce than oil on a BOE basis in the US, so this also must be factored
in.
I have been looking at Q1 2016 earnings estimates for US E&P, as well as FY 2016 earnings
estimates. Horrible. Two years in a row of record losses are coming, with year 2 worse than year
1.
Bloomberg still promotes oil glut myth. There are paranoidal about rising oil
prices and for a good reason: the US economy might well be toast if proces return
to $100 level.
Notable quotes:
"... Iran boosted output by 187,800 barrels a day to 3.13 million a day in February, the biggest monthly gain since 1997, OPEC said in a report on Monday. Brazil will also add more than 100,000 barrels of supply this year and has shown little interest in taking part. ..."
There are reasons to be doubtful that the planned freeze can radically alter
an oil market that's fallen victim to a global fight for market share, causing
stockpiles to rise to a record. Most significantly, Iran is seeking to increase
production after the end of economic sanctions and has said it won't participate
in any accord until its output has recovered.
Iran boosted output by 187,800
barrels a day to 3.13 million a day in February, the biggest monthly gain since
1997, OPEC said in a report on Monday. Brazil will also add more than 100,000
barrels of supply this year and has shown little interest in taking part.
Saudi Arabia boosted oil exports to a 10-month high of 7.84 million barrels
a day in January, just weeks before the initial freeze agreement, according
to the Joint Organisations Data Initiative, an oil industry group overseen by
the International Energy Forum.
"We will now see if OPEC and Russia are able to freeze the bears in the oil
market," said Olivier Jakob, managing director at consultants Petromatrix GmbH.
"The significance of the agreement is that it could remove the perception that
OPEC is fighting for market share."
Other forces have driven prices higher in recent weeks. Outages from Iraq
and Nigeria have disrupted more than 800,000 barrels a day of supply and tightened
the Brent market, according to Citigroup Inc. And falling drilling activity
in the U.S. shale industry has seen analysts raise forecasts for declines in
North American production.
One key question is how fast shale production could come back if OPEC and
some non-OPEC producers succeed in driving prices higher.
Oil ministers for Argentina, Venezuela and Colombia didn't immediately respond
to questions on whether they would attend. Ecuador's oil minister said he still
plans to gather Latin American producers before April 17, after a planned meeting
earlier this month was postponed.
"It's not surprising they'd be willing to agree to this because the outlook
for a further production increase was quite limited," Jeff Currie, global head
of commodities research at Goldman Sachs Group Inc., said in an interview on
Bloomberg Television. "You can't operate a cartel the way you used to."
That should give some thoughts to shale enthusiasts. In 2020 the shale industry has to pay
back over USD 200 bn. The total revenue is currently less than 100 bn per year. Even if the industry
can roll over debt, how will it get more debt for new production in 2020?
Production down 30 kb/d;
Total crude and product stocks up 6.9 million barrels (to new records);
Net crude imports up 691 kb/d in just one week (!) and 1.1 mb/d from a year ago.
Despite a glut in the local market, U.S. refiners and traders are rapidly increasing crude
imports.
"... Rystad Energy estimates that the crash in oil prices has cut into upstream investment so severely that natural depletion rates will overwhelm the paltry new sources of supply in 2016. Existing fields will lose about 3.3 million barrels per day (mb/d) in production this year, while new fields brought online will only add 3 mb/d. This does not take into account rising oil demand, which will soak up most of the excess supply by the end of the year. ..."
"... But the 3 mb/d of new supply in 2016 will mostly come from large offshore projects that were planned years ago ..."
"... However, outside of these large-scale multiyear offshore projects, the queue of new oil fields is starting to be cleared out. By 2017, the supply/depletion balance will go deeper into negative territory. Depletion will exceed new sources of production by around 1.2 mb/d before widening even further in 2018 and 2019. ..."
"... The coming supply crunch stands in sharp contrast to the short-term picture. ..."
"... But the Rystad Energy figures show that the supply-demand balance could quickly swing back in the other direction as upstream investment has screeched to a halt. As soon as later this year, or perhaps in 2017, demand could catch up to supply. Inventories will begin falling quickly and prices will start to rise. However, since supply is inelastic in the short run, the industry may struggle to satisfy demand at stable prices. The oil markets have always suffered from booms and busts, and this is just more of the same. The current bust is sowing the seeds of the next boom. ..."
The depletion of
old oil wells is expected to surpass new sources of supply in 2016,
as the ongoing oil price slump puts a long list of oil projects on
the shelf.
Bloomberg flagged new data from the Norwegian consultancy firm
Rystad Energy, which predicts that legacy production will tip the
supply balance into the negative in 2016 for the first time in
years.
The production from an average conventional oil field typically
ramps up in the early years, plateaus and then enters a period of
decline. Depletion rates vary wildly from field to field, but a
rule of thumb for conventional oil fields – which make up the bulk
of total global supply – is that they
decline something like 6 percent per year on average. Again,
those depletion rates can differ depending on location, levels of
investment, etc., but one thing that is clear is that the oil
industry needs to bring new oil fields online every year in order
to merely keep production flat.
Rystad Energy estimates that the crash in oil prices has cut
into upstream investment so severely that natural depletion rates
will overwhelm the paltry new sources of supply in 2016. Existing
fields will lose about 3.3 million barrels per day (mb/d) in
production this year, while new fields brought online will only add
3 mb/d. This does not take into account rising oil demand, which
will soak up most of the excess supply by the end of the year.
But the 3 mb/d of new supply in 2016 will mostly come from large
offshore projects that were planned years ago, investments that
were made before oil prices started crashing. The
EIA
sees four offshore projects starting up in 2016 – projects from
Shell, Noble Energy, Anadarko, and Freeport McMoran – plus two more
in 2017. The industry completed eight projects in the Gulf in 2015.
U.S. Gulf of Mexico production will climb from 1.63 mb/d in 2016 to
1.91 mb/d by the end of 2017.
However, outside of these large-scale multiyear offshore
projects, the queue of new oil fields is starting to be cleared
out. By 2017, the supply/depletion balance will go deeper into
negative territory. Depletion will exceed new sources of production
by around 1.2 mb/d before widening even further in 2018 and 2019.
A few months ago, Wood Mackenzie estimated that around
$380 billion in planned oil projects had been put on ice due to
the crash in oil prices. Wood Mackenzie says that between 2007 and
2013, the oil industry greenlighted about 40 large oil projects on
average each year. That figure plunged to fewer than 10 in 2015.
The coming supply crunch stands in sharp contrast to the
short-term picture. The EIA
reported on
March 23 that crude oil storage levels once again increased,
surging by 9.4 million barrels last week to break yet another
record. Total inventories in the U.S. now stand at 532.5 million
barrels. Record high storage levels, which continue to climb, are
signs of short-term oversupply. The IEA expects supply to continue
to outstrip demand by about 1.5 mb/d until later this year. Oil
storage levels will have to
fall to more normal levels before oil prices can rise
substantially.
But the Rystad Energy figures show that the supply-demand
balance could quickly swing back in the other direction as upstream
investment has screeched to a halt. As soon as later this year, or
perhaps in 2017, demand could catch up to supply. Inventories will
begin falling quickly and prices will start to rise. However, since
supply is inelastic in the short run, the industry may struggle to
satisfy demand at stable prices. The oil markets have always
suffered from booms and busts, and this is just more of the same.
The current bust is sowing the seeds of the next boom.
Of course, U.S. shale has demonstrated its ability to ramp up
quickly, and those short lead times could
allow new supply to come online as prices rise. But it remains
to be seen if U.S. shale, more or less on its own in the short run,
can meet rising demand in 2017 and 2018 as conventional oil
drilling remains on the sidelines.
"... "Two things happened: we had high oil prices, and central banks had zero interest rates and quantitative easing policies," says Spencer Dale, the chief economist of BP, who formerly held that role at the Bank of England. "That was a potent mix." ..."
It was a classic bubble, says Philip Verleger, an energy economist. "It was irrational investment:
expecting prices to rise continually. Companies that borrowed heavily when prices were high are going
to have a very tough time."
...In June 2014, a barrel of Brent crude for 2020 delivery was $98. And central banks' post-crisis
monetary policies pushed investors towards riskier assets, including oil and gas companies' equity
and debt.
"Two things happened: we had high oil prices, and central banks had zero interest rates and quantitative
easing policies," says Spencer Dale, the chief economist of BP, who formerly held that role at the
Bank of England. "That was a potent mix."
From 2004 to 2013, annual capital spending by 18 of the world's largest oil
companies almost quadrupled, from $90bn to $356bn, according to Bloomberg data. The assumptions used
to justify that borrowing were fuelled by a textbook example of disruptive technological innovation:
the advances in
hydraulic fracturing and horizontal drilling that made it possible to produce oil and gas from
previously unyielding shales. The success of those techniques added more than 4m barrels a day to
US crude production between 2010 and 2015, creating a glut in world markets that has sent prices
down 65 per cent since the summer of 2014.
The expectations of sustained high prices have vanished: crude for 2020 delivery is $52 a barrel.
Oil is now back to where it was in 2004, but most of the debt that was taken on in the boom years
is still there.
In the US and Europe, banks have been quick to reassure shareholders that, while their losses
are mounting, they are entirely manageable. French banks account for four of the 10 banks with the
highest exposure. Crédit Agricole, whose $29.8bn credit exposure to energy is the second highest
in Europe, has told investors that 84 per cent of the portfolio was investment grade. The disclosures
were largely effective in soothing fears about energy debt.
... "It's alarming that things are getting pulled forward so much," says Julie Solar, an analyst at
Fitch Ratings. "The pace of deterioration is coming quicker than what was previously disclosed."
... Since crude prices began to fall in the summer of 2014, investors in oil and gas companies
have lost more than $150bn in the value of their bonds, and more than $2tn in the value of their
equities, according to FT calculations.
... At Machinery Auctioneers, Mr Dickerson has been stocking up on cut-price oilfield equipment. He
bought four mobile sand containers used in fracking, with list prices of up to $275,000, for $17,000
apiece. When the industry recovers, he expects to sell them for up to $100,000 each. But before that
recovery comes there are likely to be plenty more bargains on his lots.
The state-owned Brazilian oil company announced that
it lost more than 36 billion reals in the fourth quarter, or USD$9.6 billion, a 40 percent
increase compared to the fourth quarter of 2014.
the company has enough cash flow from its operations to meet all of its obligations through
the end of 2017 at least, even if it fails to realize the planned $14 billion in asset sales.
"Even if we hit a road-bump we have sufficient cash through 2017," Bendine said. "This doesn't
mean if we have good opportunities to raise cash or lengthen maturities we won't do it."
"... I have grave reservations about the alleged spare capacity of Iran. The assumption is that the big, bad sanctions resulted in a huge drop in Iran's oil production. I am not buying it. I think the sanctions were a joke. For starters many nations refused to take part in the sanctions. Nations like India, china, japan and South Korea for starters. It would not be difficult to then reexport this oil to the rest of the world on the sly. ..."
2) select the "Well quality" tab and compare CLR vs all operators for
each year.
From the map there ("Top companies" tab), I see that CLR has a lot of poor
acreage scattered around the Bakken, but not much acreage in real sweet
spots, like Whiting and EOG had in the past in Mountrail. I was therefore
wondering at which WTI price do you think that CLR can drill profitable
wells in the Bakken? In my estimation they need over $50 WTI to just pay
back the cost of the well within 5 years. I come to this figure by
1) taking a rather optimistic 200k barrels of oil output within 5 years,
for their average well.
2) subtracting a rough 30% for royalties & production taxes: 200kbo -30%
= 140kbo. $6.7m per well / 140kbo = $48 of well cost for each barrel of
oil.
3) and adding a WTI differential.
If you then add all other costs, such as lifting costs, extra CAPEX later
in the well life for pumps etc, G&A, interest, income taxes, etc, wouldn't
they need WTI to be much higher than $70-80 to be profitable on these wells?
I know non-shale operators who want to see their money back within 3 years,
so the 5 years payback time I took above is still rather risky, especially
given the faster decline of shale wells.
You mentioned that you like them
because of STACK/SCOOP, about which I don't have much info. I just hoped
you can share your thoughts on the above, as they are still big in the Bakken.
As a member of the oil fraternity for the last 45 years it is refreshing
to read a post from someone who really understands the economics of production
and the cost/benefits of today's price environment.
I don't do average payback times for companies like CLR because much
of the marginal areas wont see any development at all (unless oil prices
head much higher, which we don't see happening in the near term).
Operators will focus on core areas and this plus well design improvements
are why we have seen EURs drive higher. We probably have different estimates
as to the number of bbls produced over the first five years which would
cloud the results some.
Working core acreage and switching to slickwater, we believe these wells
will produce about 360K BO over the first five years.
$40 WTI minus approximately $13 in costs
$27 minus $7 differential
$20 x 360000 BO
7.2 million minus 6.7 million in D&C
$500K
This is probably the biggest issue right now with those bearish and bullish,
its estimates. Not saying you are wrong or that I am for that matter, just
that we will have to wait and see. To your point on acreage, it does have
a pretty decent footprint in NE McKenzie County or in the southern part
of the Nesson Anticline and those wells could produce about 450K BO in the
first five years depending on estimates. Now if we look at its acreage in
Burke, N Williams or Montana the well results are no where near as good
and that acreage will need considerably higher WTI to develop. I would also
say that you are right about 5 year payback times being way too long and
that operators use to think at least 18 months was adequate.
We are definitely in interesting times. I don't have time to do it right
now, I am heading to the gym but will try to put some quick thoughts in
on the STACK/SCOOP this evening. The reason we like CLR isn't the Bakken
and we do see production in ND dropping here more than in Texas and Oklahoma.
We actually think that we could continue to see the Permian and SCOOP increase
production while the Bakken and Eagle Ford roll over a bit. Thanks again,
real good questions and I always appreciate our conversations. Unlike some
here you are always respectful and that only adds to the current debate
on some of these names.
Re Continental's historic underperformance in its Bakken wells compared
to peers ...
1). They were VERY early movers in this play and accumulated vast acreage
at rock bottom prices.
2). This 'Land Grab' phase generally only offered 36 months in which
to get a producing well in place so as to HPB.
3). A significant portion of this acreage is now recognized as being
outside the sweet spots.
4). CLR purposefully chose a cookie cutter approach to completions, namely,
30 stage and sliding sleeve. Reasons for this were speed through repetition
(they were racing the HPB clock), relative cost reduction with operational
familiarity, and - ALSO - having a position-wide identical well design so
as to evaluate the differing resource potentials throughout their vast holdings.
The future of their Bakken wells is apt to be far more productive than their
past.
Great work gentlemen - it is indeed awesome to see experts on here. Couple
of points that might be of interest: -In case you wanted a real data point,
avg. well head price for *cough* was ~$16.86/bbl last month, probably +$3
now based on the flat price. -I saw Jim Volker two weeks ago and he said
his research lab in Denver had found "the holy grail" of shale rock oil
extraction technology.
Interesting for whiting...perhaps CLR isn't far behind. -The production
math from ND DMR does not add up to CLR's type curve slides. I'm still trying
to figure out why. Do you think reworks are baked into type curves? I thought
not. -I would attribute the lower than expected IP rates to the choke...only
a few people like Statoil like to blow their wells out (although there are
a couple of exceptions) Option B: go the classic route of rocks are bad
or poor frac design.
Michael, Thanks for your elaborate response. I also enjoy these civil debates
with you, and I appreciate your comments on my site. You do got me very
surprised by the estimates you mentioned: 360 kbo & 450 kbo in 5 years.
Those are really exceptional numbers, that so far only a few companies
been able to get in highly prolific spots in the Bakken. 360 kbo is more
than double the results of CLRs wells that already reached 5 years.
You don't expect the average well of CLR in 2015 or 2016 in the Bakken
to come close to that, right? But if you're not, then that means that your
example should be adjusted if we look at the economic performance of CLR
in ND, and that would then show that CLR would not be able to expect its
money back on all wells drilled under current conditions within 5 years
(even though we both agree that to be a very long time already), right?
Phaedrus, "The future of their Bakken wells is apt to be far more productive
than their past." Can you be more specific, e.g. indicate using ranges what
you expect, and when, from the average wells from CLR in the Bakken? Note
that it is not a given that companies improve their results in the Bakken
every year. Whiting, and EOG already have shown several years of declining
well results, as is what we can see in several locations. So far, on the
aggregate, this has been compensated elsewhere. Also, what I think is very
clearly shown on my site, on average, the main improvements have been during
the initial months of production, but not in the long production phase after
12 months. You expect CLR to buck these trends?
alpha, We have a current target of WTI to 41.80 or so, so would add to
the DWTI position into that number. $40 will be very difficult to breach
and some traders think momentum could take us to $49 in the short term,
so this trade does have significant risk. We would close this trade in the
$32 to $34 range. But if we breach $30 may climb back in. Have a great day!
It is interesting to note the following from CLR's 2015 10K: CLR suffered
from a rather large discount concerning realized oil prices. 2015 SEC oil
price was $50.28, but CLR had to discount that to $41.63 per barrel. The
gas discount resulted in utilizing $2.35 per mcf. CLR's proved reserves
dropped 9% from 12/31/14 to 12/31/15.
More importantly, however, they became much more gas weighted, as 43%
of proved reserves are gas on a BOE basis. Therefore, analysis of gas production
and future gas prices is required in analysis of CLR. A look at CLR's statement
of future cash flows is also important. In 2014, CLR's estimate of future
cash inflows was $90.9 billion.
This dropped to $35.6 billion in 2015. This is largely the result of
the commodity crash, so it is very important if a lower for longer scenario
is correct. In 2014 the estimated future production costs were $25.8 billion.
In 2015 that fell by 60% to $10.9 billion. That is a very large drop, and
I hope analysts are able to get CLR management to walk through the steps
that they undertook to achieve such a large drop in future production costs,
but yet not a similar drop in proved reserves.
I compared these results to industry leader, ExxonMobil, and CLR knocks
it out of the park, as ExxonMobil suffered about a 24% drop in proved reserves
while cutting future production costs about 29% during the same period.
CLR also cut future development cost and abandonment cost estimates from
$12.8 billion in 2014 to $6.9 billion in 2015.
These production, development and abandonment cost cuts are critical,
had they not been achieved, CLR would have negative $1 billion in estimated
net future cash flows. Estimated net future cash flows from 2014 to 2015
fell from $38.4 billion to $15 billion. Standard measure PV10 fell from
2014 $18.433 billion to 2015 $6.476 billion. CLR has never carried much
cash, 2014 $24.4 million, 2015 $11.5 million.
Long term debt increased from $5.927 billion to $7.116 billion. CLR's
traded enterprise value continues to greatly exceed its peers.
I think it would be interesting to know if there are any other industries,
besides E&P, where such a high market capitalization could be achieved,
with such a low amount of cash, such a high long term level of debt, and
with future net cash flows, utilizing a discount rate of 10%, below the
amount of long term debt. Tesla comes to mind.
Michael. Is CLR's high density Poteet Unit a good representation of the
productivity of its SCOOP assets? Are there some other wells/units you could
recommend. I have an IHS Global subscription, would like some guidance on
assets you feel would be best to review.
Good article Iran doesn't have 50 million barrels on ships anymore though.
They started selling those shortly before sanctions were lifted late last
year and have been gradually selling those takers this year not sure there
is that much left to sell. of those at this point.
22023171, Where did you get that information? As of March 17th Iran had
an estimated 51.6 million bbls in floating storage including condensate.
It has steadily increased since Oct of last year when it had 42.02 million
bbls
Bison, Production taxes in ND dropped from 11.5% to 10% since Jan 1st this
year. E.g. link at http://bit.ly/1WApDmP
Royalties : I have seen many numbers & estimates in the range of 18%-24%.
For convenience, I took 20%. Together this means that companies have to
turn over a 30% or so of production before subtracting their own costs.
Enno: I think the royalties and excise taxes are off the wellhead price,
not off of the WTI reference. So, that adds about $3 per barrel back to
the margin. (WTI-BD)*0.7 > WT*0.7-BD Because [(WTI-BD)*0.7] - (WT*0.7-BD)
= 0.3*BD ~ 0.3*10 = 3
Please review my calculation again. I didn't take the severance taxes
& royalties from the WTI reference, I took them straight off the gross production
volume.
200 kbo gross oil production volume from an average CLR well within the
first 5 years means (subtracting production taxes & royalties of 30% or
so) about 140 kbo net oil production volume for CLR, right?
Besides, my calculation wasn't meant to be ultra-precise. I also didn't
add land costs, seismic & other CAPEX, stock-based compensation, time value
of money (discount factor), or the positive contribution from some gas.
I just wanted to show that oil prices have to be materially higher than
the strip prices in order for CLR to have its money back on these kind of
wells within a reasonable time frame. I'd love it if someone could point
out to me where I am wrong on this.
Thanks. I have one comment on royalties. Most of the early drillers got
in for a lot less than the 20% you estimated. My mineral acres are 13% and
I know several others that are in the 16% range. The reason for the low
royalties is that a lot of the mineral rights owners didn't know what they
had and in hindsight got rooked out of a lot of money.
1. If you subtracted the barrels explicitly, than that would seem to make
sense so my comment is wrong.
2. I wasn't trying to nitpick one thing to shoot down an overall argument.
Just to note the one place I (thought I) saw an error. Chill. I thought
you were doing well and just wanted to hone it better.
3. Since your discussion was already about simple payback, no reason
to model time value of money. It's already understood that this not an NPV.
4. I would treat the land costs as sunk. We are trying to think about
what price of oil it takes to drill now. (Similar for long ago seismic or
infrastructure buildout.) Obviously this is a judgment call and if you acquire
new acres or build new infrastructure than you need to charge the drill-or-not
decisions with the cost. Similarly stock costs and the corporate center
G&A are a little bit of a question.
I would probably keep them clear from the project decision (if you don't
drill, do you recover those costs? Maybe, if you do a layoff like SWN did...)
Bison. I have reviewed many non-operated working interests for sale on energynet.com
located in the Williston Basin. 1/8 royalties are rare. I have seen 72-83.3%
NRI.
My understanding is land men and others were able to latch onto significant
ORI. However, go ahead and do Enno's calculation with 87.5 NRI. You still
don't get there. We stay under $50 for awhile, eventually CLR will be bankrupt.
Too much debt, not enough future net cash flow.
This is supported by the numbers in their own 10K submitted to the SEC.
It is now almost a year and a half into the worst bust my family has endured,
yet shale proponents are still in denial.
I do not deny shale is a game changer, is very important for our country,
has had many technical breakthroughs, etc. I only deny it works broadly
sub $50, or even sub $70 oil as a good, or even marginal investment.
We have enough well histories and cost statistics, including horrific
2015 earnings, massive layoffs and depressed and wildly volatile stock prices
to know that. So please acknowledge this and join me in praying shale will
stop completing wells and fibbing about $30 break even. I unfortunately
own shares in two previously good companies COP and EGN, who got caught
up in the allure of shale. One has cut its dividend and the other eliminated
it. The shares are way down, and very volatile. They only go back up if
oil prices recover.
Rig count has crashed to below 400. It continues to go down as rigs come
off contract or as projects complete. How much less drilling do you need?
Seems like they have laid the drill bit down.
I hope you are right, but what happens if WTI hits $50? I don't want a repeat
of the spring of 2015, and the resulting price crash. Look at what happened
Friday. Add one stinking oil rig, and WTI turns lower.
shallow sand, Oil price forecasts are never concrete
but some analysts think oil will see $60/bbl this year (this means we see
it, not average it), or early next year. Lets hope oil prices are much higher
next year, as it could be a tough 6 months, but if things go well the oil
markets will balance at that point.
We have discussed this before. $20 long term = destruction of the US oil
industry, which will be followed by a massive oil super spike. Commodity
volatility is not good for the world economy. What is not good for the world
economy is not good for the US economy, generally. $100 is not good. $20
is not good. But we are all entitled to our own opinions.
Very good point, Michael. I would rather see the DUC wells completed, before
rigs are added, as there is no good DUC count quoted, and it seems traders
aren't trading off that. It seems more logical to complete all DUCS, than
add rigs, if prices rise.
But, there were some long rig agreements entered
into, compared to completion agreements. I hope you are right about $60.
I hope you know my primary beef with the shale industry is the failure,
a long time ago, to acknowledge they cannot win a "to the death" price war
with Russia and Saudi Arabia. In retrospect, had this been acknowledged,
with activity limited to establishing HBP, I doubt prices would have stayed
so low. I note that prices jumped almost immediately after 10K came out,
showing there are no future net cash flows for these companies at sub $30
WTI. However, when shale continues at it, claiming massive cost and production
improvements that will make $30 work, it sends the wrong signals to the
market concerning where prices should be, IMO. What shale has done is truly
remarkable on the production side, but the companies seem to forget they
are in business to make money first. This is why EOG's $30 competition with
OPEC statement surprised me. I had viewed them as disciplined, they stated
as much, then came out with that presentation. Very confusing. In summary,
we own production in a very shallow, old field.
The field was old in the 1970s, annual decline is less than 2%. Since
1997, when I started, I have lost $$ two years, 1998 and 2015. 2015 was
worse than 1998. 2016 is setting up to be worse than 2015. An example I
use is Coca Cola. What happens to them if top line revenues drop 70%? In
one year? Or Apple, or any other company in any industry.
I agree with Mike about tracking completion crews. CLR has 135 DUCs and
expects to exit 2016 with 195. EOG has some 300. HAL and many other sources
estimate as many as 4,000 DUCs. However this includes wells on pads just
waiting for crew not higher oil price. Maybe 2,000 waiting on higher oil???
shallow sand, It would seem that many of the "better" rigs were kept on
contract and instead of paying to end the contract early they just kept
drilling for wells to be completed at a later date. I would agree with you
in that this is not a great way to run business. Spending investor money
to do work that may or may not get done depending on oil prices isn't the
best way to run a business.
Normally EOG is one of the more disciplined operators, but I would guess
everyone is a little scared, and fear does a better job than anything of
getting people to make poor decision choices. Not saying it is right, especially
since some investors don't know what is meant by such statements. Operators
seem more scared what a production decrease announcement would do to stock
prices than working for a profit. 2016 could still have significant pain
ahead. Since supply and demand is only off by a couple percent, it has just
taken way too long to correct. Something to be said for massive overproduction,
at least the bottom is hit hard and fast.
Pablomike, More importantly, how many of those are in marginal areas that
will need $70 or $80 oil to complete? Some operators were still drilling
marginal wells when this all started and then just decided to sit on those
holes and wait. I am guessing the newer DUCs are probably in core or Tier
2 type acreage, but some of this overhang could end up sitting for a while
(while some operators will go out of business and never complete). I would
say somewhere in between 4000 and 2000 is a good number, but that one I
don't know for sure.
EOG had a hefty rig penalty if they stopped all drilling. They were clear
about this on the call and that is why they are drilling DUCs. The money
is effectively gone already. Sunk cost.
They would be drilling less (maybe not at all) in the Bakken if it were
not for the rig contracts. I suspect same is true for CLR although details
were not pinned down as well in their conf call. The meme of crazy E&P companies
is overdone by the peak oilers.
Remember these are the same critics who complained about growth when
oil was at 100+. These E&Ps are very NPV oriented and they have CRASHED
the amount of drilling down. There is a limit to how fast rigs can roll
off. But we are already down to sub 400.
The backlog of DUCs is already shrinking. Wolfcamp/Bone Spring and Eagle
Ford formations - in each of those formations, the excess has fallen by
about 150-175 over the past six months, bringing the surplus to around 300
wells in each.
In North Dakota, it might not be economic. There, the number
of DUCs climbed above 1,000 in September before falling to 945 in December,
according to the latest data from the state's energy regulator.
Wood Mackenzie reckons that the backlog of excess DUCs will decline over
the next two years and return to normal levels by the end of 2017. It is
expected to fall 35% from current levels in the Bakken and 85% in the Eagle
Ford by the end of 2016.
These are excerpts from the following article released today:
So, Bakken 1,000, 300 each Permian and Eagle Ford = 1,600. Other formations?
If one excludes NG Marcellus/Utica etc, perhaps other primary oil formations
would bring total to 2,000?
Good point. I suppose we need to categorize DUCs. Some operators realize
they have poked holes in some really lousy rock and won't complete without
much higher prices. Some like WLL, while in their best core acreage, will
keep poking holes but won't complete ANY wells until prices rise. Then there
is EOG which claims profit at $30 oil but has as many DUCs as anybody.
re: DUCs. I wanted to update my previous post. After reading again the cited
Reuters article, I realize one has to differentiate between their talking
about 'excess' DUCs (above average) and actual nominal DUCs.
So, consider
the following excerpt: "Typically, average DUC inventory is around 550 in
the Wolfcamp/Bone Spring formations and around 300 in the Eagle Ford....In
each of those formations, the excess has fallen by about 150-175 over the
past six months, bringing the surplus to around 300 wells in each." So if
the surplus is 300 each, then the total DUCs would be 850 in Wolfcamp/Bone
Spring and 600 in Eagle Ford. So formation totals would = ~1,000 Bakken
+ 850 Permian + 600 Eagle Ford = 2,450 for these three formations. Anyone
have any insight on where the remaining oil primary formations currently
sit at regarding their DUCs?
I have grave reservations about the alleged spare capacity of Iran.
The assumption is that the big, bad sanctions resulted in a huge drop in
Iran's oil production. I am not buying it. I think the sanctions were a
joke. For starters many nations refused to take part in the sanctions. Nations
like India, china, japan and South Korea for starters. It would not be difficult
to then reexport this oil to the rest of the world on the sly.
Would you please comment on this important matter. Does anyone have any
inside information about this?
Agree, most of us follow news as herd effect, but devil is in the detail.
Before the sanction, Iran was export 2.5 million barrels of oil per day
but had to import almost 0.5million barrels of processed fuel, gasoline
and diesel.
Now, 4 years after the sanction starts, Iran already built up the refinery
capacity, so it will no longer need import of refined fuels; instead it
will be exporting, how much is yet to be decided. So, right there, we will
see over 0.5 million barrels of reduction in the oil to be exported from
Iran. Yes, the sanction reduced the Iranian oil export from 2.5million to
1.5million per day, but the net effect after sanction now will be less than
0.5 million per day to the world market.
40 years, I would be surprised if you didn't have reservations. You aren't
the only one. Iran's infrastructure wasn't that great before the sanctions
so I would guess they are abysmal now. I don't think they can get to 4 million
this year, but the problem with that is I am speculating so we will just
have to track its exports and see what happens. Right now, I think it would
be ok to reduce that number by 400K BO/d. I think the biggest issue is Iran
thinks its possible, so maybe there is something going on we haven't thought
about. Probably not, but it is still something to consider. I wasn't a big
fan of the sanctions either, but some politicians would say they worked.
I think it is very possible to re-export the oil the only problem is the
very large volumes Iran can produce. If this was a small producer it is
probably easy if you sell it cheap enough (like ISIS does).
FracDaddy, I agree on EOG, but I wouldn't say they are really Bakken focused.
I think they like the Eagle Ford and Delaware Basin better. I would probably
call them a top Eagle Ford pick though. Hess has done a great job with costs
and has excellent margins, but they are still doing sleeves for the most
part, and I don't think they offer as much from a growth in production per
foot perspective. I probably like EOG more and HES less than CLR but I wouldn't
say I dislike any of them.
Do you know why CLR drilled much less number of wells in the
Springer than the Woodford below? If the economics for Springer is much
better than Woodford as CLR said before (such hype like "3X better" is no
longer in their latest PPT), they should be targeting Springer, like they
are targeting STACK? The 300K curve in 240days in Woodford is for wet gas
or NGL, probably not even light condensate.
Looking at CLR's 2016 plan, they will drill almost zero wells in Springer.
Is it possible Springer actually is hard to drill? Studying the Springer/STACK/Meramec
and found that these stacks,although quite thick, i.e. >400', they are not
homogeneous, meaning the sweetspot layers could be hard to locate within
<50'. This is different than the Woodford shale below, where the target
is well defined, i.e. the core is in the shale. It is easy to do geosteering
using gamma.
nuassembly, I think it has much to do with what you said. They are still
getting comfortable with the Springer geology while the Woodford is already
seeing pilot projects. The Springer definitely looks better though. I cant
comment on the wetgas/NGL versus light condensate comment, as Im not sure
about that.
It is possible that right now CLR doesn't want any failures given the
current economic conditions (especially with no hedge book). Thank you for
sharing your knowledge with respect to the Springer/STACK/Meramec.
You are using old info - at lot of SAGD oil sand production has half the
costs indicated in your chart. To may authors just scrape up the old obsolete
charts that are out there and use them in their articles.
marpy, Sorry if you didnt like the chart. Feel free to share links to any
charts you feel are appropriate. The article had little to do with oil sands,
but if you think PIRA's data is off feel free to correct it in future comments.
Have a good day!
Is this article a joke? Discussion the investment value of an oil company
that does not pay a dividend! Executives may be getting fat on this company,
but I doubt this result for stockholders.
Bruce909, No joke and no one is getting fat of any oil companies right now.
When investing we generally try to estimate where companies and oil prices
are going not where they are right now. I don't know what the plans are
for a dividend, but CLR and most unconventional producers aren't in a position
to do much. Thanks for the comments, and glad I could make you laugh :)
I don't see why HBP drilling a couple years ago was such a great decision.
After all, the costs were higher at that time, then they are now.
Also, the value of the acreage has dropped. Would seem to have been better
to keep the cash and wait to HBP (or let leases lapse even) now. The one
possible benefit from CLR's approach might be that they have stuck to a
plan and done a huge Design of Experiments assessment of geology and completion
techniques across the basin. And then there is some value of that. I don't
really buy that though. Don't think that kind of knowledge has as much value
in the world where marginal acreage doesn't get drilled, in a world where
downspacing is less. (Because oil is worth less.)
For that matter, I have read that many companies put too much value on
data points that they acquire themselves and too little value on the data
that is easily acquired on wells that competitors did (from logs, cores,
NDIC database, DrillingInfo, etc.). So, I don't really buy it as a rationale.
But just listing it as a possibility.
21793061, Thanks for the comment. In hind sight you are definitely correct.
I bet the mineral rights owners are happy they got the royalties they did
(and I am happy for them too, but wish Bison73 would have gotten more).
I think many thought we would have high oil prices for a long time, as not
too many thought it would be possible for unconventional production to grow
enough to cause a glut. That said, you are correct. Bigger names with some
cash will make out like bandits, as they are able to add acreage at what
will look like great deals in a year or two.
217930681 CLR actually has small working interests in a great many of the
wells that their peers drilled with operational control. Hamm has said repeatedly
that CLR studied and learned just about everything that occurred with these
non operated wells.
They have a huge amount of acreage with minimal second
and third bench TF development ... to say nothing about the almost nonexistent
delineation of the fourth bench.
CLR has made an enormous investment very early on in the Bakken.
When
prices recover, they are apt to reap significant benefits.
Mike - my mother signed the rights for that royalty although her initial
rate was 12 and 1/2%. She is 91 years old and when they came and initially
got the rights (back in 1985 or so) it was considered a good rate. That's
why I sometimes laugh at everyone who thinks that mineral owners in the
Bakken got 20% especially in the Parshall area (EOG prime area).
And my mineral acres are between Van Hook and New Town! I am not complaining
by the way. Some people unknowingly sold their mineral rights when they
sold their land and when the reservoir was created the Corp of Engineers
bought a lot of land and a lot of people lost their mineral rights but I
digress!
Bison, I am guessing any rate in that area would be pretty good. When people
start talking about royalty payments the number always seems to get bigger
as each person passes the rumor around. When the deals were signed in Parshall
Field no one new the volumes of oil the operators would get out of the ground,
or how high oil prices would go.
Thanks for the comment. Since Parshall is my hometown I know quite a
bit about what happened during the run up to the Bakken boom. Landmen were
throwing money (what people in the area thought was a lot) around and they
signed on the dotted line very quickly. I remember bonuses being paid in
2010 in the thousands of dollars/acre range which in hindsight was insane.
Michael - nice article, some really good data here. I'd like your opinion
on something, if I may. Shale plays have completely changed the game over
the past few years. Their startup economics is pennies on the dollar compared
to say, deepwater, where only the biggest players could play and the investment
costs were enormous before even a single barrel of oil was produced. Relatively
cheap to get into = lots of potential players. Now one of the things I've
only seen mentioned in one or two SA articles is this business of "producer
discipline".
There was a recent quote by the CEO of EOG saying something to the effect
that US operators had "learned their lesson" (I'm paraphrasing) and that
producer discipline would definitely be an active concern going forward
once the recovery comes. You appear to know the players in the unconventional
space pretty well. Given the current operators and any new we may see once
a recovery does come, is "producer discipline" even a remote possibility?
I personally have my doubts but would like to know what you think. Thanks.
In a free market (non collusion), then the only thing that enforces "discipline"
is the marginal producer effect. If there are operators who produce below
cost of capital (irrational), then eventually the market disciplines them.
Conversely if there is irrational hesitation to invest, then other entrants
will come and take the opportunities. It makes me cringe to hear all this
talk about "discipline". Reminds me of Dick Cheney talking about reducing
volatility.
These are code words for collusion. Fortunately this is against the law
and also difficult to achieve, given all the small producers. Well...fortunate
for consumers. For producers, they would love to have them some collusion.
Even better if OPEC will do the job for them.
Devon paid 1.6Billion in the past December, 3 months ago, for Felix acreage.
It is $20K/acre!!! while oil price dipped below $40!!
According to CLR STACK PPT, more than half of the Felix acreage is outside
(east) the so called "Pressurized zone", which means under par?
According to CLR's initial Springer story, it is over 200' thick, while
Newfield claimed it is as thick as 700'. Boy, that means everywhere you
drill there is oil--- it can not be that easy, you need to be able to geosteer
in the sweet stack, e.g. within 50' of the 700' possible. Do you see that
CLR is no longer mentioning its Springer in their latest report?
My speculation is that they will have similar challenges in Springer, or
even greater challenges, in the STACK than in Springer.
Not sure how CLR and Felix compare in sweetness (or
in wells dug and producing, i.e. steel in the ground.) But just looking
at the latest CLR conf call powerpoint, they have 595,000 acres of STACK
& SCOOP. If you make simplest assumption and say same price as Felix than
that gives you $14.1 billion for their OK acreage.
2. I agree that they don't seem to be pushing the Springer as much as earlier.
That said, it was still in several pages of their PowerPoint and in the
10-K. So not sure what you mean when you say "no longer mentioning". And
which CLR report are you referring to?
Michael, Thanks for all the work you put in for this article. Lots of good
information.
The one problem I have with most oil companies, is using BOE. It was
refreshing to see CLR state actual bbls /day in their presentation. Look
like decent wells but they are going to have to reduce their CWC to make
it a great play. I expect a year from this time, these well cost will have
decreased significantly.
Excellent article, but my question is one of changing the oil curve. Most
of CLR's success had been as oil stayed above $80.BBL from 2003 until 2014.
If we are resetting the standard price based on supply and demand oil could
end up between $15-$45 for the next 2-4 years. How can CLR sustain a longer
period of lower prices with the amount of debt currently to equity, and
taking into consideration the low float? I cannot recall a time when they
were as cash strapped as they are now and debt ridden.
If I understand your theory oil would have to be $40-$80 and if you compare
current supply to that of 1985 I believe too many investors are forgetting
how long we can stay in the lower end of $25 BBL.
green law. If you have the time, go to the section near the back of CLR
10K where is contained future cash flow estimates for the years 2013, 2014
and 2015. Reduce the estimate of future cash flows to $25 billion and estimated
future income taxes to zero for 2015.
Undiscounted future net cash flows fall to $7 billion under your pricing
scenario, which means trouble given company debt levels.
"... I have grave reservations about the alleged spare capacity of Iran. The assumption is that the big, bad sanctions resulted in a huge drop in Iran's oil production. I am not buying it. I think the sanctions were a joke. For starters many nations refused to take part in the sanctions. Nations like India, china, japan and South Korea for starters. It would not be difficult to then reexport this oil to the rest of the world on the sly. Would you please comment on this important matter. Does anyone have any inside information about this? nuassembly 20 Mar 2016, 11:25 AM Comments (13) | + Follow | Send Message Agree, most of us follow news as herd effect, but devil is in the detail. Before the sanction, Iran was export 2.5 million barrels of oil per day but had to import almost 0.5million barrels of processed fuel, gasoline and diesel. ..."
"... Now, 4 years after the sanction starts, Iran already built up the refinery capacity, so it will no longer need import of refined fuels; instead it will be exporting, how much is yet to be decided. So, right there, we will see over 0.5 million barrels of reduction in the oil to be exported from Iran. Yes, the sanction reduced the Iranian oil export from 2.5million to 1.5million per day, but the net effect after sanction now will be less than 0.5 million per day to the world market. ..."
I have grave reservations about the alleged spare capacity of Iran.
The assumption is that the big, bad sanctions resulted in a huge drop in
Iran's oil production. I am not buying it. I think the sanctions were a
joke. For starters many nations refused to take part in the sanctions. Nations
like India, china, japan and South Korea for starters. It would not be difficult
to then reexport this oil to the rest of the world on the sly.
Would you please comment on this important matter. Does anyone have
any inside information about this?
Agree, most of us follow news as herd effect, but devil is in the detail.
Before the sanction, Iran was export 2.5 million barrels of oil per
day but had to import almost 0.5million barrels of processed fuel, gasoline
and diesel.
Now, 4 years after the sanction starts, Iran already built up the refinery
capacity, so it will no longer need import of refined fuels; instead it
will be exporting, how much is yet to be decided. So, right there, we will
see over 0.5 million barrels of reduction in the oil to be exported from
Iran. Yes, the sanction reduced the Iranian oil export from 2.5million to
1.5million per day, but the net effect after sanction now will be less than
0.5 million per day to the world market.
40 years, I would be surprised if you didn't have reservations. You aren't
the only one. Iran's infrastructure wasn't that great before the sanctions
so I would guess they are abysmal now.
I don't think they can get to 4 million this year, but the problem with
that is I am speculating so we will just have to track its exports and see
what happens. Right now, I think it would be ok to reduce that number by
400K BO/d.
I think the biggest issue is Iran thinks its possible, so maybe there
is something going on we haven't thought about. Probably not, but it is
still something to consider. I wasn't a big fan of the sanctions either,
but some politicians would say they worked. I think it is very possible
to re-export the oil the only problem is the very large volumes Iran can
produce. If this was a small producer it is probably easy if you sell it
cheap enough (like ISIS does).
A typical disinformation bunged with the obvious attempt to amplify differences
within the OPEC. In spite of all this noise about oversupply i t will be difficult
to return to the lows of the year. Oil prices have surged more than 50 percent from
12-year lows since the OPEC floated the idea of a production freeze, boosting Brent
up from around $27 a barrel and U.S. crude from around $26. 15 oil-producing nations
representing about 73% of oil production have agreed to take part.
Notable quotes:
"... Qatar, which has been organizing the meeting, has invited all 13 OPEC members and major outside producers. The talks are expected to widen February's initial output freeze deal by Qatar, Venezuela and Saudi Arabia, plus non-OPEC Russia. ..."
"... Iran produced about 2.9 million bpd in January and officials are talking about adding a further 500,000 bpd to exports. So far though, Iran has sold only modest volumes to Europe after sanctions were removed. ..."
...Libya has made its wish to return to pre-conflict oil production rates
clear since four countries reached a preliminary deal on freezing output in
February. Other producers understand this, the delegate said. "They appreciate
the situation we are in."
Qatar, which has been organizing the meeting, has invited all 13 OPEC
members and major outside producers. The talks are expected to widen February's
initial output freeze deal by Qatar, Venezuela and Saudi Arabia, plus non-OPEC
Russia.
The initiative has supported a rally in oil prices, which were about $41
a barrel on Tuesday, up from a 12-year low near $27 in January, despite doubts
over whether the deal is enough to tackle excess supply in the market.
Iran has yet to say whether it will attend the meeting. But Iranian officials
have made clear Tehran will not freeze output as it wants to raise exports following
the lifting of Western sanctions in January.
The potential volume Libya and Iran could add to the market is significant.
But conflict in Libya has slowed output to around 400,000 barrels per day since
2014, a fraction of the 1.6 million bpd it pumped before the 2011 civil war.
Iran produced about 2.9 million bpd in January and officials are talking
about adding a further 500,000 bpd to exports. So far though, Iran has sold
only modest volumes to Europe after sanctions were removed.
"... A lot is written at the moment about shale break even prices of 24 to 40 usd. Every time i try to calculate those numbers, even when using best wells as per shaleprofile.com i cannot get even close to those numbers. Does somebody have the basics behind the above break-evens? ..."
"... There are outlier wells that work, but Enno's shale profile.com site is an excellent resource which shows that really no company can make these wells work at prices under $50 WTI, and really that $80+ is needed to have a good business. Remember when CLR cashed their hedges, they said they saw prices returning to $80-$90 soon. They did not. CLR and all others have cut to the bone on costs, but it is impossible to cut enough to overcome a 60-70% loss of gross revenue. ..."
"... Daniel, in 50 years of being an oil producer I had never heard the term "breakeven" until the shale oil industry came along; it is a meaningless, much overused metric. The oil industry drills wells to make money, so we can drill more new wells with net cash flow from old wells. Profitability is all that matters. Reserve growth cannot occur without profitability; unless of course you are in the shale oil business, in which case you simply borrow enough money to grow, in spite of unprofitability, and suffer the consequences down the road. Which is precisely what is happening now. ..."
"... I don't borrow money to drill wells (that is a well known no-no) so I can't wait 60 months to get my money back on a well I've drilled and completed. Thirty six months is the maximum and even that is too long. The 150% ROI numbers the shale industry use to throw around regarding "profitability" (but certainly can't any longer!!) is insufficient return on investment to keep moving forward, at least to me. I need at least 300% ROI. If my CAPEX is risked I need even higher ROI. If I can't achieve that, I don't drill the well. I was taught these standards by many before me and they still apply today. ..."
"... With great respect for my friend Shallow sand, I think it would actually require in excess of 120 dollar oil prices for the shale industry to be able to drill wells off net cash flow, in other words, to live within its means and not borrow money it can't pay back. As far as I am concerned the hundreds of billions of dollars it has already borrowed…we'll never see that. It's gone. ..."
A lot is written at the moment about shale break even prices of 24 to
40 usd. Every time i try to calculate those numbers, even when using best
wells as per shaleprofile.com i cannot get even close to those numbers.
Does somebody have the basics behind the above break-evens?
Enno and Daniel. The simple, undiscounted 60 month payout calculation has
not been refuted, with really even no attempt to, since I first used it
in early 2015 on LTO.
The only real criticism that has been valid has been from Mike, and a
few other oil producers, who say 60 months is too long. Mike is probably
right, but I am trying to give the companies the benefit of the doubt.
There are outlier wells that work, but Enno's shale profile.com site
is an excellent resource which shows that really no company can make these
wells work at prices under $50 WTI, and really that $80+ is needed to have
a good business. Remember when CLR cashed their hedges, they said they saw
prices returning to $80-$90 soon. They did not. CLR and all others have
cut to the bone on costs, but it is impossible to cut enough to overcome
a 60-70% loss of gross revenue.
I have posted this model on seeking alpha several times. No successful
attacks of my fifth grade math that I am aware of.
Enno, I think you made a good point with me awhile ago that the audience
needs it dumbed down. Given few can understand the 60 month payout, let
alone discounting future net cash flows, I wholeheartedly agree.
I encourage all to visit Enno's site. It exposes the 900K EUR fallacy
very well. Of course, the 900K is routinely half or more BOE gas, which
has been selling below $12 per BOE for months.
There is a producer who posts on Oilpro.com named Jackie, whose posts
I really enjoy. He keeps it simple, and I agree with him. If there is less
money coming in the bank account than going out, you are losing money. No
amount of slick investor presentations can refute that.
Daniel, in 50 years of being an oil producer I had never heard the term
"breakeven" until the shale oil industry came along; it is a meaningless,
much overused metric. The oil industry drills wells to make money, so we
can drill more new wells with net cash flow from old wells. Profitability
is all that matters. Reserve growth cannot occur without profitability;
unless of course you are in the shale oil business, in which case you simply
borrow enough money to grow, in spite of unprofitability, and suffer the
consequences down the road. Which is precisely what is happening now.
I don't borrow money to drill wells (that is a well known no-no)
so I can't wait 60 months to get my money back on a well I've drilled and
completed. Thirty six months is the maximum and even that is too long. The
150% ROI numbers the shale industry use to throw around regarding "profitability"
(but certainly can't any longer!!) is insufficient return on investment
to keep moving forward, at least to me. I need at least 300% ROI. If my
CAPEX is risked I need even higher ROI. If I can't achieve that, I don't
drill the well. I was taught these standards by many before me and they
still apply today.
And by the way, anybody claiming that shale oil CAPEX is not highly "risked"
I submit to you that the price of oil has fallen 70% in the past 16 months.
With great respect for my friend Shallow sand, I think it would actually
require in excess of 120 dollar oil prices for the shale industry to be
able to drill wells off net cash flow, in other words, to live within its
means and not borrow money it can't pay back. As far as I am concerned the
hundreds of billions of dollars it has already borrowed…we'll never see
that. It's gone.
Shallow you and Enno did great yesterday on Alpha; Filloon is a big time
Bakken cheerleader. Those guys are getting desperate with their we're OK
rhetoric now. Its not about big IP's and EUR's, it's not barrels and mcf's…its
about dollars and cents, nothing else. Keep up the good work, y'all.
As always, it is a pleasure to read your "no B.S." comments. Cut to the
chase and tell us like it is. Nice to have people in the reality based world
weigh in on the madness.
"Filloon is a big time Bakken cheerleader. Those guys are getting
desperate with their we're OK rhetoric now." ~ Mike
"My husband's company has it's own studies saying to expect 2 million
barrels a day from this state in 2019 and staying at that level until
around 2030." ~ dn_girl
"We had a proud young woman post yesterday about her… optimism about…
future in the oilfields of North Dakota. It is a powerful message that
we should have all embraced…" ~ Mike
"I gotta go let some good kids go. Damn, I hate that…" ~ Mike
"As always, it is a pleasure to read your 'no B.S.' comments. Cut
to the chase and tell us like it is. Nice to have people in the reality
based world weigh in on the madness." ~ islandboy
"I mix with professional people and and I know i have earnt up to
double their pay scale…" ~ toolpush
"... From 2006 to 2014, the global oil and gas industry's debts almost tripled, from about $1.1tn to $3tn, according to the Bank for International Settlements. The smaller and midsized companies that led the US shale boom and large state-controlled groups in emerging economies were particularly enthusiastic about taking on additional debt. ..."
Distress in the oil and gas industry is acute . Many companies are being liquidated
or forced to cut to the bone:
About 600 people packed on to the Machinery Auctioneers lot on the outskirts of San Antonio,
Texas, last week to pick up some of the pieces shaken loose by the oil crash.
Trucks, trailers, earth movers and other machines used in the nearby Eagle Ford shale formation
were sold at rock-bottom prices. One lucky bargain hunter was able to pick up a flatbed truck
for moving drilling rigs - worth about $400,000 new - for just $65,000.
Since the decline in oil prices began in mid-2014, activity in the Eagle Ford, one of the heartlands
of the shale revolution, has slowed sharply. The number of rigs drilling for oil has dropped from
a peak of 214 to 37, and businesses, from small "mom and pop" service providers to venture capital
companies, are trying to offload unused equipment.
Terry Dickerson, Machinery Auctioneers' founder, says sales doubled last year, in part thanks
to the oil crash. Sellers are sometimes disappointed by low prices for oil-related assets, but
they have to accept reality, he says. "I feel like a funeral director," he adds. "I'm the one
that has to tell them the bad news."
Lenders went on a spree . While this is a notoriously cyclical industry, the
shale gas frenzy drew in a lot of newbies, particularly among investors. The fact that so many players
made heavy use of borrowings, with the Fed's negative real interest rate policies all too successfully
pushing lenders into risky assets, has amplified the damage. From the story:
From 2006 to 2014, the global oil and gas industry's debts almost tripled, from about $1.1tn to
$3tn, according to the Bank for International Settlements. The smaller and midsized companies that
led the US shale boom and large state-controlled groups in emerging economies were particularly enthusiastic
about taking on additional debt.
The hangover has only just begun :
Standard & Poor's, the credit rating agency, assesses oil companies based on an assumption
of an average crude price of $40 this year. On that basis, 40 per cent of the US production and
oilfield services companies it covers are rated B-minus or below. "B-minus is a very weak rating,"
says Thomas Watters of S&P. "You don't have a long lifeline."
Make no bones about it: a B- or worse means you are barely hanging on. To illustrate:
Linn Energy, one of the 20 largest US oil and gas producers, warned last week that it expected
to breach its debt covenants. It has net debts of $3.6bn, but only $1m in borrowing capacity.
Many US producers are now having their borrowing limits, which are based on the value of their
reserves, redetermined by their banks. The falling value of those reserves means loan facilities
will be cut back, leaving some companies without enough liquidity to stay afloat.
Even when companies can be restructured, lenders are taking big hits :
When oil and gas companies go into bankruptcy, there are often slim pickings for creditors.
Quicksilver Resources, a Texas-based gas producer, went into Chapter 11 bankruptcy protection
last year with about $2.4bn of debt. This year it announced sales of its US assets for just $245m,
and some of its Canadian assets for $79m. Its creditors are on course for losses of about $2bn.
Do the math. That's an 83% loss of principal. The story reassuringly points out that even bigger
amounts are at risk at national oil companies like PDVSA of Venezuela and Petrobras.
In a worrisome parallel to subprime risk before the crisis, investors are getting rattled by banks
increasing their forecasts of losses:
"It's alarming that things [bank loan loss estimates are getting pulled forward so much," says
Julie Solar, an analyst at Fitch Ratings. "The pace of deterioration is coming quicker than what
was previously disclosed."…
Since crude prices began to fall in the summer of 2014, investors in oil and gas companies
have lost more than $150bn in the value of their bonds, and more than $2tn in the value of their
equities, according to FT calculations.
The grim reaper tone of the article suggests that things will get worse in energy-land before
they get better. The oil bust in 1980-1981, which was a regional affair in the US, was bloody and
took down pretty much all of the Texas banking industry. It's hard to know from this far a remove
what the trajectory will look like, particularly since even with things his visibly dire, the incumbents
all have strong incentives to make things appear less bad than they are. Any reader intelligence
would be very welcome.
craazyman ,
March 22, 2016 at 7:07 am
every real man wants to keep drilling until the money runs out. And if you can't keep drilling,
you have to find a new hole. That's what they say. Some holes cost more than others, but a real
man needs a hole. What does a man do now, when his hole is dry and he can't drill? Or if drilling
doesn't get him where it used to? Those were the days, when a man could drill around and have
it be good every time. Each real man has to face the day when just showing up with his drill doesn't
work anymore. He better hope the hole he has is good. And he better not have drilled on borrowed
cash, because once a hole is dry for a man there's no going back to the good times, that's for
sure.
My dad got stuck into KYN, a high yield energy-related MLP back in 2011 – considered suitable
for IRAs.
The dividend got its first 16% haircut in Dec. The div was maintained in Q1 2016. But when I took
a cursory glance at the financial statements of the top five holdings that comprised 48% of this
MLP, this is what I uncovered:
Collectively, these 5 companies had a combined net income of ~40m and ended 2015 with 849m
in cash. One of these companies had a negative (~ -1.5b) net income. Collectively, they paid out
~13b in dividends in 2015. The funding of those 13b in dividends was largely accomplished through
~17b in financing activities, via issuing debt and selling stock. Needless to say, they are all
heavily in debt and the financing activities doesn't even address financing interest expenses
and the like.
The reason I mention the above is to cite the caption "companies have borrowed heavily to fund
their growth" in the EIA chart above as a gross mis-characterization. Their financing activities
were funding their dividends in 2015, and without access to the same funding channels in 2016,
not only will the divs l be zeroed out – they will all be fighting for survival with little cash
cushion and little net income to see them through to another day.
Maybe we could use the high yield to buy Credit Default Swaps on the high-yield fund and retire
on those?
Peabody Energy is going tits-up. Similar story, gorged itself on roid's in the form of cheap
debt to fuel "growth" and now all of that bulk is pulling it down the drain. A -800% return on
the stock in last 4 years. Impressive. Almost 99 % yield on the unsecured bonds. Chapter 11 seems
to be priced in.
From what I've read, the investment arms of banks have been busy issuing new stocks and bonds
in energy companies with bad loans on the parent bank's books. The proceeds go to repay these
outstanding bank loans, mitigating some or all the damage banks face. What's left will be largely
unsecured loans that the banks could care less about since they belong to some other sucker. Of
course the stocks when issued have declined sharply in price thus burning shareholders as well.
It appears banks may have learned their lesson from previous meltdowns by farming out the losses.
"One lucky bargain hunter was able to pick up a flatbed truck for moving drilling rigs - worth
about $400,000 new - for just $65,000."
Lucky? @15 cents vs new? 86′ the bottom fishing was at 9% or less – sold in many cases by the
pound
The First Liens of the Banks are seriously underwater especially in Canada. The surge in oil
prices and the associated refinancing of bonds and secondary stock offerings will get some high
profile company exposure off the books of the banks as they take the liquidity for a pay down
– but the decline will last far beyond the momentary manipulation.
This exposure extends well beyond oil and gas to all natural resources worldwide – in 86′ the
problem was isolated. The previous five years had interest rates for Treasuries north of 9% –
in fact deep double digits by 85′ – so the cancer of debt issuance was more limited for that reason
plus Junk Bonds 82′ to 85′ were in their market infancy and so were the Commercial Banks acceptance
since the Investment Banks were unrelated entities.
This debacle will prove the integrity of the principles of Glass Steagall between Commercial
and Investment Banking are absolutely necessary as the separation of Church and State.
Supposedly smart insiders like banks also caught the falling safe of the subprime market by
buying mortgage servicers in the supposed bottom of January 2007.
Everything in the FT piece is true, and it's a useful read. But there's a problem with the
timing. This thing is likely to go into the books alongside the famous Business Week cover story
on "The Death of Equities".
Two things about oil: First, the glut is not as big as you think. IMO games are being played
– in effect painting the tape with big imports that show up in US storage (where the reporting
is most transparent) and are hyped by players with agendas. More important, there are 10 – 15
people in the world who can collectively decide – within broad limits – where oil should trade.
They can't put it back at $100 – not right away, not this year – but they can pop it $20 from
here with no trouble at all. That will happen soon, because they need it to.
If you're feeling lucky you can rummage through that pile of junk debt, and find yourself an
issuer that might not go bankrupt. Then buy the bonds – not the stock.
If a man lives by drilling from bed to bed on borrowed cash, it's not likely to end well. A
real man knows when the holes runs dry to him and the cash is gone it's time to hit the road -
because the bed don't work no more.
If you're a man who lent money to a man who's hole's ran dry and has nowhere to drill, and
not even a bed, then it's time for you to look in the mirror and see the way a real man sees.
The way a cowboy looks at the blue sky, out from under the shade of his hat, and thinks about
God.
it means there'll be a lot of holes open to drills that still have cash to spend. If your drill
is tired, you can upgrade to a huge new drill and a truck for next to nothing and drive around
hoping to get lucky. But if you do, make sure it's a hole you want to live with, because it might
dry up on you and your drill may lose its juice. When it does, you won't want to hit the road
anymore. That's a game for a man with a drill that's just getting going.
At the very least, it means many people with high-paying jobs going on unemployment, a lot
of areas whose real estate prices rose seeing them fall, and a lot of loans not being made as
credit dries up as banks try to meet their reserve obligations as they write off the loses. At
worst, it means another round of bank bail-outs and even greater political anger and strife here
in the home of fracking, the good old US of A.
"... Millions needed to clean up sites and mitigate environmental risk ..."
"... Alberta's Orphan Well Association is now responsible for 704 wells, up from 164 last year, according to Pat Payne, the association's manager. ..."
"... We started drilling over 130 years ago and we have been decommissioning the wells for a number of years, but we're getting to a point where the number of wells being drilled are less than the number of wells that need to be decommissioned ..."
"... Right now there … isn't enough cash flow in the system to do all the wells that need to be done. ..."
Petroleum Services Association of Canada wants $500M in federal money to decommission inactive
wells
By Canadian Press, Erika Stark, CBC News Posted: Mar 15, 2016 12:08 PM MT
"We started drilling over 130 years ago and we have been decommissioning the wells for a
number of years, but we're getting to a point where the number of wells being drilled are less
than the number of wells that need to be decommissioned," he said.
Salkeld stressed that PSAC's proposal isn't a bailout.
"We're in no way saying that oil companies aren't responsible," he said. "They are and they
fully accept that. The regulations have increased and the costs have increased. Right now there
… isn't enough cash flow in the system to do all the wells that need to be done."
A wave of projects approved at the start of the decade, when oil traded near $100 a barrel, has
bolstered output for many producers, keeping cash flowing even as prices plummeted. Now, that production
boon is fading. In 2016, for the first time in years, drillers will add less oil from new fields
than they lose to natural decline in old ones.
About 3 million barrels a day will come from new projects this year, compared with 3.3 million
lost from established fields, according to Oslo-based Rystad Energy AS. By 2017, the decline will
outstrip new output by 1.2 million barrels as investment cuts made during the oil rout start to take
effect. That trend is expected to worsen.
"There will be some effect in 2018 and a very strong effect in 2020," said Per Magnus Nysveen,
Rystad's head of analysis, adding that the market will re-balance this year. "Global demand and supply
will balance very quickly because we're seeing extended decline from producing fields."
A lot of the new production is from deepwater fields that oil majors chose not to abandon after
making initial investments, Nysveen said in a phone interview.
... ... ...
Companies cut capital expenditure on oil and gas fields by 24 percent last year and will reduce
that by another 17 percent in 2016, according to the International Energy Agency. That's the first
time since 1986 that spending will fall in two consecutive years, the agency said Feb. 22.
"... According to Art Berman, during the 5 year period (2008-2012), Chesapeake, Southwestern, EOG, and Devon spent over 50 billion dollars more than they took in. Such a great profitability. ..."
The question that needs answering is what was the effect of cheap funding?
The LTO oil boom was the result of companies making a nice return at $100+ oil. At that price
range production increased at a rate of one million barrels a day for three years.
If the cost of funding was say 3 to 5% higher what would have been the results?
Companies would still be making money, and they would also be borrowing, but the amount borrowed
would have been lower.
At a lower amount of borrowing, production growth would not have been one million per year.
One estimate that growth would have been around 750 kbd.
So after three years, U.S. Production would have been 750 kbd lower than it was.
At that growth rate world production would have stayed in balance, prices would have stayed
in the $100 range, and the Saudis would not have ramped up production by 1 to 1.5 million a day.
So IMO the net effect of cheap money was to grow production more than the market could use
and then crash prices.
In either case, with or without cheap money, the LTO boom would still have happened.
I believe that $100 plus oil prices was the real fuel that fed the growth in LTO production.
At that price a very good ROR was made and fund were provided.
It was simply the situation in which Wall Street needed a place to dump money provided by Fed
and shale came quite handy.
According to Art Berman, during the 5 year period (2008-2012), Chesapeake, Southwestern, EOG,
and Devon spent over 50 billion dollars more than they took in. Such a great profitability.
Most of the companies you talked about are Nat gas production companies. We are talking about
LTO.
But Art only talked about what was spent. If you look at LTO what was gotten was in increase
in production of about 4 million barrels a day of production. That is a rate of 1,460, 000,000
barrels a year.
That generates sales at $100 oil of $146,000,000,000 per year.
Art Berman talked about what these companies have spent (capex) and what they got (operating cashflow).
During the whole period of the shale boom, shale companies' capex significantly exceeded their
operating cashflows.
That doesn't mean that all that cash was "burned". Operating cashflow is what they get from today's
sales. Capex is what is spent on tomorrow's production. Given that until recently production volumes
were rapidly increasing, that partly justified cash overspending.
"... Don't waste your time calculating something that is so fuzzy as breakeven price. Price of oil went up 55% in month and half? So demand went up that much? In middle of winter? :-) In the middle of "glut" and oil storages bursting from that overflow of oil? :-) Just like that with a snap of finger. ..."
"... There is a huge difference between daily price curve and average quarterly price curve. Using average price for a longer period instead of daily price helps to smooth abrupt price movements and allow models like presented above to look more reasonable. Think about price curve as the result of juxtaposing of several sinusoid waves with different periods like in Fourier transform. Using average for a longer period essentially filters waves with a short period. ..."
Daniel, Don't waste your time calculating something that is so fuzzy as breakeven price.
Price of oil went up 55% in month and half? So demand went up that much? In middle of winter?
:-) In the
middle of "glut" and oil storages bursting from that overflow of oil? :-) Just like that with
a snap of finger.
There is a huge difference between daily price curve and average quarterly price curve. Using
average price for a longer period instead of daily price helps to smooth abrupt price movements
and allow models like presented above to look more reasonable. Think about price curve as the
result of juxtaposing of several sinusoid waves with different periods like in Fourier transform.
Using average for a longer period essentially filters waves with a short period.
There was pretty long exchange between me and Alex on this subject some time ago that covered
those issues.
"... One question. If we assume the return to recession in the second half 2017, will it necessary cause another collapse in oil prices; or may be downturn in oil prices will be more muted ? ..."
"... I think difficult days are coming for US shale/LTO players and even temporary return to above $100 price range might not restore previous financing bonanza for them - with enough financial thrust you can make pigs fly, but you better do not stand in the place where they are going to land. ..."
@ Dennis,
I was out in the woods last weekend, so I didn't have the opportunity to respond to your questions
in last Ronpost.
Dennis: "if you think that LTO output of 4.5 Mb/d can go to zero and OPEC, Canada, and Russia
can make up that difference, I believe you are incorrect."
I believe LTO output of 4.5 Mb/d will go to (nearly) zero rather soon (5 or 6 years, so 2021 or
2022), but I do not believe OPEC, Canada and Russia can make up that difference.
"Is that your assumption? Do you believe OPEC will fill that 4.5 Mb/d gap"
No. My assumption is that gap will not be filled. My assumption is the world will encounter Peak
Oil very soon (if not yet).
"What are your assumptions about the future price of oil?"
That's a tough one. Despite the model provided above by Ian Schindler. Let me take a wild guess:
WTI in the $70-$80 range by december 2016. $110 by mid 2017 followed by another collapse of the
price, due to real problems in China or India.
"Do you think the Brent oil price will be $35/b in Dec 2016 (STEO forecast)?"
See above: Brent versus WTI will vary within a 15% margin from eachother – mayby Brent being the
cheaper one during 2016. (If you ask why?: This is just gut feeling.)
Thank you for your input. Very interesting considerations, that actually correlate with my
own thoughts on the subject. Especially possible return to recession in the second half of 2017
. I also feel that Brent might be very close to WTI from now on. Lifting export ban eliminated
premium. Unless "artificial WTI" shipments spoil the broth.
One question. If we assume the return to recession in the second half 2017, will it necessary
cause another collapse in oil prices; or may be downturn in oil prices will be more muted ?
One feature of the return to recession is the collapse of junk bond market, which makes financing
of both shale and oil sands more difficult. And it typically happens before the actual economic
downturn. That will make ramping up shale oil production in 2017 extremely challenging. High oil
prices will be only of limited help, as there is no return to "good old days" of Ponzi financing
of shale.
Even speculative financing (revolving credit, aka evergreen loans) is already under threat
and will remain in this condition for the foreseeable future.
So shale players might have no money to re-start "carpet drilling" again.
I think difficult days are coming for US shale/LTO players and even temporary return to
above $100 price range might not restore previous financing bonanza for them - with enough financial
thrust you can make pigs fly, but you better do not stand in the place where they are going to
land.
Of course they may be propped by the next administration for strategic reasons. Who knows…
I believe that $100 plus oil prices was the real fuel that fed the growth
in LTO production. At that price a very good ROR was made and fund were
provided.
It was simply the situation in which Wall Street needed
a place to dump money provided by Fed and shale came quite handy.
According to Art Berman, during the 5 year period (2008-2012), Chesapeake,
Southwestern, EOG, and Devon spent over 50 billion dollars more than they
took in. Such a great profitability.
"... You also may be interested in the discussion (in the comment section) I had yesterday with Michael Filloon (a writer on Seeking Alpha), in which also a few calculations were presented: http://seekingalpha.com/article/3959718-bakken-update-continental-resources-top-bakken-player-2016 ..."
"... There are outlier wells that work, but Enno's shale profile.com site is an excellent resource which shows that really no company can make these wells work at prices under $50 WTI, and really that $80+ is needed to have a good business. Remember when CLR cashed their hedges, they said they saw prices returning to $80-$90 soon. They did not. CLR and all others have cut to the bone on costs, but it is impossible to cut enough to overcome a 60-70% loss of gross revenue. ..."
"... I encourage all to visit Enno's site. It exposes the 900K EUR fallacy very well. Of course, the 900K is routinely half or more BOE gas, which has been selling below $12 per BOE for months. ..."
"... There is a producer who posts on Oilpro.com named Jackie, whose posts I really enjoy. He keeps it simple, and I agree with him. If there is less money coming in the bank account than going out, you are losing money. No amount of slick investor presentations can refute that. ..."
A lot is written at the moment about shale break even prices of 24 to 40
usd. Every time i try to calculate those numbers, even when using best wells
as per shaleprofile.com i cannot get even close to those numbers. Does somebody
have the basics behind the above break-evens?
Enno and Daniel. The simple, undiscounted 60 month payout calculation has
not been refuted, with really even no attempt to, since I first used it
in early 2015 on LTO.
The only real criticism that has been valid has been from Mike, and a
few other oil producers, who say 60 months is too long. Mike is probably
right, but I am trying to give the companies the benefit of the doubt.
There are outlier wells that work, but Enno's shale profile.com site
is an excellent resource which shows that really no company can make these
wells work at prices under $50 WTI, and really that $80+ is needed to have
a good business. Remember when CLR cashed their hedges, they said they saw
prices returning to $80-$90 soon. They did not. CLR and all others have
cut to the bone on costs, but it is impossible to cut enough to overcome
a 60-70% loss of gross revenue.
I have posted this model on seeking alpha several times. No successful
attacks of my fifth grade math that I am aware of.
Enno, I think you made a good point with me awhile ago that the audience
needs it dumbed down. Given few can understand the 60 month payout, let
alone discounting future net cash flows, I wholeheartedly agree.
I encourage all to visit Enno's site. It exposes the 900K EUR fallacy
very well. Of course, the 900K is routinely half or more BOE gas, which
has been selling below $12 per BOE for months.
There is a producer who posts on Oilpro.com named Jackie, whose posts
I really enjoy. He keeps it simple, and I agree with him. If there is less
money coming in the bank account than going out, you are losing money. No
amount of slick investor presentations can refute that.
One month ago, as we pounded the table on the biggest threat to the fundamental case for oil,
namely that even a modest rebound in oil prices could unleash another round of production by the
"marginal", US shale oil producers, we warned that a rebound in the price of oil as modest as $40
per barrel, could be sufficient to get drillers to resume production.
As
noted in late February , among the companies prepared to flip the on switch at a moment's notice
are Continental Resources led by billionaire wildcatter Harold Hamm, which said it is prepared to
increase capital spending if U.S. crude reaches the low- to mid-$40s range, allowing it to boost
2017 production by more than 10 percent, chief financial official John Hart said last week. Then
there is rival Whiting Petroleum which may have stopped fracking new wells, but added it would "consider
completing some of these wells" if oil reached $40 to $45 a barrel, Chairman and CEO Jim Volker told
analysts. Then there was EOG Chairman Bill Thomas who did not say what price would spur EOG to boost
output this year, but said it had a "premium inventory" of 3,200 well locations that can yield returns
of 30 percent or more with oil at $40, and so on, and so on.
The reason for the plunging breakeven price? The same one we suggested on February 3: surging,
rapid efficiency improvement which "have turned U.S. shale, initially seen by rivals as a marginal,
high cost sector, into a major player - and a thorn in the side of big OPEC producers."
To be sure, while many had expected low oil prices to curb output, virtually nobody had predicted
that even a modest jump in oil (when we wrote our article on February 29 oil was at $33, just $7
from the $40 threshold) would lead to a major portion of US shale going back on line. The threat
of a shale rebound is "putting a cap on oil prices," said John Kilduff, partner at Again Capital
LLC. "If there's some bullish outlook for demand or the economy, they will try to get ahead of the
curve and increase production even sooner."
However, the cap was not big enough, because late last week driven by the relentless short squeeze
and the sliding dollar, WTI soared well over $40 hitting a fresh 2016 high.
And, as warned, with oil surging above the critical $40 new "floor" price, as
Reuters
put it moments ago , " a dreaded scenario for U.S. oil bulls might just be becoming a
reality."
What exactly is this scenario?
According to Reuters, some U.S. shale oil producers, including Oasis Petroleum and Pioneer
Natural Resources Co, are activating drilled but uncompleted wells (DUCs) in a reversal in strategy
that threatens to bring more crude to a saturated market and dampen any sustained rebound in prices.
When oil prices started their long slide in mid-2014, many producers kept drilling wells, but
halted expensive fracking work that brings them online, waiting for prices to bounce back.
But now, with crude futures hovering near multi-year lows and many doubting recent modest gains
that brought oil prices near $40 a barrel can hold, the backlog of DUCs is already shrinking in some
areas. In key shale areas such as Eagle Ford or Wolfcamp and Bone Spring in Texas such backlog has
fallen by as much as a third over the past six months, according to data compiled by Alex Beeker,
a researcher at Wood Mackenzie.
"If the number of DUCs brought online is surprising to the upside, that means U.S. production
won't decline as quickly as people expect," said Michael Wittner, global head of oil research
at Societe Generale. " More output is bearish."
In the Wolfcamp, Bone Spring and Eagle Ford, the combined backlog of excessive wells remains around
600, Beeker estimates. About 660 wells could be the equivalent of between 100,000 and 300,000 barrels
per day of potential new supply, according to Ed Longanecker, president of Texas Independent Producers
and Royalty Owners Association (TIPRO)
And with its usual 2-4 month delay, the market is finally starting to realize just this.
As expected, Reuters writes that for now, most of the wells are activated in Texas, where proximity
to refiners allows producers to sell their crude closer to benchmark prices, and by well-hedged companies
that have locked in higher prices.
Still, the pace of fracking of the uncompleted wells may quicken if cash-strapped producers
facing debt repayments can no longer afford to store their oil in the ground.
While the potential additional supply is a fraction of total U.S. production of around 9 million
bpd, the fresh flow would reinforce concerns about a growing global glut just as Iran ramps up
output and inventories in domestic storage tanks from the Gulf to Cushing, Oklahoma, test new
highs on a weekly basis.
But back to the DUCs, which are a new development for many of the algos which have been trading
oil on nothing but momentum:
Wood Mackenzie reckons that the backlog of excess DUCs will decline over the next two years,
and return to normal levels by the end of 2017. It is expected to fall 35 percent from current
levels in the Bakken and 85 percent in the Eagle Ford by the end of 2016. With service costs down,
now is a good time to bring a well online if a company has hedged its production and covered its
costs, said Jonathan Garrett, an analyst with Wood Mackenzie. The U.S. crude breakeven for such
wells is one-third lower than for new ones, according to Wood Mackenzie.
Typically, average DUC inventory is around 550 in the Wolfcamp/Bone Spring formations and around
300 in the Eagle Ford, Beeker estimates. Rival Oasis is also focusing on drawing down its backlog
this year, executives said during the company's last earnings call.
In each of those formations, the excess has fallen by about 150-175 over the past six months,
bringing the surplus to around 300 wells in each. " We're just going to be continuously
completing the wells there (in the Permian) with our fleets and so you will not see any DUCs in
Midland basin," Pioneer Chief Operating Officer, Tim Dove, told a recent earnings conference.
And then the story verges off to something else we have warned about, namely soaring hedging as
oil has rebounded, allowing producers to lock in profits even in case oil should once again resume
sliding from this price. Both Pioneer and rival Oasis have locked in future sales at prices well
above current levels. Oasis has 70 percent of its oil production for 2016 hedged above $50 a barrel
and roughly 20 percent of its 2017 production hedged at about $47 a barrel. Similarly, Pioneer has
locked in a minimum price for 85 percent of this year's production.
To be sure, not everyone will be able to ramp up production: in North Dakota, the second-largest
oil-producing state where producers like Whiting Petroleum Corp sell their oil at steep discounts,
it might not be economic Reuters calculates. There, the number of DUCs climbed above 1,000 in September
before falling to 945 in December, according to the latest data from the state's energy regulator.
Bakken producer Continental Resources Inc which made waves when it unwound its hedges in late
2014, has said it would continue to defer completions until prices rise. Bakken discounts were
just too steep, said Garrison Allen, a research associate at Raymond James. "It doesn't make sense
to do anything up there."
But not everyone is needed to ramp up production: even if shale output rises by just a few hundred
thousand barrels in the short term, that will be enough to push the US storage situation, already
at critical point, into beyond operation capacity levels, and lead to dumping of oil in the open
market, resulting in the next major leg lower in oil prices, which in turn will spillover into energy
stocks and the broader market, and force central banks to consider what until recently was merely
a joke, namely monetizing crude in the open market. After all, at this point when central banks have
lost all credibility, why not?
Rapid swings in supply/demand and prices is actually one of the predictions of what would happen
when we hit peak (or long plateau if you prefer). World peak oil was expected somewhere between
2008 and 2020 by the majority of estimates. Remember, peak oil isn't about running out of crude
. It's about falling extraction rates in the face of higher costs to extract. Tar sands and shale,
for example, is very expensive oil as evidenced by the drop off of the industry in Canada and
North Dakota when prices fell below $50 . Once the easy oil peaks, and capital no longer is able
to respond to the rapid feast and famine , THEN you'll start to notice the reality that was always
there with peak oil.... $5 gas, gas lines, etc. It will be the Jimmy Carter days all over again.
If amount of the energy needed to extract and process a unit of gas/oil is greater or equal
to the amount of energy from a unit of gas/oil, then oil/gas stays in the ground irresspective
of the volume.
REUTERS is the establishment propaganda mouthpiece. production may be increasing, but i DOUBT
its gonna hurt the price. they just want you to think that.
"... The key factor here is that the amount of oil to replace natural depletion of existing wells that can be extracted at prices below $70 is low to compensate natural depletion. For example, despite all this buzz about rising efficiency of shale production, the US shale does not belong to this category. ..."
"... Low oil price regime started to show crack already in early 2016, when agreement to freeze production was first discussed. Essentially in plain English that is a message to oil importing countries "f*ck yourself". ..."
"... The next step will be agreement to limit production based on natural decline rates and low capex environment. The huge, paranoid level of fear of such an agreement is clearly visible now in MSM. And of course the US state department along with EU will do the best to crash such a possibility. ..."
"... In other words this shale/Saudi induced price crash just speeded up the day of reckoning by several years and will make the next spike of oil prices much closer and much higher. ..."
"... How long the oil prices can be suppressed by the threat of resumption of shale production remain to be seen, but if there will be a bounce in shale production at below $80 prices it will be a "dead cat bounce" and will not last long as if prices drop again all those guys who tried to anticipate higher price environment and started "carpet bombing", sorry, drilling, again will be swimming naked again. Shale is a Red Queen race in any case. That means that shale will add to amplitude of the oscillations of the oil prices and might somewhat prolong the agony, but can't prevent oil price rise to above $80 level. ..."
All I am sure that none of us know what will happen.
What do you mean? Here most posters are adherents of the peak oil hypothesis. If so, this is
a nonsense statement.
Bets when oil will , say, above $80 belong to the casino, but if trend is predicted right then
it is clear that the prices should rise at least to the max level they reached before (above $100)
within some reasonable period (say before magic 2020). And to above $70 within much shorter time
period. Probably with some crazy spikes in both directions in between. When Wall Street speculators
see profits around 25% a quarter they are ready to kill own mother.
The key factor here is that the amount of oil to replace natural depletion of existing
wells that can be extracted at prices below $70 is low to compensate natural depletion. For example,
despite all this buzz about rising efficiency of shale production, the US shale does not belong
to this category.
It will be more difficult to induce the second oscillation of oil prices by repeating the same
trick again with forcing debt burdened producers to produce at a loss. When oil producers were
caught naked in 2014 with a lot debt to service they have no choice but to continue production.
That was an interesting neoliberalism induced wealth redistribution play in which oil producing
countries started to subsidize oil importing countries (aka G7) to the tune of 0.5 trillion a
year. They did it instead of working together on conservation and keeping oil price at reasonable
level they destabilized the system using Saudi in a bait and switch fashion. It might be an Obama
attempt to bring Russia to knees, attempt to save economy from secular stagnation or sling to
new recession, whatever. What is done, is done. But this racket can't run forever. And what can't
run forever will eventually stops.
Low oil price regime started to show crack already in early 2016, when agreement to freeze
production was first discussed. Essentially in plain English that is a message to oil importing
countries "f*ck yourself".
The next step will be agreement to limit production based on natural decline rates and
low capex environment. The huge, paranoid level of fear of such an agreement is clearly visible
now in MSM. And of course the US state department along with EU will do the best to crash such
a possibility.
But if such an agreement materialize despite all efforts to block it, it will have effect of
the A-bomb on Wall street speculators and the second nail into "oil price forever" myth coffin.
The same speculators who drove the oil price down from this point will drive it up like there
is tomorrow. And as GS trading desk change their bets, those despicable presstitutes from Bloomberg
instantly will change tone and start crying loud about coming oil crisis. Financial oligarchy
has no allegiance to any country, only to their own bank accounts.
In other words this shale/Saudi induced price crash just speeded up the day of reckoning
by several years and will make the next spike of oil prices much closer and much higher.
How long the oil prices can be suppressed by the threat of resumption of shale production
remain to be seen, but if there will be a bounce in shale production at below $80 prices it will
be a "dead cat bounce" and will not last long as if prices drop again all those guys who tried
to anticipate higher price environment and started "carpet bombing", sorry, drilling, again will
be swimming naked again. Shale is a Red Queen race in any case. That means that shale will add
to amplitude of the oscillations of the oil prices and might somewhat prolong the agony, but can't
prevent oil price rise to above $80 level.
"... Crude Mystery: Where Did 800,000 Barrels of Oil Go? Last year, there were 800,000 barrels of oil a day unaccounted for by the International Energy Agency, the energy monitor that puts together data on crude supply and demand. Where these barrels ended up, or if they even existed, is key to an oil market that remains under pressure from the glut in crude. ..."
"... "The most likely explanation for the majority of the missing barrels is simply that they do not exist," said Paul Horsnell, an oil analyst at Standard Chartered. ..."
Crude Mystery: Where Did 800,000 Barrels of Oil Go?
Last year, there were 800,000 barrels of oil a day unaccounted for by the International Energy
Agency, the energy monitor that puts together data on crude supply and demand. Where these barrels
ended up, or if they even existed, is key to an oil market that remains under pressure from the
glut in crude.
Some analysts say the barrels may be in China. Others believe the barrels were created by flawed
accounting and they don't actually exist. If they don't exist, then the oversupply that has driven
crude prices to decade lows could be much smaller than estimated and prices could rebound faster.
Whatever the answer, the discrepancy underscores how oil prices flip around based on data that
investors are often unsure of.
… "The most likely explanation for the majority of the missing barrels is simply that they do not
exist," said Paul Horsnell, an oil analyst at Standard Chartered.
"... It looks more like the chaos of a failed state rather than a popular uprising to remove an authoritarian government. The implication of this difference is that a return of Libyan oil production to prior levels is highly unlikely until there is a massive stabilization achieved, and I wouldn't be holding my breathe for that. ..."
"... The people are hungry and without hope as long as conditions remain the way they are so they riot to try to change them. It is, very likely, just the first stages of world collapse. ..."
"... Arab spring is a variant of a "color revolution". From Google search of the term: ..."
Minor quibble Dennis.
You commented- "Libya is struggling with their own Arab Spring"
I think that characterization of what is going there on is off base.
It looks more like the chaos of a failed state rather than a popular uprising to remove an authoritarian
government.
The implication of this difference is that a return of Libyan oil production to prior levels is
highly unlikely until there is a massive stabilization achieved, and I wouldn't be holding my
breathe for that.
It's Ron, not Dennis. It all depends on your definition of "Arab Spring" And I see you have provided
your own definition, "a popular uprising to remove an authoritarian government."
The Arab Spring was a series of anti-government protests, uprisings and armed rebellions
that spread across the Middle East in early 2011. But their purpose, relative success and outcome
remain hotly disputed in Arab countries, among foreign observers, and between world powers looking
to cash in on the changing map of the Middle East….
But the events in the Middle East went in a less straightforward direction.
Egypt, Tunisia and Yemen entered an uncertain transition period, Syria and Libya were
drawn into a civil conflict, while the wealthy monarchies in the Persian Gulf remained largely
unshaken by the events. The use of the term the "Arab Spring" has since been criticized for
being inaccurate and simplistic.
The Arabs themselves cannot agree on the definition of "Arab Spring". It is basically just
an uprising of the general population protesting the hardships of their lives. I would say that
the Arab Spring, in any country, is just the first stages of a failed state. I think there is no doubt that what is happening in Libya was caused by the same conditions
that has caused similar uprisings throughout the Arab world. The people are hungry and without
hope as long as conditions remain the way they are so they riot to try to change them. It is, very likely, just the first stages of world collapse.
The dream of transition to a 'consuming' economy just crashed into
the wall of excess debt and leverage. 2016 has started with a
44% collapse in China passenger car sales
. This is
the
biggest sequential crash and is 50% larger than any
other plunge in history.
Coming at a time when vehicle
inventories are near record highs relative to sales, the world's
automakers - all toeing the narrative line that growth will be from
China - now face a harsh reality of massie mal-investment deja vu.
"... I have read all about the sweet spot and certainly understood the concepts, but maybe I put a little too much belief in the corporate presentations. It is had to find a good balance, with so much information at hand, but it is also hard to come to any other conclusion with EOG, that their sweet spots are just not so sweet these days! ..."
"... Look at Whiting. Another early entrant. 2008, 2009 and 2010 far superior to all years thereafter. Look at these two in Niobrara also. ..."
"... I love Whiting Niobrara, 2015 well productivity. So much for all the "productivity" improvements. lol These graphs, really cut though the gloss put out by the companies. ..."
"... I also found the EOG results quite shocking. Do note though that their average well is still performing nicely compared with other operators. I get the strong impression that EOG is only interested in clearly profitable operations, and not the unprofitable/marginal stuff. EOG has also hardly drilled into the Three Forks formation, which is clearly (>15%) performing worse than the Middle Bakken, while other operators have shifted new wells to a great extent (up to 50%) to the Three Forks. The annual total number of new wells in the Middle Bakken formation already peaked in 2012. ..."
"... EOG was the first big operator to rapidly pull back from Bakken in 2014, and its production has halved by now since Sep 2014. ..."
"... Although we don't yet see a major deterioration of new wells in ND overall yet, there are several areas within the Bakken where this can be found – so far this effect gets compensated in other areas. It is also striking to me that despite a drop in completions of > 30% from 2014 to 2015, there has not been a marked improvement in well productivity which you would expect as operations shifted to better areas. ..."
"... If the meme of retreating to the sweet spots and bigger better completions was true, then we should be seeing an increase in well productivity during 2015. Certainly across some of the major companies, this is shown not to be true. This must bring doubt upon the validity of closer well spacings, that have been the flavour of the day, and allowed high intensity well pad drilling. ..."
Firstly, I love Enno's graphs. I know they have been up for a while, but today is the day I have
really had a chance to explore.
I got a shock when I looked at EOG well quality. 2013, was obviously a high water mark for
well quality. But it is the poor performance of 2014 and 2015, that caught my eye. I do know EOG
were one of the first to cut back drilling, and also made even deeper cuts in completions. I can
understand the severe cut backs, and EOG could afford them, but I don't understand any reason
why they would be selectively completing their poorer wells, especially when the drop in productivity
starts in 2014. It is not just the initial production that is down. The 2014/15 continue dropping,
with both about to fall below the 2010 line, which is the lowest water mark.
I have read all about the sweet spot and certainly understood the concepts, but maybe I put
a little too much belief in the corporate presentations. It is had to find a good balance, with
so much information at hand, but it is also hard to come to any other conclusion with EOG, that
their sweet spots are just not so sweet these days!
EOG were the first in, and maybe the first to show the longer term future, or lack of it?
I love Whiting Niobrara, 2015 well productivity. So much for all the "productivity" improvements.
lol These graphs, really cut though the gloss put out by the companies.
I also found the EOG results quite shocking. Do note though that their average well is still
performing nicely compared with other operators. I get the strong impression that EOG is only
interested in clearly profitable operations, and not the unprofitable/marginal stuff. EOG has
also hardly drilled into the Three Forks formation, which is clearly (>15%) performing worse than
the Middle Bakken, while other operators have shifted new wells to a great extent (up to 50%)
to the Three Forks. The annual total number of new wells in the Middle Bakken formation already
peaked in 2012.
EOG was the first big operator to rapidly pull back from Bakken in 2014, and its production
has halved by now since Sep 2014.
Although we don't yet see a major deterioration of new wells in ND overall yet, there are several
areas within the Bakken where this can be found – so far this effect gets compensated in other
areas. It is also striking to me that despite a drop in completions of > 30% from 2014 to 2015,
there has not been a marked improvement in well productivity which you would expect as operations
shifted to better areas.
If the meme of retreating to the sweet spots and bigger better completions was true, then we
should be seeing an increase in well productivity during 2015. Certainly across some of the major
companies, this is shown not to be true. This must bring doubt upon the validity of closer well
spacings, that have been the flavour of the day, and allowed high intensity well pad drilling.
That a company with the technical ability and cash of
Shell would find production from fracked shale had not "play(ed) out as
planned" should give pause to the investors and commentators who have become
believers in the shale miracle.
Mr
Voser commendably took responsibility in August for a
$2.1bn writedown on the value of the company's US shale assets – particularly
since I also misestimated the productivity of some US unconventional gas reserves,
although in a different direction.
I had thought, when the benchmark US Henry Hub gas price bottomed at the
beginning of last year,
that a decline in gas drilling forced by a shortage of exploration and production
sector cash flows would result in a very rapid rise in price to cover the full
cost of production.
Well, prices have risen, but not as fast as I imagined.
That is due to high production from two sources that increased at greater
rates than most industry people – and I – expected: "associated" gas, from oil
or gas-liquids directed drilling, and gas wells in the
Marcellus Shale .
The Marcellus is a huge "play" of sedimentary rock across much of the northeastern
US, with gas and liquids production concentrated in western Pennsylvania, Ohio
and West Virginia. There are also a lot of Marcellus reserves in New York state,
but there is effective political opposition to developing them.
Without new production from the Marcellus, US gas supplies would probably
have declined since President Obama hailed
the shale revolution in his January 2012 State of the Union address. From
a technical point of view, the strength of Marcellus production has been driven
by shallow depth and short lead times, along with the industry's rapid productivity
increases.
Even so, there are some reasonable questions that can be raised about the
Marcellus miracle, setting aside any tightening of federal, state or local
regulation of shale gas drilling .
To begin with, despite the extraordinary success of the exploration and production
effort, not a lot of money is being made. Consider
Cabot Oil and Gas , which has an excellent reputation for management, reserve
quality and technical ability, especially in the Marcellus region.
Last year, it chalked up a return on equity of about 9.5 per cent.
That is good; if it were a European bank, COG would be at the head of the
class, but it is not at the lighting-cigars-with-$100-bills end of capitalism.
As Mr Voser told the FT: "[Shale well] decline rates are very high, so after
18 months your production drops very sharply, which means you have a business
model of constant investment."
That is demanding enough for a highly diversified investment grade company
such as Shell; if your company is junk-rated, it is much harder.
Also, rising Henry Hub prices overstate how much Marcellus producers have
benefited from their hard work and good luck. Ryan Smith, an analyst at Bentek,
an energy research firm that recently published a report on the Marcellus and
Utica shale plays, points to the "basis", or discount, that Marcellus gas is
getting. "Producers are constrained by pipeline capacity, which is vital. When
[one of two new pipelines comes on line] in November, that will be filled up
within a month. Drilling is backlogged."
Beyond next year , though, there is a steep wall of capital demands for
new pipelines, reversals of existing pipelines, export terminals, nearby chemical
plants, and gas-fired power plants.
What really surprised the industry was the continuing supply of new capital
from lenders and return-short investors. This interrupted what would have been
a typical oil and gas drilling cutback phase.
In other words, yes, there is a big Marcellus effect, but it may turn out
to have been superhyped by quantitative easing. We will see what happens if
the oil price falls and interest rates ever rise.
John Kemp: Why shale skeptics are wrong: http://www.reuters.com/article/2013/10/17/shale-idUSL6N0I72FD20131017?feedType=RSS&feedName=everything&virtualBrandChannel=11563
The UK has over 2,000 years of shale gas. This is a proven fact. Shale
gas is incredibly cheap (the price of gas in the US has plummeted) and abundant.
We could add many percentage points to our growth if we embraced shale
gas 100%. Brush aside the useless hippies and enviro-wack-jobs and get drilling.
In an instant we would become 100% energy independent, household energy
bills - including electric - would plummet to about only 10% of what they
are now which would free up a tidal wave of money to be spent into the economy.
Also, about 500,000 new jobs would be created in the shale gas industry.
This is a no brainer! Frankly the naysayers should be arrested for treason.
Did anyone read Dr. Tim Morgan's piece from earlier this year saying
shale gas is the next big popular delusion? It was on FT Alphaville.
He says that the whole global growth story of the last century boiled
down to a "surplus energy equation": in the past, one unit of energy used
could extract fuel that created 100 units of energy. But now this ratio
is declining and will continue to do so.
If it now takes 20 people to extract X amount of fuel whereas in the
past it used to take 1, then that's 19 people who can't be deployed elsewhere
to do other useful stuff. And it costs more to extract energy, in line with
the thesis above.
A FT front page image from about 6 months ago seemed to support this
point. The FT published a "heat map" photo from space showing fracking sites
in the US. They were all aglow - much more so than other production sites
or towns and cities!
Please - Try accrual accounting and you get a different picture - unfunded
entitlements and lets not forget promises that pols will make to voters
at the expense of those yet to be born.
The depletion rate for a well has been given as 80% in two years The
well can be re-stimulated and will produce some more , any further efforts
bring decreasing yield .
an operating company must then drill one new well for each older than one
year old , this just to keep their flow rate .
there is good money but not a given, each well pan out differently
If it costs $5mm per well and you recover $10mm PV over the life of the
well, then it appears to be a good investment. Wash, rinse and repeat. If
you spent too much on the leases and your all in cost of each well is higher
than PV production values (Shell), then wind it up. One real issue for these
properties is their nature as a depleting asset, an asset the rarely gets
valued correctly in the markets. And one real offset for this risk is the
potential for stacked plays (layer upon layer of frackable gas under the
same piece of land) - for COG it's the Utica under the Marcellus, and for
Bakken, Permian and Niobrara players it's multiple stacked layers. Hence
the recent conclusion by analysts that the Permian basin is still one of
the largest oilfields in world with future production numbers that are expected
to massively surprise on the upside. FT, don't make us do your work.
Analysis seems a bit limited in its understanding of the drilling business
model - need to drill land to hold reserves requires lots of upfront expenses,
etc. As always, the FT seems to dig enough for our attention, but not enough
for conclusions worth the read.
Thank you for an article which mentions depletion - "decline rates" in
a serious way. The fact is that the only people who have made serious money
in this game were the people who speculated in "prime acreage" and sold
it on to the big boys like Shell and BHP.
Of course, the best acreage is that which is used early on so the idea
that the productivity will always increase is at variance with geological
reality. The document below shows that in the 12 months to July 2013, the
number of wells in the Bakken increased by 1,628 (36%) - and the oil produced
increased by 172,643 barrels per day (27%). So much for the much touted
"the industry's rapid productivity increases.". True, these figures are
for oil, but there is little reason to think they are dramatically different
for gas.
I think the Red Queen understood it well: "Now, here, you see, it takes
all the running you can do, to keep in the same place. If you want to get
somewhere else, you must run at least twice as fast as that!"
@Felix Drost: You are quite right when you say "Shale is only profitable
in a world where energy prices are high". What people tend to forget is
that the shale plays were known about decades ago, and the first fracking
of a well happened in the 1940's. Clearly we are only exploiting these expensive
resources because all the cheap resources have been exploited and are in
production decline. It's not as if they are a bonus for some great new technological
achievement!
truth serum | October 13 12:28am
thank you for your reply.
"you look into statistics on the time to drill wells, you'll see that in
each emerging play, the time taken to drill and complete wells decreases
over time. "
Those would be really interesting data.
I googled the expressions you suggested, namely Fayetteville Shale, Eagle
Ford and Barnett Shale, and there comes out a flood of references.
Would you please be more specific ? I would really appreciate.
Is there a website where those data are available beyond anectodical evidence
?
Shell paid far too much to get into the market, that's the main reason
why it has a substantial write off. It bought into shale during the heady
days when it seemed "There's gold in them thar hills." They took a large
risk. But right now they have expanded the expertise to explore shale and
are increasingly good at it.
Shale is only profitable in a world where energy prices are high, it
is simply too costly to exploit otherwise. That returns are around 10% and
will probably stabilize around there isn't odd, returns never would have
reached Saudi-levels, that was plain from the start. Neither do oil majors
earn much from easy to access resources, the host countries typically do.
10% ROI sounds pretty good in an industry that must continue risky investments
to exploit smaller and harder to access fields.
What's great about shale in the US is the huge investments required which
translate into jobs jobs jobs, powering a recovery in many states. The low
ROI and high costs ensures a more equitable spread of the proceeds in the
economy when compared to e.g. Saudi Arabia.
During the 5 year period (2008-2012), Chesapeake, Southwestern, EOG,
and Devon spent over 50 billion dollars more than they took in according
the Houston consulting geologist Art Berman. Rapidly declining very low
productivity "shale" gas wells are the culprit. The operators have to keep
drilling or their production drops like a rock! The smaller public companies
cannot allow this to happen or their stock tumbles and it is curtains for
the company. Shell's Voser explained what many oil & gas folks in the U.S.
determined two or three ago. The "shale players" over-estimated the productivity
and under-estimated cost by a factor of two or more. Add the low natural
gas prices and most shale plays will be gone in a few more years. Raise
natural gas prices to $8 or more and the fragile U.S. economy heads south
again.
Five other operators - EOG Resources, ConocoPhillips, Continental Resources,
Oasis, Pioneer. Hess, Apache are two others. Of course, not all of these
are PURE unconventional plays. Petrohawk was another one but they were acquired
by BHP. Don't have time to look up the stats right now. Look, if these plays
were unprofitable why would companies continue to pour resources into them?
I think it you look into statistics on the time to drill wells, you'll see
that in each emerging play, the time taken to drill and complete wells decreases
over time. Look to Fayetteville Shale, Eagle Ford and Barnett Shale for
evidence.
Would you turn to the CEO of Blackberry for an assessment of the profitability
of smartphones in 2013, and future market trends? I didn't think so. Ask
Ryan Lance (ConocoPhillips), Mark Papa (EOG) and Harold Hamm (Continental)
what they think of unconventionals' profitability.
The reason Shell lost money is hey did not appreciate gas was so abundant
and costs to produce it would fall so much. We have hundreds of years worth
of gas
Great Article.
@truth serum | October 12 2:17am
great remarks.
"Shell is unwilling or unable to learn from successful operators"
would you please list five of them ? it would be a very interesting counter
evidence. Especially if you manage to mention their ROE and their Free Cash
Flow.
If I have understood well what the article means, shale gas extraction is
in a profitable stage of its life cycle but, at the same time, in a negative
Free Cash Flow one, because competitors need to invest a lot to keep the
pace of a constant decrease of extraction costs coupling it with pre-emptive
strategies on prime acreage.
Those are the strategic business units which many years ago used to be called
"stars" in the Boston Consulting Group Matrix, see http://bit.ly/1g9n21U
moreover,
"cutting costs in manufacturing mode while ascending a steep learning curve"
do you mean that shale gas/oil costs are decreasing rapidly for those who
keep investing? a sort of "learning by doing" (and investing)?
again, do you have any evidence for that ?
My interest is purely academic. Shale gas extraction industry would be worth
setting up a case study and some research papers.
Just because Peter Voser's Shell cannot figure out a way to produce unconventional
gas and oil profitably, this does not mean that the industry as a whole
has not figured out a way to produce unconventional gas and oil profitably.
Alas, Shell is unwilling or unable to learn from successful operators. It's
all about 1) getting prime acreage early and 2) cutting costs in manufacturing
mode while ascending a steep learning curve to optimize well completions
and spacing. Ask Harold Hamm if he thinks the Bakken Shale is unprofitable.
My colleague Tim Morgan clearly highlighted shale's poor energy return on
energy invested, which is the root of the problem, in his publication
Dangerous Exponentials in June 2010.
Of course his warnings about this troublesome equation have been universally
ignored by the cheerleaders for the "US shale miracle", so I suppose to them
this disappointment is surprising.
T C Smith, Chief Executive, Tullett Prebon, Chief Executive, Fundsmith,
UK
"... There has been a long history of oil price model failures. I was wondering whether you could comment on how your model has overcome the weaknesses of earlier models. I have the impression that the oil price in the short, medium but also long term depends on many highly non-linear factors. That just makes it difficult for me to see how any model, even just theoretical, could make reasonable predictions. ..."
There has been a long history of oil price model failures. I was wondering whether you could
comment on how your model has overcome the weaknesses of earlier models. I have the impression
that the oil price in the short, medium but also long term depends on many highly non-linear factors.
That just makes it difficult for me to see how any model, even just theoretical, could make reasonable
predictions.
Suppose there was such a model, that had a little better predictive power than the market.
Wouldn't market participants then not rush in to make money using the model, which would again
destroy its predictive power?
The idea to use autocorrelation came from just eyeballing Figure 1. Low prices seemed to be
associated with constant rates of growth. If the rate of growth decreases or stops, the price
pops. I gave a bunch of variables to Aude (who is a statistician) and asked her to look for correlations.
She fiddled around with the data for some time trying different transformations. When she came
back with what worked I slapped myself and wondered why I hadn't told her to try that first.
As I said in the introduction, this work is preliminary and there is a lot we don't know. What
I believe is going on is that many variables normally associated with demand are hidden in past
extraction data. Exactly which variables are included and which excluded is to be determined.
I think that if traders started using this model to estimate prices the model would work better.
It would be a self fulfilling prophecy. The reason for this is that I think price speculation
is not included in the variables used, so if the speculators were closer to the "right" price,
there would be less variation.
If data were available it would be interesting to split the model by API density using the
average price for each tranche of density. The model explained past data much better with EIA
C & C data than it did with the BP data that included NGL (as Dennis thought it would).
If you have references to other price models, I am interested as well.
"... Since the EIA analysis is based on current production, changes in EURs and future areas of
derisked production are not included. For example the Permian, and Three Forks have zones that have
little production history and are not included. Also plays that are just opening up, like the Unita,
which has 1.2 trillion barrels of OOIP, is just now seeing horizontal wells with good results being
drilled in zones that has never see this type of drilling. ..."
"... With respect to LTO extraction, in my opinion the big revolution is that because of high initial
flow rates and short investment cycles, LTO extraction has introduced boom bust economics to oil extraction.
In terms of the price model LTO extraction could bring on a faster decline in oil extraction by scaring
investors away from longer cycle extraction projects such as deep water. ..."
"... The Saudis recognized that LTO production growth was a product of cheap and plentiful financing.
They set out to pop the bubble and they have. The bankruptcies are piling up. LTO economics are overstated.
The wells will not produce anything close to what the companies claim. LTO could come back if the banks
and debt investors are dumb enough to lend to the companies. My guess is that any debt financing will
have much higher costs and tighter covenants. Borrowing for 10 years unsecured at 4-5% probably won't
be coming back. ..."
One of the problems with using historical models to make predictions is that when disruptive technology
comes along this type of model may have errors that are hard to adjust for.
Many believe that Light Tight Oil (LTO, also known incorrectly as shale oil), is only a high
priced flash in the pan, that will quickly die. Over the past few years both of these assumptions
are proven to be quite wrong.
The EIA on Sept 24, 2015 came out with an updated report under "Analyisis & Projections" called
"World Shale Oil Assessments"
This analysis places the U.S. LTO resource potential at 78.2 billion barrels. A detailed breakdown
can be seen by clicking on "US" in the
table.
The U.S. analysis is a bottoms up analysis taking (1) the area of potential, (2) well spacing,
(3) EUR per well to determine what they call the "Technically Recoverable Resource " (TRR). When
doing a Peak Oil Analysis, these is what the ultimate recoverable is.
It should be noted that EURs can change quite a bit so for example for the Bakken they sub
divided it into 41 subregions.
The other piece of the disruptive technology is the cost of production. Over the last few years
this has come down much more than many believe. The lower costs can be seen in two ways.
The first place is in the EIAs monthly "Productivity Report" which shows that rig production
in barrels per day per month, for the last five years, in the Bakken has gone from 100 to 230,
and in the Eagle Ford it has gone from 100 to 300. This equates to a major reduction in costs.
The second way lower costs can be seen is what ROR the oil and gas companies are expecting.
For example EOG is estimating that their ATROR for five different plays is 30% at a WTI price
of $40. Just a few years ago the threshold price of LTO was throught to be $80 to $100.
Since the EIA analysis is based on current production, changes in EURs and future areas
of derisked production are not included. For example the Permian, and Three Forks have zones that
have little production history and are not included. Also plays that are just opening up, like
the Unita, which has 1.2 trillion barrels of OOIP, is just now seeing horizontal wells with good
results being drilled in zones that has never see this type of drilling.
The beautiful part of this model is that it does not take extraction cost into account. Whatever
the cost of extraction, based on what is extracted, this model gives you the price.
With respect to LTO extraction, in my opinion the big revolution is that because of high
initial flow rates and short investment cycles, LTO extraction has introduced boom bust economics
to oil extraction. In terms of the price model LTO extraction could bring on a faster decline
in oil extraction by scaring investors away from longer cycle extraction projects such as deep
water. Can LTO extraction replace all other types of extraction? If extraction levels decrease,
the model says the base price will decrease as well. This will accelerate the contraction phase.
I believe that what has happened in this cycle in the oil market is that an increase in U.S. production
from LTO of one million barrels a day for four years caused the S/D balance to shift to over supply.
The difference in this cycle, making it longer and deeper than expected is the Saudi change
in response.
From 1999 to 2013, each time there was a dip in price the Saudis cut their production by an
average of 1.5 million barrels a day. This happened five times.
In 2013 as prices started down they started to cut production, but then something changed.
As prices went lower instead of cutting production they increased it by over one million a day.
Was it to punish Iran or Russia. I don't think so. I believe it was to slow down the runaway
freight train of US LTO production. I believe that they understand the potential of this new resource
to change the oil market.
The Saudis recognized that LTO production growth was a product of cheap and plentiful financing.
They set out to pop the bubble and they have. The bankruptcies are piling up. LTO economics are
overstated. The wells will not produce anything close to what the companies claim. LTO could come
back if the banks and debt investors are dumb enough to lend to the companies. My guess is that
any debt financing will have much higher costs and tighter covenants. Borrowing for 10 years unsecured
at 4-5% probably won't be coming back.
"... Light tight oil is not your average crude oil. I suspect it is clogging up US inventories after the import substitution phase ended and after some modifications to US refineries were completed. This glut created the perception in markets that there is a global glut (and contributed to bring down oil prices) while it is not ..."
"... Where actually is that much-hyped global oil glut? http://crudeoilpeak.info/where-actually-is-that-much-hyped-global-oil-glut ..."
Light tight oil is not your average crude oil. I suspect it is clogging up US inventories after
the import substitution phase ended and after some modifications to US refineries were completed.
This glut created the perception in markets that there is a global glut (and contributed to bring
down oil prices) while it is not
In fact crude imports went up again in the last months. Anyway, shale production has peaked
now according to the latest drilling productivity report. The following 2014 report describes
the mismatch between shale oil production and US refinery capabilities (slides 7-9)
"... It is sometimes said the futures curve is not "forward-looking". If that means the curve is not a simple forecast and is not good at predicting what will happen to spot prices in future, the statement is correct. ..."
"... Given many market participants believe oil supplies will fall sharply, demand will increase, and stocks will peak and begin to fall later this year, the recent rise in prices and narrowing of the contango are entirely rational. Any other price response would be irrational because it would violate the requirement for inter-temporal consistency. The market could be wrong in its expectations for supply, demand, stocks and prices later in the year and in 2017, but it is being absolutely rational. ..."
"... If futures prices are above the spot price, the spread is negative and the market is said to be in contango. If futures prices are below the spot, the spread is positive and the market is trading in backwardation. ..."
"... In most cases, rising spot prices will be accompanied by a narrowing of the contango (or a move from contango into backwardation). Conversely, falling spot prices will normally be accompanied by a widening of the contango (or a move from backwardation into contango). This is exactly what is happening at the moment: the market's newfound bullishness is resulting both in a rise in the spot price of Brent and a narrowing in the contango. ..."
"... In most cases, higher prices have been associated with a narrower contango, or even backwardation, while lower prices have been associated with a wider contango ( tmsnrt.rs/22p6Fmy ). ..."
"... In the current environment, the oil market is looking past short-term oversupply towards the end of 2016 and 2017 when oversupply is expected to be much less, or there might even be excess demand. ..."
"... Via the storage and inventory financing relationships embedded in the futures curve, the expectation of a future tightening in the supply-demand balance later in 2016 and 2017 is pulling up the spot price of oil now. ..."
LONDON, March 17 The oil futures curve is flattening as a wave of bullishness washing across the
market raises the price of near-dated contracts faster than that of contracts for deferred delivery.
Brent for delivery in May 2016 has risen more than $10 per barrel since early February, while
prices for delivery in 2017 are up less than $7 over the same period.
The discount for Brent crude delivered in May 2016 compared with the average of 2017, a price
structure known as contango, has narrowed from $9 to well under $6 per barrel since Feb. 11 (
tmsnrt.rs/22p4vn8 ).
The shape of the futures curve is intimately connected with expectations about supply, demand,
stocks and the availability of storage ("Brent contango is hard to square with missing barrels",
Reuters, March 10). So the narrowing contango implies the market now expects less oversupply and
a smaller build-up in stocks in the months ahead. But market bullishness is at odds with warnings
from influential analysts forecasting supply will continue to outstrip demand and stocks rise ("Oil
shrugs off Goldman warning about premature rally", Reuters, March 14).
MAYBE WRONG, BUT RATIONAL
It is sometimes said the futures curve is not "forward-looking". If that means the curve is
not a simple forecast and is not good at predicting what will happen to spot prices in future, the
statement is correct.
But the futures market is actually very forward-looking and focused on how the balance between
supply, demand, stocks and prices will evolve in the coming months and years. Via the futures curve
and the mechanism of financing and storage, those expectations about medium-term supply, demand,
stocks and prices are ruthlessly discounted back to the present.
Given many market participants believe oil supplies will fall sharply, demand will increase,
and stocks will peak and begin to fall later this year, the recent rise in prices and narrowing of
the contango are entirely rational. Any other price response would be irrational because it would
violate the requirement for inter-temporal consistency. The market could be wrong in its expectations
for supply, demand, stocks and prices later in the year and in 2017, but it is being absolutely rational.
SPOT PRICES AND SPREADS
The price of oil for delivery on a future date (e.g. calendar average 2017) can be thought of
as the sum of a spot price (May 2016) and a spread (the price difference between May 2016 and the
calendar average of 2017).
As a matter of convention, the spread is normally expressed as the spot price minus the futures
price (it can just as easily be expressed the other way round).
If futures prices are above the spot price, the spread is negative and the market is said
to be in contango. If futures prices are below the spot, the spread is positive and the market is
trading in backwardation.
For example, if the future price is $50 and the spot price is $40, the future price can be analyzed
as a spot price of $40 plus a spread of $10 contango.
Many real trades are arranged this way, with the customer buying (selling) near-dated futures
contracts and then adjusting their position by selling (buying) the spread between the near date
and the forward one. The advantage of executing trades as two transactions (spot and spread) rather
than just one is that it enables dealers and customers to make best use of the greater liquidity
in spot contracts. In principle, spot prices and spreads are determined independently and can move
separately. In practice, there is normally a high degree of correlation between them.
In most cases, rising spot prices will be accompanied by a narrowing of the contango (or a
move from contango into backwardation). Conversely, falling spot prices will normally be accompanied
by a widening of the contango (or a move from backwardation into contango). This is exactly what
is happening at the moment: the market's newfound bullishness is resulting both in a rise in the
spot price of Brent and a narrowing in the contango.
PRICES MOVE TOGETHER
As the market becomes more bullish, the price of contracts for short-term delivery rises faster
than the price of contracts for later delivery. The result seems paradoxical since an improved outlook
for supply-demand balance over the next few months and years has its biggest impact on the price
of oil delivered now. In fact, this behaviour is typical for oil and other commodity markets.
Over the period from 1992 to 2016, taken as a whole, there is no correlation between the level
of oil prices and the degree of contango or backwardation in the futures curve (
tmsnrt.rs/22p42kQ ).
High spot prices have coincided with backwardation (January 2008) and contango (May 2008). Low
spot prices have coincided with contango (January 1999) and backwardation (April 1999).
But the large shifts in the absolute level of prices since 1992 obscure the short-term relationship
between spot prices and the shape of the futures curve. A more granular analysis reveals there has
been a fairly close correspondence between spot prices and the shape of the futures curve for most
sub-periods since 1992.
In most cases, higher prices have been associated with a narrower contango, or even backwardation,
while lower prices have been associated with a wider contango (
tmsnrt.rs/22p6Fmy ). This relationship
has held in almost all sub-periods since 1992 with the exception of 2005/06 and the first half of
2008 ( tmsnrt.rs/22p49wG ).
The relationship grows even stronger if we compare the change in prices with the change in the
shape of the curve.
That makes sense since an increase in spot prices is associated with a narrowing of the contango,
and a fall in spot prices is associated with a widening of the contango; both respond to the expected
supply-demand balance.
LOOKING BEYOND THE GLUT
Since 1992, changes in the outlook for oil production, consumption and stocks have had the biggest
impact on futures contracts near to delivery rather than those with longer maturities.
As a result, spot prices have been much more volatile than the price of futures contracts with
many months or years to delivery. In the current environment, the oil market is looking past
short-term oversupply towards the end of 2016 and 2017 when oversupply is expected to be much less,
or there might even be excess demand.
Via the storage and inventory financing relationships embedded in the futures curve, the expectation
of a future tightening in the supply-demand balance later in 2016 and 2017 is pulling up the spot
price of oil now.
The market might be wrong to expect the supply-demand balance to tighten by the end of 2016 or
early 2017. The short-term increase in oil prices could also be self-defeating if it stimulates more
production and thereby perpetuates the oversupply ("New oil order: the good, the bad and the ugly",
Goldman Sachs, March 11). But if the market is right to expect the supply-demand balance will tighten
later in the year or in 2017, then spot prices have to rise now and the contango must narrow. Any
other outcome would be time-inconsistent. (Editing by Dale Hudson)
The 21st century version of the American gold rush is coming to a swift end.
A shakeout is sweeping through the U.S. oil and gas business, putting small-time petroleum
prospectors who got rich off of shale energy out of business as rock-bottom oil prices reshape
the sector despite the commodity's slight uptick in recent weeks.
The pain low oil prices have sparked has spread into other corners of the energy industry. This
week, coal miner Peabody Energy warned that it may have to file for bankruptcy protection and
SunEdison, a developer, installer and operator of alternative energy plants said it discovered
problems in its accounting processes, the latest in a string of troubles for the company.
"... Iran's condensate production is increasing along with production of natural gas. Gains followed completion a few months ago of several development phases at giant offshore South Pars field, including phases 12, 15-16, and 17-18, which added 120,000 b/d of condensate ready for export. Most of the condensate is being stored at sea, occupying two thirds of Iran's current floating capacity and awaiting a buyer. Iran's condensate production is expected rise even further in 2016. ..."
"... It is thus conceivable that Iran can raise its crude oil production about 500,000-700,000 b/d within 3 months, and up to 800,000 b/d within 6 months. ..."
"... Most of Iran's competitors supplying similar crude oil to the same markets, mainly Saudi Arabia and Kuwait, have secured their sales by signing term agreement with customers. These commitments are usually for at least 1 year. ..."
"... Since Iran lacks a huge capacity to store unsold oil, it could increase crude oil production only slowly and cautiously. ..."
"... The outlook for Iranian condensate is different. High in sulfur, Iran's condensate is considered a light crude and is traded at prices higher than those of its heavy oil. Iran has fewer competitors for condensate-for which demand, particularly in Asia, is high-than for oil. ..."
"... Condensate flow will increase with gas production, particularly from South Pars field, an extension of Qatar's supergiant North field. The field has been Zangeneh's highest priority for development. ..."
Iran's mature oil fields are in advanced stages of decline. The US Energy
Information Administration estimates that Iranian oil fields have natural
decline rates of 8-11% and recovery rates of 20-25%.
Iran had planned to employ water and gas injection for enhanced oil recovery.
Gas injection in mature field was to have reached 330 million cu m/day by
the end of 2016. Since 2011, however, Iran hasn't been able to reach more
than 60% of its gas-injection goals. The average of actual gas injected
between March 2006 and March 2011 never increased more than 75% of what
was originally planned.
... ... ...
After the European Union-imposed embargos on exports and shipping insurance
in 2012, Iranian oil exports fell to almost half their level of a year earlier,
forcing National Iranian Oil Co. (NIOC) to cut production and shut down
some of its fields. The cuts of course focused on very mature, inefficient
fields and wells, especially those producing heavy and extra-heavy crude
oil.
In all, Iran's production and production capacity have been hammered.
Since Iran cannot produce crude oil at maximum potential rates, and because
it has had to halt production from some of its older fields, analysts cannot
precisely estimate Iran's production capacity. Estimating potential recovery
from idle fields would be guesswork.
The Iranian oil ministry estimates the country's crude oil production
capacity at 3.5-3.7 million b/d. With condensate considered to be light
crude oil, production capacity rises to perhaps 4 million b/d.
Production rebound
Aside from real uncertainties about oil production capacity, Iran's ability
to increase production in case of sanctions relief is another major question.
If sanctions are lifted, how much and for how long will it take Iran to
increase its production?
Oil Minister Bijan Zangeneh announced that Iran's production could increase
by up to 1 million b/d quickly. The International Energy Agency estimates
that Iran's production capacity is 3.6 million b/d and that the country
can increase output by 600,000-800,000 b/d within 3 months. In May, the
IEA reported Iranian production in April of 2.88 million b/d, up 90,000
b/d from March.
Two main uncertainties hamper predictions about Iran's oil production
rebound. The first is Iran's technical ability to raise output. The second
is the country's ability to export oil.
Some observers argue that production cuts in old fields have enabled
reservoir pressures to increase and might allow production to resume at
high rates. Gas injection also might boost output in mature fields within
3-6 months.
Iran's condensate production is increasing along with production
of natural gas. Gains followed completion a few months ago of several development
phases at giant offshore South Pars field, including phases 12, 15-16, and
17-18, which added 120,000 b/d of condensate ready for export. Most of the
condensate is being stored at sea, occupying two thirds of Iran's current
floating capacity and awaiting a buyer. Iran's condensate production is
expected rise even further in 2016.
It is thus conceivable that Iran can raise its crude oil production
about 500,000-700,000 b/d within 3 months, and up to 800,000 b/d within
6 months.
But the other question, access to the market, remains unanswered. The
sanctions target Iranian exports. It might take at least 3-6 months from
the time of a nuclear agreement for sanctions to be lifted significantly.
And removal of the ban on imports of Iranian oil in Europe requires a consensus
of EU members. This might be hard to achieve quickly.
There is no doubt that any nuclear deal will have an immediate psychological
effect on the market. Sales negotiations will start, and Iran at least could
slightly increase its crude oil and condensate exports, particularly by
the last quarter of this year when a seasonal demand increase in Iran would
absorb some of the incremental production.
Regaining market share
Beyond sanctions, Iran's other challenge for raising its oil exports
is regaining lost market share. This problem is particularly acute at a
time of oversupply and low oil prices.
Most of Iran's competitors supplying similar crude oil to the same
markets, mainly Saudi Arabia and Kuwait, have secured their sales by signing
term agreement with customers. These commitments are usually for at least
1 year.
So Tehran has no choice other than to sell most of its oil in the spot
market for the next year. It will have to create incentives for signing
term contracts to regain long-term market share. Since Iran lacks a
huge capacity to store unsold oil, it could increase crude oil production
only slowly and cautiously. With prices low, it doesn't make sense
for Iran to rent tankers as floating storage and sell oil at further discounts.
Oil stored at sea will encourage Iran's customers to push for further discounts.
The outlook for Iranian condensate is different. High in sulfur,
Iran's condensate is considered a light crude and is traded at prices higher
than those of its heavy oil. Iran has fewer competitors for condensate-for
which demand, particularly in Asia, is high-than for oil.
Condensate flow will increase with gas production, particularly from
South Pars field, an extension of Qatar's supergiant North field. The field
has been Zangeneh's highest priority for development.
Condensate makes up much of the 30 million bbl of oil Iran currently
holds in floating storage, which will provide the first cargos ready for
immediate export when sanctions are lifted. This offloading would reduce
rental costs while Iran prepared to boost production. Therefore, we can
expect an immediate release of oil from floating storage upon any possible
deal at the end of June or in early July.
If negotiations lead to a comprehensive deal on Iran's nuclear program
by the end of June or early July, Iranian production and exports will rise
about 200,000 b/d by the end of 2015 because at least some of the sanctions
might then have been eased and because global demand will be seasonally
high. The rest of the country's production and export increase would enter
the market gradually through mid-2016.
An open question is how extra Iranian supply would affect the global
oil market. While predictions vary for production from shales and other
low-permeability formations in 2016, most analysts expect low oil prices
at least to suppress growth rates from these sources if not to cause declines
in the next year or two. Decline forecasts have been as high as 1 million
b/d of so-called tight oil.
A gradual rise of crude and condensate from Iran thus might be offset
by a decline from shale next year and have a modest impact on the price
of oil. That balance, of course, has a broader geopolitical context as crises
in Yemen and Iraq keep upward pressure on the crude price.
The author Sara
Vakhshouri is founder and president of SVB Energy International, a strategic
energy consulting firm based in Washington, DC. She advises international
corporations, think tanks, investment banks, and law firms on global energy
markets, geopolitics of energy, and investment patterns. During 2000-08,
she worked in the public and private sectors of the Iranian energy industry.
From 2004 to 2005, she worked as an advisor to National Iranian Oil Co.
International, a division responsible for marketing and sale of Iranian
crude oil and products. Vakhshouri holds a PhD in energy security and Middle
Eastern studies and was a visiting fellow at Oxford Institute for Energy
Studies. She has MA degrees in business management (international marketing)
and international relations.
For last month, OPEC's crude oil production dropped 90,000 barrels per day, on some small losses
in Iraq, Nigeria and the United Arab Emirates, but new production from Iran and the maintenance of
the production status quo in Saudi Arabia has kept losses to an overall minimum. Production from
Iraqi, Nigeria and UAE combined fell by 350,000 barrels per day in February.
We could also expect continued declines of exports coming from Iraq in March
"... I have read your comment on the last thread and I completely disagree with your point 2 that you make: "shale companies have always been growth-oriented, and the market (investors and lenders) has been rewarding them for growth rather than capital discipline." This a definition of ponzi scheme that you describe and ponzi always end when you run out of greater fools. And shale is at that point. Their relentless drilling of the remaining sweet spots AT ANY price will not change their financials at all. ..."
"... Oil price will steadily rise as shale start running out of the sweet spots and their production start decreasing so shale will never meet that imaginary price of $80-$100. Shale will run out of sweet spots long before the price is at $80-100 range. ..."
"... If we both agree that shale is continuously drilling regardless of price and profit how can you claim (on the last thread) that shale will make new peak in production at some imaginary future higher price point? What is the basis of that assumption? ..."
"... There was a very simple, albeit pervert, economic logic in 2015 - top brass bonuses (along with several other factors like pipeline contracts, etc). Redistribution of wealth up should never stop :-) ..."
"... Are you sure? Which of major banks anticipates bright conditions for junk bond market, and especially shale junk bonds, in 2017 ? I think most banks increased their loss provisions from junk for 2016. In view that survival of companies is in question, inquiring minds want to know, who are those happy investors who by trying to earn some extra points (chasing yield) already lost quite a bit of money and want to lose more. Or this is just new fools from never ending global supply. But like with oil there might be that "peak fools" moment is behind us :-) . ..."
"... If WTI is on average $40-45 by the end of the 2016 how much US shale and US total production will be on December 2017? ..."
"... The decline might be as high as 1.5 Mb/d for total US output if oil prices remain under $43/b, with shale maybe about half of this (800 kb/d), the EIA is predicting WTI at $35/b in Dec 2016 and $45/b in Dec 2017 (the EIA's oil price forecast is too low in my view). ..."
"... Very difficult to predict, it may be that capitulation in the US oil sector is close at hand. In that case output falls by more than I have guessed, but there is no way the EIA price forecast turns out to be correct in that case. ..."
"... If US falls by 1 Mb/d, that may be enough to balance the oil market,… ..."
"... And what do you think might happen in the rest of the world? In 2016 oil production will fall in most oil producing countries. Oil production will rise in a very few countries. The oil market may balance a lot sooner than a lot of people realize. ..."
"... You may be correct on that point. If we take the US and Canada out of the equation I think increases in Iran's output might balance the declines in World minus US+Canada+Iran. The question then becomes (if my previous assumption is roughly correct), how much does US+ Canada decline in 2016? My guess is 1.25 Mb/d. I would be interested in your estimate, because you track the numbers more closely than me. Or just your estimate for World C+C decline in 2016 would be fine. ..."
"... Thanks Dennis. I don't think the increase in Iranian production will come close to offsetting the decline in the rest of the world minus the US and Canada. I believe the decline in ROW less US and Canada will be about twice the increase expected from Iran. ..."
"... Breaking it down, Iran may increase production, from February, another half a million barrels per day. That would be almost 700,000 bpd from their January production. The rest of OPEC will be flat to down, most likely down slightly. Non-OPEC, less US and Canada will be down from one million to 1.2 million bpd from their December production numbers. ..."
"... Did you mean 1-2 oil sands project that are very close to completion in 2018? I think there is very minor one. But here is some hush – hush info from oil sands patch that there will not be any new oil sands project even if the price goes much higher in the near future without export pipeline in place. But who knows. ..."
I have read your comment on the last thread and I completely disagree with your point 2
that you make: "shale companies have always been growth-oriented, and the market (investors
and lenders) has been rewarding them for growth rather than capital discipline." This a
definition of ponzi scheme that you describe and ponzi always end when you run out of greater
fools. And shale is at that point. Their relentless drilling of the remaining sweet spots AT ANY
price will not change their financials at all.
Oil price will steadily rise as shale start running out of the sweet spots and their production
start decreasing so shale will never meet that imaginary price of $80-$100. Shale will run out
of sweet spots long before the price is at $80-100 range.
You asked why companies are still drilling when oil price is $37 and they are making losses?
I said that I do not see economic logic, but they were doing that in the past, continue to do
so now, and will continue to drill and complete wells at loss in the future.
I do not mind if you call it "ponzi scheme", but this is reality. In the first 2 months of
2016 shale companies sold about $10 in equity, diluting existing shareholders, but they found
new buyers. Bondholders are happy that oil companies' bonds are up 20% in the past month and are
ready to invest more. Private equity is ready to invest tens of billions in distressed companies.
I do not mind if you call all them fools, but this is reality.
Did I say that this is normal? I didn't. Did I say that this will continue forever? I didn't.
If we both agree that shale is continuously drilling regardless of price and profit how
can you claim (on the last thread) that shale will make new peak in production at some imaginary
future higher price point? What is the basis of that assumption?
Alex, You asked why companies are still drilling when oil price is $37 and they are making losses?
I said that I do not see economic logic
There was a very simple, albeit pervert, economic logic in 2015 - top brass bonuses (along
with several other factors like pipeline contracts, etc). Redistribution of wealth up should never
stop :-)
But 2016 is a completely different game. "After me deluge" type of thinking on the top run
its course: they run out of money and can't get new loans. For most shale companies it was something
like waking up the next morning after several days of binge drinking…
Bondholders are happy that oil companies' bonds are up 20% in the past month and are
ready to invest more.
Are you sure? Which of major banks anticipates bright conditions for junk bond market,
and especially shale junk bonds, in 2017 ? I think most banks increased their loss provisions
from junk for 2016. In view that survival of companies is in question, inquiring minds want to
know, who are those happy investors who by trying to earn some extra points (chasing yield) already
lost quite a bit of money and want to lose more. Or this is just new fools from never ending global
supply. But like with oil there might be that "peak fools" moment is behind us :-) .
http://knowledge.wharton.upenn.edu/article/do-junk-bond-defaults-signal-trouble-for-2016/
The iShares iBoxx $ High Yield Corporate Bond ETF, a $14.4-billion exchange traded fund
that tracks the performance of the junk-bond market, posted an annual loss of 5.5%, and ended
2015 off a startling 12.4% from its February high. Likewise, the S&P U.S. Issued High Yield
Corporate Bond Index lost 3.99% for the year, while BofA Merrill Lynch U.S. High Yield Index
fell 5% for the year, its first annual loss since 2008.
BTW Vanguard increased the quality of bonds in their junk bond fund. And that means that they
think that the storm is ahead not behind us.
In the Bakken, the number of well completions has fallen from 185/month for the 12 months ending
in March 2015 to 70 well completions in January.
If US falls by 1 Mb/d, that may be enough to balance the oil market, output in Canada may also
fall, the low oil prices will eventually reduce output and oil prices will rise maybe by late
2016, eventually (probably 6 months later) oil output will gradually flatten and then rise, possibly
reaching the previous peak, this will depend in part on demand for oil and the price of oil.
The decline might be as high as 1.5 Mb/d for total US output if oil prices remain under
$43/b, with shale maybe about half of this (800 kb/d), the EIA is predicting WTI at $35/b in Dec
2016 and $45/b in Dec 2017 (the EIA's oil price forecast is too low in my view).
Very difficult to predict, it may be that capitulation in the US oil sector is close at
hand. In that case output falls by more than I have guessed, but there is no way the EIA price
forecast turns out to be correct in that case.
Hi Dennis,
I agree on EIA price prediction in sense that I always stay away from predicting price for anything.
Even for my weekly grocery shopping bag. :-)
If US falls by 1 Mb/d, that may be enough to balance the oil market,…
And what do you think might happen in the rest of the world? In 2016 oil production will
fall in most oil producing countries. Oil production will rise in a very few countries. The oil
market may balance a lot sooner than a lot of people realize.
You may be correct on that point. If we take the US and Canada out of the equation I think
increases in Iran's output might balance the declines in World minus US+Canada+Iran. The question
then becomes (if my previous assumption is roughly correct), how much does US+ Canada decline
in 2016? My guess is 1.25 Mb/d. I would be interested in your estimate, because you track the
numbers more closely than me. Or just your estimate for World C+C decline in 2016 would be fine.
Thanks Dennis. I don't think the increase in Iranian production will come close to offsetting
the decline in the rest of the world minus the US and Canada. I believe the decline in ROW less
US and Canada will be about twice the increase expected from Iran.
Breaking it down, Iran may increase production, from February, another half a million barrels
per day. That would be almost 700,000 bpd from their January production. The rest of OPEC will
be flat to down, most likely down slightly. Non-OPEC, less US and Canada will be down from one
million to 1.2 million bpd from their December production numbers.
Thanks. I was under the impression that there were projects coming on line in that would offset
some of the 1.2 Mb/d decline in non-OPEC less US and Canada. I may be wrong of course (happens
all the time). :-)
Did you mean 1-2 oil sands project that are very close to completion in 2018? I think there
is very minor one. But here is some hush – hush info from oil sands patch that there will not
be any new oil sands project even if the price goes much higher in the near future without export
pipeline in place. But who knows.
"... Do Permian basin drillers and oil service companies get paid in pesos, $CND, or roubles considering the high level of active rigs compared to Bakken/EF from year ago? Or more likely Bakken/EF simply run out of sweet spots by end of 2015? ..."
"... It does not matter how drillers are paid. What matters is how bonuses to the top brass are calculated: The Wall Street Journal reported that the bonuses earned by the CEO's of the major shale oil producers were tied to the level of production, not profits. ..."
"... But have a look: Oil price bust started 1.5 ago. ..."
"... Does that sound like business decision? No. It is political. The whole shale is political boondoggle camouflaged as new technology/energy independence narrative. ..."
"... Oil rig count in the Permian basin is now down 73% from the peak reached on October 24, 2014 (150 vs. 562) A 73% decline is less than 84% for the Bakken or 82% for the Eagle Ford, but this is still a huge decline. ..."
"... I don't agree that is not correct comparison. You provide 2 yardsticks: 1) bigger area and 2) there are lots of conventional fields that are in my opinion completely irrelevant. These two yardsticks are irrelevant because the price is $37 and you can't make money at $37. And you could not make money for the whole last year. The profit has always been the bottom line yardstick before shale entered the picture. ..."
"... Look Canada is waaaayy bigger field than Permian basin and we have to agree on that. How many active rigs do you have in Canada? 50 rigs. Why do you think Permian basin is "exceptional" that justify 152 rigs at this very moment? It is not bigger than the whole Canada. ..."
"... The Permian companies are not generally as debt burdened, having been more likely to have raised funds through stock issuance. ..."
"... Keep in mind history, too. The Williston Basin has had times where the rig count fell to zero. Not sure what 40 year low is for Permian, but pretty sure its never been zero. It looks like in 1999 the rig count in the Permian Basin dropped as low as 51. That is for TX only. ..."
Do Permian basin drillers and oil service companies get paid in pesos, $CND, or roubles considering
the high level of active rigs compared to Bakken/EF from year ago? Or more likely Bakken/EF simply
run out of sweet spots by end of 2015?
It does not matter how drillers are paid. What matters is how bonuses to the top brass are
calculated: The Wall Street Journal reported that the bonuses earned by the CEO's of the major shale
oil producers were tied to the level of production, not profits.
You are right about top brass, but let's not forget that even in the church their top brass justify
that they deserve more bonuses let alone oil capitalistic business.
I was being sarcastic with in what currency drillers and oil services are paid in Permian basin
just to provoke some thoughts intrigued on that model that Verwimp posted.
But have a look: Oil price bust started 1.5 ago. Numbers of rigs in Permian basin
are 8 TIMES higher now when oil price is 40-50% lower than year ago!! Does that sound like
business decision? No. It is political. The whole shale is political boondoggle camouflaged as
new technology/energy independence narrative.
But what is interesting now in 2016 to see is huge decline in the number of rigs in EF and
Bakken that actually supposed to happen in early in 2015 if this shale business was to be credible
business venture. But it did not happen in 2015. It did not happen in 2015 because it was political.
Well the reason it is happening today is probably they are running out of sweet spots. What they
are going to do until price reach $80? It is them the reason that price is not at higher level
today. Drilling marginal spots that are left in EF/Bakken is like drilling in downtown New York.
"Drill Baby Drill" only is applicable if there is something to drill for. The only shale game
in town now is Permian simply because of timing. They were the last that joined the game. Banks
will allow them to drill the the sweet spots at ANY price and then they will pull the plug.
"Numbers of rigs in Permian basin are 8 TIMES higher now when oil price is 40-50% lower than year
ago!! "
????!!!!! Oil rig count in the Permian basin is now down 73% from the peak reached on October 24, 2014 (150
vs. 562)
A 73% decline is less than 84% for the Bakken or 82% for the Eagle Ford, but this is still a huge
decline.
My bad interpreting graph from oilpro regarding the rig count. But the question is still valid:
At $35 WTI why Permian has 5 times more active rigs than Bakken today drilling unprofitable oil
for every single barrel that they produce for over year and half? I think is just matter of how
much sweet spots are left in each of the shale basin regardless of the actual price.
The comparison is incorrect. Permian basin is much bigger than Bakken and includes numerous conventional
fields. It always had much bigger number of drilling rigs than any other basin in the U.S.
I don't agree that is not correct comparison. You provide 2 yardsticks: 1) bigger area and 2)
there are lots of conventional fields that are in my opinion completely irrelevant. These two
yardsticks are irrelevant because the price is $37 and you can't make money at $37. And you could
not make money for the whole last year. The profit has always been the bottom line yardstick before
shale entered the picture.
Look Canada is waaaayy bigger field than Permian basin and we have to agree on that. How many
active rigs do you have in Canada? 50 rigs. Why do you think Permian basin is "exceptional" that
justify 152 rigs at this very moment? It is not bigger than the whole Canada.
Regarding yardstick that Permian is partly conventional also does not make sense because conventional
does not make money either at $37 and half of Canadian production is conventional and nobody is
drilling.
This shale "revolution" is political boondoggle that will have huge repercussions on US conventional
in the first place and then the rest of world's high cost and mature oil production like North
Sea and Alaska. But ultimately it will be US consumer that will pay the highest price as the biggest
consumer per capita in the world.
One reason there is more activity could be there is a larger area. Also, the severance taxes
are lower and the discounts for both oil and natural gas are lower. There could also be conventional
rigs drilling in the Permian, as well as rigs drilling wells besides producers (injection, disposal,
supply, observation)
It could also be that some rigs are deepening conventional wells to explore different and deeper
zones. The Permian is well known for may productive formations.
The Permian companies are not generally as debt burdened, having been more likely to have raised
funds through stock issuance.
Keep in mind history, too. The Williston Basin has had times where the rig count fell to zero.
Not sure what 40 year low is for Permian, but pretty sure its never been zero. It looks like in
1999 the rig count in the Permian Basin dropped as low as 51. That is for TX only.
Yes we are, I would direct people to Enno Peters website.
He does a fine job on this,
Based on the latest NDIC data, total oil production in North Dakota fell to 1122 kbo/d
in January, again a monthly drop of 30 kbo/d. This decline was slightly higher than I expected.
The number of new wells producing dropped to 70.
Oil and gas wastewater disposal has been tied to a series of earthquakes in California for the first
time, in a peer-reviewed study published last Thursday.
A string of quakes ending on Sept. 22,
2005 struck in Kern County near the southern end of California's Central Valley – and the new
study,
published
in Geophysical Research Letters, concluded that the odds that those quakes might have occurred
by chance were just 3 percent.
Instead, the researchers honed in on a very specific set of culprits: three wastewater injection
wells in the Tejon Oil Field. Between 2001 and 2010, the rate of wastewater injection at that oil
field quintupled, and up to 95 percent of that wastewater was sent to just that trio of closely-spaced
wells, the scientists noted.
The largest of the earthquakes in the swarm measured magnitude 4.6 on the Richter scale meaning
that the quakes were relatively small, unlikely to have done any damage to buildings but significant
enough to be felt by those in the area.
To be sure, natural earthquakes have always far outnumbered human-caused quakes in California
– but the researchers warned that even if the number of industry-caused quakes is small, wastewater
injection could be responsible for larger, more dangerous quakes in the future.
"Based on our empirical results, injection-induced earthquakes are expected to contribute
marginally to the overall seismicity in California," the researchers from the California Institute
of Technology, University of California, University of Southern California and two French universities,
wrote. "However, considering the numerous active faults in California, the seismogenic consequences
of even a few induced cases can be devastating."
The researchers also warned that the number of California quakes tied to oilfield activities has
been little-studied compared to other parts of the country and that natural quakes may have "masked"
the oil industry's impacts.
The findings drew an immediate response from environmental groups.
"The more oil companies frack and drill, the more wastewater they inject into disposal wells
near active faults," Shaye Wolf, a scientist with the Center for Biological Diversity, said
in a statement responding to the new research. "That's an absolutely unacceptable risk in our earthquake-prone
state."
For years, federal scientists have known that wastewater injection has caused earthquakes in Oklahoma
– a state that before the shale gas rush experienced just a two or three earthquakes over magnitude
3.0 a year, but in 2015 recorded over 840 quakes that size, some as large as magnitude 5.6 (ten times
the size of California's largest human-caused quake).
But the connection to California – which for years was the nation's
most earthquake prone state until Oklahoma's sudden surge in quakes knocked California down to
second place – is new. And unlike Oklahoma, where the recent tremors have so far caused property
damage, California has a long history of natural earthquakes powerful enough to kill.
At the end of January, the U.S. Department of the Interior agreed to
stop approving new offshore fracking operations along California's Pacific coast, part of a deal
with environmental groups that had sued over the agency's failure to adequately measure the environmental
risks, including the potential harm to endangered species, from permitting fracking at sea. Oil platforms
have been allowed to legally dump up to
9 billion gallons of wastewater annually into California's ocean.
The drought-plagued state has paradoxically grappled with a flood of oil and gas wastewater in
recent years. California's drillers annually pump out billions of barrels of wastewater, much of
it laden with corrosive salts or carcinogens like benzene.
And while much of it is disposed of through wastewater injection, water shortages have created
a market for drillers to treat that waste and sell it to farms where the food people eat is grown.
"In central California's San Joaquin Valley, Chevron piped almost 8 billion gallons of treated wastewater
to almond and pistachio farmers last year," Bloomberg
reported in July. "California Resources Corp., the state's biggest oil producer, plans to quadruple
the water it sells to growers, Chief Executive Officer Todd Stevens told investors at an April conference."
Even as the industry has experimented with other disposal techniques, wastewater injection has
spiked. Since 1995, the amount of wastewater injected underground in California has
roughly doubled, from under 20 billion gallons a year to nearly 40 billion.
In 2014, the California State Water Resources Board
confirmed that over 3 billion gallons of wastewater tainted with fracking chemicals or other
pollutants were injected directly into some of the state's underground water aquifers, which were
previously clean enough for people to drink from, with the
permission of the state's regulators.
The new study suggests that Californians may have more than water contamination to worry about
from wastewater injection. The earthquakes struck near Bakersfield, CA
– which is just 50 miles from one of the world's most notorious fault lines, the San Andreas fault.
In December, researchers from Stanford's School of Earth, Energy & Environmental
Sciences announced the results of an investigation into human-caused earthquakes in Arkansas, finding
that the more water is disposed at a given well, the stronger quakes become.
But, they added, at a certain point, there is likely to be a cap on how powerful an induced earthquake
could become.
"The question becomes, Does it taper off at magnitude 3 or a more dangerous magnitude 6.5?" Prof.
Jenny Suckale
told the Stanford Report, as she described the findings in Arkansas.
The California study comes just two weeks after Canadian authorities shut down fracking at a well
in Alberta over a 4.8 magnitude quake that struck near a town called Fox Creek. And in early January,
Oklahoma was rattled by two quakes measuring 4.7 and 4.8 – some of the strongest quakes in recent
memory.
The new publication drew the attention of federal earthquake authorities who said they found the
tie between oilfield wastewater disposal and California's earthquakes credible.
"In California, of course, we have a lot of natural seismicity here, so it's much more difficult"
to reliably connect quakes to human activities than in a place like Oklahoma, Art McGarr,
US Geological Survey seismologist
told the Associated Press. "Nonetheless, I think they made at least a fairly convincing case
that these earthquakes were related to fluid injection."
Resurgence of voodoo science is typical during crisis periods. "Deficits does not matter" voodoo
does not work in a world were there are strong economic competitors to the USA and where euro and
Yuan exists. The idea of deficit spending which
Michelle
Jamrisko discusses actually came from Keynesian economics, not from MMT.
Notable quotes:
"... Bridgewater's Ray Dalio, head of the world's biggest hedge fund, and Janus Capital's Bill Gross say policy makers are cornered and will have to resort to bigger deficits. ..."
"... "I have no problem with deficit spending," said Aneta Markowska, chief U.S. economist at Societe Generale in New York. "But this idea of the government printing money -- unlimited amounts of money -- and running unlimited, infinite deficits, that could become unhinged pretty quickly." ..."
"... Many more agree that it's precisely when households are cutting back that governments should do the opposite, to prevent a slump in demand. ..."
"... Most economists don't expect an imminent U.S. recession. But financial-market turmoil and America's political upheaval have added to a sense that nobody has figured out a cure for the economy's malaise. ..."
In an American election season
that's turned into a bonfire of the orthodoxies, one taboo survives pretty much intact: Budget deficits
are dangerous. A school of dissident economists wants to toss that one onto the flames, too.
It's a propitious time to make the case, and not just in the U.S. Whether it's negative interest
rates, or
Calls for governments to take over the relief effort are
growing louder. Plenty of economists have joined in, and so have top money managers. Bridgewater's
Ray Dalio, head of the world's biggest hedge fund, and Janus Capital's Bill Gross say policy makers
are
cornered and will have to resort to bigger deficits.
"There's an acknowledgment, even in the investor community, that monetary policy is kind of running
out of ammo," said Thomas Costerg, economist at Standard Chartered Bank in New York. "The focus is
now shifting to fiscal policy."
Currency Monopoly
That's where it should have been all along, according to Modern Money Theory. The 20-something-year-old
doctrine, on the fringes of economic thought, is getting a hearing with an unconventional take on
government spending in nations with their own currency.
Such countries, the MMTers argue, face no risk of fiscal crisis. They may owe debts in, say, dollars
or yen -- but they're also the monopoly creators of dollars or yen, so can always meet their obligations.
For the same reason, they don't need to finance spending by collecting taxes, or even selling bonds.
The long-run implication of that approach has many economists worried.
"I have no problem with deficit spending," said Aneta Markowska, chief U.S. economist at Societe
Generale in New York. "But this idea of the government printing money -- unlimited amounts of money
-- and running unlimited, infinite deficits, that could become unhinged pretty quickly."
To which MMT replies: No one's saying there are no limits. Real resources can be a constraint
-- how much labor is available to build that road? Taxes are an essential tool, to ensure demand
for the currency and cool the economy if it overheats. But the MMTers argue there's plenty of room
to spend without triggering inflation.
The U.S. did dramatically loosen the purse strings after the 2008 crisis, posting a deficit of
more than 10 percent of gross domestic product the next year. That's since been trimmed to 2.6 percent
of GDP, or $439 billion, last year.
... ... ...
Tighten Belts?
Those who push back sometimes argue that money-printing puts countries on a path that eventually
leads, in a worst-case scenario, to Zimbabwe -- where money-printing debased the currency so badly
that all the zeros could barely fit on banknotes. Or
Venezuela, whose spending spree helped push inflation to 180 percent last year. Japan's a more
mixed picture: years of deficits haven't scared off borrowers or unleashed inflation, but haven't
produced much growth, either.
There's also a peculiarly American enthusiasm for balanced budgets, according to Jim Savage, a
political science professor at the University of Virginia. He's traced it to the earliest days of
the U.S., rooted in a "longstanding fear of centralized political power, going back to England."
Wray says there are episodes in American history when a different understanding prevailed. During
World War II, he says, U.S. authorities learned a lesson that's since been forgotten -- that "we've
always got unemployed resources, including labor, and so we can put them to work."
Savage says Americans have historically tended to conflate household and government debts. That
category error is alive and well.
"Small businesses and families are tightening their belts," President Barack Obama said in 2010
as he announced a pay freeze for government workers. "Their government should, too."
It's not just MMT economists who winced at the comment. Many more agree that it's precisely when
households are cutting back that governments should do the opposite, to prevent a slump in demand.
That argument doesn't carry much sway in Congress, though. That's one reason the Fed has had to
shoulder so much of the burden of keeping the recovery alive, Societe Generale's Markowska says.
"When it comes to deciding on monetary easing, it's a handful of people in the room," she said.
"It's going to take more pain to build that political consensus around the fiscal stimulus."
Wray says he'd expected attitudes to start shifting after the last downturn, just as the Great
Depression gave rise to Keynesian economics and the New Deal, but "it really didn't change anything,
as far as the policy makers go."
"I think it did change things as far as the population goes," he said, citing the anti-establishment
campaigns of Sanders and Republican Donald Trump. It might take another crash to change minds, Wray
says.
'Strange Period'
Most economists don't expect an imminent U.S. recession. But financial-market turmoil and America's
political upheaval have added to a sense that nobody has figured out a cure for the economy's malaise.
Bill Hoagland, a Republican who's senior vice president of the Bipartisan Policy Center, has helped
shape U.S. fiscal policy over four decades at the Congressional Budget Office and Senate Budget Committee.
He says a farm upbringing in Indiana helped him understand why "it's engrained in a number of
Americans outside the Beltway that you equate your expenditures with your revenue." He also acknowledges
that government deficits are different, and could be larger now to support demand, so long as there's
balance in the longer term.
Most of all, Hoagland says he sees profound change under way. The "catastrophic event" of the
2008 crash may be reshaping American politics in a way that's only happened a handful of times before.
And economic orthodoxy has taken a hit too.
"We're going through a very strange period where all economic theories are being tested," he said.
Reuter in firmly in the "low price forever" camp so this article is within "central tendency".
The problem with this article that the accuracy of oil production reports is below 1Mb/d. So
0.76Mb/d "excess supply" might well be a statistical mirage.
LONDON (Reuters) - OPEC on Monday predicted global demand for its crude oil will be less than
previously thought in 2016 as supply from rivals proves more resilient to low prices, increasing
the excess supply on the market this year.
Demand for OPEC crude will average 31.52 million barrels per day this year, the Organization of
the Petroleum Exporting Countries said in a monthly report, down 90,000 bpd from last month's
forecast.
OPEC pumped 32.28 million bpd in February, the group said citing secondary sources, down about
175,000 bpd from January.
The report points to a 760,000-bpd excess supply in 2016 if the group keeps pumping at February's
rate, up from 720,000 bpd implied in last month's report.
While the oil price will rise in 2016, it will stay below the level at which shale
production is profitable. But drilling activity will start increasing again at price levels below
breakeven. I have recently read a prediction that we need to see $60-70 WTI to see many rigs added.
Completion rate will fall to around 50 new wells per month by May and might stays at that level
until Dec 2016. It is unclear how many more wells can be drilled in the remaining "sweet spots" and
drilling might be forced to move into more marginal areas Hovering around 100 per month during 2015,
spuds plunged in February 2016 to a multi year low of 29.
https://www.dmr.nd.gov/oilgas/stats/2016monthlystats.pdf.
Notable quotes:
"... In my opinion, the industry has finally cut production in earnest. This is very likely the main reason for the recent price recovery. The latest action provides a good basis for a significant price rise in the fall of 2016. ..."
In my opinion, the industry has finally cut production in earnest. This is very likely the
main reason for the recent price recovery. The latest action provides a good basis for a significant
price rise in the fall of 2016.
Dr. Amy Townsend-Small and her team at the University of Cincinnati conducted a study in Ohio
testing private well water to see if methane gas from hydraulic fracturing, or fracking, is
reaching drinking water. The short answer is no.
Townsend and her team set up their tests to measure well water before, during and after fracking
began, unlike studies done in other regions, notes Kallanish Energy.
The study was conducted because of concern about possible contamination. The study lasted three
years and tested 27 private wells between 35 to 115 meters underground 3-4 times per year, as
reported by the Free Press Standard.
The combined test results only produced four samples that showed dangerous levels of methane.
These wells were also located over 5 kilometers from active gas wells. Townsend's study concludes
results from those particular well can be attributed to coalbed gas and other organic carbon
rather than due to hydraulic fracturing. The other samples all show very little to no increase in
the amount of methane in the water supply. This is good news for those who rely on private wells
rather than city water where testing is not done on a regular basis and fears of contamination
due to fracking is great.
Future monitoring is still necessary, Townsend notes. An article by Midwestern Energy News noted
that baseline testing, like that done in Townsend's study, is helpful for homeowners in the cases
of contamination, providing them with proof should the groundwater develop contamination. Nathan
Wiser of the U.S. Environmental Protection Agency stated that many wells in the U.S. have
cemented casings below the groundwater table, but the casings do not fully reach the shale
formation, which can allow a leak of natural gas to escape.
"... "Controls on existing wells, especially with current low natural gas prices, will cause thousands of low-volume wells to become too expensive to operate and they will be plugged and abandoned. Twenty percent of domestic production comes from approximately 771,000 marginal wells. That's a huge source of domestic energy that is at risk from the president's latest plans," concluded Sgamma. ..."
DENVER – Western Energy Alliance released the following statement on President Obama's
announcement today to impose methane reductions on existing oil and natural gas wells.
"President Obama's announcement of further punitive measures on the oil and natural gas industry,
which has already voluntarily decreased methane emissions by 21 percent even as natural gas
production has soured 47 percent, continues policies that are counterproductive to his stated
climate change goals," said Kathleen Sgamma, vice president of government and public affairs.
"Contrary to the perception created by misleading statements from EPA and the environmental
lobby, the oil and natural gas is not the largest human source of methane emissions, but we're
the only one that captures methane in significant quantities and puts it to beneficial use.
"Our industry has delivered 59 percent more climate change benefits, through increased natural
gas electricity generation, than wind and solar combined. The small amount of methane emissions
from the upstream oil and natural gas sector is just 1.07 percent of U.S. greenhouse gas
emissions, yet the administration continues to blindly pile on regulation after regulation
without even letting the emissions reductions it has already imposed take effect. All these
costly regulations make developing American oil and natural gas more costly while giving an
advantage to producers in Iran, Saudi Arabia and Russia.
"What's particularly interesting about today's announcement is that the president has gone even
farther with his 'pen and phone.' Knowing there's not time in his last term to get through the
regulatory process required by law, he's directing EPA to engage in regulation by enforcement.
EPA will use Clean Air Act Section 114 enforcement requests to tie companies in knots with highly
detailed and extremely time consuming requests for information and then threaten huge fines if
they don't change practices, even if they're operating according to existing regulations.
Apparently, laws don't matter to the president when he's targeting an industry he doesn't like.
"Controls on existing wells, especially with current low natural gas prices, will cause
thousands of low-volume wells to become too expensive to operate and they will be plugged and
abandoned. Twenty percent of domestic production comes from approximately 771,000 marginal wells.
That's a huge source of domestic energy that is at risk from the president's latest plans,"
concluded Sgamma.
Additional background information about reduction in methane emissions from industry innovations
is available online.
About Western Energy Alliance
Western Energy Alliance, founded in 1974 as the Independent Petroleum Association of Mountain
States, is a non-profit trade association representing more than 450 companies engaged in all
aspects of environmentally responsible exploration and production of oil and natural gas in the
West. More information is available at http://www.westernenergyalliance.org/.
"... "The peaking of world oil production presents the U.S. and the world with an unprecedented risk management problem. As peaking is approached, liquid fuel prices and price volatility will increase dramatically, and, without timely mitigation, the economic, social, and political costs will be unprecedented. Viable mitigation options exist on both the supply and demand sides, but to have substantial impact, they must be initiated more than a decade in advance of peaking." ..."
"... Phil Butler, is a policy investigator and analyst, a political scientist and expert on Eastern Europe, exclusively for the online magazine "New Eastern Outlook" . http://journal-neo.org/2016/03/10/key-crisis-point-is-saudi-arabia-running-out-of-gas/ ..."
Saudi Arabia's ever increasingly hostile stance toward neighbors may not be as secular as some have
suggested. Given the nature of the country's oil reserves, and almost unlimited production for decades,
it's possible the Saudis could simply be running out of gas. Here's a candid look at the Saudi situation,
one which should be thought provoking. If the world has really reached the "peak oil" threshold,
a Middle East war may be inevitable.
Saudi Arabia has been a sort of model country for much internal
progress since the oil embargo of 1973 catapulted the members of the organization of petroleum exporting
countries (OPEC) into immeasurable profitability. Not the least of "progress" aspects derived from
oil money has been the elevated living standard of the nation's people. For a bit of a history lesson
on this, I revert to the bid by OPEC in the mid 70's.
The 1970's Happened
Be the end of the oil embargo imposed by OPEC, the price of oil had risen from $3 per
barrel to nearly $12 globally. In the US we felt the sting even more significantly as I recall.
The crisis literally shocked America, and later the 1979 "second oil shock" was to do even more catastrophic
damage. This was in the aftermath of several key events, but the Nixon administration's discovery
America could no longer keep up production of oil was the most significant. The story is a deep one,
but Saudi Arabia coming out on top as a world energy power was the end result. It was at about this
time Saudi production went into overdrive, and Saudi leaders soon became billionaires. Here's where
my story gets interesting.
Americans will remember an economic theory of the US President Ronald Reagan at about this time.
The so-called "Trickle Down Theory" was the catch phrase that captivated the masses then. Part joke,
part real economics, the idea of the fabulously wealthy getting richer, and their win filtering down
to poor people – well, it caught on big time. Reagan was one of the most popular presidents ever,
and for a time his economics worked. Trickle Down worked in Saudi Arabia too, in fact all the oil-exporting
nations accumulated vast wealth. That is until the bubble busted recently. I'll address the Saudi
social empowerment in a moment, but the effects of OPEC on the Cold War bear scrutiny here as well.
The United States' hegemony prior to the oil crisis was solely focused on the Soviet Union and China,
but with OPEC's bid at emergence, Washington faced a new "third world" threat. Drastic measures were
undertaken as a result, measures we see the effects of now in Syria, Ukraine, with regard to Russia
and Iran, and worldwide. For one thing, NATO and the rest of the leagues of nations were forced to
be far more "pro-Arab" than ever before. While this was a very good thing in many respects, nations
of these coalitions refocused strategies accordingly. The Saudis and others became increasingly dependent
on defense by the United States, which in turn led us to the veritable vassal state situation in
Europe.
Sputtering Oil Fields
Returning to my original argument, Saudi Arabia is now going broke via an American bid to reshuffle
the economic and policy deck. America's last shale reserves are being pumped dry in an effort to
break Russia and other nations dependent on exporting energy resources for their economies. And while
Russia could probably overcome any hardship out of sheer necessity, Saudi Arabia has nothing but
oil to rely on. Saudi royalty has for decades built a civil system relying on lavish schemes and
placating the masses, paid for by an unsustainable commodity. While the western press touts Wahhabi
desires to eliminate vestiges of Shia religiosity within Saudi's sphere of influence as a causal
point in Saudi aggressiveness of late, going broke would seem the greater fear to me. Assuming my
theory has merit, let's turn to Saudi oil reserves, and to recent austerity moves by the leadership.
New VAT and other taxes are in the wind, funding for external projects has slumped, and business
in Riyadh has screeched to a halt in some sectors. New projects like the lavish architectural creations
looming in the deserts have halted, the Saudis are not happy people like they were. Even the filthy
rich there have their own forms of austerity, which involve emptying their swimming pools, swapping
gas-guzzling SUVs for more economical transport, and even turning off the AC. Last month the Wall
Street Journal reported that dashed oil prices have already wiped out the Saudi budgetary plan.
RT reports
of debt defaults already looming large, so one can only imagine what will happen if the oil truly
runs out. By way of an illustration the Ghawar Field, largest in the world, is running out after
about 65 years of continuous production. Reports the Saudi Aramco will be starting the CO2-EOR process
to extract the last of the field's oil, they tell us this field will be depleted totally soon. Once
this happens, Saudi Arabia will return to an almost medieval third world status. Either this or those
billions horded by Saudi princes will have to be used to placate or to subdue the people.
Click on the picture to enlarge
This August, 2015 The Telegraph piece by author
Ambrose Evans-Pritchard notwithstanding, Saudi Arabia going broke due to low oil prices may not
be the issue really. To the point, a recent Citigroup study suggested that Saudi Arabia may actually
run out of óil by the year 2030. Furthermore, a recent WikiLeaks revelation cited a warning from
a senior Saudi government oil executive telling that the kingdom's crude oil reserves may have been
overstated by as much as 300bn barrels, or by nearly 40%! With the world having reached a threshold
known as "peak oil" already, we can easily ascertain "why" the Saudis, the US hegemony, and other
players seem desperate for war nowadays. For those unaware of what I am talking about, let me frame
what "peak oil" really means.
Peak oil refers to an event based on M. King Hubbert's theory, where the maximum
rate of extraction of oil is reached. After this date, oil capacity will fall into irreversible decline.
Hubbert was one of those genius types who was a significant geoscientist noted for his important
contributions to geology, geophysics, and petroleum geology. He worked with Shell Oil at their labs
back in Houston, and is quoted as saying about our overall dependency:
"We are in a crisis in the evolution of human society. It's unique to both human and geologic
history. It has never happened before and it can't possibly happen again. You can only use oil
once. You can only use metals once. Soon all the oil is going to be burned and all the metals
mined and scattered."
Hubbert's "peak oil" prognosis was actually supposed to take hold back in 1995, and it is my sincere
belief that it did. His science is essentially irrefutable. If you run down his theory of "peak oil"
you'll inextricably come to a graphic of a bell curve of world oil production. For my part, I have
taken Hubbert's math and overlaid other "depletive" curves for production and resource allocation
simply to satisfy my own scientific curiosity. I studied environmental geography under one of the
world's most renowned former Shell geologist,
Dr. Mitch Colgan. That said, the graph you see from Hubbert's
1956 report to the
American Petroleum Institute, on behalf of Shell Oil, shows Ohio oil production, which mirrors Texas,
or any other region where such a resource is depleted. The "fact" the world will run out of oil is
incontestable, like I said. And the Saudis have been pumping massive quantities of oil longer, and
faster than anyone.
There's not space here for an exhaustive study of whether or not we've achieved the "peak oil"
threshold. I would like to leave off on M. King Hubbert here with an ironic note,
a case I discovered
concerning his association in World War II with the US Board of Economic Warfare. Hubbert was evidently
a candidate for helping this Washington D. C. agency, but was somehow deemed "ineligible" or undesirable,
which in turn caused some controversy. You will no doubt find the letter from the chairman of the
economic warriors interesting. I'll wager most people never even knew America has such departments.
But I need to sum up.
Now What, More War?
Where Americans' interests are concerned, while President Obama has been parlaying trendy terms
like "renewable energy" and his supposed climate change agenda, the fact is petroleum still powers
96% of all transportation in America. Furthermore, fossil fuels 44% of the industrial sector, and
coal provides 51% of the nation's electricity still. Nuclear provides this biggest chunk of electricity
after coal, just to be clear here. Denial that peak oil has been reached is not only idiotic, it
may end up being catastrophic. The Saudi leadership is drawing back with austerity measure against
the people. Saudi militarism is on a gigantic upswing, as we see in Yemen and with the Turkey innuendo.
Evidence Obama and other western leaders know of the "peak oil" crisis abounds. A recent Department
of Energy request to expert Robert Hirsch in 2005 revealed a damning truth. I quote
from the report, which mysteriously disappeared in PDF and other forms from the web:
"The peaking of world oil production presents the U.S. and the world with an unprecedented
risk management problem. As peaking is approached, liquid fuel prices and price volatility will
increase dramatically, and, without timely mitigation, the economic, social, and political costs
will be unprecedented. Viable mitigation options exist on both the supply and demand sides, but
to have substantial impact, they must be initiated more than a decade in advance of peaking."
Within the various reports by
Hirsch (PDF) and other, we find statements like the one from Dr. Sadad al-Husseini, a retired
senior Saudi Aramco oil exploration executive, who went on record saying, "that the world is heading
for an oil shortage." The world consumes 85 billion barrels of oil each day. That's about 40,000
gallons per hour, and demand is not slowing, but increasing exponentially. Geologists have already
determined that more than 95% of all the recoverable oil has already been found.
Saudi aggression in Yemen, the recent siding with Turkey, and the withdrawal of aid earmarked
for military purchases by
Lebanon are all clear signs of a nation in big trouble. If my theory is correct and if these
Saudi oil fields are running out, then rumors of a
re-Islamification of Turkey make the Saudi alliance meaningful. Oil fields in Syria and Northern
Iraq may in fact be a vision of continued Saudi wealth gathering. So the deepening of strategic ties
in between Turkey and Saudi Arabia, and against the Russian and Iranian interests in Syria, may reveal
another unseen plan. Or at least the only feasible way any nation totally dependent on oil exports
might survive in tact. Washington likes to make religion the source of all conflict, or Vladimir
Putin one, but the reality is, Saudi Arabia is "probably" running out of gas.
"... A recent WikiLeaks revelation cited a warning from a senior Saudi government oil executive telling that the kingdom's crude oil reserves may have been overstated by as much as 300bn barrels, or by nearly 40%!" the American political analyst underscores. ..."
"... "Where Americans' interests are concerned, while President Obama has been parlaying trendy terms like 'renewable energy' and his supposed climate change agenda, the fact is petroleum still powers 96% of all transportation in America," Butler emphasizes. ..."
"... To paraphrase the old song, oil makes the world go round… ..."
A recent WikiLeaks revelation cited a warning from a senior Saudi government oil executive
telling that the kingdom's crude oil reserves may have been overstated by as much as 300bn barrels,
or by nearly 40%!" the American political analyst underscores.
Butler refers to a phenomenon called "peak oil." According to M. King Hubbert's theory, peak oil
is the point in time when the maximum rate of extraction of petroleum is reached and the crude capacity
will only decline.
Whether one likes it or not, peak oil has been reached, the analyst underscores.
However, while the global oil reserves are decreasing steadily, Riyadh has been pumping its crude
faster than anyone.
And here is the root cause of Saudi Arabia's warmongering. To maintain its
status quo, the Saudi kingdom has established an alliance with
Turkey, planning to seize
Syria and Iraq's oil fields.
Still, it's only half the story, since the global economy also remains petroleum-centered.
"Where
Americans' interests are concerned, while President Obama has been parlaying trendy terms like 'renewable
energy' and his supposed climate change agenda, the fact is petroleum still powers 96% of all transportation
in America," Butler emphasizes.
To paraphrase the old song, oil makes the world go round…
The question then arises, whether we are on the doorstep of new "energy wars."
"... Seems to be the possibility of a decrease of 200K-400K in one state over a two year period is noteworthy. ..."
"... I think that ND production could decline to 800 kb/d by year-end only if very few new wells are drilled and completed. ..."
"... I actually expect ND rig count and completion activity to rebound in the second half of the year. Therefore, oil production is unlikely to drop to 800 kb/d, in my view. ..."
Dennis: Not to steal your thunder concerning your post, but the last two months' ND data indicate
an annualized decline of approximately 30%.
Way too early to tell, but if that rate held up throughout 2016, by year end ND production
would be in the low 800K range, by my math at least.
If that occurs, I question whether the 12/14 peak could be surpassed. I suppose if operators
work through their DUC inventories this year, assuming prices rebound enough, 800K range is out
of question, but I think below 1 million is very likely.
Seems to be the possibility of a decrease of 200K-400K in one state over a two year period
is noteworthy.
I think that ND production could decline to 800 kb/d by year-end only if very few new wells
are drilled and completed.
Theoretically, the December 2014 peak could be surpassed, but only several years from now,
and only if oil prices stay at relatively high levels (above $70) for at least 2-3 years.
I actually expect ND rig count and completion activity to rebound in the second half of
the year. Therefore, oil production is unlikely to drop to 800 kb/d, in my view.
This author was probably one year early in his forecasts, but the direction was right -- we might
face oil shortages in 2017.
Notable quotes:
"... "In permitting low oil prices, the Saudis seek to bring the market back into equilibrium. At present, our calculation of break-even system-wide is in the $85–$100 a barrel range on a Brent basis." ..."
Low oil prices today may be setting the world up for an oil shortage as early as 2016. Today we
have just 2% more crude oil supply than demand and the price of gasoline is under $2.00/gallon in
Texas. If oil supply falls too far, we could see gasoline prices doubling within 18 months. For a
commodity as critical to our standard of living as oil is, it only takes a small shortage to drive
up the price.
On Thanksgiving Day, 2014 Saudi Arabia decided to maintain their crude oil output of approximately
9.5 million barrels per day. They've taken this action despite the fact that they know the world's
oil markets are currently over-supplied by an estimated 1.5 million barrels per day and the severe
financial pain it is causing many of the other OPEC nations. By now you are all aware this has caused
a sharp drop in global crude oil prices and has a dark cloud hanging over the energy sector. I believe
this will be a short-lived dip in the long history of crude oil price cycles. Oil prices have always
bounced back and this is not going to be an exception.
To put this in prospective, the world currently consumes about 93.5 million barrels per day of
liquid fuels, not all of which are made from crude oil. About 17% of the world's total fuel supply
comes from natural gas liquids ("NGLs") and biofuels.
One thing that drives the Bears opinion that oil prices will go lower during the first half of
2015 is that demand does decline during the first half of each year. Since most humans live in the
northern hemisphere, weather does have an impact on demand. I agree that this fact will play a part
in keeping oil prices depressed for the next few months. However, low gasoline prices in the U.S.
are certain to play a part in the fuel demand outlook for this year's vacation driving season.
Brent oil prices are now hovering around $60 a barrel. In my opinion, this is quite a bit lower
than Saudi Arabia thought the price would go and may lead to an "Emergency" OPEC meeting during the
first quarter. But for now, I am assuming that Saudi Arabia is willing to let the other OPEC members
suffer until the next scheduled OPEC meeting in June.
The commonly held belief is that Saudi Arabia is doing this to put a stop to the rapid growth
of production from the U.S. shale oil plays. Others believe it is their goal to crush the Russian
and Iranian economies. If the oil price remains at the current level for a few months longer it will
do all of the above.
My forecast models for 2015 assume that crude oil prices will remain depressed during the first
quarter, then slowly ramp up and accelerate as next winter approaches. I believe that by December
we will see a much tighter oil market and significantly higher prices. In a December 24, 2014 article
in The National, Steven Kopits managing director of Princeton Energy Advisors states that, "In
permitting low oil prices, the Saudis seek to bring the market back into equilibrium. At present,
our calculation of break-even system-wide is in the $85–$100 a barrel range on a Brent basis."
Mark Mobius, an economist and regular guest on Bloomberg TV recently said he sees Brent rebounding
to $90/bbl by the end of 2015.
Since 2005, only North America has been able to add meaningful crude oil supply. Outside of Canada
and the United States (including the Gulf of Mexico), the rest of the world's crude oil production
netted to a decline of a million barrels per day from December, 2010 to December, 2013. More than
half of the OPEC nations are now in decline. We've been able to supplement our fuel supply during
the last ten years with biofuels, but that is limited since we need the farmland for food supply.
I believe the current low crude oil price could be overkill and result in the next "Energy Crisis"
by early 2016. Enjoy these low gasoline prices while they last.
The upstream U.S. oil companies we follow closely are all announcing 20% to 50% cuts in capital
spending for 2015. We will start seeing the impact on supply at the same time the annual increase
in demand kicks in. Our model portfolio companies are all expected to report year-over-year increases
in production, but at a much slower pace than the last few years.
The current market turmoil has created a once in a generation opportunity for savvy energy
investors.
Whilst the mainstream media prints scare stories of oil prices falling through the floor
smart investors are setting up their next winning oil plays.
A study released by Credit Suisse two weeks ago shows that U.S. independents expect capital-expenditure
(Capex) cuts of one-third against production gains of 10 per cent next year. This would imply production
growth of 600,000 bpd of shale liquids, and perhaps another 200,000 bpd from Gulf of Mexico deepwater
projects. At the same time, U.S. conventional onshore production continues to fall. I have seen estimates
of 500,000 to 700,000 bpd declines within twelve months. If these forecasts are accurate, U.S. oil
production growth would be barely positive next year and headed for a material downturn in 2016.
North American unconventionals (oil sands, shale and other tight formations) have been almost
all of net global supply growth since 2005. If unconventional growth grinds to zero and conventional
growth is falling outright, the supply side heading into 2016 looks highly compromised. At today's
oil price, only the "Sweet Spots" in the North American Shale Plays and the Canadian Oil Sands generate
decent financial returns to justify the massive capital requirements needed to continue development.
Global deepwater exploration is rapidly coming to a halt.
Were demand growth muted, this might not matter. Demand for liquid fuels goes up year-after-year.
It even increased in 2008 during the "Great Recession" and ramped up sharply during 2009 and 2010
despite a sluggish global economy. Low fuel prices are increasing demand today and my guess is that,
with U.S. GDP growth now forecast at 5% in 2015, we could see demand for fuels increase by close
to 1.5 million barrels per day this year. The current IEA forecast is for oil demand to increase
by 900,000 bpd in 2015.
If this plays out, the oil markets will be heading into a significant squeeze in the first half
of 2016.
The last extended period of low oil prices was 1985 to 1990. In 1985, when oil prices collapsed
similar to what's happening now, the world had 13 million bpd of spare capacity, with 7 million bpd
in Saudi Arabia alone. OPEC was well-positioned to comfortably meet any increase in demand.
Today, just about all of the world's discretionary spare capacity resides in Saudi Arabia and
amounts to an estimate 2 million bpd. Lou Powers, an EPG member and author of "The
World Energy Dilemma," has said that Saudi Arabia will have difficulty maintaining production
at over 10 million bpd for an extended period. If we do swing to a supply shortage, Saudi Arabia
may find itself in the position of needing to run the taps full out for much of 2016. In such an
event, the world will be headed right back into an oil shock and we will see much higher oil prices
than $100/bbl.
The oil price may have finally bottomed out, the International Energy Agency (IEA) said Friday, noting
its "remarkable recovery" over recent weeks.
In its monthly report, the IEA said talk among oil
producers to freeze production amounts to "a first stab at co-ordinated action" with the presumed
aim of pushing oil up to US$50 a barrel, compared with about US$40 now.
Among other factors restraining oil supply the IEA said that Iran's return to the market had been
"less dramatic than the Iranians said it would be".
The bank said it expects Brent prices to average US$39 a barrel in 2016
and US$60 a barrel in 2017, down from its previous forecasts of US$45 and
US$62 a barrel respectively.
Goldman also trimmed its 2016 West Texas
Intermediate (WTI) price forecast by US$7 to US$38 a barrel, and its 2017
price forecast by US$2 to US$58 a barrel.
Predicting a slower recovery into next year and sharper oil production
declines in 2016, the bank said it does not foresee production hitting
previous peaks until mid-2018.
"... Bondholders are paying dearly for backing a shale boom that was built on high-yield credit. Since the start of 2015, 48 oil and gas producers have gone bankrupt owing more than US$17 billion, according to law firm Haynes and Boone. Fitch Ratings Ltd predicts US$70 billion of energy, metal and mining defaults this year, and notes that US$77 billion of energy bonds are bid below 50 cents, according to a note Thursday. ..."
Investors are facing US$19 billion in energy defaults as the worst oil crash in a generation leaves
drillers struggling to stay afloat.
The wave could begin within days if Energy XXI Ltd, SandRidge
Energy Inc. and Goodrich Petroleum Corp. fail to reach agreements with creditors and shareholders.
Those are three of at least eight oil and gas producers that have announced missed debt payments,
triggering a countdown to default.
"Shale was a hot growth area and companies made the mistake of borrowing too much," said George
Schultze, founder and chief investment officer of Schultze Asset Management in New York, which has
been betting against several distressed energy companies.
"It's amazing that so many people were willing to lend them money. Many are going to file for
bankruptcy, and bondholders and equity are going to get wiped out en masse."
Bondholders are paying dearly for backing a shale boom that was built on high-yield credit. Since
the start of 2015, 48 oil and gas producers have gone bankrupt owing more than US$17 billion, according
to law firm Haynes and Boone. Fitch Ratings Ltd predicts US$70 billion of energy, metal and mining
defaults this year, and notes that US$77 billion of energy bonds are bid below 50 cents, according
to a note Thursday.
A representative at Energy XXI declined to comment. Representatives for SandRidge and Goodrich
didn't respond to requests seeking comment.
"Absent a material improvement in oil and gas prices or a refinancing or some restructuring of
our debt obligations or other improvement in liquidity, we may seek bankruptcy protection," Energy
XXI said in a March 7 public filing.
Goodrich Petroleum is asking shareholders and bond investors to approve a restructuring deal that
would convert its unsecured debt and preferred shares into common stock. For the plan to work, shareholders
must approve it at a March 14 meeting and enough bondholders need to participate by the March 16
exchange deadline.
"Absent a successful completion of the recapitalisation plan, the company will have no alternatives
other than to seek protection through the bankruptcy courts," Walter Goodrich, chairman and chief
executive officer, said on a March 9 conference call.
"... Not an expert on Canada drilling but the production numbers won't be that impressive in 6 months as I understand this is the time they suppose to be drilling. ..."
"... AND since US + Canada are the ones that been keeping world production up we all need to hope for some serious Iran drilling in the coming months (won't happen though). Price spike here we come my and my guess this is in August/September. ..."
Although the overall decline in oil rigs is slowing, key tight oil
basins have lost 10 oil rigs.
Also note a significant decline in horizontal rigs.
Horizontal rigs drilling for oil:
– down from 311 to 301 for the week.
– down 120 units (-28.5%) from the end of 2015
– down 814 units (-73%) from the peak on November 26, 2014
Canadian Rig Count is down 31 rigs from last week to 98, with oil rigs down 22 to
28, and gas rigs down 9 to 70.
Canadian Rig Count is down 122 rigs from last year at 220, with oil rigs down 57, and gas rigs
down 65.
Not an expert on Canada drilling but the production numbers won't be that impressive in 6 months
as I understand this is the time they suppose to be drilling.
AND since US + Canada are the ones that been keeping world production up we all need to hope for
some serious Iran drilling in the coming months (won't happen though). Price spike here we come
my and my guess this is in August/September.
Everyone will be like: I thought we had a surplus? WTF happened?
Based on the latest NDIC data, total oil production in North Dakota fell to 1122 kbo/d in January,
again a monthly drop of 30 kbo/d. This decline was slightly higher than I expected. The number of
new wells producing dropped to 70.
I have added 2 tabs in the above presentation; one that shows
the top operators, and another one that shows the gas and water production that is produced together
with the oil, in North Dakota. By using the arrows you can browse through the 5 tabs.
Drilling activity has continued to drop sharply during the last months. There were 88 wells spudded
in December, 61 in January, and based on preliminary data it looks like just 30 wells were spudded
in February. This sharp drop surprised me, as the drop is even more steep than the drop in rigs.
This indicates that the drilling efficiency has dropped again these months.
"... If consumption is 10 million metric tons burned each day, it is 3,652,500,000 tonnes per year consumed by the gaping maws of industry to allow civilization be in the gluttony mode, with half of it gone, 150,000,000,000 tonnes to go, then there is a fifty year supply in the ground and under the seas and oceans. ..."
"The two basic factors of the world's oil supply are (1) geologic (discoveries) and (2) economic
(distribution). Petroleum geologists have done such a good job of finding oil that it looks as
easy as growing crops, and our engineers deliver the petroleum like clockwork. Consequently, the
public and many planners consider global distribution to be the only supply problem and attribute
all price swings to simple economics. They erroneously ignore critical long-term geological facts
and assume that cash spent = oil found. This premise is invalid where no oil exists or where prospects
are poor. Most people are unaware that the global quality of geological/oil prospects has declined
so much that the amount of new oil found per wildcat well has dropped 50% since a 1969 peak. Discoveries
of the most critical but easiest to find giant fields (each with over 500 million bbl of recoverable
oil) are now stalled at 315 known worldwide. We are simply no longer finding enough new crude
oil to replace the world's huge consumption of 20 billion bbl (840 billion gal) per year."
2,200,000,000,000/7.3=301,369,863,014 metric tons
of total oil extracted, yet of be extracted, past production and future production.
If consumption is 10 million metric tons burned each day, it is 3,652,500,000 tonnes per year
consumed by the gaping maws of industry to allow civilization be in the gluttony mode, with half
of it gone, 150,000,000,000 tonnes to go, then there is a fifty year supply in the ground and
under the seas and oceans.
The metric system is of an advantage when calculating the numbers, IMO.
Thanks to Robert Wilson for the links to L.F. Ivanhoe's findings and conclusions, appreciate
it.
Global debt has grown some $57 trillion since the collapse of Lehman Brothers in 2008, reaching
a back-breaking $199 trillion in 2014, more than 2.5 times global GDP, according to the McKinsey
Global Institute. Servicing these debts will most likely become increasingly difficult over
the coming years, especially if growth continues to stagnate, interest rates begin to rise,
export opportunities remain subdued, and the collapse in commodity prices persists.
Much of the concern about debt has been focused on the potential for defaults in the eurozone.
But heavily indebted companies in emerging markets may be an even greater danger. Corporate
debt in the developing world is
estimated to have reached more than $18 trillion dollars, with as much as $2 trillion of it
in foreign currencies. The risk is that – as in Latin America in the 1980s and Asia in the
1990s – private-sector defaults will infect public-sector balance sheets.
If global growth stagnates, interest rates won't rise by much. So high interest
rates and low GDP growth is not a very realistic scenario. Very poor monetary policy could accomplish
it (like Volcker in the 80s), but we may have learned something since then about monetary policy.
Chinese crude imports hit a record of 8 million b/d in February despite severe economic
problems and contracting imports and exports. One reason for the surge may have been the
extremely low oil prices in January which attracted more buying for strategic stocks and to
refine for exports. China's small independent refiners were only recently allowed to import oil
for their needs rather than procuring it domestically.
"... A US judge ordered Iran to pay over $10 billion in damages to families of victims who died on September 11, 2001 – even though there is no evidence of Tehran's direct connection to the attack. The same judge earlier cleared Saudi Arabia from culpability. ..."
"... The default judgement was issued by US District Judge George Daniels in New York on Wednesday. Under the ruling, Tehran was ordered to pay $7.5 billion to 9/11 victims' families, including $2 million to each victim's estate for pain and suffering, and another $6.88 million in punitive damages. Insurers who paid for property damage and claimed their businesses were interrupted were awarded an additional $3 billion in the ruling. ..."
"... Saudi Arabia was legally cleared from paying billions in damages to families of 9/11 victims last year, after Judge Daniels dismissed claims that the country provided material support to the terrorists and ruled that Riyadh had sovereign immunity. Saudi attorneys argued in court that there was no evidence directly linking the country to 9/11. ..."
"... "absurd and ridiculous." ..."
"... "I never heard about this ruling and I'm very much surprised because the judge had no reason whatsoever to issue such a ruling… Iran never took part in any court hearings related to the events of September 11, 2001," ..."
"... "Even if such an absurd and ridiculous decision has been made, the charges simply hold no water because Iran has never been mentioned at any stage of the investigation and the trials that followed." ..."
"... While Sheikholeslam argued that Iran didn't take part in related hearings, that lack of participation may have contributed to the decision. A default judgment is typically issued when one of the parties involved in a case does not respond to court summons or appear in court to make their case. ..."
"... "advice and training" ..."
"... "provided material support" ..."
"... "direct support" ..."
"... "There was no direct connection between Iran and the attacks of September 11." ..."
"... "The people who committed those terrorist attacks were neither friends nor allies of Iran," ..."
"... "They were our sworn enemies, members of Al-Qaeda, which considers Iran as their enemy. Fifteen out of the 19 terrorists were Saudi citizens, which happens to be America's best friend. The remaining four terrorists lived in Saudi Arabia and enjoyed Saudi support. Therefore the perpetrators of the 9/11 attacks had nothing to do with Iran." ..."
A US judge ordered Iran to pay over $10 billion in damages to families
of victims who died on September 11, 2001 – even though there is no evidence
of Tehran's direct connection to the attack. The same judge earlier cleared
Saudi Arabia from culpability.
The default judgement
was issued by US District Judge George Daniels in New York on Wednesday.
Under the ruling, Tehran was ordered to pay $7.5 billion to 9/11 victims' families,
including $2 million to each victim's estate for pain and suffering, and another
$6.88 million in punitive damages. Insurers who paid for property damage and
claimed their businesses were interrupted were awarded an additional $3 billion
in the ruling.
The ruling is noteworthy particularly since none of the 19 hijackers on September
11 were Iranian citizens. Fifteen were citizens of Saudi Arabia, while two were
from the United Arab Emirates, and one each from Egypt and Lebanon.
Saudi Arabia was legally cleared from paying billions in damages to families
of 9/11 victims last year, after Judge Daniels dismissed claims that the country
provided material support to the terrorists and ruled that Riyadh had sovereign
immunity. Saudi attorneys argued in court that there was no evidence directly
linking the country to 9/11.
In response to the latest ruling, Hossein Sheikholeslam, a senior aide to
Iran's parliamentary speaker, called the decision "absurd and ridiculous."
"I never heard about this ruling and I'm very much surprised because
the judge had no reason whatsoever to issue such a ruling… Iran never took part
in any court hearings related to the events of September 11, 2001," he
told
Sputnik. "Even if such an absurd and ridiculous decision has been made,
the charges simply hold no water because Iran has never been mentioned at any
stage of the investigation and the trials that followed."
While Sheikholeslam argued that Iran didn't take part in related hearings,
that lack of participation may have contributed to the decision. A default judgment
is typically issued when one of the parties involved in a case does not respond
to court summons or appear in court to make their case.
Judge Daniels found that Iran failed to defend itself against claims that
it played a role in 9/11. Iran believes the lawsuit is unnecessary because it
says it did not participate in the attack.
In the US, Tehran's role in 9/11 has been debated heavily over the years.
The
9/11 Commission Report stated that some hijackers moved through Iran and
did not have their passports stamped. It also stated that Hezbollah, which the
US designates as a terrorist organization supported by Iran, provided "advice
and training" to Al-Qaeda members.
In a
court document filed in 2011 regarding the latest case, plaintiffs claimed
Hezbollah "provided material support" to Al-Qaeda, such as facilitating
travel, plus "direct support" for the 9/11 attacks. As a result, the
plaintiffs argued Iran was liable.
However, the commission report itself found no evidence to suggest Iran was
aware of the 9/11 plot, and suggested the possibility that if Hezbollah was
tracking the movements of Al-Qaeda members, it may not have been eyeing those
who became hijackers on 9/11.
While the report suggested further investigation into the issue, President
George W. Bush has said, "There was no direct connection between Iran and
the attacks of September 11."
Iran, inhabited mostly by Shia Muslims, has also denied any connection to
Al-Qaeda – a militant Sunni group – and cooperation between the two has been
questioned due to religious differences. Al-Qaeda views the Shia as heretics,
for example.
"The people who committed those terrorist attacks were neither friends
nor allies of Iran," Iran Press Editor-in-Chief Emad Abshenas told Sputnik.
"They were our sworn enemies, members of Al-Qaeda, which considers Iran
as their enemy. Fifteen out of the 19 terrorists were Saudi citizens, which
happens to be America's best friend. The remaining four terrorists lived in
Saudi Arabia and enjoyed Saudi support. Therefore the perpetrators of the 9/11
attacks had nothing to do with Iran."
How the case moves forward after Daniels' ruling is unclear. According to
Bloomberg, it can be very hard to obtain damages from another country, but plaintiffs
might try to do so by targeting Iranian funds frozen by the US.
New Mexico regulators have accused a Texas company of trespassing and causing a spill at a
disposal site used by the oil and gas industry.
The State Land Office delivered a letter Wednesday to Midland, Texas-based Siana Operating
ordering it to obtain an entry permit to remediate damage at the waste-water injection well it
operates on state trust land in Lea County. The letter also threatened "any and all criminal and
civil actions available" if requirements are not met. The company's lease to use the facility had
expired, the agency said.
Separately, the state Oil Conservation Division issued an emergency order late Wednesday for
Siana to temporarily shut off all of its wells, both for oil production and water disposal, until
a hearing can be held on possible violations. State records list the company as an operator for
at least 11 drilling locations.
A Siana representative said the company was aware of the problem and was still considering its
response.
The State Land Office distributed photographs taken on Tuesday at the disposal well site 20 miles
southwest of Eunice that show an unlined pool of water and oil on the ground, and traces of
liquids on the ground elsewhere.
New Mexico's state trust lands support about 60 similar commercial sites for disposing of
waste-water from oil and gas drilling.
The letter from the State Land Office to Siana described earlier orders for the company to cease
commercial operations at the site near Eunice, including correspondence in February. The State
Land Office said Siana has not paid the state for its lease at the site since December 2011 and
last reported activity there in June 2015.
State Land Commissioner Aubrey Dunn said in a statement that problems at the water injection site
were brought to the state's attention by a Lea County rancher who also leases trust lands.
Patrick Padilla, assistant commissioner for mineral resources at the State Land Office, said the
agency was taking steps to block access to the site to prevent more trucks from delivering oily
water.
I'm always interested in the stuff you have to hunt around to find reported. Someone on a web
board earlier mentioned a pipeline bombed in Nigeria. Didn't see it anywhere, very sporadically
reported, apparently 300kbpd there, in reading that I found the pipeline from Kurdistan to Turkey
has been out for three weeks, apparently up to 600kbpd there.
If it was something about the glut, bloomberg would be all over it. This, zip. I used to wonder
about conspiracies, but I started following a few bloomberg reporters late last year and they
are some of the laziest SOBs I'd ever encountered. The amount of copy/paste and rehash the prevailing
sentiment without checking a few facts was astonishing. Talk about slobs, it really was about
getting all the current keywords and search descriptions into the article and particularly the
first paragraph and not much else.
Thanks. My feelings, exactly. But at the same time, what to expect from them? Is not Bloomberg
to a certain extent a GS propaganda arm ? May we need to lower our expectations.
Some grains of truth with additional effort still can be extracted from the piles of lies and
lazy, incompetent reporting (aka rehashing somebody else talking points).
Funny, but this is a kind of "Back in the USSR" situation. Our feelings are probably 1:1
correspond to the feelings of Soviet citizens about the USSR government economic reporting
:-).
7) Finally, the graphic below
from Rystad energy shows how it sees shale costs showing substantial improvements, and across
various shale plays. It projects that wellhead breakeven prices have dropped by more than 40%
between 2013 and 2015:
1,927 kWh per ton, or 0.96 kWh per pound, of coal
99 kWh per Mcf (1,000 cubic feet) of natural gas
578 kWh per barrel, or 13.76 kWh per gallon, of petroleum
317kg is 699.3 pounds of CO2 or 2447.5 pounds, when an amount of oil is generated to electricity
equal to the amount of coal used, 3.5 barrels to 2000 lbs of coal.
CO2 emissions per short ton of coal: Complete combustion of 1 short ton (2,000 pounds) of this
coal will generate about 5,720 pounds (2.86 short tons) of carbon dioxide.
Natural Gas 122 pounds of carbon dioxide/1000 cu.ft
http://cdiac.ornl.gov/pns/faq.html
so Natural Gas equivalent of 1 ton of coal equals 2306 pounds of CO2
By eliminating the use of natural gas and oil, coal can be burned to produce the usable energy,
more than likely electricity. The emissions will be close to the same amounts. Purdy good sarcasm
there.
Would you rather have a ton of coal or 3.5 barrels of oil?
3.5 barrels of oil will cost you $129.50.
A ton of good coal will be about 52 dollars in today's world of money. $16.50 for Wyoming brown
coal, good old Oklahoma crude refined into diesel and gasoline is the preferred choice, not Wyoming
brown coal. Just the way it is in the real world.
You have to pay 77.50 usd for the convenience. It is much less trouble to buy gas than to convert
coal to a usable energy for personal transportation, so you'll pay the extra money for the ease
of use and the better energy source, crude oil. You demand to use gasoline and reject coal except
to be burned at power plants to generate electricity.
Determine the amount of coal used in by the billions of tons, you can estimate the amount of
tonnage of CO2 emitted. One billion tons of burned coal will emit 2,860,000,000 tons of CO2 into
the atmosphere. 7.3 billion tons consumed worldwide each year, or 20,878,000,000 tons of CO2 emitted
into the atmosphere in a year's time.
Pollutants are going to exist when coal and fossil fuels are used to make the machine go, civilization
will collapse without fossil fuels.
That's when overshoot sets in, not enough coal and oil will take its toll. Meanwhile, the post-modern
era keeps chugging along burning all the coal and oil it can.
This is a brief excerpt from a REUTER'S article now two years old.
xxxx
Saudi power generators pay about $4 per barrel for their oil, industry data show.
That works out at a running cost of $0.006 per kilowatt hours (kWh) in 2010, excluding all
other capital, fixed and operating costs.
But accounting for the opportunity cost of exporting crude oil at international prices of $113
per barrel raises the economic cost of oil-fired power generation to $0.13 per kWh, ignoring all
non-fuel costs.
A simplified solar cost calculator developed by the U.S. Department of Energy's National Renewable
Energy Laboratory (NREL) estimates the cost of solar power at $0.07 per kWh under Saudi conditions.
That assumes a capacity factor of 33 percent as can be expected in sunnier locations in southern
Saudi Arabia and a full capital cost of $1.5 per watt, a conservative estimate for utility-scale
installations.
xxxx
So they are already building solar farms, not very many yet, with the juice priced competitively
with oil at somewhere around fifty to sixty bucks. New solar farms will get cheaper. Oil will
be going up.
It's a NO BRAINER, run the ac on sun power, and sell that oil!!!! Once it goes up again, of
course.
They may be holding off waiting for the price of solar to fall even farther. That's why I don't
have a personal system yet, it is cheaper on me to buy grid juice from one year to the next and
wait for panel and inverter prices to go down some more, using my generators for emergency backup.
"99 kWh per Mcf (1,000 cubic feet) of natural gas"
Small technical clarification about NG kWh/MCF. That is about 34% net thermal/kWh conversion
efficiency, which would apply to a conventional old-school steam turbine natural-gas power plant.
You just don't see those built anymore. Just about everyone has gone to CCGT (Combined Cycle Gas
Turbine) plants for new generating capacity. which are closer to 60% conversion efficiency.
Almost all coal plants are more conventional type pure steam power plants and don't use CCGT
technology. The newer coal plants do have some efficiency improvements, though, including heat
recovery and using super-critical operating steam pressures. But all the new air pollution equipment
for coal also takes an efficiency toll on these plants that NG plants just don't have to pay.
That CCGT efficiency upgrade really changes the equations cited for converting "equivalent"
MCF of NG to tons of coal for generating the same electrical energy.
"... We hated to disappoint all those hopeful condensate exporters last year, but the handwriting was on the wall. Regardless of unfettered export regs, if it is worth more here than it is there, then you ought to keep it here. Only about 100 Mb/d of newly legal condensate exports left U.S shores in 2015, because the economics were upside down. A harbinger of things to come for crude exports? Absolutely. ..."
5. It is nice that condensate exports are legal, but the economics of condensate exports
don't make much sense.
We hated to disappoint all those hopeful condensate exporters last year, but the handwriting
was on the wall. Regardless of unfettered export regs, if it is worth more here than it is there,
then you ought to keep it here. Only about 100 Mb/d of newly legal condensate exports left U.S
shores in 2015, because the economics were upside down. A harbinger of things to come for crude
exports? Absolutely.
"... Turkey announced today that the Kurdish pipeline should be back online
in about a week. There's been a major mine-sweeping effort going on there since
the break. ..."
"... Turks can fix the pipeline but Turks cannot support financially and politically
the whole Iraq's Kurdistan entity where the oil is coming from. You still got eat
even when the oil is $30 :), so the Kurds are doing bidding process on who will
help pay the most. Iraqis central government has an offer dangling to take care
of Kurdish government employees in exchange for re-routing that kurdish oil through
central government for sale. ..."
"... But Turks have way bigger problems than one pipeline. They are in real
bind and are pushed real hard from both Russians and Americans. When it is all said
and done they could be in process of being dismembered. ..."
"... The only leverage that Turks have is over Euro elite that still needs them
for their dirty work in ME. Notice how Ms. Markel can easily find 3 billion for
Turkey (refugees will not see a single penny of it) while last year Euro pensioners
in Greece/Spain/Italy/France all they got is austerity. ..."
"... It is a class war and it has always been like that. ..."
"... The damaged pipeline is an Iraqi pipeline; it carries Iraqi oil all the
way to Ceyhan, a Turkish port on the Mediterranean. The KRG built a pipeline that
joins it at the Turkish border, so the pipeline carries Kurdish oil too. It's in
Iraq's interest to have it open but since SE Turkey is essentially a war zone that
can be hard to bring about. ..."
Turkey announced today that the Kurdish pipeline should be back online
in about a week. There's been a major mine-sweeping effort going on there
since the break.
The PKK denies blowing up the pipeline. Who knows?
Turks can fix the pipeline but Turks cannot support financially and
politically the whole Iraq's Kurdistan entity where the oil is coming from.
You still got eat even when the oil is $30 :), so the Kurds are doing bidding
process on who will help pay the most. Iraqis central government has an
offer dangling to take care of Kurdish government employees in exchange
for re-routing that kurdish oil through central government for sale.
But Turks have way bigger problems than one pipeline. They are in
real bind and are pushed real hard from both Russians and Americans. When
it is all said and done they could be in process of being dismembered.
The only leverage that Turks have is over Euro elite that still needs
them for their dirty work in ME. Notice how Ms. Markel can easily find 3
billion for Turkey (refugees will not see a single penny of it) while last
year Euro pensioners in Greece/Spain/Italy/France all they got is austerity.
It is a class war and it has always been like that.
The damaged pipeline is an Iraqi pipeline; it carries Iraqi oil all
the way to Ceyhan, a Turkish port on the Mediterranean. The KRG built a
pipeline that joins it at the Turkish border, so the pipeline carries Kurdish
oil too. It's in Iraq's interest to have it open but since SE Turkey is
essentially a war zone that can be hard to bring about.
I suspect that Iraqi Kurdistan could support itself from sale of the
oil they produce if they were allowed to just sell it and not have the money
come from Baghdad–and if they straightened out their own corrupt economy.
Executives of the Woodlands-based oil explorer had said last month it would reduce its capital
spending by half this year amid low oil prices and evaluate its staffing needs as it reduces
activity.
... ... ...
After an 18-month oil bust, energy layoffs are nothing new. Oil producers, their suppliers,
service providers and equipment makers, along with refineries and pipeline operators, have so far
cut more than 320,000 jobs worldwide, according to Houston consultancy Graves & Co., which has
tracked industry layoffs since the downturn began.
Within the United States, Anadarko produces oil and gas in Colorado's DJ Basin, in the Permian
Basin in West Texas, in the Gulf of Mexico and elsewhere. After ConocoPhillips, it's the
second-largest independent U.S. oil company, which means it doesn't have its own refining assets
like Chevron Corp. and Exxon Mobil Corp.
... ... ...
It's about the same size reduction that Apache Corp. made last year. Houston-based Apache cut
more than 1,000 employees, or 20 percent of its workforce, through direct reductions and asset
sales in 2015, which included its liquefied natural gas assets in Canada and Australia and its
upstream unit in Australia.
David Walters · Houston Community College
All that bold talk a year ago how Houston's economy is so much more diverse is facing its
first real test.
Glenn Gustafson · University of Houston
Trouble in the oil bidness always means tough times for Houstonians. Best wishes to those
who have/will lose jobs because of this.
Douglas James Fusilier · Spring, Texas
Thank God I'm still holding on. I feel for all my colleagues who have lost jobs in this
downturn.
Terry Smith · Publisher/General Manager at Amazing Publishers
Fourth largest oil company and they only have about 6,000 employees?
"... The most significant event of the last decade regarding crude oil has been the rise of U.S. shale oil as a credible and long-lasting competitor to the OPEC. The shale oil boom has led to an almost doubling of production in the U.S. in the last 10 years. Booming oil prices, easy credit, consistently rising demand and improved technological methods of fracking led to the current production rate, which would have increased further had OPEC cut their production. ..."
Quite simply, the Saudis want to maintain their market share, but their means to control that
are dwindling.
The whole internet is jam-packed with analysis portraying Saudi Arabia and OPEC as villains for
the oil price collapse. On a closer look, however, the Saudi's could have taken no reasonable
steps to avert this situation. This is a transformational change that will run its full course,
and the major oil producing nations will have to accept and learn to live with lower oil prices
for the next few years.
Why the Saudi's are not to blame
(Click to enlarge)
As seen in the chart above, barring the period during the last
supply glut, the Saudi's have more or less maintained constant oil
production, increasing production only modestly at an average of
roughly 1 percent per year.
The most significant event of the last decade regarding crude oil has been the rise of U.S.
shale oil as a credible and long-lasting competitor to the OPEC. The shale oil boom has led to an
almost doubling of production in the U.S. in the last 10 years. Booming oil prices, easy credit,
consistently rising demand and improved technological methods of fracking led to the current
production rate, which would have increased further had OPEC cut their production.
"... All of this is to say that the level of effort and the focus of Western states in Libya, at least as regards ISIS, are on strict counterterrorism as opposed to creating conditions in which competing claimants to governing legitimacy can work out a compromise. In the meanwhile, the competing governing factions will have to defend themselves against not only other claimants to legitimacy but also ISIS and other smaller groups that have begun to attack Libyan oil production and export facilitates with increasing regularity. ..."
"... The recent attack in neighboring Tunisia also points to the problem of ISIS presence in Libya not only helping to continue the instability and political stalemate there but also spreading unrest further in Northern Africa. ..."
Sarah Emerson, Managing Principal, Petroleum & Alternative Fuels | Energy Security Analysis Inc.
(ESAI)
... ... ...
While there are ongoing negotiations, or attempts at negotiations pushed by Washington and key
European states, so far it does not look at all hopeful. In the meanwhile, the efforts of the West
are focused on two issues. First is conducting strikes against ISIS leaders and key operatives who
might be either planning on targeting Western targets or who might be consolidating control over
parts of Libya. Second is keeping refugees from flowing into southern Europe (whether they are Libyans
or Africans who are taking advantage of the lack of governance in Libya to launch from its shores).
News reports indicate that the United States, France, the United Kingdom and Italy all have Special
Forces on the ground in Libya largely to support intelligence gathering and targeting ISIS cells
or leaders. The recent U.S. airstrikes two weeks ago against ISIS leaders and a training camp in
Libya may or may not reflect this small ground presence, but the attacks indicate that Washington
is focusing on elements of the terrorist group that might be planning attacks on Western targets.
The news information on the French aircraft carrier also hints that any strikes that Paris may carry
out will be against those potentially plotting against French targets. All of this is to say that
the level of effort and the focus of Western states in Libya, at least as regards ISIS, are on strict
counterterrorism as opposed to creating conditions in which competing claimants to governing legitimacy
can work out a compromise. In the meanwhile, the competing governing factions will have to defend
themselves against not only other claimants to legitimacy but also ISIS and other smaller groups
that have begun to attack Libyan oil production and export facilitates with increasing regularity.
The recent attack in neighboring Tunisia also points to the problem of ISIS presence in Libya
not only helping to continue the instability and political stalemate there but also spreading unrest
further in Northern Africa.
Sarah Emerson, Managing Principal, Petroleum & Alternative Fuels | Energy Security Analysis Inc.
(ESAI)
"... The rising clamor at home from the crashing shale sector and the banks that financed it; the resilience of Russia in spite of sanctions and its exclusion from Western capital markets; Russia's entrance into the Syrian take-down attempt having put Russia into a new position of influence in the Middle East; demands for higher prices from more and more OPEC members; Russian and Iranian resistance to demands that they agree to limit production; Kuwait refusing to limit production; Venezuela and Mexico nearing default; Ukraine melting down politically, financially, and militarily: financial tremors at home and in Europe; and the rise of Trump and Bernie as an election nears, - these factors have led Western leaders to stop suppressing the price of crude. ..."
IMHO, the rise in crude prices is evidence that the West has blinked and is giving up on its
attempt to bankrupt Russia in order to make Putin kowtow to the West.
The rising clamor at home from the crashing shale sector and the banks that financed it; the
resilience of Russia in spite of sanctions and its exclusion from Western capital markets; Russia's
entrance into the Syrian take-down attempt having put Russia into a new position of influence
in the Middle East; demands for higher prices from more and more OPEC members; Russian and Iranian
resistance to demands that they agree to limit production; Kuwait refusing to limit production;
Venezuela and Mexico nearing default; Ukraine melting down politically, financially, and militarily:
financial tremors at home and in Europe; and the rise of Trump and Bernie as an election nears,
- these factors have led Western leaders to stop suppressing the price of crude.
The commodities traders and their algos will now be allowed to manipulate up the prices. Fundamentals
of excess supply and weak demand do not matter, and have not mattered for a long time. Futures
contracts, refinery shutdowns for fires or scheduled maintenance, pipeline ruptures, and rumors
of international instability can all be used to increase crude prices.
While some investors are predicting that market expectations for oil at $50 a barrel might be
too fast, and too soon , Bill Smith, chief investment officer and senior portfolio manager at
Battery Park Capital, told CNBC the energy sector will find equilibrium by the second quarter of
2016. And it will not be pretty for those holding bearish trades.
Speaking to CNBC's " Squawk Box ", Smith said if indeed oil prices stabilize, much-battered
energy stocks will follow crude prices higher.
"It's going to be a short covering rally that rips people's faces off," said Smith. "It's going
to be ugly."
Battery Park Capital has assets under management worth $340 million. Short-selling refers
to selling an asset in the hope of buying it back at a lower price later. The recovery in oil
prices has been supported by reports suggesting that oil producers are planning to work together
to reduce excess supply in the market.
Earlier this week Reuters, citing New York-based oil industry consultancy PIRA , reported major
OPEC producers were discussing a new price equilibrium of around $50 a barrel.
Broadly, Smith was less upbeat about the U.S. economy. He said while the economy wasn't heading
into recession, it wasn't growing either.
.. View gallery
Oil market rally could 'rip people's faces …
Nick Oxford | Reuters. Investors betting on falling shares of energy companies could have their
&quo …
"We don't have the building blocks to bust out and go on a growth trajectory," he said, adding
there's no reason for runaway inflation at this point in time.
Government data showed core inflation rose 1.7 percent in the 12 months ended in January. The
U.S. Federal Reserve 's inflation target is at 2 percent.
But Smith said he doesn't see any reason why the Fed would raise interest rates just yet, even
due to currency risks.
Last December, the Fed raised interest rates from near zero percent for the first time since
2006. Following the rate hike, the dollar initially found strength against major currencies
around the world before losing some momentum earlier this year. But the move also created a major
sell-off in global stock markets in January.
The Federal Open Market Committee is due to meet next on Mar. 15 - 16.
Smith said, "Every time they even talk about raising rates, the dollar rips higher and it's just
creating chaos globally. So, I would much rather see them sit on the sidelines now."
"... A number of signs point to the decline in production continuing during the rest of 2016 unless there is an extended oil price recovery. For a start, the number of new permits to drill wells in North Dakota is at a seven year low – indicating a low appetite for drilling (more on that in a minute). Second, there were 1183 inactive wells in the state in December - about 30% above normal for this time of year. The operators have essentially abandoned these inactive wells – usually because they are losing money. Many of these inactive wells are older and had very low production rates - less than 35 b/d. Such older wells are known as "stripper" wells and their costs are long ago written off – so operators usually keep them running unless transport and maintenance costs exceed the value of the crude – i.e. prices get too low. ..."
"... The strongest indicators of a slowdown in Bakken production come in the reduction in drilling rigs operating in North Dakota and a parallel decline in the number of well completions. We'll look at the rig count first then get to completions. ..."
"... The combination of the potential tax incentive early in 2015 and the extension of the one year limit in October led to a growing backlog of DUC wells in North Dakota that is now having an impact on production forecasts ..."
"... It seems that those producers who can afford to are increasingly opting not to complete Bakken wells but instead to leave DUC wells "on the shelf" as a kind of storage play – waiting for prices to improve. ..."
"... Many smaller companies do not have the luxury of waiting and many of these are likely to be either already casualties of the price crash or living on borrowed time (see Zombies ). ..."
"... The summary chart shows that at $30/Bbl - to achieve a consistent IRR above 20% (for even the highest cost wells) - producers need to target wells with an IP of at least 1500 b/d. Looking at historic drilling and production records, NDPA found only 63 wells – concentrated in McKenzie, Mountrail and Dunn Counties that had IP rates of 1500 b/d or higher. Those 63 wells represent just 1% of the 6000 Bakken wells that would breakeven if wellhead prices were between $55 and $70/Bbl. In short the analysis makes clear that only a fraction of existing wells would breakeven or produce an acceptable IRR at today's low crude prices. ..."
"... The expectation that oil prices might remain low for a long time is rapidly sinking in for U.S. shale producers. Many smaller operators have already fallen victim to bankruptcy but now even those with a strong balance sheet are recognizing that continued drilling and production no longer make financial sense. As a result all expectations are that U.S. shale production will tumble this year (although despite the suggestion in today's title it is not quite "all over" yet). The situation on the ground in North Dakota that we have reviewed today indicates that the slowdown is gaining momentum. The extent of any decline in production is still hard to forecast accurately – clouded as it is by the unknown impact of an increase in DUCs. As 2016 progresses you can be sure that we'll be keeping a close track on the trends for you. ..."
For the past, year many shale oil producers have defied the expectations of many and kept output
at or near to record levels in the face of falling oil prices and much tougher economics. Improvements
in productivity, cost cutting and a concentration on "sweet spot" wells that generate high initial
production (IP) rates have all helped cash strapped producers survive. But with oil prices so far
in 2016 stuck in the $35/Bbl and lower range and with the worldwide crude storage glut still weighing
on the market – producers are finally pulling back. Today we look at how increased pressure on North
Dakota producers is putting the brakes on Bakken crude production.
In December 2015, crude production in North Dakota Bakken fell by 2.5% to 1,152 Mb/d (from 1,182
Mb/d in November). That December output is down 6% from the record 1,227 Mb/d produced a year earlier
in December 2014. Lynn Helms – Director of the North Dakota Industrial Commission (NDIC) Department
of Mineral Resources commented in a February 2016 press conference that the December 2015 drop in
production was the first significant decline in North Dakota crude output not explained by other
factors such as weather. A number of signs point to the decline in production continuing during
the rest of 2016 unless there is an extended oil price recovery. For a start, the number of new permits
to drill wells in North Dakota is at a seven year low – indicating a low appetite for drilling (more
on that in a minute). Second, there were 1183 inactive wells in the state in December - about 30%
above normal for this time of year. The operators have essentially abandoned these inactive wells
– usually because they are losing money. Many of these inactive wells are older and had very low
production rates - less than 35 b/d. Such older wells are known as "stripper" wells and their costs
are long ago written off – so operators usually keep them running unless transport and maintenance
costs exceed the value of the crude – i.e. prices get too low. A third indicator of declining
producer interest in the Bakken is the large number of producing wells in North Dakota currently
being transferred (sold) by one operator to another – 697 wells as of February 17, 2016 according
to Helms. Some large producers such as Occidental Petroleum that is selling 346 wells - are leaving
the North Dakota Bakken oil patch altogether. Others that are staying in the Bakken have sold off
wells to other operators to raise cash – including Whiting Petroleum Corp (the largest Bakken producer
– selling 331 wells) and EOG Resources, grandfather of the crude-by-rail phenomenon.
The strongest indicators of a slowdown in Bakken production come in the reduction in drilling
rigs operating in North Dakota and a parallel decline in the number of well completions. We'll look
at the rig count first then get to completions. As of March 8, 2016 the rig count in North Dakota
stood at 33 – down 85% from the all time high (218) in May 2012. The green shaded area in Figure
#1 shows the North Dakota rig count since January 2013 (right axis). The number of rigs operating
hovered between 180 and 195 from January 2013 to December 2014 before dropping off a cliff from January
2015 onwards. By the end of 2015 the average rig count was down to 64 and the number fell to an average
of 52 in January 2016. The NDIC has not released the February average rig count yet – but their daily
count was down to 35 at the end of February. Just 16 producers operated those 35 rigs with only eight
companies operating more than one rig – headed by ExxonMobil affiliate XTO who still had 5 rigs and
followed by Continental Resources, Hess and Conoco Phillips running 4 each. In the past week XTO
and Hess have each dropped one more rig.
Figure #1 Source NDIC, RBN Energy (Click to Enlarge)
Turning now to completions – by which we mean when the first oil is produced through wellhead
equipment into tanks from a new well. As we have described previously – completion occurs in shale
wells after the well is drilled and the hydrocarbons are stimulated to flow by hydraulic fracturing
(see
I Cannot Complete With Your Tax Scheme). When oil prices were riding high any delays in completions
were usually practical rather than deliberate – caused by a lack of fracking crews able to complete
new wells. Producers had every incentive to complete wells to get cash flowing to help finance more
new drilling. But in an era of falling oil prices completion timing has become a big deal for
producers because waiting for a hoped for increase in prices before producing oil has become a strategy
for protecting future revenue. In North Dakota that strategy has led to a steady increase in wells
that are drilled but uncompleted (the DUCs) since the start of 2015. We previously discussed how
the North Dakota Legislature provided incentives for producers to hold off completions in the first
half of 2015 while they waited for low prices to trigger a tax break (see
Tax Scheme). Those tax incentives did not pan out due to a jump in oil prices in May 2015. However
the issue of completions in North Dakota stayed on the front burner when producers began to ask for
waivers from State mandated completions one-year after drilling (see
Incomplete).
In October 2015 the NDIC decided to issue waivers to allow producers to delay completions by up to
two years from drilling. The combination of the potential tax incentive early in 2015 and the
extension of the one year limit in October led to a growing backlog of DUC wells in North Dakota
that is now having an impact on production forecasts in 2016. Figure #1 shows NDIC data for
well completions - that have been falling (blue line left axis) and wells waiting on completion
that have been increasing since mid-2014 (red line left axis). As of the end of December 2015 there
were 945 DUC wells in North Dakota – down from an all time high of 1080 in September 2015 but 26%
higher than the 750 DUCs the previous December (2014).
It seems that those producers who can afford to are increasingly opting not to complete Bakken
wells but instead to leave DUC wells "on the shelf" as a kind of storage play – waiting for prices
to improve. A couple of weeks ago (February 27, 2016) the largest Bakken producer - Whiting
Petroleum - stated in an earnings report that they would suspend well completions in the Bakken in
April 2016 until prices rebound. In the meantime they will maintain 2 drilling rigs in North Dakota
– basically increasing their DUC inventory with no new production. Another large Bakken producer
Continental Resources announced plans in their January 2016 guidance to defer completing most Bakken
wells in 2016 - increasing DUC inventory from 135 at year-end 2015 to 195 at year-end 2016. Note
that we are just highlighting DUCs in North Dakota here but this phenomenon is widespread in the
oil shale sector and has also impacted natural gas drilling in the Northeast. The strategy is only
feasible for those production companies that have reasonably robust balance sheets and can afford
to wait before completing wells. Many smaller companies do not have the luxury of waiting and
many of these are likely to be either already casualties of the price crash or living on borrowed
time (see
Zombies). It remains to be seen to what extent large increases in DUCs during 2016 will
accelerate expected declines in output that have been forecast based on ever lower rig counts and
low prices.
The economic realities that are pushing operators to withdraw rigs and avoid completions in once
bustling plays like the Bakken are aptly illustrated by a video
presentation from the Director of the
North Dakota Pipeline Authority (NDPA) Justin Kringstad at the end of December 2015. The presentation
is an update on analysis Justin provided earlier in the year that is designed to show how lower oil
prices impact the number of wells in North Dakota that would produce an internal rate of return (IRR)
between 10 and 20% based on different drilling cost scenarios. The analysis is specific to the Bakken
but otherwise similar to the models RBN uses for production forecasting that were explained in detail
in out January 2015 Drill Down Report "It
Don't Come Easy" available to our Backstage Pass
subscribers. We are in the process of updating this analysis to reflect current drilling economics.
The chart in Figure #2 shows a summary of the NDPA's December analysis with Bakken wellhead crude
priced at $30/Bbl. That equates roughly to a West Texas Intermediate (WTI - the U.S. Domestic benchmark)
price of $35/Bbl less transportation discounts to get crude to market from North Dakota. As
of yesterday (March 8, 2016) WTI prices on the CME/NYMEX futures exchange closed at $36.50/Bbl. The
blue bars on the chart indicate the % IRR that a producer might expect based on a range of 30-day
average initial production (IP) scenarios between 400 B/d and 1500 b/d (numbers along the top of
the chart). For each IP scenario there are 3 alternate well drilling and completion cost cases -
$6 Million, $7 Million and $8 Million (indicated on the bottom axis).
Figure #2; Source: NDPA (Click to Enlarge)
As you can see the blue bars get higher from left to right as the well IP increases – because
the higher the IP rate the faster the oil revenues accrue towards the IRR. The IRR rates are also
higher when the drilling and completion costs are lower. The summary chart shows that at $30/Bbl
- to achieve a consistent IRR above 20% (for even the highest cost wells) - producers need to target
wells with an IP of at least 1500 b/d. Looking at historic drilling and production records, NDPA
found only 63 wells – concentrated in McKenzie, Mountrail and Dunn Counties that had IP rates of
1500 b/d or higher. Those 63 wells represent just 1% of the 6000 Bakken wells that would breakeven
if wellhead prices were between $55 and $70/Bbl. In short the analysis makes clear that only
a fraction of existing wells would breakeven or produce an acceptable IRR at today's low crude prices.
The expectation that oil prices might remain low for a long time is rapidly sinking in for
U.S. shale producers. Many smaller operators have already fallen victim to bankruptcy but now even
those with a strong balance sheet are recognizing that continued drilling and production no longer
make financial sense. As a result all expectations are that U.S. shale production will tumble this
year (although despite the suggestion in today's title it is not quite "all over" yet). The situation
on the ground in North Dakota that we have reviewed today indicates that the slowdown is gaining
momentum. The extent of any decline in production is still hard to forecast accurately – clouded
as it is by the unknown impact of an increase in DUCs. As 2016 progresses you can be sure that we'll
be keeping a close track on the trends for you.
"It's All Over Now" was written by Bobby
and Shirley Womack and first released by The Valentinos in 1964. The Rolling Stones had their first
number-one hit (in the U.K.) with a cover version in July 1964 – also a hit for the band worldwide.
"... As the winter '15/16 season winds down, the Northeast is set to experience lower seasonal demand, putting into question whether or not current production levels are sustainable with the amount of capacity leaving the producing states – Ohio, Pennsylvania, and West Virginia. ..."
"... This feature will look into whether or not production can find a home from the combined OH, PA, and WV "Tri-State" area, considering the seasonal swing in demand, and high storage levels reducing injection demand. It will also explore whether maxed-out outflow corridors can handle an incremental supply surplus. ..."
It seems Bentek agree with Art Berman that US or at least the NE gas production will fall by the
end of the year, just for slightly different reasons.
Risk to Northeast Production this
Summer
Wednesday, March 09, 2016 – 4:17 PM
As the winter '15/16 season winds down, the Northeast is set to experience lower seasonal demand,
putting into question whether or not current production levels are sustainable with the amount
of capacity leaving the producing states – Ohio, Pennsylvania, and West Virginia. Bentek's latest
CellCAST shows production averaging 23.5 Bcf/d for the remainder of 2016, about a 1 Bcf/d increase
from the current year-to-date average of 22.4 Bcf/d.
This feature will look into whether or not
production can find a home from the combined OH, PA, and WV "Tri-State" area, considering the
seasonal swing in demand, and high storage levels reducing injection demand. It will also explore
whether maxed-out outflow corridors can handle an incremental supply surplus.
Please continue
to read on page two for further analysis.
"... We all are living under neoliberalism , aren't we? And current fascinating developments with Bernie and Trump is nothing more than unorganized protest of shmucks against " masters of the universe " - neoliberal elite that captured Washington, DC (along with London, Paris, Berlin and other G7 capitals). And they still have quite strong fifth column in Moscow too (Yeltsin was their man) ..."
"... The revolt which BTW have little chances for success. As Orwell aptly stated, contrary to Marx delusions "the lower classes are never, even temporarily, successful in achieving their aims". ..."
"... The key idea of neoliberalism is redistribution of wealth up from shmucks to international (predominately financial) elite. So nobody care that either camel lovers or Putin lovers lose money on oil and that they are selling it below the cost. What is important that the "masters of the universe" became richer. And sustainability is provided by grabbing asset of distressed countries and companies when they go too deeply in debt slavery. So the key idea here is get those countries and companies "conditioned" enough to grab them on a cheap. In old days that was called "shock therapy" now it is called "disaster capitalism". ..."
"... Destabilization as in "drop of oil prices to unsustainable levels" can be extremely profitable (see The Shock Doctrine: The Rise of Disaster Capitalism. ). This is the way the neoliberalism enforces its Washington consensus rules on other countries, especially resource nationalists like Putin's Russia. ..."
"... This was not done in case of "shale bubble" and other countries were implicitly stimulated by it to rump up production as well as by regime of high oil prices and cheap Western credits. Now we have a real crisis when "resource nationalist" are quickly running out of money. If Washington is able to crush them, it is also will show the other countries who are trying to oppose neoliberal globalization "who is the boss". It is not accidental that all establishment candidates in the current presidential race are extremely, pathologically jingoistic and are ready to bomb yet another half-dozen of countries in short order after coming to power. In this sense differences between H, C and R are superficial. They all are servants of neoliberal oligarchy in Washington and Wall Street (for H in the opposite order). ..."
Art Berman looks at the numbers and says oil should go back to $30, or even lower. It
does take capitalism time to work.
This looks like too theoretical post well outside the scope of this blog, but still there are
some basic facts that everybody needs to be aware of.
We all are living under
neoliberalism, aren't we? And current fascinating developments with Bernie and Trump is
nothing more than unorganized protest of shmucks against "masters of the universe" -
neoliberal elite that captured Washington, DC (along with London, Paris, Berlin and other G7
capitals). And they still have quite strong fifth column in Moscow too (Yeltsin was their man)
The revolt which BTW have little chances for success. As Orwell aptly stated, contrary to
Marx delusions "the lower classes are never, even temporarily, successful in achieving their
aims".
The key idea of neoliberalism is redistribution of wealth up from shmucks to international
(predominately financial) elite. So nobody care that either camel lovers or Putin lovers lose
money on oil and that they are selling it below the cost. What is important that the "masters
of the universe" became richer. And sustainability is provided by grabbing asset of distressed
countries and companies when they go too deeply in debt slavery. So the key idea here is get
those countries and companies "conditioned" enough to grab them on a cheap. In old days that
was called "shock therapy" now it is called "disaster capitalism".
Destabilization as in "drop of oil prices to unsustainable levels" can be extremely
profitable (see
The Shock Doctrine: The Rise of Disaster Capitalism.). This is the way the neoliberalism
enforces its Washington
consensus rules on other countries, especially resource nationalists like Putin's Russia.
The countries and companies in question were gently pushed to increase the production to
the level that assured the crisis to happen. While this sounds like another conspiracy theory,
and can well be such, the simple logic suggests that in XXI century the elite understands the
natural dynamics of capital accumulation well enough to freeze too enthusiastic Ponzi schemers
before they do the major damage, if they want it. At least suppress them enough to avoid "Minsky
moment."
This was not done in case of "shale bubble" and other countries were implicitly stimulated
by it to rump up production as well as by regime of high oil prices and cheap Western credits.
Now we have a real crisis when "resource nationalist" are quickly running out of money. If
Washington is able to crush them, it is also will show the other countries who are trying to
oppose neoliberal globalization "who is the boss". It is not accidental that all establishment
candidates in the current presidential race are extremely, pathologically jingoistic and are
ready to bomb yet another half-dozen of countries in short order after coming to power. In
this sense differences between H, C and R are superficial. They all are servants of neoliberal
oligarchy in Washington and Wall Street (for H in the opposite order).
It can well be that US shale was a part this Brzezinski's
The Grand Chessboard " gambit and now is a pawn sacrificed in a wider geopolitical game.
By
Rakesh
Upadhyay 09 March 2016 21:1
Iran is expected to raise the April Official Selling Price (OSP) of its flagship
light crude oil to Asia to 25 cents above the Saudi's similarly graded Arab
light. This is the highest premium since 2011 and is an increase of 30 cents
over the previous month.
Iran will likely price its light crude at 50 cents a barrel below the average
of Oman and Dubai quotes, whereas the OSP for Iran Heavy will likely be $2.60
a barrel below Oman and Dubai quotes.
But not all crudes are equal, and when it comes to
Iran Heavy Grade , pricing will remain aggressively competitive. Heavy Grade
is Iran's main export grade, which must compete with Latin America, Iraq and
Saudi Arabia-all of whom supply a similar grade.
When it comes to its light crude, though, the competitive price Iran has
offered so far was for internal reasons and intended to reduce gasoline imports.
Many experts believed that Iran would offer large discounts to regain the
market share it lost under the sanctions regime. However, Iran is using a calculative
approach towards increasing its share and is looking to consolidate and increase
exports to its existing partners such as China, South Korea, and India, in Asia.
Iran expects to
increase exports to India to 460,000 bpd from the current 260,000 bpd. Similarly,
it expects to further increase its exports to
South Korea ,
which has already imported 203,165 bpd-its highest level since 2012.
Demand from Europe has been a little slow to pick up due to ship insurance
and banking-related issues. Nevertheless, the
first shipment to Europe landed in Southern Spain on 6 March 2016. Three
more tankers--one bound for
Romania , another to France and a third to the Mediterranean--are expected
to reach their destinations soon.
The current market turmoil has created a once in a generation opportunity
for savvy energy investors.
Whilst the mainstream media prints scare stories of oil prices falling through
the floor smart investors are setting up their next winning oil plays.
BIMCO's chief shipping analyst,
Peter Sand, said, "Former clients of Iran are the ones who are likely to
return as buyers... Italy, Spain and Greece were the top EU importers in 2011."
The mid-March meeting between OPEC, Russia and other major producers offers
a window of opportunity for Iran to increase production gradually, since the
major nations have agreed to a production freeze. On top of that, Russia is
planning to offer a different deal to Iran, which will allow it to ramp up its
production to pre-sanction levels.
The lifting of sanctions couldn't have come at a better time for Iran. It
is benefitting from the strong bounce in oil, and it is unlikely to face huge
competition, barring U.S. exports, if the production freeze is adhered to by
the major oil producers.
Tehran has cause for celebration, indeed. This was clear when Iranian Oil
Minister Bijan
Zanganeh said : "We look forward to the beginning of co-operation between
Opec and non-Opec countries and we support any measure that can stabilise the
market and increase prices."
The world can take comfort from the fact that Iran has not flooded the market
with cheap oil as previously envisaged by the experts. Capturing market share
is one thing, but there are internal needs to consider as well.
Oil production in Russia will inevitably decline by 2035 according to an Energy Ministry
report seen by the Vedomosti business daily. The different scenarios predict an output drop from
1.2 percent up to 46 percent two decades from now.
The document, obtained by the newspaper and confirmed by a source in the ministry, says by
2035 existing oil fields will be able to provide Russia with less than half of today's production
of about 10.1 million barrels per day.
The shortfall should be met by increased production from proven reserves, according to projections
by the Energy Ministry.
In the best case for oil producers, short-term growth remains possible only until 2020, according
to the report. After that, production will contract. The figures vary from 1.2 percent to 46 percent,
depending on prices, taxation and whether or not anti-Russian sanctions will be in force.
A slight increase in production is possible only for smaller companies like Slavneft and Russneft,
while the market leaders are facing the depletion of existing deposits. Added to an unfavorable
tax environment, their production is set to fall by 39-61 percent.
To counter the decline in oil production, the Energy Ministry proposes giving private companies
access to the Arctic shelf, to soften the tax regime and support for small and medium-sized
independent companies.
The Ministry also suggests promoting the processing of high-sulfur and super viscous
heavy oil with the introduction of preferential rates of excise duties on fuel produced from
such oil.
This forecast published by "Vedomosti" is for crude only and excludes condensate (around 520 kb/d
in 2015). It was not yet officially released. Condensate production growth in 2014-15 was
higher than crude only. There are gas condensate fields in the far north of West Siberia that
should start production in the next few years.
The worse case assumes very low oil prices and sanctions remaining for the whole period. Is
$30-40 oil a realistic scenario to 2035?
Base case implies 2035 crude production only 2.1% below 2015 levels
"Reasonably favorable" scenario: crude production in 2020-2030 slightly above 2015 levels;
2035: 1.6% below 2015.
Russian crude (ex condensate) production scenarios.
Source: Vedomosti newspaper based on the Energy Ministry data
Meanwhile, the EIA in its Short-Term Energy Outlook has revised upwards estimates and projections
for Russian oil production in 2015-17.
From the report:
"Russia is one example of production exceeding EIA's expectations. Fourth quarter 2015 oil
production in Russia is 0.2 million b/d higher than in last month's STEO, with initial data indicating
it has remained at high levels in early 2016. This higher historical production creates a higher
baseline level that carries through the forecast period. Russia's production is expected to increase
by 0.2 million b/d in 2016 and then decline by 0.1 million b/d in 2017. Russia's exposure to low
oil prices has been mitigated by the depreciation of the ruble relative to the dollar, given ruble-denominated
production costs, and by Russia's taxation regime for the oil sector."
The EIA is the last of the key international energy forecasting agencies to revise the numbers
for Russia (others are IEA, JODI and OPEC)
Besides what Alex already said, I want to add another important point: the recovery of oil-in-place
in Russia is very low compared to international averages, around 20-25%. This is why there is
a lot of potential just by improving extraction from current fields.
P.S. Then, there is shale oil, really a lot of it, but it requires much higher prices for it
to be developed, and economically it makes more sense to first increase the % extracted of oil-in-place
"... EIA oil price projections are unrealisticly low IMO. Removing 1.5 million bopd from USA, plus world wide demand growth of 1-1.2 in 2016, plus other worldwide declines that Ron has illustrated, add up to more than Iraq and Iran can boost production. KSA appears to be incapable of going past 10.5 million. Russia cannot quickly increase production. ..."
"... Things can change fast regarding oil prices, witness the volatility since 1/1/16. We are hearing there could be a real supply squeeze coming and are seeing real evidence of that anticipation based upon some long term offers to hedge well above the current strip, sharply increased local basis and refinery planning chatter. ..."
"... And that talk of 500k from Iran waiting to flood the market is bogus story from the beginning and it was just used to perpetuate "glut" narrative. ..."
"... Iran will not piss 500k at these prices unless there is a deal between Russians and Saudis regarding the quotas. ..."
"... As for prices, Alex should always superimpose EIA STEO prediction from a year ago on the current. Otherwise posting such a graph does not make much sense and looks like a free promotion for crappy job that EIA performs with this metric :-) ..."
"... BTW they are unrealistic by design as they are based on futures. Futures are a bad predictor of oil prices dynamics as they are often used by producers and by hedge funds for hedging and offsetting other bets. Probably worse then a typical "oil expert" predictions :-) ..."
ND rigs at 33. Burlington has one to stack. My estimate is rigs will bottom at 26-27.
EIA oil price projections are unrealisticly low IMO. Removing 1.5 million bopd from USA, plus
world wide demand growth of 1-1.2 in 2016, plus other worldwide declines that Ron has illustrated,
add up to more than Iraq and Iran can boost production. KSA appears to be incapable of going past
10.5 million. Russia cannot quickly increase production.
Things can change fast regarding oil prices, witness the volatility since 1/1/16. We are hearing
there could be a real supply squeeze coming and are seeing real evidence of that anticipation
based upon some long term offers to hedge well above the current strip, sharply increased local
basis and refinery planning chatter. All are anecdotal, but are not signifying worries of tanks
topping.
Also add 600k disruption from Iraq Kurdish area due to complete change in
geopolitics in that area, that 600k is NOT coming back to the market until there is deal and safe
infrastructure on moving that oil towards the south terminals through areas controlled by Iraq
government. And that talk of 500k from Iran waiting to flood the market is bogus story from
the beginning and it was just used to perpetuate "glut" narrative.
Iran will not piss 500k at these prices unless there is a deal between Russians and Saudis
regarding the quotas.
I would just watch March 20th meeting and try to decode the statements from the meeting.
EIA oil price projections are unrealistically low IMO
As for prices, Alex should always superimpose EIA STEO prediction from a year ago on the current.
Otherwise posting such a graph does not make much sense and looks like a free promotion for crappy
job that EIA performs with this metric :-)
BTW they are unrealistic by design as they are based on futures. Futures are a bad predictor
of oil prices dynamics as they are often used by producers and by hedge funds for hedging and
offsetting other bets. Probably worse then a typical "oil expert" predictions :-)
Economics 101 for Dummies – an OFM type of a post.
Art Berman looks at the numbers and says oil should go back to $30, or even lower. It does
take capitalism time to work. But, EVERYONE, including Saudi Arabia and Kuwait, is losing $20/bbl
or more. Those two countries are losers because they have already spent the money before it came
in. So, the industry is losing $2 billion per day minimum. Probably $1 trillion/year at current
prices. It will change. Relatively fast.
Look at the reverse. Suppose that a loaf of bread went up to $100 in the US. 99.999% of the
population would be screaming for government price controls. OFM would be getting no sleep. Why
is that? Because he would be baking bread 24/7.
Before the crash of the Soviet Union, TV reported stories of shortages of everything in their
Union. It supposedly took 3 months of labor for a typical factory worker, saving 100% of his/her
earnings, to have enough money to buy a cloth coat. That was unsustainable. Why? Because you could
quit your job, stay home and knit a coat a week and get 12 times your salary.
Heck, even the French farmers were smart enough that when milk prices went below the cost of
production, they just dumped it in the streets.
These US corps that are selling stock to shore up their balance sheets are not stupid. They
will not start drilling again until their stock prices are well above where they diluted existing
shareholders.
I think the release of the LTO company annual reports let the cat out of the bag, so to speak.
At $50.28 WTI, no one can make a go of it, if you just read the financials on these companies.
The companies will deny that and say all kinds of stuff, but the proof is in the SEC reports.
Sure, they can get by for a long time in survival mode, but $50 as a long term price absolutely
doesn't work. Actually around $80 WTI is needed long term to have a viable LTO business, with
there obviously being a range around that price, depending on many company specific factors.
When something like 70% of XOM's upstream estimated net future cash flows disappear, and their
proved reserves drop 24%, from the previous year, just imagine what happens to all of their lesser
peers. Many had to show huge production and development cost cuts to even have net future cash
flows at $50.28, and then we dropped to $30 the first two months of 2016? Again, can get by awhile
but long term, no way.
No business media report on this stuff, and very few retail investors discuss this stuff. But
you can bet the institutional people look at reserves and estimates of future cash flows. Seeing
how bad those looked, and knowing that those are likely the BEST CASE SCENARIOs the independent
reservoir engineering firms would allow, it had to have an affect. I do not think it is a coincidence
that we were bombed with LTO 10K in February and the price has rocketed up since. The traders
realized they overshot. They believed the company "break even hype" too much, and the 10K confirmed
it is a lot of hype.
That is why I was so surprised when EOG came out and said what they did about economic at $30,
after the release of their 10K. Unless the 10K is wrong, they have $0 net future cash flow at
$32 WTI and $1.70 HH. Some heavy hitters had to get into EOG's ear in order for them to say that.
My conspiracy mind says political people, but likely it was Goldman Sachs types? It was just too
"Red, White and Blue" talk coming from them,( i.e. we MUST be cost competitive with KSA and "win"
this war).
I am not saying the low oil price nightmare that US producers have experienced is over, short
term is a tough one. But, absent some major demand decreases or major OPEC production increases,
low prices cannot last as the EIA is currently predicting.
likbez says:
03/09/2016 at 10:55 pm
ShallowS,
I think the release of the LTO company annual reports let the cat out of the bag, so to speak.
I am with you, but let me to assume the position of "devil advocate". Your statement above is true
if you view "the small picture". But if you view "the large picture" the situation is slightly different.
Here are my admittedly unprofessional (aka naïve) view:
1. In a sense "the cat out of the bag" is the necessary conditions for the recovery of oil prices,
as only an incompetent, or a stooge now can talk about prices below $70 as sustainable for shale
industry. But jury is out whether it is sufficient. May be the extinction of shale companies is in
the cards, may be they will quietly kept afloat by extending loans and by sale of shares for an additional
year. Life is complex thing and economics reflects life in more then one way.
2. That's true that individual shale companies are forced into unsustainable position (aka charge
of light oil brigade in the "death valley", see https://en.wikipedia.org/wiki/Charge_of_the_Light_Brigade
). They fight bravely but the cards were against them. But for the county as a whole, low oil prices
are a powerful economic doping, which probably helped the USA to avoid recession in 2016. Obama administration
probably has a hand in staging the drop via Saudi as they openly admit (http://oilprice.com/Energy/Oil-Prices/Did-The-Saudis-And-The-US-Collude-In-Dropping-Oil-Prices.html
)
3. IMHO low oil prices are critical to prevent slide from "secular stagnation" back into a new Great
Recession. So keeping oil prices low in 2016 is one way of kicking the can down the road for Obama
administration. Which definitely would prefer postpone possible economic problems connected with
the recovery of oil price to the next administration.
4. Putin made a move against the current oil price "status quo" and being a powerful geopolitical
player he managed to keep in line such possible detractors as Azerbaijan and Iran. So on March 20
oil price might get a boost like many suggested as shortages of oil might became reality much sooner
the some people expected (Saudi suggested that excluding Iran the drop can be closer to 0.5Mb/quarter
(1 Mb/d for the second half of 2016) then the current estimate of $0.3Mb/quarter). Their own production
is dropping too:
Nov. 30, 2015 10.04M
Oct. 31, 2015 10.14M
Sept. 30, 2015 10.19M
Aug. 31, 2015 10.29M
July 31, 2015 10.29M
5. Saudi position about continuation of their predatory oil pricing game is now fuzzy as on one hand
they still want to suppress growth of their regional rivals and Russia but on the other hand losing
$100 billion a year is not an attractive option either. In no way Saudis ever considered US shale
oil industry as a geopolitical competitor. As a nuisance yes, as a possible (and in a certain sense
welcome, from the global economy health view, with a special emphasis of G7 economies health) player
in the limiting of upper bound of the price of oil to the $80-$100 band for a decade, yes. But as
a geopolitical competitor in the global oil market, I think, no. This is all MSM lies. IMHO neither
quality, not quantity, nor status of the USA as an oil importer allow shale to play a significant
role in the global oil market. The same is true for shale gas.
China did increase its oil imports over the last few months to over 30 mill tons per month
(see below chart). Together with natgas and cyclical hydrocarbon imports this adds up to 40 mill
tons of hydrocarbons per month, which is around 10 mill barrels per day.
Slowly the fundamentals are building up for an oil price rise, although I think we will get
a pullback over summer.
"The data also showed China's February crude oil imports jumped 20 percent on year to their highest
ever on a daily basis, driven by import quotas and stockpiling."
In addition to the surge of oil imports, natgas is up year over year 100%, copper 50%, copper
ore and extractives up 92%. The increase is all up in volume as imports in dollar terms are still
very low due to low prices. However these numbers are huge as China is one of the largest importers
in the world.
To me this looks like the early sign of a nascent commodity recovery.
1) state and commercial stockpiling
2) robust gasoline demand (not closely correlated with economic growth, as opposed to weak diesel
demand).
3) rising fuel exports
"Fuel exports in February rose 71.8 percent on a daily basis compared to the same month last
year, reaching 2.99 million tonnes, or 721,700 bpd, after hitting a record 975,500 bpd in December,
as China continues to export more diesel amid weakening domestic demand for the industrial fuel."
"…as China continues to export more diesel amid weakening domestic demand for the industrial
fuel."
Plus: There's increasing demand in China for gasoline as more cars are built and sold. More
gasoline coming from refineries means more diesel coming from refineries, as they produce both.
The small "teapot" refineries are being given permission to import gasoline now, I believe,
so that will help reduce overproduction of diesel, and the government has imposed a price floor
too; that helps reduce the panic exporting.
The Chinese car market is much bigger than the US car market. And also growing much faster.
When a commodity cycle starts, metals (gold, silver, base metals…) are first to soar. Oil is
actually the last to rise as oil in most cases brings a commodity cycle to its end due to higher
inflation.
There is little doubt that China is in the early stage of a massive upswing. Anyone who hopes
for higher oil prices should hope also for a Chinese recovery. Oil prices will not go up without
a Chinese recovery.
As the demand growth in 2015 has been way underestimated in 2014, it is again underestimated
for 2016.
The IEA numbers for 2016 are just an estimate and not yet a fact. Car registrations and import
numbers reveal way higher numbers are likely for China in 2016.
A strong sign of a Chinese recovery is the recent strength of the yuan, record high of new
loans (2500 bn yuan) and strong money suppley (+14%).
You are right, the IEA has significantly increased its estimate of China's oil demand for 2015.
Last year, incremental demand was actually higher that in the previous 4 years.
I also agree with you that IEA likely underestimates China's demand growth in 2016.
But this growth will still be slower than last year; it will not accelerate.
Growing imports reflect buying by the government and oil companies for stockpiling and increasing
exports.
As I said above, there is also a serious structural shift in China's oil consumption.
It is now driven by gasoline, which is due to growing private car ownership.
By contrast, demand for diesel, which is mainly consumed in the industry and construction, has
sharply decelerated.
And this seems to be a long-term trend, as China is gradually changing its economic model from
export-oriented, based on heavy industries and construction, to a more focused on private consumption.
China: y-o-y growth in gasoline consumption
source: IEA
It is possible that diesel fuel is being used more efficiently by the Chinese economy. For
example diesel is essentially the same as heating oil and as China develops less will be used
for heating buildings as natural gas pipeline infrastructure expands, there might also be some
switching to heat pumps for heating. These switches take time and there is a significant time
lag between high oil prices (from 2011 to mid-2014) and when we see the long run demand effects.
Also the expansion of auto sales tends to increase employment and economic activity throughout
the economy.
For these reasons I think a focus on total oil demand makes more sense than a focus on only
diesel demand.
Yes, there is an effect of fuel substitution.
I'm not sure if a lot of diesel is used for heating in China (I think they are mostly using LPG,
coal, firewood, etc.), but certainly there are sectors of the economy where it can be substituted
or used more efficiently.
For example, in the 2000s, a lot of diesel and residual fuel was used for power generation,
as despite a rapid growth in generation capacity China often experienced serious power shortages.
In particular, that explains a spike in oil consumption in 2004. China now has sufficient generation
capacity, so diesel use for power generation in the commercial and residential sectors is diminishing.
But more important is a structural shift in China's economy and energy consumption patterns.
The country is undergoing a gradual transition to an economy oriented toward private consumption.
The share of less energy-intensive sectors, such as services, in GDP is increasing. Fixed investment/GDP
ratio is declining from 40-50% to more sustainable levels, which means relatively slower growth
and less infrastructural developments. All this should lead to a less energy-intensive economy
and relatively lesser use of industrial fuels, including diesel.
By contrast, gasoline demand is driven by rising living standards, growing middle class, and
hence rapidly increasing car ownership. Gasoline consumption will continue to grow at a high rate,
even though economic growth is slowing.
Here's the deal. China may actually be the country where EVs take off in a big way first (if you
leave Norway out of it). The following insideevs.com piece rates China as the number one EV market
in the world. I don't understand the metrics used by the author for the countries below China
on the list but, it is hard to deny that China is the fastest growing market for EVs or that the
highest absolute numbers of EVs are being sold in China.
up from #3; local sales 207,000, plus a lot more buses and commercial trucks. Claim to fame:
easily overtook USA this year for the global volume title; increased 300% over 2014; most sales
locally made by a diverse domestic industry; makes and deploys the vast majority of the world's
EV Buses.
China has once again proven that despite its huge size, it can turn its economy and industry
on a dime. They've been doing this every few years now, in a manner rivaling what the USSR and
USA accomplished during World War II.
As always, when you crank out an omelette this big, eggs will break. Indeed, the sooty fallout
of last decade's massive industrial push is one big reason why China is in such a hurry now to
clean up its energy grid, and its car and bus fleet. Hopefully they are learning some lessons,
and not just causing problems just as big downstream.
This concern is important. For example, in January Amnesty International published a meticulous
report, showing that China's Huyaou Cobalt company buys cobalt mined off of Congolese child and
slave labor. It then sells the cobalt directly or indirectly to Li-ion battery makers, including
BYD and interestingly, Korean LG Chem and Samsung. This must stop.
That said.
It is simply mind-boggling, that in 2012 China had all of 3,000 EV sales. The US was already
at 52,000 at the time. Three years later, they have apparently crossed 200,000 sales for the year,
with 35,000 EV sold in December 2015 alone.
he Chinese government intends to further augment plug-in electric vehicle sales by increasing
purchases from various government departments.
The latest move sets buying guidelines of more than 50% of new purchases to be NEVs (New
Energy Vehicles – electric or plug-in hybrid).
What this means for future gasoline consumption growth in China is anybody's guess but, it
appears to me that EVs are in the early stages of an exponential growth phase.
"... "Of the 1 billion barrels reportedly produced but not consumed, roughly 420 million are being stored on land in member countries of the Organization for Economic Cooperation and Development (OECD). Another 75 million barrels are thought to be stored at sea or in transit by tanker somewhere from the oil fields to the refineries. That leaves 550 million "missing barrels" unaccounted for, apparently produced but not consumed and not visible in the inventory statistics..." ..."
If any of you have seen
my early writings
on OilPrice.com, you would know I have been steadfast in my criticism of the media exaggerating the
extent of the oil glut. Furthermore, I have also documented the pattern of exaggeration from both
the EIA/IEA with their statistics.
I realize that no one is perfect, forecasting the future is notoriously difficult, and these entities
have their difficulties in obtaining reliable and timely data to make accurate predictions. However,
the IEA in particular has a track record of overstating oil supplies – even back in 1999 the agency
was questioned for exaggerating a supply glut, and now it seems to have occurred again.
The chart above shows the "missing barrels," unexplained oil volumes that have shown up in IEA
data over time. John Kemp from Reuters, who has done some of the best coverage of the market, put
together this data to illustrate the problem with the reported data. He recently wrote this
piece, confirming all my suspicions of the past. In it he states the following:
"Of the 1 billion barrels reportedly produced but not consumed, roughly 420 million are being
stored on land in member countries of the Organization for Economic Cooperation and Development (OECD).
Another 75 million barrels are thought to be stored at sea or in transit by tanker somewhere from
the oil fields to the refineries. That leaves 550 million "missing barrels" unaccounted for, apparently
produced but not consumed and not visible in the inventory statistics..."
The current market turmoil has created a once in a generation
opportunity for savvy energy investors.
Whilst the mainstream media prints scare stories of oil prices falling through the floor
smart investors are setting up their next winning oil plays.
So, in other words, OVER HALF of the supposed glut that the IEA has reported is unaccounted for.
Not 5 or 10 percent, but greater than a whopping 50 percent. Does anyone believe that half of the
glut is just missing?
In the article John explains that it could be in hidden or unaccountable locations. But that doesn't
seem credible. It is hard to believe that HALF of the entire world's excess supply cannot be justified
with the data? At $40 oil, that is some $22 billion in oil that is squirreled away somewhere that
millions of people simply don't know where it is?
Yet does anyone care to even question such non-sense? No, of course not, just like every other
government statistic that is taken at face value and traded on by headline-driven algorithms. There
used to be a time when Wall Street did real research, but that appears to be gone now. Either demand
has been understated by the IEA, or supply has been vastly overstated...any rational person would
conclude the same.
"... Of the 1 billion barrels reportedly produced but not consumed, roughly 420 million are being stored on land in member countries of the Organisation for Economic Cooperation and Development (OECD). Another 75 million barrels are thought to be stored at sea or in transit by tanker somewhere from the oil fields to the refineries. ..."
"... That leaves 550 million "missing barrels" unaccounted for, apparently produced but not consumed and not visible in the inventory statistics ("Oil Market Report", IEA, Feb. 2016). ..."
"... The last time the miscellaneous to balance item was this large and positive (implying an oversupplied market) was in 1997/98 when the issue triggered fierce criticism of the IEA's statistics. Critics accused the IEA of over-estimating supply, under-estimating demand, contributing to perception of a glut, depressing prices, and causing unnecessary hardship to the oil industry ("There Are No Missing Barrels", Simmons, 1999). Senator Pete Domenici, chairman of the U.S. Senate Budget Committee, asked the General Accounting Office to investigate the IEA's statistics and the question of missing barrels. In a report published in May 1999, GAO concluded "missing barrels are not a new condition, and the amount and direction of missing barrels have fluctuated over time". "At any point in time, the historical oil supply and demand as well as the stock data reported by IEA could be overstated or understated by an unknown magnitude." It was not possible to "quantify how much of the missing barrels are due to statistical limitations and how much are the result of physical oil storage in unreported stocks". In 1997/98 episode, the IEA concluded most of the missing barrels went into non-OECD storage and uncounted OECD inventories ("Oil Market Report", IEA, June 1999). ..."
"... The question of what has happened to the missing barrels, and whether some of them exist at all, is critical because it could affect how quickly the oil market rebalances. ..."
Where has the oil gone? Missing barrels and market rebalancing: Kemp Fuel pumps are pictured at a
gas station in Sidi Allal El Bahraoui, Morocco, February 7, 2016. REUTERS/Youssef Boudlal Fuel pumps
are pictured at a gas station in Sidi Allal El Bahraoui, Morocco, February 7, 2016. Reuters/Youssef
Boudlal Where has the oil gone? Missing barrels and market...X By John Kemp LONDON (Reuters) - Global
oil production exceeded consumption by just over 1 billion barrels in 2014/15, according to the International
Energy Agency (IEA).
Production exceeded consumption by an average of 0.9 million barrels per day in 2014 and 2.0 million
bpd in 2015 (tmsnrt.rs/1pvIEw8).
Of the 1 billion barrels reportedly produced but not consumed, roughly 420 million are being
stored on land in member countries of the Organisation for Economic Cooperation and Development (OECD).
Another 75 million barrels are thought to be stored at sea or in transit by tanker somewhere from
the oil fields to the refineries.
That leaves 550 million "missing barrels" unaccounted for, apparently produced but not consumed
and not visible in the inventory statistics ("Oil Market Report", IEA, Feb. 2016).
Missing barrels are recorded in the "miscellaneous to balance" line of the IEA's monthly Oil Market
Report as the difference between production, consumption and reported stock changes. The miscellaneous
item reflects errors in data from OECD countries, errors in the agency's estimates for supply and
demand in non-OECD countries, and stockpile changes outside the OECD that go unrecorded. IEA data
currently shows a miscellaneous to balance item of 0.5 million barrels per day in 2014 and 1.0 million
barrels per day in 2015. Missing barrels have been a feature of IEA statistics since the 1970s ("International
Energy Agency: How the Agency Prepares its World Oil Market Statistics", U.S. General Accounting
Office, 1999).
Over time, errors have occurred in both directions, and have ranged up to 1 million or even 2
million barrels per day (tmsnrt.rs/1pvIBjQ). Most of the time, the oil market ignores the miscellaneous
to balance item, but it tends to become controversial when it becomes very large, either positive
or negative.
ERRORS AND OMISSIONS
The last time the miscellaneous to balance item was this large and positive (implying an oversupplied
market) was in 1997/98 when the issue triggered fierce criticism of the IEA's statistics. Critics
accused the IEA of over-estimating supply, under-estimating demand, contributing to perception of
a glut, depressing prices, and causing unnecessary hardship to the oil industry ("There Are No Missing
Barrels", Simmons, 1999). Senator Pete Domenici, chairman of the U.S. Senate Budget Committee, asked
the General Accounting Office to investigate the IEA's statistics and the question of missing barrels.
In a report published in May 1999, GAO concluded "missing barrels are not a new condition, and the
amount and direction of missing barrels have fluctuated over time". "At any point in time, the historical
oil supply and demand as well as the stock data reported by IEA could be overstated or understated
by an unknown magnitude." It was not possible to "quantify how much of the missing barrels are due
to statistical limitations and how much are the result of physical oil storage in unreported stocks".
In 1997/98 episode, the IEA concluded most of the missing barrels went into non-OECD storage and
uncounted OECD inventories ("Oil Market Report", IEA, June 1999).
In the current episode, it is also very likely some of the 550 million barrels unaccounted for
in 2014/15 have gone into unreported storage outside the OECD. China's government is known to have
been filling its Strategic Petroleum Reserve. More barrels are likely to have gone into commercial
storage in China and in other countries outside the OECD. But it is at least possible some of the
missing barrels have been caused by the IEA over-estimating oil supplies or under-estimating demand.
CLEARING THE OVERHANG
The question of what has happened to the missing barrels, and whether some of them exist at
all, is critical because it could affect how quickly the oil market rebalances. The IEA and
most other forecasters predict the oil market will remain oversupplied throughout 2016 and the first
half of 2017, ensuring stockpiles continue growing. In its "Medium-Term Oil Market Report", published
last month, the IEA predicted consumption would not exceed supply on a full-year basis until 2018.
Some analysts argue the market will need to eliminate the excess supply and work down some proportion
of the inherited stocks before oil prices can rise sustainably. With the oil market expected to remain
in surplus throughout 2016 and "already awash in oil" the IEA has said that "it is very hard to see
how oil prices can rise significantly in the short term." To the extent the miscellaneous to balance
item reflects oil that has gone into unreported storage, it will take longer to clear the overhang
of stocks that built up in 2014/15 and continue to build in 2016. But to the extent the missing barrels
are the result of over-estimating supply and under-estimating demand, or have been absorbed into
China's strategic stocks, the overhang could clear more quickly.
POSSIBLE PRODUCTION FREEZE
Following the 1997/98 episode, the missing barrels that accumulated in unreported non-OECD storage
were drawn down in 1999, according to the IEA ("Oil Market Report", IEA, Dec 1999). In December 1999,
the IEA wrote: "The weight of (the) evidence is that the missing barrels did exist and that they
have now returned to the market." "The return was triggered by the reversal in the shape of the forward
price curve and the need for additional barrels following OPEC's effective production limitation"
which began in March 1999. By the end of 1999, the oil market was seeing excess demand and prices
were rising. But the rapid recovery depended on very strong economic growth in North America and
Asia (after the East Asian financial crisis in 1997/98). It also depended on substantial production
cuts by OPEC in conjunction with production restraint from non-OPEC countries.
And it was both heralded and caused by a shift in the forward price curve from contango to a state
of backwardation (which made oil less profitable to store). The events of 1999 illustrate the factors
needed to clear an inherited glut of oil (strong demand, production restraint and a shift in the
shape of the forward price curve). Current circumstances share some similarities with 1998/99 but
there are also important differences which should not be overlooked. The current stock build has
been caused by oversupply thanks to the shale revolution rather than a slowdown in demand as in the
1997/98 Asian financial crisis. The winter of 1997/98 also saw a strong El Nino, which suppressed
oil demand as it has this winter.
The current oversupply is not as bad as it was in the earlier episode, and the missing barrels
problem is much smaller. The smaller (relative) surplus should make rebalancing faster this time
around. In 1997/98, the market was oversupplied by 2.1 million barrels per day compared with total
demand of around 74 million barrels per day, according to the IEA. In 2015, the oil market was also
oversupplied by 2.0 million barrels per day but consumption was running at more than 94 million barrels
per day, around 25 percent higher. At present, oil demand is growing strongly, just as it was in
1999, though there are concerns about the health of the global economy.
The major oil exporting countries have not so far agreed to cut production, unlike 1998/99, but
there has been discussion about a possible production freeze. Futures prices remain resolutely in
contango, which is both a symptom of excess stockpiles and creates a financial incentive to continue
holding them. There is no sign of the market moving into backwardation yet, which would indicate
the supply-demand balance was shifting and would also create a financial incentive to release oil
from storage. Several key OPEC and non-OPEC producers have announced a provisional production freeze
which could speed up the rebalancing, assuming it is implemented. But it might not be enough to eliminate
the glut quickly; outright production cuts may be needed to accelerate the process, depending on
what happens to demand and production from other countries.
"... U.S. crude oil production is projected to decrease from an average of 9.4 million b/d in 2015 to 8.7 million b/d in 2016 and to 8.2 million b/d in 2017. ..."
"... EIA expects U.S. crude oil production to decline from 9.1 million b/d in the first quarter of 2016 to an average of 8.0 million b/d in the third quarter of 2017. Production of 8.0 million b/d would be 1.7 million b/d below the April 2015 level, which was the highest monthly production since April 1971. Production is expected to begin increasing modestly in the fourth quarter of 2017, as productivity improvements, lower breakeven costs, and anticipated oil price increases are expected to end more than two years of declines in the Lower 48. The forecast remains sensitive to actual wellhead prices and rapidly changing drilling economics that vary across regions and operators. ..."
"... EIA oil price projections are unrealisticly low IMO. Removing 1.5 million bopd from USA, plus world wide demand growth of 1-1.2 in 2016, plus other worldwide declines that Ron has illustrated, add up to more than Iraq and Iran can boost production. KSA appears to be incapable of going past 10.5 million. Russia cannot quickly increase production. ..."
The EIA has further reduced its forecast for U.S. oil production in 2016-17 (by 200-300 kb/d
for 2017).
Apparently this is related with lower oil price assumptions, which are based on futures prices,
and the recent cuts in E&P companies capex guidance.
From the report (STEO, March 2016):
"U.S. crude oil production is projected to decrease from an average of 9.4 million b/d
in 2015 to 8.7 million b/d in 2016 and to 8.2 million b/d in 2017. The forecast reflects
an extended decline in Lower 48 onshore production driven by persistently low oil prices that
is partially offset by growing production in the federal Gulf of Mexico.
EIA estimates total U.S. production has fallen 0.6 million b/d since April 2015, to an average
of 9.1 million b/d in February, with the entire production decline coming from Lower 48 onshore.
With WTI prices currently below $40/b and projected to remain below that level through the first
half of 2017, EIA expects oil production to decline in most Lower 48 onshore oil production regions.
The expectation of reduced cash flows in 2016 and 2017 has prompted many companies to scale
back investment programs, deferring major new undertakings until a sustained price recovery occurs.
The prospect of higher interest rates and tighter lending conditions will likely limit the availability
of capital for many smaller producers, giving rise to distressed asset sales and consolidation
of acreage holdings by more financially sound firms.
EIA expects U.S. crude oil production to decline from 9.1 million b/d in the first quarter
of 2016 to an average of 8.0 million b/d in the third quarter of 2017. Production of 8.0 million
b/d would be 1.7 million b/d below the April 2015 level, which was the highest monthly production
since April 1971. Production is expected to begin increasing modestly in the fourth quarter of
2017, as productivity improvements, lower breakeven costs, and anticipated oil price increases
are expected to end more than two years of declines in the Lower 48. The forecast remains sensitive
to actual wellhead prices and rapidly changing drilling economics that vary across regions and
operators.
Projected crude oil production in the Gulf of Mexico rises during the forecast period, and
oil production in Alaska falls."
U.S. C+C production: STEO March 2016 vs. Feb. 2016
Projections for Lower 48 states (ex GoM) production in 2017 were revised down by 310 kb/d in
2017,
including a 350 kb/d revision for 4Q17.
EIA now expects Lower 48 output to decline from the peak of 7.73 kb/d in March 2015 to 5.84 kb/d
in October 2017 (-1.88 kb/d)
Lower 28 states (excl. GoM) C+C production: STEO March 2016 vs. Feb. 2016
ND rigs at 33. Burlington has one to stack. My estimate is rigs will bottom at 26-27.
EIA oil price projections are unrealisticly low IMO. Removing 1.5 million bopd from USA, plus
world wide demand growth of 1-1.2 in 2016, plus other worldwide declines that Ron has illustrated,
add up to more than Iraq and Iran can boost production. KSA appears to be incapable of going past
10.5 million. Russia cannot quickly increase production.
Things can change fast regarding oil prices, witness the volatility since 1/1/16. We are hearing
there could be a real supply squeeze coming and are seeing real evidence of
that anticipation based upon some long term offers to hedge well above the current strip, sharply
increased local basis and refinery planning chatter. All are anecdotal, but are not signifying
worries of tanks topping.
This article has all signs "a am short on oil" bias. As such this can serve as an
example of fine art of disinformation. Previously the same deso as now about Kuwait was
promoted about Azerbaijan. i could well be that Zerohedge traders are hurt by this "short
covering" oil rally. They never disclose their positions.
Notable quotes:
"... According to Reuters, Kuwait's oil minister said on Tuesday that his country's participation in an output freeze would require all major oil producers, including Iran, to be on board. ..."
"... Kuwait's announcement followed a report by Goldman overnight in which, as we reported, Jeff Currie said that the "commodity rally is not sustainable" and it is time to sell crude. "While these dynamics (rising prices) could run further, they simply are not sustainable in the current environment," the analysts wrote. "Energy needs lower prices to maintain financial stress to finish the rebalancing process; otherwise, an oil price rally will prove self-defeating, as it did last spring." ..."
"... China's February vehicle sales, a key driver for gasoline demand, were down 3.7 percent year on year, data from the country's Passenger Car Association showed. ..."
Back in late February, when crude prices had just hit a 13 year low, one catalyst unleashed a
furious short-covering rally: a WSJ report which cited a delayed SkyNews interview with the UAE energy
minister, according to which OPEC would freeze, if not cut production. Since then we learned, courtesy
of the Saudi oil minister Al-Naimi himself, that the Saudis will never reduce output, however, in
a utterly meaningless gesture, Saudi Arabia and Russia agreed to "freeze" production at levels which
are already at maximum capacity and under one condition: that all other OPEC members join the freeze,
with the possible exception of Iran which may be allowed to produce until it hits its pre-embargo
export levels.
Of course, even the said "freeze" is nothing but a stalling tactic employed by an OPEC member
(Saudi Arabia), to give the impression that OPEC still exists as a production-throttling cartel when
OPEC ceased to exist in that capacity in November 2014. Everything since then has been one surreal
redux of "Weekend at Bernies" where everyone pretends not to notice the corpse in the room.
However, while many had pretended to at least play along with the charade, today a core OPEC member
effectively broke ranks when Kuwait said it would only agree to an output freeze if all major producers
take part including Iran.
According to Reuters, Kuwait's oil minister said on Tuesday that his country's participation in
an output freeze would require all major oil producers, including Iran, to be on board.
"I'll go full power if there's no agreement. Every barrel I produce I'll sell," Anas al-Saleh
told reporters in Kuwait City. And since Iran has made it very, very clear that it will not join
the production freeze at its current mothballed output, and will need at least 9-12 months before
it regains its pre-embargo capacity levels, one can forget about a production freeze well into 2017,
if not forever, since by then at least one if not more OPEC members will be bankrupt (they know who
they are: they are the source of those "ALL CAPS" flashing read headlines every day).
Putting Kuwait's production in context, Kuwait - the small Gulf state Saddam invaded 25 years
ago - is currently producing 3 million barrels of oil per day. Incidentally, this is precisely how
much the oil market is oversupplied each and every day, and why in addition to PADD1, 2 and 3 being
almost full, and excess oil now being stored in ships, pipelines and trains, and re-exported to Europe,
quite soon empty swimming pools will be full with the "black gold" as the algos continue to refuse
to pay any attention to the constantly deteriorating fundamentals.
Kuwait's announcement followed a report by Goldman overnight in which, as we reported, Jeff Currie
said that the "commodity rally is not sustainable" and it is time to sell crude. "While these dynamics (rising prices) could run further, they simply are not sustainable in the
current environment," the analysts wrote. "Energy needs lower prices to maintain financial stress
to finish the rebalancing process; otherwise, an oil price rally will prove self-defeating, as it
did last spring."
Perhaps, but not just yet: in addition to China's abysmal exports, we also learned that in February
its crude imports soared 19.1% to 31.80 million tons, or about 8 million barrels per day, an all-time
high, suggesting China - like the US - is filling every available container including its SPR at
a time when prices are relatively low even if organic demand continues to deteriorate.
As Reuters writes, "despite strong oil demand, questions about the sustainability of growing consumption
weighed on markets after China's overall exports tumbled by a quarter in February."
China's February vehicle sales, a key driver for gasoline demand, were down 3.7 percent year
on year, data from the country's Passenger Car Association showed. "This is really a poor start
for trade this year," said Zhang Yongjun, senior economist at the China Centre for International
Economic Exchanges.
However, judging by the latest bounce in crude in the last hour of trading, the only thing that
still matters is who the daily "short squeeze" will rip higher. By the looks of things, at least
one major trader already got the tap on the shoulder.
number and intensity of earthquakes in Oklahoma have risen dramatically in recent years
with the underground disposal of wastes from oil and gas drilling.
The state has asked energy companies to reduce wastewater disposal by 40 percent.
The new guidelines cover more than 400 wells located in a 5,000-square-mile area.
Oklahoma officials on Monday told oil and gas producers to dramatically scale back underground
disposal of wastewater that has led to a dramatic surge in the number and intensity of earthquakes.
The
new restrictions, imposed by the Oklahoma Corporation Commission, will require drillers to cut
the amount of underground-injected wastewater by 40 percent from the peak in 2014. The move represents
a shift in strategy for the state, which had initially targeted individual wells linked to seismic
activity, said Matt Skinner, a spokesman for the commission.
"We've built the case we need based on broad correlations rather than specific," Skinner said.
"We can't look at a single well and say, 'You did this.'"
The New York Times notes the restrictions are
technically recommendations that may force energy companies to produce less oil and gas. They
follow
a similar move for wells in northwest Oklahoma imposed by the state last month.
Earthquakes in the industry-friendly state, recently
linked to drillers' injection of wastewater deep underground, have risen from a few dozen annually
in the mid-2000s to
more
than 6,000 last year. The waste is a byproduct of petroleum production, forced from the ground
with oil and gas. Energy companies have been injecting the material thousands of feet underground
into an area called the Arbuckle formation.
Skinner said the restrictions are a proactive approach by the state. The 5,000-square-mile area
in central Oklahoma covered by the new rules includes areas where earthquakes aren't happening.
Skinner said the injections aren't directly caused by the method of producing oil and gas called
fracking. The U.S. Environmental Protection Agency says Oklahoma's massive energy business can
produce up to
2 billion
gallons of wastewater a day.
Gov. Fallin, maintained that the cause of the tremors was unclear, and the state Legislature refused
to consider legislation, but she abandoned her position as the number of quakes rapidly increased.
The political leadership was not jolted into action until January, however, when a series of small
earthquakes damaged homes and interrupted power in Edmond, an Oklahoma City suburb home to many in
the state's political and financial elite - from the NYT
People in Oklahoma will not wise up until it's too late and.they get a massive earthquake that destroys
most of their major cities. They blindly listen to the republican leaders who like the ones in flint
michigan tell them there is nothing to worry about meanwhile their leaders are getting enormous kickbacks
from the oil and gas company. GOP= greed over people.
Shirl Hopkins
lol, a friend's daughter moved there. now my friend is a nervous wreck wiith her daughter constantly
on the phone, scared cuz of the earthquakes. she moved there cus okla is a really religuous state.
lol
Never ceases to amaze me. For years people stated that fracking causes earthquakes. Coincidence the
big oil companies said. Totally unrelated. Yeah, right. The more fracking, the more earthquakes.
What does one expect when the one thing that is allowing the earth to move on itself without friction
is being sucked out, processed, and put into our engines. Don't know what is worse, trying to figure
out what to do with the toxic byproducts above the ground or the crap left below it and is leeching
down to our aquifers. Lovely what we are doing to ourselves.
It's not like this issue wasn't known for decades. The USGS report on the cluster earthquakes in
the Denver area in the '60's, were a direct result of wastewater injection into a 12,000 foot well
at the Rocky Mountain Arsenal. When the injection pumping stopped, so did the earthquakes.
http://earthquake.usgs.gov/.../states/colorado/history.php
Beyond stupid, when you're screwing up the earth so bad you're causing EARTHQUAKES! don't you think
it's time to stop! Fools won't get the hint until Oklahoma is just a hole in the ground.
Oklahoma has never been a very logical place. One resource Oklahoma has plenty of is wind, and the
state contains the headquarters and plants for two manufacturers of wind generation systems. Yet
the state government for years has favored oil and gas over wind energy to the point that it allows
utilities to charge monthly hookup rates to homes with personal wind- and solar-generation equipment
that negate any savings from using those systems.
"The new restrictions, imposed by the Oklahoma Corporation
Commission, will require drillers to cut the amount of underground-injected wastewater by 40 percent
from the peak in 2014"
Do we even know if its wastewater they are pumping back into the ground?
Whats to stop them from pumping other checmicals back into the ground?
The wastewater also contains the chemicals in that were used in the fracking
fluid. The well is fractured with a sandy, saline/chemical solution. Those specific chemicals will
depend in part on what, if any, clays were present in the reservoir rock that the company will want
to disolve to increase the ability of the oil to migrate through the reservoir rock. Depending on
the clays present, the particular chemicals used can be pretty nasty. As far as chemical contamination
goes, the top of the Anadarko Basin, where the waste is injected, is over three miles below the surface.
Fresh water is generally very near the surface. I have not seen any research that suggests that the
waste water in the Anadarko could migrate upwards. It is very saline, so its density should restrict
its ability to move upwards. That is why fresh groundwater is near the surface and very deep ground
water tends to be saline. That is not to say that I am comfortable with the waste water being there.
Wait... What!!???? Republicans putting new regulations on businesses? What happened
to "If the government would just take the handcuffs off of American businesses, it would be a perfect
world?" What, Oklahoma? Didn't get quite the perfect world you thought you would? Maybe you ought
to consider suing Ayn Rand... (You know, the fiction writer who wrote your instructions on how to
govern...)
These aren't actual regulations. This is the part where conservative pols ask the
industry to play nicely. If you thought they were actually going to create standards and rules and
consequences for bad behavior you can stop being suprised now. This "ask" of theirs has fewer teeth
than the tooth fairy.
I wonder how they cam to the conclusion that 40% would do the trick. That only a 40% reduction of
the 100% of waste water shoved and pumped into the underground rocks and soil would be enough to
completely stop the damage they are doing - the earthquakes they are causing.
But, "The New York Times notes the restrictions are technically recommendations that may force energy
companies to produce less oil and gas."...OR, the oil companies may just simply ignore those "recommendations"
and just keep doing what they are doing in the "industry-friendly state".
if companies like Sandridge didnt bring in all the disposal water from Arkansas
and try and dispose of it here, there wouldnt be a problem.
The earthquakes started when Arkansas banned disposal wells and companies built disposal wells in
Oklahoma on known fault lines (with the theory that its already a big crack, just fill it with water)
and try and force two states salt water into the area of one state.
Since the disposal wells that were on known fault lines (just took the closer of 10), earthquakes
dropped significantly.
Just "guidlines" no consequences for not following them. Where do they expect frackers to dispose
of the poison? Simple they'll just dispose of it in some other unregulated fashion... problem solved,
eh? How about banning the release of benzene, toluene and the dozens of other carcinogens used in
fracking into the environment. That apparently is too much to ask in a country that kisses corporate
*ss the way we do.
"Skinner said the injections aren't directly caused by the method of producing
oil and gas called fracking."
He's technically right, but the fact of the matter is that the saltwater is coming from formations
that can only be targeted by fracking. It's like saying drilling for oil doesn't directly cause global
warming.
Of course they
do it NOW............
Now that the price of oil is in the toilet........
They were content to do nothing before.......
I guess money really IS more important than anything, INCLUDING common sense........
Oklahoma and Texas will be uninhabitable wastelands in another 20
years from fracking. Their water supplies will be so poisoned they won't be able to drink the tap
water. Hope it was worth it. But don't be crying to Federal Government yo bail you out.
The USGS is quite clear on the damages from cluster earthquakes in the Denver area as a direct result
of wastewater injection wells from the 1960's at the Army's Rocky Mountain Aresenal.
The main damage occurred in Northglenn, a northern suburb of Denver, but minor damage occurred in
many area towns. At Northglenn, concrete pillars were damaged at a church; foundations, concrete
floors, and walls cracked; windows broke; and tile fell at a school. This was the largest of a series
of earthquakes in the northeast Denver area that were believed to be induced by pumping of waste
fluids into a deep disposal well at the Rocky Mountain Arsenal. The Colorado School of Mines recorded
more than 300 earthquakes from this zone during 1967. Felt north to Laramie, Wyoming, south to Pueblo,
west to Vail, and east to Sterling.
EIA tried to play inventory card to talk down oil prices. This is wrong. Inventory matter
only during initial priod of "oil glut". One and a half yeay into the oil price crash they are reflecting
maily grid of Wall Street operators then anything else.
Notable quotes:
"... With large global oil inventory builds expected to continue in 2016, oil prices are expected to remain near current levels. Forecast Brent prices average $34/b in 2016, $3/b lower than forecast in last month's STEO. ..."
"... Prices reach an average of $45/b in the fourth quarter of 2017, as the oil market becomes relatively balanced at that point, with the potential for inventory draws beyond the forecast period. ..."
"... WTI futures contracts for June 2016 delivery, traded during the five-day period ending March 3, averaged $37/b, while implied volatility averaged 50%. These levels established the lower and upper limits of the 95% confidence interval for the market's expectations of monthly average WTI prices in June 2016 at $24/b and $58/b, respectively. ..."
Brent crude oil spot prices increased by $1/b in February to a monthly average of $32/b. Accelerating
reductions in the U.S. rig count and market reactions to news of a potential OPEC/non-OPEC supply
freeze gave support to oil prices in February that offset the downward price pressure from ongoing
growth in global oil inventories and uncertainty over the strength of global oil demand growth.
With large global oil inventory builds expected to continue in 2016, oil prices are expected
to remain near current levels. Forecast Brent prices average $34/b in 2016, $3/b lower than forecast
in last month's STEO.
Global oil inventories are expected to grow by an average of 1.6 million b/d in 2016 and by 0.6
million b/d in 2017, both higher than in last month's STEO. Inventory builds are higher in this month's
STEO as a result of recent updates to historical data showing continued resilience from non-OPEC
oil producers in the current low-price environment and as a result of a reduction in forecast global
oil demand growth. Higher forecast inventory builds and slower market rebalancing contribute to a
more limited price recovery in 2017 than previously forecast, with Brent prices forecast to average
$40/b, $10/b lower than in last month's STEO. Prices reach an average of $45/b in the fourth
quarter of 2017, as the oil market becomes relatively balanced at that point, with the potential
for inventory draws beyond the forecast period.
Forecast West Texas Intermediate (WTI) crude oil prices average the same as Brent crude oil prices
through the forecast period. The price parity of WTI with Brent in the forecast period is based on
the assumption of competition between the two crudes in the U.S. Gulf Coast refinery market, as transportation
differentials are similar to move the crudes from their respective pricing points to that market.
The expectation of continuing large inventory builds is a major source of uncertainty in the price
forecast, as the capacity of global oil storage to absorb builds of the forecast magnitude is unknown.
If global storage capacity becomes stressed, the cost of storage will rise to reflect more expensive
marginal storage options such as floating inventories on crude oil tankers. The higher storage costs
would lower near-month crude oil prices. Additional uncertainty stems from the pace of global economic
growth and its contribution to oil demand growth, and also from the responsiveness of oil producers
to sustained low oil prices.
The current values of futures and options contracts highlight the heightened volatility and high
uncertainty in the price outlook (Market
Prices and Uncertainty Report) . WTI futures contracts for June 2016 delivery, traded during
the five-day period ending March 3, averaged $37/b, while implied volatility averaged 50%. These
levels established the lower and upper limits of the 95% confidence interval for the market's expectations
of monthly average WTI prices in June 2016 at $24/b and $58/b, respectively.
The 95% confidence interval for market expectations widens over time, with lower and upper limits
of $20/b and $81/b for prices in December 2016. At this time last year, WTI for June 2015 delivery
averaged $54/b, and implied volatility averaged 46%. The corresponding lower and upper limits of
the 95% confidence interval were $36/b and $80/b.
I suspect farmers were buying diesel fuel in the past several weeks for field work coming up in
the next two months.
Two million farmers buying 2100 gallons of diesel fuel is 42,000,000,000 gallons, 1,000,000,000
barrels of diesel fuel; there it was, gone.
A thousand gallon on farm diesel tank, pour some into the tractors, trucks, all which will
hold another thousand gallons easy, you have your demand in storage waiting to be burned doing
field work. The pickups have a one hundred gallon tank in the pickup bed for some more fuel, fill
those too. Fill the combine too, add some stabilizer, you're ready to go.
Plus a can of starting fluid for cold starts, just what you need to start a cold diesel engine.
Might as well order it before the price starts to rise in April. No sense in spending another
fifty cents per gallon, that is another 21 billion dollars and might as well have it in the bank
account for some fertilizer and soybean seed.
My point is that in the energy space, shockingly, money continues to pour in whenever
it's being requested.
The facility of even the most distressed oil company to raise capital, and the least
distressed feeling the need to do so, combined with the short covering move in oil futures, rightly
spooked the equity shorts everywhere in the oil sector. You might be waiting to see a stock go, rightly,
to zero, but if companies are continually able to extend their timelines on that at will, the possibility
that oil will recover in time to save them obviously increases the risk in the short position.
The short-covering panic affected the sector stocks differently, of course -- those
with the strongest balance sheets and lowest short commitment rallied the least; those on the other
side of the spectrum -- the ones most likely (still) to face Chapter 11 (like SeaDrill) rallied spectacularly.
But now where are we? There's been a long-overdue, short-covering rally that I've been
expecting. So what? And now what?
Here are some things I can say:
Oil has bottomed. We won't see any of the $10 or $20 targets that
some have picked. Unless the momentum algorithms regroup and again begin to accumulate (which is
easily trackable), we won't even see another $26 retest again, in my view. The contango (again trackable)
would have to begin to spike outwards as well.
Oil still isn't ready to get long-term bullish, yet, either. While
this short covering could easily take prices back to $40, that still only gets oil from a ridiculously,
unsustainably low price to merely an unsustainably low price. We still need to see a whittling away
of producers and drillers before any rally can be sustained. Drillers like SeaDrill have managed
to "add wick to their time bomb fuses" but we still await a few of those bombs to explode before
we'll be convinced the bear market is turning for good.
"... Brent prices are expected to climb from an average of $40 per barrel in 2016 to between $65 and $70 per barrel by the end of the decade. ..."
"... The price expectations are based on an email survey sent to more than 2,500 energy professionals working in oil and gas, banking, hedge funds, research, professional services, trading and specialist media earlier this month. ..."
"... That's great -- Now unwashed public knows the future. I think it is true the forecasts they got are tightly clustered because it is simply easier to answer what is expected from you (aka to give a "politically correct" answer) and avoid any personal responsibility ;-). Also such surveys have some propaganda value as they form people expectations. I am less sure whether they correctly report the true distribution of answers as some people are not shills and outliers are important. ..."
Oil prices are expected to rise gradually over the next five years but will remain well below
the pre-crash level, according to a survey of professionals who follow the oil industry.
Brent prices are expected to climb from an average of $40 per barrel in 2016 to between $65 and
$70 per barrel by the end of the decade.
The price expectations are based on an email survey sent to more than 2,500 energy professionals
working in oil and gas, banking, hedge funds, research, professional services, trading and specialist
media earlier this month.
More than 800 responded.
The results are more bullish than the futures strip, where Brent is currently trading around
$50 per barrel on average in 2020.
In the survey, there is a high degree of consensus about prices for the rest of 2016. Most forecasts
for 2016 are tightly clustered between $35 and $45 per barrel. Nearly all lie between $30 and
$50.
Brent prices have averaged just $33 per barrel so far in 2016, so most respondents expect prices
to be slightly firmer in the remainder of the year.
But in the latter years covered by the survey there is far less consensus about what will happen,
reflecting uncertainty about how far and how fast prices might recover from the crash.
The central forecast rises progressively by $5 to $10 per year between 2017 and 2020, but the
range of expectations also becomes successively more dispersed.
Most respondents expect prices to rise to around $65 to $70 per barrel by 2020. But as many as
a quarter think prices will remain stuck below $55, while another 25 percent think they will have
risen to more than $80 by then.
Despite market chatter about a looming supply crunch as a result of cuts in investment spending,
only 7 percent of respondents expect Brent prices to climb back to $100 or more by the end of
the decade.
I would greatly prefer the quotes with which you personally agree instead of the whole article.
There are several warning signs about this article:
The price expectations are based on an email survey sent to more than 2,500 energy professionals
working in oil and gas, banking, hedge funds, research, professional services, trading and
specialist media earlier this month.
More than 800 responded.
Quick question: What is the average level of those professionals and how many of them are talking
their books ?
Now another typical and dirty MSM trick in forming public expectations (very similar to use
of polls in elections):
Most forecasts for 2016 are tightly clustered between $35 and $45 per barrel.
That's great -- Now unwashed public knows the future. I think it is true the forecasts they
got are tightly clustered because it is simply easier to answer what is expected from you (aka
to give a "politically correct" answer) and avoid any personal responsibility ;-). Also such surveys
have some propaganda value as they form people expectations. I am less sure whether they correctly
report the true distribution of answers as some people are not shills and outliers are important.
I would like to ask a related and no less important question: the approximate number of bankruptcies
among US LTO producers and amount of junk bond written off in 2016 if this forecast materialize.
I do not know where the oil prices will be in a year or two, but IMHO it is important to view
skeptically Reuters info in general and their oil price survey in particular. Typically their
value is zero or less. Reuters clearly belongs to the "low oil price forever" camp (like most
MSM). Jeffrey Brown recently reminded us about similar position of The Economist (another respectable
completely reliable MSM :-) in 1999:
http://peakoilbarrel.com/the-ieas-oil-production-predictions-for-2016/#comment-558646
In any case, here is an excerpt from the March, 1999 Economist Magazine cover story on oil
prices:
Here is a thought: $10 might actually be too optimistic. We may be heading for $5. Thanks
to new technology and productivity gains, you might expect the price of oil, like that of most
other commodities, to fall slowly over the years. Judging by the oil market in the pre-OPEC
era, a "normal" market price might now be in the $5-10 range. Factor in the current slow growth
of the world economy and the normal price drops to the bottom of that range.
Generally this is the same situation as with S&P500 annual forecasts. Bought analysts from
crooked firms talk their books.
"... In an interview with Reuters, Ross said oil should recover to $50 a barrel by the end of the year, potentially aided by eventual supply cuts from leading producers among the Organization of the Petroleum Exporting Countries (OPEC). ..."
"... Instead, they would keep pumping and allow prices to fall. While they did not anticipate the longest and deepest oil price rout since the mid-1980s, the effort has at last begun to curb the rise of rival higher-cost producers such as U.S. shale drillers, another sign that prices may have found a bottom. ..."
"... In his note to clients, Ross also pointed to the recent agreement between major OPEC members and leading non-OPEC producer Russia to "freeze" production at January levels as a factor boosting market sentiment after a brutal period when the only safe trade seemed to be sell. ..."
"... Officials from less influential members such as Venezuela or Angola have occasionally referenced specific prices, generally in the vicinity of $70 to $80, ..."
Major OPEC producers are privately starting to talk about a new oil price equilibrium of $50 a
barrel, adding to signs that the market's long, deep rout is officially over, says one of the
industry's leading prognosticators.
Gary Ross, the founder, executive chairman and chief oil soothsayer at New York-based consultancy
PIRA, told clients 2-1/2 weeks ago that he reckoned the "lows are in" for crude, which was then
about $30 a barrel. U.S. futures <CLc1> have rallied since then to close at nearly $36 on Friday,
with a handful of analysts also cautiously calling a bottom.
In an interview with Reuters, Ross said oil should recover to $50 a barrel by the end of the
year, potentially aided by eventual supply cuts from leading producers among the Organization of
the Petroleum Exporting Countries (OPEC).
"They want $50 oil, this is going to become the new anchor for global oil prices," said Ross, one
of the industry's most respected forecasters for his bold price predictions and decades-long
history of consulting with OPEC members.
"While it may not be an official target price, you'll hear them saying it. They're trying to give
the market an anchor."
If Saudi Arabia and other powerful Gulf OPEC members begin invoking $50 as "fair price for
producers and consumers" - a once-favored phrase that has been absent for several years - it may
could signal the end of an unusual and extended period in which the group abandoned efforts to
manage the market.
After years of signaling satisfaction with prices hovering at around $100 a barrel, top
exporter Saudi Arabia in late 2014 led OPEC in its most dramatic policy shift in decades. No
longer would the world's top oil exporter, or its OPEC allies, agree to cut their own production
to support such high prices, which they feared would erode their share of the world market.
Instead, they would keep pumping and allow prices to fall. While they did not anticipate the
longest and deepest oil price rout since the mid-1980s, the effort has at last begun to curb the
rise of rival higher-cost producers such as U.S. shale drillers, another sign that prices may
have found a bottom.
In his note to clients, Ross also pointed to the recent agreement between major OPEC members
and leading non-OPEC producer Russia to "freeze" production at January levels as a factor
boosting market sentiment after a brutal period when the only safe trade seemed to be sell.
The pact will do little to curb immediate oversupply, especially with Iran exports still swelling
after the end of sanctions. Still, working together on "verbal intervention" was a positive start
that "could lead to eventual cuts" after a period in which Saudi Arabia and Russia made little
effort toward any kind of cooperation, he said.
"Russian production is going down anyway, why not agree to a freeze and then cuts?" Ross told
Reuters.
The $50 figure was in line with analysts' consensus for 2017 U.S. prices, according to the last
Reuters poll, although much higher than the $38 a barrel median for this year.
Ross, whose forecasts are not normally made public, was among the few analysts to anticipate
OPEC's decision to let prices fall in 2014.
While he was wrong-footed in the first part of last year, when crude's rebound to around $60 a
barrel proved temporary, he joined others such as Goldman Sachs in taking a much more bearish
view in more recent months, predicting in December that U.S. crude would drop below $30 a barrel
in February.
Ever since the market detached from the $100 a barrel figure that anchored it from 2010 to 2014,
analysts, traders and executives have struggled to pinpoint where it might ultimately settle,
agreeing only that it would be a period of extraordinary volatility in the absence of any overt
OPEC guidance.
Officials from less influential members such as Venezuela or Angola have occasionally
referenced specific prices, generally in the vicinity of $70 to $80, but the bigger Gulf
producers have largely avoided any public mention of a new reference point, leaving the market
adrift.
"... Interesting we are seeing a crude oil rally in March, as in 2009 and 1999. Of course, we also had a rally in April in 2015 that didn't hold. ..."
"... There are some that are saying this is due to a massive short squeeze ..."
"... Could be anything. Could be short squeeze, could be Chinese, could be Japan (based on a secret G-20) agreement. Who is the biggest beneficiary of an oil price "stabilizing" around $35 – 45? Besides the containment of contagion from energy to banking sector – Obama to Hillary baton hand-off. ..."
There are some that are saying this is due to a massive short squeeze as happened
recently with iron ore, but I had not thought about the March correlation.
Last April didn't include the most important presidential election this country has seen in decades.
If either of the two insurgent candidates wins it could deliver a mortal blow to the empire. Anyone
who thinks they know why the price of oil is rallying is living in crazy-town.
Could be anything. Could be short squeeze, could be Chinese, could be Japan (based on a
secret G-20) agreement. Who is the biggest beneficiary of an oil price "stabilizing" around $35
– 45? Besides the containment of contagion from energy to banking sector – Obama to Hillary baton
hand-off.
The more recent descent of oil prices below $30 per barrel is inducing another period of
contraction in drilling activity, which is clearly visible with the rig count in free fall.
Individual shale basins are feeling the pinch to various degrees. The Eagle Ford shale in
South Texas, for example, had over 200 rig counts as of late 2014. That figure has fallen to just
46 as of early March. Oil production from the Eagle Ford has declined by 0.5 million barrels per
day since the middle of last year. The Permian Basin in West Texas had over 500 oil and gas rigs
at the end of 2014, a level that has plunged to just 158. Oil production from the Permian has
finally come to a halt, and could begin to decline through this year.
There tends to be a lag between movements in the oil price and the resulting effects on the
rig count. As a result, the rig count may not rebound immediately even if oil prices rise. That
means that with production in the U.S. now declining, the declines should continue at a steady
pace until oil prices post a sustained rally.
Oil speculators are becoming more bullish on oil prices. Hedge funds are rapidly liquidating
their short bets, as fears of sub-$20 oil have all but vanished for now. According to data from
the CFTC, net-short positions fell by 15 percent for the week ending on March 1. "We might see
the real bottom being behind us," Ed Morse, head of global commodity research at Citigroup Inc.,
said on Bloomberg TV on March 4.
In addition, although a lot of questions remain, OPEC representatives are planning on meeting
with Russia's energy minister between March 20 and April 1 to follow up on their production
"freeze" agreement. An outright cut to production remains a long-shot, especially since Saudi
Arabia's oil minister Ali al-Naimi all but ruled it out at the IHS CERAWeek conference in Houston
in late February. It is hard to imagine OPEC and Russia shifting course from the production
freeze, but any agreement to take additional action represents an upside risk to oil prices.
Given the mounting evidence, it seems that the oil price rally is finally here, then? Maybe.
But it is also possible that bullish sentiment is starting to outstrip the fundamentals, even if
the fundamentals are trending in the right direction.
"... Anyone who thinks they know why the price of oil is rallying is living in crazy-town. Could be anything. Could be short squeeze, could be Chinese, could be Japan (based on a secret G-20 agreement). ..."
There are some that are saying this is due to a massive short squeeze as happened recently with
iron ore, but I had not thought about the March correlation.
Last April didn't include the most important presidential election this country has seen in decades.
If either of the two insurgent candidates wins it could deliver a mortal blow to the empire.
Anyone
who thinks they know why the price of oil is rallying is living in crazy-town. Could be anything.
Could be short squeeze, could be Chinese, could be Japan (based on a secret G-20 agreement). Who
is the biggest beneficiary of an oil price "stabilizing" around $35 – 45? Besides the containment
of contagion from energy to banking sector – Obama to Hillary baton hand-off.
Though Iran hasn't committed to a production freeze, since it wants to ramp up production to pre-sanction
levels, Russian Energy Minister
Aleksander
Novak has noted that "Iran has a special situation as the country is at its lowest levels
of production. So I think, it might be approached individually, with a separate solution."
With all the major Gulf nations agreeing, Iraq, which is without a credible political leadership,
will also likely follow suit if Russia assures them of stronger support against ISIS.
If the
above scenario plays out, Russia will emerge as the de facto leader of the major oil producing
nations of the world, accounting for almost 73 percent of the global oil supply.
Along with this, Russia has been in the forefront of plans to move away from Petrodollars,
and Moscow has formed pacts with various nations to trade oil in local currencies. With this new
cartel of ROPEC (Russia and OPEC nations), a move away from petrodollars will become a reality
sooner rather than later.
Russia is smart. Vladimir Putin is genius. Moscow senses the opportunity that is almost tangibly
floating about in the low crude price environment and appears to be ready to capitalize on it
in a way that would reshape the geopolitical landscape exponentially.
Crude oil traders like Vitol Group and BP (BP)
take advantage of the broader contango market. These traders buy front-month crude oil futures contracts
and take delivery upon their expiration. They store this crude oil in Cushing, Oklahoma, and then
sell it at higher prices in six months. Industry surveys estimate that leasing costs at large tanks
in Cushing were 25–35 cents per barrel per month compared to the 12-month contango price of $8.27
per barrel, as shown in the chart above. Thus, the storage cost of crude oil for 12 months could
be $4.20 per barrel at most, keeping administrative fees and other pumping costs at $1 per barrel
for 12 months. This means traders could make a profit of $3 per barrel.
Further, the EIA (U.S. Energy Information Administration) estimates that storing crude oil in
large oil tankers for several months is expensive. It estimates that the trade will be unviable until
contango conditions reach $10–$12 per barrel. Citigroup suggests that if oil prices fall below $30
per barrel, it would be unviable to store crude oil at sea.
Effect on crude oil tankers
However, long-term oversupply and the broader contango market have benefited oil tankers like
Nordic American Tankers (NAT),
Teekay Tankers (TNK), Frontline
(FRO), Euronav (EURN),
DHT Holdings (DHT), and Tsakos
Energy Navigation (TNP).
The steep contango conditions in the ultra-low sulfur diesel market provide opportunity for contango
traders and supertankers. Ultra-low sulfur diesel inventories in the United States have risen more
than total motor gasoline inventories since the middle of June 2014.
ETFs and ETNs like the United States Oil Fund (USO),
the iPath S&P GSCI Crude Oil Total Return Index ETN (OIL),
the VelocityShares 3X Long Crude Oil ETN (UWTI),
and the ProShares UltraShort Bloomberg Crude Oil ETF (SCO)
are also influenced by the rises and falls in crude oil prices.
In the next part of this series, we'll shift our focus to the US crude oil rig count.
"... The trader's life is also made trickier by the volatility in the market, which has seen prices rise and fall by several dollars a barrel in a day. "Over the last two or three years we've seen a huge increase in volatility and that's probably due to moving more from a physical group of companies trading to a financial-based scenario," he says. ..."
"... "It's the momentum of these big hedge funds and financial institutions, which makes the market move by percentage points rather than the 30 or 40 cents you used to get three or four years ago." ..."
"... Those sudden, big movements make it difficult for traders to be off-duty. "You can never leave your position, even if technically you've left it, ie you've gone home," Ms Clubley says. ..."
Oil traders never stop talking to each other. Oil traders have to weigh up a great deal of
information
The most popular software among oil traders is not an oil trading package or even a news service
such as Reuters - it is Yahoo Instant Messenger.
"Trading oil is about getting information and knowing where the market is," says Eivind Lie who
runs the trading desk at the Norwegian oil company StatoilHydro's offices in London.
"So being a trader your life is pretty much either on Yahoo or on the telephone trying to get an
overview of the market."
Keeping in touch
While people trading shares or currencies can get a lot of their information from analysts' notes
and computerised trading systems, the oil trader still relies on chatting to a wide range of
people, ranging from other traders to specialist oil trading journalists, to try to find out what
is going on in the world.
Everything from war or natural disasters to more mundane events such as seasonal changes to
temperatures or elections can affect oil prices, so for the traders it pays to be informed.
Richard Wickham, one of the crude oil traders at Statoil, makes his first call to the office on
the way to the station after he has dropped his children off at the nursery.
Then as soon as he gets to the office he will read price reports and messages from Statoil staff
who have been trading in the US and Asia and talk to the London-based analyst.
After that, the less formal process of talking to people really gets going.
"Collating information is more than half the job," Mr Wickham says.
"Executing trades is almost small in comparison - if you don't have the information you're
blind," he says, staring at the four computer screens on his desk, which display a bewildering
array of graphs, figures, reports and message windows.
There is little else on the desk besides family photographs and a strategically-placed Norwegian
dictionary, for when he is trying to understand messages from the company's head office in
Stavanger.
Distressed cargoes
Statoil is one of the world's largest exporters of oil and, with oil topping $100 a barrel on
supply concerns, its products are in great demand.
Yet it has a relatively small trading desk in London, with just a handful of traders. "If it's a
weak market then we have to go out and sell it more actively, if it's a strong market they come
and buy it from us," Mr Lie says. Currently, demand is strong, though the traders are
nevertheless on the phone, talking to other traders, analysts and brokers.
Everyone in the market for physical oil - as opposed to paper market traders, who do not want to
end up owning any oil - is looking for that precious piece of information that will allow them to
sell oil for more, or buy it for less.
"From our side, as the seller of oil, we want to get to know the buyer's position," Mr Lie says.
"Are they short of oil, do they really need more?" The holy grail for buyers is to find a seller
having difficulty selling a shipment. "If you get too close to the delivery date, when it's taken
aboard a ship in the North Sea, and it's not sold, then the buyers know that we have what's
called a 'distressed cargo', so they will try to get a cheap price for that," he adds.
Volatile market
It may be a good time to be a seller of oil, but the way oil is traded means it can still be
nerve-wracking. "There are a lot of market price contracts where I would sell you oil today, but
we price it the day the ship loads, which might be in three of four weeks time," says Sally
Clubley, an independent oil consultant who trains oil traders.
"So we've done the deal today, but we don't know the price today and there's a lot of oil traded
on that basis."
The trader's life is also made trickier by the volatility in the market, which has seen
prices rise and fall by several dollars a barrel in a day. "Over the last two or three years
we've seen a huge increase in volatility and that's probably due to moving more from a physical
group of companies trading to a financial-based scenario," he says.
"It's the momentum of these big hedge funds and financial institutions, which makes the
market move by percentage points rather than the 30 or 40 cents you used to get three or four
years ago."
Those sudden, big movements make it difficult for traders to be off-duty. "You can never
leave your position, even if technically you've left it, ie you've gone home," Ms Clubley says.
"It really is a 24-hour job because they don't trust anybody else with it."
Mr Lie agrees.
"I think some of the traders always carry their phones, even on vacations," he says. "It's a
lifestyle more than a job so you have to enjoy it."
That's the verdict from Daniel Fine, one of Gov. Susana Martinez's senior advisers on energy
policy. The U.S. oil and gas industry - and the San Juan Basin - is in a "bust" period, Fine said
Tuesday at an inter-tribal energy conference at San Juan College's School of Energy.
"This is what a bust is. You lose the workforce," said Fine, who is associate director at New
Mexico Center for Energy Policy at New Mexico Tech. "Loss to the country and to the Southwest
will be the workforce. It will be decimated at levels of less than $30 a barrel (of crude oil)."
And 2015 was a year of layoffs and cutbacks.
Since the collapse of oil prices on the commodities market in fall of 2014, the number of workers
laid off from local oil and gas companies - from the large corporations to the smaller
independents - has been in the thousands.
"We're in a 'bust.' So be ahead of the curve, and think ahead in this business by at least six
months," Fine told the Native American and non-tribal energy leaders and business people in the
Merrion conference room at the new $15.8 million school.
He said looming federal regulations such as the the U.S. Bureau of Land Management's proposed
Onshore Oil and Gas Orders Nos. 3, 4 and 5 along with proposed updates to its rule aimed at
reducing "fugitive" atmospheric methane from oil and gas operations were doubling the pain
already caused by low crude oil prices. He said that a third of all U.S. oil and gas producers -
especially those burdened with debt - will inevitably go bankrupt.
But Fine's sobering analysis wasn't without one ray of hope for the industry.
He said that if the Organization of the Petroleum Exporting Countries, or OPEC, decides to reduce
the supply of crude oil at its June 2 meeting in Vienna, crude oil prices could climb back up to
the $50 a barrel. Commodities prices, he said, were now solely driven by foreign markets and out
of the hands of U.S. operators.
And to help ease the impending pain to tribal energy companies - and establish a precedent for
others - Fine suggested tribal energy leaders request exemptions from the federal government over
the proposed new rules.
With just two rigs drilling in the San Juan Basin, Fine said that people might find a modicum of
comfort by taking the long view.
He recommended everyone in the room read the 2002 book, "Gas: The Adventures into the History of
one of the World's Largest Gas Fields - The San Juan Basin of New Mexico."
Written by local independent oilman Tom Dugan and geologist Emery Arnold, the book takes readers
on a journey forward from the basin's first commercial oil and gas wells in the early 1920s and
through major boom-and-bust cycles in the 20th Century.
Dugan, president of the Dugan Production Corp. in Farmington, said he agrees with Fine on the
current state of the industry.
"Definitely it's a bust," Dugan said. "What I'm saying is that it's the worst of them all. It's
the hardest bust I've been through and I have been in this business for 57 years."
Never before have multiple agencies of the federal government proposed new oil and gas rules
during a "bust" period, he said. Complying, he added, would be a lot more feasible if those rules
had come along when natural gas was around $5 per million BTU and a barrel of crude oil was
selling near $100.
Dugan said the dovetailing of low commodities prices and the new federal rules - along with the
advent of horizontal drilling - have spurred him to consider picking up his pen to write a new
edition of "Gas."
He said he still stands by a prediction he first made in his book that the San Juan Basin will
deliver salable natural gas for another 100 years.
And that, eventually, a "boom" is bound to happen.
"It will come back," he said. "I just wish I knew when."
James Fenton is the business editor of The Daily Times. He can be reached at 505-564-4621.
Looks like the range of oil prices below $70 which represents the "death valley" for US LTO production
also exists for UK North Sea fields.
Most fields might degrade at natural depletion rate already
in 2016. Which is up to 22%.
Investment in the UK's embattled oil and gas industry is expected to fall by almost 90 per
cent this year, raising urgent industry calls for the Government to reform its North Sea tax
regime to safeguard the industry's future, reports
RT reports that if Brent price in 2016 stays in 0-70 range capex in the North Sea fields might
be reduced by almost 90%.
According to the report of the British Association of oil and gas industry, with current prices,
almost half of the oil fields in the UK produce oil at a loss.
The fall in oil prices has a negative impact on the UK economy. According to the report
of the British Association of oil and gas industry, the country plans to reduce by 90% investments
in the development of offshore fields in the North Sea. According to the expert in the field
of oil industry of Mamdouh Salamah, for the United Kingdom will be cheaper to import crude,
not to invest in new projects.
With current prices, almost half of the oil fields in the UK produce oil at a loss.
An expert in the field of oil industry Mamdouh Salama believes that in this situation for
the United Kingdom would be more profitable to import oil, not to invest in new projects. According
to him, for resumption of capital investments, the level of oil prices should be higher than
$60-70 per barrel.
"Given the fall in oil prices it's more profitable for the UK to import crude oil and refine
it locally, rather than invest in the North sea fields" said Salam.
Oil production from major U.S. shale fields is expected to fall by 106,000 barrels a day in April
from March to total 4.871 million barrels a day. but this is nothing but an optimistic forecast as EIA
usually overestimate production on the down slope. So it can well be closer to 0.2Mb/d drop.
The Drilling Productivity Report uses recent data on the total number of drilling rigs in operation
along with estimates of drilling productivity and estimated changes in production from existing oil
and natural gas wells to provide estimated changes in oil and natural gas production for seven key
regions. EIA's approach does not distinguish between oil-directed rigs and gas-directed rigs because
once a well is completed it may produce both oil and gas; more than half of the wells produce both.
While shale resources and production are found in many U.S. regions, at this time EIA is focusing
on the seven most prolific areas, which are located in the Lower 48 states. These seven regions accounted
for 92% of domestic oil production growth and all domestic natural gas production growth during 2011-14.
There is perhaps no more perverse relationship in the world than that which exists between
the West and Saudi Arabia - or, "the ISIS that made it," as Kamel Daoud, a columnist for
Quotidien d'Oran, and the author of "The Meursault Investigation"
calls the kingdom.
We've been over and over the glaring absurdity inherent in the fact
that the US and its partners consider the kingdom to be an "ally" in the fight against terrorism
and you can read more in the article linked above, but the problem is quite simply this:
the Saudis promote and export an ultra orthodox, ultra puritanical brand of Sunni Islam that is virtually
indistinguishable from that espoused by ISIS, al-Qaeda, and many of the other militant groups the
world generally identifies with "terrorism."
Wahhabism - championed by the Saudis - is poisonous, backward, and fuels sectarian strife
as well as international terrorism. That's not our opinion. It's a fact.
But hey, Riyadh has all of the oil, so no harm, no foul right?
Even as the very same ideals exported by Riyadh inspire the ISIS jihad, the kingdom
is so sure it has the political world in its pocket that it sought a seat on the UN Human Rights
Council, even as the country continues to carry out record numbers of executions.
They even had the nerve to establish what they called a
34-state Islamic military alliance against terrorism in December. Of course the members don't
include Shiite Iran (the Saudis' mortal enemy) or Shiite Iraq, both of which are actually
fighting terror rather than bombing civilians in Yemen and engaging in Wahhabist proselytizing.
But while everyone in the world is well aware of just how silly the "alliance" is, the farce will
apparently continue as French President Francois Hollande on Friday awarded Crown Prince
Mohammed bin Naif France's highest national honor, the Legion of Honor for "for his efforts in the
region and around the world to combat extremism and terrorism."
"... So, bottom line is, filling up of oil storage early in the cycle is an indicator of oversupply. But in the current late cycle of low oil prices [1.5 yrs already] it is a useless indicator of future oil price movement, oil demand or supply. ..."
Ron, I am a regular reader of your blog and find it very insightful. I have not seen much written
about Oil super contango and reasons for oil storage at multi decade high so would like to highlight
below.
When there is a temporary over supply, it fills up storage, as more and more storage get filled
up it leads to an increase in storage cost. This in turn lead to a contango, meaning future oil
prices being at premium. Currently premium stands at 20% for 1 year forward contract. This is
super contango and a bonanza for oil traders. If you can find a place to store oil you can make
risk free returns of 20% – (storage cost). So, why storage space are filling up so fast its because
commodity traders are scrambling to make this trade. It's a positive feedback loop. It can only
end when supply falls below the consumer demand.
So, bottom line is, filling up of oil storage early in the cycle is an indicator of oversupply.
But in the current late cycle of low oil prices [1.5 yrs already] it is a useless indicator of
future oil price movement, oil demand or supply.
"... In the years of $100 oil, U.S. oil companies took out half a trillion in risky corporate debt known as junk bonds and leveraged loans, both of which are considered at high risk of default. That money fueled the nation's shale oil bonanza. Since December, some of the same domestic explorers have raised $9.54 billion from equity investors to cover their swelling debt obligations. ..."
"... Tillerson's assessment of the U.S. oil industry likely comes as a disappointment to market observers speculating that Exxon Mobil will make a multibillion-dollar corporate acquisition anytime soon. ..."
"... What's more, companies that would consider selling themselves are still expecting too-high prices, so deal-making has "gotten more difficult, not easier," Tillerson said. ..."
"... "We take a lot of grief when the volumes don't grow," Tillerson said. "It doesn't bother us. We know it's all about the shareholder's money. One of the things that seems to be lost on people is just staying flat when you're running a depleting business, that's quite an accomplishment." ..."
"... He said the company invested about $190 billion over the past decade – that's about half its current stock-market value – but its production growth has lagged behind wildcatting peers. ..."
"... Exxon Mobil has had a reputation of relentless cost-cutting for more than a century, since the days of J.D. Rockefeller's Standard Oil, its 19th century corporate ancestor, which, unlike many other modern oil companies, started as a margins-based refining business, and gradually entered the oil-production side. ..."
"... "This current environment actually plays to our strengths," Tillerson said. ..."
"... The Exxon Mobil chief said oil prices could go lower than current levels, as producers are still oversupplying a global oil market that doesn't need as much oil at the moment. The global economy isn't "particularly inspiring," with U.S. gross domestic product likely to come in under 3 percent this year and China's transition from a diesel-heavy manufacturing economy. ..."
"... Still, even when oil prices recover, it may not matter for some over-levered companies. "We don't feel compelled to be in a big rush (to transact an acquisition) even if the environment changes for some of these companies, it doesn't necessarily change the value proposition because of the shape they put themselves in," Tillerson said. ..."
The CEO of Exxon Mobil says buying a rival U.S. oil driller would be like
purchasing a home with a big mortgage and a sliver of equity: it's a lot of
debt to pay off, with little to show for it.
For the biggest U.S. oil company, the nation's shale oil and gas resources
look promising, but they've been "encumbered" by smaller independent exploration
and production companies that are struggling to pay off high levels of debt
and that have diluted shareholder value in a recent string of stock sales.
"There's been a fair amount of value destruction in the past year as they
have continued to access capital markets and levered up," Exxon Mobil Chairman
and CEO Rex Tillerson told investors on Wednesday, during an annual investor
update. The big question in weighing today's slate of takeover targets, he said,
is this: "Is it going to add value or has the value just kind of been destroyed?"
In the years of $100 oil, U.S. oil companies took out half a trillion
in risky corporate debt known as junk bonds and leveraged loans, both of which
are considered at high risk of default. That money fueled the nation's shale
oil bonanza. Since December, some of the same domestic explorers have raised
$9.54 billion from equity investors to cover their swelling debt obligations.
Deal or no deal?
Tillerson's assessment of the U.S. oil industry likely comes as a disappointment
to market observers speculating that Exxon Mobil will make a multibillion-dollar
corporate acquisition anytime soon.
It is perhaps the only large integrated oil company with the cash to purchase
a major rival amid the ongoing oil downturn, but even after a year and a half,
it hasn't explicitly telegraphed it will be part of an impending wave of corporate
consolidation in the oil industry – an event often predicted by often-frustrated
observers.
What's more, companies that would consider selling themselves are still
expecting too-high prices, so deal-making has "gotten more difficult, not easier,"
Tillerson said.
"It's tough for us because we would like to do something," he said. "We see
there's a lot of quality resources out there, it's just how they've been encumbered.
What we're finding is we're spending more of our time on asset deals."
Borrowing to invest
Exxon Mobil this week announced it would borrow $12 billion in corporate
debt, which could supplement the Irving-based company's war chest of cash if
it wanted to buy another company.
But Tillerson didn't go into detail about what the sum was meant for, only
reemphasizing the company's focus on building value for long-term shareholders,
either through investing in projects or sending the cash it generates back to
investors.
"These projects have returns that are multiples over our borrowing costs,"
he said. "So that's the way I view the borrowing. We're going to put the money
to work. We're not going to borrow to write a check to somebody."
Exxon Mobil is planning to cut its capital spending 25 percent this year
to $23.3 billion, after a rough 2015 in which the company wrung less than half
the cash out of the dollars it spent compared to the last five years.
The company's return on capital employed, one of the most important financial
metrics for Exxon Mobil, sank from an average 18 percent over the past five
years to 7.9 percent in 2015, but it was still 4 percentage points above its
closest rival, French oil company Total.
Depleting business
As it cuts back, the company believes it will produce between 4 million and
4.2 million barrels of oil equivalent a day through the end of the decade, keeping
its production flat, in line as last year's 4.1 million barrels a day. That's
less than the daily 4.3 million barrels it had planned in 2017, but it's doesn't
deter Exxon Mobil from its true goal – building shareholder value, Tillerson
said.
"We take a lot of grief when the volumes don't grow," Tillerson said.
"It doesn't bother us. We know it's all about the shareholder's money. One of
the things that seems to be lost on people is just staying flat when you're
running a depleting business, that's quite an accomplishment."
He said the company invested about $190 billion over the past decade
– that's about half its current stock-market value – but its production growth
has lagged behind wildcatting peers.
"That just tells you how hard it is to hold your own in a depleting business,"
he said. "What we're really trying to do is just deliver the best value. Nothing
has changed about that."
Exxon Mobil has had a reputation of relentless cost-cutting for more
than a century, since the days of J.D. Rockefeller's Standard Oil, its 19th
century corporate ancestor, which, unlike many other modern oil companies, started
as a margins-based refining business, and gradually entered the oil-production
side.
"This current environment actually plays to our strengths," Tillerson
said.
Current environment
The Exxon Mobil chief said oil prices could go lower than current levels,
as producers are still oversupplying a global oil market that doesn't need as
much oil at the moment. The global economy isn't "particularly inspiring," with
U.S. gross domestic product likely to come in under 3 percent this year and
China's transition from a diesel-heavy manufacturing economy.
"I don't think we can look to the market's demand side to necessarily solve
this quickly for us," he said.
Still, even when oil prices recover, it may not matter for some over-levered
companies. "We don't feel compelled to be in a big rush (to transact an acquisition)
even if the environment changes for some of these companies, it doesn't necessarily
change the value proposition because of the shape they put themselves in," Tillerson
said.
"... He points out that his billionaire owner has given him $250 million (quarter of a billion) to buy up worthwhile acquisitions and he can hardly find anything worth buying. Slim pickings indeed. ..."
"... I should add that the company does not deal in LTO–conventional only. LTO isn't the only area hurting. ..."
He points out that his billionaire owner has given him $250 million (quarter of a billion)
to buy up worthwhile acquisitions and he can hardly find anything worth buying. Slim pickings
indeed.
That quarter of a billion will be raised to one billion dollars if the new acquisitions justify
it. If there isn't enough available, though, the owner will close the company.
"... I do not agree that $55 (assume WTI) is enough to keep the basins flat or grow production, without significantly more cost reductions. The company 10K, demonstrate that. Not enough future net cash flow. Especially as those calculations are sans interest and g & a. ..."
"... the average Bakken well produces 190K in 60 months. 152K is assumed 80% NRI. ..."
"... These guys just throw out prices, never any substance behind what they say. For once I would like to see an article that walks through the numbers and proves us wrong, but they can't, so they won't. ..."
I do not agree that $55 (assume WTI) is enough to keep the basins flat
or grow production, without significantly more cost reductions. The company
10K, demonstrate that. Not enough future net cash flow. Especially as those
calculations are sans interest and g & a.
Again, the average
Bakken well produces 190K in 60 months. 152K is assumed 80% NRI.
152,000 x $48 per barrel (assumed $7 basis discount) is $7,296,000.00
$7,296,000.00 less 10% severance = $6,566,400.00
Subtract gathering of $1.50, LOE of $8 and G &A of $2.50. We are now
at $4,742,000.00. This isn't enough in 60 months for a well that costs $6.5-8
million.
These guys just throw out prices, never any substance behind what
they say. For once I would like to see an article that walks through the
numbers and proves us wrong, but they can't, so they won't.
Sure, a standout well can work. Our standout wells work at $20. No one
has only standouts, unless they are fairly small.
Actually that's just a wild ass guess. It takes about a month, I am told,
do drill a horizontal well, a lot shorter for a vertical well. But I may
be wrong. Mike or some other oilman may chime in and tell me how wrong I
am. I found this so it looks I was pretty close.
While there have been instances when wells were drilled in as little
as 15 days, a reasonable expectation for the time required to drill a well
in the Eagle Ford is around one month.
How long does it take to drill a well and begin producing natural
gas?
Horizontal drilling currently takes approximately 18-25 days from start
to finish. Then, the well needs to be fracture stimulated in order to release
the gas. It is then connected to a pipeline, which transports the gas to
the market. From drilling to marketplace, the entire process can take up
to 3-4 months. Mike ,
07/27/2014 at 1:08 pm
Mr. Patterson, I enjoyed this post and sent it immediately to my employees
and my family with a beware or be square header; I can't give you a
bigger compliment than that. I hope it gets attention outside the peak
community.
A typical 14,000 ft. TMD well in unconventional shale takes about
3 weeks, spud to TD, you are correct. They can blow them down these
days because there are no intermediate casing strings to set, or logging
or evaluating to do going down, and the top drives they use now, instead
of rotary tables, makes the radius and lateral a piece of cake. To reach
some economy of scale, as we now know, they drill multiple wells on
long pads simply being able to walk the rig from well to well; that
is where the 2 1/2 to 3 weeks per well number comes from, IMO. It takes
a good week to tear down a big rig, load it out (35-50 loads), get it
down the highway, unload it, put it all back together again and ready
to turn to the right. In that case, 4 weeks, plus.
I think we can't use unconventional shale data for well time or costs
in Russia, however. That's all typical conventional reservoirs, many
of which are under pressured, and over pressured, require several casing
strings and everything in Russia happens in very slow motion. Many big
fields in Russia range greatly in depth too.
While I am on, I always get a kick out of the notion that other shale
resources throughout the rest of the world will save the day. The maps
sure look perddy. But no other country in the world will have the ability
to develop its shale resources as efficiently, and cheaply, as N. America
can, IMO.
And by the by, here in the US all we can hope for from shale is internal
rates of return of 70-80% of total CAPEX, over 20 years, so the shale
industry hopes.
Can the rest of the world find the money to get on the shale treadmill,
for only those kinds of returns? No way, Jose. I always like to remind
folks who look forward to abundant shale production from the rest of
the world…of Poland.
"... Offshore oil exploration success has not been good recently. Admittedly there was a hit in the GoM from the BP disaster and now the price collapse, but in the past some of the best quality finds occurred in slow down periods. ..."
"... The decline rates for deep water are very high, not quite in the LTO league but requiring a lot of drilling to keep the production facilities at high capacity ..."
"... For me that would present much higher risk to future price volatility than for what I would think of as "conventional" developments, so requiring bigger resources and/or guaranteed higher prices for FID decisions. ..."
"... George, US is NOT the world. Canadian conventional drilling slowed greatly already a year ago. Deep water drilling plans off the cost of Africa and North Sea are also cancelled. Shell Arctic drilling is cancelled. Are you telling me that all these worldwide projects are equivalent to 3 mediocre Shale plays in US? ..."
"... Well said -- Simultaneous production of junk bonds and shale oil was probably the most recent of Wall Street "innovations". Which under close look are always reincarnations of some old financial scam. In this case, in price range 0-70 per bbl it is just a Ponzi scheme or, at best, a speculative investment which fully relies on "evergreen" loans. ..."
As long as shale corps. will find any kind of financing, then they will keep drilling. The only
reason that they have decreased drilling by so much recently is because their access to loans
has been slashed. Their last line of defense is that they have managed to issue shares on Wall
Street.
But at the end of the day there is way more conventional, deep water around the world that will
not be drilled at these prices so on the global scale shale is just too small to make up a difference
and eventually they will run out of sweet spots anyway. Shale is like one hit wonder like "99
Luftbaloons" from Nena in the 80's :-)
The long-term for US shale oil production is definitely down, also of US oil production in general.
For that there can be no doubt. But there will be ups and downs along the way.
"conventional, deep water" is a bit close to an oxymoron for me. And is there really "way more"
of it or has that just been wishful thinking as we've run out of other plays?
Offshore oil exploration success has not been good recently. Admittedly there was a hit
in the GoM from the BP disaster and now the price collapse, but in the past some of the best quality
finds occurred in slow down periods.
The discoveries I've seen recently have mostly been small gas fields. But Marathon and
COP look to have lost interest. The decline rates for deep water are very high, not quite
in the LTO league but requiring a lot of drilling to keep the production facilities at high capacity
.
For me that would present much higher risk to future price volatility than for what I would
think of as "conventional" developments, so requiring bigger resources and/or guaranteed higher
prices for FID decisions.
George, US is NOT the world. Canadian conventional drilling slowed greatly already a year
ago. Deep water drilling plans off the cost of Africa and North Sea are also cancelled. Shell
Arctic drilling is cancelled. Are you telling me that all these worldwide projects are equivalent
to 3 mediocre Shale plays in US?
Volatility? Shale is synonym for volatility. So the rest of the higher cost world oil industry
said "Let the Shale pump what it has to pump and then we will get back to oil business again"
George, I can assure you that the rest of the world, including US conventional, pumps oil not
for the sake of practice but for the sake of profit.
So they will let Wall Street run their shale pet project to the ground and go back to business
later.
let Wall Street run their shale pet project to the ground and go back to business later.
Well said -- Simultaneous production of junk bonds and shale oil was probably the most recent
of Wall Street "innovations". Which under close look are always reincarnations of some old financial
scam. In this case, in price range 0-70 per bbl it is just a Ponzi scheme or, at best, a
speculative investment which fully relies on "evergreen" loans.
In a Ponzi scheme the operator pays returns to its investors from new capital,
rather than from profit earned by the operator in the expectation of oil price rise. This is
were "unlimited" Wall Street financing of shale bubble played the crucial role. It allowed
carpet bombing of shale plays with wells and eventually led to the current oil price crash.
And new profits to Wall Street. A new redistribution of wealth up.
As John Kenneth Galbraith said: "Financial operations do not lend themselves to innovation. What is recurrently so described and
celebrated is, without exception, a small variation on an established design . . . The world of
finance hails the invention of the wheel over and over again, often in a slightly more unstable
version."
It will be very interesting to see the situation in oil market three years from now.
"... These figures are backed up by EIA. There is some horizontal Mississippian production in KS, and it is down significantly, but so are all the larger production conventional counties. This is a 21% decline in under one year. ..."
"... Again, these numbers fairly correspond to EIA. This is decline of 20%. Anecdotal, I agree. Have to wonder if declines this steep have occurred in other parts of the world? I am an American through and through. But, I will admit that, not only do we have very short attention spans, but we tend to hyper focus on things. I have hyper focused on shale like the rest, but I at least realize there are many places where production has absolutely tanked. ..."
"... Many think lower for much longer. It could very well be that once the hype in the US turns, things could go quickly. ..."
"... WTI is up almost 40% since 2/11/15, 15 trading days. ..."
"... IMHO for "things go quickly" we need a trigger event that suddenly becomes a focus of news coverage. Some large bankruptcy. Whatever. May be March 20 meeting in Moscow can serve as a trigger for some short squeeze, despite the measure to be taken is an old news. But just the level of determination of oil producing countries on this meeting might be interpreted as an important market signal. ..."
"... The time lag between rig counts and actual production stands around 2 to 4 years for the general oil production index, which includes conventional and unconventional off- and onshore production (see below chart). In my view the time lag for shale is just six months and for conventional production it is at least 18 months. As an example in 2005 a doubling of the rig count did not raise oil production until 2009. ..."
These figures are backed up by EIA. There is some horizontal Mississippian production in KS,
and it is down significantly, but so are all the larger production conventional counties. This is a 21% decline in under one year.
Per the Utah Department of Natural Resources, Division of Oil, Gas and Mining:
1/15. 110,594 barrels of oil per day, 5,127 producing wells, 772 shut in, 169 T'A.
12/15. 88,469 barrels of oil per day, 4,796 producing wells, 1,157 shut in, 149 T'A.
Again, these numbers fairly correspond to EIA. This is decline of 20%. Anecdotal, I agree. Have to wonder if declines this steep have occurred in other parts of the
world? I am an American through and through. But, I will admit that, not only do we have very short
attention spans, but we tend to hyper focus on things. I have hyper focused on shale like the
rest, but I at least realize there are many places where production has absolutely tanked.
Many think lower for much longer. It could very well be that once the hype in the US turns,
things could go quickly.
WTI is up almost 40% since 2/11/15, 15 trading days.
As AlexS pointed out, there will likely be at least a 6 month lag until US activity pick up.
He thinks longer, and it makes sense. Balance sheets need major repair. Believe me, speaking from
personal experience here.
I do not foresee a straight shot up, but the world has lost a lot of oil due to this crash
IMO.
Many think lower for much longer. It could very well be
that once the hype in the US turns, things could go quickly.
I think Obama administration might object, as they need another 10
months to drive into the sunset
:-)
Dominant (sustained by propaganda machine) myths like "oil glut",
"storage overflow", fight for market share and mass overproduction by oil
producing countries (except, of course, the USA, where shale producers
suffer under brutal attack from Saudi Arabia :-)
have now a life of their own and are difficult to change even when
completely detached from reality.
IMHO for "things go quickly" we need a trigger event that suddenly
becomes a focus of news coverage. Some large bankruptcy. Whatever. May be
March 20 meeting in Moscow can serve as a trigger for some short squeeze,
despite the measure to be taken is an old news. But just the level of
determination of oil producing countries on this meeting might be
interpreted as an important market signal.
The time lag between rig counts and actual production
stands around 2 to 4 years for the general oil production index, which
includes conventional and unconventional off- and onshore production (see
below chart). In my view the time lag for shale is just six months and
for conventional production it is at least 18 months. As an example in
2005 a doubling of the rig count did not raise oil production until 2009.
If rig counts stay low until the end of this year, production is set
for a huge decline over the next year. Some interpret the still high
production at low rig counts as a miracle improvement in rig
productivity. If this is the case, the rig productivity must have been
extremely low about four years ago when a high rig count gave a then
still low production. So where does the huge turnaround come from?
Hedging only gets the job done if you can hedge at a price higher than
breakeven. If the spot price is $50/b. You would need to be able to hedge
at $75/b or more for the average well to break even, in practice this is
not likely to happen.
Currently the futures price in Dec 2018 is $10/b above the April 2016
futures price.
So possibly if oil prices reach $65/b hedging might be an option, below
this maybe not. (I have ignored transaction costs in this example.)
One way to tell that a bear market move has run its course, or is getting
close at least, is when front page stories on major news outlets declare that
all hope is lost, and none of the experts think things will get better for a
long time, if ever.
Well, forever is a very long time, and even if it weren't, the bell has tolled,
since Bloomberg, on Feb. 12,
declared the following: The Oil Industry Got Together and Agreed
Things May Never Get Better.
"Thousands of industry participants gathered in London for their annual
get-together, only to find a world awash in crude and hardly a life jacket
in sight."
The head of commodity research at mighty Goldman even said: "I wouldn't
be surprised if this market goes into the teens."
Whether or not Jan. 20 was the bottom for Brent (an ominous day being exactly
one year from the next Presidential inauguration), closing under $30, is yet
to be determined. But if nothing else, the extreme pessimism on offer at the
London gathering make it likely that a rally, if not a turning of the tide,
is in order. And, if that is the case, now that the oil price seems to be a
symptom rather than a cause of global growth, or lack thereof, there is reason
to believe that the S&P is also due for a rally.
The following dynamic
Bloomberg
graphic shows the utter collapse in U.S. drilling rigs. The most recent
figure for rigs is getting close to the record low set in 1999, when Brent was
trading in the teens.
...The IEA predicts that China will need to import another 2.6 million barrels
per day five years from now.
"The EU, which gets 30 percent of its gas from Russia, was equally hungry for the pipeline, which
would have given its members cheap energy and relief from Vladimir Putin's stifling economic and
political leverage."
That is nonsense. The issue is that Russia has quite limited leverage: They can not replace
the European customers on short notice – pipeline chain producer to certain custrumers – and they
urgently need the income.
The more interesting question for Russia is how to cope with a customers who may reduce the
demand for NG by 1% per year for the next few decades.
"The issue is that Russia has quite limited leverage: They can not replace the European customers
on short notice"
Leverage is always mutual in the gas trade that involves long term contracts
and long gas supply lines. It is like marriage :-)
"The more interesting question for Russia is how to cope with a customers who may reduce the
demand for NG by 1% per year for the next few decades."
I am not sure that this is the case.
"Gazprom's gas exports to Europe – including Turkey – had increased to 158.6 billion cubic meters
in 2015 with a 8.2 percent increase compared to 2014."
The EU's domestic production of natural gas, including non-EU member Norway, is already in
terminal decline and will be declining into the future by almost 2% per year until it reaches
zero.
Unless the EU can find alternative sources of natural gas at competitive prices, Russia remains
the only economical option, hence the extremely high stakes over the Syrian War.
Moreover, the EU's "Green Energy" policies are an outright, insolvent disaster. Windmills and
solar panels can never and will never compete with hydrocarbons and don't let any muppet claim
otherwise. If wind and solar were anywhere remotely viable sources then why would anyone give
a toss over the Middle East at all? The degree to which "alternative energy" is uneconomical can
be seen from the EU's extremely high energy costs, far and away the highest in the world. In their
fanatical crusade against Russia, the EU countries have opted for a catastrophic energy policy
that has rendered them global economic growth laggards. All this, just so that Russia's gas exports
could be kept at the absolute minimum.
What Russia seeks to achieve vis-a-vis Europe, is to force/encourage/compel the EU to integrate
by as much as possible with Russia. What NATO (and especially the US and Euro-Atlanticists) most
fear is that a Russia rich in capital and technology would be the world's dominant geopolitical
player.
This is what is at stake in the current Global Hybrid War.
"... There will be no more waving of hands and their always new breakeven price
OCD type of messages from shale crowd but very quiet departure in the sunset. ..."
"... Quantity at some point turns into quality. Now there two ranges of oil
prices that matter for shale: 0-70 and 80- infinity . With "hope" range 70-80 in
between. ..."
"... Strengthening of oil prices within the range 0-70 probably no longer matter
much for indebted shale companies and their production and by extension rig count.
Investment climate changed and will remain generally very cautious in this range,
taking into account the possibility of yet another price slump (for example, if
the price recovery overshoot; or Libya civil war ends). Mad drilling with negative
cash flow is probably the thing of the past. Taking over the companies by lenders
will be a more common practice than rescuing them. ..."
"... I think range 0-$70 now represents "death valley" for shale in which only
the "dead cat bounce" of production is possible. Investors might not return in-full
before the price reach about $80 and stays at this level for a while. Because, those
who were burned and balanced on losses around 60% on their loans (40 cents on a
dollar) probably understand, that it just does not make any economic sense. Any
belief in "shale miracle" if such existed is now busted. ..."
"... What we have now is as Ves said, "a very quiet departure into the sunset".
Of cause, we can play with numeric ranges, but you got the idea. ..."
"... IMHO it does not matter how shale E&P companies behave. Cards are stack
against them and they are in a trap. It's Minsky moment for them, when euphoria
is gone and the harsh reality started to assert itself. So the meaning of the number
of rigs now is very similar to sweating of the patient in the famous anecdote when
a doctor asks the nurse "Did the patient sweat before dying? Oh, yes. Very good,
very good". ..."
"... My point is that for "below $70 range" ( +-$10) shale companies will remain
in a "slow dying" mode. Availability of "sweet spots" does not improve with the
age of the field. Loans availability is either gone or severely cut and cash flow
is either negative or barely enough for the maintenance and for "evergreen" loans
interest payments (speculative mode of production according to Minsky). Most of
them suffer from the high level of existing debt. ..."
"... At $50.28 WTI companies lost record amounts and generally have PV10 all
categories equal to long term debt, with radical reductions in future estimated
production costs and development costs. But all are eager to show they can operate
lower than their peers. Also, the stock market seems to get ahead of itself. Look
at today, for example. ..."
"... Trading $14+ below last year SEC prices, all is not yet well. A DOUBLE
in price is needed, but likely will not occur in 2016. ..."
I think everything is clear. Rigs are going
down regardless of this uptick in the price since bottom of $26 because
it is clear that if there is sustainable price for the majority of world
production, contribution has to come from Opec and non-Opec. There will
be no more waving of hands and their always new breakeven price OCD type
of messages from shale crowd but very quiet departure in the sunset.
Despite strengthening oil prices, U.S. oil and gas rig count is
down 13 units.
Quantity at some point turns into quality. Now there two ranges of
oil prices that matter for shale: 0-70 and 80-infinity. With "hope"
range 70-80 in between.
Strengthening of oil prices within the range 0-70 probably no longer
matter much for indebted shale companies and their production and by extension
rig count. Investment climate changed and will remain generally very cautious
in this range, taking into account the possibility of yet another price
slump (for example, if the price recovery overshoot; or Libya civil war
ends). Mad drilling with negative cash flow is probably the thing of the
past. Taking over the companies by lenders will be a more common practice
than rescuing them.
I think range 0-$70 now represents "death valley" for shale in which
only the "dead cat bounce" of production is possible. Investors might not
return in-full before the price reach about $80 and stays at this level
for a while. Because, those who were burned and balanced on losses around
60% on their loans (40 cents on a dollar) probably understand, that it just
does not make any economic sense. Any belief in "shale miracle" if such
existed is now busted.
What we have now is as Ves said, "a very quiet departure into the
sunset". Of cause, we can play with numeric ranges, but you got the idea.
The E&P companies have set their budgets and placed drilling contracts.
What the price of oil does over the next three to six months won't make
much difference to the rig count. It may influence completions though as
they can be conducted on a faster turn around.
ND has lost three rigs and is likely to lose up to another ten rigs in
the coming weeks as Whiting and Continental shut down drilling, QEP and
Hess reduce to one or two rigs only, and maybe a couple of the smaller private
companies go bust.
The E&P companies have set their budgets and placed drilling contracts.
What the price of oil does over the next three to six months won't make
much difference to the rig count.
IMHO it does not matter how shale E&P companies behave. Cards are
stack against them and they are in a trap. It's Minsky moment for them,
when euphoria is gone and the harsh reality started to assert itself. So
the meaning of the number of rigs now is very similar to sweating of the
patient in the famous anecdote when a doctor asks the nurse "Did the patient
sweat before dying? Oh, yes. Very good, very good".
For conventional oil it is a completely different game and there can
be some Renaissance.
My point is that for "below $70 range" ( +-$10) shale companies will
remain in a "slow dying" mode. Availability of "sweet spots" does not improve
with the age of the field. Loans availability is either gone or severely
cut and cash flow is either negative or barely enough for the maintenance
and for "evergreen" loans interest payments (speculative mode of production
according to Minsky). Most of them suffer from the high level of existing
debt.
Also their costs rise with the rise of oil price if only because they
consume a lot of diesel fuel (if we assume EROEI 5 you need 8 gallons of
diesel per barrel of oil, so effectively your barrel contains only 42-8=34
gallons). Only a fraction of the price rise improves their economic conditions
(a large part of the "increased efficiency", lower cost of production blah-blah-blah
was based on the same effect but acting in the opposite direction). The
problems also might start when investors realize that they have a better
chance to recoup their investments by taking a hold of assets in a rising
oil price environment…
AlexS, note that in the 1998-99 price crash, oil rigs did not bottom until
a few months after the OPEC cut.
This time may be different, remains to
be seen.
At $50.28 WTI companies lost record amounts and generally have PV10
all categories equal to long term debt, with radical reductions in future
estimated production costs and development costs. But all are eager to show
they can operate lower than their peers. Also, the stock market seems to
get ahead of itself. Look at today, for example.
Trading $14+ below last year SEC prices, all is not yet well. A DOUBLE
in price is needed, but likely will not occur in 2016.
"... Bullshit. Imports are rising because oil from shale is shitty shitty oil. It is barely better than condensate. ..."
"... Refineries dont make much money on very light crude, API 45. It doesnt produce a very high volume of fuels. It is feedstock material, and there is a limited market for feedstock. Much of US LTO production is greater than API 45. ..."
Despite domestic production declining and demand surging, the EIA reported oil inventories
surge by more than 10 million barrels, or more than three times what was expected.
The 10.4 million barrel increase was mostly due to a near record increase in imports of
490,000 b/d (3.4 million barrels weekly) and an adjustment swing of 352,000 b/d (2.5 million
barrels weekly) by the EIA. The latter has been a repeated pattern to exaggerate the levels of inventory,
a pattern going back to 2015. Thus, over half of the said increase in inventory was driven
by higher imports and an arbitrary adjustment that seems routine by the EIA. Domestic production
actually fell by 25,000 B/D in the week ending on February 26. Also gasoline inventories fell 455,000
barrels, or nearly 5 percent, as capacity utilization rose 1 percent. Total gasoline supplied, which
is a gauge of demand over last 4 weeks, has risen a whopping 7 percent.
Now the real question is with U.S. production declining and inventories at record levels,
why are refiners still importing at such heights? The 8.2 million barrels per day
imported in the week came very close to the record in December, missing by some few percentage points.
U.S. commercial domestic crude oil stocks are now nearly 17 percent above last year levels. None
of this adds up: We are producing less, inventories are rising, while demand is at records and yet
we are using more imported oil?
Although raw shale oil can be immediately burnt as a fuel oil, many of its applications require
that it be upgraded. The differing properties of the raw oils call for correspondingly various
pre-treatments before it can be sent to a conventional
oil refinery . [35]
Shale oil produced by some technologies, such as the
Kiviter process ,
can be used without further upgrading as an oil constituent and as a source of
phenolic compounds
. Distillate oils from the Kiviter process can also be used as
diluents for petroleum-originated
heavy oils and as an adhesive-enhancing additive in
bituminous materials such
as asphalt
Refineries are designed to use specific types of crude, with some flexibility. Those set
up to use heavy crude need something close or at least a blend. US shale oil isn't heavy crude,
it's very light oil from what I understand.
Koch Industries spent large to modify their northern refineries to take bitumen from Canada
because it is heavily discounted (cheap). Output in Canada hasn't changed much, although exploration
and development have been greatly reduced.
US shale oil has pipeline issues in some areas and has to be transported by rail which
is considerably more expensive. Especially significant for refineries with port access.
The Saudi's have some guarantees as to minimum imports, or so I have read. When they partnered
with Shell to expand a joint refinery project on the Gulf and make it the largest refinery
in the US, apparently they got a guarantee from the US gov't on how much heavy crude they could
import. That was back when there was supposedly a great deal of excess refining capacity in
that area.
Long term availability of shale / tight oil may be in doubt to the extent investing in
refinery modifications to handle different feedstock may not be attractive.
Refineries don't make much money on very light crude, API >45. It doesn't produce a very
high volume of fuels. It is feedstock material, and there is a limited market for feedstock. Much
of US LTO production is greater than API 45.
"It was a tumultuous week in the world of hydraulic fracturing ("fracking")
for shale oil and gas, with a few of the biggest companies in the U.S. announcing
temporary shutdowns at their drilling operations in various areas until
oil prices rise again from the ashes."
And if the sordid news for the frackers were not bleak enough on the bottoming
out of oil prices, David Hughes - a former oil industry geoscientist and
current fellow with the Post Carbon Institute - recently delivered sworn
testimony to the North Carolina Utilities Commission that shale gas production
will peak in 2017 nationwide and then begin a rapid productivity decline.
Barriers to productivity growth
: "The limits to productivity growth
are set only by the limits to human inventiveness"
says
John Kay. This understates the problem. There are other limits.
I'd mention two which I think are under-rated.
One is competition. Of course, this tends to increase productivity in many
ways. But it has a downside. The fear of competition from future new technologies
can
inhibit
investment today: no firm will spend £10m on robots if they
fear a rival will buy better ones for £5m soon afterwards. ...
The second is that, as Brynjolfsson and MacAfee
say
, "significant organizational innovation is required to capture
the full benefit of…technologies."
For example, Paul David has
described (pdf)
how the introduction of electricity into American factories
did not immediately raise productivity much, simply because it merely replaced
steam engines. It was only when bosses realized that electric motors allowed
factories to be reorganized – dispensing with the need for machines to be
close to a central power source – that productivity soared, as workflow
improved and new cheaper buildings could be used. This took many years.
It's not just organizational change that's needed, though..., I suspect
that if IT is to have (further?) productivity-enhancing effects, they require
socio-organizational change. ...
However, there are always obstacles to the social and organizational change
necessary for technical change to lead to productivity gains. These might
be cognitive – such as the Frankenstein
syndrome
or "not invented
here
" mentality. Or they can be material. Socio-technical change is
a process of creative destruction, the losers from which kick up a stink;
think of taxi-drivers protesting against Uber.
Worse still, these losers aren't always politically weak Ludditites. They
can be well-connected bosses of incumbent firms, or managers seeking to
maintain their power base. ...
The big question facing us is, therefore: do we have the right set of institutions
to foster the socio-organizational change that beget productivity growth?
These require a mix of healthy markets, to maximize ecological diversity;
a financial system which backs risky new-comers;
property
rights which incentivise innovation; and state intervention
that facilitates all these whilst not being captured by Luddites. If our
politics weren't so imbecilic, this question would be getting a lot more
attention than it is.
There will be a "dramatic price movement" when the meeting between OPEC members
and Russia takes place, Nigerian Petroleum Minister Emmanuel Kachikwu said at
a conference in Abuja on Thursday. Saudi Arabia, Russia, Qatar and Venezuela
agreed on Feb. 16 in Doha that they would freeze production, if other producers
followed suit, in an effort to tackle the global oversupply.
"... I wonder if all the bankruptcies might change the culture a bit. It sure will make finding money to burn more difficult and investors may look beyond the investor presentations to the 10k and the bottom line and reward fiscal discipline. ..."
"... Hard to know for sure. The banks may pull back and the bond investors may require very high interest rates and industry behavior might change as a result. ..."
"... If the entire Shale industry goes bankrupt, they will have trouble with financing new wells in my opinion. So increasing output will be difficult without financing. ..."
"... If the assets are bought by companies using there own cash (no bank or bond financing), they will not throw money away on wells that will never break even. ..."
Maybe so. I wonder if all the bankruptcies might change the culture a bit. It sure will
make finding money to burn more difficult and investors may look beyond the investor presentations
to the 10k and the bottom line and reward fiscal discipline.
Hard to know for sure. The banks may pull back and the bond investors may require very
high interest rates and industry behavior might change as a result.
"once the entire U.S. shale space goes bankrupt, it will emerge debtless only to start drilling
and pumping anew prompting the Saudis to continue to ratchet up the pressure in an endless
deflationary merry-go-round."
If the entire Shale industry goes bankrupt, they will have trouble with financing new wells
in my opinion. So increasing output will be difficult without financing.
If the assets are bought by companies using there own cash (no bank or bond financing),
they will not throw money away on wells that will never break even.
Oil rose to an eight-week high in New York after U.S. production declined
and a weaker dollar boosted the attractiveness of commodities.
Futures rose as much as 1.9 percent. Output fell for a sixth week to 9.08
million barrels a day, the lowest level since November 2014, according to the
Energy Information Administration. Crude inventories rose, keeping supplies
at the highest in more than eight decades. OPEC members will meet with Russia
and other producers in Moscow on March 20 to resume talks on an output cap,
Nigeria's oil minister said.
"The mood has changed in the market and we are a little bit more optimistic
about the future," said Phil Flynn, senior market analyst at the Price Futures
Group in Chicago. "The market is shaking off the big inventories builds that
we saw in recent weeks."
Oil is still down about 5 percent this year on speculation a global glut
will be prolonged amid brimming U.S. stockpiles and the outlook for increased
exports from Iran after the removal of sanctions. Exxon Mobil Corp. scaled back
production targets and said drilling budgets will continue to drop through the
end of next year as the oil market shows no signs of a significant recovery.
West Texas Intermediate for April delivery rose 41 cents to $35.07 a barrel
at 11:19 a.m. Eastern time on the New York Mercantile Exchange, after reaching
$35.32. The contract rose 26 cents to $34.66 on Wednesday, the highest close
since Jan. 5. Total volume traded was about 2 percent above the 100-day average.
Brent for May settlement gained 22 cents to $37.15 a barrel on the London-based
ICE Futures Europe exchange. The global benchmark crude was at a premium of
46 cents to WTI for May.
The Bloomberg Dollar Spot Index fell 0.5 percent, after earlier gaining 0.1
percent.
U.S. crude stockpiles expanded by 10.4 million barrels to 518 million, according
to a report from the EIA Wednesday. Supplies at Cushing, Oklahoma, the delivery
point for WTI and the nation's biggest oil-storage hub, rose for a fifth week
to a record 66.3 million barrels.
The market's saying "You can't ignore fundamentals," said Tariq Zahir, a
New York-based commodity fund manager at Tyche Capital Advisors. "With the massive
amount of supplies that we have, the market should go lower. I think prices
will go back to below $30 in a few weeks."
Others are more optimistic. There will be a "dramatic price movement" when
the meeting between OPEC members and Russia takes place, Nigerian Petroleum
Minister Emmanuel Kachikwu said at a conference in Abuja on Thursday. Saudi
Arabia, Russia, Qatar and Venezuela agreed on Feb. 16 in Doha that they would
freeze production, if other producers followed suit, in an effort to tackle
the global oversupply.
Exxon's output will be the equivalent of 4 million to 4.2 million barrels
a day through 2020, compared with the previous target of 4.3 million as soon
as next year, Chairman and Chief Executive Officer Rex Tillerson said at the
company's annual strategy session in New York on Wednesday. Capital spending
will fall about 25 percent this year to $23.2 billion and will decline again
in 2017.
"... The meeting of oil-producing countries will be held on March 20th in Russia, the Minister of oil of Nigeria, Emmanuel Kachikwu, announced. According to him, it will be attended by representatives of countries who are OPEC members and countries that are not members in the organization. Mr. Kachikwu noted that producers seek to restore oil prices to $50 per barrel ..."
here is some good news. You have heard it first from me here on POB 2 weeks ago. We are moving
in direction of restoring the prices to acceptable level that major producers can live temporarily.
"The meeting of oil-producing countries will be held on March 20th in Russia, the Minister
of oil of Nigeria, Emmanuel Kachikwu, announced. According to him, it will be attended by representatives
of countries who are OPEC members and countries that are not members in the organization. Mr.
Kachikwu noted that producers seek to restore oil prices to $50 per barrel."
"... Instead, it reprieved the fading remnants of the military-industrial-congressional complex, the neocon interventionist camp and Washingtons legions of cold war apparatchiks. All of the foregoing would have been otherwise consigned to the dust bin of history. ..."
"... The Saudis geopolitical goal is to contain the economic and political power of the kingdoms principal rival, Iran, a Shiite state, and close ally of Bashar Assad. The Saudi monarchy viewed the U.S.-sponsored Shiite takeover in Iraq (and, more recently, the termination of the Iran trade embargo) as a demotion to its regional power status and was already engaged in a proxy war against Tehran in Yemen, highlighted by the Saudi genocide against the Iranian backed Houthi tribe. ..."
"... But the Sunni kingdoms with vast petrodollars at stake wanted a much deeper involvement from America. On September 4, 2013, Secretary of State John Kerry told a congressional hearing that the Sunni kingdoms had offered to foot the bill for a U.S. invasion of Syria to oust Bashar Assad. In fact, some of them have said that if the United States is prepared to go do the whole thing, the way weve done it previously in other places [Iraq], theyll carry the cost. Kerry reiterated the offer to Rep. Ileana Ros-Lehtinen (R-Fla.): With respect to Arab countries offering to bear the costs of [an American invasion] to topple Assad, the answer is profoundly yes, they have. The offer is on the table. ..."
"... Gazproms gas exports to Europe – including Turkey – had increased to 158.6 billion cubic meters in 2015 with a 8.2 percent increase compared to 2014 ..."
Stockman's Tales of western intervention into the ME Oil Puzzle.
"The Trumpster Sends The GOP/Neocon Establishment To The Dumpster"
"And most certainly, this lamentable turn to the War Party's disastrous reign had nothing to do
with oil security or economic prosperity in America. The cure for high oil is always and everywhere
high oil prices, not the Fifth Fleet"
It goes all the way back to the collapse of the old Soviet Union and the elder Bush's historically
foolish decision to invade the Persian Gulf in February 1991. The latter stopped dead in its
tracks the first genuine opportunity for peace the people of the world had been afforded since
August 1914.
Instead, it reprieved the fading remnants of the military-industrial-congressional complex,
the neocon interventionist camp and Washington's legions of cold war apparatchiks. All of the
foregoing would have been otherwise consigned to the dust bin of history.
Yet at that crucial inflection point there was absolutely nothing at stake with respect
to the safety and security of the American people in the petty quarrel between Saddam Hussein
and the Emir of Kuwait.
Having alienated Iraq and Syria, Kim Roosevelt fled the Mideast to work as an executive
for the oil industry that he had served so well during his public service career at the CIA.
Roosevelt's replacement as CIA station chief, James Critchfield, attempted a failed assassination
plot against the new Iraqi president using a toxic handkerchief, according to Weiner. Five
years later, the CIA finally succeeded in deposing the Iraqi president and installing the Ba'ath
Party in power in Iraq. A charismatic young murderer named Saddam Hussein was one of the distinguished
leaders of the CIA's Ba'athist team.
… … …
The EU, which gets 30 percent of its gas from Russia, was equally hungry for the pipeline,
which would have given its members cheap energy and relief from Vladimir Putin's stifling economic
and political leverage. Turkey, Russia's second largest gas customer, was particularly anxious
to end its reliance on its ancient rival and to position itself as the lucrative transect hub
for Asian fuels to EU markets. The Qatari pipeline would have benefited Saudi Arabia's conservative
Sunni monarchy by giving it a foothold in Shia-dominated Syria. The Saudis' geopolitical goal
is to contain the economic and political power of the kingdom's principal rival, Iran, a Shiite
state, and close ally of Bashar Assad. The Saudi monarchy viewed the U.S.-sponsored Shiite
takeover in Iraq (and, more recently, the termination of the Iran trade embargo) as a demotion
to its regional power status and was already engaged in a proxy war against Tehran in Yemen,
highlighted by the Saudi genocide against the Iranian backed Houthi tribe.
Of course, the Russians, who sell 70 percent of their gas exports to Europe, viewed the
Qatar/Turkey pipeline as an existential threat. In Putin's view, the Qatar pipeline is a NATO
plot to change the status quo, deprive Russia of its only foothold in the Middle East, strangle
the Russian economy and end Russian leverage in the European energy market. In 2009, Assad
announced that he would refuse to sign the agreement to allow the pipeline to run through Syria
"to protect the interests of our Russian ally."
… … …
But the Sunni kingdoms with vast petrodollars at stake wanted a much deeper involvement
from America. On September 4, 2013, Secretary of State John Kerry told a congressional hearing
that the Sunni kingdoms had offered to foot the bill for a U.S. invasion of Syria to oust Bashar
Assad. "In fact, some of them have said that if the United States is prepared to go do the
whole thing, the way we've done it previously in other places [Iraq], they'll carry the cost."
Kerry reiterated the offer to Rep. Ileana Ros-Lehtinen (R-Fla.): "With respect to Arab countries
offering to bear the costs of [an American invasion] to topple Assad, the answer is profoundly
yes, they have. The offer is on the table."
"The EU, which gets 30 percent of its gas from Russia, was equally hungry for the pipeline, which
would have given its members cheap energy and relief from Vladimir Putin's stifling economic and
political leverage."
That is nonsense. The issue is that Russia has quite limited leverage: They can not replace
the European customers on short notice – pipeline chain producer to certain customers – and they
urgently need the income.
The more interesting question for Russia is how to cope with a customers who may reduce the
demand for NG by 1% per year for the next few decades.
"The issue is that Russia has quite limited leverage: They can not replace the European customers
on short notice"
Leverage is always mutual in the gas trade that involves long term contracts and long gas supply
lines. It is like marriage :-)
"The more interesting question for Russia is how to cope with a customers who may reduce the
demand for NG by 1% per year for the next few decades."
I am not sure that this is the case.
"Gazprom's gas exports to Europe – including Turkey – had increased to 158.6 billion cubic
meters in 2015 with a 8.2 percent increase compared to 2014."
BAGHDAD (AP) - Iraq's Oil Ministry said Tuesday that crude exports averaged
3.225 million barrels a day in February, far below levels planned to provide
the nation with badly needed cash for ongoing military operations against Islamic
State extremists.
Last month exports grossed about $2.2 billion, based on an average price
of about $23 per barrel, ministry spokesman Assem Jihad said in a statement.
Iraq's 2016 budget is based on an expected price of $45 per barrel with a daily
export capacity of 3.6 million.
January's daily exports averaged 3.283 million barrels, bringing that month's
revenues to $2.261 billion.
The figures do not include oil being independently exported from Iraq's self-ruled
northern Kurdish region since mid-2015, preventing the government from reaping
revenues of nearly 600,000 barrels a day.
Iraq holds the world's fourth largest oil reserves, some 143.1 billion barrels,
and oil revenues make up nearly 95 percent of its budget. But like other oil-reliant
countries, Iraq's economy has been severely hit by plummeting oil prices since
2014.
This year's budget stands at nearly 106 trillion Iraqi dinars, or about $89.7
billion. It runs with a deficit of over 24 trillion dinars (about $20.5 billion)
that are planned to be relieved through loans from local and international lenders.
In the summer of 2014, Iraq was plunged into its worst crisis in the aftermath
of the withdrawal of U.S. troops at the end of 2011. The Islamic State group
- which emerged out of al-Qaida's branch in Iraq - blitzed across vast swaths
of Iraqi territory, including the country's second largest city, Mosul, and
captured nearly a third of Iraq.
Iraq introduced austerity measures earlier this year - eliminating government
posts, merging some ministries, halting spending on construction projects and
imposing new taxes to pay for civil servants and fund its military.
Four common-sense ideas for economic growth : Let me begin with two
facts that I think should be cause for concern. First, since the summer
of 2009, the US economy has grown at about 2 percent. Two percent isn't
a very good growth rate. Second, the 10-year interest rate at the end of
trading today ... was just a bit below 1.8 percent. ...
What's the way to think about these two facts together? I believe that
we are dealing with a situation that goes beyond the usual cyclical issues
associated with recession-and for many years the policy debate has been
confounded by that. The Fed has been substantially too optimistic in its
one-year-ahead forecast every year for the last six, and its forecasts are
pretty close to the consensus forecasts. The prevailing expectation in markets
has always been that significant tightening will take place in nine months.
That's been true for the last six years. It has not happened yet.
If you accept all of this, what should be done? I would suggest four
things at a minimum. First, there is an overwhelming case in the United
States for expanded public infrastructure investment. ... It's hard to imagine
a better time for expanded infrastructure investment, yet the rate of infrastructure
investment is lower now than it's been anytime since 1947. ...
Second, we should increase support for private investment in infrastructure.
...
Third, we should grow our effective labor force. ...
Fourth, our financial system requires continuing attention. ...
I would say to you that whatever you care about, if all you care about
is that we've got an excessive federal debt, the most important determinant
of the debt-to-GDP ratio in 2030 is how rapidly the economy grows between
now and then. If what you care about is American national security, the
most important determinant of how much we are respected and how much influence
we have in the world is how well our economy performs. If what you care
about is inequality and poverty, the most important determinant of the employment
prospects of the poor is how rapidly the economy is growing.
I would suggest to you that there is no more important question for the
American prospect than accelerating the rate of economic growth. It seems
to me, whether you're a demand sider or a supply sider, a Democrat or a
Republican, there's a great deal of common sense that should lead you to
support increased economic growth.
[There is quite a bit of discussion of each point in the full post.]
"... And the number of DUCs reached their peak while prices were still high. There are DUCs because there is always a delay between when the drillers finish their work and when the frackers start their work. And the number of DUCs grew, during high prices, because there were more wells being drilled than wells fracked. ..."
"... higher prices will only bring on more completions if there is money to pay for them, which is not a given. ..."
"... You don't have to be an economist or a CPA to figure out how difficult it will be for oil companies to again be growing at this point. ..."
There are always DUCs. There have always been DUCs, even when the price
was well above $100 a barrel. In fact the inventory of DUCs grew every year
that the price of oil was in the $100 range. And the number of DUCs
reached their peak while prices were still high. There are DUCs because
there is always a delay between when the drillers finish their work and
when the frackers start their work. And the number of DUCs grew, during
high prices, because there were more wells being drilled than wells fracked.
Higher prices will bring on more completions, bringing on more production,
knocking prices back down again, keeping prices lower for longer. Right
or wrong, that is simple logic. It is not nonsense.
That interrupts the logic, and is not to be considered. It is not important
that upstream companies are out of bucks, and nobody will lend them any.
Drilling will continue to be done with cash available until which time,
the coffers start filling. May take some time to put into completing those
wells that are only profitable at 80. Be quacking for quite a while. However,
that interrupts the logic of lower for longer, so it is not to be considered.
You don't have to be an economist or a CPA to figure out how difficult
it will be for oil companies to again be growing at this point. It
is mostly going to be funded by internal cash flow. Let's assume that EIA'S
estimate of the average Eagle Ford's EUR to be 168,000 bbls, and somewhat
meaningful. So, maybe the average first year's production to be 75,000 bbls.
At 100 a barrel, they recover the cost of the capex, plus a little more.
They can drill another well with positive cash flow. Probably describes
the average DUC. At 80 a barrel, they are in negative cash flow. Probably,
a profitable well, but negative cash flow. They did not make back enough
money to drill a new well the first year. Later, next year, but not by the
end of the year. So amount available for capex goes down. At 40, they may,
or may not recover the cost of the well. If the DUC is an average Eagle
Ford EUR, then it could sit for quite a while if lower for longer is the
logic.
That is the main reason you won't see large scale ramp ups on production
until it stays over 70 for a while. A large percentage of the area is average,
or less than average.
Brazilian state-owned oil company Petrobras, the most indebted oil company
in the world, could soon lose its status as the top operator in some of the
country's most prolific offshore oil assets.
Petrobras is reeling from a wide-reaching corruption scandal and it is drowning
in a mountain of debt that exceeds $100 billion. It no longer has the funds
to front large-scale drilling in the way that it once did. Petrobras executives
are now trying to manage shrinking the company's footprint.
In order to raise cash it has plans to sell off assets far and wide. But
there are questions surrounding the company's ability to raise the funds that
it needs to – since just about every company is unloading oilfields and infrastructure,
asset prices may not be as high as sellers want them to be.
Nevertheless, Brazilian news services reported that Petrobras could take
in $5 to $6 billion by selling off its natural gas pipeline unit in Brazil's
southeast. Canadian, French, and Chinese companies are submitting bids ahead
of a deadline next Tuesday. The sale is part of a plan to raise $14 billion
in cash in asset sales this year, funds that will be used to trim the company's
debt.
"... Another reason why production hasn't fallen as rapidly as some expected was that newer wells produce a bit more in the first couple of months, followed by a steeper decline. This can be seen from the production profiles from the different shale areas. This is more like a one-time gain however. ..."
"... Completion is about 2/3 of the total well cost. ..."
"... If production for a group of wells (not my model wells) completed in 2010 declines by 80% from 2010 to 2015, while the percentage of plugged/inactive wells (completed in 2010) increases from 0% in 2010 to 50% in 2015, are you seriously asserting that there is not a survivor bias issue? Or for that matter, if the percentage of plugged/inactive wells increases from 0% in 2010 to 1% in 2015. ..."
"... The average 2008 to 2012 well will be shut in at about year 15 if they are profitable to produce at up to 7 b/d of output. This will depend on oil prices in 2023, which are hard to predict. ..."
"... "the percentage of plugged/inactive wells (completed in 2010) increases from 0% in 2010 to 50% in 2015" This is a hypothetical assumption. The real number of plugged wells is low and therefore it can be ignored ..."
"... The 50% abandonment number in five years was based on a real life case history in the Barnett Shale Play, the 2007 vintage wells on the DFW Airport Lease that Chesapeake asserted would produce "for at least 50 years." ..."
"... So I don't see any survivorship bias. As long as we include all the wells in the data (including those abandoned) survivorship bias is eliminated. ..."
Couple of comments:
– I think the rig count is an important metric to follow. However, some
adjustment is needed to correct for the fact that rigs are more efficient
now in drilling wells. Probably several reasons for this (better rigs, crews,
methods, pad drilling, drilling in a closer area, etc). E.g., in ND in 2012
every rig on average drilled 0.8 well per month. In 2014 this was 1.1, and
in the last few months it was 1.4. I agree with you that the rig count eventually
has to impact production (it will be with some delay, and corrected with
the above factor).
– Shallow showed a comment from the Hess CEO that another reason to keep
drilling was to keep at least some experienced production staff in the company.
– Another reason why production hasn't fallen as rapidly as some
expected was that newer wells produce a bit more in the first couple of
months, followed by a steeper decline. This can be seen from the production
profiles from the different shale areas. This is more like a one-time gain
however.
– Some companies apparently do intend to drill more wells than complete
them in 2016. Continental Resources plans to drill 73 wells, and complete
26 (net) wells in 2016. Note that in 2015 they actually reduced the number
of wells waiting for completion by 35. Completion is about 2/3 of the
total well cost.
Imagine the production profile if they could complete every single well
in the fracklog on the same day, vs if they complete one a day for the next
11 years.
These are obviously absurd examples, but just to make the point that
really what we would like in order to accurately predict production is a
'frac crew count' rather than a rig count, and to agree with what you say
above.
Following is a link to, an excerpt from, a question I posed on a prior
thread. It's my understanding that you are attempting to correct for survivor
bias, in regard to decline rates, by dividing annual production by the original
number of producing wells. I constructed a simple model which seems to show
that this makes no difference. It seems to me that one is calculating rates
of change in total production in both cases (total production or total production
divided by original number of wells).
As my example model shows, one can produce a year over year rate
of change chart that looks a lot like the Bakken year over year rates
of change, but by the time that the decline has settled down to 10%
per year, 90% of the wells completed in year one of the model (2010)
are no longer producing.
I don't know what the percentage of inactive wells is for the Bakken
Play by year, for example, the percentage of Bakken wells completed
in 2007 that are no longer producing, and I don't know whether the percentages
are material, but there are numerous examples of very high abandonment
rates in other shale plays.
For example, Chesapeake claimed that their 2007 vintage wells on
the DFW Airport Lease, in the Barnett Shale Play, would produce "For
at least 50 years." Five years later, about half of the 2007 wells had
already been plugged and abandoned.
I don't use the well count. For each vintage group, for each exact year
on production, I sum the latest 12 months production, and compare it with
the total (again over all relevant wells) 12 months production of the prior
year on production.
For example, to calculate the decline rate of the 2008 vintage group,
in year 4, I calculate the total production these wells had in their 4th
year of production, and compared it to the total production from the same
wells in year 3 on production.
I have excluded wells that appear to have been refracked from the whole
set, to try to establish the natural rate of decline.
As I noted in my comment, I agree that this works for volumes, but not for
rates of decline, i.e., there is no difference between rates of change for
total production by vintage year versus total production by vintage year,
divided by the original number of wells.
Following is an excerpt from my comment linked above:
Following is a model with more relevant (hyperbolic) simple percentage
decline rates. I assume a fully developed lease with 10 producing wells,
all completed in 2010. There is one very good well, with 9 relatively
poor wells. Production drops by 40%, then 30%, then 20% and then settles
down to a 10%/year decline rate. The lease loses three wells per year,
until it is down to the one good producing well. Here is the model:
From 2014 on, production declines at 10%/year, from one well.
The exponential year over year rate of decline in total production from
2012 to 2013 was 22%/year (natural log of 336/420).
If we divide the 2012 and 2013 production by 10, i.e., the original number
of wells completed in 2010, the exponential year over year rate of decline
in production was also 22%/year (natural log of 33.6/42.0)–as the number
of producing wells on the lease fell by 75%.
So, again, unless I am missing something, it seems to me that the rates
of decline chart you showed reflects the rates of decline in total production
by year, without any weight given to survivor bias.
Are you disputing this?
The only way I see to address the survivor bias issue is to show the
number or percentage of plugged/inactive wells by year, on the same chart
as the year over year rates of decline chart. On the example I showed, the
plugged/inactive percentage would be 0% in 2010, rising to 90% in 2013.
I understand your example, but I don't see an issue regarding survivor
bias. The 22% is the decline number I am interested in, as it reflects the
total decline that can be expected for that group, for that year.
In any case, it's a non-issue for now, as not many wells are dropping
out yet (about 1% of wells a year). Let's leave it at this.
I understand your example, but I don't see an issue regarding
survivor bias. The 22% is the decline number I am interested in,
as it reflects the total decline that can be expected for that group,
for that year.
I agree that the 22% decline number reflects the decline from the wells
still producing, and the percentage of plugged/inactive wells may or may
not be material in regard to survivor bias. But that is not the issue. It
doesn't matter whether 1% of the original producing wells or 50% of the
original producing wells are plugged/abandoned at a given point in time.
This is a math question.
If production for a group of wells (not my model wells) completed
in 2010 declines by 80% from 2010 to 2015, while the percentage of plugged/inactive
wells (completed in 2010) increases from 0% in 2010 to 50% in 2015, are
you seriously asserting that there is not a survivor bias issue? Or
for that matter, if the percentage of plugged/inactive wells increases from
0% in 2010 to 1% in 2015.
In any case, why not include a chart showing the percentage, by year,
for the plugged/inactive wells along with the chart showing decline rates
by year? For example, 100% of the wells completed as oil wells in 2010 had
some level of production, and what percentage of those 2010 wells were plugged/inactive
by year, as time goes on?
Probably the best way to show a survivor bias chart is to show the number
of wells showing some level of production as time goes on, expressed as
a percentage of total number of wells with reported production in the reference
year. That way, the slope of the curve would be in the same direction as
the slopes of the decline rates. For my example, the survivor percentage
by year for my 10 well model would be:
2010: 100%
2011: 70%
2012: 40%
2013: 10%*
*2013 and subsequent years until last producing well is plugged.
Of course, when the survivor percentage hits 0%, production = zero.
An interesting question would be projected half-life, to-wit, how many
years would it take for the survivors among a group of wells completed in
a given year, e.g., 2010, to be reduced to 50% of the original number?
As noted above, the observed half-life for the 2007 vintage wells completed
on the DFW Airport Lease in the Barnett Shale Play–the wells that Chesapeake
asserted would produce "for at least 50 years–was about five years.
As Enno points out for the Bakken/Three Forks after 8 years about 1%
of 2007 wells that were not refracked have been permanently abandoned.
The average 2008 to 2012 well will be shut in at about year 15 if they
are profitable to produce at up to 7 b/d of output. This will depend on
oil prices in 2023, which are hard to predict.
Are you now arguing that the survivor bias is not material, whereas you
previously, and repeatedly, asserted that there was no survivor bias in
regard to rates of change calculations? Following is a link to the original
question, followed by three of your comments:
I have given you that data in the past. The well profiles do not
have survivorship bias as long as a zero is entered for output for abandoned
wells.
That is what Enno does.
I can send you Enno's spreadsheet or Ron can, just email and ask.
Dennis Coyne ,
02/24/2016 AT 7:11 AM
Hi Jeffrey,
To me (and possibly Enno), using the original 10 wells in the denominator*
is adequate to calculate the average well profile. Note that in the
first five years the wells abandoned are very low (probably less than
1% per year). As I said before, request Enno Peter's data from Ron and
make any chart you would like. Oh and it would be nice if you stop claiming
survivorship bias when both Enno and I have repeated this several times,
but you continue to bring it up.
Dennis Coyne ,
02/24/2016 AT 1:36 PM
As I said before get the spreadsheet and do what you like.
There is no survivorship bias in the average well profiles published
by Enno Peters.
Following is my original question, followed by Enno's response. My point
was and is that Enno's approach is a pointless exercise in regard to rates
of change, since he is, in both cases (with or without attempted survivor
bias adjustments) simply calculating rates of change in total production.
Jeffrey J. Brown ,
02/23/2016 AT 11:47 AM
Is there a provision for "Survivor bias?"
In other words, how many wells that were put on line in 2007, 2008,
etc. are plugged & abandoned or temporarily abandoned?
REPLY
Enno ,
02/23/2016 AT 11:57 AM
Jeffrey,
Yes, in my ND data I always add 0 production months after the last
reported month by the NDIC. So no survivor bias in the info I present.
And here is the question that Enno has still refused to address:
If production for a group of wells (not my model wells) completed
in 2010 declines by 80% from 2010 to 2015, while the percentage of plugged/inactive
wells (completed in 2010) increases from 0% in 2010 to 50% in 2015,
are you seriously asserting that there is not a survivor bias issue?
Or for that matter, if the percentage of plugged/inactive wells increases
from 0% in 2010 to 1% in 2015.
"the percentage of plugged/inactive wells (completed in 2010) increases
from 0% in 2010 to 50% in 2015" This is a hypothetical assumption. The real
number of plugged wells is low and therefore it can be ignored
The 50% abandonment number in five years was based on a real life case
history in the Barnett Shale Play, the 2007 vintage wells on the DFW Airport
Lease that Chesapeake asserted would produce "for at least 50 years."
As I said, it doesn't matter whether one assumes a 50% or a 1%
abandonment percentage in five years, this is a math question.
Are you guys incapable of answering a math question?
Enno and Dennis have repeatedly asserted that that there is NO survivor
bias.
In any case, at least for people who do not reject fundamental mathematical
principles, it's when, not if, that survivor bias becomes a factor in regard
to year over year rates of change calculations.
Lets say output was 500 kb/d in 2010 from 500 wells and in 2015 these
same 500 wells were producing 100 kb/d, but only 250 of the wells were producing.
If I use 250 wells in the denominator for both 2010 and 2015 to find the
output of the "average" well then in 2010 the average well produced 1000
b/d and in 2015 the average well produced 200 b/d.
There would be survivorship bias if I claimed the "average" well produced
200 b/d in 2015 and that is not what I do.
So I don't see any survivorship bias. As long as we include all the
wells in the data (including those abandoned) survivorship bias is eliminated.
Perhaps Enno and I understand this term differently from you.
Enno and I consider output from the entire play or in my case I will
often construct a hypothetical "average well" where the average well profile
is equal to total output divided by the total wells completed.
You are correct that this is a question of arithmetic.
Let's say 50% of the wells were abandoned and initially there were 100
wells completed. If we take total output and divide by 100 to find the average
well profile, then for this hypothetical average well there is no survivorship
bias.
There would be survivorship bias if I divided output by the number of
producing wells to find the average well profile, but that is not
what is done, I use 100 in the denominator even if there are only 50 wells
producing (in the example above.)
I agree that the 22% decline number reflects the decline from the
wells still producing, and the percentage of plugged/inactive wells may
or may not be material in regard to survivor bias.
The 22% decline rate reflects the decline rate of all wells completed
not only the wells still producing.
Let's say 1000 wells were completed and output was
100 kb/d (example chosen for simple arithmetic rather than realism) in the
first year, let's also assume that 1 year later output fell to 80 kb/d from
the initial 1000 wells, but that 100 wells were plugged and abandoned.
No survivorship bias
year 1 output is 100 b/d for average well
year 2 output is 80 b/d for average well
a decline of 20% for first year
Survivorship bias
year 1 100 b/d for avg well
year 2 89 b/d for avg well (80,000b/900 producing wells)
a decline of 11% for first year
I don't use the number of producing wells, I use the total wells completed
in the denominator no matter how many wells are producing, that eliminates
any survivorship bias.
The answer to your question in bold is yes that is exactly what
I am asserting.
As long as one uses 10 wells in the denominator for all years to construct
an "average" well profile there is no survivorship bias, if one used the
number of producing wells in the denominator there would be survivorship
bias.
I use your model above to find a NSB (no survivorship bias) average well
profile and an SB (survivorship bias) average well profile. Chart below.
As noted up the thread, I showed that dividing annual production by the
original number of producing wells (10 wells in the model I showed) to correct
for survivor bias has no effect on rates of change calculations. In both
cases, one is simply calculating the year over year rates of change in total
production from surviving wells , and as noted, it's when, not if
that it becomes a material factor.
Dennis had the following response in one of his previous comments:
To me (and possibly Enno), using the original 10 wells in the denominator
is adequate to calculate the average well profile.
How does one respond to people who reject fundamental mathematical principles?
More importantly perhaps, why should one waste one's time responding to
people who reject fundamental mathematical principles?
I think it's time for another grizzled oil patch veteran to bid you guys
adieu. Good luck with your continuing efforts to, in effect, to assert that
1 + 1 = 3, because it feels like a better answer.
Jean Laherrere had a post on POB that indicated a 20 to 30 month lag between
rig count and production, during the expansion phase. Empirically the curves
seemed to match but I don't get why the delay is that high or the correlation
so close. However if true it would suggest production is going to fall off
of a cliff over the next 2 to 6 months.
"Another reason why production hasn't fallen as rapidly as some expected"
Rats can chew thru a PV Source circuit and you have barbecue but Future
Energy Production is not Jeopardized. With an unconventional well It's my
understanding that the Resource may be affected if shut in or altered. Perhaps
in the environment, E&P's "can not afford" to take this risk (??)
Baker Bughes in 2012-2014 issued well count for key U.S. oil and gas
basins.
Using the well count and rig count, they have calculated the number of wells
drilled per 1 rig per 1 quarter and year.
Unfortunately, this product was discontinued in 2015.
I was wondering about my claim (which may be incorrect), that during
a bust the less qualified or hard working people get laid off and a company
is left with their best workers.
If that is correct it would seem that the elite crew that remains would
make fewer mistakes and get more accomplished on average on any given day.
This would tend to increase rig efficiency (number of wells drilled per
month per rig) if we assume everything else is unchanged (which is never
correct in the real world.)
Dennis, company men (middle management, on site supervisors) get comfortable
with certain rigs and the personal on those rigs. If Dennis is given 14
wells to drill in 2015 he will stick with H&P 395, if he can, because he
is on a first name basis with the toolpusher and everyone else and they
all work in 3 part harmony; hands will stay with a rig and the rig boss
(toolpusher). There might be some inner rig contractor personal movement
based on time with the company, etc., I don't know anymore. If Nabors 419
gets stacked, most of the hands on that rig will go to the house. When I
roughnecked, and was a driller, when my rig got stacked I went mostly to
the wine shop and waited it out. Certain companies generally ask for certain
rigs if they can.
Again, I don't think rig efficiency can improve much; I think I have
already said as much. Those shale rigs get it and go. Its like tire manufacturing,
almost. There is always a problem that comes up. Think of all the wells
they have drilled in the past 7 years; everyone on a rig, and steering,
and running casing, and cementing and frac'ing know what the drill is now.
Fourteen wells per rig per year is what I guess, maybe 15 depending on pad
stuff. Costs will not go down based on efficiency as much as competition
between rig and pumping services vying for limited work.
It looks like the the US oil refiners like a bargain when they see one.
http://www.eia.gov/petroleum/supply/weekly/pdf/highlights.pdf
"U.S. crude oil imports averaged 8.3 million barrels per day last week,
up by 1.2 million barrels per day from the previous week. Over the last
four weeks, crude oil imports averaged 7.6 million barrels per day"
They don't seem to worried about the so called glut of US oil production with an increase
of oil imports like that?
That was always one of the funniest things about this "Oil Glut". The US stocks though they
were in the upper range, were certainly not overfull. Now I know the US is not the world, but
they do use 25% of the words oil, and do put out some of the best number on a timely manner, and
therefore a good guide to what is going on in the market, but maybe there were keeping their powder
dry, and are now racing to fill their boots, while the 50% discount sign is still on display.
What Kiernan fails to understand is that peak oil does not happen overnight. We have hit
the peak of conventional low cost oil production and demand exceeding that conventional oil production
has pushed prices up to a level where higher cost oil is now possible to develop.
If we had an option, we wouldn't be spending money to produce shale oil, because it is high
cost. But at the current level of demand we need shale production. That is why the drop in oil
prices is not going to be permanent. The price of oil needs to be at a level that allows shale
production to continue.
"... I think the "shale revolution" may never really recover from the price collapse. Investors will think twice before putting any money there again. Unless the oil price goes alot higher than 100 $/barrel and stays there for a while. ..."
"... Hard to how a business can keep running on negative cash flow, falling price of its only commodity, and interest rates continuing to rise, if a lender can be found, that is? ..."
"... "What is clear is that the world has become addicted to central bank stimulus. Bank of America said 56pc of global GDP is currently supported by zero interest rates, and so are 83pc of the free-floating equities on global bourses. Half of all government bonds in the world yield less that 1pc. Roughly 1.4bn people are experiencing negative rates in one form or another. ..."
Current oil price collapse is exposing many false claims about shale profitability.
Oil price will recover, but investors will forever become more cautious.
Drilling pace in shale oil mainly determined by credit availability and cost. With investors
being more cautious, drilling activity will become less aggressive .
I think the "shale revolution" may never really recover from the price collapse. Investors
will think twice before putting any money there again. Unless the oil price goes alot higher than
100 $/barrel and stays there for a while.
Down in the comments, I thought this was very interesting,
"A quick check indicates that both Whiting and EOG, two of the better shale plays, continue
to show negative free cash flow"
Hard to how a business can keep running on negative cash flow, falling price of its only
commodity, and interest rates continuing to rise, if a lender can be found, that is?
"What is clear is that the world has become addicted to central bank stimulus. Bank of
America said 56pc of global GDP is currently supported by zero interest rates, and so are 83pc
of the free-floating equities on global bourses. Half of all government bonds in the world yield
less that 1pc. Roughly 1.4bn people are experiencing negative rates in one form or another.
These are astonishing figures, evidence of a 1930s-style depression, albeit one that is still
contained. Nobody knows what will happen as the Fed tries to break out of the stimulus trap, including
Fed officials themselves."
"... The momentum of the shale boom can be seen in the large overhang of drilled but uncompleted wells (DUCs) sitting out in the field today, looming over the market and weighing on any potential oil price recovery… ..."
Raymond James analysts shared a similar viewpoint, noting a certain dynamic
on the oilservice industry. "Lower returns and crimped cash flow lead operators
to slow activity and conserve cash in any way possible," the note said. "Since
many of the land rigs had longer-term contracts and the frack crews didn't,
the quickest way to conserve cash is to drill but not complete."
But wells are obviously being completed. In fact more wells are being completed
than being drilled but we obviously don't know just how many. And…
DUCs to Prolong Shale Boom Hangover
Many prognosticators of oil and gas markets have found themselves on the
wrong side of U.S. production calls throughout the shale era after failing to
understand and model the risks associated with operational momentum. Increases
in well productivity brought higher potential returns, and every company in
the oil patch scrambled to gain the assets, people, and infrastructure to grow
production (and hopefully cash) in the future. As supply growth outpaced demand,
prices sank, but production hasn't responded with an equal intensity. Why doesn't
production respond accordingly? The same reason you can't turn around an aircraft
carrier on a dime, momentum.
The momentum of the shale boom can be seen in the large overhang of drilled
but uncompleted wells (DUCs) sitting out in the field today, looming over the
market and weighing on any potential oil price recovery…
Until the number of DUCs returns to levels more aligned with historical working
inventory levels (3-6 months of drilling), we expect their threat to loom large
over the market and have a dampening effect on any near-term price recovery.
But their longer term impact could loom just as large. If producers steer too
much capital away from drilling, and instead harvest DUCs to maintain production
and cash flow in 2016, the human capital behind the rig fleet could be lost
to other industries, making service cost inflation all but guaranteed when U.S.
supply growth is again needed. It looks like this hangover will be felt for
years to come.
Conclusion
The decline in the oil rig count cannot, in the near term, be directly linked
to a decline in oil production due to so many DUCs. But eventually it must.
Steep declines in oil production must eventually follow steep declines in the
rig count. And as we see a drop in production we will see a corresponding rise
in prices. This, in turn, will cause an increase in well completions, knocking
the price back down again.
So don't expect any quick recovery of either oil prices or production. Yes,
it looks like the hangover will be felt for years to come. And in the meantime
peak oil will be in the rear view mirror. But no one will notice for years to
come.
"... This ship has some big holes in it and is taking on water; what else is the captain going to say to it's passengers? Abandon ship? Some folks are getting ahead of themselves; EOG had a plus 40 dollar hedge and lost money last quarter. Now it says it can make money at 30. If anybody thinks EOG has been "saving" its good locations for high grading, or super high grading, whatever they want to call it, that is ridiculous. Oil companies don't drill the worse stuff first and save the best for last. I drive thru the guts of EOG's operations all the time; they have been hammering that stuff down there for years. There are stinkin' shale wells everywhere. Look at a TRRC GIS map for Karnes County. ..."
"... Shale oil that declines at the rate of 73% the first 3 years of production cannot compete with the rest of the world's conventional fields. Haven't we just learned that? ..."
"... The horse is gone and over the hill; closing the barn door now by slashing CAPEX costs is a day late. And several hundred billion dollars short. And when these shale companies have to come off the drilling hamster wheel, and those steep declines on exiting wells really kick in, hold on to your knickers, boys. ..."
These guys are getting desperate. I think because no shale oil company can qualify for additional
lending based on the 65% yardstick of PV10, it is back to trying to raise money again by promoting
stock to grandmas and grandpas. I think there is evidence this might even be working?
EOG stated it could reduce costs, maintain production (essentially) and even deleverage. Right.
It's important to recognize that this latest round of rhetoric, and bluster, fails to address the
issue of existing debt. I think these shale guys want a do over.
I like EOG and hope they succeed, but at a development pace that is conducive to price stability,
not production spikes. Oil price volatility will be the death of the American oil industry and it
is up to companies like EOG to control production spikes and help keep oil prices stable. EOG led
the way in LTO oversupply and that is the primary reason we are in a nine line bind now, all of us;
LTO oversupply. I don't believe a vowel of what the shale oil industry says anymore and so myself
and several much smarter friends try and stick to the numbers, and not the hype. EOG states it is
going to slow development and not bleed as much cash in 2016. That's a necessity, not a plan. My
smart buddy up hole thinks they are still going to gush cash this year (and by the way, his numbers
do not even include G&A or interest expense!). EOG has been drilling in the lower EF and geo steering
in 10 ft. windows for years. It's sweet spots are pretty well delineated. Go to Cheapside, Texas
(now called Richside) here: http://wwwgisp.rrc.state.tx.us/GISViewer2/
and decide how much saturation drilling it can still do. It is already drilling wells 18H and higher
on their 1000 plus/minus acre units. Again, we don't "save" our best locations for last in the oil
industry so we can drill them when oil prices decline 70%, I assure you. CAPEX costs can't come down
too much more, I don't think. OPEX costs have come down very little.
Mega frac's cost mega bucks. They make for bigger IP's so shale companies can create bigger EUR's
to make themselves look healthier than they are and to meet lender covenants. Higher IP's appear
to be resulting in steeper declines and not much more UR, not enough to pay for the mega frac's.
The funky EUR stuff is going to come out, big time, pretty quick.
These shale guys are NOT making money and the interest meter on their massive debt never stops.
The PV10 value of their reserves are now vastly insufficient to be able to still borrow money; many
of the best shale companies barely have assets equal to total debt. They owe lots of money and by
2018 that is all come to head, big time.
This ship has some big holes in it and is taking on water; what else is the captain going to say
to it's passengers? Abandon ship? Some folks are getting ahead of themselves; EOG had a plus 40 dollar
hedge and lost money last quarter. Now it says it can make money at 30. If anybody thinks EOG has
been "saving" its good locations for high grading, or super high grading, whatever they want to call
it, that is ridiculous. Oil companies don't drill the worse stuff first and save the best for last.
I drive thru the guts of EOG's operations all the time; they have been hammering that stuff down
there for years. There are stinkin' shale wells everywhere. Look at a TRRC GIS map for Karnes County.
Shale oil that declines at the rate of 73% the first 3 years of production cannot compete with
the rest of the world's conventional fields. Haven't we just learned that?
The horse is gone and over the hill; closing the barn door now by slashing CAPEX costs is a day
late. And several hundred billion dollars short. And when these shale companies have to come off
the drilling hamster wheel, and those steep declines on exiting wells really kick in, hold on to
your knickers, boys.
I read that CLR will return to activity if prices reach $45. At least that is the headline.
Assuming 200K gross barrels of oil from a CLR Bakken well in 60 months, 160K net with 20% royalty,
with a $7 discount to WTI, per CLR recent 10K, such a well will only gross $6 million dollars
in 60 months.
So after 60 months CLR will still be over $1 million short of reaching the cost of the well,
BEFORE, considering 10% severance tax, OPEX, G & A and interest. Also, none of the land acquisition,
permitting , seismic, etc is considered.
Why do the MSM ignore this. It seems so elementary to me.
Bakken LTO needs $80 WTI, minimum, to be a good investment. Just do my 5th grade math. Don't
need any exotic presentations to figure this out.
SS,
Don't pay attention to headline. They are just part of deception game. Shale production is adjusting,
US on shore is adjusting. Today I have briefly scanned that Russian paper is stating that Russian
big oil have a meeting today where among the topics are "freeze" (previously discussed with Saudis,
Qataris) and even some possible cuts. Pieces are coming together although it looks like at snail
pace from the perspective of someone like you that is caught in this bullshit politics. But it
is coming.
Ves, Don't pay attention to headline. They are just part of
deception game.
This is not typical business as usual and
a regular level of MSM deception with corrupt jornos bought by
powerful interests. This is something more then that. The level
of cheerleading of low oil prices is really deafening.
Elementary logic is ignored in most such articles. Which makes
them pure propaganda. which looks a lot like war propaganda to
me. Guided by the same principles:
1. Obscure one's economic interests;
2. Appear humanitarian in work and motivations;
3. Obscure history;
4. Demonize the enemy; and
5. Monopolize the flow of information.
and
These principles are abstracted from Jowett & O'Donnell.
•Avoid abstract ideas – appeal to the emotions.
•Constantly repeat just a few ideas. Use stereotyped phrases.
•Give only one side of the argument.
•Continuously criticize your opponents.
•Pick out one special "enemy" for special vilification.
Pieces are coming together although it looks like at snail
pace from the perspective of someone like you that is caught in
this bullshit politics. But it is coming.
I also hope so. But it looks like there are powerful forces
behind the current drop. And they will not give up easily.
Bakken LTO needs $80 WTI, minimum, to be a good investment. Just do my 5th grade math. Don't
need any exotic presentations to figure this out.
Exactly!
Bakken oil production is more like mining coal than it is drilling for oil ("Red Queen effect").
All company operating in this areas have crushing debt levels. Obtaining revolving credit line
when prices are below $80 might become very difficult as Bakken has the highest marginal cost
of production. So this slump will last longer for Bakken then for other plays.
Also "carpet bombing" drilling is new and might have some additional effects that we now can't
predict. I would give three years on restoring investor confidence.
"... They say it is because of the low price. They have increased oil production 10% per year in the last years, due to the horizontal wells, but for next year they foresee no production increase. I have seen profiles of their horizontal wells and within 12-18 months their production is 50 % less. ..."
"... Their water injection activity has caused a lot of propery damage in the area, but the government has turned a blind eye. ..."
Bankers Petroleum which operates the biggest on shore oil field in Europe, Patos-Marinza in Albania,
will rest 3 rigs out of 6 in 2015.
They say it is because of the low price. They have increased oil production 10% per year in
the last years, due to the horizontal wells, but for next year they foresee no production increase.
I have seen profiles of their horizontal wells and within 12-18 months their production is 50
% less.
Their water injection activity has caused a lot of propery damage in the area, but the government
has turned a blind eye. A whole village with uninhabitable houses and people having nowhere to
go. If they protest the police arrests them. Local people think Bankers is producing oil through undergroung blasts (could it be?). Maybe this slowdown will spare some houses.
Bankers is also good at manipulating balance sheets looking unprofitable for 5 years now, so
the state budget won't feel much of the slow down. No word of this slow down in the Albanian media.
They only pound thea good news.
I read that CLR will return to activity if prices reach $45. At least that is the headline.
Assuming 200K gross barrels of oil from a CLR Bakken well in 60 months, 160K net with 20% royalty,
with a $7 discount to WTI, per CLR recent 10K, such a well will only gross $6 million dollars
in 60 months.
So after 60 months CLR will still be over $1 million short of reaching the cost of the well,
BEFORE, considering 10% severance tax, OPEX, G & A and interest. Also, none of the land acquisition,
permitting , seismic, etc is considered.
Why do the MSM ignore this. It seems so elementary to me.
Bakken LTO needs $80 WTI, minimum, to be a good investment. Just do my 5th grade math. Don't
need any exotic presentations to figure this out.
SS,
Don't pay attention to headline. They are just part of deception game. Shale production is adjusting,
US on shore is adjusting. Today I have briefly scanned that Russian paper is stating that Russian
big oil have a meeting today where among the topics are "freeze" (previously discussed with Saudis,
Qataris) and even some possible cuts. Pieces are coming together although it looks like at snail
pace from the perspective of someone like you that is caught in this bullshit politics. But it
is coming.
Bakken LTO needs $80 WTI, minimum, to be a good investment. Just do my 5th grade math. Don't
need any exotic presentations to figure this out.
Exactly!
Bakken oil production is more like mining coal than it is drilling for oil ("Red Queen effect").
All company operating in this areas have crushing debt levels. Obtaining revolving credit line
when prices are below $80 might become very difficult as Bakken has the highest marginal cost
of production. So this slump will last longer for Bakken then for other plays.
Also "carpet bombing" drilling is new and might have some additional effects that we now can't
predict. I would give three years on restoring investor confidence.
Click to Edit
Request Deletion (56 minutes and 59 seconds)
Thanks Shallow for digging thru these filings and Uncovering what should be clear --
Fernando posted this yearly cash flow matrix ROI for the Powerwall which shows that Energy stored
via Electro-Chem can not compete yet with the Delta of baseline vs peak power rates. When I point
this out to people this they think I'm clueless. Anyway – Need something like this for wells in
different plays or companies to point out the Insanity. Perhaps I missed it or i'm actually clueless.
Three Big Shale Plays Decline Rate Going To a More Than One Million Barrels A Day!
Using Ron Patterson's updated rig counts per play, I used that data along with production data
from the EIA Productivity Report to calculate the expected overall decline rate per play.
All data is per month.
The Bakken has 36 rig running, and has a "New Well Production Per a rig" of 725 barrels per
day, and a decline rate ("Legacy Production Change) of 58,000 b/d.
New production (rig times rate) is 26,000 b/d so the net decline rate (new – decline rate)
is 32,000 b/d
Doing the same calculation for the Eagle Ford
Rig = 41
Production per rig = 800
Baseline Decline rate = 110,000
Net decline rate = 77,000'b/d per month
Permian
Rigs = 162
Production per rig = 425
Baseline decline rate = 83,000 b/d
Net decline rate = 14,000 b/d per month
Adding the net decline rate for the three plays we have an overall decline rate of 123,000'barrels
a day per month.
That comes out to a yearly rate of 1.47 million barrels a day.
We are not at that rate today as it takes time for dropping a rig to effect production rates.
I would expect to see thus overall rate by some time this summer. It is much larger than anyone
is expecting.
"... Pickens said Saudi cannot produce more than 10 million billion barrels per day. Well someone else agrees with me. I wish he had went farther and said that there is no OPEC spare capacity. I am sure he knows that. ..."
"... Pickens may not have the capability of writing Of Fossil Fuels and Human Destiny and The Grand Illusion , but when it comes to that oil barrel, man – he knows very well whats coming! ..."
Pickens said Saudi cannot produce more than 10 million billion barrels per day. Well someone else
agrees with me. I wish he had went farther and said that there is no OPEC spare capacity. I am
sure he knows that.
Joe Kernan is a complete moron. He was mocking T.Boone, who was predicting higher prices all the
way from $30 to $140 in 2004-2008. At current growth rates, Saudi's will consume an additional
1 million barrels per day of their own consumption in 5 years. Ditto for Russia. Gonna be very
interesting.
That's precisely why he reacted with the lexicon and facial expression he did when his "old
buddy" Joe "challenged" his point of view and tried to portray him as a "same ol', same ol' "
charlatan!
Pickens may not have the capability of writing "Of Fossil Fuels and Human Destiny" and "The
Grand Illusion", but when it comes to that oil barrel, man – he knows very well what's coming!
And the imbecile Joe got it (or was told) at the end that you do not mess with T.Boone…so we
have to end on football and the "come again when in NYC…" bullshit.
"Well someone else agrees with me"
I would argue with some accuracy that a few more than "someone" do indeed agree with you Ron,
but your ultimate proof of vindication and sign that what you narrate about is close…very close,
stands with the fact that idiots akin to Joe Kernan, Ron Insana, etc. feel confident and knowledgeable
enough on mocking Matt Simmons…
-As Mr. Joseph Kennedy said: "…when the shoe shine boy gives you stock tips, cash out and stuff
the mattress…".
ExxonMobil Focuses on Business Fundamentals; Paced, Disciplined Investing
ExxonMobil anticipates capital spending of $23 billion in 2016, down 25 percent from 2015.
The company continues to selectively advance its investment portfolio, building upon attractive
longer-term opportunities.
Either the speed of electrons has slowed down, or Exxon is recycling old news. I first heard
it as breaking news on CNBC, live, not a replay. lol
Looked it up on Noodls, which took me to the Exxon page. Time stamped as Mar 2, 2016 – 08:11
a.m. EST.
So, max oil production when there has been falling demand causes
low prices which is good for consumers, what could go wrong?
If you're Syria you're the pipeline hub to enable either NATO or
Russian control of european gas supplies.
If you're Ukraine, well, everything has gone wrong, hasn't it?
Innocence of the masses VS effective propaganda...
If you're Yemen then your border is contiguous with that of a large
Saudi oil field, not to mention a competing brand of Islam.
If you're Iraq then, well, you've been totally f*d over since Bush
Sr., sorry about that.
If you're Libya and want to sell oil in gold Dinars, and your name
is Kadaffy (I know, but who cares how it's spelled?) then you should
have known better. Doesn't matter if you have a huge aquaifier and can
give away land and irrigate it, or provide free university education.
I guess I should be glad I'm just a simple consumer! Wait, I'm
paying for all this shiite!!!
Short term, the trade was to sell w/34.69 APR 16 as a stop. There
is still the trend, mojo to the downside, which has not yet broken.
The shot game is to hold feb high, and plunge to new lows, so March is
a thich red monthly bar that closes near the lows. I think the trigger
price is Feb highs, and it isn't too far away prev year sett, meaning
a break of feb = touching the prev yr sett, and going positive for the
year, which is an epic event, esp in this setting. Right now the
market is trapped inside of the 2/16/2016 shadow, w yday close
conspicuously settling (once again) inside that shadow @.75, with the
top of yday bar @.98, last trade 90.
the news is bad, but the news is bs. just a headline. the news is
only a story, the truth is somewhere else. so trading on old news
wears out and the paradigm shifts. pretty soon they talk about how the
world's population break 8 BB, so many ppl, so much demand, all that
stuff. then you stare at a chart that is in love with the upper right
hand corner of the chart, instead of the lower.
It's hard to see it, and believe me, impossible to feel it, esp
with all this short sniping and juking ower, threatening, etc, but,
and I get the velocity of money thing, I had not really taken that
fully into consideration, but nonetheless, the money supply flying
around out there is still 4x greater
today
that it was in
2009, where the prices were
higher
than they are now. On the
surface of it, that seems crazy to me.
So, theoretically, commods across the board are front running a
collapse in money supply (which has not happened yet) bcz, if I have
this right, the ponzi scheme of this money system requires fresh debt
to cover old % obligations, and those % obligations touch innumerable
amounts of debt instruments, govt, corp, down to mom and pop private.
As ZH hammers away on all the time, the question is, exactly
where
is the fresh money supply supposed to come from to cover?
If ZIRP failed for lack of takers, and one could argue that failure is
real because of the existence of NIRP, where the banks just go into
your acct and simply take
your
money to cover
their
obligations, and if NIRP is only a temporary bandaid (TM, haha)
solution, the argument goes that if there is not enough liquidity in
the system, these obligations
cannot
be covered, and as we
saw in 2008, when
that
happens, the par value of the bonds
pretty much hits zero, and when that happens,
then
the money
supply crashes, because as we know,
debt is money.
Assuming Putin is not (at least completely) right about the selling
politically motivated, with the hidden hand behind it the US Treasury,
trying to destroy Mother Russia (that has to at least be a factor),
what I would say that we are looking at, considering the extreme, mind
blowing divergence between oil prices and the stock market indices, is
at least the
possibility
the market has just
priced in
the coming money supply wipe out, the
worst case scenario.
So let's say the money supply crashes from today's levels to 2009,
that is a big drop, for sure, but oil
already played that
, to
the
extreme
of hitting $26 (!). That would definitely have an
impact on stock prices, but if oil
was
at $35 @2009 MS
levels, why would it be @10?
Of course, when the money supply crashes, moving away from the
current, seemingly impenatrable MS ceiling, this then leaves a lot of
room for fresh injections of money supply, to get the game started all
over again - but not after a lot of ppl get whatever they had in
equity totally wiped out.
But, under my analysis here, assuming that scenario, oil was way
out in front, so they wont be trading on that anymore because it
happened. That is old news, for real. And in that scenario, oil
production gets wiped out, but the demand (static as it generally is,
increasing only with a steady rise in population, in broad terms),
this would force oil prices much higher.
And what if the bet on money supply crash is wrong, and the central
banks pull a rabbit out of their hat? That is supportive of oil prices
as well.
Finally, setting aside all else, assuming our crazy world just
keeps on keeping on, and the fraud of headlines continues to mask the
truth that things are far better in the world than the headline
dictates, and that no new technology has come into play that makes oil
obsolete, the most basic and primitive analysis has one looking at
$26 v 0 and $26 v $150. You tell me, where is the risk?
Getting to new all time highs in a commod can take a very long
time, I grant you that. But no matter how I slice it, while sellers
might get some love down here for, what, $10, $15, they are starting
to play a game of market roulette, where instead of one bullet in the
chamber, there are like 3 or 4.
Thus, (150 - 25) / 2 = $62. (150 - 15) / 2 = $67. In other words,
the lower the prices go, the higher the mid point in the range between
old all time high, and last printed low. Some would argue the $150 oil
was an anomaly, but I say it has to be accounted for, and the
underlying factors that led to it are still in play, and not likely to
change for years to come. Even
if
there is an equity crash
back to 2009 lows, what does anybody thing the odds are that the fed
res system will be abolished and the hands that control the money
system will change?
If
that
happens, then the FRN becomes extinct, and then
perhaps we see a repricing across the board, where
everybody
gets a massive haircut. But that is a separate issue. Apples and
oranges, and a different risk discussion. Hence, in the present
context, I see oil back in the mid 60s, hard to say when, 2 years? Who
knows. But if the context doesn't change, I am far more focused on
that $150 than the $10, because if the context doesn't change, even
if
there is a MS crash, as oil is way out in front of it,
they can just rebuild the MS and put everybody right back where they
were in 2007, or even worse - meaning oil trades @ $200 p/bbl, back to
peak oil headlines, incessent demand, etc.
You cant see it now. 5 years? 7? Yeah, it wont look like this.
Leave it to the markets and the news and all the BS of the day
distract you from seeing a once in a lifetime opportunity. But, that
is what makes a market a market. Everybody has their own ideas, and
definitions of risk, and execute accordingly.
All this idiotism with drilling while having negative cash flow will eventually stop.
And unless supply of "free money" is somehow restored it can be resumed only when the price
go above approximately $80 per bbl. Because for non-crazy investors this is a real, not MSM fantasy
land break even point for shale producers if you calculate all the costs (and they are not static:
the higher oil price is, the higher the costs). OK, +- $10 depending on the area.
Think about it as "shale conundrum" or Catch 22 situation.
And about the value of EIA price "forecasts" of three and four (2020-2016=4) years ago ( STEO
Mar2012 and Mar 2013). Are they really worth electrons with which they are painted on the our
screens ?
Russia's crude and condensate production in February was 10,840 kb/d (preliminary estimate), up
2.1% year-on-year, and down 25 kb/d (0.2%) from January level.
Hedge funds and other money managers held a combined net long position in the three main crude oil
futures and options contracts amounting to 383 million barrels on Feb. 23.
The combined net long
position has increased in eight of the last 11 weeks from a recent low of 230 million barrels on
Dec. 8. (tmsnrt.rs/1XUWJih)
But the increase in hedge fund and other money manager net long positions has been concentrated
in Brent rather than WTI. (tmsnrt.rs/1XUWS5i)
The net long position in Brent futures and options traded on ICE Futures has jumped by more than
100 million barrels to 320 million barrels from 183 million barrels.
The net long position in WTI futures and options traded on ICE and the New York Mercantile Exchange
has risen less than 20 million barrels to 63 million barrels from 47 million barrels. (tmsnrt.rs/1XUWVy1)
Extreme pessimism about the near-term outlook for prices, which reached its height in December
and early January, seems to have dissipated a little.
There is more confidence that the long-awaited rebalancing of supply and demand is now underway in
earnest which could help stabilize stockpiles and prices later in 2016.
U.S. shale producers seem to be finally cracking under the strain from low prices, with more than 100 oil drilling rigs idled over the past month, and many producers now openly talking about producing less in 2016.
That interrupts the logic, and is not to be considered. It is not important that upstream companies
are out of bucks, and nobody will lend them any. Drilling will continue to be done with cash available
until which time, the coffers start filling. May take some time to put into completing those wells
that are only profitable at 80. Be quacking for quite a while. However, that interrupts the logic
of lower for longer, so it is not to be considered.
You don't have to be an economist or a CPA to figure out how difficult it will be for oil companies
to again be growing at this point. It is mostly going to be funded by internal cash flow. Let's
assume that EIA'S estimate of the average Eagle Ford's EUR to be 168,000 bbls, and somewhat meaningful.
So, maybe the average first year's production to be 75,000 bbls.
At 100 a barrel, they recover the cost of the capex, plus a little more. They can drill another
well with positive cash flow. Probably describes the average DUC. At 80 a barrel, they are in
negative cash flow. Probably, a profitable well, but negative cash flow.
They did not make back enough money to drill a new well the first year. Later, next year, but
not by the end of the year. So amount available for capex goes down.
At 40, they may, or may not recover the cost of the well. If the DUC is an average Eagle Ford
EUR, then it could sit for quite a while if lower for longer is the logic.
That is the main reason you won't see large scale ramp ups on production until it stays over
70 for a while. A large percentage of the area is average, or less than average.
Last week
we reported that in what has been Saudi Arabia's biggest victory to date
in its war against U.S. oil and gas producers, both Whiting Petroleum, which
is North Dakota's largest oil producer, and Continental Resources would indefinitely
suspend fracking operations for the foreseeable future. The reason was simple:
oil prices are too low to make incremental drilling and pumping profitable,
and instead most shale companies are now entering hibernation, limiting cash
outlays in the form of dividends and capex spending, in hopes of weathering
the crude oil storm, which has already gone on far longer than even the most
pessimistic mainstream pundits expected it would.
Which, of course, is the right response: as the saying goes the cure for
low oil prices is low oil prices, and as more shale companies halt drilling,
exploring and production, the 3 mmb/d oversupplied oil market will slowly return
to equilibrium.
There is logically a flipside to that as well: as those companies which have
recently mothballed operations either voluntarily or because they had to when
they went bankrupt when oil was at $30, return to market the previously oversupplied
market condition will promptly return as well, thereby pressuring oil lower
yet again.
The question is at what "breakeven" price does it make sense for US shale
companies to return. As
Reuters reports , less than a year ago major shale firms were saying
they needed oil above $60 a barrel to produce more ; however in just
one year this number has changed and quite drastically at that.
We hinted at this three weeks ago in an article which many readers had a
hostile reaction to: specifically we warned of "
Another Leg Lower In Oil Coming After Many Producers Found To Have Far Lower
Breakevens ." As we reported then, "what many thought would be the "breaking"
price point for virtually every shale play has just been lowered, and quite
dramatically at that. It also means that algos and traders who had reflexively
bought any dip below $30 on expectations this is close to the "sweet spot" and
where the Saudis would relent, will have to drop their support levels by as
much as a third."
Today
Reuters confirms that this assessment was stpo on with a report that some
shale companies say they will settle for far less in deciding whether to crank
up output after the worst oil price crash in a generation.
Among the companies which are prepared to flip the on switch at a moment's
notice are Continental Resources led by billionaire wildcatter Harold Hamm,
which said it is prepared to increase capital spending if U.S. crude
reaches the low- to mid-$40s range, allowing it to boost 2017 production by
more than 10 percent, chief financial official John Hart said last week
.
Then there is rival Whiting Petroleum which may have stopped fracking new
wells, added it but would " consider completing some of these wells"
if oil reached $40 to $45 a barrel, Chairman and CEO Jim Volker told analysts.
Less than a year ago, when the company was still in spending mode, Volker said
it might deploy more rigs if U.S. crude hit $70 ."
EOG Chairman Bill Thomas did not say what price would spur EOG to boost output
this year, but said it had a "premium inventory" of 3,200 well locations
that can yield returns of 30 percent or more with oil at $40.
Apache Corp , forecasts its output will drop by as much as 11 percent this
year, but said it would probably manage to match 2015 North American
production if oil averaged $45 this year.
The reason for the plunging breakeven price? The same one we suggested on
February 3: surging, rapid efficiency improvement which "have turned U.S. shale,
initially seen by rivals as a marginal, high cost sector, into a major player
- and a thorn in the side of big OPEC producers."
To be sure, while many had expected low oil prices to curb output, virtually
nobody had predicted that even a modest jump in oil ($40 is just $7 from here)
would lead to a major portion of US shale going back on line.
The threat of a shale rebound is "putting a cap on oil prices," said John
Kilduff, partner at Again Capital LLC. " If there's some bullish outlook
for demand or the economy, they will try to get ahead of the curve and increase
production even sooner."
Which in turn will force the Saudis to immediately retaliate, breach all
amusing "production freezes", and double down their efforts to crush shale.
In fact, some producers have already began hedging future production, with
prices for 2017 oil trading at near $45 a barrel, which could put a floor under
any future production cuts.
Another risk factor for all those hoping the modest rebound in oil will persist
is the record backlog of wells that have already been drilled but wait to get
fractured to keep oil trapped in shale rocks flowing. There were 945 such wells
in North Dakota compared to 585 in mid-2014, when prices peaked, according to
the latest available data from the Department of Mineral Resources. Their numbers
are growing as firms like Whiting keep drilling, but hold off with fracking.
Reuters' summary:
Their latest comments highlight the industry's remarkable resilience,
but also serve as a warning to rivals and traders: a retreat in
U.S. oil production that would help ease global oversupply and let prices
recover may prove shorter than some may have expected.
Our
observation three weeks ago was practically identical : since Saudi Arabia
had expected that its FX reserve outflow would last only temporarily using $40-50
breakevens, it will have to sell many more US reserves (either TSYs or stocks)
to fund the cash shortfall which will persist for far longer until oil catches
down to the lowest cost US producers.
What this means is that for the Saudis to declare victory they will have
to unleash a sharp downward oil spike that lasts long to put as many marginal
producers out of business as possible.
As we said: "In short: the oil price war is about to enter its far more vicious,
and far more lethal phase, and while it is unclear who ultimately wins, whether
it is Shale or the Saudis, the loser is clear: anyone who bought into bets of
an imminent oil bounce."
But the real punchline has nothing to do with breakeven prices and efficiency
and everything to do with balance sheets, because if and when the mass default
wave finally hits and hundreds of U.S. corporations undergo debt-for-equity
exchanges in which the bondholders end up with the equity keys, then the all-in
production costs (AIPCs) will be drastically cut even lower as there will be
no interest expense left to cover with operational cash flow proceeds.
As such, the stunning outcome may well be one in which U.S. shale turns Saudi's
"marginal producer" war on its head, and unleashes a massive oversupply spike,
one which slowly at first then very fast, leads to the Saudi exhaustion of its
FX reserves, until it is Saudi Arabia which itself is pushed out of the low-cost
production bracket and is instead forced to deal with far less palatable outcomes
such as social insurrection and revolution, as its already precarious welfare
state fights for survival in a world in which government oil revenues have trickled
to a halt.
What happens to the price of oil then is unclear, but what will need to happen
before we get to that point is very clear: oil will have to trade far, far lower
from its current price.
And even if it doesn't, we now have the oil price ceiling bogey: any time
a barrel of crude approaches $40, watch as the "marginal" producers do just
that, and resume production on very short notice.
Once a well is dug, they just keep pumping it. It costs money to shut
it down, better off to keep running until you can't breakeven at the daily
cost level which my guess is somewhere in the single digits for oil companies.
These "costs of production" also don't factor in that all of the O&G suppliers
cut their prices as oil prices decline so while it may have cost "$50" to
pump oil 2 years ago the cost is much lower because all the equipment suppliers
are struggling and cutting prices as well.
All through 2015 we've heard about how the storage was going to be gone
"soon". The reality if you look into it is that no one really knows how
much storage is available. Seems really stupid, I know, but no one ever
kept track of it in any single or consolidated database so everything is
run off of "estimates" and we all know how reliable those are. My guess
is that storage is likely a lot higher than these estimates make it because
there was so much money flowing in oil during the run up years that people
probably built a ton of it. It was covered on ZH once that no one knows
what the actual global (or even US) storage capacity is I think in like
2014 but then the stories converted over to just that we are running out.
We're still running on rumor from the Saudi's. I don't think it will
matter in a few months when the economic numbers can no longer be 'adjusted'
into a smiley face......
Investors are so starved for yield that even at $20 oil most of these
companies will be able to either issue equity and/or issue debt to rollover
any upcoming debt repayment obligations. Until the market freeze up this
party will keep going.
Goldman helps with both the selling of equities and debt. More selling
is good for Goldmen. Brakeing the companies in the process and rewarding
themselves, dont forget the bankruptcy management teams.
Wow, thank god. This is great news. Since the financial media cheerleaders
are always accurate and correct once this baby gets back above $40 I can
get out there again peddling High Yield Shale Bonds yielding a massive 4.99%
at par. The assumptions built in are quite reaosnable oil just needs to
hold above $40 in 2016 and then rocket above $100 in 2017 holding at least
at that level for twenty years to cap total capital losses at only 30%.
I'm really anticipating strong interest in these debt instruments.
"... Id say this crash will pretty well end much hope of conventional onshore in US regaining 2014 levels. Added to the inevitable future declines in GOM, US onshore LTO will have to carry the day. ..."
"... Capital investment was $401 million in 2015 Vs. 2016 capital investment plan of $50 million ..."
"... Approximately 30% of 2016 crude oil production hedged in excess of $50 per barrel ..."
"... I am not critical of CRC, just pointing out what they say their base decline is with no new wells. ..."
California Resources Corporation released earnings today. They disclosed they plan to neither
drill nor complete a well in 2016. They stated that they believe their base decline rate to be
10-15%. They produced 102K barrels in Q4 2015. That is their net. I think gross they produce about
20% of oil produced in California.
Interestingly, Denbury Resources, who has operations in different area, but like CRC, has primarily
secondary and tertiary recovery, but of different kinds (CO2 v steamflood being the major one)
is forecasting 10-15% reduction in production from 2015. Again, forecasting minimal to zero new
wells.
Of course, decline is different than shutting in production.
I'd say this crash will pretty well end much hope of conventional onshore in US regaining
2014 levels. Added to the inevitable future declines in GOM, US onshore LTO will have to carry
the day.
At current prices, CRC expects that available liquidity plus expected operating cash flows
will be sufficient to fund its capital program and 2016 commitments.
The Company recently received 100% approval from its bank group to amend its credit facilities
The amendment requires cash in excess of $150 million be applied to repay outstanding revolving
loans, reduces the revolving commitments to $1.6 billion and imposes certain other restrictions.
"Expect to see us(CRC) demonstrate financial discipline to maintain sufficient liquidity through
2016. We plan to continue building economically viable drilling inventory, while managing our
activity consistent with our principle of living within cash flow."
Capital investment was $401 million in 2015 Vs. 2016 capital investment plan of $50 million
Approximately 30% of 2016 crude oil production hedged in excess of $50 per barrel
"... In other words EIA operating with four meaningful digit on the data with error margin at or above 1% is just a sophisticated form of deception of (mathematically challenged) public creating an impression of precision were it does not exist. ..."
If we assume error margin 1% for EIA data that means that EIA data should be rounded to two meaningful
digits before making any conclusions.
That makes minimum meaningful difference 100,000 bbl. Everything below that should be considered
to be statistical noise.
In other words EIA operating with four meaningful digit on the data with error margin at
or above 1% is just a sophisticated form of deception of (mathematically challenged) public creating
an impression of precision were it does not exist.
And if the addition is below the error margin it can't be considered statistically meaningful
because the value 9,262 is in reality an interval from 9.162 to 9.362 within which the precise
value lies.
Looks like Russian bear after being hit in the head and robbed at gun point starts slow awakening
from hibernation. The honchos of Russian oil companies are now officially onboard for the freeze
and some of them want more drastic measures. They have a discussion of "stabilization of Russian
economy" (which means stabilization of oil prices) with President Putin, which means that Putin
got his marching orders from oil oligarchs, some of which wants "quid pro quo" from the
government (not to increase taxes on oil despite budget deficit). Details are scarce. But previously
hapless head of Rosneft Igor Sechin lamented about the situation he drove his company into, being
completely unprepared to the oil price crush. May be he got promises of additional loans to keep
the company afoot.
Generally Russian performance in this crises leaves to me the impression of complete incompetence
on high level. Especially unimpressive is Alexander Novak – the Russian Minister of Energy. He
speaks like a typical neoliberal. This is when more centralized economy should score points and
they instead were taken for the ride and continued to buy the US Treasuries. Why not to buy Russia
oil for the strategic reserve instead, like China did ? I think Russia still does not have any
state strategic oil reserves (the only major country in such a position).
President Vladimir Putin and the heads of major Russian oil companies discussed implementation
of decisive measures to stabilize the Russian economy in view of increased volatility of world
markets.
As a start Russia is ready to join the group of countries within and outside OPEC, which approved
the proposal to freeze the level of production of oil in 2016 at January level. Such production
limits can be implemented by a joint agreement of key countries, that is already was put on table
on Feb 16, 2016 by Saudis, Russia, Qatar and Venezuela and now is at the stage of multilateral
discussion with other oil exporting countries. The final decision is expected somewhere in March
on a new meeting of Ministers of oil producing countries.
This meeting at the Kremlin was chaired by Vladimir Putin and was attended by all key representatives
of the Russian oil industry - the Chairman of the Board of "LUKOIL" Vagit Alekperov, the General
Director "Surgutneftegaz" Vladimir Bogdanov, the head of Board "Gazprom oil" Alexander Dyukov,
the President of the company "Bashneft" Alexander Korsik, the General Director of Zarubezhneft
Sergey Kudryashov, the head of "Tatneft" Nail Maganov, President of "Rosneft" Igor Sechin, the
head of the Independent oil and gas company Eduard Khudainatov.
In addition, the Russian minister of energy Alexander Novak and the head of the presidential
administration Sergei Ivanov, as well as aide to President Putin Andrei Belousov also participated
in this meeting.
This year Alexander Novak held a series of meetings with Ministers of oil-producing countries.
In February, the negotiations in the Qatari capital and it was proposed to fix the production
at the level of January. In January, Russia produced 46,006 million metric tons of oil with gas
condensate. This is 1.5% more than in January 2015. Average daily production amounted to 10.9
million barrels.
Before the meeting, when everybody was sitting at the table, Vladimir Putin held a short private
consultation with Alexander Novak. After that Putin opened the meeting with the following statement:
"As the Minister reported to me, some of you have more radical suggestions (for the countries
- exporters of oil. - Izvestia) for the stabilization of oil markets, but about this particular
measure (fixation of production at the level of January. - "The news") as I understand something
close to a consensus already exists.
The purpose of our meeting today is to hear from each of the heads of the companies represented
here personally the opinion of each of you on the subject of the discussion. How do you really
feel about the current situation and measures that need to be taken ?"
CEOs of major Russian companies remained silent while journalists were present. Only the General
Director "Tatneft" Nail Maganov and Chairman of the Board "Gazprom oil" Alexander Dyukov start
grinning, because these companies in January of this year recorded a growth of production relative
to January of last year (by 4.2% and 5.6% respectively, according to the Central Department of
Control of Fuel and Energy Complex).
After those introductory remarks journalists were asked to leave the meeting.
The meeting did not last long. After the meeting ended, Minister Alexander Novak in a press
conference said to journalists that all heads the Russian companies who were present supported
this international initiative. He stated that:
The implementation of this freeze should give a positive impulse on oil markets. It increases
the predictability of behaviors of key market participants, which should lead to the reduction
of volatility…
Today, the total surplus of world oil production is estimated to be around 1.5 million barrels
per day. If you freeze the level of production on the level of January, 2016 and the demand
increases by 1.3 million to 1.5 million barrels a day, the oversupply in the market will be
eliminated at the end of the year. And we already saw some signs of stabilization of the market
after this measure was announced.
Alexander Novak also noted that this freeze may not only reduce price volatility but also shorten
the period of depressed oil prices to the end of 2016, when in his opinion oil prices can return
to the $50-60 per barrel range. He noted that as of today 15 oil producing countries have publicly
declared his readiness to sign the agreement.
According to the Minister, they represent around 73% of world oil production. The exact format
of the agreement, in which the key is the method of monitoring of compliance, is yet to be determined.
The sighing of the freeze agreement can happen at another meeting of oil ministers in March.
According to Alexander Novak, even if Iran does not join the agreement, the market will still
stabilize, as Iran still has a very low level of production and can't increase it fast. Due to
this countries-signers of the agreement can make an exception for Iran and increase its ceiling
over the January 2016 level.
Freezing production at least will stop flooding the market with new volumes of oil in the delusionary
pursuit of "market share", commented on the event the analyst of FC "Discovery Broker" Andrei
Kochetkov. It will more be influenced by the financial strength of companies and countries as
well as the real costs of production from the depleting fields. On average, traditional oil wells
lose 3-5% of production volume each year, he said. Accordingly, if the flow of new investments
in the field slow down to a halt, the global market might lose another 3-4 million barrels per
day of the production at the end of the year. This drop even if less drastic as stated will increase
the pressure on oil prices said the expert.
There should not be any major problem for Russian companies with freezing the production of
oil on January, 2016 level said the head of the analytical company of the Small Letters Vitaly
Kryukov. We should not fear that this measure damage our fields, given that in Western Siberia
production continues to fall, he said.
That, of course, might lead to less drilling in some places but will not affect the commissioning
of new projects that were under construction. For example, LUKOIL is expected to launch new projects
this year in the Caspian sea, but at the same time they are quickly losing the volume of production
in Western Siberia.
The second topic discussed at the meeting with the President was the taxation of Russian oil
companies. The heads of the companies have asked the head of state in the medium term, not to
raise taxes and to keep the current system of taxation while the current turmoil with oil prices
exist. In his after the meeting interview Alexander Novak stated that Vladimir Putin is now aware
about the position of the heads of Russian oil companies on this subject, but this issue still
needs to be discussed inside the government.
"... consider Ilambiquateds previous mention of what I call, The Shopper-Shafter, for apparent programmatic-mining of reciepts for patterns to optimize prices as high as possible to help shift the baselines in the race to the bottom. Have I got that right, Il? May I suggest you somehow incorporate Kardashian as spokesperson and have her riding the new bigger/better/badder Toyota Priapus in a Race to the Bottom Sweepstakes! ..."
Carl Martin: Is an average EUR of 750,000 net bbl of oil per well accurate in the Bakken? It doesn't
appear that it is when one looks through the public information put out by the State of North
Dakota. Further, it doesn't appear generally that Continental has the wells capable of hitting
this figure. EOG and Whiting are the primary companies to have the wells capable of 750,000 net
bbl EUR, based upon public data.
I have read on this site that 320,ooo gross bbl EUR is more probable overall in the Bakken,
although I am sure if people have agendas they can skew the numbers. I think at least a few of
the people who post here appear to have strong enough math/science/engineering backgrounds to
make some pretty reasonable calculations and are making an unbiased attempt to be as accurate
as possible.
Trying to figure out what is accurate and what is not is more difficult than what you let on,
IMO. It does appear that substantially lower oil prices may provide some answers.
There is that. 2.7 Billion at $10 million/well, from the CLR Nov investor briefing, is 270 wells.
For the whole year.
Avg flow year 1 is about 450 bpd? So incremental revs in 2015 would be 270 X 450 X $30 (net
of Bakken Sweet minus royalties, taxes) = $3.65 million, for the whole field for the whole year
from new wells.
Maybe Warren Buffett will do what he did for BoA. They created a special preferred issue for
him to buy $5 B of. Paid 8% dividend or something. Hell, he may get more of Harold's money than
the ex.
"Avg flow year 1 is about 450 bpd? So incremental revs in 2015 would be 270 X 450 X $30 (net of
Bakken Sweet minus royalties, taxes) = $3.65 million, for the whole field for the whole year from
new wells."
err I think you forgot that a year has 365 days? That comes out to more than 1.3 billion dollars
even at these depressed prices!
The average well flow for the first year is about 233 b/d, not 450 b/d (second month output is
usually highest at about 400 b/d), the average well produces roughly 85 kb in year 1.
Using Watcher's figure of 270 wells and call refinery gate oil prices $60/b, transport costs
$12/b, OPEX plus other costs $8/b leaving $40/b, then we need to pay taxes and royalties of roughly
25% on wellhead revenue of $48/b, so we need to subtract another $12/b and we get to $36/b net.
If 270 average wells are drilled we get about 23 million barrels of oil in year 1 for a net of
$826 million. The wells cost about $9 million each for a total of $2.4 billion. Looking at a single
well, we need 250 kb for simple payback (ignoring the time value of money), but the average Bakken
well takes at least 8 years to reach 250 kb of output, typically a "good well" pays out in 18
months or less. At two years the average Bakken/Three Forks well in North Dakota produces about
130 kb which is about $4.3 million in net revenue and far short of a $9 million payout level.
No, the 750,000 boe is just a reference to CLR's claim, that they have eight years of drilling
activities, that can produce that much per well. TRANSLATION: The current low oil price environment
is easily weathered by simply high grading. Any company with similar property can do the same.
But, many of the newer, smaller Bakken dotcoms have no such property, so their very existence
is in great danger.
It is nowhere near the average Bakken EUR.
By the way, unlike so many others here, I don't guess anything, and have very few opinions
of my own. I mostly just repeat what is generally accepted knowledge about the shale industry,
because no one has so far been able to prove any of it to be wrong.
It's just that none of my researched information supports any PO theory at all. That's the
rub.
So at what cost does oil have to be produced in the future? Where are we find this oil? And are
you so negative about renewables you think they won't be competitive with oil at $500 per barrel
in today's dollars?
Enno Peters collects data on all North Dakota wells from the NDIC, the EUR of the average Bakken
well between 2011 and 2014 is about 325 kb of oil, if you add in natural gas and convert to barrels
of oil equivalent(boe), it increases to 406 kboe, but note that the extra 80 kboe is very low
value relative to crude.
Note that the typical well in an investor presentation is not the same as an average well.
Maybe CLR only drills above average wells.
I don't dispute your average EUR numbers, as I don't have the neccesary info to do so. Besides
that, they sound about right to me. But you need to be careful about getting too hung up in
the word or concept of average. After all, what do you think is the average gender in the US
in Dec. 2014?
Investor presentations ALWAYS show their best results, and almost never reveal all the failures,
that bring their averages down. This is just business as usual. But, it is okay because they
are always moving up the learning curve, so by showing their best results now, they are giving
a clear indication of where they expect their average results to one day be.
Also, if you want to understand this industry, it does no good to focus on average companies,
you need to look at the leaders, because they are the trend setters. Ultimately everything
is based upon best practices, and EOG is presently the undisputed best at everything. They
just don't keep investors very well informed. Therefore, I still get most of my info from CLR.
This sentence of yours is not as silly as you might think. "Maybe CLR only drills above
average wells." In a sense, "they do." That is to say, that they have no monster wells, that
I know of, they choke a lot more than others, and they have used their standard 10,000 foot
lateral and 30 frack stages well design over most of the Bakken, even when it didn't make economic
sense to use it. It is because they use their standard well as a measuring stick. Now they
have a fixed point for reference to compare different areas of the Bakken.
That's why they know exactly what they are talking about, and why I accept most everything
they say. You obviously don't. But, you have never given a good reason for not doing so, other
than the results they are claiming don't show up in the data bases you are using. Why don't
you just send them an email and try to clear up a major misunderstanding on your part? Then
everyone at this website will be able to move forward.
Continental wells with first month of output between Jan 2009 and Oct 2014 have an average
cumulative output over 70 months of 186 kb, this is slightly below the average Bakken well
over the same period for all wells completed(925 wells).
There is a lot of hype in investor presentations.
The Continental wells will produce considerably less oil that the 480 kb claimed (only 80%
of the 600 boe EUR is oil) in investor presentations. The EUR is more in the 250- 300 kb range
for the average Continental well.
I wonder if they have run flow meters to check how much flow they get from the toe of a 10
thousand foot lateral. You seem to follow this closely, are those wells slugging?
Dennis, sometimes very long wells in three phase flow can have phase segregation in the horizontal
section. This causes liquid slugs to accumulate, which tend to move up the well in slug flow.
This can be avoided by placing the heel higher than the toe. But I've never worked with a 10
thousand foot well. And I was wondering if they had sensors to confirm the toe is producing.
I came to the same conclusion as you Dennis. The Continental wells are actually bellow average.
I have attached a graph showing the production profile for Continental wells from January 2010
to October 2014. I also included the average Bakken well profile for 2010 for reference. The
first 3 year cumulative oil + gas production for an average Continental well is about 170.000
boe. No one knows what the EUR will be, but EIA suggests that 50% of the oil has been produced
during that time (
http://www.eia.gov/forecasts/aeo/tight_oil.cfm ) which gives an EUR of about 340.000 boe.
Carl, you are saying yourself that they only show the best results and don´t tell about
their failures. So why should we then believe in anything they tell us? I have learned that
you should never ever trust in what companies tell in their presentations. Especially not smaller
companies which are dependent on cheap credits. It is actually quite disturbing that companies
can make such exaggerations and get away with it.
I however agree with you Carl that there are still drillable locations left in sweetspots.
But perhaps some companies start to run out of them. That would affect total Bakken output,
which I am mostly interested in.
I posted a chart for average Bakken cumulative output per well by company for four large companies
over the Jan 2009 to Oct 2014 period( about 1/3 of all ND bakken/Three Forks wells drilled(3462
wells).
The "avg" well is for all Bakken/Three Forks wells in North Dakota over the same period with
a cumulative of 197 kb per well over the first 58 months of output.
Chart came out a little small the first time so I will try it again.
I put together data for more companies, about 75% of total wells, too many for a clear well
profile so I am using a bar chart with 54 month (4.5 year) cumulative output for the average
well for each company over the Jan 2009 to Oct 2014 period. The average Bakken well is shown
for comparison. Companies with more than 200 wells over the chosen period are presented below.
Surprised by QEP, they don't get the hype the others do. Always assumed EOG had the most
productive wells in the Balkan due to Parshall. Must have wells in other areas which bring
the average way down.
I wish TX reported by well as opposed to by lease. Would be really interesting to see the
same info for EFS and Permian horizontal wells.
Really seems irresponsible for these companies to claim EUR oil at 600,000+. I guess they
assume the wells will produce 40-60 bbl per day for 25 years. Will be interesting to see if
they do.
It looks like the quote from the other day, "Continental must drill all above average wells",
may need some adjustment. To "Continental must drill all below average wells"?
I show the North Dakota Bakken/Three Forks cumulative average well profiles by company for
the Jan 2009 to Oct 2014 period, total wells for this set of companies is 6472 wells of about
8054 wells completed (drilled and fracked) for all companies operating in the North Dakota
Bakken/Three Forks (80%). This is where I got the data for the bar chart. QEP energy is the
high well profile and OXY is the low well profile, the middle dashed line is the average well
profile for all companies (including those not presented in the chart).
Exactly, Mr. Walter. If one uses the ND DMR Gis map to get a micro view, then glance at 'bigger
picture' using either Mr. Hughes' colored dots or – more informatively – the aforementioned
ND slides, it should be clear that the high productive/sweet spots (red – Hughes, yellow/white
– DMR) have a lot of drilling yet to go.
That's a great graphic that shows many things. The spacing on virtually every one of those
wells is st least 1,200′ apart. The successful down spacing will prompt a near doubling of
those wells if the 700′ spacing proves widely workable. The designs of the fracs are more and
more purposefully geared to extend no farther than 300′ or so from the wellbore.
The underlying Three Forks formation has at least two or three productive layers that the USGS
actually claims to be larger in recoverable hydrocarbons than even the middle Bakken.
Crowded dance floor? If Shania walked in, room would be made garonteeed.
I have a geologic theory to propose on the basis of no evidence. Doug, listen up. Mike, ditto.
So we drilled and fracked a lot of laterals. Then we are going to shut down. For a year
or three. We're going to near zero output. Loss of 3.5 mbpd, up the imports to keep people
fed, etc.
People come back and say, the price is up. Let's get going again.
But down there 10,000 feet we have four counties that have been pin cushioned and nanopores
down there having been subjected to 3-5 yrs of explosion type vibrations. And there are lots
and lots of empty pores now, from wells drilled and emptied.
If we give the nanopores in the undrilled places long enough, with very poor natural permeability,
and lets say long enough isn't a million years, lets say it's just 3, might that oil flow over
to the empty pores?
Then you have drilled and fracked wells that refilled, but only about 1/8th of what they
had. The pressure is gone. Much more important, those areas not yet drilled are losing their
oil. It's flowing to the already drained wells.
I *think* this makes the whole field uneconomic pretty much forever? No one well will have
enough in it to warrant going after it?
Heh Watcher, I'm currently "in transit" and, damn it, I left my crystal ball on the mantle.
Truth is I have no idea. My gut feeling is you could come back and carry on. Perhaps the areas
drilled like Swiss cheese would be degraded on some scenario like you suggest, BUT, in general,
tight formations are tight and fracked "cylinders" could (should) be independent (new) structures
- I imagine. But your opinion is as good as mine. And although I've some geological savvy I've
zero LTO experience. I'll think about your question on our next flight leg but main concern
right now is Christmas presents getting to Norway (Bergen) in one piece. Meanwhile keep doing
your stuff. Cheers.
Watcher, one quick comment before I go to work, its never good to frac a well then shut it
in. I know that is true in fractured carbonates and other tight sandstones, it must be true
for shale also. As you elude to, the frac "energy" is lost over time (like blowing up a balloon
and the letting it squeal out the outlet). Natural micro fractures in shale are expanded and
filled with proppant during the frac process; they will closed back if the well is not produced.
At that depth there is over burden forces that cause proppant to embed into the shale also
closing the fractures.
Well, I don't know what the scale is on that map and neither to you. Lets assume you are right,
they'll go back in between those wells and drill more wells, when the price of oil is 119.oo
dollars a barrel. But to accommodate that, spend more money and get even more in debt, they'll
re-tweak the frac-radiuses on those wells so they DON'T interfere with each other; less sand,
less rates, fewer stages?
But wait, I thought they were doing just the opposite, they were using more sand, more water,
bigger rates, more stages, super-hero, big-boy frac's…no? Might they be doing that to increase
frac radiuses and URR on a given unit…to keep from having to drill in between wells? I am confused.
Whooptie to doo on the stacked horizon thing. Not so good, I hear. And the USGS, well, the
boat done left the dock without them out there in California, uh?
Time to give up the ghost. Time for the shale oil biz to tell it like it is. They'll win
friends and influence more people by telling the damn truth!
Mike, both you, I and anyone can get precise scaling from your graphic by clicking on the above
(Mr. Walters) link which takes you to the North Dakota DMR Gis map. It contains a ton of info
– including physical locations – of every well drilled in the state going back to the fifties.
The one sq. mile rectangles are formed into 1,280 sq. acre/2 sq. mile Drilling Spacing Units.
The issue of mimimally effective spacing between wells is an ongoing quest with companies like
Carrizo claiming success with 300 foot spacing in the Niobrara.
Gotta go. Best wishes and best of luck to you all.
Just curious as to why you (apparently) think that oil companies don't actually want well
communication ( well interference/ pirating) between wells in the same zone?
The actual production of oil wells is highly influenced by all the natural low grade seismic
activity going on in their area. Fracking is just artificial low grade seismic activity, and
there is considerable evidence out there, that fracking actually improves overall oil production,
if there is well communication going on within specific zones. That's why nearby wells are
temporarily shut in during fracking operations. But, so far no one wants well communication
going on between two different zones, because it would be too difficult to monitor and control.
If done correctly very close down spacing can result in greater overall productivity, and
at a lower cost. That is, after all, why it is done. Would you consider doing some homework
on this issue?
The actual production of oil wells is highly influenced by all the natural low grade seismic
activity going on in their area.
Uh?
I am sitting on a rig right now trying to get home to see my family for Christmas, Mr. Martin.
I don't have the time, nor the inclination to engage with you, or whomever, about lofty shale
oil EUR's and years of drillable locations, nor do I seek to debate you the merits of zipper
frac'ing, interlacing frac tips and the economics of infield development. Whatever you have
to say about it comes straight off a shale oil website, or quarterly report, anyway. I have
heard it all before. There must be a press package to download somewhere.
The point that you wish to make, I think, is that I have it all wrong, as do a lot of people
that post here often, about shale oil. It is everything shale oil companies say it is, that
you say it is, and much more. Got it!
It is geology 101 and has nothing to do with shale oil companies. All the rocks on planet
earth are in constant (slow) motion. The proof of this can be seen in oil production. In any
given area, or well, it is not at all steady. You can easily see how oil production jumps in
all the wells in a given area, when a minor seismic event occurs nearby. Why don't you ask
a geologist in the company you work for about this phenomenom?
I've been here and done this before with another oil field worker. Just because you happen
to work in an oil field doesn't mean that you know much about the business. What you know,
or don't know, certainly gets revealed pretty quickly in a forum like this.
You are basically saying that you won't prove me wrong, because you don't have time to do
so. That's just a cover up. You won't attempt to prove me wrong, because you simply can't,
but your hurt pride won't allow you to admit it.
We are all witness to what coffeeguyzz has said to you, and you wern't left with a leg to
stand on. Sorry, but I've yet to meet a PO believer who has not revealed himself to be anything
other than a hot bag of air.
If that shoe doesn't fit you, then I'd sure be interested in anything further you have to
say.
Carl: "The actual production of oil wells is highly influenced by all the natural low grade
seismic activity going on in their area." What's your point? Are you suggesting micro seismic
events increase or decrease well productivity? I've never heard anyone suggest micro seismic
activity correlated with oil flow rate increases. I've no doubt strong events affect rock permeability,
in various ways, but would be loath to say it was working in one direction. Of course there
is always background activity (as well as diurnal (tidal) rock formation flexing). If you wish
to pursue this I recommend: Stress Waves in Solids by Kolsky, a readable work on wave propagation
in non-elastic solids.
Doug, I can't get too detailed about it here…in some cases we have both lab, and field, data
showing vibrations and pressure pulses increase recovery. I have a theoretical outline for
pressure pulse effects in heavy oil displacement I may publish one of these days. I haven't
seen data for fractured tight zones, therefore I can't say anything about it, but I wouldn't
toss ideas in the waste basket so fast.
Mr. Leanme, the comment above implied "natural" seismic activity in the earth "highly" effects
the consistency of oil production (everywhere). Oil pressure "jumps" in areas of seismic activity,
that sediments are constantly moving. I don't buy that, not to the effect they change production.
I have not seen that in 50 years of doing this stuff. We were not talking about induced seismic
pulsation or vibration down casing, that sort of thing. I have experienced that theory; in
clastic sands and fractured carbonates it did not work.
Mr. Martin, by the way, you have the manners of a goat. My trying to get home from a well
to see my family for Christmas was not a "cover up." I wished you a Merry Christmas and you
then insulted me. I am not retired (at 65), nor am I an "oilfield worker." I am still actively
engaged in exploration and production, from developing the prospect to seeing the end result
into the tanks and managing the production over the ensuing years. That is how I feed my family
and the families of my employees. In other words, I have to invest my money into my beliefs,
my money where my mouth is, so to speak. How 'bout you? That does not make me an expert on
anything, on the other hand I don't like to be insulted by kids on computers who develop ideas
based on website dribble. I think clearly your ideas about 750K EUR's is BS. You just got embarrassed
with some real data.
Indeed there are lots of straws to still get stuck in sweet spots, big deal. I believe,
and several very smart people believe, that sweet spots are being depleted. Production data,
declining IP's, increasing GOR and increasing WOR all indicate that, clearly. The bottom line
in all discussions of oil development, past, present and future, is based on the ECONOMIC sustainability
of that development. The numbers and fluff don't mean nada; its about the money. I am still
waiting on the shale industry to sho' me some money.
In the Eagle Ford, lateral orientation is generally dip oriented, heel to toe from NW to SE
or vice versa. I think this corresponds to stress fractures in the rock. The shale guys down
here like to drill two laterals parallel to each other, not perpendicular, and frac both laterals
at the same time, something they call zipper frac'ing. The frac's are designed so that the
tips interlace with each other to achieve better URR; that is their "downsizing" MO. Having
said that, the shale oil folks are now touting bigger frac's; more stages, tons of sand pumped
at enormous rates, to achieve greater frac radiuses to get those highly sought after IP's,
that translate into big EUR's, that translate into booked reserves that translate into happy
bankers. I don't why they would then want to drill 9 million dollar in between wells, just
to say they can, inside the partially drained radius of a nearby well but hey, if its on the
internet, it must be true.
Mike, that sure makes sense for the Eagle Ford. I was referring to the Bakken well layouts.
Some operators hace wells drilled perpendicular to the "normal" direction.
Reference the vibes and pulsing, I think it depends on the reservoir. Pulsing works with
highly viscous oils if the reservoir is being flooded. It works much better if the producers
aren't cutting a lot of water. I saw some odd results for vibration but that may have been
fake data put out by a promoter. But none of this is from natural seismicity.
Fernando, "but I wouldn't toss ideas in the waste basket so fast". I'm not sure how saying:
"I've never heard anyone suggest micro seismic activity correlated with oil flow rate increases.."
is tossing anything in a basket. I understood Carl's comments as being directed at NATURAL
micro seismic activity. Pulsing (something that you introduced) doesn't seem relevant to Carl's
(or my) remarks.
A few people have mentioned higher density drilling in the Bakken and the layers of the
Three Forks which might be exploited.
The Continental Hawkinson well data is available which is a poster child for higher well
density (more wells per square mile).
Note that the first Hawkinson well was drilled in the three Forks and started producing
in Feb 2010 and was very productive (356 kb over first 24 months), two more wells started producing
in Sept 2011 (one in middle Bakken and one in Three Forks). All three of these wells look like
they were refracked by Sept 2013 when 11 more wells started producing as part of the high density
experiment. Early wells were averaged together by month from first output, the early wells
are the first 3 wells which started producing Sept 2011 or earlier.
Later wells are the 11 wells which started producing in Sept 2013 (7 are Three Forks wells,
3 are middle Bakken, and one is not labelled). The later wells produce an average cumulative
output about 40% lower than the first 3 "early" wells.
Chart with individual Hawkinson wells, the indication is that higher density drilling will
reduce the average well output, despite what the investor presentations might suggest.
Another point, is that sometimes people claim that with low prices the oil companies will
just drill in the "sweet spots". As the Hawkinson wells show, even in a sweet spot, as the
first three wells clearly were, further drilling does not always produce high EUR wells, you
don't really know what you will get until you drill and frack and then start producing.
Seems to me the key to this business is to batch drill and complete multiwell pads, use liners,
gas lift, design surface systems for 700 Barrels of fluid per day, keep things simple, automate,
keep things simp,e, widen spacing and negotiate hard to lower costs. They also need pipelines.
And this wouldn't be such a critical decision if the state used its brains and paced development
to hold state production flat at say 700 thousand BOPd. It's a shame they allowed the play
to go wild, it causes a lot of human suffering.
"…can you give any examples anywhere or anytime of what you're talking about??" ~ Nick
G
You.
And/or some of your comments, what they seem to suggest, and how they sometimes read– like
a corporate commercial shill … Maybe that G is actually a 6? …Looks a little funny
over here on my screen… Maybe there're attempts being made to assimilate/upsell me as well…
Should I upgrade to the new Nissan Leaf-blower or the Toyota Priapus?
"Permaculture and relocating to the land may solve most of fossil fuel lack of supply."
~ Rita
" Those are unrealistic . Electric transportation, biofuels and synthetic fuels
would work just fine…
A Nissan Leaf is the cheapest vehicle on the road to own and operate (with the tax credit!),
and it'll get you to any job within 40 miles (and 80 miles, if you can charge at work).
A Chevy Volt is among the cheapest vehicles, and it'll take you anywhere…" ~ Nick 6
' With the tax credit! '.
…Examples ostensibly suggestive of those caught in the Matrix/Plato's Cave, and upholding
it while subverting their own foundations, lives, freedoms, fellow creatures. The ultimate
prisoners perhaps, ones that don't believe they are, and that resist reasonable attempts at
being freed.
"In The Decline of the West, Spengler noted that the last phases of every civilization are
marked by increasing technological complexity. This is strikingly true of planetary culture
today…
…'Why Civilizations Fail' outlines quite ably the reasons why civilizational failure is
inevitable, why the grasping control ethos of domestication comes to its self-defeating end.
The book's first sentence also serves very well to announce the fatal illusion that prevails
today: 'Modern civilization believes it commands the historical process with technological
power.'
The fallacy of this belief is becoming clearer to more people. After all, as Jared Diamond
puts it, 'All of our current problems are unintended consequences of our existing technology.'
In fact, civilization is failing on every level, in every sphere, and its failure equates so
largely with the failure of technology. More and more, this is what people understand as collapse…
Despite this reach and height, the rule of civilization is based on less and less [
consider Ilambiquated's previous mention of what I call, 'The Shopper-Shafter', for apparent
programmatic-mining of reciepts for patterns to optimize prices as high as possible to help
shift the baselines in the race to the bottom. Have I got that right, Il? May I suggest you
somehow incorporate Kardashian as spokesperson and have her riding the new bigger/better/badder
Toyota Priapus in a Race to the Bottom Sweepstakes! ]. Inner nature is as ravaged as outer
nature. The collapse of human connectedness has opened the door to unimaginable phenomena among
lonely human populations. The extinction of species, melting polar ice, vanishing ecosystems,
etc., proceed without slowing.
Fukushima, acidifying oceans, Monsanto, fracking, disappearing bees, ad infinitum. Even
rather more prosaic aspects of civilization are in decline." ~ John Zerzan
In fact, civilization is failing on every level, in every sphere, and its failure equates
so largely with the failure of technology. More and more, this is what people understand as
collapse…
You and the peak oil doomers keep saying the same thing, and I'm not sure what value it
contributes. They, like you, expect total collapse.
No solutions whatsoever. If that is the case, I might as well not bother wasting whatever
time I have left to read what you guys write. If I can't do a thing about it, why should I
care what you have to say?
I have also already mentioned
permaculture . But that depends on many things.
"I might as well not bother wasting whatever time I have left to read what you guys write…"
~ Boomer II
For a second, I thought you already started not doing so. But I don't necessarily write
for you, babycakes. Nevertheless, if you like to blow the praises of Nissan Leaf-blowers or
'Shopper-Shafters', I wouldn't blame your response.
"You and the peak oil doomers keep saying the same thing…" ~ Boomer II
The same thing is BAU/BAU-lite or somesuch eat-cake-and-have-it-too/technofixes-for-technoproblems/doing-same-thing-over-and-over
thinking and manifestations… Geoengineering, wage-slave jobs for tax-theft for Nissan Leaf-blower
tax credits, etc. That's baked-in doom. You don't need your so-called 'peak oilers' for that.
Peak oil is, in a sense, almost small potatoes.
The peak oil doomers are just an example of another group of people who think we are all doomed.
I'm not sure why either of you posts. If the world collapses, what is your point? You're
snarky enough that I suspect you're doing it mostly as a troll.
At any rate, if you guys believe there is nothing to do, you are all kind of irrelevant
because we can ignore you and still face the same outcome.
Perhaps we should just let you post and ignore you.
I could argue that you're trolling me. Too easy.
The fact that we are even currently concerning ourselves with peak oil/FF depletion and effects
is precisely what I am and have been writing about– doing things ass-backwards in a nutshell.
So it is highly relevant, even if you want to pretend it isn't and want to– what is this, kindergarten?–
appeal to consensus (' we should' threat rather than ' I should') suck your
thumb in front of ' us ' about it and call me names like, "You baaad troll…
I– no, we - not want talk to you no more! (bad troll… so bad… *sniff*…)
"This is the time for our species to 'turn 21′: to transition from adolescence to responsible
adulthood as citizens of the planet, before we destroy our own future." ~ Culture Change
This is meaningless.
So what are you planning? A military revolution? A peaceful economic transition?
Growing up, smartening up , and permaculture for starters.
And suggesting some for us, yourself. Have you? If so, I'd be happy to take a look.
I might crap on this Dystem, but I do endeavor to walk the talk.
Great. Do permaculture. Get other people to do permaculture.
How do you plan to introduce it beyond where it is already being done? How do you plan to
phase out both fossil fuels and renewable energy projects and what timetable are you shooting
for?
I'm glad to see you clarify that you support a specific improved technical approach.
Make no mistake – this is simply a more sophisticated approach to agriculture. It's part
of what you might call "general progress", and is in no way in conflict with electric transportation
or other improved technical approaches to "getting stuff done".
In other words, there's no conflict between permaculture and "technofixes". Permaculture
*is* a technofix.
"Permaculture and relocating to the land may solve most of fossil fuel lack of supply."
~ Rita
"Those are unrealistic. Electric transportation, biofuels and synthetic fuels would work
just fine." ~ Nick G
"I'm glad to see you clarify that you support a specific improved technical approach."
~ Nick G
You seem to think now that permaculture is more 'realistic', despite perhaps being overly
simplistic and/or appearing less informed about what permaculture is.
But it's a start, and in any case, I did write 'for starters'. My personal verdict is not
yet out, and probably never will be, with regard to permaculture, nor with the human species.
Time will tell, outside of my own ephemeral lifespan.
You seem to think now that permaculture is more 'realistic', despite perhaps being overly
simplistic and/or appearing less informed about what permaculture is
Well, a couple of thoughts, FWIW.
1st, insults don't convince anyone, they just reduce your credibility.
2nd, I'm not trying to present an evaluaation of permaculture: I'm just pointing out that
there's nothing mystical about it – it's an improved "technique" of agriculture (yes, it's
primarily oriented towards ag). I think improved emotional health/spirituality/egalitarian
living is a very good idea, but permaculture wasn't developed by mystics, it was developed
by practical people trying to make everyday life work better.
Now, it certainly has developed into a system that's intended to promote a holistic approach
to life, and respect for all living things.
Which brings us to a basic question: is it possible to approach things through an empirical,
rational basis and come to something that is emotionally healthy, even profound?
Sure. You might want to take a look at Sam Harris' latest book: "Waking up – A guide to
spiruality without religion".
"What was even nuttier than peak oil was peak gas. The Oil Drum looked truly deluded with
the posts by Art Berman who was telling us in 08 through even last year how shale gas was declining
so much that it would go bust at less than $8."
"Probably best not to reply to him Ghung.
Gail ignores him. He attacks her at every opportunity as she refutes everything he denies.
For the last six years he's been saying things are getting better and we need to 'just buy
a Prius'." ~ Bandits
Seeing as my time is more limited than yours seems to be (paid? how? I'm envious.), I'll
leave it at that with the it-goes-both-ways-caveat, since we're on about insults…
"Never argue with a fool, onlookers may not be able to tell the difference." ~ Mark Twain
So no lightening-up or kisses? Awww… But it's almost 2015! But hostility? Moi?! Mais, cherie!
Perhaps Freud would think you were projecting? Juste un peut? Hm? 'u'
…As long I guess as you understand that not everyone has to have a grey, dull, humorless, imprisoning
approach to life. I mean, we can leave that to maybe you and the office drones on the way,
in their fossil-fuel-constructed-large-scale-centralized-governpimp-controlled-on-rolling-blackout-grid-powered
shit-box Toyota Priapuses (or is that Priapi?), to their tax-theft-for-the-governpimps wage-slave
jobs? That's what you want, isn't it? Technocracy? Plutarchic Technocracy?
Well, if so, there's a one-way-trip to Mars that might still be taking signups.
Oh yes, I got you another quote-prezzie, since you seemed less than enthused by Twain. Try
this on, see if it fits:
"If you can't dazzle them with brilliance, baffle them with bullshit." ~ ?
Cuddles,
~ Your contrived-credibility-free Cae
(…Puts down the vodka-and-green-tea-egg-nog for a moment…)
PS, Crony-capitalist-cum-governpimp-managed anything will not give us what you seem to want,
unless what you want is to live in a kind of freedom-restricted prison and to continue to wreck
our communities and planet. That's the ultimate insult, and yes, my hostility there is in abundance,
along with resentment and contempt.
But as you now seem to be conceding, it's a social problem, but 'social problem' is a loaded
term that needs to be evaluated.
PS2: All the energy developments and technical details in the world, and their discussions,
aren't worth shit (although shit's looking pretty good these days) if they disclude real, direct-democratic
community control.
PS3: Horses didn't build coal mines, humans did! (They do build usable manure though, unlike
one-trick-pony Nissan Leaf-blowers, and you can get around on them, even when the governpimps
and their pimped-out infrastructures fade into the anals of history.) 'u^
"At any rate, if you guys believe there is nothing to do…" ~ Boomer II
I had already posted 'permaculture' as well as clarified for you ( twice ) my sence
of how collapse may go ('fractal') both links of which I went through the trouble of locating
for you as well.
But we can only do so much for those who insist on being neglectful and/or willfully ignorant
or whatever…
"This is the time for our species to 'turn 21': to transition from adolescence to responsible
adulthood as citizens of the planet, before we destroy our own future." ~
Culture Change
I have already mentioned on TOD that we live in an infantilistic culture where we don't
know how in general to do much of the basics for ourselves anymore, such as with regard to
growing our own food, making our own clothes, or building our own homes. There's another clue
for you, sweetcheeks, but I can't hold your hand for you all the time, especially if you don't
want to follow and/or have your own foregone conclusions about those 'bad snarky peak oil doomers'
anyway.
Do you believe there are too many of us to go without the inputs of fossil fuels and the technology
which boosts agricultural production? We are also draining aquifers awfully fast to feed everyone.
Most of our farmland may have already been degraded beyond the ability for permaculture to
substitute for existing practices.
Permaculture is something and among what we will probably have to try anyway, like
a life-preserver thrown to us.
Its practitioners seem to think that good, healthy soil can be regenerated from despoiled with
some proper care, insight, understanding, knowledge and wisdom.
Like, Nick G's mention of 'indoor plumbing' might have to be kind of modified with
the keepsake turd in mind.
We are not all doomed. But I was wondering where you think we will be getting 100 million barrels
of oil per day in 2064? Just list a few locations, please.
I believe we ARE running out of oil. And I don't have that innocent outlook about energy sources
appearing in thin air to solve our problems. Producing oil requires an enormous effort, and
it's getting more and more difficult and expensive. This means we probably shouldn't expect
to be producing oil at the very high prices we would require in the future. On the other hand
renewables as we have today are much more expensive. This tells me we ought to be more efficient
using oil, and put more cash into renewable energy research and development. Right now I have
no idea if a solution will be found.
My assumption is that people will do something. It may not be the best solution, but I don't
think people will give up. So talking about alternatives is a reasonable thing to do.
As I have said, I get frustrated with people who are so focused on THE END that they won't
allow any talk of potential solutions or work-arounds. No matter what people toss out, if it
isn't oil, the collapse is coming and ALL people will die.
I don't believe that, so I find talk of conservation, downsizing, and alternative energy
thought-provoking. Of course it won't all work, and no, I don't think the world will support
everyone, particularly in a middle class lifestyle, but I think the world will continue to
support a percentage of the world's population.
The USGS 2000 assessment estimated 3 trillion URR, and upgraded Venezuela in 2009 to 513
billion barrels. The EIA recently estimated an additional 345 billion barrels of tight oil.
That's enough oil to last another 100 years. I wouldn't call that "running out".
With regards to renewables, Solar has already reached "grid parity", not only with oil,
but also gas and coal, in several US states. Solar will reach grid parity in all US states
in a few years.
With regards to transportation, the US has now replaced 10% of it's gasoline supply with
Ethanol. With an increasing number of electric, and hybrid electric vehicles also reducing
demand.
Worldwide, renewables provide 20% of the energy for the power grid.
These are huge gains for renewables over just a few years ago. If you were to graph out
the growth of renewables and alt vehicles, you would see that fossil fuels will be replaced
long before the supply "runs out".
renewables as we have today are much more expensive. This tells me we ought to be more efficient
using oil, and put more cash into renewable energy research and development.
This is unrealistic – renewables are *not* much more expensive. They are competitive in
many places on a marketplace basis, and less expensive if you include external costs.
Sadly, it's clear you've been reading talking points created by industries opposed to competition.
You're going to die, no solutions to that, why bother? So are all your friends, relatives,
etc. Yet still people do bother. Seems to me death should bother people more than collapse.
More inevitable and more final.
I'm not sure if this is directed to me or to the collapse people.
I believe we should be working on options other than fossil fuels, both for resource limitations
and pollution/carbon dioxide reasons.
So rather than focusing on the "this won't work," "that won't work," "collapse is coming
and we can't stop it," and so on, I like to hear how we might cope with the end of the oil
era, and what we do to slow down global warming, and how to cope if we cannot.
I get frustrated with people who shoot down all ideas and only want to focus on collapse.
In which case, I think, "What's the point?"
It's like being born and the only conversations you are allowed to have are about your death.
Boomer – I suspect you're missing the point. Collapse IS the answer to the predicament humans
currently find themselves in. BAU cannot continue without the concentrated energy that fossil
fuels provide. Thermodynamics say so, and their word tends to be pretty final.
I focus on collapse so that those around me might mentally prepare themselves for a massively
lower quality of life – lessen the shock to the system as it were. Men in particular cope badly
with a sudden reduction in circumstances; if I can prevent a few suicides by mentally preparing
folks then all the better.
We slow down global warming by collapsing the economy – it might still be too little too late
though.
IIRC the old Byzantium empire collapsed gradually in a managed way (maybe they actually listened
to their Cassandras
) –
perhaps there are lessons to be learned?
Maybe you should show how 100,000 terawatts could have built the world (without fossil fuels),
7.3 million humans occupy and by that extrapolation it will show how it will support that many
people now. If you can't then you had better look for another blog to confound with your abstract
assertions.
I won't mention that you are the same old shill Nick from TOD and still claiming electric cars,
wind mills and solar are the answer to all our woes. At one stage your answer to everything
including over population was "just buy a Prius".
Yes and he could have said the moon was made of green cheese too, so what. He claimed nuclear
was the answer. Do you say he was wrong about that? Solar power "could", you get a large amount
of "could's" from the cornucopian dreamers.
Well, sure, I was having a little bit of fun, like Watcher often does. Really, when the US
could reduce it's fuel consumption by 25% without any sacrifice at all just by switching to
hybrids, how can you not say things like that occasionally?
Uhhmmm…how could the world run on 100,000TW? Well, transportation could run on electricity
pretty well. Long range driving, seasonal ag, long distance water transport and aviation would
probably work best with liquid fuel, but that's less than 20% of our current liquid fuel consumption,
and the tech to synthesize portable fuels is here, right now. Ethanol can provide some, as
well. Synthetic fuel would be rather more expensive (at least out of pocket), but the scale
would be much smaller, so it would be affordable.
Coal and gas, of course, are mostly used for electricity these days, so replacing it with
renewable electricity would be pretty straightforward (yes, I know it's more variable, but
there are affordable solutions for that – ask, and I'll expand on it).
Well, take 100,000 TW and reduce by 99% to identify the land area that we could use without
too much inconvenience (starting with commercial rooftops). That gives us 1,000 TW. Now, divide
1,000 TW by 7B people, and you get one megawatt.
Now, compare that to the roughly .005 megawatts used by the average US resident (including
all energy sources).
The extreme boomers believe at as soon as BAU ends, homo sapiens face extinction. They believe
homo sapiens can't survive no matter what changes they make.
I see no reason to believe that. Because I expect that hardships to hit different areas
and different groups of people at different rates and levels of severity, I think some people
will survive.
I think life will be different when oil becomes so expensive that it can't be freely used.
But I don't necessarily see that as the collapse to end all collapses.
Again, what frustrates me are doomers who are so locked into the idea that the world can't
survive without oil that they refuse to consider any scenarios where oil is phased out or greatly
reduced in consumption.
I think it is reasonable to consider alternatives to an oil-fueled lifestyle. When people
won't consider alternatives of any kind, I get frustrated with them and figure they only want
to talk about total collapse, rather than talking about what can and will survive, and how.
I see no reason to believe that. Because I expect that hardships to hit different areas
and different groups of people at different rates and levels of severity, I think some people
will survive.
That is, of course, cold comfort to the billions who will die.
This extinction/not extinction dichotomy is a strawman. I suspect that most of us doomers
look at the megadeaths involved in an energy constrained future the way I do: I see the suffering
and shortened lives of billions of people. No people left, a billion people left…it's still
7 or 8 billion people who will live short lives that will probably end really unpleasantly.
I don't see a coming together to distribute the resources of the world and spread the suffering
evenly- mainly because we don't spread it evenly now .
I see a continuation of the system we have- because it means years more life for those who
can play the system. My dad is 90, and my father-in-law is 95. The average life expectancy
in 1900: 46 years. Industrial society has essentially given them 2 lifetimes.
North Americans and Europeans have a 35% greater life expectancy than Africans. Leveling
the playing field (if it were even possible, because North American infrastructure is essentially
200 years of embedded energy and the associated environmental costs) would mean giving this
up; if we didn't, why would anyone negotiate things like carbon reduction and energy use with
us?
So you can argue the extinction thing all you want- it's a mug's game. The real issue, as
far as broad social change to meet an energy-constrained future in an equitable way globally,
is whether you can persuade a majority of North Americans that they should live shorter
lives.
First, low-CO2 energy is very affordable – recent German analysis showed that 80% reduction
of CO2 emissions from their grid would pay for itself.
Second, the feedbacks from energy shortages are very immediate. Prices go up, marginally
useful consumption goes down immediately.
The real problem is the long lag times from CO2 emissions, combined with determined resistance
from the investors who would lose a great deal of money if carbon in the ground became worthless
Germany tried the solar/wind renewable energy boondoggle and all it did was astronomically
increase energy prices to their businesses and profit-makers while creating real energy poverty
for the middle class and the poor. Hundreds of thousands have had their electricity turned
off because they can no longer afford it.
Now Germany seems to finally "get" the sham that is renewable energy and global warming
(which ended 18 years ago, btw) and has been REDUCING solar/wind subsidies while also building
23 BRAND NEW Coal Fired Plants.
Meanwhile also look at Australia. The people there dumped their GREENIE-WEENIE government
and replaced it with a government that reversed the destructive carbon tax responsible for
damaging their economy and prosperity nearly beyond repair.
What's the matter Mark? Despite all the resources you have at the American Enterprise Institute
you still can't muster a single reference to support your assertions.
So you can argue the extinction thing all you want- it's a mug's game. The real issue, as
far as broad social change to meet an energy-constrained future in an equitable way globally,
is whether you can persuade a majority of North Americans that they should live shorter lives.
But that is my point. Life will change. Those changes won't affect people equally. Some
people won't make it. But for others to make it, they will have to adjust. And I think they
will. If not by choice, then by necessity.
And as those adjustments are made, it will help some survive.
I don't think any actions will be taken to give everyone in the world an equal life. So
saying that as BAU ends, everyone will suffer equally doesn't strike me as likely.
In other words, adjustments will be made, but the results won't be evenly shared. The advantage
localization is that if we show there are benefits within a local area, we might be able to
persuade those people to make changes for themselves, if not the world.
For example, the advantage of solar is that one becomes less dependent on centralized power
generation and transmission. There are benefits for individual communities, so they might be
persuaded to pursue that path. Not because it reduces global warming. But because it allows
local communities to become more self-sufficient.
I think is great if some of you think you can transform the world economy to make it more
fair. Or if you think the world economy will become more fair after peak oil. I certainly won't
stop you from carrying out your plans.
But I don't see anything accomplished by pooh-poohing some of the alternative energy ideas
proposed here. How does that advance your cause?
In case you haven't heard the news yet we live in a Darwinian world.
Now explain to ME why I should give a hoot about the eight billion who are indeed at risk
of dying young?
I a was born with a brain programmed by a hundreds of millions of years of evolution to
give a damn about me and mine.
The ones who are going to die a horrible early death are just going to die a horrible early
death. There is nothing at all intrinsically special about naked apes.
A meteor or something along that line took out most of the life on this ball of rocks a
couple of times and the interactions of volcanos and microbes inter tangled with the Milankovich
cycles of our planetary orbit wiped out most live a few other times.
I am only half serious. Only half sarcastic.
JUST a realist. Go ahead and grieve for the billions that are going to die because of overshoot.
Maybe you will feel better.
In the meantime the survivors will be eating and drinking and dancing and screwing and having
a good old time in general.
I am more soft hearted and sentimental than most people when you get right down to it but
you know what Comrade Stalin said ?
ONE death is a tragedy. A million is a statistic.
I would gladly condemn a hundred African or Chinese or Vietnamese kids I have never seen
to death in order to save the life of a child of my own. Failure to do so would eliminate my
own existence in the form of my child. I have NO doubt the average Chinese or African parent
would make the same decision. Suicide is for losers.Life is about winners. Winners write the
history books.
If all this sounds sort of cynical – well that is because being a realist I am also quite
a cynic.
There are many places where far less energy per capita is used than North America where
life expectancy is similar.
The second point is that we should transition to other forms of energy because fossil fuels
will eventually deplete. If we wait too long then energy will be constrained and this could
lead to great suffering.
The basic problem is that many think the party can go on forever, hopefully soon higher
fossil fuel prices will become a reality.
Total World URR for crude plus condensate will likely be between 2700 Gb and 3700 Gb (not
including NGL output of about 300 to 500 Gb). My best guess is about 3000 Gb of C+C (including
extra heavy oil from oil sands in Canada and Venezuela) and about 3400 Gboe when NGL is included.
Reasonable estimates of US LTO output are in the 15 to 25 Gb range and significant production
of LTO outside North America is unlikely. Basically LTO is a drop in the bucket and a World
wide peak in C+C output will be apparent within 5 years (I would guess 2015 to 2020 with early
2018 my best guess).
Maybe when peak oil is more widely recognized, people will realize that coal and natural
gas will peak as well (I think total fossil fuels will peak by 2025, possibly as late as 2030,
depending on what happens to the World economy when peak oil is apparent.)
Bottom line, by not changing our economy to run on less fossil fuel we may be trading high
life expectancy now with lower future life expectancy due to energy constraints, unless we
act.
It's not just me that thinks Peak Oil is pretty straightforward to fix. Heck, how hard is
it to buy a hybrid or plug-in? That takes you 50% of the way, right there (yes, I know, some
people depend on used vehicles, but look at China: they sell about 25M electric bikes per year,
more than ICE vehicles. And, there's always carpooling – the average US light vehicle has 1.15
passengers, and gets 22MPG – I think the possibilities for improvement are pretty obvious…).
And, Germany is pretty well know for it's hard headed engineers. They think CO2 emissions
can be reduced dramatically, which is a lot harder than fixing PO (but tehir plan just happens
to accomplish that along the way).
"The extreme boomers believe at as soon as BAU ends, homo sapiens face extinction. " ~ Boomer
II
Don't you mean, doomers? 'u^
But we are already in doom-mode anyway, half-dead, so it's a moot point in a way. The doom/zombification
is taxes. governpimps and their thugs– crony-capitalist plutarchies, I guess.
On top of permaculture there's also the re-wilding set, as well as ecovillages and intentional
communities. Just people getting it that we need to get out from under this dystopic system's
crushing heel.
Price optimization is about keeping ahead of the collapse in prices for goods across the board
due to globalization and the drumbeat of innovation in production and distribution. It is an
attempt to de-commoditize products. That reduces price pressure caused by competition. Another
way to look at it to say "marketing" should be called "market destruction", because market
competition reduces profit. There is nothing new about this, but it is getting more and more
urgent.
Backing EVs is unrelated. It is just the government pushing innovation, like the government
land handout to the railroads after the American Civil War so they could build a transcontinental
railroad. You can argue that EVs are a bad bet, but they are hardly the end of civilization.
Also I wonder what you mean by simple. EVs are simpler than ICEs. The engine has one moving
part. We are shifting to solid state technology in many areas. Of course at the molecular level
solid state devices are pretty complex, but nothing manmade come close to the complexity of
a potato (yet). so I think mechanical complexity is all that counts.
I remember talking to Germans the early 80s. It was popular to say we shouldn't use them
because all would be lost if the electricity goes out. Is that what you're getting at? No doubt
the cuneiform scribes bemoaned the introduction of paper as the end of permanent record keeping
and beginning of dependence on paper makers. They were right I guess. But civilization didn't
end.
Also you may be able to browbeat your niece during Thanksgiving Dinner by using funny names
for things Republicans don't like, but I wouldn't try to be that uncle on line. It just
makes you look like a Rush Limbaugh fan.
"Also you may be able to browbeat your niece during Thanksgiving Dinner by using funny
names for things Republicans don't like, but I wouldn't try to be that uncle on line. It
just makes you look like a Rush Limbaugh fan." ~ Ilambiquated
That was the point. ^u^
I even hyperlinked to 'Leaf Blower' and 'Priapus' on Wikipedia to make it even more ridiculous
as part of the 'happy motoring' scenario, with of course some flourish with the association
of Kardashian and the 'race to the bottom'. (I just used that one– invented hereon and somewhat
to your credit– with some folks in person to some chuckles.)
While I'm relatively unfamiliar with Rush Limbaugh, from what is understood, a 'Rush Limbaugh
culture' sounds about right, what do you think? I mean, what inspired my comment that day was
also a crossing of the road during Rush hour and a notice of the overwhelming majority
of vehicles that had only one person inside… Think of all that energy for all that metal and
plastic, etc., being dragged along for just that one person… Meanwhile or nevertheless, some
people still want EV's… presumably for the majority of those one-person V's?
But to get back to our hypothetical niece, let's say I'm yours: How would you explain your
job or at least that price
optimization bit to me? And/Or does it shaft shoppers?
In a previous article "
The Real Natural Gas Production Decline ", I discussed a simple and effective way of estimating
the real declines and realistic EURs (Estimated Ultimate Recovery) of shale wells based on two things
that shale gas and oil producers can not lie about: number of wells added during a period of time,
and the total daily productions.
The Simple and Effective Method of Estimating EUR
The idea is simple. All shale wells are in steep decline. Thus as the producers put new wells
into production, a considerable portion of the new production merely compensates the decline of existing
wells. If we assume producers add just enough wells to exactly compensate for the decline, then the
EUR times number of wells added equals the amount of production during the same period.
Let me explain in formulas. Let the combined daily decline of existing wells be D, and IP being
the Initial Production rate per well:
Total_Production * D = IP * Well_Additions
EUR = Total_Production/Well_Additions = IP/D
In surveying several different shale plays, I found that all of them have a combined decline rate
of 0.2% per day. Combined decline rate means the decline of the total production from existing wells.
For example if the total production is 500 MMCF one day and 499 MMCF the next day, the 499-500)/500
= -0.2%/day.
Thus, a rough estimate of EUR equals to IP/D = IP/0.2% = 500 IP, or roughly 500 days worth of
production at the IP rate.
Estimating the Bakken Shale Well Productions
The North Dakota Mineral Resource Commission has a
web site
that publishes the shale well counts and monthly productions of Bakken.
I decide to crunch some numbers to see the real productivity of the Bakken oil wells, using the
idea discussed above. Let's start from the oil productions of the latest two months:
Aug-2012: 635,177 Barrels/Day
Sep-2012: 662,428 Barrels/Day
Wells added: 170
Let's do the calculation using the above numbers. The production rate increased by 27251 Barrel/Day
in 30 days. So the daily increase was 908.4 Barrel/Day. Daily well addition is 170/30 = 5.67 wells/day.
Let's assume the combined decline rate of D=-0.2% also applied in Bakken. The median production rate
during the 30 days from mid Aug. to mid Sep. was 648,660 Barrels/Day. So the natural decline would
have been 0.2% * 648,660 BPD = 1297.320 BPD. So 5.67 new wells per day not only compensates for loss
of 1297.320 BPD, but also boost the production by 908.4 BPD. Thus:
So that's the IP per well that I estimates, 389 Barrels/Day. The EUR then would be EUR = IP/D
= IP/0.2% = 500*IP = 0.1945M barrels.
Consider that there are so far 4629 wells in d the accumulative oil production is 458.860M barrels,
averaging 0.099M per well. My EUR estimate is roughly twice the accumulative oil production per well.
So I think my estimate is pretty good.
A good thing of my method is it is pretty fair. Let's say I over-estimated the D. Let's say the
combined decline rate is less than I thought, repeating the same calculation, it results in a less
IP as well. Since EUR = IP/D, a less value divided by a less value, gives you a result that is about
the same.
Let's try a D = -0.15% instead of -0.2% and see what I get:
Thus, knowing the previous month's production rate, we can calculate what the next month's production
rate should be, by subtracting the decline, then add number of new wells times IP.
Let me assume D = -0.2%/Day. I assume IP = 365 Barrels/Day. I further assume that in 2005, 2006,
2007, 2008, 2009, the IP was only 30%, 50%, 70%, 80%, 90% of the current IP level, as the technology
was less sophisticated than today, and well productivity was less than what we get today. Let's see
how my calculation looks like compare with actual production:
click to enlarge)
It looks like a perfect match. Thus my assumed values, D=-0.2% and IP = 365 Barrels/Day, a good
numbers that give perfect fit. Had I used an IP higher or lower, my projection would not match the
data.
So based on that, the average Bakken shale well EUR is
My EUR estimate is far below what producers have been pitching.
Case Study on Continental Resources Shale Wells
Let's have a look at Continental Resources (NYSE:
CLR ), who is considered the most
successful developer of the Bakken shale oil resources.
I pulled out CLR's most recent
quarterly report . Here are a few relevant numbers:
Oil and gas revenue received in the quarter was $617.93M
Oil and gas production was 0.103M BOE/day in the quarter.
Oil and gas production was 0.095M BOE/day in last quarter.
In 3 quarters, CLR participated completion of 541 wells, net 222 that belongs to CLR. So that's
74 per quarter.
Capital spending for 3 quarters totaled $2584.434M
First the capital spending of %2584.434M divided by 222 net wells completed is $11.64M
per well. This is the per well capital cost, not including the production cost yet.
What is the per well IP, and the combined decline rate D? Note that production rate increased
from 0.095M to 0.103M barrels in 92 days. That's a daily increase of 86.96 Barrels/Day. If D=0.2%,
the daily decline would be roughly 0.2%*0.1M/Day = 200 Barrels/Day. So the daily production increase
due to new wells is 200+86.96 = 287 BPD. Daily well addition is 74 wells / 92 days = 0.804 wells/Day.
Thus:
IP = 287 BPD / 0.804 = 357 Barrels/Day
EUR = IP / D = 357 BPD / 0.2% = 0.1785M Barrels
These numbers look lower than the average of the whole Bakken, or IP = 365 BPD and EUR = 0.1825M
Barrels.
What is CLR's profitability outlook under these numbers? From CLR's Q3 revenue and production
volume, I calculated that the unit price they fetched on the oil and gas was about $65/BOE
.
So a CLR well's expected EUR=0.1785M BOE would fetch a revenue of $65*0.1785M = $11.60M per well.
But as discussed above, the per well capital spending was $11.65M. So CLR barely breaks even for
the well capital spending. But the capital spending is not the only cost. We have not calculated
the production and maintenance costs, the G&A costs. Thus, at the current oil price, CLR is not making
any real profit in developing Bakken shale wells.
Discussions and Investment Implications?
So then, how could CLR manage to report positive profits for the quarters? Let me explain how
it works out for them.
Just like other shale oil and gas producers, CLR does not record well drilling capital spending
as cost directly. Instead, they first record it as investment activity. The the capital cost is recognized
in each quarter as depletion and armortization costs.
I discovered that as producers tend to over-estimate the EURs and over-estimate the life span
of shale wells, they end up armortizing the cost way below the fair amount of armortization they
should calculated. Thus, as they under-estimate the costs, they end up over-estimate the profitability
of the operations.
But one thing they could not hide is that in quarters after quarters, the producers have consistently
spend several times higher on capital spending, than the revenue they take in. Producers continue
to borrow more and more on debts in order to continue their well drilling programs.
Is a business profitable, if it continues to borrow more debts quarter after quarter, and it continue
to spend several times more on capital spending, than the revenue it takes in? This is neither profitable,
nor sustainable. I can see that when the banks get suspicious and stop lending money, then the shale
industry will collapse.
As I stated many times. The shale gas and oil adventure is deeply un-profitable. The "cheap natural
gas replacing coal" is a pipe dream. Investors should bet their money on the rebound of the coal
sector, not on the false promise of shale gas or shale oil.
Full disclosure: I have no vested interest in CLR but I may consider a short position in the near
future. I have heavy long positions in coal stocks like James River Coal (JRCC), Alpha Natural Resources
(ANR), Arch Coal (NYSE: ACI ) and
Peabody Energy (NYSE: BTU ).
Gaucho , contributor
,
premium contributor
Comments (879) | + Follow Following - Unfollow | Send Message But not to worry. With the US government support they are now planning on selling all of our
gas overseas. That way we will be out of fuel much sooner than other wise. It will also drive
the prices up here so we can be less competitive. Great planning once again by the US government.
Or should I say by the corporations that control the US government. 10 Dec 2012, 08:48 AM
Reply Like 1
Carl Martin
, contributor ,
premium contributor Comments (1530)
| + Follow Following - Unfollow | Send Message Mark,
Why are you simply making this assumption?
"Let's assume the combined decline rate of D=-0.2% also applied in Bakken."
Because, if your assumption is wrong, then the direction of your whole article/blog is wrong.
I believe that decline rates for shale gas are far steeper then for shale oil.
But, do you happen to have any proof to offer to back up your assumption?
Meanwhile, I will put some effort into finding some proof for my belief. But, I have noticed over
at TOD, that most PO believers also assume that shale oil behaves exactly like shale gas. That's
where I think you are going all wrong, but we'll see... 11 Dec 2012, 03:24 PM
Reply Like 0
Mark Anthony
, contributor ,
premium contributor Comments (3595)
| + Follow Following - Unfollow | Send Message Author's reply
" Carl Martin:
The D=-0.2%/Day combined decline rate is a very reasonable assumption. The proof is right in my
article and in the chart. My projection based on that value matches the actual production. Had
I used a less steep (smaller) decline rate, the calculation will be much higher than the actual
data. Likewise, had I used a higher IP value, the calculation will also come out to be higher
than actual.
You simply have to use IP = 365 BPD, and not any higher, and D = 0.2%/Day, and not any lower,
to project the correct total Bakken production rate as reported.
Now I do have actual proof that Bakken shale wells actuall DO decline that fast. Look at this
on page 63:
http://bit.ly/VAYoHb
The CLR chart shows the cumulative production of Charlotte 2-22H well. They claim the IP was 1396
BPD and at the end of 9.8 months (295 days), it dropped to 167 BPD and accumulative production
was 87 MBOE. Going from 1396 to 167 is a loss of 88%, and in only 295 days. That is an average
decline of -0.72% per day. Much higher than the -0.2%/Day I used. Of course I am talking the combined
decline of all wells, old and new. That's an annualized rate of -51.8% decline/year. I think that
is reasonable. 11 Dec 2012, 04:46 PM
Reply Like 0
Mark Anthony
, contributor ,
premium contributor Comments (3595)
| + Follow Following - Unfollow | Send Message Author's reply
" I forget to embed the link to the ND statistics of historic Bakken shale oil productions, which
is indicated in the graph any way. The link is:
http://1.usa.gov/VCJyQv
The DMR of ND has a good collection of all sorts of data. I will continue to study and analysis
data related to Bakken shale wells. 12 Dec 2012, 04:06 PM
Reply Like 0
My name is Zoltan Ban, I have a double honors degree in history and anthropology, as well as a
BA in economics. I am the author of the book "Sustainable Trade"
Latest StockTalk With Oil Under $60/Barrel, Shale Oil Revolution May Be Over (Permanently)
http://seekingalpha.com/a/1nf8x
Dec 22, 2014 Latest articles & Instablog posts
Here is another, much simpler calculation, which shows that there is a reasonable chance that
the whole Eagle Ford field will ultimately prove to be unprofitable. http://bit.ly/V7dtqs
"... If you dont believe what the industry is saying, then you just admitted that your point of view is based upon BELIEF, not facts. Therefore, PO is a religion. If you want it to be a science, then you have to first disprove what the industry is saying. I have noticed, that no one here is actually doing that. ..."
"... All the recent mega activity at this site just seems to be one big cover up of the fact, that all your great PO theories got shot to shit with the recent fall in oil price due to over production from US shale. The latest figures from the EIA show that 9,137,000 bpd were being produced in the US as of 12/12/14, and that is an increase. Sorry, but that is not how terminal decline plays out in the world of reality. ..."
"... CLR was $30 a few days ago. $80 a few months ago. Maybe theyll go bankrupt. That will really mess up Mrs. Hamms lawyers. ..."
But I'm having an extremely difficult time even believing, that these PO discussions about
Bakken sweet spots supposedly being tapped out are still going on….AFTER ALL THESE YEARS!!!!!
All you had to do was to look at the maps KOG was putting on their website, which show exactly
where each Bakken well is drilled. Then you compare that drilling pattern to CLR's maps, which
show you where all the sweet spots are. Even Rune is now "aware" that the sweet spots are largely
determined by pressure gradients, which is what CLR's maps shows. I found out about all this,
MORE THAN FOUR YEARS AGO !!! by simply writing an email to CLR and asking why they choked back
their wells so much.
CLR also presently claims to have more than eight years of future drilling sites available
in the Bakken (at their present rate of drilling) which they say will yield more than 750,000
boe in EUR's per well. As CLR is a good proxy for the entire Bakken, what does that tell you about
the future of the entire Bakken?
I might mention that "the best" definition of a Bakken sweet spot given at this website by
a true believer, "Watcher", was that sweet spots were defined by latitude and longitude, not EUR's.
How pathetic.
If you don't believe what the industry is saying, then you just admitted that your point of
view is based upon BELIEF, not facts. Therefore, PO is a religion. If you want it to be a science,
then you have to first disprove what the industry is saying. I have noticed, that no one here
is actually doing that.
As for this sentence from the above "article"…… " The first measured 24 hour production from
Bakken wells is a very good predictor of the future production of that well." The truth is exactly
the opposite, for among many other reasons, the choking history is not even taken into account.
All the recent mega activity at this site just seems to be one big cover up of the fact, that
all your great PO theories got shot to shit with the recent fall in oil price due to over production
from US shale. The latest figures from the EIA show that 9,137,000 bpd were being produced in
the US as of 12/12/14, and that is an increase. Sorry, but that is not how terminal decline plays
out in the world of reality.
8 yrs. 750K barrels EUR per well. At current 175ish/month well addition rate that's 16000ish wells
added in 8 years.
Current total 11,000ish. So 27000 wells total then. X 750K =
about 2 Trillion barrels of oil. Don't think even CLR expects more than 50 billion, and they
are bizarre. But hey, at $40 barrel Bakken sweet prices, that's a lot of money. $80 Trillion.
What a bonanza.
CLR was $30 a few days ago. $80 a few months ago. Maybe they'll go bankrupt. That will really
mess up Mrs. Hamm's lawyers.
I'm not going to even bother to check your math. Your numbers are way too far out for me. But,
more than four years ago, CLR estimated 24 billion boe recoverable. That was recently upped to
62-96 billion boe "recoverable" (@$100) Call it less, if you like at today's prices. But, the
Bakken is still Ghawar sized, so you can eventually expect Ghawar sized production.
As to the number of eventual wells, try starting at 100,000, and go up from there. In the 4,000
square mile CLR designated sweet spot, their plan is for 16 wells per square mile (in four different
zones) which means 160 acre spacing. That's 64,000 wells right there.
How about Y-O-U defining what constitutes a PO Bakken sweet spot in EUR's, instead. Then, we
can start communicating. (maybe).
Carl Martin: Is an average EUR of 750,000 net bbl of oil per well accurate in the Bakken? It doesn't
appear that it is when one looks through the public information put out by the State of North
Dakota. Further, it doesn't appear generally that Continental has the wells capable of hitting
this figure. EOG and Whiting are the primary companies to have the wells capable of 750,000 net
bbl EUR, based upon public data.
I have read on this site that 320,000 gross bbl EUR is more probable overall in the Bakken,
although I am sure if people have agendas they can skew the numbers. I think at least a few of
the people who post here appear to have strong enough math/science/engineering backgrounds to
make some pretty reasonable calculations and are making an unbiased attempt to be as accurate
as possible.
Trying to figure out what is accurate and what is not is more difficult than what you let on,
IMO. It does appear that substantially lower oil prices may provide some answers.
There is that. 2.7 Billion at $10 million/well, from the CLR Nov investor briefing, is 270 wells.
For the whole year.
Avg flow year 1 is about 450 bpd? So incremental revs in 2015 would be 270 X 450 X $30 (net
of Bakken Sweet minus royalties, taxes) = $3.65 million, for the whole field for the whole year
from new wells.
Maybe Warren Buffett will do what he did for BoA. They created a special preferred issue for
him to buy $5 B of. Paid 8% dividend or something. Hell, he may get more of Harold's money than
the ex.
"Avg flow year 1 is about 450 bpd? So incremental revs in 2015 would be 270 X 450 X $30 (net of
Bakken Sweet minus royalties, taxes) = $3.65 million, for the whole field for the whole year from
new wells."
err I think you forgot that a year has 365 days? That comes out to more than 1.3 billion dollars
even at these depressed prices!
The average well flow for the first year is about 233 b/d, not 450 b/d (second month output is
usually highest at about 400 b/d), the average well produces roughly 85 kb in year 1.
Using Watcher's figure of 270 wells and call refinery gate oil prices $60/b, transport costs
$12/b, OPEX plus other costs $8/b leaving $40/b, then we need to pay taxes and royalties of roughly
25% on wellhead revenue of $48/b, so we need to subtract another $12/b and we get to $36/b net.
If 270 average wells are drilled we get about 23 million barrels of oil in year 1 for a net of
$826 million. The wells cost about $9 million each for a total of $2.4 billion. Looking at a single
well, we need 250 kb for simple payback (ignoring the time value of money), but the average Bakken
well takes at least 8 years to reach 250 kb of output, typically a "good well" pays out in 18
months or less. At two years the average Bakken/Three Forks well in North Dakota produces about
130 kb which is about $4.3 million in net revenue and far short of a $9 million payout level.
No, the 750,000 boe is just a reference to CLR's claim, that they have eight years of drilling
activities, that can produce that much per well. TRANSLATION: The current low oil price environment
is easily weathered by simply high grading. Any company with similar property can do the same.
But, many of the newer, smaller Bakken dotcoms have no such property, so their very existence
is in great danger.
It is nowhere near the average Bakken EUR.
By the way, unlike so many others here, I don't guess anything, and have very few opinions
of my own. I mostly just repeat what is generally accepted knowledge about the shale industry,
because no one has so far been able to prove any of it to be wrong.
It's just that none of my researched information supports any PO theory at all. That's the
rub.
So at what cost does oil have to be produced in the future? Where are we find this oil? And are
you so negative about renewables you think they won't be competitive with oil at $500 per barrel
in today's dollars?
Enno Peters collects data on all North Dakota wells from the NDIC, the EUR of the average Bakken
well between 2011 and 2014 is about 325 kb of oil, if you add in natural gas and convert to barrels
of oil equivalent(boe), it increases to 406 kboe, but note that the extra 80 kboe is very low
value relative to crude.
Note that the typical well in an investor presentation is not the same as an average well.
Maybe CLR only drills above average wells.
I don't dispute your average EUR numbers, as I don't have the neccesary info to do so. Besides
that, they sound about right to me. But you need to be careful about getting too hung up in the
word or concept of average. After all, what do you think is the average gender in the US in Dec.
2014?
Investor presentations ALWAYS show their best results, and almost never reveal all the failures,
that bring their averages down. This is just business as usual. But, it is okay because they are
always moving up the learning curve, so by showing their best results now, they are giving a clear
indication of where they expect their average results to one day be.
Also, if you want to understand this industry, it does no good to focus on average companies,
you need to look at the leaders, because they are the trend setters. Ultimately everything is
based upon best practices, and EOG is presently the undisputed best at everything. They just don't
keep investors very well informed. Therefore, I still get most of my info from CLR.
This sentence of yours is not as silly as you might think. "Maybe CLR only drills above average
wells." In a sense, "they do." That is to say, that they have no monster wells, that I know of,
they choke a lot more than others, and they have used their standard 10,000 foot lateral and 30
frack stages well design over most of the Bakken, even when it didn't make economic sense to use
it. It is because they use their standard well as a measuring stick. Now they have a fixed point
for reference to compare different areas of the Bakken.
That's why they know exactly what they are talking about, and why I accept most everything
they say. You obviously don't. But, you have never given a good reason for not doing so, other
than the results they are claiming don't show up in the data bases you are using. Why don't you
just send them an email and try to clear up a major misunderstanding on your part? Then everyone
at this website will be able to move forward.
Continental wells with first month of output between Jan 2009 and Oct 2014 have an average
cumulative output over 70 months of 186 kb, this is slightly below the average Bakken well over
the same period for all wells completed(925 wells).
There is a lot of hype in investor presentations.
The Continental wells will produce considerably less oil that the 480 kb claimed (only 80%
of the 600 boe EUR is oil) in investor presentations. The EUR is more in the 250- 300 kb range
for the average Continental well.
I wonder if they have run flow meters to check how much flow they get from the toe of a 10 thousand
foot lateral. You seem to follow this closely, are those wells slugging?
Dennis, sometimes very long wells in three phase flow can have phase segregation in the horizontal
section. This causes liquid slugs to accumulate, which tend to move up the well in slug flow.
This can be avoided by placing the heel higher than the toe. But I've never worked with a 10 thousand
foot well. And I was wondering if they had sensors to confirm the toe is producing.
I came to the same conclusion as you Dennis. The Continental wells are actually bellow average.
I have attached a graph showing the production profile for Continental wells from January 2010
to October 2014. I also included the average Bakken well profile for 2010 for reference. The first
3 year cumulative oil + gas production for an average Continental well is about 170.000 boe. No
one knows what the EUR will be, but EIA suggests that 50% of the oil has been produced during
that time ( http://www.eia.gov/forecasts/aeo/tight_oil.cfm
) which gives an EUR of about 340.000 boe.
Carl, you are saying yourself that they only show the best results and don´t tell about their
failures. So why should we then believe in anything they tell us? I have learned that you should
never ever trust in what companies tell in their presentations. Especially not smaller companies
which are dependent on cheap credits. It is actually quite disturbing that companies can make
such exaggerations and get away with it.
I however agree with you Carl that there are still drillable locations left in sweetspots.
But perhaps some companies start to run out of them. That would affect total Bakken output, which
I am mostly interested in.
I posted a chart for average Bakken cumulative output per well by company for four large companies
over the Jan 2009 to Oct 2014 period( about 1/3 of all ND bakken/Three Forks wells drilled(3462
wells).
The "avg" well is for all Bakken/Three Forks wells in North Dakota over the same period with a
cumulative of 197 kb per well over the first 58 months of output.
Chart came out a little small the first time so I will try it again.
I put together data for more companies, about 75% of total wells, too many for a clear well profile
so I am using a bar chart with 54 month (4.5 year) cumulative output for the average well for
each company over the Jan 2009 to Oct 2014 period. The average Bakken well is shown for comparison.
Companies with more than 200 wells over the chosen period are presented below.
Surprised by QEP, they don't get the hype the others do. Always assumed EOG had the most productive
wells in the Balkan due to Parshall. Must have wells in other areas which bring the average way
down.
I wish TX reported by well as opposed to by lease. Would be really interesting to see the same
info for EFS and Permian horizontal wells.
Really seems irresponsible for these companies to claim EUR oil at 600,000+. I guess they assume
the wells will produce 40-60 bbl per day for 25 years. Will be interesting to see if they do.
It looks like the quote from the other day, "Continental must drill all above average wells",
may need some adjustment. To "Continental must drill all below average wells"?
I show the North Dakota Bakken/Three Forks cumulative average well profiles by company for
the Jan 2009 to Oct 2014 period, total wells for this set of companies is 6472 wells of about
8054 wells completed (drilled and fracked) for all companies operating in the North Dakota Bakken/Three
Forks (80%). This is where I got the data for the bar chart. QEP energy is the high well profile
and OXY is the low well profile, the middle dashed line is the average well profile for all companies
(including those not presented in the chart).
Reuters' summary of U.S. shale companies production guidance for 2016.
Note that this is oil & gas production in boe.
I guess that the decline in oil production will be steeper.
Factbox: U.S. shale firms see 5.6 percent decline in 2016 oil, gas output
For the first time in two years, U.S. oil companies are beginning to forecast stagnating, or
even lower, production. Still, their forecasts are less severe than most estimates.
According to a Reuters analysis, based on forecasts from 18 shale oil-oriented firms released
over the past several weeks, oil and gas output is expected to fall 300,000 barrels or equivalent
per day (boepd) this year, which equates to a 5.6 percent decline from 2015.
The U.S. Energy Information Administration expects overall U.S. crude oil production to decrease
by 700,000 barrels per day, or 7.5 percent from 2015 levels.
Not accounting for production from Alaska and the Gulf of Mexico, EIA expects overall production
to fall nearly 11 percent.
Reuters calculations show that production is expected to decline by about 6 percent if
eight of the 18 companies that have operations outside the shale patch are excluded.
Only two of the 18 firms analyzed by Reuters expect to produce more in 2016. This is in sharp
contrast to last year, when increased efficiencies and lower service costs helped companies ramp
up output even at lower levels of spending.
Production at the same companies rose nearly 10 percent on average in 2015, after factoring
in a fall in output at 7 companies.
Below is a compilation of the 18 companies' production forecasts for the year.
All figures are Reuters estimates or calculations based on company data. Midpoints were used
in cases where company disclosed a forecast range. Most companies forecast percentage change for
2016; Reuters calculated 2016 output estimates based on reported 2015 data.
Apache Corp (APA.N) would "rather leave those barrels in the ground" and wait for prices to
rebound than finish the fracking process, Chief Executive John Christmann said last week. Apache
expects production, nearly two-thirds of which is onshore in North America, to fall by 7 to 11
percent.
Yet the overall declines may still appear unusually shallow given the scale of spending cuts.
Many producers are still managing to coax ever-more oil from each new well, tempering the reversal
in production even with only 400 drilling rigs deployed nationwide, one-quarter of the peak of
2014, according to Baker Hughes data.
EOG Resources Inc (EOG.N) expects to boost output from new wells in the first four months by
50 percent for each foot it drills, chairman and CEO Bill Thomas told analysts on Friday. EOG
expects its oil production to dip by only about 7.6 percent this year.
"The resilience (of U.S. shale) has been extraordinary, a tribute to technical expertise," Neil
Atkinson, head of the International Energy Agency's benchmark Oil Market Report, said last week.
The agency expects U.S. production to rebound to record highs within just a few years. "Anyone
who believes the U.S. revolution has stalled should think again."
Until this year, energy firms have been able to sustain output thanks to increased efficiencies
and more targeted drilling. In December, shale powerhouse North Dakota pumped some 1.15 million
barrels per day, barely 2 percent below its April 2015 peak.
Now, the "precipitous" fall in rig count is beginning to outpace efficiency gains, said Brian
Kessens, Portfolio Manager at Tortoise Capital Advisors. The anticipated declines show that there
is a limit to how much companies can squeeze out of their oilfields without drilling and completing
new wells.
Whiting Petroleum (WLL.N), the biggest producer in North Dakota, last week forecast its output
would drop by over 18 percent, the most among the surveyed firms, as it set out to cut well completions
and slash its capital budget by 80 percent.
The only driller to anticipate an increase this year, Pioneer Natural Resources (PXD.N), can
do so largely because of its most extensive hedging among shale firms. Concho Resources (CXO.N)
and Halcon Resources Corp (HK.N), which have also hedged substantial parts of their production,
both see output slipping by less than 5 percent.
All in all, output data so far and forecasts suggest this year's declines will be relatively
modest, raising questions whether the retreat will be deep and long enough to support a sustained
recovery in oil prices.
"Non-OPEC supply needs to fall more broadly before the market gets rebalanced and prices recover
in a durable way," Raymond James analyst Pavel Molchanov said.
While individual company forecasts offer the clearest view of supply from those closest to
the oil wells, in sum they are a less than perfect gauge.
The companies in the survey represent only a portion of U.S. crude production, which reached
a near record of 10 million bpd last year, and most offer no separate forecasts for crude oil,
natural gas or other related liquids. Privately-held companies, which do not report forecasts,
may get hit harder.
Projections from the half-dozen larger firms in the group are bolstered by other large overseas
or offshore non-shale projects, which often produce crude for years without the need for new wells.
Marathon Oil Corp (MRO.N), for instance, sees a 6-8 percent decline in overall output, but
warned its big shale plays in the Bakken, Eagle Ford and SCOOP areas would drop by the "low teens".
Occidental expects a 2-4 percent rise this year as overseas projects offset a "slight" decline
from domestic wells.
Yet its oil-rich Permian Basin shale properties, source of one-sixth of its output, are still
expected to pump more this year – even as it cuts back to only two to four rigs.
The 65 kb/d difference between the most recent estimate for December 2015 published on Feb
29 and previous estimate issued on Feb 12 is a fact
How can a fact make no sense?
My statement is that the EIA has been constantly underestimating US oil production volumes
and therefore had to revise upwards its previous forecasts.
Thus, the estimate for September 2015 has been revised by 480 kb/d between September STEO and
today's Monthly Production Report (MPR).
Compared to 480 kb/d, 65 kb/d is not much, but there might be further revisions.
EIA's US monthly oil production estimates for 2015: from STEO Sep.15 to MPR Feb.16
My statement is that the EIA has been constantly underestimating US oil production
IMHO you are missing possible correlation of "misunderestimation" of US oil production with
"cheerleading" of oil price slump. Please note that this is not about some "wild" conspiracy theory
:-)
As unforgettable Bush II said "I've been misunderestimated most of my life." North Charleston,
South Carolina; February 15, 2016
and
"There's an old saying in Tennessee-I know it's in Texas, probably in Tennessee-that says,
'Fool me once, shame on…shame on you. Fool me - you can't get fooled again.'"[12] - Nashville,
Tennessee; September 17, 2002
The same is true about EIA estimates of the USA oil production :-)
Dec 10, 2012 5:39 AM | about stocks:
CLR
,
CHK
,
UNG
,
EOG
,
COGQZQ
,
ACI
,
BTU
In a previous article "
The
Real Natural Gas Production Decline
", I discussed a simple and effective
way of estimating the real declines and realistic EURs (Estimated Ultimate
Recovery) of shale wells based on two things that shale gas and oil
producers can not lie about: number of wells added during a period of time,
and the total daily productions.
The Simple and Effective Method
of Estimating EUR
The idea is simple. All shale wells are in steep decline. Thus as the
producers put new wells into production, a considerable portion of the new
production merely compensates the decline of existing wells. If we assume
producers add just enough wells to exactly compensate for the decline, then
the EUR times number of wells added equals the amount of production during
the same period.
Let me explain in formulas. Let the combined daily decline of existing
wells be D, and IP being the Initial Production rate per well:
Total_Production * D = IP * Well_Additions
EUR = Total_Production/Well_Additions = IP/D
In surveying several different shale plays, I found that all of them have
a combined decline rate of 0.2% per day. Combined decline rate means the
decline of the total production from existing wells. For example if the
total production is 500 MMCF one day and 499 MMCF the next day, the
499-500)/500 = -0.2%/day.
Thus, a rough estimate of EUR equals to IP/D = IP/0.2% = 500 IP, or
roughly 500 days worth of production at the IP rate.
Estimating the Bakken Shale Well Productions
The North Dakota Mineral Resource Commission has a
web site
that publishes the shale well counts and monthly productions of
Bakken.
I decide to crunch some numbers to see the real productivity of the
Bakken oil wells, using the idea discussed above. Let's start from the oil
productions of the latest two months:
Aug-2012: 635,177 Barrels/Day
Sep-2012: 662,428 Barrels/Day
Wells added: 170
Let's do the calculation using the above numbers. The production rate
increased by 27251 Barrel/Day in 30 days. So the daily increase was 908.4
Barrel/Day. Daily well addition is 170/30 = 5.67 wells/day. Let's assume the
combined decline rate of D=-0.2% also applied in Bakken. The median
production rate during the 30 days from mid Aug. to mid Sep. was 648,660
Barrels/Day. So the natural decline would have been 0.2% * 648,660 BPD =
1297.320 BPD. So 5.67 new wells per day not only compensates for loss of
1297.320 BPD, but also boost the production by 908.4 BPD. Thus:
So that's the IP per well that I estimates, 389 Barrels/Day. The EUR then
would be EUR = IP/D = IP/0.2% = 500*IP = 0.1945M barrels.
Consider that there are so far 4629 wells in d the accumulative oil
production is 458.860M barrels, averaging 0.099M per well. My EUR estimate
is roughly twice the accumulative oil production per well. So I think my
estimate is pretty good.
A good thing of my method is it is pretty fair. Let's say I
over-estimated the D. Let's say the combined decline rate is less than I
thought, repeating the same calculation, it results in a less IP as well.
Since EUR = IP/D, a less value divided by a less value, gives you a result
that is about the same.
Let's try a D = -0.15% instead of -0.2% and see what I get:
Thus, knowing the previous month's production rate, we can calculate what
the next month's production rate should be, by subtracting the decline, then
add number of new wells times IP.
Let me assume D = -0.2%/Day. I assume IP = 365 Barrels/Day. I further
assume that in 2005, 2006, 2007, 2008, 2009, the IP was only 30%, 50%, 70%,
80%, 90% of the current IP level, as the technology was less sophisticated
than today, and well productivity was less than what we get today. Let's see
how my calculation looks like compare with actual production:
click to enlarge)
It looks like a perfect match. Thus my assumed values, D=-0.2% and IP =
365 Barrels/Day, a good numbers that give perfect fit. Had I used an IP
higher or lower, my projection would not match the data.
So based on that, the average Bakken shale well EUR is
My EUR estimate is far below what producers have been pitching.
Case Study on Continental Resources Shale Wells
Let's have a look at Continental Resources (NYSE:
CLR
),
who is considered the most successful developer of the Bakken shale oil
resources.
I pulled out CLR's most recent
quarterly report
. Here are a few relevant numbers:
Oil and gas revenue received in the quarter was $617.93M
Oil and gas production was 0.103M BOE/day in the quarter.
Oil and gas production was 0.095M BOE/day in last quarter.
In 3 quarters, CLR participated completion of 541 wells, net 222 that
belongs to CLR. So that's 74 per quarter.
Capital spending for 3 quarters totaled $2584.434M
First the capital spending of %2584.434M divided by 222 net wells
completed is
$11.64M
per well. This is the per well capital
cost, not including the production cost yet.
What is the per well IP, and the combined decline rate D? Note that
production rate increased from 0.095M to 0.103M barrels in 92 days. That's a
daily increase of 86.96 Barrels/Day. If D=0.2%, the daily decline would be
roughly 0.2%*0.1M/Day = 200 Barrels/Day. So the daily production increase
due to new wells is 200+86.96 = 287 BPD. Daily well addition is 74 wells /
92 days = 0.804 wells/Day. Thus:
IP = 287 BPD / 0.804 =
357 Barrels/Day
EUR = IP / D = 357 BPD / 0.2% =
0.1785M Barrels
These numbers look lower than the average of the whole Bakken, or IP =
365 BPD and EUR = 0.1825M Barrels.
What is CLR's profitability outlook under these numbers? From CLR's Q3
revenue and production volume, I calculated that the unit price they fetched
on the oil and gas was about
$65/BOE
.
So a CLR well's expected EUR=0.1785M BOE would fetch a revenue of
$65*0.1785M = $11.60M per well. But as discussed above, the per well capital
spending was $11.65M. So CLR barely breaks even for the well capital
spending. But the capital spending is not the only cost. We have not
calculated the production and maintenance costs, the G&A costs. Thus, at the
current oil price, CLR is not making any real profit in developing Bakken
shale wells.
Discussions and Investment Implications?
So then, how could CLR manage to report positive profits for the
quarters? Let me explain how it works out for them.
Just like other shale oil and gas producers, CLR does not record well
drilling capital spending as cost directly. Instead, they first record it as
investment activity. The the capital cost is recognized in each quarter as
depletion and armortization costs.
I discovered that as producers tend to over-estimate the EURs and
over-estimate the life span of shale wells, they end up armortizing the cost
way below the fair amount of armortization they should calculated. Thus, as
they under-estimate the costs, they end up over-estimate the profitability
of the operations.
But one thing they could not hide is that in quarters after quarters, the
producers have consistently spend several times higher on capital spending,
than the revenue they take in. Producers continue to borrow more and more on
debts in order to continue their well drilling programs.
Is a business profitable, if it continues to borrow more debts quarter
after quarter, and it continue to spend several times more on capital
spending, than the revenue it takes in? This is neither profitable, nor
sustainable. I can see that when the banks get suspicious and stop lending
money, then the shale industry will collapse.
As I stated many times. The shale gas and oil adventure is deeply
un-profitable. The "cheap natural gas replacing coal" is a pipe dream.
Investors should bet their money on the rebound of the coal sector, not on
the false promise of shale gas or shale oil.
Full disclosure: I have no vested interest in CLR but I may consider a
short position in the near future. I have heavy long positions in coal
stocks like James River Coal (JRCC), Alpha Natural Resources (ANR), Arch
Coal (NYSE:
ACI
)
and Peabody Energy (NYSE:
BTU
).
Instablogs
are blogs which are instantly set up and networked within the Seeking Alpha
community. Instablog posts are not selected, edited or screened by Seeking
Alpha editors, in contrast to contributors' articles.
var ratings_hash={};
comment_ids = [12437651];
ratings_hash = { 12437651: [1] };
Gaucho
, contributor
,
premium contributor
Comments (879)
|
+ Follow
Following
- Unfollow
|
Send Message
But not to worry. With the
US government support they are now planning on selling all of our gas
overseas. That way we will be out of fuel much sooner than other wise.
It will also drive the prices up here so we can be less competitive.
Great planning once again by the US government. Or should I say by the
corporations that control the US government.
10 Dec 2012,
08:48 AM
Reply
Like
1
"Let's assume the combined decline rate of D=-0.2% also applied in
Bakken."
Because, if your assumption is wrong, then the direction of your whole
article/blog is wrong.
I believe that decline rates for shale gas are far steeper then for
shale oil.
But, do you happen to have any proof to offer to back up your
assumption?
Meanwhile, I will put some effort into finding some proof for my
belief. But, I have noticed over at TOD, that most PO believers also
assume that shale oil behaves exactly like shale gas. That's where I
think you are going all wrong, but we'll see...
11 Dec 2012,
03:24 PM
Reply
Like
0
The D=-0.2%/Day combined decline rate is a very reasonable assumption.
The proof is right in my article and in the chart. My projection based
on that value matches the actual production. Had I used a less steep
(smaller) decline rate, the calculation will be much higher than the
actual data. Likewise, had I used a higher IP value, the calculation
will also come out to be higher than actual.
You simply have to use IP = 365 BPD, and not any higher, and D =
0.2%/Day, and not any lower, to project the correct total Bakken
production rate as reported.
Now I do have actual proof that Bakken shale wells actuall DO decline
that fast. Look at this on page 63:
The CLR chart shows the cumulative production of Charlotte 2-22H well.
They claim the IP was 1396 BPD and at the end of 9.8 months (295
days), it dropped to 167 BPD and accumulative production was 87 MBOE.
Going from 1396 to 167 is a loss of 88%, and in only 295 days. That is
an average decline of -0.72% per day. Much higher than the -0.2%/Day I
used. Of course I am talking the combined decline of all wells, old
and new. That's an annualized rate of -51.8% decline/year. I think
that is reasonable.
11 Dec 2012,
04:46 PM
Reply
Like
0
Mark Anthony
, contributor
,
premium contributor
Comments (3595)
|
+ Follow
Following
- Unfollow
|
Send Message
Author's reply "
I forget to embed the link
to the ND statistics of historic Bakken shale oil productions, which
is indicated in the graph any way. The link is:
The DMR of ND has a good collection of all sorts of data. I will
continue to study and analysis data related to Bakken shale wells.
12 Dec 2012,
04:06 PM
Reply
Like
0
My name is Zoltan Ban, I have a double honors degree in
history and anthropology, as well as a BA in economics.
I am the author of the book "Sustainable Trade"
Latest StockTalk
With Oil Under $60/Barrel, Shale Oil Revolution
May Be Over (Permanently)
http://seekingalpha.com/a/1nf8x
Dec 22, 2014
Latest articles & Instablog posts
Here is another, much
simpler calculation, which shows that there is a reasonable chance
that the whole Eagle Ford field will ultimately prove to be
unprofitable.
http://bit.ly/V7dtqs
The global economy seems to be tottering on the edge even with cheap
oil. If the price had stayed at $110 and these losses had been covered
by OECD consumers where would we be (or well will we be if the price
does recover eventually) – I guess even more debt until the bubble really
does pop.
"... Whether this will be enough to affect the world market is an open question, but four or five hundred thousand barrels a day taken off the market would be significant imo. ..."
There is a good chance some they will have to curtail production later
this year due to lack of credit to buy the necessary diluents, spare parts,
etc. Whether this will be enough to affect the world market is an open
question, but four or five hundred thousand barrels a day taken off the
market would be significant imo.
Filling up of oil storage early in the cycle is an indicator of oversupply.
But in the current late cycle of low oil prices [1.5 yrs already] it is a useless indicator of
future oil price movement, oil demand or supply. It just indicates the level of contango that
exists in oil futures market. See
Gaurav
comment on Mar 06, 2016
Notable quotes:
"... One interesting take from Art Berman presentation is that he ignores "Great condensate Con" (and grossly overplays Cushing "storage glut" MSM meme). He also thinks that without OPEC cut $30 oil price range will last for the whole 2016 ..."
"... And why are we still importing oil: lack of sufficient domestic AVAILABILITY…not production. The vast majority of oil going into Cushing IS NOT do to a lack of buyers as the import numbers indicate. It's largely do to speculators hoping to take advantage of f increases in future oil prices. The net effect is that these speculation OIL BUYERS are competing with the refiners for domestic production. ..."
"... And now compare the 88 mm bbl capacity to the PADD 3 (essentially Texas and LA. where the bulk of the refineries are) capacity of 260 mm bbls. Between the speculator purchases and the smaller number of refineries combined with the large volume of Canadian imports seeing Cushing filling up is no surprise. ..."
"... So again compare the 88 mm bbl capacity at Cushing to the total storage capacity at US refineries: 179 mm bbls. No: the volume of oil held at refineries is not part of the total TANK FARM capacity. So how much is the Cushing storage capacity compared to tank farms + refinery storage: 13%. ..."
Here is a short excerpt from this article, in which Berman basically argues that the price
of oil is controlled by the level of storage at Cushing. I agree at least to the extent than the
price correlates closely with storage at Cushing.
For oil prices to increase, Cushing inventories must fall. That means that both U.S.
tight oil production, chiefly from the Bakken play, and Canadian light oil production brought
by pipeline to Cushing must decline.
Bakken production was consistent in 2015 at about 1.2 million barrels per day. Canadian
oil imports to the U.S. decreased from April through July 2015 and may have contributed to
the fall in Cushing inventories that lead to a $15 per barrel increase in WTI prices. At the
same time, decreased production from the Eagle Ford and Permian basin tight oil plays would
free up storage in the Gulf Coast that might allow more oil to flow out of Cushing.
One interesting take from Art Berman presentation is that he ignores "Great condensate Con"
(and grossly overplays Cushing "storage glut" MSM meme). He also thinks that without OPEC cut
$30 oil price range will last for the whole 2016:
• Energy markets have been characterized by low oil prices and over-supply since mid-2014.
• Supply deficit before Jan 2014, supply surplus after
• Prices fell from 2011-2013 average of $111 per barrel to average of $52 in 2015.
• Without an OPEC cut, 2016 prices will probably be in the $30 per barrel range.
… … …
U.S. crude oil produc4on has declined about 570,000 bopd since the peak in April 2014,
about 60,000 bopd per month.
• EIA forecast is for a total decline of 1.4 mmbpd by September 2016 ( ~100,000 bopd per month)
before increasing again based on $43 per barrel WTI by year-end 2016 and $58 by year-end 2017.
• Price deck has WTI at $43 per barrel by December 2016 & $58 by December 2017.
• Forecast suggests that the oil market is sufficiently in balance now for prices to increase
but that production will not respond to price signals until later in 2016-very optimistic.
… … …
Little chance that oil prices will increase beyond the head-fakes and sentiment-driven price
cycles of 2015 and early 2016 until U.S. crude oil storage begins to decrease.
• Oil stocks are currently 152 million barrels above the 5-year average and 128 million barrels
above the 5-year maximum.
… … …
• Cushing and Gulf Coast storage make up almost 70% of U.S. working storage.
• These areas are currently at 84% of capacity. Cushing at 89%.
• As long as storage volumes remain above 80% of capacity, oil prices will be crushed.
• Until U.S. oil production declines substantially, storage will remain near capacity.
This article is a little on the long side, for those of us who are into sound bites, but folks
with more patience will find it illuminating, and maybe even find a little something in it to
improve their personal morale, if they are feeling really down about the future.
Here is a short excerpt from this article, in which Berman basically argues that the price
of oil is controlled by the level of storage at Cushing. I agree at least to the extent than
the price correlates closely with storage at Cushing.
… … …
That's what happens when good people get into bad company due to lack of employment opportunities
caused by shale oil price crush :-)
And to add to some of the good points made: Cushing contains only 20% of total US oil storage
capacity. Notice they don't mention the fill level of that total: last time I looked it was
about 65%. That means 35% of the 450+ MILLION BBL CAPACITY is still empty.
And why are we still importing oil: lack of sufficient domestic AVAILABILITY…not production.
The vast majority of oil going into Cushing IS NOT do to a lack of buyers as the import numbers
indicate. It's largely do to speculators hoping to take advantage of f increases in future
oil prices. The net effect is that these speculation OIL BUYERS are competing with the refiners
for domestic production.
Which, again, explains why we still import a huge volume of oil despite the constant and
foolish use of the word "glut". IOW if we are still importing oil how can there be a glut of
domestic oil: the US lacks sufficient oil production to satisfy the demand from the refineries
AND speculators.
rockman on Sat, 27th Feb 2016 9:39 am
A few more FACTS to offset the "OMG Cushing is filling up" hysteria. First, Cushing is in
PADD 2 as they point out. But it isn't the only tank farm in that midwest district: it only
holds 60% of that total capacity.
And now compare the 88 mm bbl capacity to the PADD 3 (essentially Texas and LA. where the
bulk of the refineries are) capacity of 260 mm bbls. Between the speculator purchases and the
smaller number of refineries combined with the large volume of Canadian imports seeing Cushing
filling up is no surprise.
And we're just talking about tank farm storage.
So again compare the 88 mm bbl capacity at Cushing to the total storage capacity at US refineries:
179 mm bbls. No: the volume of oil held at refineries is not part of the total TANK FARM capacity.
So how much is the Cushing storage capacity compared to tank farms + refinery storage: 13%.
Nice mocking of US energy independence propaganda.
Notable quotes:
"... Had Texas maintained production at 400,000,000 barrels per year, the price would have stabilized to a higher low. A 700,000,000 barrel per year drop in production would be steep. ..."
"... 400,000,000 barrels per year at 75 usd per barrel is 30,000,000,000 dollars. ..."
"... 1.161,024,209 times 25 dollars per barrel is 29,025,600,000 dollars. ..."
"... Just too much oil production in Texas by two times. Texas at a 1.3 million barrel per day production level might bring back 75 dollar oil. ..."
Texas goes from 399,315,095 barrels in one year of production in 2009 all
the way to 1,161,024,209 barrels in 2015.
Looks close to a tripling of production from 2009 to 2015. Gotta go for
the gusto.
Must be contributing to the 'glut', in other words, 'we have to refine
this oil into all of the diesel fuel we can and get it shipped to Europe
as fast as we can, that's where the money is'. Gotta follow the money, that's
where the money is. It's a no brainer.
Or some such verbiage.
Or, refinery 'glut'. The gasoline can be sold at a bargain price, those
crazy Europeans buy diesel at any price, they could care less about that
gasoline. har
Europeans pay through the nose for diesel fuel only to subsidize low
gasoline prices for US consumers! double har, so har again.
Had Texas maintained production at 400,000,000 barrels per year,
the price would have stabilized to a higher low. A 700,000,000 barrel per
year drop in production would be steep.
400,000,000 barrels per year at 75 usd per barrel is 30,000,000,000
dollars.
1.161,024,209 times 25 dollars per barrel is 29,025,600,000 dollars.
Just too much oil production in Texas by two times. Texas at a 1.3
million barrel per day production level might bring back 75 dollar oil.
For leading U.S. shale oil producers, $40 is the new $70.
Less than a year ago major shale firms were saying they needed oil above
$60 a barrel to produce more; now some say they will settle for far less
in deciding whether to crank up output after the worst oil price crash in
a generation.
Their latest comments highlight the industry's remarkable resilience, but
also serve as a warning to rivals and traders: a retreat in U.S. oil production
that would help ease global oversupply and let prices recover may prove
shorter than some may have expected.
Continental Resources is prepared to increase capital spending if U.S.
crude reaches the low- to mid-$40s range, allowing it to boost 2017 production
by more than 10 percent, chief financial official John Hart said last week.
Rival Whiting Petroleum, the biggest producer in North Dakota's Bakken
formation, will stop fracking new wells by the end of March, but would "consider
completing some of these wells" if oil reached $40 to $45 a barrel, Chairman
and CEO Jim Volker told analysts. Less than a year ago, when the company
was still in spending mode, Volker said it might deploy more rigs if U.S.
crude hit $70.
While the comments were couched with caution, they serve as a reminder
of how a dramatic decline in costs and rapid efficiency gains have turned
U.S. shale, initially seen by rivals as a marginal, high cost sector, into
a major player – and a thorn in the side of big OPEC producers.
Nimble shale drillers are now helping mitigate the nearly 70-percent slide
crude price rout by cutting back output, but may also limit any rally by
quickly turning up the spigots once prices start recovering from current
levels just above $30.
The threat of a shale rebound is "putting a cap on oil prices," said
John Kilduff, partner at Again Capital LLC. "If there's some bullish outlook
for demand or the economy, they will try to get ahead of the curve and increase
production even sooner."
Some producers have already began hedging future production, with prices
for 2017 oil trading at near $45 a barrel, which could put a floor under
any future production cuts.
While the worst oil downturn since the 1980s sounds the death knell for
scores of debt-laden shale producers, it has also hastened the decline in
costs of hydraulic fracturing and improvements of the still-developing technology.
For example, Hess Corp., which pumps one of every 15 barrels of North Dakota
crude, cut the cost of a new Bakken oil well by 28 percent last year.
What once helped fatten margins is now key to survival in what Saudi
Oil Minister Ali al-Naimi described last week as the "harsh" reality of
a global market in which the Organization of Oil Exporting Countries is
no longer willing to curb its supplies to bolster prices.
While Deloitte auditing and consulting warns that a third of U.S. oil
producers may face bankruptcy, leading shale producers say their ambitions
go beyond just outrunning domestic rivals.
"It's no longer enough to be the low cost producer in U.S. horizontal shale,"
Bill Thomas, chairman of EOG Resources Inc, said on Friday. "EOG's goal
is to be competitive, low-cost oil producer in the global market."
Thomas did not say what price would spur EOG to boost output this year,
but said it had a "premium inventory" of 3,200 well locations that can yield
returns of 30 percent or more with oil at $40.
Apache Corp, forecasts its output will drop by as much as 11 percent
this year, but said it would probably manage to match 2015 North American
production if oil averaged $45 this year.
One reason shale producers can be so fleet-footed is the record backlog
of wells that have already been drilled but wait to get fractured to keep
oil trapped in shale rocks flowing.
There were 945 such wells in North Dakota, birthplace of the U.S. shale
boom in December, compared to 585 in mid-2014, when prices peaked, according
to the latest available data from the Department of Mineral Resources. Their
numbers are growing as firms like Whiting keep drilling, but hold off with
fracking.
Some warn that fracking the uncompleted wells can offer only a short-term
supply boost and a sustained increase would require costly drilling of new
wells and therefore higher prices.
"It's going to take a move up to $55 before we see anyone plan new production,"
says Carl Larry, director of business development for oil and gas at Frost
& Sullivan.
To be sure, it is far from certain whether oil prices will even reach
$40 any time soon. Morgan Stanley and ANZ expect average prices in the low
$30s for the full year.
Some analysts also warn resuming drilling quickly may prove hard after firms
laid off thousands of workers and idled more than three-quarters of their
rigs since late 2014.
In fact, John Hess, chief executive of Hess Corp last week took issue with
labeling U.S. shale oil as a "swing producer." Hess told Reuters in an interview
that U.S. shale firms should be rather considered as "short-cycle" producers,
which might need up to a year to stop or restart production.
And even scarred veterans of past boom-bust oil cycles are not sure what
will happen once prices start to recover – during the last big upswing a
decade ago, shale oil did not even exist.
"We are a little concerned that this time there is one dynamic we've never
had previously," said Darrell Hollek, vice president of U.S. onshore at
Anadarko Petroleum Corp.
--------------
Some analysts also believe that drilling/completion activity in the U.S.
will rebound in the second half of the year, as oil prices reach $40-45.
See, for example, US rig count forecast by Raymond James (chart below).
BTW, their energy analyst expect WTI to reach $50 by the end of 2016.
AlexS. This talk is pure desparate talk, and nothing more.
A group of us have been analyzing the Statements of Future Cash Flows
in the 10K's recently released by some of the large shale players, including
EOG, CLR, WLL, PXD and CHK.
The assumptions made in the reduction of future production costs
are questionable. Here are the revisions from 12/31/14 to 12/31/15 for
these companies:
EOG
2014 $51.533 billion
2015 $32.061 billion
CLR
2014 $25.799 billion
2015 $10.869 billion
WLL
2014 $20.772 billion
2015 $12.344 billion
PXD
2014 $18.223 billion
2015 $11.475 billion
CHK
2014 $17.036 billion
2015 $7.391 billion
The only thing I have been unable to determine is whether any drilling
and completion costs are included by these companies in "future production
costs"
I would note all break out "future development costs" and all have
greatly reduced numbers from 2014 to 2015, which makes sense given large
budget cuts.
In any event, it is worth noting the future estimates of these companies
in the 10K and how radically they have changed from 12/31/14 to 12/31/15.
Further, it is noteworthy that if current oil and gas prices are
plugged into the 12/31/15 future cash inflows, there is little positive
to negative future net cash flows.
In summary, the claims are not backed up by the company SEC filings,
IMO. Also, the large long term debt incurred in prior years cannot be
ignored either, IMO.
Here is a repost of CLR's snake oil sale press release and calculations
for PDP reserve adds for CLR and what that implies about EUR's in the
Bakken. If correct, breakevens for the Bakken is much higher than $55.
Sorry, 850K. From CLR's Q4 press release:
"Given its plans to defer most Bakken completions in 2016, Continental
expects to increase its Bakken DUC inventory to approximately 195 gross
operated DUCs at year-end 2016. The year-end 2016 DUC inventory represents
a high-graded inventory with an average EUR per well of approximately
850,000 Boe. At year-end 2015, the Company's Bakken DUC inventory was
approximately 135 gross operated DUCs."
From an analyst named Frank, who posts on Yahoo. His calcs look right
to me.
"Look at the 10-k reserve and production data – proved developed
only of course.
In the Bakken
They added 180 net wells in 2015
They produced 38 mm BO and 47 mmcf ng or 46 mm boe
Reserves declined 15.5 mm BO and ng reserves increased by 16.2 mmcf
or 2.7 boe
Therefore reserves declined by 13 mm boe
So adds from new wells was 46-13 = 33 boe from 180 wells. That is 185k
boe per well. A little shy of 800k."
EUR is total expected production from a well during its lyfe cycle,
not annual production, especially as these wells were producing less
than a year in 2015.
I know. The EUR sabove are calculated from the change of PDP reserves
adjusted by a year's production, divided by wells completed. That should
give you the amount of reserves added per completed well.
"... In the USA we use crude for various purposes. Based on old data of 2007 we use close to half for passenger travel, and only
2% for on farm use, for example. Probably hasn't changed much. How much of the passenger travel is important to GDP, or is "productive"
vs "frivolous"? ..."
"... An even better question is how much of GDP itself is "productive" or "frivolous"? ..."
"... Households spent $306 billion on gasoline in 2015 which is ~1.7% of ~$18 trillion of GDP. If 2016 gasoline prices average $1.98
per gallon (EIA February STEO report), household spending on gasoline relative to total household spending will be the lowest in the
69 year history of the data set. ..."
"... Gasoline on its own it is pretty much useless unless you want just to start camp fire for marshmallows. If you want to include
the true cost of using gasoline in the household you have to include the cost of vehicles that have never been higher in the history,
you have to include the cost of insurance that is also marching higher every year. And let's not even go into ever increasing cost of
building and maintaining each mile of highway network. So you have to look at built in price inflation in today's monetary system to
realize the true costs. And anyway example that you provide for 2016 that "gasoline relative to total household spending will be the
lowest in the 69 year history" is anomaly. Do you understand why it is anomaly? It is anomaly because at that price nobody in oil industry
makes any profit. So you won't have this anomaly for very long. ..."
In the USA we use crude for various purposes. Based on old data of 2007 we use close to half for passenger travel, and only
2% for on farm use, for example. Probably hasn't changed much. How much of the passenger travel is important to GDP, or is "productive"
vs "frivolous"?
Households spent $306 billion on gasoline in 2015 which is ~1.7% of ~$18 trillion of GDP. If 2016 gasoline prices average
$1.98 per gallon (EIA February STEO report), household spending on gasoline relative to total household spending will be the lowest
in the 69 year history of the data set.
Gasoline on its own it is pretty much useless unless you want just to start camp fire for marshmallows. If you want to include
the true cost of using gasoline in the household you have to include the cost of vehicles that have never been higher in the history,
you have to include the cost of insurance that is also marching higher every year. And let's not even go into ever increasing
cost of building and maintaining each mile of highway network. So you have to look at built in price inflation in today's monetary
system to realize the true costs. And anyway example that you provide for 2016 that "gasoline relative to total household spending
will be the lowest in the 69 year history" is anomaly. Do you understand why it is anomaly? It is anomaly because at that price
nobody in oil industry makes any profit. So you won't have this anomaly for very long.
In 2014, by my calculations, 40% of total S&P 500 capital expenditures went to the energy sector.
The shale boom was the biggest thing going, and banks as well as high yield bond funds poured money
down the wells. With oil around $30 shale loses money, and banks are reporting
multi-billion dollar losses. . The high-yield energy sector as a whole now yields 15 percentage
points more than US Treasuries, which means dollar prices in the 70s and 80s. Depending on what lenders
think they can recover from busted shale borrowers, high-yield market prices imply an expected default
rate of 20%-25%. It gives a whole new meaning to the term "horizontal driller."
Break even cost remain slightly north of 60 dollars per bbl
Notable quotes:
"... We have decided to that we too need to reduce our future production costs by 60%. The electric cooperative said no problem. So did the chemical company, our workers comp carrier, liability insurance carrier. The steel manufacturers did too, so our tubing and rods dropped 60%. The down hole and injection pump service providers were ok with that. Hey Clueless, even our accountant said, "No problem! Since you need to compete with OPEC and Russia, we are knocking 60% off our bill! Now go beat those Saudi's and Russians in this oil price war! Show em who is boss!" ..."
I wonder what ShallowS thinks of EOG's new strategy? That is, to choose their very best of
the best projects, cut costs to the bone and hope that they can make a profit.
Good analogies are hard to come by, but I will throw one out. In 2009, at the depths of
the housing collapse, what if the CEO of Toll Brothers proposed: "We are going to select our
very best lots – the Crown Jewels in our inventory.
Then we are going to build some of our more modest houses on them, cutting costs to the
bone. We hope that we can then sell them for at least break even." Personally, if I owned the
stock, I would have sold immediately.
Clueless. You know what I think. And I do really like your Toll Brothers example.
What I think is more impressive than their current meme on $30 oil is how they cut their
estimate of future production costs from $52 billion at the end of 2014 to $32 billion at the
end of 2015, without a major proved reserve reduction.
But hey, Continental cut theirs from $26 billion to $11 billion. So no big deal.
We have decided to that we too need to reduce our future production costs by 60%. The electric
cooperative said no problem. So did the chemical company, our workers comp carrier, liability
insurance carrier. The steel manufacturers did too, so our tubing and rods dropped 60%. The
down hole and injection pump service providers were ok with that.
Hey Clueless, even our accountant said, "No problem! Since you need to compete with OPEC
and Russia, we are knocking 60% off our bill! Now go beat those Saudi's and Russians in this
oil price war! Show em who is boss!"
Seriously, we have seen some cost reductions, but nothing remotely near 40-60%. And, of
course, although we pay the most to the electric coop of anyone, they just don't seem too keen
on lowering rates for us.
The number of drilling rigs working in the Eagle Ford Shale is a fraction of what it was a year
ago, down 70 percent. There are 47 drilling rigs still working in the South Texas field, which
arcs from the border near Laredo toward the College Station area on the eastern edge of the field.
One interesting take from Art Berman presentation is that he ignore "Great condensate Con" (and
grossly overplays Cushing "storage glut" MSM meme). He also thinks that without OPEC cut $30 oil
price range will last for the whole 2016.
• Energy markets have been characterized by low oil prices and over-supply since
mid-2014.
• Supply deficit before Jan 2014, supply surplus after
• Prices fell from 2011-2013 average of $111 per barrel to average of $52 in 2015.
• Without an OPEC cut, 2016 prices will probably be in the $30 per barrel range.
… … …
U.S. crude oil produc4on has declined about 570,000 bopd since the peak in April 2014,
about 60,000 bopd per month.
• EIA forecast is for a total decline of 1.4 mmbpd by September 2016 ( ~100,000 bopd per
month) before increasing again based on $43 per barrel WTI by year-end 2016 and $58 by
year-end 2017.
• Price deck has WTI at $43 per barrel by December 2016 & $58 by December 2017.
• Forecast suggests that the oil market is sufficiently in balance now for prices to increase
but
that production will not respond to price signals until later in 2016-very optimistic.
… … …
Little chance that oil prices will increase beyond the head-fakes and sentiment-driven price
cycles of
2015 and early 2016 until U.S. crude oil storage begins to decrease.
• Oil stocks are currently 152 million barrels above the 5-year average and 128 million barrels
above the
5-year maximum.
… … …
• Cushing and Gulf Coast storage make up almost 70% of U.S. working storage.
• These areas are currently at 84% of capacity. Cushing at 89%.
• As long as storage volumes remain above 80% of capacity, oil prices will be crushed.
• Until U.S. oil production declines substantially, storage will remain near capacity.
"... Seriously, we have seen some cost reductions, but nothing remotely near 40-60%. And, of course, although we pay the most to the electric coop of anyone, they just dont seem too keen on lowering rates for us. ..."
I wonder what ShallowS thinks of EOG's new strategy? That is, to choose their very best of the
best projects, cut costs to the bone and hope that they can make a profit.
Good analogies are hard to come by, but I will throw one out. In 2009, at the depths of the
housing collapse, what if the CEO of Toll Brothers proposed: "We are going to select our very
best lots – the Crown Jewels in our inventory.
Then we are going to build some of our more modest houses on them, cutting costs to the bone.
We hope that we can then sell them for at least break even." Personally, if I owned the stock,
I would have sold immediately.
Clueless. You know what I think. And I do really like your Toll Brothers example.
What I think is more impressive than their current meme on $30 oil is how they cut their estimate
of future production costs from $52 billion at the end of 2014 to $32 billion at the end of 2015,
without a major proved reserve reduction.
But hey, Continental cut theirs from $26 billion to $11 billion. So no big deal.
We have decided to that we too need to reduce our future production costs by 60%. The electric
cooperative said no problem. So did the chemical company, our workers comp carrier, liability
insurance carrier. The steel manufacturers did too, so our tubing and rods dropped 60%. The down
hole and injection pump service providers were ok with that.
Hey Clueless, even our accountant said, "No problem! Since you need to compete with OPEC and
Russia, we are knocking 60% off our bill! Now go beat those Saudi's and Russians in this oil price
war! Show em who is boss!"
Seriously, we have seen some cost reductions, but nothing remotely near 40-60%. And, of course,
although we pay the most to the electric coop of anyone, they just don't seem too keen on lowering
rates for us.
"... Whiting Petroleum Corp. (NYSE:WLL), the largest oil producer in North Dakota, has announced that it will suspend all fracking in the state and cut its budget for this year by 80% ..."
"... As of 1 April, Whiting will halt all fracking and stop completing its wells at 20 Bakken and three Forks sites. By this summer it will cut spending to $160 million for the rest of year to fund maintenance. ..."
"... The news comes along with Whiting's fourth-quarter results, which posted a net loss of $0.80 per share and revenues of $2.05 billion compared with 2014 EPS of $4.15 and revenues of $3.09 billion. ..."
"... It's also in a better position despite all the setbacks because it doesn't have any bonds maturing until 2019 ..."
Whiting Petroleum Corp. (NYSE:WLL), the largest oil producer in North Dakota, has
announced that it will suspend all fracking in the state and cut its budget for this year by 80%
in a move that sent its shares up 9% on Wednesday, back down to a record low on Thursday, and
$4.02 this morning.
... ... ...
As of 1 April, Whiting will halt all fracking and stop completing its wells at 20 Bakken
and three Forks sites. By this summer it will cut spending to $160 million for the rest of year
to fund maintenance.
... ... ...
The news comes along with Whiting's fourth-quarter results, which posted a net loss of
$0.80 per share and revenues of $2.05 billion compared with 2014 EPS of $4.15 and revenues of
$3.09 billion.
In an earnings call on 25 February, Whiting noted that its production for the fourth quarter
averaged 155,210 barrels of oil equivalent per day, and that enhanced completion designs in the
Williston Basin drove performance by delivering 22% production increases quarter over quarter on
a per well basis.
"Despite the sharp drop in commodity prices, our proved reserves increased 5% to 821 million
barrels of oil equivalent, even after 53 million barrels of oil equivalent of asset sales which
equated to almost 7% of our year-end 2014 reserves," Whiting executives noted.
The company sold $512 million of assets last year, ending the year with $2.7 billion of
liquidity. It's also in a better position despite all the setbacks because it doesn't have
any bonds maturing until 2019, and will not be negatively affected by the "March madness"
that is threatening other producers.
U.S. market is so oversupplied with oil that traders are experimenting with a new place
for storing excess crude
There are plenty to choose from: Thousands of railcars ordered up to transport oil now sit idle
because current ultralow crude prices have made shipping by train unprofitable.
The OPEC cartel needs to take action to stabilize the oil market because crude prices have fallen
to "totally unacceptable" levels, Nigerian President Muhammadu Buhari said on Sunday.
Nigeria, Africa's biggest oil producer which earns around 90 percent of its foreign exchange earnings
from crude oil exports, has been hit hard by the erosion of vital revenues caused by the global slump
in oil prices which has also hammered its currency.
"The current market situation in the oil industry is unsustainable and totally unacceptable,"
Buhari told Qatar's ruler during a meeting in Doha, his office said in a statement.
Speaking on the second day of his visit, Buhari highlighted the need for cooperation between OPEC
and non-OPEC producers.
"We must cooperate both within and outside our respective organizations to find a common ground
to stabilize the market," said Buhari, who also discussed ways to stabilize prices with Saudi Arabia's
King Salman in Riyadh last week.
On Thursday, Venezuela's oil minister said Qatar, Russia, and Saudi Arabia had agreed to a meeting
in mid-March as part of efforts to stabilize oil markets.
Buhari's spokesman, Femi Adesina, added that delegations from Nigeria and Qatar signed two bilateral
agreements to "boost economic cooperation" between the countries.
There was an agreement to avoid double taxation and tax evasion as well as another that would
pave the way for direct flights between major cities of both countries.
Nigeria should be worried. With a population of 173 Mil Nigeria is a huge African nation. Nigeria
just barely feeds many of its poor people. Climate change appears to not be a benefit to Nigeria
with increasing instances of drought. This country is flirting with failure if low oil prices
and drought continue. Oil has allowed this country to expand many times past what it should have.
Lagos metropolitan area is approximately 16Mil. This is a mega city in an overpopulated country.
If you think Nigeria can just fail and everyone will do fine without them think again. Some of
the best oil in the world comes from Nigeria. They are a significant producer at 2.5 mbd. They
are an important anchor to West Africa the world can ill afford to lose.
Rick Bronson on Sun, 28th Feb 2016 5:10 pm
If big oil can produce at $30 / barrel, they can survive, otherwise they close.
More than 1/2 the rigs were closed, that means Shale is not viable at $30 / barrel.
It has nothing to do with the leadership. Its the market economy.
But even at this low oil prices, electric vehicles are selling decently.
Garden-City Boy on Sun, 28th Feb 2016 5:49 pm
Oil is the only glue that holds the Nigerian patchwork together. The tanking oil price triggering
Nigeria's export earnings' nosedive is probably the best thing to happen to the Nigerian contrivance.
Nigerians and indeed the World should brace up for the inevitable and learn to come to terms
with what crystalizes from the precariously fragile mosaic.
All shale companies are underwater as for production prices and most are bleeding cash. As
of February 2016, ""Great Shale Oil Shutdown" started. After 18 month of dropping prices
most companies got the message and started shut down the production
Notable quotes:
"... So , unless prices go up, depletion is virtually guaranteed to take a bite out of annual production. We all seem to be in agreement this far. ..."
"... Running at a loss is one thing, bleeding cash at a loss is something else and far worse. ..."
"... Look up above. I mentioned three publicly traded companies whose combined BOE was 160K BOEPD who shut in production in Q4, before the latest $10+ dollar drop. It's here and will continue. ..."
With oil prices what they are now, not very much money is going to be spent on bringing any new
production to market, unless the project is already well underway, and most likely, not too far
from completion.
So , unless prices go up, depletion is virtually guaranteed to take a bite out of annual production.
We all seem to be in agreement this far.
Now supposing little or no new oil comes to market for the next few years, if and because the
price stays really low, Can anybody estimate HOW FAST the current production will go underwater?
If a company is SPENDING say forty bucks to produce a barrel, and getting thirty for it, the loss
will eventually FORCE that production to be shut in.
So – the question is, how many barrels will be shut in, and how soon, because those barrels
are losing money propositions on a day to day basis, cash in, cash out?
Running at a loss is one thing, bleeding cash at a loss is something else and far worse.
Looking at the oil price question from this point of view, I can see oil staying cheap for
quite some time if the overall world wide economy declines rather than at least holding steady.
OFM. Look up above. I mentioned three publicly traded companies whose combined BOE was 160K BOEPD
who shut in production in Q4, before the latest $10+ dollar drop. It's here and will continue.
"... Once this project is completed DECC will be able to better quantify system costs to inform policy decisions. Any future policy development, such as future renewable support, will be informed by the improved evidence base developed through this project . ..."
"... The additional costs of having variable generation on the system are low and for the most part renewable generators already pay these costs, said Renewable UKs director of policy, Dr Gordon Edge. If were going to talk about system costs, then we also need to talk about the undoubted economic benefits that wind generators also bring, he added. ..."
"... At a White House meeting between the CIAs director of plans, Frank Wisner, and John Foster Dulles, in September 1957, Eisenhower advised the agency, We should do everything possible to stress the holy war aspect, according to a memo recorded by his staff secretary, Gen. Andrew J. Goodpaster. ..."
"... When oil is selling for below its full life cycle production cost; when the industrys revenue has fallen by $2.3 trillion per year in the last two years; when the Saudis are borrowing money to pay their bills; when the nation with the largest petroleum resource on the planet cant afford toilet paper for its citizens; when hundreds of US producers are going out of business; when the world is using petroleum eight times faster than it is finding it; when the Etp Model said that this was going to happen years ago -– yep, I believe it. ..."
Nor, for that matter, of peak coal or gas. Fossil fuels, said to be on the path for an effective
demise in the rich world later this century, will actually continue to fulfil the major part of our
energy needs for the foreseeable future. So says the latest
BP Energy Outlook
.
... ... ...
...As oil prices dropped steeply in 2014, the once-dominant OPEC producers kept the taps open,
looking to maintain market share in the face of surging US competition, rather than cutting production
to force prices up. However, the forecasters were wrong in this case as well. Rather than decimating
the North American shale oil producers, the weaker ones went to the wall but many carried on pumping.
The costs of fracking (and re-fracking) and drilling multiple horizontal wells from a single well-head
had come down to a point at which losses were bearable, albeit further drilling was discouraged.
Breakeven cost for US oil in general is about $36 per barrel, although the average for shale is around
$58 (see
breakeven cost for top oil exporters
). The figure for Saudi Arabia, in contrast, is just $9.90.
Nevertheless, the consequences of continuing low oil prices are worse for Middle Eastern countries
and other 'cheap' oil producers because their economies are also heavily dependent on oil exports.
So, while a single industrial sector may take a hammering in the USA, Saudi Arabia needs about $105/barrel
to balance its budget (
Fiscal breakeven cost for the top oil-dependent economies
). For such countries, the economic
and social costs could be severe, while shale oil production can be scaled back but then quickly
revived when the market picks up.
On a more parochial note, plans in EU member states for continued expansion of renewable energy
were based on a projected reducing need for subsidies as conventional energy prices rose steadily.
Now, however, it begins to look as though subsidies will escalate for the foreseeable future. In
the UK, for example, the realities of photovoltaics having very limited potential at such a high
latitude and the building of more onshore wind farms meeting continued resistance from local communities
has made offshore wind an increasingly attractive proposition politically.
Politically attractive maybe, but hardly so economically. As last week's newsletter pointed out,
offshore wind farm operators are being offered energy prices of at least £115 per MWh, over £20 more
than the much-criticised strike price for electricity from the proposed Hinkley C nuclear plant (
(Guaranteed) power to the people
). Even these inflated prices, paid for by consumers, don't take account of the additional costs
of transmission, grid strengthening and conventional backup.
The result is a rethink of at least some aspects of the subsidy regime and a somewhat lukewarm
attitude to renewables in the UK (although Germany seemingly is set to push ahead with yet more wind
and solar, seemingly oblivious to the negative consequences of the policy instruments chosen: replacement
of clean and flexible gas by new lignite stations). The much-vaunted prospects of carbon capture
and storage (CCS), always just over the horizon and apparently destined to remain so, has had yet
another false start as funding for a demonstration project has been pulled.
Even the renewable energy industry itself if not united.
Power firm Drax urges biomass
subsidy rethink puts the case for biomass being a more cost-effective option than other renewables,
taking into account additional costs not normally included in the headline figures. The £105 per
MWh paid to Drax for energy generated mainly from imported American wood pellets is certainly higher
than the maximum of £82.50 paid for the latest onshore wind farms. However, an analysis conducted
for the energy generator by NERA Economic Consulting and Imperial College argues that the overall
cost to consumers of decarbonisation could be £2bn lower if biomass power stations were allowed to
bid for new renewable energy contracts.
The precise figures can be criticised, but the thrust of the argument is undeniable: the only
valid way of comparing competing technologies is to analyse the overall system cost. The Department
of Energy and Climate Change is said to be looking into the use of whole system costing, with work
due to finish shortly. According to energy minister Angela Leadsom, "Once this project is completed
DECC will be able to better quantify system costs to inform policy decisions. Any future policy development,
such as future renewable support, will be informed by the improved evidence base developed through
this project".
Let's hope so. The wind and solar industries will doubtless put up strong resistance, because
the higher-than-reported overall costs of their technologies is a secret they would rather was not
made public. We can expect to hear much more of this kind of thing: "The additional costs of
having variable generation on the system are low and for the most part renewable generators already
pay these costs," said Renewable UK's director of policy, Dr Gordon Edge. "If we're going to talk
about system costs, then we also need to talk about the undoubted economic benefits that wind generators
also bring," he added.
What those 'undoubted economic benefits may be to those other than the foreign-owned suppliers
of wind turbines and photovoltaic panels, we wait to find out.
The massive global debt bubble is the surest sign yet that we have reached peak oil. Without
growth in oil production, there can not be economic growth.
Debt was used to buy today's oil yesterday. Facilitated by cheap credit, we are currently producing
tomorrow's oil today. Tomorrow's oil, the last of the easy stuff, will have been depleted and
the debts will not only have not been paid but, will have gotten bigger.
Peak oil mates, peak oil. This is it. We are living it now. As I have stated previously, those
that deny peak oil do not understand it.
Plantagenet on Sat, 27th Feb 2016 8:48 pm
As long as global oil production continues to go up, we are not at peak oil.
We'll see a global peak in oil production sometime in the next 10 years, but we aren't quite
there yet.
CHEERS!
Harquebus on Sat, 27th Feb 2016 9:32 pm
Yeah but, oils ain't necessarily oils.
A lot of oil production is called oil but, it isn't sold on the oil market so, it isn't really
oil.
Truth Has A Liberal Bias on Sat, 27th Feb 2016 9:45 pm
Global oil production is down. July 2015 exceeds January 2016. And it will continue to decline
as we go forward.
Apneaman on Sat, 27th Feb 2016 9:53 pm
Yergin's a fuctard cheerleader and any prize can be bought. Pulitzer – Big fucking deal. Obama
has a Nobel and drone bombs babies and their mommas daily.
Apneaman on Sat, 27th Feb 2016 10:01 pm
Middle Eastern Wars Have ALWAYS Been about Oil
"Robert Kennedy Jr. notes:
For Americans to really understand what's going on, it's important to review some details about
this sordid but little-remembered history. During the 1950s, President Eisenhower and the Dulles
brothers - CIA Director Allen Dulles and Secretary of State John Foster Dulles - rebuffed Soviet
treaty proposals to leave the Middle East a neutral zone in the Cold War and let Arabs rule Arabia.
Instead, they mounted a clandestine war against Arab nationalism - which Allen Dulles equated
with communism - particularly when Arab self-rule threatened oil concessions.
They pumped secret
American military aid to tyrants in Saudi Arabia, Jordan, Iraq and Lebanon favoring puppets with
conservative Jihadist ideologies that they regarded as a reliable antidote to Soviet Marxism [and
those that possess a lot of oil].
At a White House meeting between the CIA's director of plans,
Frank Wisner, and John Foster Dulles, in September 1957, Eisenhower advised the agency, "We should
do everything possible to stress the 'holy war' aspect," according to a memo recorded by his staff
secretary, Gen. Andrew J. Goodpaster."
Rising debt might be a sign of approaching peak oil – excess energy is diminishing and therefore
unable to general excess capital production in society in order to pay interest and principal.
But in and of itself Debt is not definitive. Even if the return on energy were between 1 and
0 (costs more input than you get out), which would result in ginormous debts, but we could still
produce more total volume on a consistent basis, by the standard definition, no peakum oilum.
Now, its been at least six years that many have suggested we need to change the definition
of peak oil to mean: amount of Net Energy Available (from oil) to Society (nate hagens, et al).
And from that perspective, we've almost certainly reached peak net available energy or peak oil.
the question also about the different "liquids" going into the number is a solid question.
Will any of these questions make a difference to the MSM or doubters on this site? No.
rockman on Sat, 27th Feb 2016 10:53 pm
And again if folks keep allowing themselves to be baited into debates about PO dates and the
silly position that supply won't always meet demand (which it will thanks to the modulation effect
of pricing) then the reality of the complexity of the Peak Oil Dynamic will be ignored.
Just consider how few citizens don't understand that the current low oil prices are a result
of the diminishing capacity to develop meaningful new long term reserves.
shortonoil on Sun, 28th Feb 2016 7:07 am
"Breakeven cost for US oil in general is about $36 per barrel, although the average for
shale is around $58 (see breakeven cost for top oil exporters). The figure for Saudi Arabia, in
contrast, is just $9.90."
Crude stayed in the $100 range for almost four years. According to the quote above the industry
was making incredible profits during that period; so incredible that one would have to be an absolute
idiot to believe it? At $36 the profit margin on gross sales would have been 278%. On $58 it would
have been 172%, and on $9.90 it would have been 1010%.
That very easily explains how the Shale industry managed to accumulate over a $1 trillion in
debt to build annual sales of $360 billion. A 172% profit margin on gross sales will do that using
a combination of the New Math, and some very creative accounting. These guys are quoting EBITDA
numbers, not break even numbers. Of course, they think they have enough stupid, credulous readers
that they can get away with it.
Put it in print, and someone is dumb enough to believe it!
eugene on Sun, 28th Feb 2016 9:31 am
Another of the endless debates amongst people with little or no knowledge of the energy situation
but lots of opinions with each convinced their opinion is absolutely the correct one. I'd add
mine but I'm just an old man sitting in the woods with an "opinion" based on very limited knowledge.
One thing I do "know", oil is vital to our lifestyle and is a finite resource of which we have
extracted most of the cheap, easy stuff so will have to produce ever more expensive stuff. I like
the word "stuff" as it appears to me the definition of oil is changing according to the agenda
of the person speaking.
onlooker on Sun, 28th Feb 2016 11:21 am
"Just consider how few citizens don't understand that the current low oil prices are a result
of the diminishing capacity to develop meaningful new long term reserves." But some even here
say it is a glut. Hahaha. Funny isn't Rockman. Oh and for those who may not know Rockman is in
the Oil business he is not just some armchair pundit.
shortonoil on Sun, 28th Feb 2016 11:49 am
When the world is burning 32 Gb per year, and discovering 4Gb to replace the 32 it just used,
you apparently have a "glut". Is that the result of how you use your Facebook account? Maybe its
a Twitter brain thing?
onlooker on Sun, 28th Feb 2016 12:09 pm
Short thanks. Another person in the trenches. Not some denier, BAU cheerleader or shill. Because
they are the only ones harping on how Shale/Tar will bring about a revolution of new energy. Of
those 4Gb, I wonder now much of that per year we will even be able to bring to market. I think
depletion and the fizziling out of LTO will make in short term a mockery of the so called glut
and its advocates.
"The Cambridge Network is a commercial business networking organisation for business people
and academics[1][2] working in technology fields in the Cambridge area of the UK."
"Activities[edit] The organisation's mission is "We raise the game for business in Cambridge, and through that we
try to raise the game for economic growth in the UK."
Looker – I wish I didn't have to result to an worn anology but it works so perfectly: the blind
men trying to ID an elephant by each analyzing individual parts of the critter. PO (or more correctly
the POD…peak oil dynamic) is more than the date of global max oil production, storage volumes
at Cushing, KSA production levels, debt incurred by the US shale players, frac'ng costs, US oil
exports, a lot of dilbit made with Eagle Ford condensate, etc, etc, etc.
It's no different the
arguing that critter is a snake because only it's trunk has been analyzed. We see the same approach
here: PO isn't a factors because we see XXX or PO is the end of life as we know it because YYY
is happening.
Some don't like the POD because it's to inclusive. Which is the same as saying we shouldn't
study the entire anatomy of the elephant in order to ID it because that data is "too inclusive".
As I've stated before: the oil price spike which lead to the shale boom which led to increased
US oil production while cooling the global economy and leading to consumers who were unable/unwilling
to pay more then $40 per bbl which led to a drastic decline of shale rigs and a slew of oil companies
pushed to and over the brink of failure: collectively these events along with others indicate
to true nature of the PO dynamic.
At this point if one can't grasp the entire picture I doubt
they ever will.
IOW it's a f*cking elephant. LOL.
onlooker on Sun, 28th Feb 2016 2:58 pm
Thanks for the clear explanation of recent peak oil dynamics Rock. I being a layman have tried
to understand what is going on relative to PO and other matters affecting the planet as the least
we can do is know what the heck is really going on in the world we live. Now if they still don't
understand then they are dense or have an agenda.
shortonoil on Sun, 28th Feb 2016 3:17 pm
"Short thanks. Another person in the trenches."
When oil is selling for below its full life cycle production cost; when the industry's revenue
has fallen by $2.3 trillion per year in the last two years; when the Saudis are borrowing money
to pay their bills; when the nation with the largest petroleum resource on the planet can't afford
toilet paper for its citizens; when hundreds of US producers are going out of business; when the
world is using petroleum eight times faster than it is finding it; when the Etp Model said that
this was going to happen years ago -– yep, I believe it.
It's not that hard to get your head wrapped around, unless your head is made out of concrete.
Anonymous on Sun, 28th Feb 2016 3:37 pm
That was my point Ape
The word 'Cambridge' is intended to be associated with Cambridge University. Thus=Academic,
credible source.
And 'Science' of course, is pretty self explanatory. It is there to reinforce the 'Cambridge'
association.
Sort of doubling up on the implications that this source is a credible, rational, impartical
scientific org. (LOL). And not,(its hopeed) as you point out, basically, a high sounding cheerleader
for UK commercial energy corporations. And others I am sure…
makati1 on Sun, 28th Feb 2016 7:01 pm
Recent signs of oil's peak…
"Global Trade Is Collapsing--Chinese Exports To Brazil Down 60% In January Y/Y; All Containerized
Shipments To LatAm Down 50%" "Bond Vigilantes Push $258 Billion of Oil Debt Past Junk"
"Halliburton to cut 5,000 jobs in new round of layoffs" "Slashing Start for European Energy Sector"
"Apache Slashes 2016 Budget By More Than Half, Sees Lower Output" "World outside US and Canada doesn't produce more crude oil than in 2005"
"Shale Oil Architect Predicts Doom for Some Drillers Amid Slump" "UK Oil Industry At The "Edge Of A Chasm"
"Mansion sales and discount dining: oil rout hits Houston's rich" "Watch Five Years of Oil Drilling Collapse in Seconds"
And for chuckles: " Former Mexican President To Donald Trump: 'I'm Not Gonna Pay For That [Expletive] Wall,' Vicente
Fox Says" "Clinton Defends Ongoing Anarchy In Libya: We Are Still In Korea, We Are Still In Germany"
Art Berman thinks that the glut of oil of oil is glut of condensate and light oil. Banks basically
has given shale operator a pass in 2015. At one point analogy with subprime will became too evident
to hide it and then crash starts. Art Berman recommended to watch Big Short to see what is happening
on shale patch.
While US banks have been
exceedingly transparent in their reporting, European banks have been
much more inconsistent; exposure could be significantly greater still.
The shale bust and the fallout from $30 per barrel oil claimed another 13 rigs this week,
Baker Hughes announced Friday.
The oilfield service company's rig count showed only 400 rigs drilling for oil across the
U.S., down 75 percent from the October 2014 peak of 1,609. Over the past year, the count has
fallen by nearly 60 percent.
The total rig count - including both oil and gas rigs - now stands at 502 rigs. Natural gas rigs
were up one this week to 102.
The combined count is only 14 rigs above the lowest point since Baker Hughes began recording. The
record low was reached in 1999.
As I highlighted
on CNBC yesterday, Saudi's actions speak louder than their words; they
may be willing to entertain a production freeze if everyone else plays ball,
but in the meantime, they are continuing to flood the market, involved in a
political battle with Iran.
This is illustrated in the chart below. So far
in February, we are seeing Saudi crude oil flows into China up 30% versus
February last year, and some 67% higher than volumes seen last month,
kicking around record levels. On the flip-side, while we are hearing
repeated claims of production ramping up from Iranian sources, we are yet to
see this manifesting itself in vastly higher Iranian export activity.
On the economic data front we have had a number of inflation readings out
across the globe. Japan kicked things off, with inflation data coming in as
flat as a pancake at 0.0% YoY in January, edging down from +0.2% in the
month prior. German inflation was also as flat as a beaver's tail, at 0.0%
YoY for February, down from +0.5% in the prior month. We have also had
consumer confidence and business climate assessments out of the Eurozone:
both readings were downbeat.
Looks like Russian oil minister decided to play the role of a regular supply and demand jerk, may
be intentionally. Generally Russians unlike Chinese's behaved like idiots in this situation. Inread
of building state petroleum reserves like Chinese did and later selling oil later at reasonable prices
they continued to dump the oil on market helping Saudis to crash the price. Russia is still buying US
treasures instead as if oil is not as reliable as currency. Russia is the only major country that does
not have strategic oil reserves.
Alexander Novak mostly sounded like a regular member of the neoliberal cosmopolitan elite not as
a Russian oil minister who is interested in well-being of Russian citizens. As Soros aptly mentioned
such people have more in common with Wall Street financial oligarchs that with interests
of their own country.
Whether this was intentional of this is a his assumed position for Die Welt I do no know.
Notable quotes:
"... Given the pricing environment we expect in 2016 further reductions of 15-40%. Thus, this year 30 largest companies in the world can cut $200 billion from capex budgets . At the same time, we see that rise in in the price of the credit for oil producers in the US hinders their access to financial markets. ..."
"... On a global scale in the short term, these effects will be minimal. However, in the medium and long term they will be dramatic, because many of the cancelled projects were important for stability of oil supply from the point of view of growing global demand, have been postponed or frozen. So we can assumed that after 2020 a stable supply of oil is under threat. In this regard, Russia seeks to remain a stable supplier of oil globally. ..."
24.02.2016 | Die Welt/InoSMI
Russia is suffering from extremely low oil prices. Energy Minister Alexander Novak warned us
against the dramatic consequences of falling oil prices for the entire world. After the oversupply
of oil, according to him, a severe deficit is coming.
Die Welt: You have agreed with the oil Minister of Saudi Arabia on the limitation of oil
production. At first the market reacted to the results of your negotiations negativity and oil prices
continued to fall. What, in general, gives us this arrangement?
Alexander Novak: I Think our meeting with the colleagues from Saudi Arabia, Qatar and Venezuela
were very productive. The main result was a preliminary agreement on limiting oil production in 2016
at the level of January of this year. The final decision will be made when this initiative will join
most other oil producers. In our view, this approach would gradually reduce the oversupply and stabilize
prices at a level that will ensure the stability of the industry in the long term.
- Let's assume that others will agree with this. However, experts believe that price stabilization
is necessary not just freeze, and a reduction in oil production.
- Such proposals are periodically received. But we think that this may soon lead to an abrupt
artificial increase in prices. Because such a rise in prices entails the inflow of speculative
money into capital-intensive projects, for example, in the production of shale oil that, in turn,
will lead to rapid increase of oil production and as a result another round of oil prices fall. Of
crucial importance is the level of prices at which US shale oil is unprofitable. If the oil price
moved higher higher, we will again be faced with the effect of plummeting oil prices. That is why
we need mutual consultation in order better to access the current supply and demand situation.
- But the decline in prices over the last 18 months ago is already having a serious negative
impact on producers with higher costs.
- Yes, albeit slower than expected. This is a change from previous oil price cycles, when only
the oil exporting countries influenced the market by voluntarily reducing the production. But after
the invention of the technology for shale gas extraction in 2009, the situation has changed.
- So you agree with the International energy Agency, believes that in 2016, contrary to expectations,
oil prices stabilize?
- In general yes. Because when in mid-2014 oil prices began to decline, many thought that soon
shale oil will fall prey of it. However, this did not happen. We can see that the price at around
$100 per barrel was too high, but shale oil companies for more then a year managed to withstood the
falling oil prices and continue oil extraction is volumes comparable with the volume at peak.
Demand and supply grow equally, and the gap between them did not became smaller. That's why in 2016
everyone is adjusting their predictions about the end of low oil prices regime.
Limited access to funding by high cost producers and delay in implementation of capital intensive
projects will play a role in the alignment of supply and demand in the market and the volume of oil
production outside OPEC, primarily in North America, will be reduced. For example, in the US, the
number of drilling rigs already has declined by two-thirds.
- Not only in the United States. All the world's leading oil companies reduced their investment
programs by 10-35%. What reductions we can expect in 2016?
- Given the pricing environment we expect in 2016 further reductions of 15-40%. Thus, this
year 30 largest companies in the world can cut $200 billion from capex budgets . At the same time,
we see that rise in in the price of the credit for oil producers in the US hinders their access to
financial markets.
- What can be the consequences of reducing investments in the foreseeable future?
- On a global scale in the short term, these effects will be minimal. However, in the medium
and long term they will be dramatic, because many of the cancelled projects were important
for stability of oil supply from the point of view of growing global demand, have been postponed
or frozen. So we can assumed that after 2020 a stable supply of oil is under threat. In this regard,
Russia seeks to remain a stable supplier of oil globally.
- Can Russia to help stabilize prices, "selling" to OPEC and other major producers the
idea to reduce production?
- We haven't made exact calculations. For Russia, this is a difficult question due to the technological
aspects of oil extraction, the current state of the projects under construction and climatic conditions.
You can understand our situation from a simple fact: Russia has more than 170 thousand wells, and
to reduce their number very difficult. And in the middle East much less wells: Saudi Arabia produces
the same amount of oil as we do, with only 3500 wells. In addition, our oil companies are independent
joint-stock companies which are independently planning the level of their own production.
- The head of the second largest Russian oil company LUKOIL Vagit Alekperov said recently that
the Russian oil sector is most afraid that the government will change tax rules for him.
- I share the opinion of the head of the Lukoil concern. We needs a stable tax system. Oil prices,
along with the ruble and so fell and to this created for oil companies the problems of financing
of the oil extraction. If in addition we change the rules of taxation, the future would
become impossible to predict and the companies would be unable to plan their activities for more
then one year. We in the last two years had introduced some tax breaks which should encourage the
production at new fields in Eastern Siberia and the far East. Their effect is already noticeable:
in 2015, we got from those fields additional 60 million tons.
- And in the Arctic region?
- This region now is off-limit due to the costs. But the investments in the extraction of Okhotsk
and Caspian seas have risen because they are attractive from the point of view of taxation. In the
long run we are - regardless of the dynamics of oil prices - will have to change the tax system.
Together with the Ministry of Finance we will develop in the course of this year proposals.
- Russia, as you know, is struggling with declining production in current fields. If the investment
will be reduced, won't this mean that in 2017 the volume of oil production will fail?
- Much will depend on the situation with oil prices and the ruble exchange rate. All our major
companies confirm that they will be able to maintain production at the current fields at the current
level. However, at the current oil prices, investment in new projects will be reduced - at least
by 20-30%.
- In the medium to long term additional load on unconventional and expensive projects will
fall and Western sanctions. How noticeable the effect of them now?
- Impact on overall production is extremely small. In the last two years we have extracted from
these "difficult" fields were we do need western technology just 18 million tons, or around
3% of our total production. The growth of their share is a matter of the future.
- However, without the Western technologies to achieve it will be difficult.
- I expect the opposite effect. Since our companies cannot cooperate with the West in this
area, they had to do this work independently and to develop new technologies in Russia.
- Let me get this straight: in the next few years Russia can't eliminate technological handicap
with the West. This will not work.
At least, we achieve our goals. In three years we seriously upgraded the level of our current
technology. Professionals, scientific and practical basis of all that we have. Many companies are
working on it.
- As for the gas sector, the European Commission seeks to obtain access to all of the gas contracts.
What is that in your shows?
- It's hard for me to comment on it. We believe that commercial contracts are a matter between
the two companies.
- Are you concerned about the behaviour of the EU?
- European authorities want the contract on deliveries was coordinated by the European Commission.
However, many countries disagree. Much will depend on them.
- Differences between the EU and Gazprom have a long tradition. For a long time Gazprom attitude
to the EU's was aggressive and disrespectful. Now his tone was softer. How do you evaluate the bilateral
relations at the moment?
- We believe that Russia is a reliable supplier and that the relationship is beneficial to both
parties. Thus the entire current infrastructure was created. Now, however, we have to expand
it taking into account the fact that production in Europe will decrease and demand will increase.
But differences remain. Can we call the position of Europe a constructive policy ?
- Political aspects now take precedence over the economic aspect of natural gas and oil supplies.
So, for political reasons the project "South stream" was blocked . For political reasons, there
are attempts to prevent the expansion of Nord stream. It is obvious that the construction of the
first two lines of the "Nord stream" conformed to European legal norms. However, the attitude
to the two new branches is different. In addition, we see that in the new energy strategy of the
EU does n mention relations with Russia. How can this be considering the fact that we are the main
supplier of energy to EU? We hope, however, that pragmatism will prevail. We need to develop relations
based on mutual interests, guarantees and long-term prospects.
- I can assume that you are counting on the support of Germany to expand the "Nord stream".
- We presume that we are talking, primarily, about economic project. Major energy companies of
Europe are interested in him. Because this is a long term project. And we will compete with other
suppliers of natural and liquefied gas, which is the rate now.
It has been an historic week for the US energy market, as hot on the heels of US oil exports is the
first US LNG export cargo – leaving
from the Sabine Pass terminal. Yet while this is viewed as a game-changer for the US – as it
can now truly live up to its moniker as 'the Saudi Arabia of natural gas' – exports could
be just as big a game-changer for parts of Europe.
By reducing its reliance upon Russia, Europe
will not only see benefits from a pricing perspective, but it will also help limit the political
power that Russia holds over many countries. The chart below starkly illustrates Russia's dominance
in Europe, with a number of countries leaning on it for the majority of its gas needs.
In total, Russia supplies a third of Europe's natural gas. Nonetheless, some estimates suggest
that the US could
catch up with Russia within a decade in terms of exports into Europe. Estimates also suggest
that US exports could drop European LNG prices by 25% over the next two years. This benefit would
be widespread across the continent; Germany relies on Russia for half of its gas needs, Italy for
a third, while countries such as Bulgaria lean on Russia for the vast majority of its supplies.
"... Chinas output in 2016 will decline between 3 percent and 5 percent from last years record 4.3 million barrels a day, according to analysts from Nomura Holdings Inc. and Sanford C. Bernstein Co. That would be the first decline in seven years and the biggest drop in records going back to 1990. The country is the worlds fifth-largest producer and biggest consumer after the U.S. ..."
"... Fellow state-run energy giant China Petroleum Chemical, also known as Sinopec, said on Jan. 27 that oil and gas output in 2015 fell for the first time in 16 years as a slump in domestic crude production outweighed record volumes of natural gas ..."
"... While some Middle East suppliers can operate with oil at $25 a barrel, the break-even cost for Chinas Cnooc is closer to $41, according to Nomura Holdings Inc. analyst Gordon Kwan, who predicts the countrys domestic crude production will fall by 5 percent this year. ..."
"... The plateau, 2008 – 2014, was made possible by infill drilling. I suspect that the decline curve will be steeper than indicated in the above chart. ..."
• Domestic production forecast to fall first time since 2009
• Crude output may decline by as much as 5 percent: Nomura
China's output in 2016 will decline between 3 percent and 5 percent from last year's record
4.3 million barrels a day, according to analysts from Nomura Holdings Inc. and Sanford C. Bernstein
& Co. That would be the first decline in seven years and the biggest drop in records going back
to 1990. The country is the world's fifth-largest producer and biggest consumer after the U.S.
"We expect significant cuts in upstream production as the companies cut output at loss-making
fields," said Neil Beveridge, a Hong Kong-based analyst at Sanford C. Bernstein & Co. "Chinese
explorers need to take more radical action to cut operating costs and increase efficiency."
CNPC plans to maintain crude output near 2015 levels, Deputy General Manager Wang Dongjin was
quoted in a statement posted last month on the company's website. The country's biggest producer
has only a "limited amount" of money to invest this year and will spend on oil and gas projects
that improve efficiency or promote sales, Wang said.
Fellow state-run energy giant China Petroleum & Chemical, also known as Sinopec, said on
Jan. 27 that oil and gas output in 2015 fell for the first time in 16 years as a slump in domestic
crude production outweighed record volumes of natural gas.
Cnooc. Ltd., the country's biggest offshore crude explorer, said last month that output will
fall this year, the first time in more than a decade, as it accelerates spending cuts.
While some Middle East suppliers can operate with oil at $25 a barrel, the break-even cost
for China's Cnooc is closer to $41, according to Nomura Holdings Inc. analyst Gordon Kwan, who
predicts the country's domestic crude production will fall by 5 percent this year.
China announced last month fuel prices won't be cut in line with crude as long as it trades
below $40 a barrel. The National Development and Reform Commission said the floor is designed
in part to shield domestic oil producers from the global price collapse.
"The policy is designed to provide explorers room to breathe," said Laban Yu, head of Asia
oil and gas equities at Jefferies Group LLC in Hong Kong. "China cannot afford to shut down domestic
production no matter how cheap crude gets."
The articles I referred to above show a decline in actual Chinese production of 2.5 percent in
one month. China produces around 4 million bopd, so it is a top producer. Any producing area can
show a lot of variability from one month to another and production could rebound or have a small
decline next month, however 2.5 percent decline in a month is big.
As a comparison, If the EIA came out with actual USA production falling 2.5 percent in January
that would be a decline of around 230,000 barrels per day from December 2015. That's big!
On the other hand, Ron's historical production charts for China do show a lot of variation
from one month to next. I don't know anything about xinhuanet which ran this report, or the National
Development and Reform Commission which is supposedly reporting this information.
Click on 5 Yrs. Looks like relentless increase in Chinese oil production since mid 2014 when
price decline started and when oil was > $100. Apparently EIA data.
No reason this can't be so given they have their own central bank.
Nope, its an actual reported one month reduction of 2.5%. The data is in tons and I'm not sure
how it would convert but it would probably be a little over 100,000 bopd.
My point was that rate of decline in the US would be about 230,000 bopd in a month, so it is
a large percentage decline.
It is hard to say how free oil companies are in China to go their own way, as they see fit, when
it comes to production policy. The government exercises an enormous amount of power over Chinese
industry.
Now if I were a Chinese commie, in a high position, knowing my country has a huge stash of
dollars possibly subject to depreciation due to inflation, I would opt to buy oil, and hold on
to domestic oil in the ground inside the country.
It seems like a damned safe bet it will be worth a lot more in a few years than it is now,
and the interest China earns on dollars is trivial.
I was referring to Nomura's prediction of a 5% yearly fall in China's 2016 oil production. If
it comes to happen this should set back production to 2012-13 levels.
China's mature onshore oil fields are declining.
This includes Daqing, China's largest field, currently accounting for a fifth of the country's
output.
excerpts from an article:
"In late 2014, CNPC essentially threw in the towel on its workhorse field, Daqing, announcing
that it would allow the field to essentially enter a phase of managed decline over the next five
years. Under this new approach, the field's oil production will fall from 800,000 barrels per
day (kbd) in 2014 to 640 kbd by 2020: a 20 percent decrease.
Daqing's oil production has declined relentlessly, despite PetroChina's significant increase
in drilling activity in the field during recent years. This suggests a significant risk that production
could fall faster than planned. For reference, PetroChina drilled 1,975 development wells in 2002
when oil production averaged 1.079 million barrels per day, but was forced to boost this to 4,498
development wells in 2014, when oil output at Daqing averaged 792,000 barrels per day. In short,
the number of development wells drilled increased by nearly 250 percent while oil production fell
by roughly 27 percent."
China's second largest field is Shengli, operated by Sinopec (China Petroleum & Chemical Corp.).
Although Shengli is a mature field (discovered in 1961, developed since 1964), production there
remained relatively stable within a range between 510 and 540 kb/d for many years, thanks to intensive
drilling program.
While Shengli's output was plateauing, Sinopec's other fields in China have delivered impressive
growth, having doubled oil production from around 150 kb/d in 1999 to 310 kb/d in 2014 (see the
chart below).
The growth trend was reversed in 2015, when Sinopec's output in China declined by 4.7% – the
first decline since the company's IPO in 2000. Further decline is expected in 2016.
The quote below is from Bloomberg:
"Sinopec has been maintaining output in its aging oil fields by over-investing and this is
no longer possible in the current oil price environment," said Neil Beveridge, a Hong Kong-based
analyst at Sanford C. Bernstein, who estimates the company needs oil to stay above $50 a barrel
to break even. "We expect Sinopec's domestic oil production to drop 5 percent to 10 percent this
year as it shuts down aging high-cost oil fields."
"Sinopec Shengli Oilfield Co. [Sinopec's subsidiary – AlexS] will shut the Xiaoying, Yihezhuang,
Taoerhe and Qiaozhuang fields to save as much as 130 million yuan ($19.9 million) in operating
costs, the company said in a statement.
The four oilfields are among the least profitable among 70 run by Sinopec Shengli, according to
the statement.
Fu Chengyu, the former chairman of Sinopec, said last year that output at the unit was being cut
"proactively" because of low oil prices."
The speculation surrounding the possibility of an OPEC production cut have
not gone away, despite the comments from Saudi oil minister Ali al-Naimi earlier
this week. Venezuela's oil minister stoked the markets when he
said on Thursday that representatives from Russia, Saudi Arabia, Qatar,
and Venezuela would meet in mid-March to discuss cooperative efforts to stabilize
oil prices.
Oil prices shot up more than 1 percent on the news, but there isn't much
new here to trade on. These countries will move forward with the production
freeze, but that will likely have only a limited effect on the fundamentals
in the short-term. An actual production cut remains a remote possibility for
now.
"... And to add to some of the good points made: Cushing contains only 20% of total US oil storage capacity. Notice they don't mention the fill level of that total: last time I looked it was about 65%. That means 35% of the 450+ MILLION BBL CAPACITY is still empty. ..."
"... The vast majority of oil going into Cushing IS NOT do to a lack of buyers as the import numbers indicate. It's largely do to speculators hoping to take advantage of f increases in future oil prices. The net effect is that these speculation OIL BUYERS are competing with the refiners for domestic production. ..."
"... IOW if we are still importing oil how can there be a glut of domestic oil: the US lacks sufficient oil production to satisfy the demand from the refineries AND speculators. ..."
"... A few more FACTS to offset the "OMG Cushing is filling up" hysteria. First, Cushing is in PADD 2 as they point out. But it isn't the only tank farm in that midwest district: it only holds 60% of that total capacity. ..."
"... OMG: almost 13% of the capacity of storing oil in the US is getting close to being full…what are we going to do??? ..."
"... Maybe they'll just build more storage: since 2011 about 25 million bbl of new storage was added to Cushing and 57 mm bbls added in the Gulf Coast. IOW Cushing would have been completely filled years ago had not SPECULATING INVESTORS not paid for new storage. ..."
"... Agreed, the Cushing stuff is overplayed. It's the tail, not the dog anyways. ..."
"... From all evidences Cushing is flooded with light oils and condensate, waiting for more heavy oils to be blended with, or more orders from the plastics manufacturers. ..."
"... That is probably true because very light crude is only minimally useful to the refineries: ..."
"... It produces almost none of the more profitable end products, like diesel. It also only has a minimal impact on the economy because its energy content is much lower. ..."
"... Its lower energy content also impacts crude prices. The price of oil depends on the strength of the economy, and the strength of the economy depends on oil's ability to power it. Lower energy content oil does less powering, which results in less demand. ..."
"... The specific gravity of a fuel oil is a reflection of its heating value. The heating value is determined primarily by the carbon/hydrogen ratio; as the carbon/hydrogen ratio increases, the specific gravity will increase and the heating value will decrease. Section 3, Figure 3 will give some idea of the effect of the carbon/hydrogen ratio and the various hydrocarbon components on the heating value. The heating value is also decreased by the presence of sulfur. ..."
And to add to some of the good points made: Cushing contains only 20% of total US oil storage
capacity. Notice they don't mention the fill level of that total: last time I looked it was about
65%. That means 35% of the 450+ MILLION BBL CAPACITY is still empty.
And why are we still importing oil: lack of sufficient domestic AVAILABILITY…not production.
The vast majority of oil going into Cushing IS NOT do to a lack of buyers as the import numbers
indicate. It's largely do to speculators hoping to take advantage of f increases in future oil
prices. The net effect is that these speculation OIL BUYERS are competing with the refiners for
domestic production.
Which, again, explains why we still import a huge volume of oil despite the constant and foolish
use of the word "glut". IOW if we are still importing oil how can there be a glut of domestic
oil: the US lacks sufficient oil production to satisfy the demand from the refineries AND speculators.
rockman on Sat, 27th Feb 2016 9:39 am
A few more FACTS to offset the "OMG Cushing is filling up" hysteria. First, Cushing is
in PADD 2 as they point out. But it isn't the only tank farm in that midwest district: it only
holds 60% of that total capacity.
And now compare the 88 mm bbl capacity to the PADD 3 (essentially Texas and LA. where the bulk
of the refineries are) capacity of 260 mm bbls. Between the speculator purchases and the smaller
number of refineries combined with the large volume of Canadian imports seeing Cushing filling
up is no surprise.
And we're just talking about tank farm storage. So again compare the 88 mm bbl capacity at
Cushing to the total storage capacity at US refineries: 179 mm bbls. No: the volume of oil held
at refineries is not part of the total TANK FARM capacity. So how much is the Cushing storage
capacity compared to tank farms + refinery storage: 13%.
OMG: almost 13% of the capacity of storing oil in the US is getting close to being full…what
are we going to do???
Maybe they'll just build more storage: since 2011 about 25 million bbl of new storage was
added to Cushing and 57 mm bbls added in the Gulf Coast. IOW Cushing would have been completely
filled years ago had not SPECULATING INVESTORS not paid for new storage.
Nony on Sat, 27th Feb 2016 12:41 pm
Agreed, the Cushing stuff is overplayed. It's the tail, not the dog anyways.
Oil us up several dollars over the last couple weeks (26 to 33). And the contango has shrunk
(prompt/spot up more than 1 year out). Both of these are factors that argue we are not in a storage
crisis, that the glut is easing.
Note: 33 is still WAY less than 100. And the long term strip has dropped significantly also
So we have had a radical change in the market since JUL2014. But current indications (even just
the contango itself) argue that future oil prices will be higher than current, rather than lower.
Of course there is a probability spread of outcomes and the US EIA STEO price funnel diagram
shows that prices could be higher or lower over next few years. So future price drops are still
reasonably possible (above 5% likelihood), although not likely (below 50% chance).
farmlad on Sat, 27th Feb 2016 2:02 pm
From all evidences Cushing is flooded with light oils and condensate, waiting for more
heavy oils to be blended with, or more orders from the plastics manufacturers.
Apneaman on Sat, 27th Feb 2016 4:02 pm
Short sellers hitting energy at near-crisis levels
It produces almost none of the more profitable end products, like diesel. It also only
has a minimal impact on the economy because its energy content is much lower.
Its lower energy content also impacts crude prices. The price of oil depends on the strength
of the economy, and the strength of the economy depends on oil's ability to power it. Lower energy
content oil does less powering, which results in less demand.
IFuckYouOver on Sat, 27th Feb 2016 4:59 pm
Short of a chemical analysis of what is in there, we cannot interpret these data properly
The specific gravity of a fuel oil is a reflection of its heating value. The heating value
is determined primarily by the carbon/hydrogen ratio; as the carbon/hydrogen ratio increases,
the specific gravity will increase and the heating value will decrease. Section 3, Figure 3 will
give some idea of the effect of the carbon/hydrogen ratio and the various hydrocarbon components
on the heating value. The heating value is also decreased by the presence of sulfur.
The heat contained in a fuel, or its heating value (BTU/lb), is primarily affected by
changes in a specific (or API) gravity and its sulfur content in percent by weight.
As the gravity of the oil increases, the ratio of carbon to hydrogen increases, as well as
the sulfur content. The result is that there is less hydrogen with its high heating value available
per pound, and a consequent decrease in heat released during combustion. From a performance viewpoint,
this change in heat content is indicated by an increased brake specific fuel rate in pounds per
brake horsepower-hour and, to a very slight degree, by a decrease in overall engine efficiency,
as more fuel with a lower heat content must be burned for a fixed power output.
"... Despite all the talk of technology, etc, the real measure of any business is an accurate measure of its future cash flows, and then application of an appropriate discount rate to those future cash flows, minus the debt. ..."
"... EOG reported long term debt of $6.654 billion. Production fell from 2014 to 2015. Go to shale profile.com and look at their Bakken and Niobrara production drops. Soon Enno will have the Eagle Ford shale up, we can look at that to. ..."
"... In my opinion, EOG released this presser because at current oil and gas prices, their assets have no value, absent even more cuts to production and development costs, which to me seem improbable. Even more cuts probably don't get them to the ability to pay back debt, especially as the above cash flow calculations DO NOT include general and administrative expenses, nor debt interest expense. ..."
"... I really hope readers will take the time to read this post. EOG is about the best shale company out there IMO. Yet, their assets cannot produce future net cash flows over their expected lives, in aggregate, at current oil and gas prices, without even further cost cutting. Even another 25% of cost cuts doesn't get them close to servicing debt. ..."
"... Also, for the oil traders out there, knowing that EOG is likely a more effective cost producer out there than over half of worldwide production, why don't you explain to me the current futures strip? ..."
For EOG, $40 is becoming the new $70. This morning, the company discussed a new strategy
to make unconventional oil development in US plays like the Eagle Ford and the Permian Basin
competitive on a global scale at current oil prices. Specifically, EOG has identified a decade
of premium unconventional oil drilling inventory that will generate double digit returns at
$30 oil.
Backed into a corner by lower cost producers in a global price war, EOG essentially just
yelled a battle cry at OPEC on behalf of US shale, implying they will make unconventional oil
just as cost effective as OPEC barrels.
EOG Resources is light years ahead of its peers in shale science and acreage quality, and
its ambitions may not be repeatable industry-wide, although others will certainly try. EOG
is to shale what Saudi is to OPEC - uniquely advantaged relative to other peers/members.
Friday morning, EOG Resources CEO Bill Thomas launched a new "premium location" concept,
which is essentially next level high-grading (focusing on the core of the core). Thomas's plan
aspires to make shale work in the new oil price paradigm, and competitive in the new world
oil market.
I have not had time to read it all, but have fun. I am sure the comments will be worth a read.
Toolpush. I read that on Oilpro. It is a head scratcher, as I thought I read Bill Thomas had earlier
said they need $80 oil to have a good business. He is EOG's CEO.
Despite all the talk of
technology, etc, the real measure of any business is an accurate measure of its future cash flows,
and then application of an appropriate discount rate to those future cash flows, minus the debt.
EOG, like all other oil and gas producers, is required to disclose estimates of future cash
flows in their annual 10K reports. They employ an independent engineering firm for this purpose.
Here is what they disclosed effective 12/31/14
Future cash inflows:$146.950 billion.
Future production costs:$51.633 billion
Future development costs$20.495 billion
Future income taxes: $20.495 billion
Future net cash flows:$51.636 billion
Future net cash flows discounted to PV10:$27.923 billion
Here is what they disclosed effective 12/31/15
Future cash inflows:$68.720 billion
Future production costs:$32.061 billion
Future development costs:$15.786 billion
Future income taxes $4.616 billion
Future net cash flows $16.258 billion
Future net cash flows discounted to PV10: $9.621 billion
Now, here is what happens to EOG reported numbers as of 12/31/15 if we drop their cash inflows
by another 1/3, which is where prices are today:
Future cash inflows:$45.814 billion
Future production costs:$32.061 billion
Future development costs:$15.786 billion
Future net cash flows:-$2.032 billion.
EOG reported long term debt of $6.654 billion. Production fell from 2014 to 2015. Go to
shale profile.com and look at their Bakken and Niobrara production drops. Soon Enno will have
the Eagle Ford shale up, we can look at that to.
In my opinion, EOG released this presser because at current oil and gas prices, their assets
have no value, absent even more cuts to production and development costs, which to me seem improbable.
Even more cuts probably don't get them to the ability to pay back debt, especially as the above
cash flow calculations DO NOT include general and administrative expenses, nor debt interest expense.
I really hope readers will take the time to read this post. EOG is about the best shale
company out there IMO. Yet, their assets cannot produce future net cash flows over their expected
lives, in aggregate, at current oil and gas prices, without even further cost cutting. Even another
25% of cost cuts doesn't get them close to servicing debt.
I ask anyone to tell me what I am missing. If there are any business media out there, please
look this over and then report on it. Look at other major independents such as ConocoPhillips,
Anadarko, Marathon, Chesapeake, Occidental, etc. I am sure that, with the possible exception of
OXY, they are worse.
Also, for the oil traders out there, knowing that EOG is likely a more effective cost producer
out there than over half of worldwide production, why don't you explain to me the current futures
strip?
The crash in oil prices has taken its toll. The number of rigs drilling for oil and gas in the
U.S. is plunging toward the lowest level in more than 75 years of records. The animation below
shows the deployment of rigs over five years, culminating in the collapse of almost 75 percent of
the rig count.
... ... ...
These five years represent the fastest expansion of oil production in U.S. history. New
technology drove this boom-particularly the deployment of horizontal drilling through shale rock.
The three biggest oil-producing shale regions are the Permian basin in West Texas, the Eagle Ford
in Southern Texas, and the Bakken in North Dakota.
After the plunge in oil prices kicked off in late 2014, producers started shutting down rigs at
an unprecedented rate. The number of active rigs is approaching the lowest level since Baker
Hughes started tracking rig counts in 1940. The rig count fell by 12 to 502 in the latest week of
data. The lowest rig count on record was 488, in April 1999.
Lots of talk about economy and growth. Anyone interested would do well to read "The End of Normal"
by James Galbraith. Galbraith is saying basically the same thing John Michael Greer has been saying
for a long time, but as a respected mainstream economist, Galbraith's message is all the more
meaningful.
"... My understanding is that California oil production is characterized by a large number of shallow wells producing small amounts of oil each. Also, many of these advanced fields have been under water flood or steam flood for quite a while. ..."
"... If $30 oil lasts very long, I would think that the decline rate could be as high as 3 percent a month due to high shut-ins and abandonment. I think a somewhat higher price would slow the decline a lot, as you would see normal depletion but would not see wholesale abandonment. ..."
"... USA and international have other similar mature fields with large numbers of wells producing small amounts of oil each. If a number of these fields start seeing a high rate of shut-in and abandonment, there will be substantial declines. ..."
"... From what Ive seen, most production projections seem to be focused on the shale and offshore declines. I think we may see a higher than expected decline in these old fields. The Bakken has become the leading indicator of shale, and California may become the best indicator of how these post mature fields respond. ..."
"... We have shut in quite a bit. Some places around here are pretty bad. One little field I go by sometimes had only one well pumping out of over 20. They all were on in 2014 and prior. ..."
"... The first leg there were 16 producing and 14 idle. The second leg there were 21 producing and 41 idle. Some of the idle ones may be on timers, and I dont have a baseline to compare. Nevertheless, it seems like a lot of idle wells. This is in Kansas, lots of low volume wells. Also, significant differentials. Prices were down to $16 but have moved back to $22-23. ..."
"... Quote from CEO: The other operational point I will make surrounds work overs. We routinely repair our wells across our entire portfolio and based on todays price environment, if a well goes down, we may leave it off a little while because spending money on repair isnt economically justifiable. Accordingly we expect to lose some wells in 2016, predicting that number of wells is nearly impossible ..."
Shallow, I know you have been looking at info on conventional declines as well as shale. California
is the number 3 producing state. According to their weekly notice summaries, they haven;t issued
a drilling permit in the last 3 weeks, and only 41 in 2016. Permits to abandon are now at 246
in 2016. Baker Hughes has them down to 6 rigs. It will be interesting to see how their production
declines, although they are slow to report.
dclonghorn. I am sure CA will decline. California Resources Corporation (the OXY spinoff) is in dire straits. Breitburn is also in dire straits, they are a significant CA producer. They didn't answer questions
on their conference call. I really don't blame them, what is there to say?
Agreed, they will decline. How rapidly they decline is a big question to me. My understanding
is that California oil production is characterized by a large number of shallow wells producing
small amounts of oil each. Also, many of these advanced fields have been under water flood or
steam flood for quite a while.
If $30 oil lasts very long, I would think that the decline rate could be as high as 3 percent
a month due to high shut-ins and abandonment. I think a somewhat higher price would slow the decline
a lot, as you would see normal depletion but would not see wholesale abandonment.
USA and international have other similar mature fields with large numbers of wells producing
small amounts of oil each. If a number of these fields start seeing a high rate of shut-in and
abandonment, there will be substantial declines.
From what I've seen, most production projections seem to be focused on the shale and offshore
declines. I think we may see a higher than expected decline in these old fields. The Bakken has
become the leading indicator of shale, and California may become the best indicator of how these
post mature fields respond.
If I am not mistaken, Denbury, Legacy Reserves and Breitburn all reported in conference calls
they that have shut in not an insignificant amount of oil production.
We have shut in quite a bit. Some places around here are pretty bad. One little field I go
by sometimes had only one well pumping out of over 20. They all were on in 2014 and prior.
I did some deliveries yesterday. I've recently been counting producing and idle pumps. The first
leg there were 16 producing and 14 idle. The second leg there were 21 producing and 41 idle. Some
of the idle ones may be on timers, and I don't have a baseline to compare. Nevertheless, it seems
like a lot of idle wells. This is in Kansas, lots of low volume wells. Also, significant differentials.
Prices were down to $16 but have moved back to $22-23.
Denbury press release. 2015 production, 72,861 boepd, down 2% from 2014. Q4 shut in 1,700 boepd.
Forecast 2016 64-68K boepd.
Breitburn. 55.3K boepd in 2015. Guidance 46.5-54K boepd. Shut in 650 boepd Q4 2015.
Legacy Reserves. 2015 45,135 boepd. No 2016 guidance.
Quote from CEO: "The other operational point I will make surrounds work overs. We routinely repair our wells
across our entire portfolio and based on today's price environment, if a well goes down, we may
leave it off a little while because spending money on repair isn't economically justifiable. Accordingly
we expect to lose some wells in 2016, predicting that number of wells is nearly impossible"
Man, this stuff isn't good at all. I have nothing against these guys, they are in the same
boat as us, just have debt because they grew a lot prior to 2015.
"... Those bonds must be cumulative mustnt they – i.e. rolled over each year. Otherwise that is about $1.3 trillion total. At (say) 5,000,000 bpd for 7 years at as high as $100 per barrel the companies would only be getting $1.25 trillion total. Or am I missing something. ..."
"... ….Credit analysts at UBS say there are $1.2 trillion outstanding in loans to the U.S. oil industry! A third of this debt is owed by exploration and production companies. And UBS predicts the default rate on these loans could end up being in the low-teens….. ..."
"... I think $1.2 trillion is total debt owed by the US oil and gas industry, not just loans. 1/3 of $1.2 trillion = $400 billion owed by the E P companies. This includes bonds and bank loans. Bonds include junk bonds and investment grade bonds. So $260 billion in junk bonds is the right number. ..."
Those bonds must be cumulative mustn't they – i.e. rolled over each year. Otherwise that is about
$1.3 trillion total. At (say) 5,000,000 bpd for 7 years at as high as $100 per barrel the companies
would only be getting $1.25 trillion total. Or am I missing something.
I'm going to predict a lot of bankruptcies in late 2017 as oil prices start to rise because the
lender's will suddenly see a lot more money in taking over the resource base than by keeping the
bond's rolling over.
….Credit analysts at UBS say there are $1.2 trillion outstanding in loans to the U.S. oil industry!
A third of this debt is owed by exploration and production companies. And UBS predicts the default
rate on these loans could end up being in the low-teens…..
The oil industry also includes pipelines and infrastructure, refineries ……
In the above diagram it is also clearly stated:
The amount of bonds US energy companies below investment grade need to pay back each year….
So, it is clear that the total amount of debt maturing over the next 7 years stands at 1.2
trillion.
"Credit analysts at UBS say there are $1.2 trillion outstanding in loans to the U.S. oil industry!
A third of this debt is owed by exploration and production companies"
I think $1.2 trillion is total debt owed by the US oil and gas industry, not just loans.
1/3 of $1.2 trillion = $400 billion owed by the E&P companies.
This includes bonds and bank loans.
Bonds include junk bonds and investment grade bonds.
So $260 billion in junk bonds is the right number.
Besides, I have seen in various sources a similar number
Heinrich – I think I agree with Alex. The caption is wrong in the "per year" bit, but correct
in "below investment grade" – that is junk, which is not the total debt to the oil industry by
a long way (let's hope).
"... Credit analysts at UBS say there are $1.2 trillion outstanding in loans to the U.S. oil industry! A third of this debt is owed by exploration and production companies. And UBS predicts the default rate on these loans could end up being in the low-teens. ..."
"... Fitch, a credit rating agency, said actual defaults should have begun happening nine to 12 months after oil prices started to fall. ..."
Credit analysts at UBS say there are $1.2 trillion outstanding in loans to the U.S. oil industry!
A third of this debt is owed by exploration and production companies. And UBS predicts the default
rate on these loans could end up being in the low-teens.
The latest survey of bank loan officers by the Federal Reserve found there is a higher expectation
that shale firms will have trouble meeting the terms of the loans. The survey also found that banks
were cutting credit lines to energy companies and asking shale firms for more collateral.
Fitch, a credit rating agency, said actual defaults should have begun happening nine to 12
months after oil prices started to fall.
But, judging by the stock performances of most of the companies involved, everything is great.
Why has nothing happened yet?
The answer is hedges. Many shale oil firms hedged their production this year. Chesapeake Energy (CHK),
for example, will have $1.2 billion added to its cash flow this year thanks to hedges on its production. But this protection declines and even disappears entirely in 2016 for some companies, leaving
them wide open to finally be hurt by low oil and gas prices.
Plus, companies can't add any more hedges at this late date because, in most cases, it would be
too costly.
Maybe that's why companies
targeted by David Einhorn as vulnerable, such as EOG and Pioneer, are so anxious to increase
their production as soon as possible. They need to generate cash.
"... Einhorn called much of the industry "frack addicts" who were wasting money on wells that'll never pay off. He said some companies are currently getting a negative return on their invested capital. And that, in some cases, that was true even when oil was trading at $100 per barrel! ..."
"... Since 2006, the U.S. oil exploration and production industry has spent $80 billion more in capital than it made selling oil. Einhorn says companies were only kept alive by the constant inflows of capital from bankers (also known as loans) and investors alike. ..."
"... Moody's said its LSI (Liquidity Stress Index) for these companies more than doubled in March to 9.8% from 4.4%. But keep in mind, this Index hit 26% in March 2009 when oil prices plunged due to the financial crisis. ..."
In November 2007, the relatively unknown hedge fund manager David Einhorn raised major concerns about
the accounting at Lehman Brothers. It led him to bet against the company, and short the stock.
No one paid much attention… until Lehman Brothers collapsed. Einhorn's reputation was made, and his firm, Greenlight Capital, became one of
the hedge
funds to watch. Now, Einhorn has found another prominent target: the frackers,
U.S.-based oil exploration and production (E&P) companies.
Zeroing In
Einhorn called much of the industry "frack addicts" who were wasting money on wells that'll never
pay off. He said some companies are currently getting a negative return on their invested capital. And
that, in some cases, that was true even when oil was trading at $100 per barrel!
Einhorn added, "When someone doesn't want you to look at traditional (financial) metrics, it is
a good time to look at traditional metrics." By "someone," he means exploration and production companies.
Einhorn dislikes how these firms report their earnings through methods like EBITDAX, which means
earnings before interest, taxes, depreciation, amortization, and exploration expenses. He said this
measure "stands for earnings before a lot of stuff." In particular, Einhorn targeted five companies:
Pioneer Natural Resources (PXD),
EOG Resources (EOG),
Continental Resources (CLR),
Whiting Petroleum (WLL),
and Concho Resources (CXO). Pioneer seems to be his No. 1 target, since he dubbed it "the motherfracker." "A business that burns cash and doesn't grow isn't worth anything," said Einhorn about Pioneer.
Instead, Einhorn encouraged investors to focus on cash as a guide to the health of the industry.
Since 2006, the U.S. oil exploration and production industry has spent $80 billion more in capital
than it made selling oil. Einhorn says companies were only kept alive by the constant inflows of
capital from bankers (also known as loans) and investors alike.
David Einhorn is a well-known poker player. (He won $4.4 million at the 2012 World Series
of Poker tournament.) But is he bluffing here?
On the Money, Sort Of
There is no denying the massive cash burn of these E&P companies. Many of them have debt problems,
which I have spoken about
before.
Moody's said its LSI (Liquidity Stress Index) for these companies more than doubled in March to
9.8% from 4.4%. But keep in mind, this Index hit 26% in March 2009 when oil prices plunged due to
the financial crisis.
This year Chesapeake's
stock market valuation has
suffered phenomenally. A year ago it was around $20 billion. By mid-February this year, it was around
$1 billion, and had been trading at under $2 a share until Wednesday, having shed more than $18 per
share over last year.
This has sparked fears that Chesapeake
was facing bankruptcy, but those fears seem to have been allayed if the 23 percent share price
jump is any indication. But the company still has $500 million in debt that is coming due in March-and
this is where the asset sale to FourPoint comes in handy.
There has been much investor concern about whether Chesapeake would be able to cover its debts
with planned asset sales and bond repurchasing. The plan was to purchase $240 million of the 3.25
percent senior notes due in March at discount rates,
according to Bloomberg. The news agency also noted that Chesapeake had been buying up bonds that
mature next year for 45 percent less than their value. The markets responded positively, but not
all analysts agree.
"We still believe it is burdened by too much leverage and by legacy transportation agreements,
and that if the strip (prices) were to hold true, that the stock has no equity value,"
Doug Leggate, a Bank of America Merill Lynch analyst,
wrote on Wednesday.
"... By Irina Shav, a writer for the U.S.-based Divergente LLC consulting firm with over a decade of experience writing on the oil and gas industry. Originally published at OilPrice ..."
"... nearly 35 percent of pure-play E P companies listed worldwide, or about 175 companies, are in the high risk quadrant, Deloitte noted, adding that the situation is precarious for 50 of these companies due to negative equity or leverage ratio above 100. ..."
"... More than 80 percent of U.S. E P companies who filed for bankruptcy since July 2014 are still operating (Chapter 11) under the control of lenders or the supervision of bankruptcy judges, according to Deloitte. ..."
"... However, the majority of these Chapter 11 debt restructuring plans were approved by lenders in early 2015, when oil prices were $55-60/bbl. Since then, prices have fallen to $30/bbl, and hedges at favorable prices have largely expired, making it tough for existing Chapter 11 bankruptcy filers to meet lenders earlier stipulations and increasing the probability of US E P company bankruptcies surpassing the Great Recession levels in 2016. ..."
"... According to AlixPartners, these debts totaled $353 billion for U.S. and Canadian energy companies at end-2015. To compare, Deloitte puts the combined debt of those 175 bankruptcy-threatened companies at more than $150 billion, nearly half of the total for US and Canada. ..."
"... Then there are the banks, which used to have a soft spot for energy companies when oil was selling for over $100 a barrel. Now that it is hovering around $30, the soft spot is gone and lenders are trimming their energy investment portfolios. ..."
"... Cost for shale oil production $15 a barrel? Thats roughly the cost of pumping light sweet crude in Saudi Arabia, the lowest cost producer out there. Sounds like nonsense to me. ..."
"... Consolidation likely, but only after bankruptcy. Which banks are most at risk? ..."
"... Secondary indirect effects are also of concern. Related exposures of the TBTFs and large shadow banks to the oil and gas sector, including derivatives, are opaque. Couple these developments with volatile price fluctuations in major currencies, declining prices of many other commodities, and the interconnected nature of these systemically important financial institutions, and one hopes their risk management and internal controls are adequate. ..."
"... In the good old days the Texas Railroad Commission set world oil prices. Now its being done by players that are solely focused on their own self interests and players that are very short sighted. ..."
"... President Obama wants an oil tax, then give him one. Impose a windfall tax on imported oil at $60 a barrel. This will cause higher gasoline prices now, but will forestall much higher gasoline prices in the future. ..."
"... Some of this misery, is self inflicted along with the complicit of Fed encouraging animal spirits of wildcatters with cheap credit expansion since 09! Lot of mal-investments are made all over just like in China. Karma is getting back its bite! ..."
"... The U.S. shale boom was fueled by junk debt. Companies spent more on drilling than they earned selling oil and gas, plugging the difference with other peoples money. Drillers piled up a staggering $237 billion of borrowings at the end of September, according to data compiled on the 61 companies in the Bloomberg Intelligence index of North American independent oil and gas producers. U.S. crude production soared to its highest in more than three decades… ..."
"... actually the undesirable aspects of fracking have been IGNORED, until now when it may affect the wealthy and the banks…we utilize products and transportation that is heavy on petroleum because that make banks and oligarchs a lot of money, and theyll kill public transportation to get moar. ..."
"... trees dont grow to the sky. There is a maximum volume of humans that the planet will tolerate, and we seem to be fixated on finding out what that number is. ..."
By Irina Shav, a writer for the U.S.-based Divergente LLC consulting firm with over
a decade of experience writing on the oil and gas industry. Originally published at
OilPrice
More than one-third of public oil companies globally face bankruptcy, according to a new Deloitte
report that paints a fairly gloomy picture of the U.S. shale patch as it struggles to survive under
mountains of debt.
The Deloitte report -the first high-profile report on the current financial situation of global
oil and gas companies-surveyed 500 companies and found that 175 are facing "a combination of high
leverage and low debt service coverage ratios".
"[…] nearly 35 percent of pure-play E&P companies listed worldwide, or about 175 companies,
are in the high risk quadrant," Deloitte noted, adding that the situation is "precarious" for 50
of these companies due to negative equity or leverage ratio above 100.
"Stock prices of some of these has already dipped below $5, making them penny stocks. The probability
of these companies slipping into bankruptcy is high in 2016, unless oil prices recover sharply, a
large part of their debt is converted into equity, or big investors infuse liquidity into these companies."
Reports about the growing numbers of bankruptcies among U.S. shale producers
aren't new, but the Deloitte findings reinforce the picture.
"More than 80 percent of U.S. E&P companies who filed for bankruptcy since July 2014 are still
operating (Chapter 11) under the control of lenders or the supervision of bankruptcy judges," according
to Deloitte.
"However, the majority of these Chapter 11 debt restructuring plans were approved by lenders in
early 2015, when oil prices were $55-60/bbl. Since then, prices have fallen to $30/bbl, and hedges
at favorable prices have largely expired, making it tough for existing Chapter 11 bankruptcy filers
to meet lenders' earlier stipulations and increasing the probability of US E&P company bankruptcies
surpassing the Great Recession levels in 2016."
Shale producers amassed huge debts that they are now struggling to service in the oil price downturn.
According to AlixPartners, these
debts totaled $353 billion for U.S. and Canadian energy companies at end-2015. To compare, Deloitte
puts the combined debt of those 175 bankruptcy-threatened companies at more than $150 billion, nearly
half of the total for US and Canada.
That's a lot of debt that needs servicing or restructuring. Unfortunately, things in the industry
are so bad that the usual solutions don't work as effectively as they normally would. For starters,
demand for E&P assets is at best moderate. Then there are the banks, which used to have a soft spot
for energy companies when oil was selling for over $100 a barrel. Now that it is hovering around
$30, the soft spot is gone and lenders are trimming their energy investment portfolios.
Private equity firms are one alternative source of finance for the troubled industry players.
Deep capex cuts are another. The efficiency of both options, however, is questionable. Banks, the
IEA, and the IMF have warned that oil prices could reach $20. Iran is back on the international market
and planning to raise
production to pre-sanction levels (around 4 million bpd in 2011.). The world's number one and
two producers, Russia and Saudi Arabia, have made a deal to freeze output at current levels, but
these levels are record-highs for both countries, so a freeze is unlikely to take care of the glut
quickly enough. And it's not going to happen anyway.
All this spells doom for that unfortunate one-third of producers. There is one alternative to
bankruptcy-sector consolidation-although the problems with consolidation are similar to the problems
with asset sales. Few energy companies are in a position to make acquisitions right now.
What's left? Continuing the optimization of everyday operations. Operating efficiencies are constantly
being improved, mainly in the shale patch but also outside it. Costs for 95 percent of U.S. output
have fallen below $15 a barrel, says Deloitte. It seems all that is left for the troubled E&Ps is
to continue pumping and keep hoping the storm will eventually subside. Not a fascinating prospect,
by all means, but the most realistic one.
Cost for shale oil production $15 a barrel? That's roughly the cost of pumping light sweet
crude in Saudi Arabia, the lowest cost producer out there. Sounds like nonsense to me.
They are waiting for the big bailout after the election, just like the S&L crooks, but this
time without 600 of them going to jail and the rest taking the haircut of the century.
I'm wondering what the impact on these new nat gas terminals will be with a decimated fracking
industry. I got a laugh out of NBR last night, they said it was good news that less inventory
came into storage last month, um when the tank is full you can't put any more in there……
I agree
with you that oil won't go to zero, one of the industry analysts referenced the Deloitte report
and based on it called the bottom 18. Cheapest gas in sd 2.29, most expensive by airport 3.49!
Also, I don't see Iran not putting their oil on the market, they need the dough, too
Most likely. And because the drilling, fracking and exploring was debt financed the producers
have to keep pumping as long as the price is above their marginal cost because they have to make
those monthly payments. So all these debt financed drillers are going to flood the market trying
to stay solvent until they all go bust.
Since the fossil fuel industry are big backers of the Republicans, this should present an opening
to the Democrats to do something significant about global warming. If they actually gave a damn
and weren't in the tank themselves.
Secondary indirect effects are also of concern. Related exposures of the TBTFs and large shadow
banks to the oil and gas sector, including derivatives, are opaque. Couple these developments
with volatile price fluctuations in major currencies, declining prices of many other commodities,
and the interconnected nature of these systemically important financial institutions, and one
hopes their risk management and internal controls are adequate.
The $15 per barrel operating cost doesn't matter, even if it is true – the core analysis is
the decline curve for Shale is very steep – more than 90% decline after 40 months – by the time
the price recovers the active reserve assets remaining – no matter what the asset discount for
bankruptcy – leaves little for a prize. Once these wells are put on a pump the deeper the well
the more operating cost with low volumes to cover the cost.
The losses will be catastrophic to include the banks.
In 86′ oil went from $42 at the top to $9.60 / Bbl. at the bottom – the see thru buildings
from Tulsa to Houston lasted for a long time since there were no tenants for the space – even
the law firms went off the air --
The problem in this current situation is that we are a capitalistic country trying to function
in a cartel world. In the good old days the Texas Railroad Commission set world oil prices. Now
it's being done by players that are solely focused on their own self interests and players that
are very short sighted.
OPEC tripled the price of oil between 2000 and 2010. They then held the price level. The marginal
price for oil was low and the additional portion of the price was essentially a kicker for their
government revenues. The problem was they got too greedy and set the price too high (had they
set the world price at $85 instead of $100, we likely would have avoided the latest boom/bust
cycle).
The capitalistic market saw these high prices and realized that they could make money at the
prices that OPEC was charging the market. In other words, the marginal cost for new oil prospects
was less than the artificial press levels that OPEC was setting. The result was predictable, though
partly driven by technology and fracking.
Marginal players, like the oil sands and deep and remote large scale oil and gas projects were
put into motion. The oil shale players were also put into motion, and they added about 3 million
barrels of oil per day out of about 92 million bopd. Other players, like Iraq also increased their
production.
When OPEC started feeling squeezed, they threw the kitchen wrench in and tried to hurt all
the other players in the market. In economics, this behavior is often either referred to as "dumping"
or "predatory pricing".
So, our domestic oil and gas production industry, to include a lot of US manufacturing jobs,
is being directly attacked by foreign countries that are trying to hurt our U.S. industry so they
can jack world prices up to higher levels.
So, those of you that are reveling in the current tough circumstances of our oil and gas industry
at these price levels, please realize a few things.
(1) OPEC really wants prices back at the high levels they have enjoyed recently. These low prices
will not last.
(2) OPEC has already managed to disrupt the longer term pipeline of oil projects – meaning that
the future oil supply over the next five years will be less than it would have been – which will
likely have a negative impact on world GDP.
(3) Our oil industry has made great strides in lowering costs and making unconventional oil shale
projects more competitive.
(4) Our government has done very little to support our cause of maintaining U.S. oil production.
We currently produce about 9 million barrels a day (down from about 9.5 million bopd recently)
at a time when we consume 19 million bopd as a country. While these extra imports we're now being
asked to cough up are cheap now, they will not be so cheap when OPEC jacks world oil prices higher
again.
Here's how we can fight back. President Obama wants an oil tax, then give him one. Impose a
windfall tax on imported oil at $60 a barrel. This will cause higher gasoline prices now, but
will forestall much higher gasoline prices in the future. Domestic producers will immediately
get a $60 oil price for their output. This will stop the Saudi's and Russians from being able
to deliberately destroy an industry in our country and allow us to create some employment stability
for a home grown industrial sector. The additional production in the U.S. will also make it more
difficult for OPEC to screw us later when oil prices soar again.
Some of this misery, is self inflicted along with the complicit of Fed encouraging animal spirits
of 'wildcatters' with cheap credit expansion since '09! Lot of mal-investments are made all over
just like in China. Karma is getting back it's bite!
Debt-Fueled Boom
The U.S. shale boom was fueled by junk debt. Companies spent more on drilling than they earned
selling oil and gas, plugging the difference with other peoples' money. Drillers piled up a staggering
$237 billion of borrowings at the end of September, according to data compiled on the 61 companies
in the Bloomberg Intelligence index of North American independent oil and gas producers. U.S.
crude production soared to its highest in more than three decades…
to paraphrase B. Dylan; 'who don't we all throw stones'
Everybody doin their 2 minute hate… am I right ??…………we're all stuck in this energy quagmire,…and
yes, the undesirable effects of fracking are now being felt, but we all utilize products or transportation
that relies on petroleum, like it or not !! Getting away from that energy source basically means
living a much reduced lifestyle !! who's willing to give up even, say 50%, of their energy usage
to eliminate petroleum use completely, because wind and solar currently do not scale, if they
ever will !!
actually the undesirable aspects of fracking have been IGNORED, until now when it may affect
the wealthy and the banks…we utilize products and transportation that is heavy on petroleum because
that make banks and oligarchs a lot of money, and they'll kill public transportation to get moar.
I do not plan to have another car and the GFC reduced my consumption significantly, probably more
than 50% because my truck was a '56 GMC half ton, and rather than the ACA I just plan to go die
when the time comes, and live the best life I can until then.
trees don't grow to the sky. There is a maximum volume of humans that the planet will tolerate,
and we seem to be fixated on finding out what that number is.
…and not to be too much in your face sorry but it's probably easy to knock off 50% of petroleum
usage in the same way that I have for most people, and I agree petroleum serves a mighty purpose
in our situation as it is
"... Once that pressure is down the dribbles that gravity will draw through those tiny cracks will still be tiny dribbles with twice as many cracks. Refracking wont do much to increase the gas pressure around a gas depleted horizontal run. ..."
This is a guest post from
WebHubbleTelescope
. Here he provides a simplified explanation of his Oil Shock Model as applied to oil production
from the Bakken formation. Previous contributions to THe Oil Drum from WHT can be found
here and
here .
My premise for participating was that I wanted to see how far I could get in understanding our
fossil fuel predicament by applying the mathematics of probability and statistics. There were enough
like-minded individuals that it turned out to be a productive exercise, and I found that even the
contrarian and cornucopian viewpoints could add value.
This was an ongoing process and I documented my progress with occasional posts on TOD and regular
posts on my blog http://mobjectivist.blogspot.com
. I treated the process as an experiment and as I collected more pieces of the puzzle, I realized
that I had collected enough information to aggregate it into a more comprehensive format.
After I finished the book (which incidentally I titled The Oil ConunDRUM as a nod to The Oil Drum)
the mobjectivist blog went dormant. I essentially treated that bog as a lab notebook, and I considered
that notebook was complete and finished as a historical record of what went into the book. So everyone
that mourns the closing of The Oil Drum has to remember that progress marches on, and something else
will spring from the analysis and research that went on here.
In passing, and as a short note to what one can do with some of the research that went into The
Oil Conundrum book, I thought to consider explaining how we can apply the Oil Shock Model to projecting
future Bakken formation production rates. Several TOD commenters have asked for a simple and intuitive
definition for how the shock model works, and it has always been a challenge to express it concisely.
In mathematical terms, it is simply the application of the convolution function to a model
of the statistical flow rate operating on the reserve potential of the reservoirs of interest.
The problem in casting it in this stark a mathematical form has been that the concept of convolution
is neither intuitive nor readily available to the layman. For example, the Excel spreadsheet application
does not have a convolution function in its toolbox of statistical operators. This is odd considering
that the great statistician William Feller once remarked that "It is difficult to exaggerate the
importance of convolutions in many branches of mathematics."
The best intuitive explanation that I can come up with is that a convolution (in the oil production
context) is a "sliding" summation of extraction applied to reserves.
Thus, the convolution algorithm automatically keeps track of older reserves as well as new reserves
as the total production accumulates with varying levels of extraction over time. Whether this is
completely intuitive to the layperson, we can always remember that a convolution is largely a cookbook
accounting exercise and once the form of the two inputs are known, a simple algorithm can be applied
to obtain a result.
For modeling the Bakken ala the convolution-based shock model, the inputs are two time-series.
The forced input is the time series of newly available wells.
The response input is the time series of expected decline from a single well.
The convolution function takes the forced input and applies the response input and generates the
expected aggregate oil production over time.
DC at his blog http://OilPeakClimate.blogspot.com/
has used this approach to good effect in modeling historical and projecting future Bakken production.
I apply a slightly different response function than DC and get this shock model output:
The two curves correspond to (1) the actual production data and (2) that which is modeled after
applying the convolution-based shock model to the well build-up, assuming a fairly rapid decline
response per well. The decline after month 714 would show what would happen if no new wells were
added. That of course won't happen, but it illustrates the Red Queen effect that Rune Likvern
has argued on these pages. The Red Queen hypothesis is that production will continue to increase
as long as a fresh supply of new wells with nominal reserve potential comes on line at a good pace.
As a detail, where DC and I differ is in how we apply the response model for the average well.
I have been applying a diffusional model based on the physics of flow, whereas DC has been using
a hyperbolic decline model which is favored by reservoir engineers. Not much of a difference between
the two, apart from gaining an understanding of what is actually happening underground, which is
likely an initially rapid diffusional flow followed by a the long tails of a diffusional decline.
As a caveat, the model would likely work even better if the North Dakota Department of Mineral
Resources had kept a cumulative total instead of an active count in their PDF table --
but as is the case with most of the data, you use what you can get.
The take-home point is that analysis approaches do exist outside of the insider oil patch knowledge-base.
Us mere mortals can formulate and apply these simple models to at least try to get a handle on future
fossil fuel supplies. That was the objective that I had when I started my blog and followed along
with TOD as we watched crude oil production plateau the last 9 years.
---
Doing this work on applying probability and statistics to the energy predicament has opened up
other possibilities which I have since pursued. Recently I have started up another blog on general
environmental modeling called http://ContextEarth.com
. This has an associated interactive modeling web server called the Dynamic Context Server, which
builds up from a semantically-organized knowledge-base of land, water, and atmospheric information.
I have incorporated the shock model as one of the functionalities in the server and intend to
maintain other capabilities to make it useful for environmental model activities, such as wind, solar,
and transportation simulations. Comments and collaboration opportunities are welcomed.
As you can see, The Oil Drum is only a start to the on-going energy transformation that we are
going through.
Any thoughts on how to incorporate price effects - e.g., the effect of the recent price hike,
which took Bakken production from it's former peak to a new growth phase?
The thinking is that the profit margin isn't that great and some have even speculated that
many operators will lose money. It sounds very similar to making a Hollywood movie -- all the
costs are eaten up during production with few films actually making money.
The early days include some wells that were borderline conventional wells, which made them
more competitive with other conventional wells in that timeframe. But there weren't many like
that, and it took the price increases to open up the rest to hydrofracturing technology.
Correction, in the last sentence: "But there weren't many like that".
I didn't want to edit and send it back into moderation. Sorry for delays in responding if I
include links. I have today off from work so can respond to questions quickly if no links are
involved.
In an ideal world, we'd have a single model that could project production for multiple price levels.
That is to say, something that in 1980 would have projected a ND peak of around 150k bpd under
a regime of $25 oil, and in 2007 would have projected a peak above 800k bpd for $90 oil.
My suggestion for these Bakken wells is to have a good model for when they get shut-in. That would
suggest the minimum level of production while still maintaining profitability.
You had the right scent when you brought up price but lost the trail with this last question.
It is the strong gas drive that makes these Bakken wells pay off quickly. Once that pressure
is down the dribbles that gravity will draw through those tiny cracks will still be tiny dribbles
with twice as many cracks. Refracking won't do much to increase the gas pressure around a gas
depleted horizontal run.
On the price thing, we can certainly evision that once a certain price threshold is achieved
somewhat less sweet spots will begin to pay and that those less and less sweet spots will encompass
greater acreage. More or less an inverse relationship between sweetness and area...but what we
can envision and the real facts under the ground might diverge wildly.
Oh and Web's diffusion light bulb came on when I posted this chart from the Great Bear site
Rock's comment on the chart was more or less that is was a crock as below a certain size crack
oil just wasn't going to have a significant increase in flow...but he kind of skipped mentioning
that gas flowed through those smaller cracks quite readily and that the increased gas drive those
cracks create might be the the real pay off.
This is a representation I made of the diffusional model:
The fissures are truly random pathways and the oil randomly walks to the collection point as
shown. They could just as easily travel away from the intended direction. It is true that the
pressure release enhances the flow but this flow is not as direct as a straight line. There is
really no control over the fissure formation.
The substantiation of this model is that the production follows a type of inverse square root
of time dependence, which is the signature of Fickian diffusion.
Look at the diffusion paper on the ContextEarth blog linked to above (go to Figure 17 shown
above to find the right section). Diffusional models are fairly general and can be used to describe
lots of applications. One of my favorite recent ones is that of Lithium ion battery charge and
discharge.
The math is very similar to oil flow, ions in the Lithium composite have to follow a random
walk to move between the anode and cathode. The random walk helps prevent the battery from discharging
(or charging) all at once.
It is really diminishing returns after the first fracturing attempt.
The model is one of diffusive flow, so if the volume is fractured one time, the second time
the fluid gets even more dispersed to points even further away from the collection points.
I have a paper describing diffusive flow on the ContextEarth server linked above that describes
the math.
They do refrac in some cases. While it is "diminishing returns", sometimes a refrac can increase
production enough to be worth the expense to the operator. However refracs probably won't change
the "big picture" of Bakken production all that much.
The technology of controlling fracs has become sophisiticated enough that in some cases the
refrac can open up new rock that wasn't fractured in the initial job. Or a refrac may help when
the original frac wasn't optimally done. See for example
Restimulating
the Bakken: What have we learned?
The model is one of diffusive flow, so if the volume is fractured one time, the second time
the fluid gets even more dispersed to points even further away from the collection points.
Your model may be diffusive flow and it may well mirror the actual oil and gas flow rates,
but what you must realize is the diffusion in fracking is the creation of the fractures themselves.
Once the big frac pumps shut down the fluids are not diffusing anymore, they are all following
the path of least resistance from a high pressure environment to a low pressure environment. And
that path is always little cracks feeding bigger cracks because bigger cracks relieve pressure
faster...as long as they stay open.
Wouldn't that be more like the reverse of diffusive flow just as much as tributary springs
flowing into brooks and creeks creeks, flowing into rivers and ultimately into the ocean is the
reverse of diffusive flow. Of course evaporation from those water courses and bodies is diffusive
flow and it does keep the cycle going but that is another story and is not what is happening in
a fracked well.
The pressure from the over burden is relentless and is always closing down fizzures pores that
no longer have enough fluid in them to push back. Its always a big squeeze out of any fluid that
can escape to low pressure areas just as long as the channels stay propped open. Refracking will
still have the liberated fluids attempt to leave high pressure environment for the low not disperse
them away from collection points for just as long as the refracking leaves open paths to the low
pressure zone.
I responded yesterday with an image from my paper but that got held up in moderation, so this
is what I said without the Figure 17 from the paper.
The fissures are truly random pathways and the oil randomly walks to the collection points.
They could just as easily travel away from the intended direction. It is true that the pressure
release enhances the flow but this flow is not as direct as a straight line. There is really no
control over the fissure formation.
The substantiation of this model is that the production follows a type of inverse square root
of time dependence, which is the signature of Fickian diffusion. I add an element of dispersion
to the flow which allows a range of diffusivities to the mix.
Look at the diffusion paper on the ContextEarth blog linked to above (go to Figure 17 to find
the right section). Diffusional models are fairly general and can be used to describe lots of
applications. One of my favorite recent ones is that of Lithium ion battery charge and discharge.
The math is very similar to oil flow, ions in the Lithium composite have to follow a random
walk to move between the anode and cathode. The random walk helps prevent the battery from discharging
(or charging) all at once.
"Wouldn't that be more like the reverse of diffusive flow just as much as tributary springs
flowing into brooks and creeks creeks, flowing into rivers and ultimately into the ocean is
the reverse of diffusive flow."
Once it gets to a river, that is definitely a gravity-fed flow. However, for tracing of flow
through porous media, hydrologists measure what are called breakthrough curves, and these are
largely diffusional flow with some gravity feed as well. I solved these dispersive transport equations
in The Oil Conundrum, and that is why it was fairly easy to make the connection to the Bakken
flow rates.
The Bakken flow is extremely diffusional because it has the strong diffusional spike at the
beginning followed by the fat-tails. Reservoir engineers use a heuristic curve called hyperbolic
decline, which happens to match the dispersive diffusional flow for a specific set of heuristic
parameters.
I could post some diagrams, but that would just go back in moderation, so I suggest you look
at the diffusional paper on the ContextEarth site and also The Oil Conundrum book where I have
a chapter on porous media dispersive diffusional flow.
The fissures are truly random pathways and the oil randomly walks to the collection points.
They could just as easily travel away from the intended direction. It is true that the pressure
release enhances the flow but this flow is not as direct as a straight line. There is really no
control over the fissure formation.
I never claimed the flow to be a straight line, the randomness of fissure direction is what
makes your diffusional flow math work, however the flow is not truly random. The fluids are moving
from high pressure to low pressure zones following the path of least resistance through open pathways
many of which only remain open because of the propant injected into the them.
The high initial flow after the first frac' job is generally very dependent on the gas drive.
That was my quibble when you described the diminishing returns of a refrac job to Nick. The first
frac' job will have found most of the larger natural fissures thus the bulk of the mobile fluids
in the horizontal well's sphere of influence. That is the main reason a second frac' would have
diminishing returns--there just won't be that much mobile gas and oil left for the horizontal
run to liberate--it wouldn't be because the new pathways opened will offer even longer routes
from high to low pressure zones or even that some of those longer routes lower pressure zones
will lead to already drained dead ends--though both are likely results of a second frac' job.
Unlike near surface water moving through porous medium fluids trapped in the Bakken medium
won't move much at all until a pressure differential is made available to them--a pressure differential
like the one created by frac'ed pathways leading to the horizontal collection pipe. As long the
pathways from higher to lower pressure remain open, the fluids will be travelling to low pressure
from high regardless how random the the direction of the pathway looks.
Without direct evidence that the flow is not random, the best we can do is look at the empirical
flow rates of a typical well. This seems to fit best either a diffusional flow profile or a hyperbolic
profile with a tuned exponent. The former is based on physics while the latter is a heuristic.
That essentially describes my model of the initial fracturing attempt.
Perhaps what happens on successive fracturing attempts is a moot point. The speculation is
the amount of oil rapidly diminishes -- but without some data to analyze, we are guessing as to
what the flow actually looks like.
I guess the next logical question is: is there a price for oil at which it would be worth drilling
new wells in between the old ones – In other words is there a price point at which well spacing
changes?
I'd argue that production is driven by profit rather than price. Consumption however is likely
pretty much a function of price.
If one assumes a required minimum return on capital OVER TIME profit and price then should be
causal but certainly not in the shorter run. What constitutes short run vs long run is related
to the nature of the project. Short run for somebody selling oysters is different from somebody
developing oil fields.
Correct me if I am wrong, but convolution is a cookbook technique for doing mathematically
what could be done with a lot of patience and a spreadsheet.
I produced this graph with a spreadsheet. Assume a well like the red line with production of
100, 60, 40, 30, 25, 20, ... in succeeding years (these numbers are just a guess for illustration,
not based on any real well), and open one new well a year. Then production will be as follows:
Yr 1: 100 total Yr 2: 60 + 100 = 160 total Yr 3: 40 + 60 + 100 = 200 total etc etc.
If I could do convolutions I could produce the totals 100, 160, 200, ... mathematically without
having to draw up a spreadsheet.
The accuracy of the model depends on two factors:
1. The correct shape of the well depletion curve.
2. The correct prediction of the number of wells drilled.
If sweet spots are drilled first one would expect individual wells to become less productive
with time, and the number of wells drilled to decrease. I presume these changes over time can
be modelled mathematically as well.
So, assuming WHT has done his sums correctly, and I believe he has, one's assessment of the
model must depend on one's assessment of how closely the depletion curves and drilling numbers
match reality.
I think these input factors should always be shown along with the final output curve.
Aa, you have the algorithm down about right for convolution.
In the context server that I mentioned, the calculation uses an expressive language whereby one
only has to write the phrase, A convolve B, to invoke a convolution. It is commutative so that
the order does not matter.
It is called the shock model since one can add perturbations, or slight shocks, to the extraction
rate as a final step. This is normally used for significant geopoltical shocks, as described in
Stuart Staniford's last post.
I am glad you got this piece written and my thanks to you and Joule for posting.
I find it helpful and will be pleased to follow your future 'experiments' with data in a variety
of fields!
That DC and Rune take a very similar approach to data is encouraging.
I await developments.
Even if I can 'follow' your logic, it does not mean that I could engage in creative or critical
discussion of methodology (!) but I am personally encouraged that you engage with 'entropy' as
a basis for your logic concerning probability, and that you appeal to known physical processes
such as diffusion in the case of tight-oil. All of which does indeed seem fundamental for the
outcomes we are interested in, if and when as you say the numbers are available.
Thanks again
Phil H
PS Can the 'shock' approach be used to test historical data retrospectively - e.g. perhaps
looking at USSR oil production, to test assumptions about industrial / technological / political
continuity, or indeed somewhat differently, effects of technology innovation? Perhaps to get a
handle on the size of 'shocks' and their effects? For the latter there is the example of USA tight-oil
extraction emerging during extraction from 'almost-conventional' oil-bearing formations, and then
expanding into a new phase with a new territory of opportunity. This was itself a 'shock', no?
"Can the 'shock' approach be used to test historical data retrospectively "
Certainly. In the book that I linked to, "The Oil Conundrum", I have more thorough examples
of how the shock model applies to historical geopolitical situations.
The Bakken example of this post is the simplest case of the convolution approach and so does
not incorporate the shocks of sudden changes to production levels.
A good example of a simple shock is looking at the historical UK North Sea production and then
consider the Piper Alpha incident. This caused a depression in extraction levels that the shock
model can approximate, resulting in the "dual hump" of UK oil production levels. This is also
described in the book.
This is an example of the shock applied to the UK production using the convolution-based shock
model:
The lower left is an extraction rate profile, which models the actual production level on the
upper right. The main point is that relatively small perturbations on the extraction rate leads
to noticeable changes in the production. The Piper Alpha caused both a reduction in that platform,
but also an overall reduction in the North Sea extraction as safety concerns propagated down the
line to other platforms.
As a caveat, the model would likely work even better if the North Dakota Department of Mineral
Resources had kept a cumulative total instead of an active count in their PDF table --
but as is the case with most of the data, you use what you can get.
I'm puzzled by this - do you mean cumulative production, or something else?
When a well stops producing it no longer shows up in the statistics. That makes it hard to tell
what the true cumulative is and how many new wells are being added. In other words, the running
total is new wells minus those removed, with no distinguishing between the two.
If you pay the N Dakota Department of Mineral Resources you can get the detailed records from
what I understand.
The given link did not bring me to a pdf file of the book.
(My books are free on line, but I'm a long ways up stream from you guys.)
To find my books, Google for Jon Claerbout books
Go to the menu item labeled The Oil Conundrum and that will take you to the PDF.
"The aim of every political constitution is, or ought to be, first to obtain for rulers men
who possess most wisdom to discern, and most virtue to pursue, the common good of the society;
and in the next place, to take the most effectual precautions for keeping them virtuous whilst
they continue to hold their public trust." -James Madison, FEDERALIST #57 (1787)
Actions of the company in cutting drilling and capex contradict rozy projections
Notable quotes:
"... Specifically, EOG has identified a decade of premium unconventional oil drilling inventory that will generate double digit returns at $30 oil. ..."
"... EOG expects to complete approximately 270 net wells in 2016, compared to 470 net wells in 2015, with total company crude oil production expected to decline only 5 percent versus 2015. ..."
"... For 2 yrs in a row, EOG has now cut its capital budget by more than 40%. 2016 spending will be $2.4-$2.6bn, down 45% to 50% year-over-year. ..."
"... EOG wont be fooled again by a temporary oil price uptick like in spring-2015, so the company plans to wait on any activity increase until it is convinced any future increase in oil price is sustainable. ..."
For EOG, $40 is becoming the new $70. This morning, the company discussed a new strategy to make
unconventional oil development in US plays like the Eagle Ford and the Permian Basin competitive
on a global scale at current oil prices. Specifically, EOG has identified a decade of premium unconventional
oil drilling inventory that will generate double digit returns at $30 oil.
Backed into a corner
by lower cost producers in a global price war, EOG essentially just yelled a battle cry at OPEC on
behalf of US shale, implying they will make unconventional oil just as cost effective as OPEC barrels.
EOG Resources is light years ahead of its peers in shale science and acreage quality, and its
ambitions may not be repeatable industry-wide, although others will certainly try. EOG is to shale
what Saudi is to OPEC - uniquely advantaged relative to other peers/members.
... ... ...
EOG has identified more than 2 billion barrels of oil equivalent resource, and over a decade
of drilling inventory (3,200 wells) that can generate returns of 10% at $30 oil, 30%+ at $40 oil,
and 100%+ at $60 oil. The company is shifting into premium drilling mode, concentrating on the
core-of-the-core in top plays.
... ... ...
In addition to the new strategy, some key takeaways from EOG's 2016 plan:
EOG expects to complete approximately 270 net wells in 2016, compared to 470 net wells
in 2015, with total company crude oil production expected to decline only 5 percent versus 2015.
For 2 yrs in a row, EOG has now cut its capital budget by more than 40%. 2016 spending
will be $2.4-$2.6bn, down 45% to 50% year-over-year.
Non-premium inventory is still high quality. A large portion will be converted to premium
through technology over time. What can't be converted will be part of property sales or trades.
EOG is delaying the work schedule on some frac spreads from 7 to 5 days a week in order to
maintain more fleets so they will have the ability to ramp in the future.
EOG won't be fooled again by a temporary oil price uptick like in spring-2015, so the
company plans to wait on any activity increase until it is convinced any future increase in oil
price is sustainable.
Since the Gazprom long-favored pipeline project South Stream by the end of 2014 due to the European
resistance was abandoned, Russia tirelessly seeks for new Pipelinevarianten to secure its dominant
position in the lucrative European market. It also tries to hedge supplied. But suppied to Chinese
market are not so quick to occur.
From the point of view of the Russians, time is short, because the Kremlin and Gazprom have decided,
the problematic gas transit through Ukraine to Europe from 2019 to shut down, and on other routes
to redirect. The fundamental plan does not change, even if Russia's energy Minister last week in
an Interview with the "world" did not exclude "that part of the deliveries to continue over the Ukraine
is running".
As a substitute for South Stream was Russia has been an Alternative at the ready: the "Turkish
Stream" Pipeline should Gas through the Black sea and via Turkey to the EU border. But it has not
been more than a flash in the pan, because the project since the Russian-Turkish upheavals of the
past few months has been put on hold.
New Pipeline plans to increase the pressure on Brussels
The revival of the Poseidon Pipeline is therefore to become more important. Also as a Signal to
the Mediterranean countries. The namely were recently very angry about the Gazprom group, the majority
of its energy in the intended Expansion of the Nord Stream Baltic sea pipeline (Nord Stream 2) to
Germany to invest in it.
Nord Stream 2 should the Plan to the existing capacity of 110 billion cubic meters of double,
which the majority of Europe in particular Russian gas in Germany would arrive. For comparison: ITGI
Poseidon has the original concept after only eight billion cubic meters of capacity, equal to one
tenth of the German annual consumption. In total, Gazprom delivered in the previous year 158,56 billion
cubic meters of Gas to Europe and, thus, eight percent more than in the weak Exportjahr 2014.
For Nord Stream 2 has Gazprom, with Shell, BASF, E. on, very interesting to count and OMV five
leading European gas companies for a consortium and won the support of individual EU member States.
The EU Commission is, however, resists this project, because it is a violation of the EU energy Package,
and sees the dependence on Russian Gas supplies anyway would rather like to reduce. With the Poseidon
project would have Gazprom at least a small lever to the participants of Nord Stream 2 to get your
pressure in Brussels to increase.
Heinrich, you say: "I am still behind my forecast as I think the fundamentals even have improved
over the last half year (future markets went into backwardation)."
I think that you are talking
about nat gas. But, backwardation is when the front months are priced higher than the back months.
And, that generally would be bullish because the market is saying I need the product NOW. So, if
you put it into storage, you will lose money because the future price is lower.
Contango [sometimes referred to as a carry market] appears to be in place for nat gas. Contango
is when the front months are priced lower than future months. That is generally bearish because the
market is telling you that it does not want the product NOW. So, it tells you to put it into storage
now and sell it in the future for a higher price.
Full contango is when the higher amount that you
receive in the future is greater than your cost of money + storage fees. When it is much larger than
that, the market is telling you that it is getting harder to find storage and you may just have to
stop producing. Think of like right now putting excess oil into floating tankers – a very high cost,
but worth it if the contango is great enough.
Obviously, there are other factors involved, but the above should give you the general idea. Many
people look at contango and, erroneously I believe, think that it is primarily telling you that people
are speculating that the price will rise in the future.
"... When Bubbles pop it almost always takes a full generation for investors to get interested again. It takes a new generation of suckers to buy into the next bubble. 2015-2014 was the peak in energy investment (adjusting for inflation of course). ..."
"... We very well will see Oil prices much higher in the future, but its not liking to influence CapEx as it did over the past decade. Most investors now see investing in energy too risky. We are likely to see some another round of banking trouble. ..."
"... This is like the Gold rush of the 19th century that lead to ghost towns. Banks will be holding on to retail and homes in oil boom towns that they won't be able to sell at virtually any price. ..."
"... I think the biggest losers in the Shale boondoggle is going to be pension funds, that were desperate for yield after they got clobbered in the 2008 housing bubble and the extreme low interest rates of the Bernanke years. They piled into energy hoping to make up for decades of losses. Now they will need to go ultra-conservate as boomers are now retiring and withdrawing thier pensions. ..."
"... We are already now on a permanent decline trajectory, really it was the US drilling that permitted global oil production to rise. Now we are 7 years further down the depletion road, and no mitigation plans in place. At some point in-fill drilling at the super-giants is going to come to end, and Oil majors will no longer be able to maintain output. Once these large fields rollover, no amount of drilling is going to prevent a global decline. I am sure that at or before 2020 arrives the majority of the super-giants be rolling over into significant declines. ..."
"... We are now in a permanent economic decline. The world economy had been propped up by developing nation borrowing (ie Brazil, China, India) and now they reached Peak Debt. Trying to add more debt, is just pushing on strings and lead to greater deflation & economic contraction. There is no more Chinas, Brazils, or Indias to kick off more infrastructure spending. The West is rapidly sinking as it can no longer stimulate economic growth and can no longer export goods and services to the BRICs. ..."
"... They are not going to like their increased living standards taken from them during the same lifetime that saw the increase. Brazil should be the poster child for this situation as the fall in its industrial production since the price crisis is nothing short of horrific. ..."
"... Time always answers these questions, but if 2015 is the peak, we will not see significant decline (more than 2 Mb/d) before 2030 unless there is a shock ..."
"When the oil price rises we will return to 2015 output levels
or higher by 2022 to 2025."
When Bubbles pop it almost always takes a full generation for investors
to get interested again. It takes a new generation of suckers to buy into
the next bubble. 2015-2014 was the peak in energy investment (adjusting
for inflation of course).
We very well will see Oil prices much higher in the future, but its
not liking to influence CapEx as it did over the past decade. Most investors
now see investing in energy too risky. We are likely to see some another
round of banking trouble. Even if banks have limited exposure to Oil&Gas
debt, they still likely loaned out money to workers that bought homes, or
business that started in the Boom towns. This is like the Gold rush
of the 19th century that lead to ghost towns. Banks will be holding on to
retail and homes in oil boom towns that they won't be able to sell at virtually
any price.
I think the biggest losers in the Shale boondoggle is going to be
pension funds, that were desperate for yield after they got clobbered in
the 2008 housing bubble and the extreme low interest rates of the Bernanke
years. They piled into energy hoping to make up for decades of losses. Now
they will need to go ultra-conservate as boomers are now retiring and withdrawing
thier pensions.
[US Auto workers, FedEx/UPS, Teacher Unions, Trucking Unions, State and
City workers across the country are facing severe pension cuts soon]
We are already now on a permanent decline trajectory, really it was
the US drilling that permitted global oil production to rise. Now we are
7 years further down the depletion road, and no mitigation plans in place.
At some point in-fill drilling at the super-giants is going to come to end,
and Oil majors will no longer be able to maintain output. Once these large
fields rollover, no amount of drilling is going to prevent a global decline.
I am sure that at or before 2020 arrives the majority of the super-giants
be rolling over into significant declines.
We are now in a permanent economic decline. The world economy had
been propped up by developing nation borrowing (ie Brazil, China, India)
and now they reached Peak Debt. Trying to add more debt, is just pushing
on strings and lead to greater deflation & economic contraction. There is
no more Chinas, Brazils, or Indias to kick off more infrastructure spending.
The West is rapidly sinking as it can no longer stimulate economic growth
and can no longer export goods and services to the BRICs.
At best the Worlds Central banks may turn to global scale QE, but that
won't fix the the mounting problems. Eventually we all become Venezuelans
& Greeks.
I harbor similar sensibilities about the global outlook, but then again
I tend to just look at things that way.
However, there is another way
of looking at things. For example, to many Indians the world has never looked
brighter. For many, they are just now starting to achieve what we might
consider middle class. The number of people who can afford to purchase a
gallon of gasoline each week has mushroomed over the past 20 years.
Here is an interesting graphic illustrating that trend from Reuters (2012)
"For example, to many Indians the world has never looked
brighter. For many, they are just now starting to achieve what we might
consider middle class."
Unfortunately I don't think is sustainable. I think there is a lot of
debt that is going to burn them. Same store in Brazil and China too. All
of them have seen some increased living standards. but is it sustainable?
no.
They are not going to like their increased living standards taken from
them during the same lifetime that saw the increase. Brazil should be the
poster child for this situation as the fall in its industrial production
since the price crisis is nothing short of horrific.
We should expect
civil unrest met with military repression during the upcoming 2016 Rio Olympics.
Graph of Brazil industrial production from Dr. Ed's blog
There have been bubbles in the past in the oil industry, but
with the exception of 1979 to 1983 (not a bubble, but a War) the declines
have been relatively short with sometimes a plateau of a few years. I believe
we will see a plateau for 5 years or so and then C+C output will rise by
1 to 6 Mb/d with a peak between 2020 and 2030 (2024-2026 is my best guess).
How much output rises will depend on oil prices and how consumers react
to the increase in prices. Higher oil prices will result in higher supply,
but those high prices may also destroy some demand.
Time always answers these questions, but if 2015 is the peak, we
will not see significant decline (more than 2 Mb/d) before 2030 unless there
is a shock (financial crisis or major war between Saudi Arabia and
Iran and/or Iraq). I cannot predict future shocks, but if someone wants
to go out on a limb and predict one, it can be modeled.
"... Despite all the Chinese slowdown talk, China is importing commodities at a record pace (see below the chart for natgas imports, which increased by over 100% year over year). ..."
Despite all the Chinese slowdown talk, China is importing commodities at a record
pace (see below the chart for natgas imports, which increased by over 100% year over year).
Although 6 bcf/d (or 1 mill boe/d) of natural gas imports are much lower than the 7 mill b/d
oil imports, the impressive growth rate reveals there is much room for future growth for natgas
exports here.
The main question remains if the US can produce enough natgas at low costs. 9 bcf/d is nearly
15% of US production. The US is currently still a net importer of natgas.
"... Lest anyone forget, if the number of additional wells does not increase in Bakken year-over-year, then the result will be as we showed in the last of The Oil Drum posts http://www.theoildrum.com/node/10221 ..."
Lest anyone forget, if the number of additional wells does not increase in Bakken year-over-year,
then the result will be as we showed in the last of The Oil Drum posts
http://www.theoildrum.com/node/10221
Individual Bakken wells have little long-term capacity, so that the decline effects are seen almost
immediately.
Per Baker Hughes, there are 45 onshore rigs drilling vertical wells in the lower 48, 44 oil and
1 gas.
Conventional onshore lower 48 oil and gas is dying.
It would be very interesting to me if we knew where those wells were being drilled.
It would also be interesting to me to get some idea of how many conventional oil and gas wells
have been shut in in the USA.
Wonder why, in this era of big data, no one is trying to gather that? Or maybe they are, and
aren't sharing? Genscape comes to mind.
There are an ever growing number of wells shut down where we are. A big jump since 1/1/16.
I know Wood Mac says little shut in, but when was that and where did they look? I know we are
high cost, so maybe its just us?
I suppose US conventional is so small, 2 million or so, that a percentage of it being shut
in is no big deal?
"... In any event. the idea that oil and natural gas will stay below $50 and $2.50 does not appear to be possible in my view. without one of the following: (1) substantially increased worldwide oil production; (2) substantially decreased worldwide oil demand. ..."
"... I think Ron has shown that 1. will be very difficult, he would say impossible. ..."
There are still a few relevant 10K's to be release by E & P companies for 2015.
However, thought
I would share some aggregate numbers from some large US E & P's. Keep in mind that these companies
mostly have overseas operations, and I am finding that the numbers with regard to PV10 are much
better for those assets than for US assets.
Anadarko, ConocoPhillips, Occidental Petroleum, EOG, Marathon Oil and Chesapeake account for
over 4 million BOE.
Ending 12/31/2015, total long term debt for these companies was $70.338 billion dollars.
Ending 12/31/2015, standard measure PV10 for these companies was $67.205 billion dollars, using
WTI of $50.28 and HH of $2.58.
In looking at smaller companies, I am finding that the majority have lower standard measure
PV10 than long term debt, and the few that are higher are barely.
Thus, preliminarily, it appears that the present value of future cash flows for US non-integrated
public oil and gas companies, discounted to 10% is less, in aggregate, than aggregate long term
debt for these companies, at $50.28 WTI and $2.58 HH.
Finally, given we are significantly lower on both WTI, and HH at present, I will note a few
companies have disclosed PV10 at lower price points. It appears to me that PV10 drops by about
50% at $30 WTI and $1.75 HH.
One can argue that in this low interest rate environment, PV10 is too high, we should use a
lower discount rate, which would push the values higher. I can see merit in that argument. However,
given the distress in the debt markets, E & P debt requires a very high premium to US Treasuries
in most instances.
In any event. the idea that oil and natural gas will stay below $50 and $2.50 does not
appear to be possible in my view. without one of the following: (1) substantially increased
worldwide oil production; (2) substantially decreased worldwide oil demand.
I think Ron has shown that 1. will be very difficult, he would say impossible.
So far, since 2005, world oil demand has only fallen one time year over year. That was 2008-2009.
Oil and natural gas prices have overshot, IMO, but the market can stay irrational much longer
than most can stay solvent.
Perhaps Moody's is reading your posts carefully here at POB. Here is a link to a Bloomberg
article that discusses Credit down grades for Exxon, ChevronTexaco,Marathon and ConocoPhillips.
Some (albeit vague) support for a growing day-by-day "glut deniers" movement :-) . The newer
part of the the argument revolves on fixed ratio of gasoline to distillate in refining process.
Which supposedly caused a growth of distillate inventories due to weather induced low demand :
In the last year, U.S. refiners have been fairly successful in matching gasoline production
and stockpiles with demand. Gasoline production remains at the centre of their operational
planning.
Crude stocks have continued to increase, reflecting worldwide oversupply, though stockpiles
are rising somewhat more slowly than at the start of 2015.
But refiners lost control of distillate stocks in the second half of 2015 as freight
demand slowed and El Nino ensured a warmer than normal winter across the United States and
other parts of the northern hemisphere.
Winter heating demand across the United States has been around 17 percent below average,
according to the National Oceanic and Atmospheric Administration.
And by the end of 2015, the volume of freight being moved across the United States by road,
rail, pipeline, barge and air had fallen by more than 2 percent compared with the same period
at year earlier.
Over the last four weeks, U.S. implied distillate consumption has averaged just 3.5 million
barrels per day, which is 12 percent below the long-term average and 16 percent below the same
period in 2015.
The fact that refiners have lost control of distillate stocks should come as no surprise
because distillate is essentially a by-product of gasoline production.
Refineries have operated to maximise gasoline production but in the process created an enormous
and growing oversupply of distillate.
There is some limited flexibility in the refining system to switch from distillate production
to gasoline but it is typically only on the order of a few percentage points.
Massive overproduction of distillate has pushed gross refining margins for the fuel to the
lowest level since 2010.
But refining margins for gasoline have been much healthier, at least until recently,
which has encouraged refiners to continue maximising crude throughput.
As long as gasoline demand remains strong, refiners will continue to meet it, which is why
the outlook for U.S. gasoline consumption is so critical for the oil market in 2016.
It always surprises me, that when people talk about the year on year drop in diesel consumption,
nobody mentions the fact of 1000 less drilling rig working, plus the lower demand from less fraccing,
the transport of train loads of sand per well, etc.
I would have thought, the EROI boys would be all over it. As I feel this is where the theory
of EROI being very low for unconventional oil and gas, actually starts to show up in day to day
numbers.
It always surprises me, that when people talk about the year on year drop in diesel consumption,
nobody mentions the fact of 1000 less drilling rig working, plus the lower demand from less fraccing,
the transport of train loads of sand per well, etc.
A 1984 study estimated the EROEI of the different oil shale deposits to vary between 0.7–13.3:1.[21]
More recent studies estimates the EROEI of oil shales to be 1–2:1 or 2–16:1 – depending on
if self-energy is counted as a cost or internal energy is excluded and only purchased energy
is counted as input.[20][22] According to the World Energy Outlook 2010, the EROEI of ex-situ
processing is typically 4–5:1
So we need 4.2 gallon per bbl.
The EIA estimates in the Annual Energy Outlook 2015, that about 4.2 million barrels per day
of crude oil were produced directly from tight oil resources in the United States in 2014.
So we are talking about 0.4 Mb/day of diesel consumption. Which is respectable 10% out of 4
Mb/d total US distillates consumption. So 2% drop (which amount to 20% drop of diesel consumption
in oil patch) might be fully attributable to the lower activity of shale patch.
The hypothesis is that in order to satisfy the glowing demand for gasoline the US distillers
overproduce distillates which go into storage and create the impression of the glut.
Notable quotes:
"... But refiners lost control of distillate stocks in the second half of 2015 as freight demand slowed and El Nino ensured a warmer than normal winter across the United States and other parts of the northern hemisphere. ..."
"... Over the last four weeks, U.S. implied distillate consumption has averaged just 3.5 million barrels per day, which is 12 percent below the long-term average and 16 percent below the same period in 2015. ..."
"... But refining margins for gasoline have been much healthier, at least until recently, which has encouraged refiners to continue maximising crude throughput. ..."
"... It always surprises me, that when people talk about the year on year drop in diesel consumption, nobody mentions the fact of 1000 less drilling rig working, plus the lower demand from less fraccing, the transport of train loads of sand per well, etc. ..."
Some (albeit vague) support for a growing day-by-day "glut deniers" movement :-) . The newer
part of the argument revolves around the fixed ratio of gasoline to distillate in refining process.
Which supposedly caused a growth of distillate inventories due to the weather induced low demand
:
In the last year, U.S. refiners have been fairly successful in matching gasoline production
and stockpiles with demand. Gasoline production remains at the centre of their operational
planning.
Crude stocks have continued to increase, reflecting worldwide oversupply, though stockpiles
are rising somewhat more slowly than at the start of 2015.
But refiners lost control of distillate stocks in the second half of 2015 as freight
demand slowed and El Nino ensured a warmer than normal winter across the United States and
other parts of the northern hemisphere.
Winter heating demand across the United States has been around 17 percent below average,
according to the National Oceanic and Atmospheric Administration.
And by the end of 2015, the volume of freight being moved across the United States by road,
rail, pipeline, barge and air had fallen by more than 2 percent compared with the same period
at year earlier.
Over the last four weeks, U.S. implied distillate consumption has averaged just 3.5
million barrels per day, which is 12 percent below the long-term average and 16 percent below
the same period in 2015.
The fact that refiners have lost control of distillate stocks should come as no surprise
because distillate is essentially a by-product of gasoline production.
Refineries have operated to maximise gasoline production but in the process created an enormous
and growing oversupply of distillate.
There is some limited flexibility in the refining system to switch from distillate production
to gasoline but it is typically only on the order of a few percentage points.
Massive overproduction of distillate has pushed gross refining margins for the fuel to the
lowest level since 2010.
But refining margins for gasoline have been much healthier, at least until recently,
which has encouraged refiners to continue maximising crude throughput.
As long as gasoline demand remains strong, refiners will continue to meet it, which is why
the outlook for U.S. gasoline consumption is so critical for the oil market in 2016.
Toolpush, 02/25/2016 at 10:40 pm
Amatoori,
It always surprises me, that when people talk about the year on year drop in diesel consumption,
nobody mentions the fact of 1000 less drilling rig working, plus the lower demand from less
fraccing, the transport of train loads of sand per well, etc.
I would have thought, the EROI boys would be all over it. As I feel this is where the theory
of EROI being very low for unconventional oil and gas, actually starts to show up in day to
day numbers.
It always surprises me, that when people talk about the year on year drop in diesel consumption,
nobody mentions the fact of 1000 less drilling rig working, plus the lower demand from less
fraccing, the transport of train loads of sand per well, etc.
A 1984 study estimated the EROEI of the different oil shale deposits to vary between
0.7–13.3:1.[21] More recent studies estimates the EROEI of oil shales to be 1–2:1 or 2–16:1
– depending on if self-energy is counted as a cost or internal energy is excluded and only
purchased energy is counted as input.[20][22] According to the World Energy Outlook 2010,
the EROEI of ex-situ processing is typically 4–5:1
So we need 4.2 gallon per bbl.
The EIA estimates in the Annual Energy Outlook 2015, that about 4.2 million barrels per
day of crude oil were produced directly from tight oil resources in the United States in 2014.
So we are talking about 0.4 Mb/day of diesel consumption. Which is respectable 10% out of
4 Mb/d of the total US distillates consumption. So 2% drop (which amount to 20% drop of diesel consumption
in oil patch) might be fully attributable to the lower activity of shale patch.
"... My level of knowledge in the oil world is too low, but from what I have seen in this blog we might be seeing a loss of 1 to 1.5 mbpd in 2016, depending on how much Iran is able to increase production. ..."
"... I guess then between 1 and 2 mbpd defines the possible loss of oil production in 2016. Is this a reasonable estimate? ..."
"... If Oil prices remain low 2015 will be the peak. I doubt oil prices will remain low after 2018. ..."
"... Not just discovery shortages, but the oil industry will have a severally compromised development capacity. It could barely overcome decline rates for conventional oil over the past 10 years, the LTO got developed at a loss, and about 30 to 40% of the industry is currently being laid off or shut down. ..."
"... I would love to see your rational for this. Who will return to 2015 output levels or higher? Obviously not everyone because so many nations have already peaked and are in decline. So for production to return to 2015 levels, and higher since you are not predicting peak oil until a decade or so from now, who will increase their production to well above 2015 levels? We know this will have to happen, for your scenario to be correct, because post peak nations will continue to decline regardless of price. ..."
Yes, OFM, I also shared Ron's opinion by late 2014 that 2015 was going to
be the year of Peak Oil.
But this is now a fact. Summer of 2015 (July for C+C, August for all
liquids) is a peak oil for everybody for as long as production doesn't start
increasing again. Since nobody is predicting an increase in production for
2016, the most fundamental issue in the oil world right now is how fast
is production going to fall and for how long.
My level of knowledge in the oil world is too low, but from what
I have seen in this blog we might be seeing a loss of 1 to 1.5 mbpd in 2016,
depending on how much Iran is able to increase production.
On the other hand people usually talk about a level of annual depletion
of around 6%. That's about 4.5 mbpd for the entire world, so if only half
of the world depletes at those rates we are talking upwards of a fall of
2 mbpd.
I guess then between 1 and 2 mbpd defines the possible loss of oil
production in 2016. Is this a reasonable estimate?
Not just discovery shortages, but the oil industry will have a severally
compromised development capacity. It could barely overcome decline rates
for conventional oil over the past 10 years, the LTO got developed at a
loss, and about 30 to 40% of the industry is currently being laid off or
shut down. There is no way it will be able to ramp up to about 150% of the
capacity it had say in 2013 to overcome accelerating decline rates and add
production on what will be ever more complex new fields (i.e. small, heavy,
deep water etc.)
When the oil price rises we will return to 2015 output levels or higher
by 2022 to 2025.
I would love to see your rational for this. Who will return to 2015 output
levels or higher? Obviously not everyone because so many nations have already
peaked and are in decline. So for production to return to 2015 levels, and
higher since you are not predicting peak oil until a decade or so from now,
who will increase their production to well above 2015 levels? We know this
will have to happen, for your scenario to be correct, because post peak
nations will continue to decline regardless of price.
So who will it be Dennis? Where will all this new production come from?
"... As much as 15 percent of the face value of high-yield bonds owed by U.S. oil producers and service companies could go into default this year, according to BCA Research. ..."
"... Trouble could radiate outward if banks, their balance sheets weakened by defaults in the oil industry, cut back lending to other enterprises. Says Nicholas Sargen, chief economist at Fort Washington Investment Advisors: "There are some people beginning to worry that this thing could spread like the subprime crisis. People said then that it was too small to matter, and then you find out there are linkages you didn't know about." ..."
"... In any case, oil prices this low aren't likely to last long. The market for crude is driven increasingly by high-frequency, computer-based momentum trading. In July, the CME Group-formerly the Chicago Mercantile Exchange-ended the 167-year history of actual humans trading commodity futures in open pits in Chicago and New York. Computer trading has proved more efficient, but not always better. "There was a governing quality of human input that's been lost in the market, that sort of prevented this kind of lunacy," says Dan Dicker, a former oil trader on the Nymex and president of MercBloc, a wealth-management firm. "People could only move but so fast." ..."
"... At the moment, says Kopits of Princeton Energy Advisors, "there's a weird disconnect between any kind of long-term fundamentals and current market values." Fundamentals tend to win out in the long run. Supply will be curbed as drillers drop projects that are unprofitable at $30 a barrel. And demand will accelerate; people are already driving more miles, albeit in more fuel-efficient vehicles. (A 2015 Ford F-150 pickup gets 30 percent better gas mileage on the highway than the 2005 model.) Oil traders spent most of 2015 increasing their bets that oil prices would fall. Since mid-January they have slightly pared their short positions and bought more contracts that gain value when oil rises. ..."
The market turmoil is shaking up companies as far afield as St. Louis-based
Emerson Electric, headed since 2000 by Chief Executive Officer David Farr. Emerson
makes products ranging from oil-production instruments to closet organizers.
"The last 30 days have been what I would call the most unusual in my time at
Emerson. I've never seen a marketplace go so volatile," Farr told analysts on
Feb. 2.
ExxonMobil is facing a potential
credit downgrade for the first time since the Great Depression. ConocoPhillips
is
cutting its dividend for the first time in a quarter-century. Energy stocks
account for 6.6 percent of the S&P 500's market value. While that's only half
their share of five years ago, it's still big enough for them to drag down the
overall index on bad days.
In 2014 the energy industry accounted for nearly one-third of S&P 500 companies'
capital expenditures, according to data compiled by Bloomberg. At least $1 trillion
in spending is getting canceled, says Steven Kopits, president of Princeton
Energy Advisors. When energy companies cut back, pipe makers, truckers, railroads,
and businesses in other industries suffer.
Goldman Sachs puts the chance of a recession in the
next year at 18 percent
Then there's the financial sector. Oil drillers borrowed heavily to expand
production, and many can't make money at today's superlow prices. As much
as 15 percent of the face value of high-yield bonds owed by U.S. oil producers
and service companies could go into default this year, according to BCA Research.
"The major risk banks have isn't to their normal retail-oriented stuff,
it's to the oil space," says Andrew Brenner, head of international fixed income
at National Alliance Capital Markets in New York. Markets were rattled on Feb.
8 after the Debtwire news service reported that Chesapeake Energy, the No. 2
U.S. natural gas producer, had hired a law firm to restructure a $9.8 billion
debt load. The company issued a statement saying it has no plans to pursue bankruptcy.
Trouble could radiate outward if banks, their balance sheets weakened
by defaults in the oil industry, cut back lending to other enterprises. Says
Nicholas Sargen, chief economist at Fort Washington Investment Advisors: "There
are some people beginning to worry that this thing could spread like the subprime
crisis. People said then that it was too small to matter, and then you find
out there are linkages you didn't know about."
How long will oil and stocks continue their doomed embrace? No one knows
for sure, but there are signs that emotion has gotten the better of investors.
Once things calm down, the underlying strengths of the U.S. economy could start
to become clearer. At that point, stocks could start to rebound even if-or because!-the
global glut of crude keeps oil prices low.
... ... ...
Synchronized plunges this extreme in stocks and oil usually indicate that
investors are expecting a U.S. recession, which would kill corporate profits
and demand for crude. But
how likely is a recession over the next year or so? Not impossible, but
not probable.
The most important indicator of economic health is employment. The U.S. created
151,000 jobs in January, less than in previous months but more than enough to
absorb the normal flow of entrants into the labor force. The unemployment rate
dropped to 4.9 percent, which the Federal Reserve considers full employment.
Average hourly earnings rose 2.5 percent from the year before. That's a real
pay raise for American workers, since it's above the inflation rate, yet it's
not so high as to get the Fed worried about an incipient wage-price inflationary
spiral. Meanwhile, companies show no sign of retrenching on employment: In December
listed job openings were the highest as a share of all jobs, filled and unfilled,
since record keeping began in 2000, according to data released by the Bureau
of Labor Statistics on Feb. 9.
Cheap oil, supposedly an economic threat, has done one good thing for the
U.S. economy and stocks. It's kept the overall increase in consumer prices through
December to just 0.7 percent. That could help persuade the Fed to throttle back
its plans to raise rates. On Feb. 10, Fed Chair Janet Yellen suggested that
further rate hikes would depend on whether the market turmoil persists. "Monetary
policy is by no means on a preset course," she
told Congress. Low rates are good for both the economy and Wall Street,
because stocks become a more enticing alternative when rates are low.
The bears are right that cheap oil is damaging high-cost producers around
the world, and some of those are in the U.S.
... ... ...
...The
bad parts of the oil plunge are hitting now: the credit downgrades, the
defaults, the
investment cutbacks, the layoffs of roughnecks. They're making news and
rattling people's confidence. "We've taken the big hit upfront," says Chris
Varvares, co-founder of St. Louis-based Macroeconomic Advisers. Eventually,
the money freed up by cheap oil will leak into other parts of the economy. When
oil prices crashed in 1986 and gasoline suddenly got cheap, it didn't show up
in the consumption numbers for more than a year, says David Rosenberg, chief
economist at Gluskin Sheff.
In any case, oil prices this low aren't likely to last long. The market
for crude is driven increasingly by high-frequency, computer-based momentum
trading. In July, the CME Group-formerly the Chicago Mercantile Exchange-ended
the 167-year history of actual humans trading commodity futures in open pits
in Chicago and New York. Computer trading has proved more efficient, but not
always better. "There was a governing quality of human input that's been lost
in the market, that sort of prevented this kind of lunacy," says Dan Dicker,
a former oil trader on the Nymex and president of MercBloc, a wealth-management
firm. "People could only move but so fast."
At the moment, says Kopits of Princeton Energy Advisors, "there's a weird
disconnect between any kind of long-term fundamentals and current market values."
Fundamentals tend to win out in the long run. Supply will be curbed as drillers
drop projects that are unprofitable at $30 a barrel. And demand will accelerate;
people are already driving more miles, albeit in more fuel-efficient vehicles.
(A 2015 Ford F-150 pickup gets 30 percent
better gas mileage on the highway than the 2005 model.) Oil traders spent
most of 2015 increasing their bets that oil prices would fall. Since mid-January
they have slightly pared their short positions and bought more contracts that
gain value when oil rises.
Barry White began
Can't
Get Enough of Your Love, Babe by saying, "I've heard people say that
too much of anything is not good for you, baby." Cheap oil is kind of like that
for the stock market. But with any luck, their dysfunctional dynamic won't last
much longer.
"The balance sheets of shale producers are in disrepair," said Mr Hess"
and
"Opec launched a price war against US shale and other high-cost producers, including Canadian
oil sands and Brazilian deep-water oilfields, in November 2014 by not reducing output despite
a global oversupply. Since then, oil prices have plunged by more than half, hitting a 12-year
low of about $26 on February 11.
In a rare admission that the policy hasn't worked out as planned, Mr El-Badri said that Opec
didn't expect oil prices to drop this much when it decided to keep pumping near flat-out.
Opec's strategy began to shift last week, when the oil ministers of Saudi Arabia and Russia
agreed to freeze their output at the January level, provided other oil-rich countries joined.
Mr El-Badri said the new policy will be evaluated in three to four months before deciding whether
to take other steps.
"This is the first step to see what we can achieve," he said. "If this is successful, we will
take other steps in the future." He refused to explain what steps Opec could take."
Opec launched a price war against US shale and other high-cost producers, including Canadian
oil sands and Brazilian deep-water oilfields, in November 2014 by not reducing output despite
a global oversupply. Since then, oil prices have plunged by more than half, hitting a 12-year
low of about $26 on February 11.
This para is in the article, but is apparently not a quote of anyone but the reporter. It's
not attributed in the article.
The rest is much like it. Exact quotes scarce. Interpretation-without-portfolio not scarce.
Not surprising. It's IHS/CERA week. They pour it onto the reporters.
"... With those sort or numbers, we will nearly be able to count the number of rigs drilling in the Bakken, on our fingers and toes! And if XTO cut their 5 rigs to similar to their competitors, we will! ..."
"... If these numbers hold, looking at as low a 900K bopd this summer from ND. ..."
With Halcon and EOG releasing 2016 guidance, estimate the following companies:
QEP, SM Energy, Enerplus, Continental, Marathon, Oasis, Hess, WPX, Whiting, Newfield, HRC Operating
(Halcon) and EOG…
will complete in between 200-250 Middle Bakken and/or Three Forks wells in 2016. This is just
an ESTIMATE, as the companies report this guidance in many different formats, and in gross and/or
net wells.
The remaining companies with rigs running are XTO, Burlington, Statoil, Liberty and PetroHunt.
I cannot find Bakken specific 2016 guidance for XTO (ExxonMobil) Burlington(COP) and Statoil.
If anyone finds this, please post it.
PetroHunt and Liberty Resources, I believe, are private companies. They each have just one
rig running.
The above companies, I believe, are the only ones running rigs in the Williston Basin at present.
Clearly, there are other companies that have, and that could have DUCS to complete in 2016. Anyone
with any information on those, please post.
FYI, it appears the bulk of the completions will occur in Q1.
With those sort or numbers, we will nearly be able to count the number of rigs drilling in
the Bakken, on our fingers and toes! And if XTO cut their 5 rigs to similar to their competitors,
we will!
Toolpush. Went over those numbers with Rune, he came up with a little higher number than me, so
I will revise that to 250-325. Still a very low number for the large number of companies involved.
If these numbers hold, looking at as low a 900K bopd this summer from ND.
As many as 74 North American producers face significant difficulties in sustaining
debt, according to credit rating firm Moody's Investors Service. Shale explorers
from Texas to North Dakota will be "decimated" in coming months amid a wave
of restructurings and bankruptcies, said Mark Papa, the former EOG Resources
Inc. chief executive officer who helped create the shale industry more than
a decade ago. The survivors will be more conservative, Papa, who is now a partner
at private-equity firm Riverstone Holdings LLC, said during a panel discussion
on Tuesday.
In any case, oil prices this low aren't likely to last long. The market for crude is driven increasingly
by high-frequency, computer-based momentum trading. In July, the CME Group-formerly the Chicago Mercantile
Exchange-ended the 167-year history of actual humans trading commodity futures in open pits in Chicago
and New York. Computer trading has proved more efficient, but not always better. "There was a governing
quality of human input that's been lost in the market, that sort of prevented this kind of lunacy,"
says Dan Dicker, a former oil trader on the Nymex and president of MercBloc, a wealth-management
firm. "People could only move but so fast."
"... Since the start of 2015, U.S. refineries have been processing record amounts of crude to meet strong demand for gasoline as continued growth, rising employment and cheap fuel prices have encouraged increased driving. ..."
"... U.S. gasoline stockpiles are currently 11 percent higher than normal for the time of year but if they are adjusted for strong gasoline demand then the surplus shrinks to 7 percent. ..."
"... Distillate stockpiles are currently 24 percent higher than the long-term average but once adjusted for weak consumption they are 43 percent higher than normal for the time of year. ..."
"... Modern U.S. refineries process up to 600,000 barrels per day, 300-1200 times as much as the first batch-based plants, though a more typical refinery has capacity of around 100,000 to 200,000 bpd. ..."
"... With the shift to continuous processing and the prodigious growth in demand for gasoline as a road fuel, the oil industrys need to hold stocks of unrefined crude and refined products surged. ..."
"... At the end of 2013, with the oil market more less balanced, more than 1.05 billion barrels of crude and refined products were being stored at refineries, distributors and oilfields as well as in pipelines and on tank farms. ..."
According to the U.S. government, there are over 1.3 billion barrels of crude oil and refined products
in commercial storage around the United States, an increase of more than 300 million barrels in the
last two years.
There is a tendency to assume all these barrels of crude and products are "excess"
inventories, the result of overproduction, but most of them are held for operational reasons.
The best way to distinguish excess inventories from normal operational stocks is to adjust reported
inventories for time of year, consumption of crude by refineries, and consumption of products by
end customers.
Other things being equal, the more crude refineries process every day, the more crude they need
to hold on site, at tank farms or en route to the refinery in pipelines and on ships to keep their
distillation towers supplied.
And the more fuel supplied to customers, the more refined stock refineries, blenders and distributors
need to keep on hand to deal with seasonal swings, maintenance and unexpected disruptions in the
supply system.
Since the start of 2015, U.S. refineries have been processing record amounts of crude to meet
strong demand for gasoline as continued growth, rising employment and cheap fuel prices have encouraged
increased driving.
U.S. crude stockpiles are currently 47 percent higher than the average over the last 10 years
but if stocks are adjusted for the higher rate of processing the surplus falls to around 34 percent.
The reported surplus in crude stocks over the long-term average is around 162 million barrels
but if stocks are adjusted for higher processing the surplus falls to around 128 million barrels
(tmsnrt.rs/20WQt9F).
U.S. gasoline stockpiles are currently 11 percent higher than normal for the time of year but
if they are adjusted for strong gasoline demand then the surplus shrinks to 7 percent.
The reported surplus in gasoline stocks over the long-term average is 26 million barrels but adjusted
for higher demand falls to 17 million barrels (tmsnrt.rs/20WQzhl).
Crude and gasoline stocks are somewhat less excessive than the unadjusted data suggests because
refinery processing and gasoline consumption have been so strong.
But distillate demand has been much weaker than normal thanks to sluggish demand from the freight
sector and El Nino.
Distillate stocks are much higher than the raw numbers suggest, once they are adjusted for the
current weakness in demand.
Distillate stockpiles are currently 24 percent higher than the long-term average but once adjusted
for weak consumption they are 43 percent higher than normal for the time of year.
The reported surplus in distillate stocks over the long-term average is 31 million barrels but
adjusted for weak demand the surplus surges to 48 million barrels (tmsnrt.rs/20WQE4M).
At this time of year, U.S. gasoline stocks are normally around 26 days worth of consumption, and
they are currently a bit higher at 28 days.
Distillate stocks should be around 32 days worth of consumption but are currently at a massive
46 days worth of demand.
CONTINUOUS PROCESSING
Early U.S. oil refineries processed crude in batches, with each batch of oil loaded separately
into a still, where it was heated until the distillates were boiled off, condensed and collected
for sale.
Early refineries were really just simple distilleries: the equipment would be instantly recognisable
to anyone who has been on a tour of a whisky distillery ("A practical treatise on coal, petroleum
and other distilled oils", Gesner, 1865).
The first U.S. refineries established during the 1860s and 1870s processed up to 2,000 barrels
per day, though most were much smaller and produced less than 1,000 barrels per day ("Early and later
history of petroleum", Henry, 1873).
Refineries were geared to produce a middle distillate boiling around 300-600 degrees Fahrenheit
which was sold as kerosene or paraffin oil and used for illumination.
Gasoline, with its lower boiling point, was too volatile to be used safely as lamp fuel and was
mostly considered a nuisance and waste product.
U.S. oil refineries eventually switched from processing crude in discrete batches to feeding oil
into distillation towers and drawing off the fractions in a continuous process.
Modern U.S. refineries process up to 600,000 barrels per day, 300-1200 times as much as the first
batch-based plants, though a more typical refinery has capacity of around 100,000 to 200,000 bpd.
The objective has switched from producing kerosene for lighting to producing gasoline for use
as a transportation fuel.
In the first decades of the 20th century, electric lighting began to reduce demand for kerosene
while the massive expansion in car ownership stimulated consumption of gasoline.
From 1915-1920 onwards, refineries were increasingly geared to produce gasoline as the main product,
while middle distillates became a by-product.
With the shift to continuous processing and the prodigious growth in demand for gasoline as a
road fuel, the oil industry's need to hold stocks of unrefined crude and refined products surged.
To ensure an uninterrupted flow of oil from the wellhead to the refinery and the end customer,
stocks of crude and refined fuels are held at every stage along the supply chain.
Refineries hold substantial stocks of crude to ensure a continuous flow of carefully prepared
(de-watered and de-salted) as well as blended crude into their distillation towers.
The industry also needs substantial stocks of refined fuels, lubricants and petrochemicals to
ensure a continuous supply to distributors and end users.
Refineries hold crude and refined products to meet routine operational requirements as well as
to deal seasonal variations in demand, planned maintenance and unexpected disruptions.
The amount of oil involved is enormous.
At the end of 2013, with the oil market more less balanced, more than 1.05 billion barrels of
crude and refined products were being stored at refineries, distributors and oilfields as well as
in pipelines and on tank farms.
By February 2015, with the oil market clearly oversupplied, crude and refined products in storage
had climbed to more than 1.33 million barrels, according to the U.S. Energy Information Administration
("Weekly Petroleum Status Report", EIA, Feb. 24).
OPERATIONAL PLANNING
In the last year, U.S. refiners have been fairly successful in matching gasoline production and
stockpiles with demand. Gasoline production remains at the centre of their operational planning.
Crude stocks have continued to increase, reflecting worldwide oversupply, though stockpiles are
rising somewhat more slowly than at the start of 2015.
But refiners lost control of distillate stocks in the second half of 2015 as freight demand slowed
and El Nino ensured a warmer than normal winter across the United States and other parts of the northern
hemisphere.
Winter heating demand across the United States has been around 17 percent below average, according
to the National Oceanic and Atmospheric Administration.
And by the end of 2015, the volume of freight being moved across the United States by road, rail,
pipeline, barge and air had fallen by more than 2 percent compared with the same period at year earlier.
Over the last four weeks, U.S. implied distillate consumption has averaged just 3.5 million barrels
per day, which is 12 percent below the long-term average and 16 percent below the same period in
2015.
The fact that refiners have lost control of distillate stocks should come as no surprise because
distillate is essentially a by-product of gasoline production.
Refineries have operated to maximise gasoline production but in the process created an enormous
and growing oversupply of distillate.
There is some limited flexibility in the refining system to switch from distillate production
to gasoline but it is typically only on the order of a few percentage points.
Massive overproduction of distillate has pushed gross refining margins for the fuel to the lowest
level since 2010.
But refining margins for gasoline have been much healthier, at least until recently, which has
encouraged refiners to continue maximising crude throughput.
As long as gasoline demand remains strong, refiners will continue to meet it, which is why the
outlook for U.S. gasoline consumption is so critical for the oil market in 2016.
I think unrevealing of the weakest shale is coming. Peace agreement
in Syria is signed today and it is huge and there is no need to keep War
party (from all sides) shackled with low prices any longer by keeping shale
on life support.
I think in the next few weeks or months certain things will be iron out
in terms of actual cuts from the major producers. No doubt that US production
is already in decline and could be even more than what EIA numbers are showing,
and it will be incorporated as official "cut" by US. But Saudis and Russians
will cut too. The first sign was that "freeze" negotiation a week ago in
Doha and it was building block.
Yeah Niami is still cooing "No cuts" but he is just bargaining. Last
week I thought it would be by summer but it could happen earlier.
No orders were unfilled at $100 either. It depends on level of production
unless it is coupled with major producers start prancing around refineries
and offering discounts like Saudis did and then everybody follows offering
discount. And once ball start rolling you end up with price from 1990's.
"The balance sheets of shale producers are in disrepair," said
Mr Hess"
and
"Opec launched a price war against US shale and other high-cost producers,
including Canadian oil sands and Brazilian deep-water oilfields, in
November 2014 by not reducing output despite a global oversupply. Since
then, oil prices have plunged by more than half, hitting a 12-year low
of about $26 on February 11.
In a rare admission that the policy hasn't worked out as planned,
Mr El-Badri said that Opec didn't expect oil prices to drop this much
when it decided to keep pumping near flat-out.
Opec's strategy began to shift last week, when the oil ministers
of Saudi Arabia and Russia agreed to freeze their output at the January
level, provided other oil-rich countries joined. Mr El-Badri said the
new policy will be evaluated in three to four months before deciding
whether to take other steps.
"This is the first step to see what we can achieve," he said. "If
this is successful, we will take other steps in the future." He refused
to explain what steps Opec could take."
The world's most powerful oilman brought a harsh message to Houston for executives hoping for
a rescue from low prices: high-cost producers -- many of them sitting in the room -- need to
either "lower costs, borrow cash or liquidate."
For the thousands of executives attending the IHS CERAWeek conference, the message from Saudi
Arabia oil minister Ali al-Naimi means deeper spending cuts, laying off more roughnecks and
idling drilling rigs.
"It sounds harsh, and unfortunately it is, but it is the most efficient way to rebalance
markets," Naimi told the audience in Houston on Tuesday.
... ... ...
Naimi told the executives in Houston that Saudi Arabia believed that freezing oil production
-- as it just agreed with Russia -- would be enough to eventually balance the market. Over time,
high-cost producers will get out of the business, and rising demand will slowly eat up the
oversupply, he said. The International Energy Agency believes that means another two years of low
prices.
The freeze agreement isn't "cutting production. That is not going to happen," Naimi said.
Venezuela, Saudi Arabia, Russia and Qatar have discussed holding a meeting in mid-March for
OPEC and non-OPEC oil producers that support the production freeze, Venezuela Oil Minister
Eulogio Del Pino said on Twitter. All oil producers are being consulted to determine where and
when the meeting will be held, Del Pino said. Venezuela has been lobbying for producers to
support prices, with Del Pino circling the globe to drum support.
... ... ....
While Naimi insisted that Saudi Arabia wasn't at war with shale, or any other producer, he was
clear in his aim. "We are doing what every other industry representative in this room is doing,"
he told the audience. "Efficient markets will determine where on the cost curve the marginal
barrel resides."
"It's going to be really, really ugly to get through this valley," Papa said.
Note they are the first I have seen to report PV10 with hedges, which
moves PV10 to $2.3 billion.
I wish they would disclose PV10 at various price points too.
Probably more note worthy, SM Energy's Q4 2015 oil production was down
14% from Q4 2014.
Also, their netback, pre hedges, was just $6 per BOE. That means Q1 netback,
pre hedges will be negative in all likelihood. They don't have a lot hedged
in 2016 compared to 2015.
"The world's second-largest oilfield services provider said last month it
cut nearly 4,000 jobs in the final three months of 2015. With the latest layoffs,
the company will have let go of nearly 29,000 workers, or more than a quarter
of its headcount since staffing reached its peak in late 2014."
"... Although these reports are very interesting, they ignore in my opinion financial conditions – mainly the bond market – and oil prices as major drivers for oil production. Jean Laherrere is fully aware of this fact, yet does not provide oil production scenarios at different oil price and bond market conditions. ..."
"... So, if oil prices would fall below 20 USD per barrel for a long period I am pretty sure, oil production for Bakken and Eagle Ford would tend to zero within a short time and all above production scenarios would be irrelevant. ..."
"... Possibly the availability of cheap money through most of 2015 overrode any price signals and they just kept on drilling no matter how much losses they incurred. You talking about a maturity wall now – how would that have impacted production in the past, especially when in the beginning of the price fall producers were expecting prices to recover at any time and later were concentrating solely in staying alive for the next month and couldnt afford to look much further ahead. ..."
"... Bottom line, there is about 25-30 Gb of combined URR in the Bakken/Three Forks(10 Gb), Eagle Ford(8 Gb), and Permian (9 GB, LTO only), but $80 to $150/b oil prices will be needed for it to be profitable to produce. If oil prices never rise above $80/b the URR will be about half this estimate. ..."
Although these reports are very interesting, they ignore in my opinion financial conditions
– mainly the bond market – and oil prices as major drivers for oil production. Jean Laherrere
is fully aware of this fact, yet does not provide oil production scenarios at different oil price
and bond market conditions.
So, if oil prices would fall below 20 USD per barrel for a long period I am pretty sure, oil
production for Bakken and Eagle Ford would tend to zero within a short time and all above production
scenarios would be irrelevant.
If oil prices would recover, production will start again.
Yet it is in my view not possible to sustain horrendous losses for a long time. Somebody has
to pay the bill. It is already clear now that high US oil production supports the US dollar, yet
brings the bond market to its knees. The bond – and equity holders are paying currently the bill,
yet for how long?
Might be so. If the production continues to follow the Hughes predictions though, I'd say that
will cast a lot of doubts over how much impact short term price swings have had.
Possibly the
availability of cheap money through most of 2015 overrode any price signals and they just kept
on drilling no matter how much losses they incurred. You talking about a maturity wall now – how
would that have impacted production in the past, especially when in the beginning of the price
fall producers were expecting prices to recover at any time and later were concentrating solely
in staying alive for the next month and couldn't afford to look much further ahead.
With data currently available the main message I've got from this is that there is probably
a lot less oil in the Bakken and Eagle Ford than EIA are saying – at any price.
Laherrere's estimate is too low. Hughes has a good estimate for the Eagle Ford, but I think
he may have assumed the USGS Assessment for the Bakken in April 2013 was for the TRR, but it was
the undiscovered TRR, when proved reserves and cumulative production (in Dec 2012) are
added, the TRR increases to 10 Gb and if probable reserves are also added the TRR becomes 11.4
Gb.
If we only consider proved reserves plus cumulative production we come close to Hughes estimate
for the URR of the Bakken/Three Forks, for the North Dakota Bakken/Three Forks this is about 6.7Gb
at the end of 2014.
Bottom line, there is about 25-30 Gb of combined URR in the Bakken/Three Forks(10 Gb), Eagle
Ford(8 Gb), and Permian (9 GB, LTO only), but $80 to $150/b oil prices will be needed for it to
be profitable to produce. If oil prices never rise above $80/b the URR will be about half this
estimate.
"... Go back to 2007. The total amount of subprime and Alt-A loans was about US$1 trillion. The losses in that sector ticked well above 20%. There, you had a US$1 trillion market with $200 billion of losses. ..."
"... Here we're talking about a US$5 trillion market with US$1 trillion of losses from unpaid debt - not counting derivatives. ..."
"... Some other companies are going to be fine because they bought the derivatives. But then, the question is: Where did those derivatives go? Think back to the housing bust. We now know that a lot of the derivatives ended up at AIG. ..."
The drop in the
price of oil
from approximately $100 a barrel to the
$40–60 range roughly constitutes a 40% decline or more.
That's extreme.
That's only happened three times in the past 70 years.
Oil
and other
commodities
are
volatile, but don't think for one minute that this is a normal fluctuation.
It's not. This would be like an 8,000 point drop on the Dow.
When the
oil price
dropped it came as a shock. No one expected it, other than maybe a
handful of people who were plotting it behind the scenes.
When the price of oil goes from US$100 to US$60, which as I said is extreme,
people say, 'Now it's going to go to US$50, then it's going to go to US$40 and then,
soon after, to US$30.'
You can't rule anything out, but it does look as if oil is going to oscillate
around US$60. It will go above that and below, but it will gravitate towards US$60.
That's still a big deal and will cause a lot of damage.
... ... ...
Oil below US$60 is more than low enough to do an enormous amount of damage in
financial markets.
Losses are already all over the place. We're only starting to learn about them
right now.
But I guarantee there are major losers out there and they're going to start to
merge and crop up in unexpected places.
The first place losses will appear are in junk bonds. There are about US$5.4
trillion - that's
trillion
- of costs incurred in the last five years for
exploration drilling and infrastructure in the alternative energy sector.
When I say alternative I mean in the fracking sector.
A lot of it's in the Bakken and North Dakota but also in Texas and Pennsylvania.
That's a lot of money. It's been largely financed with corporate and bank debt.
When many oil producers went for loans, the industry's models showed oil prices
between US$80 and US$150.
US$80 is the low end for maybe the most efficient projects, and US$150 is of
course the high end.
But no oil company went out and borrowed money on the assumption that they could
make money at US$50 a barrel.
So suddenly, there's a bunch of debt out there that producers will not be able to
pay back with the money they make at US$50 a barrel. That means those debts will need
to be written off. How much? That's a little bit more speculative. I think maybe 50%
of it has to be written off. But let's be conservative and assume only 20% will be
written-off.
That's a trillion dollars of losses that have not been absorbed or been priced
into the market.
Go back to 2007. The total amount of subprime and Alt-A loans was about US$1
trillion. The losses in that sector ticked well above 20%. There, you had a US$1
trillion market with $200 billion of losses.
Here we're talking about a US$5 trillion market with US$1 trillion of losses
from unpaid debt - not counting derivatives.
This fiasco is bigger than the subprime crisis that took down the economy in
2007. I'm not saying we're going to have another panic of that magnitude tomorrow;
I'm just trying to make the point that the losses are already out there.
Even at US$60 per barrel the losses are significantly larger than the subprime
meltdown of 2007. We're looking at a disaster.
On top of those bad loans, there are derivatives
Some of these fracking companies are going to go bankrupt. That means you may have
equity losses on some of the companies if they didn't hedge. Then, many frackers
issued debt which is going to default. That debt, whether it's bank debt or junk bond
debt, is going to default.
Some other companies are going to be fine because they bought the derivatives.
But then, the question is: Where did those derivatives go? Think back to the housing
bust. We now know that a lot of the derivatives ended up at AIG.
AIG was a 100-year-old traditional insurance company who knew that they were
betting that house prices would not go down. Goldman Sachs and a lot of other
institutions were taking opposite bet. When house prices did go down, everyone turned
to AIG and said: 'Hey, pay me.'
But AIG of course couldn't pay and had to be bailed out by the US government to
the tune of over US$100 billion. That's the kind of thing we're looking at now. These
bets are all over the place, because nobody thought oil was going to go to US$60 or
lower.
The losses are going to start to roll in, but they'll come in slowly. I'm not
suggesting that tomorrow morning we're going to wake up and find the financial system
collapsed. This is just the beginning of a disaster. The first companies to be
hardest hit will be second tier or mid-tier drilling and exploration companies.
Don't worry about the big companies. Exxon Mobil is not going go bankrupt. But
the smaller, higher cost producers with lots of debt will. With oil in the US$45–55
per barrel range, those projects are no longer profitable and that debt will begin to
default in late 2015 or early 2016.
"... JPMorgan said it will increase its reserves for oil and gas loans by 60%
in Q1 . ..."
"... As you can see from the following slide, provisions will rise by $500 million
from $815 million the bank had set aside as of the end of last year. Metals and
mining reserves will also rise, by $100 million. ..."
"... As is apparent from the chart, Dimon's "fortress" balance sheet includes
some $19 billion in HY O&G exposure. We're anxious to see if the vaunted billionaire
will dismiss the enormous writedowns that are invariably coming in the next few
quarters as a "tempest in a teapot." ..."
"... Take the case of Gusher National Bank. Gusher was very aggressive in making
loans to oil and natural gas companies that had no problem repaying their loans
when energy prices were high. The loans spelled big profits for Gusher, and everyone
agreed that Gusher's executives were smart business people who really knew how to
make money. ..."
"... Then the economy slowed down, and the demand for energy fell. Factories
burned less oil and natural gas. Truck drivers, commuters, and vacationers drove
fewer miles and burned less fuel. As a result, energy prices dropped sharply, and
many energy companies fell behind on their loan payments. Some even stopped making
payments altogether. ..."
"... Months passed, oil prices remained low, and more energy companies fell
behind on their payments. Finally, Gusher lost so much money to bad loans that government
regulators had to step in and close the bank. Gusher had fallen victim to changing
economic conditions-falling energy prices and a high concentration of loans to energy
companies. ..."
"... I work in the oil patch. Everyone is running with skeleton crews and the
effect on the greater economy- real estate, retail, construction etc is devastating.
I think the banks are fucked. If they do the prudent thing and cut off funding they'll
still be fucked. Therefore they continue to loan money. One day the dam will break.
..."
Most importantly, we said, are these follow up questions:
"How long before the impairments and charges currently targeting smaller
firms finally shift to the bigger ones? And how underreserved is
JPM for that eventuality? "
Today, just over a month later, we got the answer ahead of JPM's investor
day, when JPMorgan said it will increase its reserves for
oil and gas loans by 60% in Q1 .
As you can see from the following slide, provisions will rise by $500
million from $815 million the bank had set aside as of the end of last year.
Metals and mining reserves will also rise, by $100 million.
Note also that the bank says it may be forced to provision another $1.5 billion
should crude prices stay at or near $25 for an extended period of time.
As is apparent from the chart, Dimon's "fortress" balance sheet includes
some $19 billion in HY O&G exposure. We're anxious to see if the vaunted billionaire
will dismiss the enormous writedowns that are invariably coming in the next
few quarters as a "tempest in a teapot."
Page 31 has a section called 'Why Do Banks Fail" and tells a story of
a bank that invested highly in oil and gas assets and got destroyed when
the prices of oil dropped.
Gusher National Bank Slips on Falling Oil Prices
Falling energy prices mean cheaper gasoline and lower home heating
bills. So, falling oil prices must be good, right?
Not for everyone! Take the case of Gusher National Bank. Gusher
was very aggressive in making loans to oil and natural gas companies
that had no problem repaying their loans when energy prices were high.
The loans spelled big profits for Gusher, and everyone agreed that Gusher's
executives were smart business people who really knew how to make money.
Then the economy slowed down, and the demand for energy fell.
Factories burned less oil and natural gas. Truck drivers, commuters,
and vacationers drove fewer miles and burned less fuel. As a result,
energy prices dropped sharply, and many energy companies fell behind
on their loan payments. Some even stopped making payments altogether.
Months passed, oil prices remained low, and more energy companies
fell behind on their payments. Finally, Gusher lost so much money to
bad loans that government regulators had to step in and close the bank.
Gusher had fallen victim to changing economic conditions-falling energy
prices and a high concentration of loans to energy companies.
Are we absolutely sure we can't just package these loans up, break them
into tranches, stamp them "AAA" and sell them off to "investors"? Oh, and
let's get some CDSs going on these things, too. I'm sure we can find some
insurance company somewhere who's willing to take on that risk while holding
zero reserves against it.
Yes, and they can get Jon Corzine to head the Fund. I know he is available
to build a bridge to acquiring the financial and governmental backing to
get this thing done...
That's what's nice about being a loan officer; bag your commissions on
house loans, O&G loans, etc no matter how risky they are. By the time they
fail you are long gone, usually promoted up the ladder based on all your
great loan creations.
Wait till those mortgages in energy cities start defaulting as the robust
recovery in oil ripples out. The banks/loan companies will get a double
whammy::
Real Estate Prices in Dallas, Denver and Houston Set For a Fall
I work in the oil patch. Everyone is running with skeleton crews
and the effect on the greater economy- real estate, retail, construction
etc is devastating. I think the banks are fucked. If they do the prudent
thing and cut off funding they'll still be fucked. Therefore they continue
to loan money. One day the dam will break.
Banks with energy exposure are doing the same thing China is doing on
a larger scale... Papering over bad loans with more loans and hoping for
a hail mary surge in oil prices before carcasses start hitting the floor.
Little Johnny owes $100,000 for his liberal arts degree. He also purchased
a new Jetta with a 7 year auto loan and has racked up $15,000 in credit
card debt while looking for a job, which he has no luck finding so far.
He is now several months behind on payments. Seems like a good idea to
lend Little Johnny another $50,000 to keep up on his payments, right..?
I mean he's gonna find a job eventually. What could go wrong..?
"... In less than a month, the U.S. oil bust could claim two of its biggest
victims yet. ..."
"... SandRidge is likely to file for bankruptcy, analysts at junk bond research
firm KDP Investment Advisors Inc. wrote in a report last week. ..."
"... Since the start of 2015, 48 North American oil and gas producers have gone
bankrupt with a total of $17.3 billion in debt, according to law firm Haynes and
Boone. The largest was Samson Resources Corp., which entered Chapter 11 in September
owing more than $4 billion. ..."
"... Others are probably coming. The number of U.S. companies that have the
highest risk of defaulting on their debt is nearing a peak not seen since the height
of the financial crisis, according to a report by Moodys Investors Service earlier
this month. The oil and gas sector took up the biggest share, accounting for 28
percent, or 74 borrowers. ..."
"... Most of the shale industrys debt is in the form of bonds, according to
data compiled for the Bloomberg Intelligence index. Of those $197 billion of securities,
$101 billion is junk-rated. ..."
"... We are at the very beginning of the next wave of energy defaults, said
Paul Halpern, chief investment officer at Versa Capital Management, which manages
about $1.5 billion of distressed debt. ..."
"... For U.S. global investment banks such as Bank of America Corp., Citigroup
Inc. and JPMorgan Chase, funded exposures to the oil and gas industry range from
1.5 percent to 5 percent and average 2.3 percent of total loans, according to Moodys.
The ratings company also underscored risks for banks in energy-exporting regions
from the Middle East and Russia to Africa and Latin America. ..."
"... Goldman Sachs Group Inc. said about 40 percent of its oil and gas loans
and lending commitments are to junk-rated firms. ..."
"... The total exposure jumps $1.9 billion counting derivatives and other receivables,
which were primarily to investment-grade firms, Goldman Sachs said. The banks market
exposure to oil and gas firms was negative $677 million compared with $805 million
a year earlier. ..."
"... Goldman Sachss total is less than of its biggest competitors. Citigroup
Inc.s funded and unfunded commitments amounted to $58 billion, analysts at Susquehanna
Financial Group LLP wrote in a note last week. Most of Wells Fargo Co.s $17 billion
in outstanding energy loans is for companies that arent investment grade, Chief
Financial Officer John Shrewsberry said last month. ..."
"... Credit analysts at UBS say there are $1.2 trillion outstanding in loans
to the U.S. oil industry! A third of this debt is owed by exploration and production
companies. ..."
"... The oil industry also includes pipelines and infrastructure, refineries
…… ..."
"... So, it is clear that the total amount of debt maturing over the next 7
years stands at 1.2 trillion. ..."
"... I think $1.2 trillion is total debt owed by the US oil and gas industry,
not just loans. 1/3 of $1.2 trillion = $400 billion owed by the E P companies. This
includes bonds and bank loans. Bonds include junk bonds and investment grade bonds.
So $260 billion in junk bonds is the right number. ..."
SandRidge, Energy XXI missed interest payments due Feb. 16
Face $7.6 billion default if interest isn't paid by mid-March
In less than a month, the U.S. oil bust could claim two of its biggest
victims yet.
Energy XXI Ltd. and SandRidge Energy Inc., oil and gas drillers with
a combined $7.6 billion of debt, didn't pay interest on their bonds last
week. They have until the middle of next month to either pay the interest,
work out a deal with their creditors or face a default that could tip them
into bankruptcy.
If the two companies fail in March, it would be the biggest cluster of oil
and gas defaults in a month since energy prices plunged in early 2015.
"We're just beginning to see how bad 2016 is going to be," said Becky Roof,
managing director for turnaround and restructuring with consulting firm
AlixPartners.
The U.S. shale boom was fueled by junk debt. Companies spent more on
drilling than they earned selling oil and gas, plugging the difference with
other peoples' money. Drillers piled up a staggering $237 billion of borrowings
at the end of September, according to data compiled on the 61 companies
in the Bloomberg Intelligence index of North American independent oil and
gas producers. Oil prices have now fallen more than 70 percent from a 2014
peak, and banks and bondholders are fighting for scraps. U.S. high yield
energy debt lost 24 percent last year, the biggest fall since 2008, according
to Bank of America Merrill Lynch U.S. High Yield Indexes.
Both Energy XXI and SandRidge could still reach an agreement with creditors
that will give them time to turn their businesses around. SandRidge said
last week that it missed a $21.7 million interest payment. The company owes
$4.2 billion, including a fully-drawn $500 million credit line. Energy XXI,
which owes $3.4 billion, said in a filing last week that it missed an $8.8
million interest payment.
David Kimmel, a spokesman for SandRidge, said it has the money to make
interest payments due in February, March and April. He wouldn't comment
on SandRidge's options if it doesn't make the interest payments by the end
of the grace period.
The companies' failing to pay interest on their bonds may be a way to
help motivate creditors to renegotiate debt, said Jason Wangler, an energy
analyst with Wunderlich Securities in Houston.
"It's a negotiating tool," Wangler said. "They say, 'I'm not going to
pay you. Now what are you going to do?'"
Energy XXI owes $150 million to banks including Royal Bank of Scotland
Group Plc, UBS Group AG and BNP Paribas SA, among others. SandRidge has
fully drawn its credit line with banks including Barclays Plc, Royal Bank
of Canada and Morgan Stanley, according to data compiled by Bloomberg.
SandRidge is likely to file for bankruptcy, analysts at junk bond
research firm KDP Investment Advisors Inc. wrote in a report last week.
S&P wrote in a separate report that Energy XXI is probably going to file.
Since the start of 2015, 48 North American oil and gas producers have
gone bankrupt with a total of $17.3 billion in debt, according to law firm
Haynes and Boone. The largest was Samson Resources Corp., which entered
Chapter 11 in September owing more than $4 billion.
Others are probably coming. The number of U.S. companies that have
the highest risk of defaulting on their debt is nearing a peak not seen
since the height of the financial crisis, according to a report by Moody's
Investors Service earlier this month. The oil and gas sector took up the
biggest share, accounting for 28 percent, or 74 borrowers.
Most of the shale industry's debt is in the form of bonds, according
to data compiled for the Bloomberg Intelligence index. Of those $197 billion
of securities, $101 billion is junk-rated.
Bond investors aren't likely to recover much money from oil and gas companies
that default. Standard & Poor's estimates, for example, that Energy XXI's
and SandRidge's unsecured noteholders will receive, at most, 10 cents on
the dollar.
Banks are setting aside more money to cover potential losses on souring
energy loans. S&P estimates that credit lines to these companies could be
cut by 30 percent by April, when banks conduct one of their twice-yearly
evaluations of their loans.
"We are at the very beginning of the next wave of energy defaults,"
said Paul Halpern, chief investment officer at Versa Capital Management,
which manages about $1.5 billion of distressed debt.
Revenue generated by U.S. investment banks through their capital markets
businesses may "suffer" if oil and commodity prices stay low and the global
economy slows further, Moody's Investors Service has warned.
While direct energy loan exposures for the largest U.S. banks look "manageable
relative to earnings" and most of their exposures are to investment-grade
borrowers, additional loss provisions will be necessary in some cases should
oil remain subdued for an extended period, the credit assessor said in a
report dated Feb. 24. Moody's also warned that "lower-for-longer" oil prices
presented a rising threat for lenders around the world.
JPMorgan Chase & Co. said this week its reserves for impaired energy
loans would increase by about $500 million in the first quarter and it would
have to add an additional $1.5 billion to the set-aside if oil prices held
at $25 a barrel for about 18 months. Wells Fargo & Co., the world's largest
bank by market value, said Wednesday in a filing soured energy loans climbed
49 percent in the last three months of 2015, while higher oil-and-gas provisions
at Royal Bank of Canada crimped quarterly earnings.
"Oil price volatility has contributed to increased market volatility,
which could help boost trading activity and returns," Moody's said. "However,
current weak sentiment in global equity and credit markets could work in
the opposite direction, reducing trading volumes and banks' related revenues."
For U.S. global investment banks such as Bank of America Corp., Citigroup
Inc. and JPMorgan Chase, funded exposures to the oil and gas industry range
from 1.5 percent to 5 percent and average 2.3 percent of total loans, according
to Moody's. The ratings company also underscored risks for banks in energy-exporting
regions from the Middle East and Russia to Africa and Latin America.
"Banks' direct and indirect exposures to the drop in oil prices pose
the potential for deterioration in asset quality, particularly in net oil-exporting
countries," Moody's said. "While direct exposures appear broadly manageable
from both a solvency and earnings perspective, low oil prices could still
test the credit profiles of banks across our global rated portfolio."
Goldman Sachs Group Inc. said about 40 percent of its oil and gas
loans and lending commitments are to junk-rated firms.
The figure, which counts both loans made and future promises to lend,
accounted for $4.2 billion of a total $10.6 billion as of the end of December,
the New York-based bank said Monday in its annual regulatory filing. Goldman
Sachs has $1.5 billion in loans to energy companies rated below investment
grade and $2.7 billion in unfunded commitments.
The total exposure jumps $1.9 billion counting derivatives and other
receivables, which were "primarily" to investment-grade firms, Goldman Sachs
said. The bank's market exposure to oil and gas firms was negative $677
million compared with $805 million a year earlier.
Goldman Sachs's total is less than of its biggest competitors. Citigroup
Inc.'s funded and unfunded commitments amounted to $58 billion, analysts
at Susquehanna Financial Group LLP wrote in a note last week. Most of Wells
Fargo & Co.'s $17 billion in outstanding energy loans is for companies that
aren't investment grade, Chief Financial Officer John Shrewsberry said last
month.
Those bonds must be cumulative mustn't they – i.e. rolled over each year.
Otherwise that is about $1.3 trillion total. At (say) 5,000,000 bpd for
7 years at as high as $100 per barrel the companies would only be getting
$1.25 trillion total. Or am I missing something.
I'm going to predict a lot of bankruptcies in late 2017 as oil prices start
to rise because the lender's will suddenly see a lot more money in taking
over the resource base than by keeping the bond's rolling over.
….Credit analysts at UBS say there are $1.2 trillion outstanding
in loans to the U.S. oil industry! A third of this debt is owed by exploration
and production companies. And UBS predicts the default rate on these
loans could end up being in the low-teens…..
The oil industry also includes pipelines and infrastructure, refineries
……
In the above diagram it is also clearly stated:
The amount of bonds US energy companies below investment grade need to
pay back each year….
So, it is clear that the total amount of debt maturing over the next
7 years stands at 1.2 trillion.
"Credit analysts at UBS say there are $1.2 trillion outstanding in
loans to the U.S. oil industry! A third of this debt is owed by exploration
and production companies"
I think $1.2 trillion is total debt owed by the US oil and gas industry,
not just loans. 1/3 of $1.2 trillion = $400 billion owed by the E&P companies.
This includes bonds and bank loans. Bonds include junk bonds and investment
grade bonds. So $260 billion in junk bonds is the right number.
Besides, I have seen in various sources a similar number
Heinrich – I think I agree with Alex. The caption is wrong in the "per year"
bit, but correct in "below investment grade" – that is junk, which is not
the total debt to the oil industry by a long way (let's hope).
Yes, has anyone noticed swimming pools filled with oil in their neighborhood?
I haven't.
Why would anyone let oil go on a tanker and leave port unless they were paid for it?
Answer: They wouldn't. They get paid for it because they had an order for it and filled
the order. Why would they cut output and refuse to fill customer orders?
So who placed an order for oil they weren't going to sell to someone else who would
then burn it? Answer: No one did. They had customers and the customers placed orders
for it because they needed to burn it, and then took possession of it and burned it.
Why contort thinking on this? It's simple and clear.
"Why would anyone let oil go on a tanker and leave port unless they were paid for
it? "
This is a common practice. The tankers leave ports and can several times change
directions as the owner/seller of oil is trying to find the best buyer.
Interesting. How about offloading? That ever happen without paying the producer?
Because if the theory proposed here is all the storage is in tankers, you're going
to have to find about a billion barrels sitting unpaid for - all whilst KSA says
they produce what they have orders for.
About 20 to 25 of the world's 650 supertankers, which can hold two million
barrels and are called very large crude carriers, are in use as floating
storage,
That's 2 X 25 = 50 million barrels. The alleged oversupply of 3 mbpd for
20 mos (since June 2014) is 20 X 30 X 3 = 1.8 billion barrels.
There was never 3 mb/d oversupply, not to say for 20 months.
The oversupply peaked at 2.2-2.4mb/d in 2Q15, according to various estimates
(see the chart below).
From IEA OMR, January 2016:
"A notional 1 billion barrels of oil was added to global inventories
over 2014 – 2015 and our latest supply and demand balances suggest builds
will persist with up to 285 mb expected to be added to stocks over the
course of 2016. Despite estimations of current space storage capacity
and the outlook for significant capacity expansions over 2016, this stock
build will likely put midstream infrastructure under pressure and could
see floating storage become profitable. "
The volume in floating storage is a small part of total global inventories.
It can belong to producers (particularly, the NOCs) or to large traders.
Oil stored in tankers may belong to:
1) oil producers, particularly the NOCs (national oil companies). For
example, Iran's ~40 million barrels of crude and condensate stored
in tankers belongs to the Iranian national oil company.
2) oil traders, who have bought that oil and are storing it in tankers
in a hope that they could sell it later at a higher price.
Can you please explain how in oversupplied Europe Iran suddenly
found customers for more then 0.3 Mb/d (Italy, Greece and France;
Spain is next).
You should see inventories rising by the same amount because
according to the "oil glut" theory this oil can't be consumed, don't
you ? And 0.3Mb/d is 9 Mb/month. Most large oil contracts are long
term and you can't break them without penalties.
Also in the USA no producer with reasonably good quality oil
("sweet" with reasonable API gravity) has any difficulties selling
any volume he can produce. Moreover buyers ask for additional volumes.
Note the word "selling", not putting in storage at his own expense.
Theoretically within "oil glut" framework there is no place for
this oil to go other then in storage. And storage costs now are
very high in Continental US so there should be reasonable attempts
to minimize losses due to large amount of stored oil, which should
limit "new" oil buying.
So it looks like "glut theory" (which is essentially an extension
of neoclassical supply/demand model) has some serious holes in it.
"... There were massive capex budget cuts announced at several shale drillers today. Some of them cutting to around 20 percent of 2015s budget. ..."
"... Hess CEO, cannot make money at $50, let alone $30, going to run 2 rigs so dont have to disband the drilling department. ..."
"... I am thinking the attitude now is, You got us, we are toast without prices more than doubling. We may be seeing the capitulation we should have seen this time last year. ..."
"... Shale is going to take a dive in 2016, it appears. I suspect the straight holes in the USA took a dive in 2015, and it will get worse in 2016. ..."
"... The oil business is more about finances than most appear to recognize. For the near term (like the next 2-3 years) the developments will very much be related to the strength (or lack of) the oil companies balance sheets (as in assets/equities). ..."
"... Point being, at $30 WTI, PV10 is maybe a little more than half long term debt? Now lets apply that statistic to the entire US LTO industry. I sure hope we have hit capitulation combined with resignation that plans for almost zero activity for 2016 must be stuck to in the USA, despite any price uptick, for survival purposes. ..."
There were massive capex budget cuts announced at several shale drillers today. Some of them cutting
to around 20 percent of 2015's budget. CHK is planning on running 4-7 rigs in 2016 vs an average
of 28 in 2015 and 64 in 2014. WLL is anticipating 2 rigs in Niobrara and 2 in Bakken, an 80% cut
in capex from 2015. QEP is reducing capex from 1007 million in 2015 to around 450 to 500 million
in 2016, they will have one rig running in Pinedale, Permian, and Bakken with a fourth rig somewhere
later in the year. OAS is cutting capex from 610 million in 2015 to around 400 million in 2016.
CLR is also cutting substantially as well as reporting a sequential decline in 4th Q 2015 production
from 3rd Q.
One further thing to note about Whiting, making my conventional (vertical) decline point.
North Ward Estes CO2 flood
1/15 9,976 bopd, 11,901 mcfpd.
12/15 8,508 bopd, 9,902 mcfpd.
Hess CEO, cannot make money at $50, let alone $30, going to run 2 rigs so don't have to disband
the drilling department.
I am thinking the attitude now is, "You got us, we are toast without prices more than doubling."
We may be seeing the capitulation we should have seen this time last year.
An interesting observation about CHK's drilling plans, is they intend to only have one rig
in the Marcellus/Utica area, normally considered the most productive and prospective area, while
they will have 3 drilling in the Haynesville, normally considered past its prime.
I have to wonder if the lack of pipelines in the NE and the continuing delays in the approval
process, compared to available pipeline capacity, and full HH price, has any bearing on their
decision to stay with the Haynesville?
"North Dakota oil producer Whiting Petroleum Corp said on Wednesday it will suspend all
fracking and spend 80 percent less this year, the biggest cutback to date by a major U.S. shale
company reacting to the plunge in crude prices." … "Denver-based Whiting said it will stop fracking and completing wells as of April 1. Most of
its $500 million budget will be spent to mothball drilling and fracking operations in the first
half of the year. After June, Whiting said it plans to spend only $160 million, mostly on maintenance."
As I recall, the reason for TX revisions is due to new leases, primarily, and some slow reporting
by small operators, secondarily? So looking at conventional 12/15 should be fairly accurate, or
at lest 10-11/15 should be?
I looked at a few of the big conventional producers in TX, including Sheridan, Citation, Legacy,
Breitburn.
All big down YOY. SACROC is down, but Yates surprised me, it is up. Also, looks like XTO and
Chevron kept their big leases up, wonder if they will in 2016.
Shale is going to take a dive in 2016, it appears. I suspect the "straight holes" in the
USA took a dive in 2015, and it will get worse in 2016.
I know I am seeing more and more idle wells each week. They just aren't being pulled,
work over rigs stacked.
I assume there will be a lag till prices begin to rise, especially if KSA keeps trash talking.
The oil business is more about finances than most appear to recognize. For the near term (like
the next 2-3 years) the developments will very much be related to the strength (or lack of) the
oil companies balance sheets (as in assets/equities).
Gotta give CLR credit for providing this information. I hope many do.
CLR long term debt $7.118 billion.
Point being, at $30 WTI, PV10 is maybe a little more than half long term debt? Now let's apply that statistic to the entire US
LTO industry. I sure hope we have hit capitulation combined with resignation that plans for almost zero activity
for 2016 must be stuck to in the USA, despite any price uptick, for survival purposes.
"... Iron ore's rally – up 11 per cent over the past week – may not have much further to go but the days of rock-bottom prices are probably over, say analysts. ..."
Getting back to the market, the reason why they tend to fool us most of the time is because we don't
listen to its message in an unemotional way. If you're a commodity bull, you probably think the bottom
is in and this rally represents the start of a new bull market.
Jesse Livermore never used the words bullish or bearish. He thought they came with too many emotional
connotations. It made it more difficult for him to change tack when the market told him he was wrong.
He simply looked at a market or stock and worked out whether the trend was up, down or going sideways.
This told him what to do in an unemotional way.
Livermore was a pro. He made millions and lived the high life. He also lost his millions and ended
up with a bullet in his head. Put there by himself. The market, and life, broke him at the age of
63.
So don't think the market is easy. It doesn't hand out freebies to anyone. You have to work hard
and think harder to tame the beast. And it doesn't make it any easier reading the mainstream business
press, who regularly quote 'analysts' who change their mind with each change in the direction of
the price.
For example, the ongoing rally in the
iron ore price is predictably changing opinions. From the Financial Review:
'Iron ore's rally – up 11 per cent over the past week – may not have much further to go
but the days of rock-bottom prices are probably over, say analysts.'
Why are the days of rock bottom prices 'probably' over? As far as I can tell, it's simply because
the price has moved sufficiently away from 'rock bottom' to give confidence that it won't return
to rock bottom.
Top analysis, huh?
But when the herd moves, it moves on emotion, not on cold hard analysis.
Don't get me wrong, this could well be the bottom. But you need to see more evidence before increasing
your bets.
On the positive side for the commodity complex, US inflation numbers out late last week were higher
than expected. Core consumer prices rose 2.2%, the highest rate since 2012. So much for deflation…
Also providing some added fuel for the rally is the near record short position in US stocks. This
means that a large amount of traders are betting on further prices falls. According to Zerohedge,
it's the largest bet against the market since July 2008.
The problem with large 'short' positions in the market is that any bit of good news can spark
a big short covering rally. Short sellers have to buy back their shares at some point. That's how
they close out their positions. So an increase in short sales actually represents a lot of future
buying power.
This recent rally then could well be short sellers buying back their positions.
The most recent four week running average data (through Mid-February), show that US net crude
oil imports increased year over year, from 6.8 million bpd in 2/15 to 7.4 million bpd in 2/16. And
US net crude oil imports, as a percentage of C+C inputs into refineries, rose year over year from
44% last year to 47% this year (four week running average data).
And links to articles from last year and this year that discuss refiners' unhappiness with "Synthetic
WTI" blends of heavy crude and condensate:
"... WTI definition was changed to allow more shale output flow into Cushing. Inventory definition similarly changes and loses all valid comparison to history. There's no valid data on most of what's going on. ..."
WTI definition was changed to allow more shale output flow into Cushing.
Inventory definition similarly changes and loses all valid comparison to
history. There's no valid data on most of what's going on.
With US shale balancing of the verge of financial collapse this is a pure propaganda. This time
it is the US shale companies that are the weakest link and they will not last 2016 is oil prices stay
low. Wells can be reopened but shale well deteriorate so fast that it does not make much
sense. And you need money for drilling new wells. Who will finance this new shale boom after so many
players were burnt ?
Notable quotes:
"... Kuwait's struggles in the 1980s are instructive for anyone wondering whether producing countries can tinker their way out of trouble now. In the face of weak prices in the early years of the decade the OPEC production group introduced output cuts in an attempt to mop up oversupply. Kuwait slashed production from nearly 2 million barrels per day to about 600,000 bpd. The top producer Saudi Arabia made even costlier cuts. ..."
When Sheikh Ali Khalifa al-Sabah of Kuwait thinks about today's plunging oil prices, his mind drifts
back to the mid-1980s, when he was forced to sell some of his country's crude for as little as $5
a barrel.
As Kuwait's oil minister at the time, Sheikh Ali had to sell a cargo or two at that price
just to keep up cash flow to a country that depended upon oil revenues. "It wasn't because I wanted
to; it was because it was the market price," he recalls.
"We really had no alternative."
For oil industry players active during the 1980s bust, the current drop in prices carries echoes
of those desperate days. Interviews with some of those involved in that period reveal that while
there is little consensus on how long prices will stay depressed, experience suggests the current
market glut will not evaporate soon.
Representatives from all aspects of the energy industry will be mulling current low oil prices
and the supply glut this week during the IHS CERAWeek gathering in Houston.
Kuwait's struggles in the 1980s are instructive for anyone wondering whether producing countries
can tinker their way out of trouble now. In the face of weak prices in the early years of the decade
the OPEC production group introduced output cuts in an attempt to mop up oversupply. Kuwait slashed
production from nearly 2 million barrels per day to about 600,000 bpd. The top producer Saudi Arabia
made even costlier cuts.
Three factors dashed the plan: fellow OPEC members cheated on their own cuts; global thirst for
oil had dried up after price spikes in the 1970s pushed consumers to buy efficient cars; and new
supplies, particularly from non-OPEC Mexico, Norway, and Alaska threatened to squash gains from any
cuts.
By late 1986, Saudi Arabia and other OPEC members opened the taps again to regain market share,
and prices did not recover for 20 years.
The memory leaves Sheikh Ali, now 71, feeling grim about a price recovery this
time.
"Tomorrow if the price of oil goes down to $20 I would not be surprised," he said. "You don't
take excess oil away very quickly. It was true in the 1980s, now it's even worse."
... ... ...
Sheikh Ali estimated it will take seven to 10 years to emerge from the current slump. "The
idea that U.S. companies are going to collapse and therefore their production is going to zero is
daydreaming," he said. "Even the wells that have closed can easily re-open."
Saudi Arabia may no longer be the swing producer of global markets, but the United States is
now the world's "spring producer," Sheikh Ali said. Shale stands to put a long term damper on
global markets, because when oil prices rise even a little, North Dakota and Texas output can pop
back to market far easier than expensive deepwater or Alaskan production did decades ago, he
said.
Technology innovations keep pushing the cost of shale production lower. And the return of Iran's
oil exports after the lifting of sanctions also threatens to moderate prices.
The only problem with US exports is that the USA is net importer of oil. The USA definitely can
export condensate, as it does not has processing facilities for it, but that's about it. As for
"A prolonged period of low gas and oil prices will put heavy pressure on Russia" the USA shale producers
will go belly up first. Probably this year.
The same is true for natural gas. The USA remains a net exporter and shale production is dwindling
down quickly. Individual shipments does not change this picture.
Notable quotes:
"... The U.S. remains a net importer, but its demand for foreign oil has fallen by 32 percent since peaking in 2005. West Texas Intermediate crude traded at $33.34 a barrel at 8:51 a.m. on the New York Mercantile Exchange Tuesday, down 33 percent from a year earlier. ..."
"... "A prolonged period of low gas and oil prices will put heavy pressure on Russia in its relations with the West and of course low energy prices put tremendous strain on all exporters of hydrocarbons worldwide, on their government budgets," said Ted Michael, an analyst at Genscape Inc., an energy-market data and intelligence firm. ..."
"... Trafigura Group Pte Ltd. also sold West Texas Intermediate oil to a refinery in Israel, Ben Luckock, global head of crude oil at the commodity trader, said on Monday by e-mail. The 700,000-barrel cargo of U.S. benchmark crude will be delivered in March. ..."
"... Bloomberg has an article up by somebody saying that it is a "game changer" now that the US can ship oil all over the world to compete with OPEC. I would guess that the guy has never read anything by Jeffrey Brown. I think that he thinks that we are an Export Land in the model. ..."
"... There is so much ignorance out there that it is going to be a rude awakening when it happens. All these guys advising investors to sell everything related to fossil fuels because they are not making any money, but they think that they will make huge profits at $50 bbl. Except that when it does get to $50, it will plunge again because the huge flood of oil that will hit the market. What a joke. ..."
"... I think Bloomberg is mixing the export of condensate which is overproduced in the USA and does not fit the refineries tune up with the export of oil which might be a more challenging idea. ..."
"... It is unclear whether this is a "real" WTI or "artificial" WTI that the US refineries do not want. I think it is the latter. ..."
For the
Saudis and their OPEC cohorts, who collectively control 40 percent of the globe's oil supply, the
specter of U.S. crude landing at European and Asian refineries further weakens their grip on world
petroleum prices at a time they are already suffering from lower prices and stiffened competition.
With Russia also seeing its influence over European energy buyers lessened, the two crude superpowers
last week tentatively agreed to freeze oil output at near-record levels, the first such coordination
in a decade and a half.
... ... ...
Beyond corporations, the Dec. 18 lifting of the export ban by Congress and President Barack Obama
created geopolitical winners and losers, too. The U.S., awash in shale oil, has gained while powerful
exporters like Russia and Saudi Arabia, for whom oil represents not just profits but also power,
find themselves on the downswing.
The U.S. remains a net importer, but its demand for foreign oil has fallen by 32 percent since
peaking in 2005. West Texas Intermediate crude traded at $33.34 a barrel at 8:51 a.m. on the New
York Mercantile Exchange Tuesday, down 33 percent from a year earlier.
... ... ...
"A prolonged period of low gas and oil prices will put heavy pressure on Russia in its relations
with the West and of course low energy prices put tremendous strain on all exporters of hydrocarbons
worldwide, on their government budgets," said Ted Michael, an analyst at Genscape Inc., an energy-market
data and intelligence firm.
... ... ...
The Theo T was joined shortly after its trailblazing journey by a second ship out of Houston destined
for the Netherlands. How many tankers have sailed since won't be known until comprehensive data on
January's shipments is released by the U.S. Census Bureau in the coming weeks.
Trafigura Group Pte Ltd. also sold West Texas Intermediate oil to a refinery in Israel, Ben Luckock,
global head of crude oil at the commodity trader, said on Monday by e-mail. The 700,000-barrel cargo
of U.S. benchmark crude will be delivered in March.
What's already clear is that even with crude losing about 70 percent of its value since the middle
of 2014 amid a worldwide production glut and a slowdown in Chinese demand growth, buyers are happy
for the chance to diversify their sources of supply.
... ... ...
U.S. companies, led by Cheniere, have been spending billions of dollars on LNG export complexes where
the fuel is cooled to minus 256 degrees Fahrenheit (minus 160 Celsius) to shrink it to 1/600th its
volume so it can be shipped aboard ocean-going tankers. As a result, an international gas market
is emerging akin to the long-established one for the more readily transportable crude oil.
LNG
Exports
Houston-based Cheniere plans to begin LNG exports within weeks, after missing a January target
because of faulty wiring. The first tanker that will carry LNG from Cheniere's Sabine Pass terminal
in Louisiana has arrived. Asia Vision has moored at Sabine Pass, according to ship-tracking data
compiled by Bloomberg.
U.S. LNG cargoes, in combination with a bevy of new gas projects in Australia, will probably add
15 billion cubic feet of daily supply to global markets in the next few years, Genscape's Michael
said. That would be a 43 percent addition to the 35 billion currently bought and sold internationally.
Bloomberg has an
article up by somebody saying that it is a "game changer" now that the US can ship oil all
over the world to compete with OPEC. I would guess that the guy has never read anything by Jeffrey
Brown. I think that he thinks that we are an Export Land in the model. How can they not know
that, in effect, except for quality differences, we are just exporting oil that we imported from
Canada or some other place.
There is so much ignorance out there that it is going to be
a rude awakening when it happens. All these guys advising investors to sell everything related
to fossil fuels because they are not making any money, but they think that they will make huge
profits at $50 bbl. Except that when it does get to $50, it will plunge again because the huge
flood of oil that will hit the market. What a joke.
I think Bloomberg is mixing the export of condensate which is overproduced in the USA and does
not fit the refineries tune up with the export of oil which might be a more challenging idea.
Beyond corporations, the Dec. 18 lifting of the export ban by Congress and President Barack
Obama created geopolitical winners and losers, too. The U.S., awash in shale oil, has gained
while powerful exporters like Russia and Saudi Arabia, for whom oil represents not just profits
but also power, find themselves on the downswing.
The U.S. remains a net importer, but its demand for foreign oil has fallen by 32 percent
since peaking in 2005. West Texas Intermediate crude traded at $33.34 a barrel at 8:51 a.m.
on the New York Mercantile Exchange Tuesday, down 33 percent from a year earlier.
… … …
Trafigura Group Pte Ltd. also sold West Texas Intermediate oil to a refinery in Israel, Ben
Luckock, global head of crude oil at the commodity trader, said on Monday by e-mail. The 700,000-barrel
cargo of U.S. benchmark crude will be delivered in March.
What's already clear is that even with crude losing about 70 percent of its value since
the middle of 2014 amid a worldwide production glut and a slowdown in Chinese demand growth,
buyers are happy for the chance to diversify their sources of supply.
It is unclear whether this is a "real" WTI or "artificial" WTI that the US refineries do not
want. I think it is the latter.
The growth engine of Canada's energy industry is poised to shut off next decade, according to
the International Energy Agency.
Production gains from the oil sands in northern Alberta will slow dramatically or come to a halt
as crude prices remain low and costs too high for one of the world's most expensive sources of
oil, the agency forecast Monday in a report on the global medium-term crude market. Environmental
concerns, a lack of new oil pipelines and uncertainty about policy in Alberta are also causing
companies to slow development work, the report said.
... ... ...
The outlook for slowing oil-sands growth next decade comes as Canadian energy companies report
quarterly earnings results that display the full brunt of the market collapse. Narrowing refining
margins are no longer shielding producers such as Cenovus Energy Inc. from losses in their
upstream divisions. Companies are further lowering dividends, cutting jobs and setting aside
drilling rigs to contend with what Cenovus Chief Executive Officer Brian Ferguson earlier this
month called "hurricane-force" winds.
"... While the Saudis said Tuesday they don't plan to cut production, Pursell said the excess Saudi capacity is smaller than they claim. It's not "remotely possible" that Saudi Arabia is accurately reporting 12.5 million barrels of daily capacity, he said. In reality, it's likely no more than 11.5 million barrels. ..."
The price of oil may rebound to at least more than $40 a barrel relatively soon as supply and
demand come closer to balance, said EIA Administrator Adam Sieminski.
"I don't think we're that far away from it," he said.
David Pursell, managing director of Tudor, Pickering, Holt & Co. investment banking firm in Houston,
is particularly bullish. Companies are borrowing money to keep paying dividends to investors and,
in the process, they're canceling future projects. That leaves a big hole in future production, he
said.
... ... ...
While the Saudis said Tuesday they don't plan to cut production, Pursell said the excess Saudi
capacity is smaller than they claim. It's not "remotely possible" that Saudi Arabia is accurately
reporting 12.5 million barrels of daily capacity, he said. In reality, it's likely no more than 11.5
million barrels.
Jamie Webster, the senior director for global oil markets at IHS, said the oil crash was actually
expected to occur sooner than 2014. The Iranian sanctions and a sharp decline in Libyan production
simply delayed it, he said.
The next big question is what happens in April when a lot of energy companies go back to the banks
to negotiate debts and borrowing, Webster said. He expects banks to become much stingier.
"... The $45 is break-even for a lot of producers. Its not just about making a profit, its about staying alive, one trader said. ..."
"... Denbury Resources Inc ( DNR.N ), for instance, said on Thursday that it had recently increased its fourth-quarter hedges to cover 30,000 barrels a day at around $38 a barrel. ..."
"... a month earlier, Pioneers chief operating officer, Tim Dove, had told Reuters that the company would be looking for a minimum price of around $50 a barrel to lock in more hedging, but oils relentless rout may have softened that view. ..."
"... Matador Resources ( MTDR.N ) said this week it had added to its hedges over the past two weeks, but did not say by how much. It now has 43 percent of its estimated 2016 oil output hedged at weighted average floor and ceiling prices of $44 and $66. ..."
...Trading volume in over-the-counter oil swaps was more than five times higher than the past
three days combined, according to swaps data from the Depository Trust & Clearing Corp, available
via Thomson Reuters Eikon.
The re-emergence of hedging interest, which traders said was still limited in scope for now and
mainly in the form of inquiries rather than execution, came as a surprise to some, surfacing below
the $50 psychological threshold that some traders had thought would be needed to coax back producers.
The activity likely reflects both the growing investor and lender pressure to safeguard heavy
debt requirements down the road, as well as the fact that drilling costs continue to decline, allowing
companies to break even at lower prices.
"The $45 is break-even for a lot of producers. It's not just about making a profit, it's about
staying alive," one trader said.
... ... ...
Denbury Resources Inc (DNR.N),
for instance, said on Thursday that it had "recently" increased its fourth-quarter hedges to cover
30,000 barrels a day at around $38 a barrel.
"These are not great prices, but they protect our liquidity and will minimize our borrowings in
the event that prices are lower for longer, because these hedges are above our total current cash
costs," Chief Financial Officer Mark Allen told analysts.
... ... ...
Pioneer did not immediately respond to requests for comment. Just a month earlier, Pioneer's
chief operating officer, Tim Dove, had told Reuters that the company would be looking for a minimum
price of around $50 a barrel to lock in more hedging, but oil's relentless rout may have softened
that view.
Matador Resources (MTDR.N)
said this week it had added to its hedges over the past two weeks, but did not say by how much. It
now has 43 percent of its estimated 2016 oil output hedged at weighted average floor and ceiling
prices of $44 and $66.
"... The conclusion is US shale production is far less robust than the world of oil traders currently believes. ..."
"... My belief is US production is declining at a rate best described by Projection 2. This means the decline is trending in the lower channel and possibly the lower half of the upper channel. The less steep poly trend line also likely describes the situation well. ..."
It seems that EIA is doubling down on their faulty model for weekly US oil production estimates.
EIA continues to drive monthly production estimates up, at least through February, and in turn this
is supporting weekly overestimates of US production. In fact their latest monthly report estimates
production in the major US shale basins will exceed their previous January production estimate by
68k bbl/day. This is in direct conflict with dropping rig counts and more importantly falling
well completion rates reported by the states of Texas and North Dakota.
... ... ...
The conclusion is US shale production is far less robust than the world of oil traders currently
believes. If we have now moved into a mode where Unaccounted for Oil tends to be negative,
say -150k bbl/day every week, opposed to the normal +150k bbl/day every week, and this is just week
2 of a much longer streak of back to back negative values for Unaccounted for Oil, US production
could already be well under 9MM bbl/day and very rapidly falling toward 8MM bbl/day.
Below I'm including my updated 2016 US production + Unaccounted for Oil projection. I've
included a couple of my own linear projections as well as a couple polynomial trend lines.
My belief is US production is declining at a rate best described by Projection 2. This
means the decline is trending in the lower channel and possibly the lower half of the upper channel.
The less steep poly trend line also likely describes the situation well.
"... Opec's strategy began to shift last week, when the oil ministers of Saudi Arabia and Russia agreed to freeze their output at the January level, provided other oil-rich countries joined. Mr El-Badri said the new policy will be evaluated in three to four months before deciding whether to take other steps. ..."
"... "This is the first step to see what we can achieve," he said. "If this is successful, we will take other steps in the future." He refused to explain what steps Opec could take." ..."
"The balance sheets of shale producers are in disrepair," said Mr Hess"
and
"Opec launched a price war against US shale and other high-cost producers, including Canadian
oil sands and Brazilian deep-water oilfields, in November 2014 by not reducing output despite
a global oversupply. Since then, oil prices have plunged by more than half, hitting a 12-year
low of about $26 on February 11.
In a rare admission that the policy hasn't worked out as planned, Mr El-Badri said that Opec
didn't expect oil prices to drop this much when it decided to keep pumping near flat-out.
Opec's strategy began to shift last week, when the oil ministers of Saudi Arabia and Russia
agreed to freeze their output at the January level, provided other oil-rich countries joined.
Mr El-Badri said the new policy will be evaluated in three to four months before deciding whether
to take other steps.
"This is the first step to see what we can achieve," he said. "If this is successful, we will
take other steps in the future." He refused to explain what steps Opec could take."
"... Citing swaps data from the Depository Trust Clearing Corp., Reuters noted
that trading volume in over-the-counter oil swaps was more than five times higher
than the past three days combined. ..."
"... By the end of March, the U.S. shale industry will have a combined interest
bill due of $1.2 billion-some 50 percent of that owed by companies that have junk-rated
credit, according to Bloomberg . By the end of this year, $9.8 billion in interest
payments will come due for the shale industry. ..."
According to
Reuters, last Thursday, U.S. crude for December 2017 delivery fell more
than 2 percent to $43.47 per barrel, partly due to producer hedging. WTI for
2017 rose up to $43.55 per barrel, compared to January's record low of $37.38
per barrel.
Citing swaps data from the Depository Trust & Clearing Corp.,
Reuters noted that trading volume in over-the-counter oil swaps was more
than five times higher than the past three days combined.
The renewed hedging comes as shale interest payments are due in March, and
producers are under tough pressure to ensure they will be able to make good
on their debts.
By the end of March, the U.S. shale industry will have a combined interest
bill due of $1.2 billion-some 50 percent of that owed by companies that have
junk-rated credit,
according to Bloomberg. By the end of this year, $9.8 billion in interest
payments will come due for the shale industry.
Some have already missed their payments, including a $21.7 million interest
payment by
SandRidge Energy Inc., and an $8.8 million payment by Energy XXI Ltd. SandRidge
can apparently make the payment, but chose to make use of the 30-day grace period.
A total of 48 oil and gas producers have declared bankruptcy in North America
since January last year, leaving unpaid debts of some $17 billion,
according to HaynesBoone law firm.
As of the beginning of this year, we're looking at $325 billion in debt for
American's cash-flow negative producers,
according to ZeroHedge.
And banks are
getting a bit nervous because of all the pressure coming from investors
who aren't keen on the emerging default picture in the oil and gas industry-despite
the fact that most banks' overall portfolios only have 2-3 percent lending to
this sector. The KBW Bank Index has fallen 16.7 percent since the 1 January
2016.
According to the
Financial Times, America's 60 leading oil and gas companies have $200 billion
in debt-and counting.
'Within weeks, two low-profile legal disputes may determine whether an
unprecedented wave of bankruptcies expected to hit U.S. oil and gas producers
this year will imperil the $500 billion pipeline sector as well.
"... So far, relatively few oil and gas producers have entered bankruptcy, and most were smaller firms. But with oil prices down 70 percent since mid-2014 and natural gas prices in a prolonged slump, up to a third of them are at risk of bankruptcy this year, consultancy Deloitte said in a Feb. 16 report. ..."
"... Midstream operators have been considered relatively secure as investors and analysts focus on risks to the hundreds of billions of dollars in equity and debt of firms most directly exposed to commodity prices. ..."
"... Now, with U.S. oil output shrinking and gas production stalling, many of the cash-strapped producers entering bankruptcy will be seeking to rid themselves of pricey agreements, particularly those with so-called minimum volume commitments that require paying for space even if it is not used. ..."
So far, relatively few oil and gas producers have entered bankruptcy, and
most were smaller firms. But with oil prices down 70 percent since mid-2014 and natural gas prices
in a prolonged slump, up to a third of them are at risk of bankruptcy this year, consultancy Deloitte
said in a Feb. 16 report.
Midstream operators have been considered relatively secure as investors and analysts focus on
risks to the hundreds of billions of dollars in equity and debt of firms most directly exposed to
commodity prices.
That's because firms such as Enterprise Products ( EPD.N ),
Kinder Morgan KM.N and Plains All American ( PAA.N )
relied upon multi-year contracts -- the kind targeted in the two bankruptcies -- that guarantee pipeline
operators fixed fees to transport minimum volumes of oil or gas.
Now, with U.S. oil output shrinking and gas production stalling, many of the cash-strapped producers
entering bankruptcy will be seeking to rid themselves of pricey agreements, particularly those with
so-called minimum volume commitments that require paying for space even if it is not used.
"They will be probably among the first things thrown out," said Michael Grande, director for U.S.
midstream energy and infrastructure at Standard & Poor's.
Still, the pain is accruing already. Plains All American said this month that it expected a default
from one unidentified customer who contracted for 10 percent of its BridgeTex pipeline, which transports
crude from west Texas to the Houston area. Reuters later identified the customers as a little-known,
privately held merchant called Stampede Energy. [IL2N15W14Z]
'Within weeks, two low-profile legal disputes may determine whether an unprecedented wave of bankruptcies
expected to hit U.S. oil and gas producers this year will imperil the $500 billion pipeline sector
as well.
Shale explorers will be "decimated" in coming months amid a wave of restructurings and bankruptcies,
fallout from the 70 percent drop in oil prices since mid-2014, Papa, who is now a partner at private-equity
firm Riverstone Holdings LLC, said during a panel discussion at the IHS CERAWeek event in Houston
on Tuesday. Low prices probably will linger for another 16 to 24 months before supply cuts cause
a rebound, he said.
"... Consumption of natural gas for power generation (power burn) in Texas is at a record high,
according to data from Bentek Energy. Daily consumption in 2015, through August 11, has averaged 4.5
billion cubic feet per day ..."
Consumption of natural gas for power generation (power burn) in Texas is at a record
high, according to data from Bentek Energy. Daily consumption in 2015, through August 11, has
averaged 4.5 billion cubic feet per day (Bcf/d). The next-highest level was 4.4 Bcf/d,
for the same period in 2012.
"... The next six to 12 months is going to be a decimation for that industry – bodies all over the place, ..."
"... From those ashes you're going to see the companies that survive, are going to come out of it a lot more conservative as they go forward. They're not going to stretch their balance sheets so much and make acquisitions based on false premises ..."
"... "Where is the supply going to come from, particularly when you see capital spending on the mega projects has stopped cold," he said. "I can foresee a case where the biggest supplier in 2020 is the U.S. shale producers, because the world needs that incremental production." ..."
"The next six to 12 months is going to be a decimation for that industry – bodies all over the
place," he said at the IHS CERAWeek conference. "From those ashes you're going to see the companies
that survive, are going to come out of it a lot more conservative as they go forward. They're not
going to stretch their balance sheets so much and make acquisitions based on false premises."
... ... ...
Still, if forecasts that world demand will grow 1 million barrels a day annually for the next
five years hold true, Papa said he was bullish on the U.S. sector.
"Where is the supply going to come from, particularly when you see capital spending on the mega
projects has stopped cold," he said. "I can foresee a case where the biggest supplier in 2020 is
the U.S. shale producers, because the world needs that incremental production."
A drop of natural gas production also means drop in condensate production. "Production in the
Utica and Woodford plays is increasing but it is largely offset by declining associated gas from the
Eagle Ford, Bakken and other tight oil plays."
Notable quotes:
"... Every week, the EIA proclaims a new record for natural gas production. But their own forecasts show that the U.S. will be short on supply by October of this year. A price increase is inevitable beginning later in 2016. ..."
"... The popular myth is that gas production will continue to increase and that prices will remain low for years. In the myth, price has no effect on production. The reality is that price matters and production is down 1.2 bcfd 1 since September 2015 ..."
"... Hedges made when prices were in the $5-range carried many companies through falling prices as they continued to produce like there was no tomorrow. Tomorrow has arrived and the hedges are gone. ..."
"... A supply deficit does not mean that there won't be enough gas. There is ample gas presently in storage to cover a supply shortfall for awhile. That is what happened during the supply deficit in 2013-2014 (Figure 5). That deficit was created by flat production similar to what EIA predicts for the first 3 quarters of 2016. ..."
"... What is different this time, however, is that net imports will reach zero in early 2017 because of decreasing imports from Canada and increasing exports. Add to that the challenge of replacing conventional gas depletion, and there is a much more serious supply problem than EIA's already questionable forecast suggests. ..."
Every week, the EIA proclaims a new record for natural
gas production. But their own forecasts show that the U.S. will be short on supply
by October of this year. A price increase is inevitable beginning later in 2016.
Popular Myth vs Reality
The popular myth is that gas production will continue to
increase and that prices will remain low for years. In the myth, price has no effect on
production. The reality is that price matters and production is down 1.2 bcfd1
since September 2015 (Figure 1).
The production increases reported by EIA are year-over-year comparisons that don't reflect
declines during the last 4 months.
Prices have fallen to less than half what they were in early
2014. The average price for the first quarter of 2016 is only $2.25 per MBTU2 (Figure 2).
Hedges made when prices were in the $5-range carried many companies through falling prices as
they continued to produce like there was no tomorrow. Tomorrow has arrived and the hedges are
gone.
Over-production in the Marcellus Shale means that producers have to compete for limited pipeline
capacity by deeply discounting their sales price. The best core area locations are commercial at
$4 per mcf3 but wellhead prices averaged only $1.75 per mcf in 2015.
... ... ...
There is no
simple solution to falling supply. That's because almost half of U.S. supply is conventional gas
and it is in terminal decline. Now, shale gas is also in decline (Figure 3).
... ... ...
The
EIA forecasts that net dry gas production will increase 1.4 bcfd in 2016 and 1.6 bcfd 2017. Even
with that optimistic forecast, their data still shows that the U.S. will have a supply deficit
beginning in the last quarter of 2016 (Figure 5). A more realistic forecast implies a much
greater deficit that begins sooner.
... ... ...
A supply deficit does not mean that there
won't be enough gas. There is ample gas presently in storage to cover a supply shortfall for
awhile. That is what happened during the supply deficit in 2013-2014 (Figure 5). That deficit was
created by flat production similar to what EIA predicts for the first 3 quarters of 2016.
What is different this time, however, is that net imports will reach zero in early 2017
because of decreasing imports from Canada and increasing exports. Add to that the challenge of
replacing conventional gas depletion, and there is a much more serious supply problem than EIA's
already questionable forecast suggests.
Another big difference is that in 2013-2014,
capital was freely available with average oil prices above $90 per barrel and average gas prices
more than $4 per MBTU. Today, the oil and gas industry is in financial shambles with both oil and
gas prices at very low levels, and it is unlikely that companies can raise the capital necessary
to ramp up gas drilling quickly if at all.
Iran called a proposal by Saudi Arabia and Russia to freeze oil production
"ridiculous" as its seeks to boost its own output after years of sanctions constrained
sales.
The proposal by Saudi Arabia, Russia, Venezuela and Qatar for oil producers
to cap output at January levels puts "unrealistic demands" on Iran, Oil Minister
Bijan Namdar Zanganeh said Tuesday, according to the ministry's news agency
Shana.
"It is very ridiculous, they come up with the proposal on freezing oil production
and call for this freeze to take place in their 10 million barrels a day production
vis-a-vis Iran's 1 million barrels a day" planned production boost, he said.
"If Iran's crude oil production falls, it will be overtaken considerably by
the neighboring countries."
The three OPEC members and Russia are seeking to stop the 40 percent drop
in oil prices over the past year caused by a global crude glut. Iran is seeking
to boost output by 1 million barrels a day this year after international sanctions
on its oil industry were lifted last month.
"... So, if oil prices would fall below 20 USD per barrel for a long period I am pretty sure, oil production for Bakken and Eagle Ford would tend to zero within a short time and all above production scenarios would be irrelevant. ..."
In the discussions here and concerning Bakken LTO has either of these two articles been mentioned?
They are by David Hughes and Jean Laherrere.
The David Hughes one in particular looks to have predictions close to what has been happening.
They both question EIA estimates of the amount of oil recoverable. For example from Hughes:
"The U.S. Energy Information Administration's (EIA) forecasts regarding tight oil production-published
in its Annual Energy Outlook (AEO)-are commonly viewed by industry and government as the best
available assessment of what to expect in the longer-term, with the EIA's reference case typically
viewed as the most likely scenario for future production. In my Drilling Deeper1 report published
last October, I developed alternate production forecasts for two major tight oil plays, the Bakken
and Eagle Ford, and reviewed the credibility of EIA AEO20142 forecasts for other major plays based
on the fundamental geological characteristics of each play. In most plays the AEO2014 production
projections were found to be highly to extremely optimistic when reviewed in the light of play
fundamentals. For the Bakken and Eagle Ford plays, AEO2014 overestimated the likely recovery of
oil by 2040 by 42% compared to my "Most Likely" drilling rate case found in Drilling Deeper."
This is from the Laherrere article (posted at POB) and looks, for something 18 months ago,
as prescient as anything I've seen in the light of subsequent events:
"It seems that most oil companies are spending more than their revenues by increasing their
debts. Countries can live for a long time with huge debt increase, not companies. They count on
the stock market by delivering optimistic reports and keep drilling to avoid the production to
decline. With shale oil or shale play, in contrary with conventional where wells are dry or producing,
oil can be produced even for a while if not economical.
Such behavior explains why most peak forecasts are wrong. But the main question is about the slope
of the decline after the peak. EIA forecast a LTO (light tight oil = shale oil) peak in 2017 it
is not too far after my forecast, the big difference is the slow EIA LTO decline."
Although these reports are very interesting, they ignore in my opinion financial
conditions – mainly the bond market – and oil prices as major drivers for oil production. Jean
Laherrere is fully aware of this fact, yet does not provide oil production scenarios at different
oil price and bond market conditions.
So, if oil prices would fall below 20 USD per barrel for a long period I am pretty sure, oil
production for Bakken and Eagle Ford would tend to zero within a short time and all above production
scenarios would be irrelevant.
If oil prices would recover, production will start again.
Yet it is in my view not possible to sustain horrendous losses for a long time. Somebody has
to pay the bill. It is already clear now that high US oil production supports the US dollar, yet
brings the bond market to its knees. The bond – and equity holders are paying currently the bill,
yet for how long?
Might be so. If the production continues to follow the Hughes predictions though, I'd say that
will cast a lot of doubts over how much impact short term price swings have had. Possibly the
availability of cheap money through most of 2015 overrode any price signals and they just kept
on drilling no matter how much losses they incurred. You talking about a maturity wall now – how
would that have impacted production in the past, especially when in the beginning of the price
fall producers were expecting prices to recover at any time and later were concentrating solely
in staying alive for the next month and couldn't afford to look much further ahead.
With data
currently available the main message I've got from this is that there is probably a lot less oil
in the Bakken and Eagle Ford than EIA are saying – at any price.
The IEA has actually increased its medium-term global demand projections compared with the previous
year's report. This reflects a much higher 2015 base, but also slightly higher growth rates in
2016-2020.
As a result, projected demand in 2020 is now almost 1.5 mb/d higher than in MTOMR-2015 (100.5mb/d
vs. 99.05mb/d).
From the new report:
"…our forecast for oil demand to 2021 is for annual average growth of 1.2 mb/d (1.2%) which
represents a very solid outlook in historical terms. Oil demand breaks through the 100 mb/d barrier
at some point in 2019 or 2020. A major change from the 2015 MTOMR is the higher base from which
our forecast begins. In 2015 world oil demand increased by 1.6 mb/d (1.7%), one of the biggest
increases in recent years stimulated to a large extent by the rapid fall in oil prices that began
in the second half of 2014 and gained momentum in 2015. However, any expectations that the most
recent fall in oil prices to USD 30/bbl oil will provide further stimulus to oil demand in the
early years of our forecast and send annual rates of growth above 1.2 mb/d are likely to be dashed.
In the first part of 2016 we have seen major turmoil in financial markets and clear signs that
almost any economy you care to look at could see its GDP growth prospects downgraded.
Since 2014 the non-OECD countries have used more oil than OECD countries and the gap will widen
in years to come. However, the rate of demand growth in the non-OECD countries is vulnerable to
being pared back as the cost of energy subsidies becomes a major burden and governments take action.
This will probably not have an immediate impact on demand in the early part of this forecast,
but later on we might see that the reduction in expensive fuel subsidies in many countries, including
the fast-growing Middle East, does have a significant effect on growth. Also, rising energy use
has brought with it terrible environmental degradation, particularly in the fast-growing Asian
economies, and oil's part in this is recognised by measures to limit vehicle registrations and
use. Although reducing subsidies and tackling pollution will affect the rate of demand growth,
it should be stressed that non-OECD Asia will still remain the major source of oil demand growth
with volumes increasing from 23.7 mb/d in 2015 to 28.9 mb/d in 2021."
Global liquids demand (mb/d): IEA Medium-Term Market Reports 2016 vs. 2015
The IEA's non-OPEC C+C+NGLs production estimate for 2015 in last year's MTOMR proved too pessimistic.
They have underestimated the resilience of high cost oil production, particularly that of the
US LTO. As a result, actual non-OPEC production was 1.1 mb/d higher than in last year's report.
Still, the agency expects non-OPEC production to decline by 0.6mb/d in 2016 and 0.1mb/d in 2017
before a gradual recovery from 2018. Projected decline in 2016-17 should be mainly driven by LTO.
Expected non-OPEC production in 2020 is 0.4mb/d lower than in the MTOMR-2015.
From the new report:
In the year since the 2015 MTOMR was published, the supply side has provided many surprises.
By far the most significant has been the resilience of high cost oil production and in particular
that of light, tight, oil (LTO) output in the US. As oil prices cascaded down from more than USD
100/bbl it was widely predicted at various milestones that the extraordinary growth in total US
crude oil production from 5 mb/d in 2008 to 9.4 mb/d in 2015 would grind to a halt and move rapidly
into reverse. Growth certainly ceased in mid-2015 but the intervening period has seen a relatively
modest pull-back and total US crude oil production in early February 2016 was still close to 9.0
mb/d, aided by expanding production in the Gulf of Mexico.
In our base case outlook, there is an element of the "straw breaking the camel's back" and
we expect US LTO production to fall back by 600 kb/d this year and by a further 200 kb/d in 2017
before a gradual recovery in oil prices, working in step with further improvements in operational
efficiencies and cost cutting, allows a gradual recovery. Anybody who believes that we have seen
the last of rising LTO production in the United States should think again; by the end of our forecast
in 2021, total US liquids production will have increased by a net 1.3 mb/d compared to 2015. Such
has been the element of surprise provided by the resilience of US oil production, and the wide
divergence of views as to the future, that we have added a High and Low Case to our non-OPEC production
analysis and plotted the impact on the global oil market balance of US LTO production falling
by more than in our base case or, conversely, less. The eventual outturn is one of the most important
factors – if not the most important – in assessing when the oil market will re-balance.
Non-OPEC liquids production (ex biofuels) (mb/d): IEA Medium-Term Market Reports 2016 vs. 2015
(Note: excludes Indonesia)
The IEA expects the oil market to re-balance in 2017, which is in line with the EIA's and many
other forecasts. However the accumulated excess inventories will return to long-term normal levels
only by 2021, which should dampen the recovery in oil prices.
From the report:
For some time now analysts have tried to understand when the oil market will return to balance.
A year ago it was widely believed that this would happen by the end of 2015 but that view has
proved to be very wide of the mark. In 2014 and again in 2015 supply exceeded demand by massive
margins, 0.9 mb/d and 2 mb/d respectively, and for 2016 we expect a further build of 1.1 mb/d.
Only in 2017 will we finally see oil supply and demand aligned but the enormous stocks being
accumulated will act as a dampener on the pace of recovery in oil prices when the market, having
balanced, then starts to draw down those stocks. Unless we see an even larger than expected
fall in non-OPEC oil production in 2016 and/or a major demand growth spurt it is hard to see
oil prices recovering significantly in the short term from the low levels prevailing at the
time of publication of this report.
It is very tempting, but also very dangerous, to declare that we are in a new era of lower
oil prices. But at the risk of tempting fate, we must say that today's oil market conditions
do not suggest that prices can recover sharply in the immediate future – unless, of course,
there is a major geopolitical event.
The EIA weekly estimate of production is still too high as indicated by Unaccounted for Oil
and production estimates based on well completion rates. However, the weekly estimate is starting
to move down in a big way. Last week down 30k bbl/day, this week 50k bbl/day. 50k bbl/day is
huge, that is 200k bbl/day/month The reality is US production has been falling 20k-30k bbl/day
for weeks or even months already, now it is likely falling 30-37k bbl/day/week not 50k
bbl/day/week. 50k bbl/day/week would imply almost zero well completions, when around half of each
months shale decline is currently being replaced monthly. But EIA is so far behind, with likely
production levels already below 9 MM bbl/day compared to the official estimate of 9.135 MM
bbl/day, that they are being forced and will continue to be forced to show huge weekly declines
for awhile to catch up. Won't be surprised to see 100k bbl/day cut reported next week and
potentially the week after as well.
Unaccounted for oil has been running dramatically negative since Dec. 4. We have now just seen 3
back to back weeks with negative unaccounted for oil. This week it was -500k bbl/day or 3.5MM bbl
for the week. Imagine what happens when -500k bbl/day in Unaccounted is zeroed out and put in
production instead.
The International Energy Agency (IEA) is warning consumers not to let cheap oil lull them into
a false sense of security amid forecasts of a price spike by 2021.
In a report, the IEA said it expects prices to start recovering in 2017. But it forecasts that
will be followed by a sharp jump in price as supply shrinks following under-investment by
struggling producers.
Brent crude touched a 13-year low of $28.88 a barrel in January. It has since recovered
somewhat, but is still far below a high of $115 in June 2014.
On Monday the price was up around 4.9% at $34.62.
Fatih Birol, executive director of the IEA, said: "It is easy for consumers to be lulled into
complacency by ample stocks and low prices today, but they should heed the writing on the wall:
the historic investment cuts we are seeing raise the odds of unpleasant oil-security surprises in
the not-too-distant-future."
... ... ...
The policy advisor expects global oil supply will grow by 4.1 million barrels of oil per day
between 2015 and 2021, down from an increase of 11 million barrels of oil per day between 2009
and 2015.
It also expects investment in oil exploration and production to fall by 17% in 2016 following a
24% decline last year.
"... If oil prices remain under $40/b for the remainder of 2016, we might see more significant decline in LTO output than 600 kb/d, my more optimistic forecasts for LTO were based on an assumption of an oil price recovery in 2016, which is looking less likely due to continued oversupply of oil. ..."
"... At some point a "Minsky moment" may occur in the LTO sector and as all the investors head for the exit at once, we might see a sharp drop in LTO output as companies go bankrupt and financial chaos ensues. ..."
"... The scenario of a 'Minsky' moment in the shale industry is exactly what I think is necessary to bring oil prices up again. Some call it capitulation. ..."
"... As the shale industry is still fighting to keep production up, the situation gets more tense and more painful by the day. ..."
I don't have access to the report is there a reference oil price scenario?
If oil prices remain under $40/b for the remainder of 2016, we might see more significant decline
in LTO output than 600 kb/d, my more optimistic forecasts for LTO were based on an assumption
of an oil price recovery in 2016, which is looking less likely due to continued oversupply of
oil.
At some point a "Minsky moment" may occur in the LTO sector and as all the investors head for
the exit at once, we might see a sharp drop in LTO output as companies go bankrupt and financial
chaos ensues. I don't think this is high probability, but don't think it highly unlikely either,
maybe a 1/3 chance that a major crisis in the LTO sector is in the cards.
The scenario of a 'Minsky' moment in the shale industry is exactly what I think is necessary
to bring oil prices up again. Some call it capitulation.
There are still many people invested hoping for a turnaround without capitulation. Yet this
will take a lot of time and will be painful. A sudden capitulation is much more likely and will
be at the end less painful.
As the shale industry is still fighting to keep production up, the situation gets more tense
and more painful by the day.
"... Still, at current prices PXD is trading at 20 times EV/EBITDA inclusive of hedges. I have been saying this for a long time – the market is pricing ALL shale companies as if the price of oil is $70 per barrel. ..."
PXD's net debt is lower because they expect $1.6 billion in cash from the stock offering
and $500 million in cash from the sale of the pipeline.
Still, at current prices PXD is trading at 20 times EV/EBITDA inclusive of hedges. I have
been saying this for a long time – the market is pricing ALL shale companies as if the price of
oil is $70 per barrel.
I'm curious what are low decline vertical waterflood properties selling for in this
environment? Aren't these in general better in a lower priced environment (say $50ish) than the
shale plays? I can't really figure out why horizontal permian gets so much hype in this environment.
I've found 2 permian players that seem to make money at 50 and below, RSP permian and Callon Petroleum,
but they are valued as if oil is +80 trading at over $100k per flowing barrel. The lowest cost
producers I've found are all vertical producers and MLPs. MCEP is probably the lowest cost producer
in the U.S. and they do pure low decline waterfloods. They have quite a bit of debt but even with
that they're trading at $40k per flowing barrel including all debt.
Kelly b. Right now, unhedged, 2/16 price looks to be $16-$26 depending on location.
I sincerely
doubt there are many secondary projects will all in costs (excluding interest) under $20. Just
look at MCEP.
How do you price assets that are barely making money, breaking even, or losing money?
Likewise, re shale. PXD values PUD PV10 at about $350 million. It isn't too economic. They
are saying that, not me. Some 600,000 acres in the Permian with PUD PV 10 of $350 million at $50
WTI.
The only value in lower 48 onshore is that prices rise substantially in 2016. It is practically
all an option at current levels. The PV10 values tell us that.
What happens to GM, for example, if they can suddenly only sell new vehicles for $5-15K?
One company you mention is Mid-Con. In 2014 PV10 was $664 million. But look at costs. LOE $22.93,
production taxes $5.56, G & A $12.58. LT debt $205 million.
Granted, in Q3 2015 they had hammered costs down to $19.60 LOE, $.46 production taxes and $5.04
G & A. At $25 wellhead there is $0 PV.
Yes, Mid-Con is hedged. Only way they may survive. I'd say almost secondary and tertiary projects
are underwater at $30 WTI in lower 48, when G & A is included.
Shale oil LOE is only low due to a high number of new wells. I think 5+ year old wells have
LOE $15-$30 for the most part, with outliers of course.
"... In west-central Alberta, the ballpark cost of a vertical well is probably $1-2 million. The cost of a horizontal multi-stage hydraulically fractured well is more like $5-10 million (I didn't research these numbers. I'm just basing them on what I've seen in the past). ..."
"... Did multi-stage horizontals make producing from unconventional reservoirs possible? Of course. Did they make it economic? For a while, when oil was $100 per barrel. Did they make production predictable? Not even close. ..."
In west-central Alberta, the ballpark cost of a vertical well is probably $1-2 million.
The cost of a horizontal multi-stage hydraulically fractured well is more like $5-10 million
(I didn't research these numbers. I'm just basing them on what I've seen in the past).
Did multi-stage horizontals make producing from unconventional reservoirs possible?
Of course. Did they make it economic? For a while, when oil was $100 per barrel. Did they make
production predictable? Not even close.
I especially like "The world of peak oil supply has been turned on its head, due to structural changes
in the economies of key developing countries and major efforts to improve energy efficiency everywhere."
Notable quotes:
"... Further, it is becoming even more obvious that the prevailing wisdom of just a few years ago that "peak oil supply" would cause oil prices to rise relentlessly as output struggled to keep pace with ever-rising demand was wrong. Today we are seeing not just an abundance of resources in the ground but also tremendous technical innovation that enables companies to bring oil to the market. ..."
"... The world of peak oil supply has been turned on its head, due to structural changes in the economies of key developing countries and major efforts to improve energy efficiency everywhere. ..."
"... I estimate that Saudi Arabia may have already shipped in the vicinity of half of their post-2005 CNE. Note that annual Saudi net oil exports fell from 9.5 million bpd in 2005 to 8.4 million bpd in 2014 (probably remaining at about 8.7 mililon bpd in 2015, EIA + BP data). In other words, Saudi net exports, after increasing very rapidly from 2002 to 2005, have almost certainly been below their 2005 rate for 10 straight years. But the hidden danger, which almost no one is focused on, is the ongoing–and accelerating–rate of depletion in remaining volume of post-2005 Saudi and Global Cumulative Net Exports of oil. ..."
"... Increasing the extraction rate simply increases the depletion rate. I can't see how anything humans do can change that fact. In other words, nothing can turn peak oil on its head. ..."
"... I believe that high oil prices will be back, but have been convinced by AlexS that it will not be as soon as I have been predicting. Long term projects that will come on line and be ramping up in 2016 and 2017 may keep oil prices under $80/b through mid 2018, we may not see prices rise to $100/b or more (2015$) until 2019, when the current delays in long term oil investment will start to affect oil output in a big way (2 to 3 Mb/d less output than if the projects deferred had been completed). ..."
Further, it is becoming even more obvious that the prevailing wisdom of just a few years
ago that "peak oil supply" would cause oil prices to rise relentlessly as output struggled
to keep pace with ever-rising demand was wrong. Today we are seeing not just an abundance of
resources in the ground but also tremendous technical innovation that enables companies to
bring oil to the market.
Added to this is a remorseless downward pressure on costs and, although we are currently
seeing major cutbacks in oil investments, there is no doubt that many projects currently on
hold will be re-evaluated and will see the light of day at lower costs than were thought possible
just a few years ago. The world of peak oil supply has been turned on its head, due to
structural changes in the economies of key developing countries and major efforts to improve
energy efficiency everywhere.
I fear that there will be a rude awakening for some in the next few years.
The WSJ has an article on the IEA outlook, with an interesting chart (do Google Search for access):
WSJ: IEA Sees Global Oil Markets Rebalancing Next Year
IEA says 'supply and demand will gradually rebalance by 2017, with a corresponding recovery in
oil prices from around $30 a barrel'
Attached is an article in today's WSJ about
the IEA's most recent outlook, for the balance between global total liquids supply & demand. There
is a very interesting chart in the article. Apparently, oil prices were trading up today, because
of the report.
However, the IEA outlook does not take into account two critical factors: (1) The composition
of the global Crude + Condensate (C+C) inventory oversupply (mostly condensate, in my opinion)
and (2) Even as production increases, net exports can fall, because of domestic consumption in
net oil exporting countries.
Some of my comments on net oil exports:
Following is a link to a discussion, in three sequential comments, of the Export Land Model
(ELM, a simple mathematical model which assumes a 5%/year rate of decline in production and a
2.5%/year rate of increase in consumption, in a net oil exporting country), the Six Country Case
History (major net exporters that hit or approached zero net exports from 1980 to 2010, excluding
China) and the (2005) Top 33 Net Exporters, with graphics for each item:
Note that what I define as the ECI Ratio (Export Capacity Index) is the ratio of production
to consumption, and CNE = Cumulative Net Exports (for a defined time period).
Based on the mathematical model, which is confirmed by the empirical data (Six Country Case
History), a declining ECI Ratio tends to correlate with an accelerating rate of depletion in remaining
CNE.
For example, about the only metric that most analysts focus on is the top line production number
in a net oil exporting country, and from 1995 to 1999, Six Country production rose by 2%, but
in only four years they had already shipped 54% of their post-1995 CNE.
I estimate that Saudi Arabia may have already shipped in the vicinity of half of their
post-2005 CNE. Note that annual Saudi net oil exports fell from 9.5 million bpd in 2005 to 8.4
million bpd in 2014 (probably remaining at about 8.7 mililon bpd in 2015, EIA + BP data). In other
words, Saudi net exports, after increasing very rapidly from 2002 to 2005, have almost certainly
been below their 2005 rate for 10 straight years. But the hidden danger, which almost no one is
focused on, is the ongoing–and accelerating–rate of depletion in remaining volume of post-2005
Saudi and Global Cumulative Net Exports of oil.
The world of peak oil supply has been turned on its head, due to structural changes in the
economies of key developing countries and major efforts to improve energy efficiency everywhere.
Increasing the extraction rate simply increases the depletion rate. I can't see how anything humans
do can change that fact. In other words, nothing can turn peak oil on its head.
Correct. I think what has surprised many, including the IEA is that a few years ago
they worried that high oil prices would be a problem as oil supply growth would struggle to keep
up oil demand growth.
That has not proven to be the case from late 2014 until today as oil supply growth has outpaced
oil demand growth. This is mostly due to a change in strategy by OPEC to focus on market share
rather than oil revenue.
I believe that high oil prices will be back, but have been convinced by AlexS that it will
not be as soon as I have been predicting. Long term projects that will come on line and be ramping
up in 2016 and 2017 may keep oil prices under $80/b through mid 2018, we may not see prices rise
to $100/b or more (2015$) until 2019, when the current delays in long term oil investment will
start to affect oil output in a big way (2 to 3 Mb/d less output than if the projects deferred
had been completed).
To me the undulating plateau scenario looks somewhat plausible, unless there is a financial
crisis, in which case demand and price will fall along with output. I have no prediction for when
such a crisis might occur, but the scenario below ignores that possibility.
This interesting hypothesis about the elite split is not supported by the facts. It is unclear that
is this is true, why faction of elite which represent Big Oil can't get their own Presidential candidate.
Hillary is definitely a neocon. Same its true for Jeb! (he was a member of neocon think tank "Project
for New American century" and used Wolfowitz as a political advisor), Cruz and Rubio (both are probably
to the right of Jeb!).
Notable quotes:
"... This is power struggle between two opposite approaches between two camps. Elite is split along
the lines who has more to lose between two approaches: continuous world conflict or cohabitation and
gradual shifting of power to other parts of the world. Everything points that Bankers Big Oil are in
two opposite camps. Rest of us, including small medium oil, are just collateral damage in all of this.
..."
"... Do really believe that Bankers via their shale pet project just pumped 4.5 mbpd within just
6-7 years for reason of profit? There is no profit. Don't you see the blame game and the deflection
from the bankers that Saudis are "flooding" the oil market? ..."
"... Saudis are "flooding" oil as much Norwegians are "flooding" and that is – same as before. Do
you see that only shale are the "chosen one" and have a luxury of keeping the credit lines open while
Big Oil is forced cutting dividends for the first time in 100 years? Too many things are pointing to
this struggle that would make this just coincidence. ..."
I know where you are coming from but all I am trying to see through the fog of lies and
disinformation. This whole oil price crash is not about renewables , or how big our carbon foot
print is and if people should feel "not good enough" because of that.
This is power struggle between two opposite approaches between two camps. Elite is split
along the lines who has more to lose between two approaches: continuous world conflict or cohabitation
and gradual shifting of power to other parts of the world. Everything points that Bankers & Big
Oil are in two opposite camps. Rest of us, including small & medium oil, are just collateral damage
in all of this.
Do you really believe that these critical articles about Exxon are just suddenly appearing
after 100 years of pumping oil? Do really believe that Bankers via their shale pet project
just pumped 4.5 mbpd within just 6-7 years for reason of profit? There is no profit. Don't you
see the blame game and the deflection from the bankers that Saudis are "flooding" the oil market?
Saudis are "flooding" oil as much Norwegians are "flooding" and that is – same as before.
Do you see that only shale are the "chosen one" and have a luxury of keeping the credit lines
open while Big Oil is forced cutting dividends for the first time in 100 years? Too many things
are pointing to this struggle that would make this just coincidence.
This is power struggle between two opposite approaches between two camps. Elite is split along
the lines who has more to lose between two approaches: continuous world conflict or cohabitation
and gradual shifting of power to other parts of the world.
Very interesting hypothesis.
Thank you --
Now one question.
Was not Jeb! a representative of Bush clan and by extension Big Oil in the current
Presidential race ? If so, then please note that he is a typical neocon (former member of the Project for New American
Century; with Wolfowitz as a political advisor). Also it was an oil man Bush II who got us into Iraq.
Those facts make your hypothesis about Big Oil being against imperial adventures somewhat weaker.
"... The total exposure jumps $1.9 billion counting derivatives and other receivables,
which were primarily to investment-grade firms, Goldman Sachs said. ..."
Goldman Sachs Group Inc. (GS) said about 40 percent of its loans and lending
commitments to oil and gas companies are to junk-rated firms.
The figure, which counts both loans made and future promises to lend, accounted
for $4.2 billion of a total $10.6 billion as of the end of December, the New
York-based bank said Monday in its annual regulatory filing. Goldman Sachs has
$1.5 billion in loans to energy companies rated below investment grade and $2.7
billion in unfunded commitments.
The total exposure jumps $1.9 billion counting derivatives and other
receivables, which were "primarily" to investment-grade firms, Goldman Sachs
said.
Concerns about banks' energy loans have helped spur share declines for lenders
after the price of oil fell 42 percent in the past 12 months through Friday.
The Standard & Poor's 500 Financials Index slumped 13 percent in the same period.
Goldman Sachs's total is below some of its biggest competitors. Citigroup
Inc.'s (C) funded and unfunded commitments amounted to $58 billion, analysts
at Susquehanna Financial Group LLP wrote in a note last week. Most of Wells
Fargo & Co.'s (WFC) $17 billion in outstanding energy loans is for companies
that aren't investment grade, Chief Financial Officer John Shrewsberry last
month.
Of course, with PXD, long term debt of $3.2 billion = PV10 of $3.2 billion.
At $50 WTI.
They have a high percentage of 2016 oil hedged, but considerable amount
with three way collars.
Who wants to bet that the aggregate PV10 of all US based non integrated
E & P public companies is less than their aggregate long term debt at $50
WTI? And we are at $30 WTI.
Maybe I will try to add it up in about a month or so, once the 10K are
out.
If that is true, how many billions of market cap is purely a bet that
oil prices are headed well north of $50 before debt cannot be extended?
Can you explain to me if PXD, PV10 is =or< long term debt, why is not
PXD declared insolvent, and suspended from trading, as they would be technically
bankrupt.
Toolpush. Per their Q4 press release, it appears all categories PV 10 is
$3.2 billion. From another press release the same day (2/10/16), it appears
long term debt is $3.2 billion.
They are not insolvent if they can make debt and expense payments. They
have hedges, which definitely helps them. Keep in mind, however, PV10 was
calculated at $50 WTI and $2.65 HH.
Looked at Denbury, who has about 70K bopd, about half CO2 flood. Long
term debt $3.3 billion, PV10 at $50 WTI $2.3 billion.
PXD stock at $122. Denbury stock at $1.
I guess that is why they call it a casino, the stock market thing we
put our 401k's in and W wanted to invest SS money in. LOL.
I have been running some numbers at $30 WTI and $2 natural gas. Just
plugging in numbers, not specific to any company. Assuming $25 well head
oil and $1.50 wellhead gas. But I am including interest and G & A in addition
to OPEX, transport, P & A.
There really isn't any significant value, even with $8 OPEX, which is
really pretty low for oil weighted companies.
For a company with OPEX like Denbury, the assets are not, they are liabilities,
because they are cash flow negative now at those prices.
Note: I escalate OPEX at 3% per annum, which I have found is fairly common,
at least for five years or so. Shale has almost no PV10 when you do that
as it becomes CF negative in year 2-3 due to steep decline. I'm using 25%
decline in the shale reference, per PXD saying ceasing activity in EFS will
result in 25% decline in 2016, then tapering off 5% per year till getting
to 5% annual, then holding at 5%.
Texas Crude and condensate are basically holding flat, yet associate or
casing head gas is on the increase. An indication of a rising GOR, similar
to the Bakken.
Depending on which side of the fence you are sitting, It could be drilling
more gassy parts of the reservoir, or those damn chokes, that keep vibrating
open!
I'm curious what are low decline vertical waterflood properties selling
for in this environment? Aren't these in general better in a lower priced
environment (say $50ish) than the shale plays? I can't really figure out
why horizontal permian gets so much hype in this environment. I've found
2 permian players that seem to make money at 50 and below, RSP permian and
Callon Petroleum, but they are valued as if oil is +80 trading at over $100k
per flowing barrel. The lowest cost producers I've found are all vertical
producers and MLPs. MCEP is probably the lowest cost producer in the U.S.
and they do pure low decline waterfloods. They have quite a bit of debt
but even with that they're trading at $40k per flowing barrel including
all debt.
Kelly b. Right now, unhedged, 2/16 price looks to be $16-$26 depending on
location.
I sincerely doubt there are many secondary projects will all in costs
(excluding interest) under $20. Just look at MCEP.
How do you price assets that are barely making money, breaking even,
or losing money?
Likewise, re shale. PXD values PUD PV10 at about $350 million. It isn't
too economic. They are saying that, not me. Some 600,000 acres in the Permian
with PUD PV 10 of $350 million at $50 WTI.
The only value in lower 48 onshore is that prices rise substantially
in 2016. It is practically all an option at current levels. The PV10 values
tell us that.
What happens to GM, for example, if they can suddenly only sell new vehicles
for $5-15K?
One company you mention is Mid-Con. In 2014 PV10 was $664 million. But
look at costs. LOE $22.93, production taxes $5.56, G & A $12.58. LT debt
$205 million.
Granted, in Q3 2015 they had hammered costs down to $19.60 LOE, $.46
production taxes and $5.04 G & A. At $25 wellhead there is $0 PV.
Yes, Mid-Con is hedged. Only way they may survive. I'd say almost secondary
and tertiary projects are underwater at $30 WTI in lower 48, when G & A
is included.
Shale oil LOE is only low due to a high number of new wells. I think
5+ year old wells have LOE $15-$30 for the most part, with outliers of course.
In light of the recent declines, financial services firm Raymond James
& Associates Inc. further reduced its forecast US rig counts for 2016-18
in its most recent industry brief.
RJA now projects an average 2016 count of 500, down from the 620 the
firm projected just last month and down nearly half compared with the 2015
average. The new bottom is expected occur in April at 400 units, compared
with RJA's previous projection of 550 in June. [The most recent rig count
is 514 – AlexS].
A drilling rebound isn't seen until late 2016, the firm says, as many
E&P firms are likely to first focus on drawing down their uncompleted well
inventories and improving their balance sheets, while waiting for consistently
higher crude oil prices and a labor force recovery.
The count is forecast to end 2016 at 700 units, adding just 300 during
the second half.
… the lower activity this year should still lead to even more robust
growth in 2017-18," the firm said.
RJA expects the average count to jump 106% year-over-year in 2017 to
1,030, and rise 32% year-over-year to 1,358 in 2018.
"Despite the strong growth expected in 2017-18, we don't see the rig
count reaching the heights of 2014 levels again, as rig efficiencies continue
to advance at a solid clip," the firm added.
I think their forecast is based on the belief that the US government
will somehow (may be indirectly via OPEC June meeting) help to rotate the
existing debt in 2008 banks bail-out fashion.
"... A pretty typical story. The true cost of the extraordinarily low rates
and availability of cheap credit since 2008 is the misallocation of resources up
to and including emergence of a class of Ponzi borrowers (see below). In other words
stability of 2010-2014 in oil sector was highly destabilizing. ..."
"... These companies are outspending what they earn by a dollar more today than
they were a year ago during the first half of 2014. Anyone who believes that decreased
service costs and drilling efficiency will allow tight oil companies to make a profit
at $50-60 oil prices needs to think again." ..."
"... As soon as the use of Ponzi financing of operations became widespread the
bubble is ripe for popping. When for some reason the asset prices stop increasing
and start doing down, Ponzi borrowers go down with some time lag. ..."
"... That changes attitude of lenders dramatically and they start tightening
the conditions of borrowing and make it more difficult to roll over the debt even
if interests payments were paid on time. ..."
"... Dominoes start falling. That means that speculative borrowers follow Ponzi
borrowers as they can no longer refinance (roll over) the principal even if they
are able to cover interest payments. ..."
"... Collapse of the speculative borrowers can then bring down even hedge borrowers,
who are unable to find loans despite the apparent soundness of the underlying investments.
..."
"... I hope the government will provide some lifeline at least by allowing refinancing
of the loans so that the complete collapse of shale/tight oil bubble will be avoided.
..."
Look at Denbury Resources. They have shut in 2,300 barrels of
oil production per day. Their operating costs, plus severance taxes,
general and administrative expenses and interest are more than what
they can sell their current production for. And they have $3.3 billion
of debt. This is a 70,000 bopd company.
A pretty typical story. The true cost of the extraordinarily low
rates and availability of cheap credit since 2008 is the misallocation of
resources up to and including emergence of a class of Ponzi borrowers (see
below). In other words stability of 2010-2014 in oil sector was highly destabilizing.
"…For the first half of 2015, the tight oil-weighted E&P companies
that I follow spent about $2.20 in capital expenditures for every dollar
they earned from operations (Figure 5)… These companies are outspending
what they earn by a dollar more today than they were a year ago during
the first half of 2014. Anyone who believes that decreased service costs
and drilling efficiency will allow tight oil companies to make a profit
at $50-60 oil prices needs to think again."
Essentially he described what Minsky called "Ponzi borrowers". Following
Minsky the key mechanism that pushes a given sector towards a crisis is
the accumulation of Ponzi debt.
He identified three types of borrowers that contribute to the accumulation
of insolvent debt: hedge borrowers, speculative borrowers, and Ponzi
borrowers.
The "hedge borrower" can make debt payments (covering
interest and principal) from current cash flows from investments.
For the "speculative borrower", the cash flow from investments
can service the debt, i.e., cover only the interest due, but the
borrower must regularly roll over, or re-borrow, the principal.
The "Ponzi borrower" (named for Charles Ponzi, see also
Ponzi scheme) borrows based on the belief that the appreciation
of the value of the asset will be sufficient to refinance the debt
but could not make sufficient payments on interest or principal
with the cash flow from investments; only the appreciating asset
value can keep the Ponzi borrower afloat.
As soon as the use of Ponzi financing of operations became widespread
the bubble is ripe for popping. When for some reason the asset prices stop
increasing and start doing down, Ponzi borrowers go down with some time
lag.
That changes attitude of lenders dramatically and they start tightening
the conditions of borrowing and make it more difficult to roll over the
debt even if interests payments were paid on time.
Dominoes start falling. That means that speculative borrowers follow
Ponzi borrowers as they can no longer refinance (roll over) the principal
even if they are able to cover interest payments.
Collapse of the speculative borrowers can then bring down even hedge
borrowers, who are unable to find loans despite the apparent soundness of
the underlying investments.
I hope the government will provide some lifeline at least by allowing
refinancing of the loans so that the complete collapse of shale/tight oil
bubble will be avoided.
While MatlinPatterson's Portfolio Manager Michael Lipsky can't wait to enter
the distressed junk bond space, thanks to "$74 billion in debt trading at
under 25 cents on the dollar, and $205 billion trading at under 70 cents on
the dollar", he agrees with BofA's Michael Contopoulos
that it is still far too soon to buy. The question, according to Lipsky,
is what capital structure works in the aftermath of several recent "bombs" such
as Magnum Hunter which are trying to emerge from bankruptcy with negative EBITDA,
and as a result both secured debt and the DIP are getting equitized.
The punchline
of Lipsky's speech was that due to the persistent collapse of oil prices, the
bankruptcy process has been turned on its head: "we always assume that secured
lenders would roll into the bankruptcy become the DIP lenders, emerge from bankruptcy
as the new secured debt of the company. But they don't want to be there,
so you are buying the debt behind them and you could find yourself
in a situation where you could lose 100% of your money."
Which brings us to Lipsky's moment of zen: "all these derivatives
bets on oil, let's just own oil; and on the other side we are
actually short, focused more on the EM oil exposure."
Give and take between the Comptroller of the Currency and the
Fed generated stories of big banks being a bit more lenient rather than
swamping regional banks with failures. E&P companies had their
borrowing bases upheld, for now, but were told to generate additional liquidity
or have those bases cut in the spring.
What this means is that what we reported one month ago about the Dallas Fed
"advising" banks to "not to force energy bankruptcies", something which also
spilled over in the Fed advising banks to limit mark-to-market on energy exposure
and to use a generous strip pricing, was spot on.
Rumor Houston office of Dallas Fed met with banks,
told them not to force energy bankruptcies; demand asset sales instead
Now, thanks to Credit Suisse and Lipsky we have the full story: the
meetings between the Dallas Fed and the banks did indeed happen, however, as
we suspected, the Fed used a neat loophole.
Fast forward to 2:17 into the clip for the answer on what it was (which is
also the reason why banks don't want to be at the top of the capital structure
of energy companies any longer):
"The OCC is breathing down the neck of the large commercial banks
to limit their energy exposure."
Full clip below:
And there you have it: when the Fed responded that there was no truth to
our story with the curious explainer that "the Fed does not issue such guidance
to banks", even as it did everything else we disclosed, it was actually telling
the truth: because between Credit Suisse and MatlinPatterson we now know that
the explicit guidance actually came from the Office of the Currency Comtroller,
the regulator operating under the US Treasury umbrella which however is completely
useless without Fed input.
The OCC charters, regulates, and supervises all national banks and federal
savings associations as well as federal branches and agencies of foreign
banks. The OCC is an independent bureau of the U.S. Department of the Treasury.
So here is what happened: everything we said about the Dallas Fed meeting
with banks, going through bank loan books, and urging to limit bankruptcies,
demand asset sales, as well as suspend mark to market in explicit circumstances,
was true, however the explicit "guidance", precisely for FOIA
avoidance purposes, came not from the Fed but from the OCC.
Needless to say, we are immediately submitting a FOIA to the OCC next, demanding
to know whether it was the Office of the Comptroller of the Currencywhich was
the US government entity that advised US banks to do all those things which
we revealed back in mid-January, and which the Fed desperately tried to deny.
Finally, we are certainly looking forward to the Dallas Fed follow up response
to this post.
If 20-30 million bopd of non-US, non-OPEC, non Russian
production fell by as much as 10% from 12/14 to 12/15 and world demand increased 1.2 million
bopd we have 3.2-4.2 million bopd gap between supply and demand.
Notable quotes:
"... The states with higher 11/15 than 12/14 are OH, OK, NM and CO. From my review, these are the ones with the highest overall [low] API liquids of the shale plays, so API gravity has likely continued the upward climb for the entire US liquids production profile. ..."
"... I expect 12/15 for the non shale states to be lower than 11/15, thus steeping YOY decline. ..."
"... If non shale, non OPEC and non Russia world wide oil production follows the US non shale state pattern, OPEC and Russia would really need to ramp up, absent a decrease in YOY demand from 2015. Instead, they seem ready to at least cap, if not cut for the remainder of 2016. ..."
"... demand is expected to increase 1.2 million bopd from 2015. ..."
US less the shale states of PA, ND, OH, OK, NM, TX, CO, as well as less Alaska and GOM:
12/14: 1,597 bopd.
11/15: 1,425 bopd.
Data Per EIA.
Some thoughts:
The states with higher 11/15 than 12/14 are OH, OK, NM and CO. From my review, these are the
ones with the highest overall [low] API liquids of the shale plays, so API gravity has likely continued
the upward climb for the entire US liquids production profile.
Next, some of the non shale states actually went higher into the spring, so the decline is
steeper than what is shown.
I expect 12/15 for the non shale states to be lower than 11/15, thus steeping YOY decline.
I expect January through at least April, 2016 to continue to decline regardless of price as
Feb oil sales are not paid until late March and any sudden price swing would not be reflected
until at least May. In reality, given the carnage, it is unlikely any of these states would rebound
until 2017 given most will wait several months to see if price recovery is for real.
If $20s-$30s persists all year, there will be a steeper decline from 15 to 16 than from 14
to 15.
If non shale, non OPEC and non Russia world wide oil production follows the US non shale state
pattern, OPEC and Russia would really need to ramp up, absent a decrease in YOY demand from 2015.
Instead, they seem ready to at least cap, if not cut for the remainder of 2016. Further,
demand
is expected to increase 1.2 million bopd from 2015.
I suppose it is not realistic to think that 20-30 million bopd of non-US, non-OPEC, non Russian
production fell by as much as 10% from 12/14 to 12/15?
"... When the capital development of a country becomes a by-product of the activities of a casino, the job is likely to be ill done. ..."
"... The implication of Keynes comment, and therefore of the title that Strange appropriated, is that speculation and efficient investment - capital development - are inversely related. ..."
"... Economists, especially those who are comfortable wearing the blinders of neoclassical theory, tend to believe that the evolution of markets and institutions results mainly from the utility and profit seeking behavior of units . ..."
"... economic evolution leads to shifts in the balance of power between markets and [ oil producing - likbez] states. [ read OPEC - likbez] ..."
"... This insight helps explain how the Bretton Woods system broke down [and petrodollars emerged]. The chaos that Strange now finds in the international monetary regime is imputed to key decisions and nondecisions, mainly by the United States ..."
"... The term [ Minsky Moment ] was coined by Paul McCulley of PIMCO in 1998, to describe the 1998 Russian financial crisis, and was named after economist Dr. Hyman Minsky, who noted that bankers, traders, and other financiers periodically played the role of arsonists, setting the entire economy ablaze. Minsky opposed the deregulation that characterized the 1980s. ..."
While Marion King Hubbert was a revolutionary in oil industry, forecasting that American oil production
would peak surprisingly soon and decline steadily thereafter, Hyman Minsky was a similar revolutionary
in economics pointing out inherent instability of casino capitalism.
He advanced so called "Minsky
financial instability hypothesis" which postulates that the booms and busts are inevitable under
neoliberalism (aka "free market economy") due to the nature of financial system (
https://en.wikipedia.org/wiki/Hyman_Minsky
):
Minsky proposed theories linking financial market fragility, in the normal life cycle
of an economy, with speculative investment bubbles endogenous to financial markets. Minsky
claimed that in prosperous times, when corporate cash flow rises beyond what is needed to pay
off debt, a speculative euphoria develops, and soon thereafter debts exceed what borrowers
can pay off from their incoming revenues , which in turn produces a financial crisis. As
a result of such speculative borrowing bubbles, banks and lenders tighten credit availability,
even to companies that can afford loans , and the economy subsequently contracts.
This slow movement of the financial system from stability to fragility, followed by crisis,
is something for which Minsky is best known, and the phrase "Minsky moment" refers to this
aspect of Minsky's academic work .
What we experienced in July 2014 can probably be called "Minsky moment" for oil industry (although
it is not the exact meaning of the term).
The flavor of concerns that should have been central to Strange's volume was captured by
Keynes in a passage in The General Theory that is part of the currency of every economist:
Speculators may do no harm on a steady stream of enterprise. But the position is serious
when enterprise becomes a bubble on a whirlpool of speculation. When the capital development
of a country becomes a by-product of the activities of a casino, the job is likely to be
ill done.(p. 159)
The implication of Keynes' comment, and therefore of the title that Strange appropriated,
is that speculation and efficient investment - capital development - are inversely related.
It follows that a volume on Casino Capitalism needs to begin with a serious consideration
of the determinants of investment in capitalist economies with sophisticated and ever evolving
financial structures. Although in the beginning of the book some awareness of the relation
between speculation and efficient investment is evident, Strange does not examine closely how
the capital development of capitalist economies was affected by the financial evolution of
the past decades. What she does do is present in a discursive and somewhat journalistic fashion
the development of the international financial structure in recent years as well as a partial
review of some interpretations of the import of financial arrangements.
In spite of her approach the volume is useful. Economists, especially those who are
comfortable wearing the blinders of neoclassical theory, tend to believe that the evolution
of markets and institutions results mainly from the utility and profit seeking behavior of
units. To this Strange offers the useful antidote that "a monetary system cannot work effectively unless
there is a political authority . . ." , i.e., contracts need to be enforced. Therefore the
outcomes in both the short and the longer runs are the joint result of decisions by market
participants and authorities. Furthermore, economic evolution leads to shifts in the balance
of power between markets and [ oil producing - likbez]
states. [ read OPEC - likbez]
This insight helps explain how the Bretton Woods system broke down [and petrodollars emerged].
The "chaos" that Strange now finds in the international monetary regime is imputed to key decisions
and nondecisions, mainly by the United States, both early on in the postwar period and after
1971. Her main point is that domestic concerns dominated decisions in the United States both
when the United States acted and when it did not. As a result havoc was played with the
order [ including oil price - likbez ] needed for world
economic stability.
"Marvin[Hyman] Minsky was a similar revolutionary in economics pointing
out inherent instability of casino capitalism." ~ likbez
"The term [Minsky
Moment] was coined by Paul McCulley of PIMCO in 1998, to describe
the 1998 Russian financial crisis, and was named after economist Dr. Hyman Minsky,
who noted that bankers, traders, and other financiers periodically played the role of arsonists,
setting the entire economy ablaze. Minsky opposed the deregulation that characterized the
1980s." ~ Wikipedia
The
Wikipedia entry
addresses both points. Interestingly
In 1925, Henry Ford tells the New York Times that ethyl alcohol is "the fuel of the future" which
"is going to come from fruit like that sumach out by the road, or from apples, weeds, sawdust
-- almost anything. There is fuel in every bit of vegetable matter that can be fermented. There's
enough alcohol in one year's yield of an acre of potatoes to drive the machinery necessary to
cultivate the fields for a hundred years."
I take this to mean 1% of land growing potatoes could provide farm fuel for the other 99%. Sounds
way optimistic, but maybe he meant just cultivation, which does not take all that much fuel, as opposed
to planting, plowing and harvesting?
This is quite interesting
from the article: "French bank BNP Paribas last week confirmed it would halt funding oil and gas
companies with large capital requirements, particularly in the US."
"... It is estimated that ~250,000 people have lost their jobs in the industry
in the last 18 months. ..."
"... Ive mentioned this a few times...but in the 80s you SAW the economic crush
all around you. For those who do not live in our visit Houston, Im telling you....something
is very bizarre here that puzzles the shit out of me.....malls are packed, and you
dont see crush anywhere...I dont get it. ..."
One week ago,
when we commented on the latest weekly update from Credit Suisse's very
well hooked-in energy analyst James Wicklund, one particular phrase stuck out
when looking at the upcoming contraction of Oil and Gas liquidity: "while your
borrowing base might be upheld, there will be minimum liquidity requirements
before capital can be accessed. It is hitting the OFS sector as well. As
one banker put it, "we are looking to save ourselves now."
In his latest
note, Wicklund takes the gloom level up a notch and shows that for all the bank
posturing and attempts to preserve calm among the market, what is really happening
below the surface can be summarized with one word: panic, and not just for the
banks who are stuck holding on to energy exposure, or the energy companies who
are facing bankruptcy if oil doesn't rebound, but also for their (now former)
employees. Curious why average hourly earnings refuse to go up except for those
getting minimum wage boosts? Because according to CS "It is estimated
that ~250,000 people have lost their jobs in the industry in the last 18 months."
... ... ...
Wicklund concludes with some even more troubling observations
about the recent OPEC headline-induced volatility and the future price of oil:
Rolling On. What was originally a "surplus-induced" downturn is
now turning into a global credit downturn, with economic demand and GDP
continuing to decline. US corporate debt levels are close to all-time
highs as a share of GDP and global monetary policy has very few levers left
to pull. "Duration" has become the new buzzword, "survivability" appears
to be the key investment metric and any lights in the tunnel appear to
be dimming.
The Fix. Demand was going to be the bailout and specifically consumer
led demand, however, just about every economic report issued seems to
deny that possibility. It is easy to say that with demand growing and
capital starved supply waning, reaching balance and beginning growth is
inevitable. But it may not be as simple as that and the timing remains one
key question. And that key question is one that everyone has an opinion
on. Now, it appears that Saudi, Russia, Iraq and Iran MIGHT come to some
agreement to cap production growth at January levels, which was up more
than 280kbopd from December. The cap offers some positive, but it makes
any production CUTS less likely .
All this, as global demand across every industry continues to contract and
as central banks are now powerless to do virtually anything, means that the
true lows in the oil price are still ahead of us.
Latitude25
Let me guess. The banks are selling securitized energy loans to the muppet
pension funds for pennys on the dollar and soon to be totally worthless.
Central Bankster
If you try to inflate assets, it will cause
massive distortions in price (IE reinflating oil from$30 in 2009 to $110
a few years later) created a massive and misguided allocation of capital
into new oil production...
Antifaschistische
I've mentioned this a few times...but in the 80's you SAW the economic
crush all around you. For those who do not live in our visit Houston, I'm
telling you....something is very bizarre here that puzzles the shit out
of me.....malls are packed, and you don't see crush anywhere...I don't get
it.
...and I have NOTHING to gain from a crush, because I'll eventually get
swept out to sea also...but it's just crazy here with construction at a
non-stop pace. Everyday of my life is like economic doomsday prepping in
Houston.
Beatscape
Coming to a ticker tape near you: The 10(!) times upside Oil ETF, filled
with all these toxic energy loans and oil companies teetering into bankruptcy.
A fool and his money are soon parted.
VWAndy
Bingo they are searching for bagholders now. Too bad there are no bagholders
with pockets that deep.
Racer
As one banker put it, "we are looking to save ourselves now."
Total rubbish, the banks NEVER look to save themselves
buzzsaw99
There are reports of banks selling loans at cents on the dollar
to try and ensure their own survival...
smells like bullshit. which banks? which loans? how many cents on the
dollar? how does booking a major loss ever help a bank?
Bank_sters
Strangely, most articles I read are about how little exposure all the
big banks have. So who is holding the 2 trillion dollars of energy related
debt that has been created over the last 12 years?
abyssinian
All the banks are fine, Deutsche Bank's CEO said they are solid as a
rock and buying their bonds back, JP Morgan CEO just bought tons of company
stocks with his bonus and Tim Seymore Butt from CNBC said there is no recession,
everything is great and people just making noises. Everything is good!
ConanTheLibert... -> abyssinian
"Deutsche Bank's CEO said they are solid as a rock"
Like the corpse has turned solid as a rock?
Catullus
Talked to a consultant in CRE in Texas on Friday. Said he's never seen
it like this in 30 years in Houston. Dallas is ok for now. Credit is terrible.
Everyone asking for LOCs or AAs even for power contracts to the buildings.
Don't let a bank tell you this is energy only exposure. It extends to
CRE as well
Christophe2
LOCs = lines of credit :)
White Mountains
Old Man of the See - this is because if you open a successful profitable
store, tattoo shop, or whatever, the copycats see your success and so open
an identical business right across the street hoping to take your success.
Then, you get to compete on price which means both businesses circle
close to the toilet bowl as you fight tooth and nail for market share and
ever dwindling profits because there is always some dumbass willing to work
himself to death for slave wage returns or even loose money as he knocks
viable businesses out of business.
Amazon's business model is a non-profit loser much like this only on
a huge and very destructive scale.
And if the banks go under who loses? One more reason to believe the Fed
is lying when it denied they allegedly instructed banks to not force bankruptcies
on these companies. Prevent the bankruptcy and find a way to dump the fallout
on someone else to CYA and let someone lower on the food chain take the
hit. Isn't that how the hierarchical criminal ponzi scheme works?
Who do you think the Fed cares more about after themselves, if anyone?
A. Banks
B. Shareholders
C. 3rd Party Corporations that do business with either banks or the Fed
D. Employees of any Corporations
E. Some poor workers pension fund purchasing the new fraud scheme that will
be cooked up to hand these failures off to the muppets
F. None of the above. Central Banks are so megalomaniacal they only care
about themselves, their profits and interests above all else.
Print Length: 416 pages
Publisher: W. W. Norton & Company; 1 edition (April 11, 2016)
Publication Date: April 1, 2016
Sold by: Amazon Digital Services LLC
A complete biography of Marion King Hubbert, one of the twentieth century's most influential
energy experts, who was dubbed the "father of peak oil."
In 1956, geophysicist and Shell Oil researcher Marion King Hubbert forecast that American oil
production would peak surprisingly soon and decline steadily thereafter. Hubbert's prediction
outraged the architects of the U.S. oil industry at the time, but it was largely correct. Even
amid a twenty-first century shale boom, Hubbert's logic remains a source of debate and
controversy.
In a richly researched narrative that surveys Hubbert's papers and correspondence for the
first time, award-winning journalist Mason Inman rescues the history of a man who shocked the
scientific community with his brilliance, eccentricity, and controversy. The Oracle of Oil shows
Hubbert as a man of his era: a time of great intellectual ferment and discovery tinged by dark
undercurrents of intellectual witch hunts.
In its portrait of a man whose prescient ideas about sustainability still resonate today, The
Oracle of Oil looks to the past to find a guiding philosophy for our energy future.
About the Author
Mason Inman is an award-winning journalist who focuses on energy and climate issues. He has
written for National Geographic News, Science, Nature, and The Economist. He lives in Oakland,
California.
Why wouldn't we call the EIA liars in reporting far more Texas oil production than the RRC?
Critics say they are not lying as their difference with the RRC is initial reporting vs. final
estimated reporting. If that critique were valid, then why is the oil production drop by the RRC
from peak triple the fall that the EIA reports for Texas?
"... Following on from a sharp downward revision in its benchmark crude and natural gas price assumptions in January, S&P also lowered the ratings on 25 speculative-grade companies after reviewing 45. ..."
"... S&P on January 12 slashed its Brent and WTI crude price assumptions to $40/barrel each (from $55 and $50 respectively) and Henry Hub natural gas price assumption to $2.50/MMBtu (from $3). ..."
"... S&P flagged the "liquidity risks" faced by the smaller E&P companies, "particularly with respect to the April 2016 revolving credit facility bank borrowing base redeterminations." ..."
"... S&P expects the companies' borrowing bases will have shrunk by 20-30% at the next re-determination in April, as the cutback in drilling activity in 2015 has hobbled their reserves replacement. ..."
"... The US Energy Information Administration in its short-term market outlook released Feb 9 said it expects US production to fall to an average 8.69 million b/d this year from an average of 9.43 million b/d in 2015. And slip further to 8.46 million b/d in 2017. ..."
US E&P sector sucking wind: Is oil's equilibrium closer than we think?
How long does the world have to wait before all the surplus oil sloshing
around gets mopped up and prices find an equilibrium point that represents balanced
supply and demand? Would you believe it if someone said that might be just a
quarter and a bit away?
On the supply side, all bets are on shale to bail: there is no hope of output
cuts from OPEC, let alone a coordinated action with other major producers such
as Russia, amid a stubborn quest for market share.
If anything, most OPEC members are pumping full tilt and some such as Kuwait
and Iraq are eying a production boost this year. A sanctions-free Iran is preparing
to offload an additional 0.5-1.0 million b/d on an already oversupplied market,
though the pace of that return is highly uncertain.
The question then arises, how long before more US producers buckle under
and how sharp might the drop in output be?
Standard & Poors Ratings earlier this month downgraded big names in shale
including Chevron, Apache, EOG Resources, Devon, Hess, Marathon and Murphy.
Of the 20 "investment-grade" companies the agency reviewed, three were placed
on Creditwatch with negative implications, and the outlook on another three
revised to negative.
Until now, such actions had mostly affected the speculative-grade companies,
S&P noted.
Following on from a sharp downward revision in its benchmark crude and
natural gas price assumptions in January, S&P also lowered the ratings on 25
speculative-grade companies after reviewing 45.
S&P on January 12 slashed its Brent and WTI crude price assumptions to
$40/barrel each (from $55 and $50 respectively) and Henry Hub natural gas price
assumption to $2.50/MMBtu (from $3).
S&P flagged the "liquidity risks" faced by the smaller E&P companies,
"particularly with respect to the April 2016 revolving credit facility bank
borrowing base redeterminations."
A borrowing base is the maximum amount of money a bank will lend to an energy
company based on the value of its reserves at current market prices.
S&P expects the companies' borrowing bases will have shrunk by 20-30%
at the next re-determination in April, as the cutback in drilling activity in
2015 has hobbled their reserves replacement.
Also, more hedges will roll off this year, and the values on the futures
curve are below many bank borrowing base prices, S&P credit analysts noted.
As they hunker down, S&P expects many of the companies to continue lowering
capital spending and focus on efficiencies and drilling core properties. However,
the analysts say, "these actions, for the most part, are insufficient to stem
the meaningful deterioration expected in credit measures over the next few years."
The US Energy Information Administration in its short-term market outlook
released Feb 9 said it expects US production to fall to an average 8.69 million
b/d this year from an average of 9.43 million b/d in 2015. And slip further
to 8.46 million b/d in 2017.
But like any forecast, this year's figure could be revised down further.
Exactly a year ago, in its February 2015 report, the EIA had estimated 2016
US production at 9.52 million b/d. The agency has progressively whittled down
the figure since October last year.
Meanwhile, a total of 67 US oil and gas companies filed for bankruptcy in
2015, according to consultants Gavin/Solmonese, a whopping 379% spike on 2014,
CNN reported last week.
Might the other big shadow looming on the markets - Iran - turn out to be
a teddy bear?
Iranian businesses continued to be hobbled by the sanctions fallout. Some
US clearing banks have warned banks in Europe, Asia and the Middle East that
their US-based dollar accounts will face close scrutiny if they do business
with Iran.
This has prevented banking transactions with Iran starting up again despite
the removal of sanctions, the Financial Times said in this
report Feb 14.
Not surprisingly, expectations on the pace of Iran's incremental barrels
flowing into the market are taking a more conservative turn. As Platts reporter
Robert Perkins highlights in this
analysis published Feb 8, a 500,000 b/d immediate rise and 1 million b/d
within six months is seen as "wildly optimistic."
Platts calculations based on current market consensus point to a far sober
200,000 b/d rise in the first quarter, growing to 450,000 b/d by year-end.
Excluding Iranian supply, global oil balances are now seen returning to equilibrium
by the third quarter of 2016, according to implied market outlooks from the
International Energy Agency, the EIA and OPEC.
That brings us to the "dread discount" on oil because of the wider global
financial markets panic since the start of the year, triggered in large part
by fears over Chinese economic growth.
While impossible to quantify, could the discount evaporate if the global
economy performs much better than the doomsday scenarios currently preying on
nerves?
To paraphrase Mark Twain, it ain't what the oil markets don't know that will
get them into trouble. It's what they know for sure that just ain't so.
"... If additional oil were not supplied to the market, then the global surplus of oil would fall by at least 1.3 million barrels per day, Novak added. ..."
MOSCOW Consultations on a preliminary deal between leading oil producers to freeze output
should be concluded by March 1 after a group led by Russia and Saudi Arabia reached a common
position this week in Doha, Russia's energy minister said.
... ... ...
Novak said talks between Venezuela and Iran were still ongoing, and said consultations would
also be held with non-OPEC countries, including Mexico and Norway.
"I believe that they (Mexico and Norway) would take a constructive stance," he said.
If additional oil were not supplied to the market, then the global surplus of oil would fall
by at least 1.3 million barrels per day, Novak added.
... ... ...
Novak also said it was "discussed with colleagues" that an oil price of $50 per barrel would
suit consumers and exporters in the long term. He did not elaborate.
What's really behind falling
oil prices? Are there more conspiratorial forces at work here?
There are certainly some who believe so…
According to CNBC, Iranian President Hassan Rouhani told a cabinet meeting
back on Dec. 10, 2014, that the
oil price collapse was "politically motivated" and a "conspiracy against the interests of the
region, the Muslim people, and the Muslim world."
... ... ...
Echoing Rouhani's sentiment, Russian President Vladimir Putin said, "We all see the lowering of
the oil price. There's lots of talk about what's causing it. Could it be the agreement between the
U.S. and Saudi Arabia to punish Iran and affect the economies of Russia and Venezuela? It could."
... ... ...
Oil Conspiracy Theory No. 3: I'll Have Iranian Oil with a Side of Economic Prosperity, Please
On April 7, 2015, the Energy Information Administration released the following statement: "Oil
prices could tumble $15 a barrel next year if sanctions are lifted following a final nuclear deal
with Iran."
While Iran and other world powers reached a preliminary deal on April 2, 2015, further negotiations
are needed to complete an agreement by a June 30 deadline.
Bloomberg Financial reports that "Iran's full return to the oil market
risks delaying a recovery in prices, which have slumped by almost half since last year amid a supply
glut. Iran could boost output by at least 700,000 barrels a day by the end of 2016."
That's right, Iran itself is a potential whale of an oil exporter – it sits on at least 10% of
the world's reserves. But because of sanctions, the country lacked the foreign investment it needs
to actually get the darn oil out of the ground.
Until now.
The oil price conspiracy theory here is that the Iran nuclear deal was made simply to boost the
U.S. economy, while further damaging Russia's. After all, there are several reasons why a drop in
oil prices is great for the American economy: it encourages consumer spending, it improves the job
market and it provides businesses with more profits.
Oil Conspiracy Theory No. 4: Sneaky, Sneaky POTUS
One conspiracy theory suggests that U.S. President Barack Obama colluded with the Saudis to flood
the global market with oil to bring down the U.S. shale oil industry. Why would he want to do that?
Because the shale oil glut threatens the development of renewable energy and slows progress in
cutting U.S. greenhouse gas emissions. According to this theory, POTUS is using the oil glut to destroy
anti-environmental projects across the board within the U.S.
In an article published by Slate, "Senate Democrats narrowly defeated
the Keystone XL pipeline
[bill on Tues., Nov. 18, 2014] in part because President Obama was expected to veto it even if it
did pass. He likely feels more comfortable about that stance than he would if oil were priced at
more than $100 a barrel right now."
Furthermore, Saudi Arabia hates the American shale oil industry as well. Though King Riyadh is
an ally, relations with the country are fraught over this particular subject. So what better way
to kill two birds with one stone? Let's just keep our Saudi allies happy while covertly
destroying the purportedly environmentally unfriendly fracking industry from within. More oil, please!
"... A friend of mine who is a financial person predicted $20s oil in 2013. I told him he was nuts, explained to him costs. He said he could care less about costs, said price has to revert to historical norms. ..."
"... He now says oil will average below $35 for at least the next five years. I tell him that will bankrupt almost all US producers and many nations. He says doesnt matter, that stuff is not relevant, not even a part of the equation. ..."
"... I would say he is full of it except he predicted $20s. He says oil producers in no way determine oil prices, that prices are all determined by traders. He says traders do not care about anything concerning the upstream industry. ..."
"... I do not agree with him, but this is the way financial folks think. And they are the ones trading the oil futures. ..."
John S. I agree but many of the financial people do not.
A friend of mine who is a financial person predicted $20s oil in 2013. I told him he was
nuts, explained to him costs. He said he could care less about costs, said price has to revert
to historical norms.
He now says oil will average below $35 for at least the next five years. I tell him that
will bankrupt almost all US producers and many nations. He says doesn't matter, that stuff is
not relevant, not even a part of the equation.
I would say he is full of it except he predicted $20s. He says oil producers in no way
determine oil prices, that prices are all determined by traders. He says traders do not care about
anything concerning the upstream industry.
I do not agree with him, but this is the way financial folks think. And they are the ones
trading the oil futures.
Ron, you were in the financial industry. I assume you agree my friend is full of crap?
"How is it possible that monster wells in PA and OH can keep prices at a level where virtually
all gas in the US is being produced at a loss on an operating basis?" ~ Shallow Sand
-You continue to think and analyze the situation the old fashion way: supply-demand fundamentals.
That is why you are (continue to be…) puzzled!
-This time is different (as I explained "thusly" numerous times before).
The way things stand at the moment, price upstream means very little to price down stream…
"... There are 3100 wells in the Williston Basin that are producing 40 bpd and less, if they all are producing close to the forty barrels per day, the shutting of those wells will reduce the production by some 120,000 bpd, maybe. Daily production would fall to one million bpd and maybe even close in on 900,000 bpd with decline. ..."
"... Bakken well horizontals are known to fill up with sand, so you have to keep pumping oil to prevent plugging the horizontal. ..."
"... Madison Formation oil is a heavier oil than Bakken oil, the classic dark green gray color of the oil is there, it is oily oil, clings to the side of the jar, not the light stuff like Bakken crude. A distinct color difference between the two oils. ..."
There are 3100 wells in the Williston Basin that are producing 40 bpd and less, if they all
are producing close to the forty barrels per day, the shutting of those wells will reduce the
production by some 120,000 bpd, maybe. Daily production would fall to one million bpd and maybe
even close in on 900,000 bpd with decline.
Madison Formation wells and Red River Formations have produced plenty of oil over the years,
nothing like the Bakken though. If you view the pdf, the production for each formation is right
there. Bakken well horizontals are known to fill up with sand, so you have to keep pumping oil
to prevent plugging the horizontal. You will need two hamsters in the wheel to make it go faster.
Madison Formation oil is a heavier oil than Bakken oil, the classic dark green gray color of
the oil is there, it is oily oil, clings to the side of the jar, not the light stuff like Bakken
crude. A distinct color difference between the two oils.
"... And this, just in: ExxonMobils reserve-replacement ratio for 2015: 67%. First time in 22 years it hasnt been at least 100%. ..."
"... Usually when Exxon, cant be bother drill exploration wells, they go drilling on the corner of Wall and Broad St NY. Obviously the prognosis is not looking so good there as well! ..."
Usually when Exxon, can't be bother drill exploration wells, they go drilling on the corner
of Wall and Broad St NY. Obviously the prognosis is not looking so good there as well!
[Feb 20, 2016] Tech Talk - Oil Supply, Oil Prices and Saudi Arabi
Notable quotes:
"... Thus slight reductions in production from OPEC, and particularly the Kingdom of Saudi Arabia (KSA), can keep the world supply in balance with demand and more critically for them keep the price up at a level that they are comfortable with. Note that in relation to the overall volumes of oil being traded, they are not talking much adjustment in their overall volume (around 1% of the total 30 mbd) in order to sustain prices. The USA produces more, OPEC produces less – not much less because global demand is growing – and the price is sustained. ..."
"... This has virtually nothing to do with the speculators on Wall Street and the corrections they might impose, this is all about supplying a needed volume to meet a demand and controlling that supply to ensure that the price is sustained. ..."
"... As I have noted in the past, OPEC is sufficiently suspicious of the reported numbers from the countries themselves that they check from secondary sources, and provide both sets of numbers. ..."
"... One of the other caveats is that the internal demand in these countries is rising, and that lowers the amount that can be exported. This will in time require that OPEC produce more, just to sustain the amounts that they export. And the problem here is the biggest caveat of all. Because KSA cannot continue to produce ever-increasing amounts of oil. ..."
"... But these new fields, including Manifa and Safaniya produce a heavier crude that, for years, KSA struggled, usually in vain, to find a market for internationally. It is only now that it is building its own refineries to process the oil that it can find a global market for the product. ..."
"... Realistically, over a couple of years, I would suspect that the oil price line that I mentioned was rising at the beginning of the piece will continue to rise and we are just going to have to accommodate to it. ..."
From the time that The Oil Drum first began and through the years up to the Recession of 2008-9,
there was an increase in the price of oil, and that resumed following the initial period of the recession,
and in contrast to the price of natural gas, oil has recovered a lot of the price that it lost.
Figure 1. Comparable price of oil from 1946 (Inflation
data)
If one were to draw a straight line on that graph from the low point in 1999 though now, there
hasn't been a huge variation away from the slope of that line for long. That, of course, does not
stop folk from pointing to the very short, roughly flat bit at the end and saying that oil prices
are going to remain at that level, or are even
about to decline.
To address that final point first, I would suggest that those making such a foolish prediction
should go away and read the OPEC Monthly
Oil Market Reports. Remember that, for just a little while longer, oil is a fungible product.
OPEC make no secret of the fact that they continuously examine the global economy and make estimates
on how it is going to behave.
This month they note that the economies aren't doing quite as well as expected, and have revised
down global growth to 2.9%, though they expect next year to be better, and hold to their estimate
of a 3.5% growth rate.
But OPEC go beyond just making that prediction - they use it, and data that they have on consumption
and oil supplies around the world to estimate how much OPEC should produce each month to balance
supply against demand, so that the price will remain at a comfortable level for the OPEC economies.
And based on those numbers they tailor production.
This month, for example, they note that global oil demand is anticipated to grow by 0.8 mbd this
year (and by 1.04 mbd in 2014). They anticipate growth in production of around 1.0 mbd from the non-OPEC
nations, with projected increases from Canada, the United States, Brazil, the Sudans and Kazakhstan
contributing to an additional 1.1 mbd next year. From these numbers they can project that demand
for OPEC oil will be slightly down this year, at 29.9 mbd down 0.4 mbd on last year, with next year
seeing an additional fall of 0.3 mbd on average.
Figure 2. Projected oil demand for 2013 (OPEC
MOMR )
Thus slight reductions in production from OPEC, and particularly the Kingdom of Saudi Arabia (KSA),
can keep the world supply in balance with demand and more critically for them keep the price up at
a level that they are comfortable with. Note that in relation to the overall volumes of oil being
traded, they are not talking much adjustment in their overall volume (around 1% of the total 30 mbd)
in order to sustain prices. The USA produces more, OPEC produces less – not much less because global
demand is growing – and the price is sustained.
This has virtually nothing to do with the speculators on Wall Street and the corrections they
might impose, this is all about supplying a needed volume to meet a demand and controlling that supply
to ensure that the price is sustained.
There are a number of caveats to this simplified explanation, one being the short-term willingness
and ability of some producers to keep to their targets. One of the imponderables is the production
from Iraq. Although Iraq
has been given a waiver through 2014 on the need to limit their production, the increasing violence
has led to a drop in production,
back below 3 mbd.
Figure 3. OPEC production based on data from secondary sources (OPEC
MOMR)
As I have noted in the past, OPEC is sufficiently suspicious of the reported numbers from the
countries themselves that they check from secondary sources, and provide both sets of numbers.
Figure 4. OPEC production numbers from the originating countries. (OPEC
MOMR August 2013)
Note, for example, that Iran says that it is producing over 1 mbd more than other sources report,
and Venezuela is around 400 kbd light. The balancing act is largely the charge of KSA, since it produces
the largest amount and can adjust more readily to balance the need.
One of the other caveats is that the internal demand in these countries is rising, and that lowers
the amount that can be exported. This will in time require that OPEC produce more, just to sustain
the amounts that they export. And the problem here is the biggest caveat of all. Because KSA cannot
continue to produce ever-increasing amounts of oil.
Just exactly how much the country can produce is the subject of much debate, and has been at The
Oil Drum since its inception. But if I can now gently admonish those who think it can keep increasing
forever and that it has vast reserves that can flood the market at need. This fails to recognize
that the major fields on which the country has relied are no longer capable of their historic production
levels, and that over the time that TOD has been in existence, production has switched to the new
fields that KSA had promised it would, back in time.
But these new fields, including Manifa and Safaniya produce a heavier crude that, for years, KSA
struggled, usually in vain, to find a market for internationally. It is only now that it is building
its own refineries to process the oil that it can find a global market for the product. Yet those
refineries have only a limited capacity. If you can't ship, refine and market your product in the
form that the customer needs, it can't be sold, regardless of how much, instantaneously, you can
pump out of the ground. And so KSA is starting to look harder for other fields. They have increased
the number of rigs employed to 170 by the end of the year (in 2005 they had about
20 oil and 10 gas rigs operating), going beyond
the 160 estimated earlier, seeking both to raise production from existing fields, but also to find
new ones. This is almost double the number that Euan reported at the end of last year. That this
is being expedited is not good news! Because new fields will very likely be smaller, and more rapidly
exhausted, and may not have the quality of the oil produced from Ghawar and the other old faithfuls.
Realistically, over a couple of years, I would suspect that the oil price line that I mentioned
was rising at the beginning of the piece will continue to rise and we are just going to have to accommodate
to it.
I define the ECI (Export Capacity Index) ratio as the ratio of total petroleum liquids + other liquids
production to liquids consumption. So, production of 2.0 mbpd and consumption of 1.0 mbpd would result
in an ECI ratio of 2.0 (or they were consuming half of production). Mathematically of course, a declining
ECI ratio means that the net exporter is trending toward zero net oil exports (and an ECI ratio of
1.0).
Note that some countries with flat net exports, e.g., Russia, which had net exports of 7.2
mbpd in 2007 and in 2012 (EIA), showed declines in their ECI ratios. Russia's ECI Ratio fell from
3.7 in 2007 to 3.3 in 2012.
If we look at 2005 to 2012 data, as annual Brent prices increased from $55 to $112, only seven
countries showed increases in their ECI ratios--Canada, Colombia, Iraq, Libya, Kazakhstan, Azerbaijan
and Nigeria. If we look at the last three years of data, 2010 to 2012, as annual Brent prices were
respectively $80, $111 and $112, only four of these seven countries still showed increases in their
ECI ratios--Canada, Colombia, Iraq and Libya. The other three--Kazakhstan, Azerbaijan and Nigeria--showed
declining ECI ratios from 2010 to 2012. And of course, Libya comes with an asterisk, because of political
unrest.
So, only 4 of the (2005) Top 33 net oil exporters showed: (1) An increasing ECI Ratio from 2005
to 2012, and (2) Maintained an increasing ECI ratio from 2010 to 2012.
Incidentally, some other countries did show increases in their ECI ratios from 2010 to 2012, but
they remained below their 2005 levels, e.g., the UAE's ECI ratio increased from 4.6 in 2010 to 5.1
in 2012, but they remained well below their 2005 ECI ratio of 7.6, i.e., the UAE is (so far at least)
on an "Undulating Decline" in their ECI ratio. At the 2005 to 2012 rate of decline in the UAE's ECI
ratio, they were on track to approach zero net oil exports in less than 30 years.
The overall (2005) Top 33 net oil exporters' ECI ratio fell from 3.75 in 2005 to 3.26 in 2012
(EIA).
As I have noted before, the cyclical pattern of higher annual oil price highs and higher annual oil
price lows is very interesting, especially in regard to "Higher lows." Following are the last three
year over year declines in annual Brent crude oil prices (1998, 2001 and 2009), along with the rates
of change for 1998 to 2001 and for 2001 to 2009.
If Brent averages $108 in 2013, down from $112 in 2012, it would be a +14%/year rate of change
(since the 2009 price of $62), which would be between the +12%/year and the +20%/year rates of change.
Following is a chart of the GNE/CNI* ratio versus annual Brent crude oil prices for 2002 to 2011.
For 2012, Brent averaged $112, and EIA data show that the GNE/CNI ratio fell from 5.3 in 2011 to
5.0 in 2012.
*GNE = Combined net oil exports from (2005) Top 33 net oil exporters, BP + EIA data for graph,
total petroleum liquids CNI = Chindia's (China + India) Net Imports, BP data
Rupee woes: More trouble ahead as oil prices touch all time high
In a press release dated August 16, 2013, the Ministry of Petroleum and Natural Gas, talks
about the increasing under-recoveries on diesel. The under-recovery on diesel has gone up to Rs
10.22 per litre for the fifteen day period ending August 15, 2013. Before this, the under-recovery
was at Rs 9.29 per litre. This leads to a daily under-recovery of Rs 389 crore or Rs 11,670 crore
for the month. That's the under-recovery just on diesel. Other than this there are under-recoveries
on cooking gas as well as kerosene. The under-recoveries for the first quarter of 2013-2014 (i.e.
period between April 1, 2013 and June 30, 2013) stood at Rs 25,579 crore.
This is likely to go up during this quarter, given the depreciation of the rupee and the increasing
price of oil. Oil prices have been going up internationally because of the uncertainty that prevails
in Egypt. The "fear premium" is getting built into the price of oil.
....
Only very recently, the government started to increase the price of diesel, to reduce the under-recoveries.
But with the international price of oil going up and the rupee depreciating against the dollar,
even at higher prices, the under-recoveries on diesel haven't come down. The under-recovery on
diesel was at Rs 9.29 per litre in January. It is now at Rs 10.22, despite diesel prices going
up.
I have been running my own site for some time at
Bit Tooth Energy . It covers more than
just Peak Oil - there is a weekly column on the use of high pressure water (which I actually did
for a living once) and other OT matters - come on over, the water is fine!
The ability to generate cash flow has fallen substantially
Notable quotes:
"... Moodys says weakness in prices for crude oil and natural gas has caused a fundamental change in the energy industry, whose ability to generate cash flow has fallen substantially – a condition Moodys believes will persist for several years, so it is in the process of recalibrating the ratings of many energy companies to reflect the industry shift. ..."
"... More downgrades are sure to be on the way following last months move by the ratings agency in placing the credit ratings of 120 energy companies and 55 mining companies from around the world on review for possible downgrade. ..."
"... How is it possible that monster wells in PA and OH can keep prices at a level where virtually all gas in the US is being produced at a loss on an operating basis? ..."
"... I fault the business model for a high IP reserve quick declining production company that will be flipped in 3-5 years to a greater fool. I loath the Oklahoma companies and their business practices which have been adopted by many Texas companies and the bastardization of regulatory practices which have enabled the get rich quick pursuit of yield at any cost for all but a select few executives and investment advisors. ..."
"... Personally, I am overjoyed to see NG rig counts at a historic low. I think the train is about to run off the tracks. There is simply no possibility that 100 rigs can drill enough rock in a year to replace the reserves produced on an annual basis. And if annual production is not replaced each and every year then we are SELF LIQUIDATING! ..."
"... I am very suspicious of these so called monster wells in the Maecellus and Utica. I am willing to admit that some exist but am very doubtful that repeatable wells exist on the scale claimed by that the cheerleaders. ..."
"... Free money in my opinion caused the market distortion between natural gas and crude oil pricing. I think the historical price ratio might be restored so if gas is marketed for $2/mcf then oil will be priced around $20/bbl. If Heinrich is right about natural gas and the gas recovers to $6-8/mcf then maybe we will see oil priced at $60-80/bbl. ..."
"Moody's says it has downgraded a total of 28 energy companies since December, including another
eight yesterday.
Anadarko Petroleum (NYSE:APC), Continental Resources (NYSE:CLR), Hess (NYSE:HES), Murphy Oil
(NYSE:MUR), Southwestern Energy (NYSE:SWN) and Western Gas Partners (NYSE:WES) were cut to junk
levels.
National Fuel Gas (NYSE:NFG) and Noble Energy (NYSE:NBL) were lowered to Baa3, one notch above
junk.
Outlooks for Cimarex Energy (NYSE:XEC) and EQT Corp. (NYSE:EQT) were confirmed above junk without
downgrades, while EQT Midstream (NYSE:EQM) was affirmed in junk territory but not downgraded.
Moody's says weakness in prices for crude oil and natural gas has caused a fundamental change
in the energy industry, whose ability to generate cash flow has fallen substantially – a condition
Moody's believes will persist for "several years," so it is in the process of recalibrating the
ratings of many energy companies to reflect the industry shift.
More downgrades are sure to be on the way following last month's move by the ratings agency
in placing the credit ratings of 120 energy companies and 55 mining companies from around the
world on review for possible downgrade."
I know extremely little about natural gas production.
The rig count at 100 has never been so low.
How is it possible that monster wells in PA and OH can keep prices at a level where virtually
all gas in the US is being produced at a loss on an operating basis?
I know a little about natural gas production but over the last 8 years I have found that I
know very little about natural gas "markets". But I think we both agree that everything in this
business has been hugely distorted over the last 8 years or so.
I fault the business model for a "high IP reserve" quick declining production company that
will be flipped in 3-5 years to a greater fool. I loath the Oklahoma companies and their business
practices which have been adopted by many Texas companies and the bastardization of regulatory
practices which have enabled the "get rich quick" pursuit of yield at any cost for all but a select
few executives and investment advisors.
Personally, I am overjoyed to see NG rig counts at a historic low. I think the train is
about to run off the tracks. There is simply no possibility that 100 rigs can drill enough rock
in a year to replace the reserves produced on an annual basis. And if annual production is not
replaced each and every year then we are SELF LIQUIDATING!
I am very suspicious of these so called monster wells in the Maecellus and Utica. I am
willing to admit that some exist but am very doubtful that repeatable wells exist on the scale
claimed by that the cheerleaders.
Free money in my opinion caused the market distortion between natural gas and crude oil
pricing. I think the historical price ratio might be restored so if gas is marketed for $2/mcf
then oil will be priced around $20/bbl. If Heinrich is right about natural gas and the gas recovers
to $6-8/mcf then maybe we will see oil priced at $60-80/bbl.
So after my rant, let me just say that I personally see light at the end of the tunnel. I just
hope that I'm not standing on the wrong track and that that light is a train headed straight for
me.
"... I see this debt cliff as a yet another blowback of neoliberalism, which automatically generates bubble after bubble. Not that different in nature from dot-com bubble of subprime bubble. You see, all an effective CEO does is juicing shareholder value , often measured quarterly. So, with low or no profits, many chose to borrow money to increase shareholder value by carpet bombing fields with wells thereby increasing share price. Or they chose to juice dividends. Those easy money is what created and sustained shale boom. After all they used to have huge hopes for the future. ..."
"... Now Wall Street is keeping them by the balls as the level of debt does not allow to cut production which would rebalance the market. So this downtrend proved to be sticky. They need all the money they can make to service the debt or they are gone with the wind. In other words they are hostages of their own debt and financial companies which provide it and cant cut production without severe adverse effects. That actually include not only shale players but such conventional players as Rosneft. ..."
It is a foolish argument to think that financial manipulations or trading vehicles can change
the value of the underlying (a barrel of oil or a british pound) for more than a short timeframe,
if the the market for the underlying is a wide open high volume one.
So, to think that Soros caused the British Pound to fall is faulty thinking. He and his partners
just saw the writing on the wall earlier and more clearly than others, and had the balls to take
a big risk that they had the timeframe right. Regardless of his trades, that pound was way overvalued
relative to other currencies and the market would have worked it down just same (likely more slowly).
Today, the most over-valued big currency is the Chinese renimbi. I just don't have the sophistication
to put a big bet on it, or I would.
"It is a foolish argument to think that financial manipulations or trading vehicles can change
the value of the underlying (a barrel of oil or a british pound) for more than a short timeframe,
if the market for the underlying is a wide open high volume one."
I like your faith in the innocuous nature of neoliberal marketplace. As reflected in your statement
above. Yes we can. Keep the faith brother --
Another consideration is that there is no market as we used to understand it. Instead there
is a financial casino in which due to commodities modernization act the trend down can be fed
with dollars and acquire its own momentum like snow avalanche and crush everybody and everything
on its way. Amount of dollars that can participate is the amplifying the downtrend ("paper oil")
is much larger then the amount of ""real oil" so it a way it does not matter. Add HFT to the picture
(which really can drive the prices down as was confirmed by GS during Aleynikov trial) and you
have more or less complete image of the modern "marketplace" were most trades are executed by
robots not by people.
Still if "a short timeframe" is 18-36 month you are probably right. But it can be longer, especially
if you add some help from Saudis (predatory pricing). I doubt that this situation can last till
the end of 2017.
I see this debt cliff as a yet another blowback of neoliberalism, which automatically generates
bubble after bubble. Not that different in nature from dot-com bubble of subprime bubble. You
see, all an effective CEO does is juicing "shareholder value", often measured quarterly. So, with
low or no profits, many chose to borrow money to increase shareholder value by "carpet bombing"
fields with wells thereby increasing share price. Or they chose to juice dividends. Those easy
money is what created and sustained shale boom. After all they used to have huge hopes for the
future.
Now Wall Street is keeping them by the balls as the level of debt does not allow to cut
production which would rebalance the market. So this downtrend proved to be sticky. They need
all the money they can make to service the debt or they are gone with the wind. In other words
they are hostages of their own debt and financial companies which provide it and can't cut production
without severe adverse effects. That actually include not only shale players but such conventional
players as Rosneft.
In other words they are no longer independent players capable of making their own decisions.
Negative cash flow can do wonders with the management worrying about managing their own debt.
Which explains
"masters of the universe" mentality better then my post:
John S. I agree but many of the financial people do not.
A friend of mine who is a financial person predicted $20s oil in 2013. I told him he was
nuts, explained to him costs. He said he could care less about costs, said price has to revert
to historical norms.
He now says oil will average below $35 for at least the next five years. I tell him that
will bankrupt almost
all US producers and many nations. He says doesn't matter, that stuff is not relevant, not
even a part of the equation.
I would say he is full of it except he predicted $20s. He says oil producers in no way determine
oil prices, that prices are all determined by traders. He says traders do not care about anything
concerning the upstream industry.
I do not agree with him, but this is the way financial folks think. And they are the ones
trading the oil futures.
Ron, you were in the financial industry. I assume you agree my friend is full of crap?
Something similar to GNE is happening within the US, which I would call "local net oil exports"
The horizontal drilling and fracturing in the Bakken formation, Eagle Ford, and areas of similar
oil bearing strata uses a lot of energy in the process. I have mentioned before about how Tesoro's
Mandan, ND refinery (70,000 bpd being expanded to 110,000 bpd) cannot produce enought diesel fuel
for the local market. This is mainly due to the Bakken oil production requiring HUGE amounts of
diesel fuel, besides the transport system (both trucks and railroads) being fueled to keep the
oil and supplies moving. My customer each month moves millions of gallons of diesel from the Fargo
ND pipeline (fed by St. Paul, MN refinery) every month to Bismark, ND. This "imported " diesel
keeps trucks fueled in the Bakken formation area.
So as EROEI decreases for oil production regions like the Bakken, less percentage of that oil
will ever be "exported" to other areas of the US. Tesoro's increase in refinery capacity will
not help lower diesel prices in ND, now near $5/gallon, since most of the new diesel produced
will be used locally for Bakken region users, IMO.
1,000 truck trips per constructed pad site, with maybe 5,000 pads to be built in the 50,000
well drill plan. That's a lot of diesel....especially since trucks keep running after the pad
is built too.
The EROEI of oil sands production ranges from 12:1 for the most efficient mining operations
to about 4:1 for the least efficient steam injection projects. I tend to use 6:1 as an arbitrary
number for discussion purposes.
However, the Bakken probably has an EROEI in the same range once all the fuel consumption for
drilling, fracing, and trucking the product are factored in. The oil industry is indeed a very
intensive user of diesel fuel.
In the case of oil sands, though, the fuel is natural gas, which is trading far below its fuel
value on an energy equivalence basis, so in money terms it works out rather well for the companies
in the long term. OTOH, the Bakken wells may not have a long term given their very steep production
decline rates.
I found a source earlier this year where nat gas consumption for Canadian tar sands was published
and this led to an ERoEI estimate of 3. When ERoEI approaches one we are really dealing with energy
conversion as opposed to energy "production", and as you point out with nat gas cheap in N America,
this is currently an attractive proposition.
We are happy to do energy conversions of coal and gas to electricity with significant energy
losses along the way. Upgrading energy quality is a vital component of our energy system.
The thing that gets me right now in N America is how expensive shale gas has dumped nat gas
prices making the oil sands more attractive.
I was working from industry numbers. Companies don't generally calculate EROEI, but you can
calculate it from their oil production and gas consumption data. It's important to realize they
are steadily improving the EROEI as they make improvements in the technology. A lot of the technology
is very new, so an EROEI of 3 is probably from old data.
However, the low price of NG certainly makes the industry's bottom line look better. There
are NG fields near and directly underneath the oil sands. A lot of the oil sands companies have
their own NG wells, and no economic market for the NG other than to feed it into their own oil
sands plants.
There are also shale gas fields nearby that recent studies have determined are as big as those
in the US, but they are definitely uneconomic at current prices.
The Bakken region sounds to be a perfect place for CNG/LNG for truck/train haulage. They are
currently flaring Nat gas due to lack of market, and needing to invest heaps to import diesel.
Kill two birds with the one stone. Use the waste nat gas instead of expensive diesel. The drilling
rigs and maybe even the frac trucks could also be converted. The technology is there, just need
managers to start thinking outside the box, and start making use of all the resources available
to them. This seems the easy way to decrease the amount of liquid fuel inputs into high cost oil
production.
It takes more than managers thinking about it, it requires government regulation to prevent
flaring.
This is an obscure historical point, but it was NG flaring that led to provincial regulation
of the oil industry in Alberta. Oil companies flared off about $20 billion worth of NG (at today's
prices) and permanently damaged the reservoir drive on the old Turner Valley field. It was quite
obvious what was going on because people in Calgary, 100 miles away, could see the flares lighting
up the night skies and smell the sulfur from the burning gas. Ducks stopped going south for the
winter and people used to hunt rabbits at night with the light from the flares.
The oil companies and the federal government rejected provincial government regulation of flaring,
and the supreme court stuck down several laws, but the Alberta government proved it could be very
innovative at inventing new laws, it could pass them faster than the courts could strike them
down, and things could turn very ugly at election time - the opposing parties were not just defeated
but completely wiped out in Alberta.
Eventually the companies, the Feds, and courts agreed that it was easier to let the Alberta
government regulate NG production, and it has done so very positively ever since. This was the
origin of the Alberta Energy Resources Conservation Board.
"... And as I commented on another post, a couple of years ago Citi Research put the gross decline rate from existing US gas production at about 24%/year. This would be the rate of decline in the absence of new wells. Note that Louisiana showed a 20%/year net rate of decline in total marketed gas production from 2012 to 2014 (this was the net rate of decline after new wells were put on line). So, the Louisiana case history would seem to confirm the CIti estimate. ..."
"... The estimated volumetric loss of US gas production from existing wells, about 17 BCF/day per year, matches or exceeds the 2014 annual dry gas production of every country in the world, except for the US Russia (2014 BP data). ..."
Oilpro.com had an article about the EU importing LNG from the US and Australia, in order to reduce
their reliance on Russian gas. My response:
Based on production and consumption data through 2014 (BP), and ignoring changes in storage
volumes, in 2014 Russia had net natural gas exports of 16 BCF/day, Australia had net natural gas
exports of 2.5 BCF/day and the US had net natural gas imports of 3 BCF/day. So, as of 2014 anyway,
combined net natural gas exports from the US + Australia would be approximately zero.
And as I commented on another post, a couple of years ago Citi Research put the gross decline
rate from existing US gas production at about 24%/year. This would be the rate of decline in the
absence of new wells. Note that Louisiana showed a 20%/year net rate of decline in total marketed
gas production from 2012 to 2014 (this was the net rate of decline after new wells were put on
line). So, the Louisiana case history would seem to confirm the CIti estimate.
The estimated volumetric loss of US gas production from existing wells, about 17 BCF/day
per year, matches or exceeds the 2014 annual dry gas production of every country in the world,
except for the US & Russia (2014 BP data).
So, while the Marcellus/Utica Play has some very impressive wells, in round numbers it seems
likely that we need the productive equivalent of a new Marcellus Play every year, or the productive
equivalent of all of Qatar's gas production every year, just to offset the declines from existing
US wells–as the overall US rig count has declined about 70% from the rig counts we have seen in
recent years.
"... Kellyb. Raw Energys articles on Seeking Alpha are among the best. ..."
"... As I have repeatedly indicated, 100%+ debt to PV10 means technically insolvent and 60-65% debt to PV10 should mean no ability to finance with banks. ..."
"... It is looking like a slow, painful death for the US industry. I have also continuously maintained the only savior will be a OPEC cut (or major supply disruption). ..."
Anyone with knowledge of the industry care to chime in on which companies are most likely to survive
this low price environment, based on things like low debt, strong cash flow, the best assets-
human and otherwise?
I think the major integrated companies will survive. I think Oxy will prosper. Oxy is one of the
largest producers in the Permian and a leader in Tertiary Recovery ( although that sucks right
now). It's just my opinion but all of the unconventional companies have a little red target on
their backs. Few of the Oklahoma based companies will survive in their present form.
That doesn't mean those are necessarily the best companies but the way the game is rigged bank
debt provides liquidity so the more of that available the longer they can last.
Kellyb. Raw Energy's articles on Seeking Alpha are among the best.
For all interested, note in the article the tables showing debt to PV10 (2014 SEC value) and
then debt to 50% of 2014 SEC PV10.
I am sure Raw Energy will update the tables when 2015 number are released.
As I have repeatedly indicated, 100%+ debt to PV10 means technically insolvent and 60-65% debt
to PV10 should mean no ability to finance with banks.
It is looking like a slow, painful death for the US industry. I have also continuously maintained
the only savior will be a OPEC cut (or major supply disruption).
Just look at the losses E&P is reporting for 2015 with $50 WTI.
Shale industry in now in severe stress and many company are on the verge of bankruptcy. Only
dramatic rise of oil prices (above $50) can save them.
Notable quotes:
"... Mr. Verwimp, that is one frightening graph you have there. If the production follows the graph for the next six months, people are going to start to really notice. I do have a question though. If there continues to be completions of wells in the 70s per month, will that be enough to level the descent, considering the increased initial output due to better or more intensive fracking techniques? ..."
"... People are already starting to notice in the shale gas fields, they are clearly past peak. ..."
"... As for your question on how many wells per month are needed to level the descent, I would like to point to the models Dennis Coyne presents here. That is, basically, exactly the exercise he undertakes. As far as I understand, he needs something like 150 wells per month to keep production at the actual level. ..."
"... I dont believe 70 fresh gushers a month will compensate for the decline of 10.000 wells. Neither do I believe 70 wells will be added on average during the next months. ..."
"... So why are so many producers struggling and/or going broke? That $30 to $35 mark must be well-head costs of production without overheads? ..."
"... The present ND price is $16.50 for one thing. The analysis is for operating fields and does not include exploration or new developments, without which oil companies would have a short lifetime. ..."
"... One also has to consider both Lease Operating Expenses (LOE) and G A costs (plus debt service). ..."
"... In the real oilfield, not the one displayed by the shale cos. in their Urban skyscrapers, what is most important is what goes in the checkbook, what goes out of the checkbook and the current balance in the checkbook. Classifying a rod job as CAPEX does not change the fact that a check has to be written within 30 days (apparently 180+ days for shale) to the contract company who pulled the pump. ..."
"... Due to the skyrocketing of costs in the industry from 2005-2014, I believe this crash is more severe than 1998-1999, despite Brent and WTI oil prices not quite falling to the inflation adjusted lows of that period, as well as the fact the basis spreads are much wider for certain crudes (think Bakken, Western Canadian Select, etc.) than they were in that era. ..."
"... We are suffering much more than in 1998-1999 for sure, on the very same leases. The combination of cost inflation, reserves that are tougher to produce, and in the case of marginal producers like us, natural decline, makes dropping into the $20s (or below) brutal. ..."
"... The vast majority of US publicly traded E P have PDP PV10 reserve values LESS than long term debt at $50 WTI. ..."
"... Remember that reserve based lending standards typically do not allow for a borrowing base in excess of 65% of PDP PV10 (recently PV9 due to historically low interest rates). This includes not only first lien bank debt, but any other types of second lien or junior debt. ..."
"... Therefore, at $50 WTI, almost all US onshore based E P DO NOT qualify for reserve based credit with US banks. And we are at $30 and change today. ..."
"... Just because 1% of wells in the Sprayberry Wolfcamp play in Midland Co., TX are worth drilling and completing at $30 WTI does negate the fact that the entire industry is in jeopardy without a significant price spike. ..."
"... I would really like to know how much industry debt to banks is delinquent. I bet there is still a lot of pretending going on by the banks with regard to provisioning energy loan losses. ..."
"... Make no mistake about it, this has been a price crash of epic proportions. ..."
Mr. Verwimp, that is one frightening graph you have there. If the production follows the graph
for the next six months, people are going to start to really notice.
I do have a question though. If there continues to be completions of wells in the 70's per month,
will that be enough to level the descent, considering the increased initial output due to better
or more intensive fracking techniques?
Hi GoneFishing, the graph is just as frightening as it has been ever since I built it 25 months
ago, (and published in the comment section on this blog once every three months approximately.)
Now it is getting attention, suddenly.
People are already starting to notice in the shale gas fields, they are clearly past peak.
As for your question on how many wells per month are needed to level the descent, I would like
to point to the models Dennis Coyne presents here. That is, basically, exactly the exercise he
undertakes. As far as I understand, he needs something like 150 wells per month to keep production
at the actual level.
You should understand there are some 10.000 wells now, all of them are declining according
to the average well profile (this is: huge decline during the first year, more moderate decline
later on.) Anyway: I don't believe 70 fresh gushers a month will compensate for the decline of
10.000 wells. Neither do I believe 70 wells will be added on average during the next months.
My model for each month takes the average well profile, which has not changed for 12 months
or so and simply substitutes past guesses at future number of wells with the actual number of
new wells completed. That is it. I do tend to change my guess of the future number of wells completed
based on new information, such as the current price of oil and future forecasts of oil prices
along with well cost and information about capital spending by LTO focused companies.
In scenarios I presented in 2012 I did not foresee the present oil glut and I assumed new wells
would continue to be added at 2400 to 2800 new wells per year. For the past 12 months the well
completion rate has been about 1450 per year and for the past 3 months the rate has dropped to
908 new wells per year (annualized past 3 months).
Note that for your model to be correct, at least 60 new wells per month will be needed, notice
that my model has only 50 new wells per month from Jan 2016 to June 2017, but that output is lower
than your model.
For example my model has output at 800 kb/d in Jan 2017, but your model has output at about
840 kb/d, that would require about 60 new wells per month from Jan 2016 to Jan 2017, if my model
is correct.
We do agree that 70 new wells per month will not be completed, we could both be wrong, the
LTO players stubbornly complete new wells seemingly impervious to low prices.
I keep thinking they will slow down, but they are doing so more slowly than I had anticipated.
Additional buried costs of Unconventional extraction are surfacing. Fracking and production liquids
are live costs – how often is liquids disposal cost breaken out for the life of the well?
"Though fracking industry proponents scoff at any intimation their so-called vital industry
poses even scant risks to the public, a new study published in Toxicology and Applied Pharmacology
just proved those critics right - fracking wastewater causes cancer.
Using human bronchial epithelial cells, which are commonly used to measure the carcinogenesis
of toxicants, researchers confirmed fracking flowback water from the Marcellus Shale caused the
formation of malignancies."
"Citing up-to-date analysis of production data and cash costs from over 10,000 oil fields,
Wood Mac said it believes 3.4 million b/d, or less than 4% of global oil supply, is unprofitable
at oil prices below $35/b.
Even the majority of US shale and tight oil, which has been under the spotlight due to
higher-than-average production costs, only becomes cash negative at Brent prices "well-below"
$30/b, according to the study."
So why are so many producers struggling and/or going broke? That $30 to $35 mark must be well-head
costs of production without overheads?
The present ND price is $16.50 for one thing. The analysis is for operating fields and does
not include exploration or new developments, without which oil companies would have a short lifetime.
I think they are only including OPEX or what I call LOE.
As I have mentioned previously, these expenses typically include only the electricity or other
power costs to operate the wells, the chemicals used on a regular basis down hole, minor repairs,
and direct lease labor. At least that is the way the shale guys report it. Otherwise, why do they
always report $4-$8 per BOE in company reports, yet I see much higher than that on the lease operating
statements sent to non-operated working interest owners for interests for sale on the auction?
I have my doubts as to whether they are including in OPEX finding and development costs, including
the costs to lease the land, permit the well, drill the well, complete the well, equip the well,
any subsequent equipment that is capitalized and not expensed, including replacement of tubulars,
rods, down hole pumps, etc. over the life of the well, both ordinary work overs such as repair
of tubing leaks and replacement of down hole pumps, as well as work overs such as sand pumping,
acid, re-perforation, re-fracking, all transportation costs, all general and administrative expenses,
all severance, extraction, production, income, ad valorem, etc. taxes, and interest payments on
debt.
In the real oilfield, not the one displayed by the shale cos. in their Urban skyscrapers, what
is most important is what goes in the checkbook, what goes out of the checkbook and the current
balance in the checkbook. Classifying a rod job as CAPEX does not change the fact that a check
has to be written within 30 days (apparently 180+ days for shale) to the contract company who
pulled the pump.
Due to the skyrocketing of costs in the industry from 2005-2014, I believe this crash is more
severe than 1998-1999, despite Brent and WTI oil prices not quite falling to the inflation adjusted
lows of that period, as well as the fact the basis spreads are much wider for certain crudes (think
Bakken, Western Canadian Select, etc.) than they were in that era.
We are suffering much more than in 1998-1999 for sure, on the very same leases. The combination
of cost inflation, reserves that are tougher to produce, and in the case of marginal producers
like us, natural decline, makes dropping into the $20s (or below) brutal.
The vast majority of US publicly traded E & P have PDP PV10 reserve values LESS than long
term debt at $50 WTI. At least I suspect the 10K will show that in the next 15-45 days as
they are released.
Keep in mind we have been hovering around $30 WTI in 2016, after hovering around $40 WTI since
last fall. I imagine PDP PV10 is less than half at $30 WTI as opposed to $50 WTI. I further suspect
that PUD PV10 in almost non-existent in the US onshore lower 48 fields at $30 WTI.
Remember that reserve based lending standards typically do not allow for a borrowing base
in excess of 65% of PDP PV10 (recently PV9 due to historically low interest rates). This includes
not only first lien bank debt, but any other types of second lien or junior debt.
Therefore, at $50 WTI, almost all US onshore based E & P DO NOT qualify for reserve based
credit with US banks. And we are at $30 and change today.
In reality, any equity value these companies have is purely a bet that the current WTI and
HH futures will not hold, but will go substantially higher in the near future (yet this year).
I know I and others have been beating this drum for a long time, but dang it the truth has
to be said. Just because 1% of wells in the Sprayberry Wolfcamp play in Midland Co., TX are
worth drilling and completing at $30 WTI does negate the fact that the entire industry is in jeopardy
without a significant price spike.
I would really like to know how much industry debt to banks is delinquent. I bet there
is still a lot of pretending going on by the banks with regard to provisioning energy loan losses.
Make no mistake about it, this has been a price crash of epic proportions.
The Center on Global Energy Policy hosted a presentation and discussion with
Steven Kopits, Managing Director, Douglas-Westwood, on the different approaches
to global oil market forecasting. Mr. Kopits' remarks focused on both supply and demand-based methodologies,
including how these models result in different assumptions and implications for oil supply (OPEC
and non-OPEC), total oil demand and oil price. He also reviewed other key drivers such as changes
in the transport sector and overall economic growth and discussed how these variables can further
impact oil demand and supply.
…Enerplus delivered fourth quarter production of 106,905 BOE per day, contributing to annual
average production of 106,524 BOE per day, approximately 3% higher than 2014 and above guidance
of 106,000 BOE per day. This strong production was despite a 39% reduction in capital spending
year-over-year and over 6,000 BOE per day of production divested during the year which,
given the timing of the divestments, reduced annual average volumes by approximately 1,300
BOE per day.
…Fourth quarter funds flow was $103 million ($0.50 per share), down approximately 15% from
the previous quarter primarily as a result of lower commodity prices and production volumes.
Full year funds flow was $493 million ($2.39 per share), down approximately 43% primarily
due to significantly lower crude oil and natural gas prices relative to 2014. Commodity hedging
helped support funds flow during 2015 with cash gains of $288 million.
…Enerplus reported a net loss of $625 million in the fourth quarter as it incurred
non-cash charges including $266 million related to an asset impairment and a $426 million valuation
allowance for deferred tax assets.
Enerplus has also reduced its 2016 capital budget a further 43% to $200 million. This
represents a 60% reduction from 2015 spending levels. The reduced budget is focused on
balance sheet preservation and maximizing the long-term value of the Company's assets. The
revised 2016 capital program comprises drilling 25.9 net wells (18.5 in North Dakota, 1.5 in
the Marcellus and 6.0 in the Canadian waterfloods) and bringing on-stream 24.2 net wells (13.6
in North Dakota, 4.6 in the Marcellus and 6.0 in the Canadian waterfloods).
Taking into account the reduced capital program, and the approximately 8,000 BOE per
day of production divested since Enerplus released its original 2016 guidance, the revised
production guidance for 2016 is 90,000 – 94,000 BOE per day. Expected crude oil and natural
gas liquids production is modestly lower at 43,000 – 45,000 barrels per day, now representing
48% of total 2016 production at the midpoint (versus 44% previously).
Note assets sales and 10% drop in production forecasted for 2016.
mbnewtrain
on November 22, 2012 - 12:27am
Permalink
Something similar to GNE is happening within the US, which I would call "local net oil exports"
The horizontal drilling and fracturing in the Bakken formation, Eagle Ford, and areas of similar
oil bearing strata uses a lot of energy in the process. I have mentioned before about how Tesoro's
Mandan, ND refinery (70,000 bpd being expanded to 110,000 bpd) cannot produce enought diesel fuel
for the local market. This is mainly due to the Bakken oil production requiring HUGE amounts of
diesel fuel, besides the transport system (both trucks and railroads) being fueled to keep the
oil and supplies moving. My customer each month moves millions of gallons of diesel from the Fargo
ND pipeline (fed by St. Paul, MN refinery) every month to Bismark, ND. This "imported " diesel
keeps trucks fueled in the Bakken formation area.
So as EROEI decreases for oil production regions like the Bakken, less percentage of that oil
will ever be "exported" to other areas of the US. Tesoro's increase in refinery capacity will
not help lower diesel prices in ND, now near $5/gallon, since most of the new diesel produced
will be used locally for Bakken region users, IMO.
Paleocon
on November 22, 2012 - 12:55am
Permalink
|
Subthread
|
Parent
|
Parent subthread
|
Comments top
1,000 truck trips per constructed pad site, with maybe 5,000 pads to be built
in the 50,000 well drill plan. That's a lot of diesel....especially since trucks
keep running after the pad is built too.
RockyMtnGuy
on November 22, 2012 - 9:00pm
Permalink
|
Subthread
|
Parent
|
Parent subthread
|
Comments top
The EROEI of oil sands production ranges from 12:1 for the most efficient
mining operations to about 4:1 for the least efficient steam injection projects.
I tend to use 6:1 as an arbitrary number for discussion purposes.
However,
the Bakken probably has an EROEI in the same range once all the fuel consumption
for drilling, fracing, and trucking the product are factored in. The oil
industry is indeed a very intensive user of diesel fuel.
In the case of oil sands, though, the fuel is natural gas, which is trading
far below its fuel value on an energy equivalence basis, so in money terms
it works out rather well for the companies in the long term. OTOH, the Bakken
wells may not have a long term given their very steep production decline
rates.
Euan Mearns
on November 23, 2012 - 5:10am
Permalink
|
Subthread
|
Parent
|
Parent subthread
|
Comments top
I found a source earlier this year where nat gas consumption for Canadian
tar sands was published and this led to an ERoEI estimate of 3. When ERoEI
approaches one we are really dealing with energy conversion as opposed
to energy "production", and as you point out with nat gas cheap in N America,
this is currently an attractive proposition.
We are happy to do energy
conversions of coal and gas to electricity with significant energy losses
along the way. Upgrading energy quality is a vital component of our energy
system.
The thing that gets me right now in N America is how expensive shale
gas has dumped nat gas prices making the oil sands more attractive.
RockyMtnGuy
on November 23, 2012 - 10:35am
Permalink
|
Subthread
|
Parent
|
Parent subthread
|
Comments top
I was working from industry numbers. Companies don't generally calculate
EROEI, but you can calculate it from their oil production and gas consumption
data. It's important to realize they are steadily improving the EROEI
as they make improvements in the technology. A lot of the technology
is very new, so an EROEI of 3 is probably from old data.
However, the low price of NG certainly makes the industry's bottom
line look better. There are NG fields near and directly underneath
the oil sands. A lot of the oil sands companies have their own NG wells,
and no economic market for the NG other than to feed it into their
own oil sands plants.
There are also shale gas fields nearby that recent studies have
determined are as big as those in the US, but they are definitely uneconomic
at current prices.
The Bakken region sounds to be a perfect place for CNG/LNG for truck/train
haulage. They are currently flaring Nat gas due to lack of market, and needing
to invest heaps to import diesel. Kill two birds with the one stone. Use the
waste nat gas instead of expensive diesel. The drilling rigs and maybe even
the frac trucks could also be converted. The technology is there, just need
managers to start thinking outside the box, and start making use of all the
resources available to them. This seems the easy way to decrease the amount
of liquid fuel inputs into high cost oil production.
This is an obscure historical point, but it was NG
flaring that led to provincial regulation of the oil industry in Alberta.
Oil companies flared off about $20 billion worth of NG (at today's prices)
and permanently damaged the reservoir drive on the old Turner Valley field.
It was quite obvious what was going on because people in Calgary, 100 miles
away, could see the flares lighting up the night skies and smell the sulfur
from the burning gas. Ducks stopped going south for the winter and people
used to hunt rabbits at night with the light from the flares.
The oil companies and the federal government rejected provincial government
regulation of flaring, and the supreme court stuck down several laws, but
the Alberta government proved it could be very innovative at inventing new
laws, it could pass them faster than the courts could strike them down, and
things could turn very ugly at election time - the opposing parties were
not just defeated but completely wiped out in Alberta.
Eventually the companies, the Feds, and courts agreed that it was easier
to let the Alberta government regulate NG production, and it has done so
very positively ever since. This was the origin of the Alberta Energy Resources
Conservation Board.
"... Iranian businesses continued to be hobbled by the sanctions fallout. Some
US clearing banks have warned banks in Europe, Asia and the Middle East that their
US-based dollar accounts will face close scrutiny if they do business with Iran.
This has prevented banking transactions with Iran starting up again despite the
removal of sanctions, the Financial Times said in this report Feb 14. ..."
"... Platts reporter Robert Perkins highlights in this analysis published Feb
8, a 500,000 b/d immediate rise and 1 million b/d within six months is seen as "wildly
optimistic." ..."
"... Platts calculations based on current market consensus point to a far sober
200,000 b/d rise in the first quarter, growing to 450,000 b/d by year-end. ..."
"... Excluding Iranian supply, global oil balances are now seen returning to
equilibrium by the third quarter of 2016, according to implied market outlooks from
the International Energy Agency, the EIA and OPEC. ..."
Might the other big shadow looming on the markets - Iran - turn out to be
a teddy bear?
Iranian businesses continued to be hobbled by the sanctions fallout.
Some US clearing banks have warned banks in Europe, Asia and the Middle East
that their US-based dollar accounts will face close scrutiny if they do business
with Iran. This has prevented banking transactions with Iran starting up again
despite the removal of sanctions, the Financial Times said in this
report Feb 14.
Not surprisingly, expectations on the pace of Iran's incremental barrels
flowing into the market are taking a more conservative turn. As Platts reporter
Robert Perkins highlights in this
analysis published Feb 8, a 500,000 b/d immediate rise and 1 million b/d
within six months is seen as "wildly optimistic."
Platts calculations based on current market consensus point to a far
sober 200,000 b/d rise in the first quarter, growing to 450,000 b/d by year-end.
Excluding Iranian supply, global oil balances are now seen returning
to equilibrium by the third quarter of 2016, according to implied market outlooks
from the International Energy Agency, the EIA and OPEC.
That brings us to the "dread discount" on oil because of the wider global
financial markets panic since the start of the year, triggered in large part
by fears over Chinese economic growth.
While impossible to quantify, could the discount evaporate if the global
economy performs much better than the doomsday scenarios currently preying on
nerves?
To paraphrase Mark Twain, it ain't what the oil markets don't know that will
get them into trouble. It's what they know for sure that just ain't so.
Well, apparently the EIA and IEA are counting only liquid fuels,
but it's not a legitimate accounting technique. They should be
doing a mass and/or energy balance. There is quite a lot of mass
and energy in the coke a refinery produces, and they don't actually
throw it away, they sell it as fuel. Looking at only liquid fuels
is really a very simplistic approach which gives a misleading
picture.
Black_Dog
on November 22, 2012 - 10:09am
Permalink
|
Subthread
|
Parent
|
Parent subthread
|
Comments top
As you note, "processing gains" aren't something which one can measure
directly. The markets deal in volumes and as a result, governmental reports
(such as those from the EIA and the IEA) present data in volumes, not energy
content or mass. Processing gain only serves to keep the "green eye shade"
crowd of corporate and financial types happy, since they are trained to look
at various balance sheets in which every thing neatly adds up. In reality,
"processing gain" is simply the calculated difference between the volume of
product and the volume of input liquids.
The volumes reported on both sides of the calculation have numerous
sources of error, not to forget the non-technical situations, such as the
Saudis, where production is a state secret and various unauthorized
diversions, such often reported in Nigeria. For countries (and companies)
with a larger fraction of such gains, the cause might be more efficient
refining or differences in the output fraction of each product type.
Refiners which have access to natural gas may use that instead of crude to
provide the thermal or electrical energy to run the refinery, resulting in
more product output. The results might also reflect differences in emissions
where a country which has strict standards and enforcement might end up with
more product actually making it to market. Then too, it's always going to be
difficult to contain these liquid and gaseous materials, especially in
countries with warmer climates. There's also the possibility that
"processing gains" might turn out to be negative, if losses are extreme.
Ideally, from a scientific or thermodynamic point of view, the accounting
should be carried out in energy terms, presenting the information rather
like that found in the various markets for natural gas or electricity. With
such accounting, there would not be any "processing gain", only the losses
during extraction, refining and distribution. The efficiency of each link in
the processing and delivery chain would be clearly apparent and the market(s)
would be able to include this information in various corporate valuations.
Sad to say, our markets don't work that way...
The former tells
us that after the Shale bump 'native' production will go back to decline, and the
later shows us that replacing it with imported oil is going to get harder, or at
least more expensive.
So. Be nice to Canada now, and/or probably better sabotage any attempts by
those pesky northerners to build infrastructure that liberates the Alberta
resource either east or west and onto the global market.
Related: Is the Alberta product dependent on US inputs to lighten it? If so
that is a way that that Bitumen, once it hits the station forecourt, could at
least in part accurately be described as a 'North American' product?
"... To wit, the industry propaganda machine convinced Wall St et al that it could produce virtually unlimited quantities of oil and profits at ever lower numbers: $80/bbl, then $60/bbl, then $40/bbl. ..."
"... Until this emperor is shown to have no clothes (and that will likely take a few years and a significant extended oil shortage), the oil price will rise very slowly. This is on top of the Saudi myth that they will also flood the market if there is too much fracked oil on the market. ..."
"... Stories drive the market, just like our lives, methinks. ..."
As a writer, it is very interesting to me how the myth-making of the fracking industry as it ramped
up is now coming to bite itself on the ass. To wit, the industry propaganda machine convinced
Wall St et al that it could produce virtually unlimited quantities of oil and profits at ever
lower numbers: $80/bbl, then $60/bbl, then $40/bbl.
Whether it is all true or not I am not one to say, although it does seem unlikely. But the
myth is out there, and has effectively put a ceiling on the price, because all the traders are
telling themselves that if oil goes up too high, all the frackers will ramp everything back up
again and then there will be another glut.
Until this emperor is shown to have no clothes (and that will likely take a few years and
a significant extended oil shortage), the oil price will rise very slowly. This is on top of the
Saudi myth that they will also flood the market if there is too much fracked oil on the market.
Stories drive the market, just like our lives, methinks.
Thanks a lot for your post. We need more critical thinkers like you. Mythology is an important
tool in human societies and a very powerful force. I agree with your point:
Until this emperor is shown to have no clothes (and that will likely take a few years
and a significant extended oil shortage), the oil price will rise very slowly
It resonates with my thinking.
The whole neoclassical supply-demand model for oil is highly questionable. I think oil should
be thought for civilization much like water is for plants. So increased supply of oil (up to a
limit) is beneficial to the economy growth and, if you wish, GDP growth (and please note that
GDP is a very questionable measure of economy growth).
IMHO excessive supply within several percent of total volume (let's say 3-5%) is seamlessly
absorbed, so for this range of excessive supply the whole idea of "oil glut" is open to review.
The illusion of glut can be created by exogenous factors like "Great Condensate Con" hypothesis
suggests or by action of particular countries (Watcher idea of predatory pricing used by Saudi
Arabia to decimate oil price for purely political motives) .
For example, none of oil producers in the USA other then those with high sulfur oil have any
difficulties selling all what they can produce and actually can sell more.
Iran magically found the possibility to supple Western Europe with at least 0.3 Mb/d of additional
oil despite all those fairy tales of "oil glut".
To me all those talks is just the game of market speculators to increase their profits via
creating an artificial trend from which they can extract their rent. And they control media (contrary
to Ron's thinking they do). As low oil price are beneficial to the US economy and geopolitical
interests, EIA (which is at least 50% a propaganda agency and only 50% statistical agency) is
on board. So they have a field day now. IEA is more or less a US lapdog too.
So the question now is not a balance (calculated on data with high error margin that agencies
provide) but a severe, undeniable shortage which can ruin the myth. The myth which obtained its
staying power due to constant repetition (brainwashing effect). It confines itself to a few points
and repeat them over and over." As Joseph Goebbels aptly noted
"It would not be impossible to prove with sufficient repetition and a psychological understanding
of the people concerned that a square is in fact a circle. They are mere words, and words can
be molded until they clothe ideas and disguise."
― Joseph Goebbels
"Stories drive the market, just like our lives, methinks."
I will go along with this generalization to a certain extent, because the human species really
does live by the narrative. Group think rules, to a substantial extent, in the lives of men.
But in the end, people buy as much oil, and as many services dependent on oil, as they want
and can afford.
I find it just about impossible to believe that the people running the nationalized oil companies
in the Middle East, or the oil companies in Russia, or Mexico, or China or Venezuela, believe
that traders can control the price of oil. Traders can BET on what they think the price of oil
will be, and they can thus exert great influence on oil companies that are independently owned
and operated, in terms of how much they will invest in future production.
But just because the futures market says REAL physical barrels will be available at a X per
barrel on a certain date is no assurance at all that such barrels WILL be available. Who ever
has the REAL barrels might be able to sell them for considerably more, or might have to sell them
for considerably less. The folks holding contracts for paper barrels will either win or lose.
Producers who have hedged will know how much they will get for their oil,guaranteed, after settling
up their wins or losses on their hedges. That will be the price at which they hedged, minus the
actual cost of hedging.
So far, other than arguing that the actions of Wall Street have a big or controlling influence
on the ENTIRE world economy, I have not seen any rational argument made concerning just how traders
can control the DEMAND FOR OIL. If the demand is there, it will be produced, if it can be produced
at a profit.
The low price expectation could vanish like fog in bright morning sun, just like the high
price expectation vanished.
Nor have I seen any rational argument to the effect that they can control the investment decisions
of Saudi Aramco, etc.
We simply don't know how fast production might drop off as depletion bites, and as BUSINESS
oriented oil companies shut in marginal production, and scale back upstream spending in the face
of low prices. We don't have any RELIABLE way to predict whether the world economy will have a
heart attack, or soldier on, for the next two or three years, maybe even perking up a little,
or soldier on , just gradually contracting a little.
I must assume that the people who run such oil companies as Saudi Aramco have superb access
to the actual DATA involving the geological situation, via their business muscle, and via industrial
spying operations. This data access would extend to just about the entire world, so far as the
data actually exists.
So they will have a pretty good idea how much oil can be produced at how much cost, and where,
barring new technological developments, which usually take a good while to be debugged and widely
adopted.
So -If the Saudis for example think oil will be worth eighty or ninety bucks again within the
next few years, a straight up business decision on their part would be to continue upstream investment.
Of course geopolitical power struggle considerations might trump the business decision, at least
temporarily.
If anybody at all has a TRULY RELIABLE crystal ball when it comes to predicting the behavior
of the economy, I have not yet heard who they are.
The futures market might be way off. Futures are a win / lose game.
So far I have never run across a convincing example of anybody being able to control the price
of any good or service, unless by means of either controlling demand for it, or controlling the
supply of it. Gasoline would get to be dirt cheap indeed if getting caught in possession of a
gallon of it meant paying a thousand dollar fine. This absurd example is merely intended to illustrate
that demand CAN be controlled, if the controlling agency has power enough.
Why should I believe that Wall Street can control demand for oil, specifically ?
Why should I believe that Wall Street can control the behavior of oil producers, especially
producers that are not in need of Wall Street money, or controlled by yankee regulatory departments
or agencies?
Why should I believe that Wall Street can control the behavior of oil producers, especially
producers that are not in need of Wall Street money, or controlled by Yankee regulatory departments
or agencies?
They do not control producers directly. Their control is indirect due to the fact that moneywise
physical oil now dwarf paper oil and futures contracts and options are allowed to settle in dollars
without any commodity changing hands. In other words oil became just another currency and its
price is driven up or down using all the dirty tricks of the currency games (See Soros attack
on British pound).
Typical USA volume is about one million contracts a day. One contract is 1000 barrels. So one
billion barrels of paper oil changes hands daily only in the USA. Add London and other European
exchanges and ratio of 1:200 of "real" to "paper" oil is not unrealistic.
Susan Strange was probably the first to analyze this new "casino capitalism" model for oil
boom and bust. Here is a relevant quote from her book (1997):
As with interest rates, the problem with oil prices is not so much that they have been
high, but rather that they have also been so unpredictable and so unstable. Again the instability
has engendered a new game in the great financial casino – oil futures.
This evolved in the following way. In the 1980s as OPEC's command over the oil market
weakened, with some producers desperate for foreign exchange ready to undercut the agreed
price with secret, under the-counter deals, more and more oil cargoes came to be traded
on what is rather misleadingly called the Rotterdam spot market .
But this is not a market in the ordinary sense in which buyers and sellers are identifiable
and prices known to everyone. It is just a network of about a hundred oil traders and brokers,
connected with each other by long distance intercontinental telephone and telex. Like other
brokers in grain or porkbellies or frozen orange-juice, they are often tempted to increase
their profits by talking the market price up or down.
As late as 1978, the spot market deals still accounted for only 5 per cent of all trade
in oil. They now account for 40 per cent or more.
Inevitably, because of the close connection between oil prices, generally denominated
in dollars, and the price of the dollar in foreign exchange markets, there has grown up
in London and New York a futures market in 'paper barrels' to match the forward and futures
markets in dollars and dollar assets.
These 'paper barrel' contracts can change hands as many as 50 times, and do not need
to be based on barrels of real oil. Futures contracts on the British Brent blend of North
Sea oil are thought to add up to as much as eight times the total annual output of the Brent
field (Hooper, 1985).
In short, while there is little doubt that the instability of exchange rates has helped
to destabilize the oil market, the oil market is now adding its own gambling game to all
the others.
The picture so far is one of an international financial system in which the gamblers
in the casino have got out of hand, almost beyond, it sometimes seems, the control of governments.
The question has occurred already to a good many people whether it is the governments
that have got weaker over the past 15 years, or whether it is a fortuitous coincidence of
economic forces that have combined to make the markets more powerful. It is an important
question, for the answer will dictate what has to be done to control, to moderate, or to
close down the great financial gambling game.
That question is linked with a second one: have all states weakened in relation to markets,
or only one, or perhaps just a few of the more important governments? Those who think that
all governments have weakened tend to find rather broad general explanations of how this
has come about. If they offer solutions they are apt to be of the most vague and general
kind. In contrast, those who think the explanation lies with the few, or even just with
the USA as the dominant power in the international financial system – as all the figures
show it to be – tend to be much more specific both in the explanations they put forward
and in the solutions they suggest.
I think in 1997 the term "neoliberalism" was not yet common and "casino capitalism" was
used as a substitute for depiction of essentially the same phenomenon. She "feels the pain"
but did not understand that it was a "quite coup" that installed neoliberalism as a dominant
social system all over the world, displacing both New Deal Capitalism and Socialism. Kind of
global coup detat of financial oligarchy. So governments were already captured and can't serve
as a countervailing force for gambling.
Quote above is cited from
Casino Capitalism Reprint Edition, by Susan Strange. Paperback: 224 pages. Publisher: Manchester
University Press; Reprint edition (October 16, 1997)http://www.amazon.com/gp/product/0719052351?keywords=Susan%20Strange%20Casino%20capitalism
In other words "paper oil" radically changed the game.
"... Marathon Oil has reduced conventional exploration spending to $30 million, down from more than $250 million in 2015 and from more than $500 million in 2014. Activity in 2016 is limited to existing commitments in the Gulf of Mexico and Gabon, with no exploration wells planned. ..."
"... Hundreds of companies are going to disappear soon if prices stay low. The stronger ones will survive... ..."
"... they split the refining and pipeline segments off, so there have not been mass job losses in those segments. I bet COP, MRO, HES wish they hadnt listened to Wall Street re the spin offs. ..."
Marathon oil lost money last quarter and have cut spending by 75% compared to 2014. In particular:
"Marathon Oil has reduced conventional exploration spending to $30 million, down from more
than $250 million in 2015 and from more than $500 million in 2014. Activity in 2016 is limited
to existing commitments in the Gulf of Mexico and Gabon, with no exploration wells planned."
At least they split the refining and pipeline segments
off, so there have not been mass job losses in those segments. I bet COP, MRO, HES wish they hadn't listened to Wall Street re the spin offs.
"... The CEO of Devon [which cut 75% of their drilling budget] essentially asked: Who would ever drill for new production at these prices. Then Marathon came out with essentially the same thing with their budget. And, EOG will not have any rigs running in ND. I think that Harold Hamm finally got religion over at CLR. ..."
"... I am sensing an emerging consensus to just bite the bullet and bring production down as fast as possible unless a lender forces the issue. ..."
Does anyone know what the status of crude pipelines to haul Bakken oil is? I ask because I believe
that the decline in rail car loading is greater than any decline in production. So, I am curious
how much of the Bakken oil is now avoiding the extra cost that rail shipment incurs.
The CEO of Devon [which cut 75% of their drilling budget] essentially asked: "Who would
ever drill for new production at these prices." Then Marathon came out with essentially the same
thing with their budget. And, EOG will not have any rigs running in ND. I think that Harold Hamm
finally got religion over at CLR.
So, the big unknown now seems to be how fast they will complete the inventory of drilled but
uncompleted wells. I am sensing an emerging consensus to just bite the bullet and bring production
down as fast as possible unless a lender forces the issue.
Does anyone know what the status of crude pipelines to haul Bakken oil is? I ask because I believe
that the decline in rail car loading is greater than any decline in production. So, I am curious
how much of the Bakken oil is now avoiding the extra cost that rail shipment incurs.
The CEO of Devon [which cut 75% of their drilling budget] essentially asked: "Who would ever
drill for new production at these prices." Then Marathon came out with essentially the same thing
with their budget. And, EOG will not have any rigs running in ND. I think that Harold Hamm finally
got religion over at CLR.
So, the big unknown now seems to be how fast they will complete the inventory of drilled but
uncompleted wells. I am sensing an emerging consensus to just bite the bullet and bring production
down as fast as possible unless a lender forces the issue.
DUBAI, United Arab Emirates - The United Arab Emirates threw its support on Thursday behind a
plan by major oil producers to freeze output levels in an attempt to halt a slide in crude prices
that has pushed them to their lowest point in more than a decade.
Russia, Saudi Arabia, Qatar and Venezuela announced their willingness to cap output at last
month's levels at a surprise meeting in Qatar this week - but only if other major oil producers
join them. OPEC member Kuwait has since said it supports the proposal.
The support from the Emirates, a close Saudi ally, does not come as a major surprise but is still
significant. The seven-state federation is OPEC's third-largest oil producer.
Energy Minister Suhail Mohammed al-Mazrouei said in a statement to state news agency WAM that the
Emirates supports any proposal to freeze output through consensus with OPEC and Russia, which is
not part of the oil-producing bloc.
"We believe that freezing production levels by members of OPEC and Russia will have a positive
impact on balancing future demand based on the current oversupply," he said.
He was also quoted as saying he believes current conditions will prompt producing countries to
cap existing output, if not cut supply. The UAE, he said, "is always open for cooperation with
everyone in order to serve the higher interests of the producers and the balance of the market."
A day earlier, Iranian Oil Minister Bijan Namdar Zanganeh said after talks with counterparts from
Iraq, Venezuela and Qatar that his country "supports any measure to boost oil prices" but stopped
short of committing Iran to capping its own output. Iran has previously said it aims to boost
production above its roughly 2.9 million barrels a day now that sanctions related to its nuclear
program have been lifted.
Most of the defaults, debt restructurings, and bankruptcies so far this year and last year were
triggered when over-indebted cash-flow negative companies could not make interest payments on their
debts.
During the crazy days of the peak of the credit bubble two years ago, they would have been able
to borrow even more money at 8% or 9% and go on as if nothing happened. But those days are gone.
Now the riskiest companies face interest costs of 20% or higher – if they're able to get new money
at all. Hence, the wave of debt restructurings and bankruptcies.
But that's small fry. Now comes the wave of companies whose debts mature. They will have to borrow
new money not only to fund their interest payments, cash-flow-negative operations, and capital expenditures,
but also to pay off maturing debt.
That "refinancing cliff" is going to be the biggest, steepest ever, after the greatest credit
bubble in US history when companies took on record amounts of debt, and it comes at the worst possible
time, warned Moody's in its annual report.
In its report a year ago, Moody's had already warned that the refinancing cliff for junk-rated
US companies over the next five years – at the time, from 2015 through 2019 – would hit $791 billion.
Of that, $349 billion would mature in 2019, the largest amount ever to mature in a single year.
...Among the other macroeconomic factors, Moody's lists the slowdown in China and volatility in
oil prices. And there's another factor that will "make it more difficult for lower-rated companies
to refinance": worried regulators have been cracking down on banks' exposure to leveraged loans,
which are so risky that even the Fed has been fingering them publicly.
Banks sell these leveraged loans to loan mutual funds or repackage them into collateralized loan
obligations (CLOs) which they then sell in tranches to institutional investors. When leveraged loans
mature, companies have to come up with the money, but Moody's warns that "rising defaults and the
impact of the Dodd-Frank Act's risk retention rule will make it more difficult for existing CLOs
to supply corporate financing."
I see this debt cliff as a neoliberal blowback. You see, an effective CEO does all he can to
juice shareholder value, often measured quarterly. So, with lagging sales and low or no profits,
many chose to borrow money to increase shareholder value by buying back stock, thereby increasing
share price, or juicing dividends. After all, they had the cashflow to pay the interest and huge
hopes for the future. If instead, CEOs were more concerned with the long-term vitality of their
company they would have trimmed production and shaved costs wherever they could, including reducing
C-suite salaries. Had the major oil companies done such things, they could today be gorging on
the distressed wildcatters instead of worrying about managing their debt.
Helpful tip – when ever using the meme 'shareholder value' follow in brackets [bonus multiplier].
Skippy…. I also like the 'short skirt' come hither juicing dividends thingo… why – as you say,
administer a company when all you have to do is prance around with money falling out your lingerie
on the exchange dance pole….
Hmmm…it seems to me our financial system is based on the old "Run for your Life" TV show.
For you youngsters, this is where a handsome guy finds out he is going to die, so he decided in
his last year (this is in TV time, so if the series went for years it would not have been a problem)
that he would live it up.
Now, how does he pay for all these adventures?????
Simple – Credit
American express bill is charged to his diners club and than the diners club is charged to Master
Card, and so on. And of course, as he is "paying" ever bigger bills, he is advanced ever more
credit….deja vu all over again…
Of course, the TV protagonist had a way to escape all his debt….
"... Mining and exploration investment declined from $135 billion in 2014 to $87.7 billion in 2015, weighing down investment growth more than any other segment of nonresidential investment. ..."
Mining and exploration
investment declined 35% in 2015, the second largest year-over-year decline since the U.S.
Bureau of Economic Analysis (BEA) began reporting the series in 1948. Most mining and exploration
investment reflects petroleum exploration and development, but the category also includes natural
gas, coal, and other minerals.
Mining and exploration investment declined from $135 billion in 2014 to $87.7 billion in
2015, weighing down investment growth more than any other segment of nonresidential investment.
Total private fixed investment, of which mining and exploration is a small subset, grew 4% in
2015 to $2.7 trillion. Low
commodity prices remain a significant factor in U.S. firms' investment decisions.
Crude-Oil-Peak has a recent post that shows that since 2005, the only region of the world that
was been able to bring on any additional oil was the United States. Does anyone have a figure
for how much CapEx was spent during that time to keep us essentially on a plateau? How much CapEx
was spent during 2005-2014?
"... Suppose, at $50 oil, a company could sell forward 2 years of production at $55. They cannot. Why not? Because they have no collateral. All of their assets are pledged to existing loans. Why do they need collateral? Because, what if the price rises – to lets say to $85. In that hypothetical, they need $30/bbl of margin CASH. I believe that Ron will confirm that you HAVE to make margin calls within 24 hours or your position is sold out. ..."
"... Today is different. Most to these companies do not have any unpledged collateral. So, it is a catch 22. They will not be able to sell forward contracts. ..."
"... Something tells me that Wall Streets hunger for oil investments may be diminishing. ..."
I read an article on Bloomberg a couple of days ago, saying that if oil gets to $50/bbl, that
the US oil companies will sell forward contracts and flood the market with oil.
I hope that Ron comments on this. But, I see some problems. The first problem is that the average
oil company has PROVED [with $100's billion of write-offs and worthless junk bonds] that they
cannot make a profit at $49 oil [2015 PV-10].
The second problem is: Suppose, at $50 oil, a company could sell forward 2 years of production
at $55. They cannot. Why not? Because they have no collateral. All of their assets are pledged
to existing loans. Why do they need collateral? Because, what if the price rises – to let's say
to $85. In that hypothetical, they need $30/bbl of margin CASH. I believe that Ron will confirm
that you HAVE to make margin calls within 24 hours or your position is sold out.
Well, how did companies like Chesapeake Energy do it. Well, at the time [several years
ago], they had enough reserves that were not pledged on any loans, even though they were highly
leveraged. So they pledged that collateral to, like Goldman Sachs, to cover any margin calls.
So GS would put up the margin calls, if needed.
Today is different. Most to these companies do not have any unpledged collateral. So, it is
a catch 22. They will not be able to sell forward contracts.
There's an article at Downstream Today about hedge funds applying to buy oil assets, including
infrastructure, in North Dakota. It seems that there's a lot of money looking to move in, and
Lynn Helms is quoted at some length as being not at all happy about it.
He says that the ND government is looking hard not only at data on the companies applying but
on the top personnel as well. His big worry is that (surprise) there'll be no expertise available
for utilizing what outside money might buy.
The the nine hundred forty five wells awaiting completion is in ND is probably an accurate number,
plus or minus maybe a couple of dozen, depending on how up to date the data is.
I read somewhere a couple of days ago that there are about four thousand wells awaiting completion,
in total, in the USA.
Driving up 101 today from Pismo Beach, passed the San Ardo oil field. Shiny new rigs were pumping,
lots of activity it seemed. Surprised me - figured the whole operation would be in mothballs at
today's prices.
"... There are over $1.8 trillion of US junk bonds outstanding. It's the lifeblood of over-indebted corporate America. When yields began to soar over a year ago, and liquidity began to dry up at the bottom of the scale, it was "contained." ..."
"... The average yield of CCC or lower-rated junk bonds hit the 20% mark a week ago. The last time yields had jumped to that level was on September 20, 2008, in the panic after the Lehman bankruptcy, as we pointed out . Today, that average yield is nearly 22%! ..."
"... Today the scenario is punctuated by defaults, debt restructurings with big haircuts, and bankruptcy filings. These risks had been there all along. But "consensual hallucination," as we've come to call the phenomenon, blinded investors, among them hedge funds, private equity firms, bond mutual funds for retail investors, and other honorable members of the "smart money." ..."
"... The M&A-related bond issue by Endurance International Group couldn't be syndicated and ended up on the balance sheets of the underwriters. ..."
"... The market was hit hard again this week amid solid volume trading as oil prices plunged anew. There was a meager attempt at stability on Wednesday, but some participants described it as similar to the calm at the eye of a hurricane. ..."
"... And retail investors are catching on. Over the past three sessions alone, they pulled $488 million out of the largest high-yield ETF, the iShares HYG, which on Thursday closed at 75.59, down 21% from its high in June 2014, and the lowest level since May 2009. ..."
"... All grades of junk bonds have been losing ground: the S&P High-Yield Index is down 3.9% year-to-date. But it's in the CCC-and-lower category where real bloodletting is occurring. ..."
"... It's not just energy. The category includes all kinds of companies, among them brick-and-mortar retailers and restaurants, hit hard by excessive debt, slack demand, consumer preference for online shopping, and other scourges. Unlike oil and gas drillers, these companies have no assets to sell. Standard & Poor's "believes these trends will accelerate in the coming year and lead to further retail defaults." ..."
"... All the Central Bank stimulus programs have been Neo-Keynesian, in line with the new economics. The money is pushed into the top of the economic pyramid, the banks, and according to the new economics it should trickle down. ..."
"... I see a storm brewing. A huge economic tsunami will occur when the financial sector collapses. The question is not if this will occur but when and how bad it will be. The severity is bound to be intense and long term as Congress is hidebound by ideological stances that are the origination of the Tsunami. The Fed has run out of strategies that actually have any positive effect. ..."
"... Not to diminish the concerns Wolf has expressed here or the related causal factors, but staff at the Atlanta Fed is forecasting sharply improving economic activity this quarter. ..."
"... But "consensual hallucination," as we've come to call the phenomenon, blinded investors, among them hedge funds, private equity firms, bond mutual funds for retail investors, and other honorable members of the "smart money." ..."
"... Please explain how "smart money" is losing on this "hallucination." Oh, maybe you mean the Private Equity LPs or the retail investors in the Mutual Funds, or the investors in the hedge funds. They aren't the smart money. The smart money is playing this game for all it is worth and is not losing out. ..."
Posted on
February 13, 2016 by
Yves
Smith By Wolf Richter, a San Francisco based executive, entrepreneur, start
up specialist, and author, with extensive international work experience. Originally
published at
Wolf Street
It's not contained.
There are over $1.8 trillion of US junk bonds outstanding. It's the lifeblood
of over-indebted corporate America. When yields began to soar over a year ago,
and liquidity began to dry up at the bottom of the scale, it was "contained."
Yet contagion has spread from energy, metals, and mining to other industries
and up the scale. According to UBS, about $1 trillion of these junk bonds are
now "stressed" or "distressed." And the entire corporate bond market, which
is far larger than the stock market, is getting antsy.
The average yield of CCC or lower-rated junk bonds hit the 20% mark a
week ago. The last time yields had jumped to that level was on September 20,
2008, in the panic after the Lehman bankruptcy,
as we pointed out . Today, that average yield is nearly 22%!
Today even the average yield spread between those bonds and US Treasuries
has breached the 20% mark. Last time this happened was on October 6, 2008, during
the post-Lehman panic:
At this cost of capital, companies can no longer borrow. Since they're cash-flow
negative, they'll run out of liquidity sooner or later. When that happens, defaults
jump, which blows out spreads even further, which is what happened during the
Financial Crisis. The market seizes. Financial chaos ensues.
It didn't help that Standard & Poor's just went on a "down-grade binge,"
as S&P Capital IQ LCD called it, hammering 25 energy companies deeper into junk,
11 of them into the "substantial-risk" category of CCC+ or below.
Back in the summer of 2014, during the peak of the wild credit bubble beautifully
conjured up by the Fed, companies in this category had no problems issuing new
debt in order to service existing debt, fill cash-flow holes, blow it on special
dividends to their private-equity owners, and what not. The average yield of
CCC or lower rated bonds at the time was around 8%.
Today the scenario is punctuated by defaults, debt restructurings with
big haircuts, and bankruptcy filings. These risks had been there all along.
But "consensual hallucination," as we've come to call the phenomenon, blinded
investors, among them hedge funds, private equity firms, bond mutual funds for
retail investors, and other honorable members of the "smart money."
But now that they've opened their eyes, they're running away. And so the
market for new issuance is grinding down.
"Another tough week," S&P Capital IQ LCD said on Thursday in its
HY Weekly . There was one small deal earlier this week: Manitowoc Cranes'
$260 million B+ rated second-lien notes that mature in 2021 sold at a yield
of 14%!
The M&A-related bond issue by Endurance International Group couldn't
be syndicated and ended up on the balance sheets of the underwriters. LeasePlan
has a $500 million deal on the calendar. If it goes today, it will bring the
total this week to a measly $760 million, down 90% from the four-year average
for the second week in February. According to S&P Capital IQ LCD, it would be
"the lowest amount of early-February issuance since the credit crisis in 2009."
In the secondary market, where the high-yield bonds are traded, it's equally
gloomy. S&P Capital IQ LCD:
The market was hit hard again this week amid solid volume trading
as oil prices plunged anew. There was a meager attempt at stability on Wednesday,
but some participants described it as similar to the calm at the eye of
a hurricane.
That proved true today, as markets fell further. There was red across
the board with losses in dollar terms ranging 1–5 points, depending on the
credit and sector. The huge U.S. Treasury market rally gave no technical
support, even as the yield on the 10-year note, for one, pierced 1.6%, a
4.5-year low.
And retail investors are catching on. Over the past three sessions alone,
they pulled $488 million out of the largest high-yield ETF, the iShares HYG,
which on Thursday closed at 75.59, down 21% from its high in June 2014, and
the lowest level since May 2009.
On a broader scale, investors
yanked $5.6 billion out of that asset class in January, the fourth month
in a row of outflows.
All grades of junk bonds have been losing ground: the S&P High-Yield
Index is down 3.9% year-to-date. But it's in the CCC-and-lower category where
real bloodletting is occurring.
This chart shows the return from interest payments and price changes of that
category. Since June 2014, the index has lost 28%. During the panic of the Financial
Crisis, it plunged 48%. But now the volume of junk bonds outstanding is twice
as large and the credit bubble is far bigger than it had been before the Financial
Crisis. So this might just be the beginning:
It's not just energy. The category includes all kinds of companies, among
them brick-and-mortar retailers and restaurants, hit hard by excessive debt,
slack demand, consumer preference for online shopping, and other scourges. Unlike
oil and gas drillers, these companies have no assets to sell. Standard & Poor's
"believes these trends will accelerate in the coming year and lead to further
retail defaults."
S&P now expects the overall default rate to reach 3.9% by the end of 2016.
But it may be the rosy scenario; last March, S&P still thought the default rate
at the end of 2016 would be 2.8%. Credits are deteriorating fast.
Among these CCC-rated retailers and restaurants are Claire's Stores, Logan's
Roadhouse, and the Bon-Ton Department Stores. Others, at B-, are just a downgrade
away, such as Toys "R" Us, 99 Cents Only Stores, or P.F. Chang's China Bistro.
Some are rated B, such as Men's Wearhouse and Neiman Marcus. If these companies
need money, it's going to get very expensive.
And contagion is spreading to high-grade bonds: issuance so far in February
plunged 90% to just $5 billion, from the same period a year ago. Year-to-date
issuance was inflated by one monster deal carried over from last year, the $46-billion
M&A-driven trade for Anheuser-Busch InBev, bringing the total to $126.5 billion,
still down 13%. S&P Capital IQ LCD:
Severe broad market volatility shuttered the investment-grade primary
market for a fifth consecutive session Thursday, as secondary-market spreads
continued to widen.
If policy makers wanted to understand the irrelevance of ZIRP or NIRP
in the world where real businesses and people live, they only have to read
this article.
And don't forget the risk that's posed by the sovereign debt issued by
the EU PIIGS:
Are The EU PIIGS About To Start Squealing?
As the migrant crisis in Europe worsens serious steps to address it are
being considered.
One proposal is for passports to be required in order to cross from one
EU country to another.
Would such a drastic move spell the beginning of the end for the Eurozone
as a viable entity?
And if so what will happen to the piles of sovereign debt that's been
issued by the economically vulnerable EU PIIGS, and to the investors who
have been pouring money into them at what appear to be ridiculously low
yields?
Bring in nonsense economics globally and let it destroy everything.
Today's nonsense economics:
1) Ignores the true nature of money and debt
Debt is just taking money from the future to spend today.
The loan/mortgage is taken out and spent; the repayments come in the
future.
Today's boom is tomorrow's penury and tomorrow is here.
One of the fundamental flaws in the economists' models is the way they
treat money, they do not understand the very nature of this most basic of
fundamentals.
They see it as a medium enabling trade that exists in steady state without
being created, destroyed or hoarded by the wealthy.
They see banks as intermediaries where the money of savers is leant out
to borrowers.
When you know how money is created and destroyed on bank balance sheets,
you can immediately see the problems of banks lending into asset bubbles
and how massive amounts of fictitious, asset bubble wealth can disappear
over-night.
When you take into account debt and compound interest, you quickly realise
how debt can over-whelm the system especially as debt accumulates with those
that can least afford it.
a) Those with excess capital invest it and collect interest, dividends
and rent.
b) Those with insufficient capital borrow money and pay interest and rent.
Add to this the fact that new money can only be created from new debt
and the picture gets worse again.
With this ignorance at the heart of today's economics, bankers worked
out how they could create more
and more debt whilst taking no responsibility for it. They invented securitisation
and complex financial instruments to package up their debt and sell it on
to other suckers (the heart of 2008).
2) Doesn't differentiate between "earned" and "unearned" wealth
Adam Smith:
"The Labour and time of the poor is in civilised countries sacrificed
to the maintaining of the rich in ease and luxury. The Landlord is maintained
in idleness and luxury by the labour of his tenants. The moneyed man is
supported by his extractions from the industrious merchant and the needy
who are obliged to support him in ease by a return for the use of his money.
But every savage has the full fruits of his own labours; there are no landlords,
no usurers and no tax gatherers."
Like most classical economists he differentiated between "earned" and
"unearned" wealth and noted how the wealthy maintained themselves in idleness
and luxury via "unearned", rentier income from their land and capital.
We can no longer see the difference between the productive side of the
economy and the unproductive, parasitic, rentier side.
The FIRE (finance, insurance and real estate) sectors now dominate the
UK economy and these are actually parasites on the real economy.
Constant rent seeking, parasitic activity from the financial sector.
Siphoning off the "earned" wealth of generation rent to provide "unearned"
income for those with more Capital, via BTL.
Housing booms across the world sucking purchasing power from the real
economy through high rents and mortgage payments.
Michael Hudson "Killing the Host"
3) Today's ideal is unregulated, trickledown Capitalism.
We had un-regulated, trickledown Capitalism in the UK in the 19th Century.
We know what it looks like.
1) Those at the top were very wealthy
2) Those lower down lived in grinding poverty, paid just enough to keep
them alive to work with as little time off as possible.
3) Slavery
4) Child Labour
Immense wealth at the top with nothing trickling down, just like today.
This is what Capitalism maximized for profit looks like.
Labour costs are reduced to the absolute minimum to maximise profit.
(The majority got a larger slice of the pie through organised Labour
movements.)
The beginnings of regulation to deal with the wealthy UK businessman
seeking to maximise profit, the abolition of slavery and child labour.
Where regulation is lax today?
Apple factories with suicide nets in China.
The modern business person chases around the world to find the poorest
nation with the laxest regulations so they can exploit these people in the
same way they used to exploit the citizens of their own nations two hundred
years ago.
Labour costs are reduced to the absolute minimum to maximise profit.
Capitalism in its natural state sucks everything up to the top.
Capitalism in its natural state doesn't create much demand.
There is more than one version of Capitalism, and today's version is
an upside down version of the one we had 40 years ago that produced the
lowest levels of inequality in history within the developed world.
40 years ago most economists and almost everyone else believed the economy
was demand driven and the system naturally trickled up.
Now most economists and almost everyone else believes the economy is
supply driven and the system naturally trickles down.
Economics has been turned upside down in the last 40 years.
All the Central Bank stimulus programs have been Neo-Keynesian, in
line with the new economics. The money is pushed into the top of the economic
pyramid, the banks, and according to the new economics it should trickle
down.
What we have seen is that the money stays at the top inflating asset
bubbles in stocks, fine art, classic cars and top end property.
Businessmen believe in the new economics when it comes to keeping all
the rewards for themselves and shareholders.
Businessmen believe in the old economics when it come to investing and
won't invest until demand rises.
The new economics has taken us back to a disastrous past.
1920s/2000s – high inequality, high banker pay, low regulation,
low taxes for the wealthy, robber barons (CEOs), reckless bankers, globalisation
phase
1929/2008 – Wall Street crash
1930s/2010s – Global recession, currency wars, rising nationalism
and extremism
I see a storm brewing. A huge economic tsunami will occur when the
financial sector collapses. The question is not if this will occur but when
and how bad it will be. The severity is bound to be intense and long term
as Congress is hidebound by ideological stances that are the origination
of the Tsunami. The Fed has run out of strategies that actually have any
positive effect.
Not to diminish the concerns Wolf has expressed here or the related
causal factors, but staff at the Atlanta Fed is forecasting sharply improving
economic activity this quarter.
Although I only began tracking their work during the past year, I have
been impressed by the accuracy of their recent GDP forecasts:
But "consensual hallucination," as we've come to call the phenomenon,
blinded investors, among them hedge funds, private equity firms, bond
mutual funds for retail investors, and other honorable members of the
"smart money."
Please explain how "smart money" is losing on this "hallucination."
Oh, maybe you mean the Private Equity LPs or the retail investors in the
Mutual Funds, or the investors in the hedge funds. They aren't the smart
money. The smart money is playing this game for all it is worth and is not
losing out.
A while back (it had seemed like years to me but it was actually March 23,
2012--is it just me or did this last presidential election cycle actually stretch
time?) Joules Burn posted
From Qurayyah
to Khurais: Turning Water Into Oil which contains links to part one (9:47)
and two (13:06) of From Qurayyah to Khurais
The following are direct YouTube links to the same
My end of the wire bottom of the line DSL connection made loading those clips
downright painful but it was worth it. It is a very well done animation
and really fleshes out the process your linked article describes.
Zero hedge is a really crooked site when it comes to oil.
I had an account banned
there for continually pointing out the inconsistencies of their narrative on production and supply.
You'll notice they'll only use graphs when there's been an uptick in production. All the time last
year when production was falling they never once used a graph.
When production was still increasing they always used a combined rig count/production graph, the
moment production started to fall they pulled the production line from the graph. The moment production
plateaued and slightly increased, the production line reappeared.
There's some skilled propagandists there because most of the commenters lap it up, I doubt many
of them would realise production actually fell in the US in 2015, they probably still think it's
increasing. None of them would realise Saudi production has fallen either.
"... At the centre are the two designated heirs to the 271-year-old House of Saud, which has ruled Saudi Arabia since its emergence as a modern state. Crown Prince Mohammed bin Nayef, the kings 56-year-old nephew, is first in line to the throne but Deputy Crown Prince Mohammed bin Salman, believed to be about 30, is Salmans son and a rising power. ..."
"... Mohammed bin Nayef is interior minister while Mohammed bin Salman runs the defence ministry, and their growing rivalry is making itself felt, experts say. ..."
"... He points to the irresponsible Saudi-led intervention in Yemen and says the key Western ally has taken a more hard line tilt away from reforms. . . . ..."
"... In addition to being defence minister, Mohammed bin Salman heads the kingdoms main economic co-ordinating council as well as a body overseeing Saudi Aramco, the state oil company in the worlds biggest petroleum exporter. ..."
I have read, and heard, that many analysts are increasingly concerned that a 30 year old, Mohammed
bin Salman, is calling a lot of the shots in Saudi Arabia. And there have been widespread reports
that members of the royal family are increasingly unhappy about the current regime.
Two princes in Saudi Arabia battle for one throne (October, 2015)
A POWER struggle is emerging between Saudi Arabia's two most powerful princes, analysts
and diplomats say, as the secretive kingdom confronts some of its biggest challenges in years.
The Saudi-led military intervention in Yemen, falling oil prices and rising jihadist violence
are putting the country's leadership to the test, nine months after King Salman assumed the
throne following the death of King Abdullah. The kingdom's rulers have also faced criticism
for last month's hajj tragedy which, according to foreign officials, killed more than 2200
people in a stampede at the annual Muslim pilgrimage.
With concerns over the long-term health of 79-year-old Salman, jockeying for influence has
intensified, experts say.
At the centre are the two designated heirs to the 271-year-old House of Saud, which
has ruled Saudi Arabia since its emergence as a modern state. Crown Prince Mohammed bin Nayef,
the king's 56-year-old nephew, is first in line to the throne but Deputy Crown Prince Mohammed
bin Salman, believed to be about 30, is Salman's son and a rising power.
Mohammed bin Nayef is interior minister while Mohammed bin Salman runs the defence ministry,
and their growing rivalry is making itself felt, experts say.
"It's resulting in some disturbing policies abroad and internally," says Frederic Wehrey
of the Middle East Programme at the Carnegie Endowment for International Peace in Washington.
He points to the "irresponsible" Saudi-led intervention in Yemen and says the key Western
ally has taken a more "hard line tilt" away from reforms. . . .
In addition to being defence minister, Mohammed bin Salman heads the kingdom's main
economic co-ordinating council as well as a body overseeing Saudi Aramco, the state oil company
in the world's biggest petroleum exporter.
"Mohammed bin Salman is clearly amassing extraordinary power and influence very quickly.
This is bound to unsettle his rivals," Wehrey says.
The deputy crown prince "has this need to structure his position to become, at the moment
his father dies, irreplaceable" because he has no assurances of how Mohammed bin Nayef, as
king, would treat him, another foreign diplomat says.
Mohammed bin Salman, who has a close relationship with his father, has been "acting as if
he was the heir apparent, so this obviously creates tensions," Lacroix says.
"... Wells in the Williston Basin that produce 40 barrels per day and less are going to be shut. I think it is about a thousand of them, if they have been shut already, it would explain the 29,000 bpd drop. Shut wells will result in an increase of daily production per well. ..."
Wells in the Williston Basin that produce 40 barrels per day and less are going to be shut. I
think it is about a thousand of them, if they have been shut already, it would explain the 29,000
bpd drop. Shut wells will result in an increase of daily production per well.
When the price of oil increases, the wells will recommence pumping.
"... Winter just started affecting the North Dakota production numbers. There is more decline to be expected the coming months. Consider seasonal conditions combined with the maturity of the field and with low prices. The peak is behind us. ..."
"... The accuracy of your curve would suggest that the drop in oil price hasnt had as marked an impact as would be expected – i.e. the decline was going to happen anyway, no matter what. Can you comment on that? ..."
"... basically, I believe ND Bakken is producing every barrel it can, from a geology point of view – despite the low prices. ..."
"... for the coming year we agree. Down down down. Prices may (and will) rise again. But I do not see another 27k wells being drilled in that North Dakota landscape. Just look at it on Google Maps. There are wells everywhere! Where are the North Dakotans going to drill 27k new wells? The USGS is an important institution, but I believe they overestimate Bakken URR greatly. ..."
"... the number of potential well locations is still high. Many of them are outside the sweet spots, but if and when oil prices rebound, a large part of potential B-TF wells may be economically viable. ..."
"... And how many loans are created in consumer/real estate economy based on oil being $100 where was incentive to provide enough liquids at that price for our endless car circling that we call GDP. That debt is no different than E P debt and will be crashing down at same time. ..."
Winter just started affecting the North Dakota production numbers. There is more decline to
be expected the coming months. Consider seasonal conditions combined with the maturity of the
field and with low prices. The peak is behind us.
The accuracy of your curve would suggest that the drop in oil price hasn't had as marked an impact
as would be expected – i.e. the decline was going to happen anyway, no matter what. Can you comment
on that?
I am, honestly, stupified myself by the accuracy of the curve, that is 25 months old now without
ever tinkering the parameters of the model. It was based on Hubbert analysis, adding a seasonal
effect on it. So basically it is pure geology, no impact of price whatsoever. Besides that, one
needs to aware of the price collapse and the possible impact on the industry. So I might be just
"lucky" to be right with my prediction, because the price collapse happened to coincide with the
predicted decline in production.
For that reason I added the other set of curves: the first derivative of the model and the
change in production (5 month moving average). The cool thing is: there is basically no disturbance
of the expected/predicted changes in the data. The changes in the data do follow the first derivative
of the model too. Would there have been a sudden policy change (due to lower prices) there would
occur a mismatch between the first derivative of the model and the change in the data. That did
not happen.
So, basically, I believe ND Bakken is producing every barrel it can, from a geology point
of view – despite the low prices.
Can you remind us what the URR of your Hubbert model is?
I ask because Proved plus probable reserves at the end of 2014 were about 9.3 Gb, cumulative
production was about 1.2 Gb at the end of 2014,which suggests a URR of 10.5 Gb, if no new reserves
are added from possible reserves or contingent resources in the future .
The decline has very little to do with geology and much to do with the oil price.
If new wells were being added at a rate of 150 new wells per month in a scenario where oil
prices only fell to $80/b instead of $50/b in 2015 and then gradually rose from $80/b in June
2017 to $160/b in Oct 2020, then output would increase until mid 2020 and then gradually decrease.
If we assume profitable well locations run out at about 40,000 total wells drilled, we get
the scenario below when 150 new wells per month are added from May 2015 to Sept 2031.
An alternative to Bruno Verwimp's model where the wells added decreases due to low oil prices
and then increase when oil prices increase in the future. The URR is consistent with USGS estimates
of about 10 Gb for the Bakken Three Forks.
Nice to meet you again, Dennis! I was waiting for you. :-)
The future will tell who had the
best idea. Reality may turn out to be something in between our ideas. At least I understand
for the coming year we agree. Down down down. Prices may (and will) rise again. But I do not
see another 27k wells being drilled in that North Dakota landscape. Just look at it on Google
Maps. There are wells everywhere! Where are the North Dakotans going to drill 27k new wells? The
USGS is an important institution, but I believe they overestimate Bakken URR greatly.
There are currently 10,756 producing unconventional Bakken–Three forks wells. Even including
the shut-in wells, the total number of drilled Bakken-TF wells unlikely exceeds 12-13 k.
So the number of potential well locations is still high. Many of them are outside the sweet
spots, but if and when oil prices rebound, a large part of potential B-TF wells may be economically
viable.
"Citing up-to-date analysis of production data and cash costs from over 10,000 oil fields,
Wood Mac said it believes 3.4 million b/d, or less than 4% of global oil supply, is unprofitable
at oil prices below $35/b.
Even the majority of US shale and tight oil, which has been under the spotlight due to higher-than-average
production costs, only becomes cash negative at Brent prices "well-below" $30/b, according to
the study."
So why are so many producers struggling and/or going broke?
That $30 to $35 mark must be well-head costs of production without overheads?
The present ND price is $16.50 for one thing. The analysis is for operating fields and does not
include exploration or new developments, without which oil companies would have a short lifetime.
I think they are only including OPEX or what I call LOE.
As I have mentioned previously, these expenses typically include only the electricity or other
power costs to operate the wells, the chemicals used on a regular basis down hole, minor repairs,
and direct lease labor. At least that is the way the shale guys report it. Otherwise, why do they
always report $4-$8 per BOE in company reports, yet I see much higher than that on the lease operating
statements sent to non-operated working interest owners for interests for sale on the auction?
I have my doubts as to whether they are including in OPEX finding and development costs, including
the costs to lease the land, permit the well, drill the well, complete the well, equip the well,
any subsequent equipment that is capitalized and not expensed, including replacement of tubulars,
rods, down hole pumps, etc. over the life of the well, both ordinary work overs such as repair
of tubing leaks and replacement of down hole pumps, as well as work overs such as sand pumping,
acid, re-perforation, re-fracking, all transportation costs, all general and administrative expenses,
all severance, extraction, production, income, ad valorem, etc. taxes, and interest payments on
debt.
In the real oilfield, not the one displayed by the shale cos. in their Urban skyscrapers, what
is most important is what goes in the checkbook, what goes out of the checkbook and the current
balance in the checkbook. Classifying a rod job as CAPEX does not change the fact that a check
has to be written within 30 days (apparently 180+ days for shale) to the contract company who
pulled the pump.
Due to the skyrocketing of costs in the industry from 2005-2014, I believe this crash is more
severe than 1998-1999, despite Brent and WTI oil prices not quite falling to the inflation adjusted
lows of that period, as well as the fact the basis spreads are much wider for certain crudes (think
Bakken, Western Canadian Select, etc.) than they were in that era.
We are suffering much more than in 1998-1999 for sure, on the very same leases. The combination
of cost inflation, reserves that are tougher to produce, and in the case of marginal producers
like us, natural decline, makes dropping into the $20s (or below) brutal.
The vast majority of US publicly traded E & P have PDP PV10 reserve values LESS than long term
debt at $50 WTI. At least I suspect the 10K will show that in the next 15-45 days as they are
released.
Keep in mind we have been hovering around $30 WTI in 2016, after hovering around $40 WTI since
last fall. I imagine PDP PV10 is less than half at $30 WTI as opposed to $50 WTI. I further suspect
that PUD PV10 in almost non-existent in the US onshore lower 48 fields at $30 WTI.
Remember that reserve based lending standards typically do not allow for a borrowing base in
excess of 65% of PDP PV10 (recently PV9 due to historically low interest rates). This includes
not only first lien bank debt, but any other types of second lien or junior debt.
Therefore, at $50 WTI, almost all US onshore based E & P DO NOT qualify for reserve based credit
with US banks. And we are at $30 and change today.
In reality, any equity value these companies have is purely a bet that the current WTI and
HH futures will not hold, but will go substantially higher in the near future (yet this year).
I know I and others have been beating this drum for a long time, but dang it the truth has
to be said. Just because 1% of wells in the Sprayberry Wolfcamp play in Midland Co., TX are worth
drilling and completing at $30 WTI does negate the fact that the entire industry is in jeopardy
without a significant price spike.
I would really like to know how much industry debt to banks is delinquent. I bet there is still
a lot of pretending going on by the banks with regard to provisioning energy loan losses.
Make no mistake about it, this has been a price crash of epic proportions.
"I think they are only including OPEX or what I call LOE. "
Woodmac mentions cash operating costs, not full-cycle costs
Cash operating costs include not only LOE, but also taxes, G&A.
Not sure if they include interest expense.
As regards LTO full cycle costs:
"full life cycle economics require an oil price in the range of $40-$60," Wood Mackenzie said.
AlexS. They may include taxes and interest, but I bet a lot of costs that are necessary to keep
the lease producing are put in CAPEX and not included.
For example, I look at a lot of LOS for shale wells.
LOE runs $10-20K routinely per well in the Williston Basin, with newer wells tending to be
more costly due to higher produced water disposal costs.
Invariably, however, there will be a monthly LOS with an extraordinary charge, some times in
excess of 5 times the routine monthly LOE. Sometimes it is not readily apparent what these charges
are for. Sometimes they are routine work overs, pump changes, tubing leaks. In any event, I believe
at least some of these costs are being capitalized. Anything permissible to reduce the per BOE
cost of LOE in company reports will be taken advantage of, and likely even required by GAAP, and
reported differently for income tax purposes.
It appears ND is granting operators the ability to idle wells producing 40 bopd or less for
up to 24 months.
Based on Enno Peters shale profile website, it is apparent many wells fall below 40 bopd within
60 months of first production. I suspect most wells under 40 gross bopd in the Williston Basin
cost $25 per BOE+ to keep online. Given the differential to WTI in that basin, I suspect they
generally are in the negative at current prices.
Regardless, if a 3-4 million bopd cut were announced by Russia and OPEC, I suspect prices would
rally significantly. So even if Wood Mac is including all the necessary expenses to keep production
online, 3-4 million bopd underwater is a big deal.
"The vast majority of US publicly traded E & P have PDP PV10 reserve values LESS than long term
debt at $50 WTI."
SS,
It is no different in District XI aka Canada :-)
And how many loans are created in consumer/real estate economy based on oil being $100
where was incentive to provide enough liquids at that price for our endless car circling that
we call GDP. That debt is no different than E&P debt and will be crashing down at same time.
Thank you, Ron, for this update. Assuming Bakken decline follows Bruno Verwimp's predicted curve
we are going to see an increase in the rate of fall over coming months. Noting that the model
is Hubbert, seasonally adjusted, implies that it is price insensitive; we shall see.
This will focus minds on the reality of the Red Queen and, to use another fairy tale analogy,
demonstrate that the Emperor has few clothes.
I read an article on Bloomberg a couple of days ago, saying that if oil gets to $50/bbl, that
the US oil companies will sell forward contracts and flood the market with oil.
I hope that Ron comments on this. But, I see some problems. The first problem is that the average
oil company has PROVED [with $100's billion of write-offs and worthless junk bonds] that they
cannot make a profit at $49 oil [2015 PV-10].
The second problem is: Suppose, at $50 oil, a company could sell forward 2 years of production
at $55. They cannot. Why not? Because they have no collateral. All of their assets are pledged
to existing loans. Why do they need collateral? Because, what if the price rises – to let's say
to $85. In that hypothetical, they need $30/bbl of margin CASH. I believe that Ron will confirm
that you HAVE to make margin calls within 24 hours or your position is sold out.
Well, how did companies like Chesapeake Energy do it. Well, at the time [several years ago],
they had enough reserves that were not pledged on any loans, even though they were highly leveraged.
So they pledged that collateral to, like Goldman Sachs, to cover any margin calls. So GS would
put up the margin calls, if needed.
Today is different. Most to these companies do not have any unpledged collateral. So, it is
a catch 22. They will not be able to sell forward contracts.
The the nine hundred forty five wells awaiting completion is in ND is probably an accurate number,
plus or minus maybe a couple of dozen, depending on how up to date the data is.
I read somewhere a couple of days ago that there are about four thousand wells awaiting completion,
in total, in the USA.
"... I am not going to mention any names publically but I know of one operator based in Midland in the Wolfcamp Bone Spring plays whose bankers are making him liquidate his acreage position. They loaned the operator $300 million for acreage and it is doubtful in my mind that they will recoup 1/2 of the cost. ..."
I am not going to mention any names publically but I know of one operator based in Midland
in the Wolfcamp & Bone Spring plays whose bankers are making him liquidate his acreage position.
They loaned the operator $300 million for acreage and it is doubtful in my mind that they will
recoup 1/2 of the cost.
Also, a lot of acreage is probably going to be surrendered this year in the Permian.
[Feb 17, 2016] Fracking wastewater causes cancer
Notable quotes:
"... fracking wastewater causes cancer. ..."
"... Using human bronchial epithelial cells, which are commonly used to measure the carcinogenesis of toxicants, researchers confirmed fracking flowback water from the Marcellus Shale caused the formation of malignancies. ..."
Additional buried costs of Unconventional extraction are surfacing. Fracking and production liquids
are live costs – how often is liquids disposal cost breaken out for the life of the well?
"Though fracking industry proponents scoff at any intimation their so-called vital industry
poses even scant risks to the public, a new study published in Toxicology and Applied Pharmacology
just proved those critics right - fracking wastewater causes cancer.
"... LOE runs $10-20K routinely per well in the Williston Basin, with newer wells tending to be more costly due to higher produced water disposal costs. ..."
"... I suspect most wells under 40 gross bopd in the Williston Basin cost $25 per BOE+ to keep online. Given the differential to WTI in that basin, I suspect they generally are in the negative at current prices. ..."
"... in any case, if the current wellhead price in the Bakken is $16.5, they are all in the red (ex hedges) ..."
AlexS. They may include taxes and interest, but I bet a lot of costs that are necessary to keep
the lease producing are put in CAPEX and not included.
For example, I look at a lot of LOS for shale wells.
LOE runs $10-20K routinely per well in the Williston Basin, with newer wells tending to be
more costly due to higher produced water disposal costs.
Invariably, however, there will be a monthly LOS with an extraordinary charge, some times in
excess of 5 times the routine monthly LOE. Sometimes it is not readily apparent what these charges
are for. Sometimes they are routine work overs, pump changes, tubing leaks. In any event, I believe
at least some of these costs are being capitalized. Anything permissible to reduce the per BOE
cost of LOE in company reports will be taken advantage of, and likely even required by GAAP, and
reported differently for income tax purposes.
It appears ND is granting operators the ability to idle wells producing 40 bopd or less for
up to 24 months.
Based on Enno Peters shale profile website, it is apparent many wells fall below 40 bopd within
60 months of first production. I suspect most wells under 40 gross bopd in the Williston Basin
cost $25 per BOE+ to keep online. Given the differential to WTI in that basin, I suspect they
generally are in the negative at current prices.
Regardless, if a 3-4 million bopd cut were announced by Russia and OPEC, I suspect prices would
rally significantly. So even if Wood Mac is including all the necessary expenses to keep production
online, 3-4 million bopd underwater is a big deal.
"... At least I understand for the coming year we agree. Down down down. Prices may (and will) rise again. But I do not see another 27k wells being drilled in that North Dakota landscape. Just look at it on Google Maps. There are wells everywhere! ..."
"... Where are the North Dakotans going to drill 27k new wells? The USGS is an important institution, but I believe they overestimate Bakken URR greatly. ..."
"... There are currently 10,756 producing unconventional Bakken–Three forks wells. Even including the shut-in wells, the total number of drilled Bakken-TF wells unlikely exceeds 12-13 k. ..."
"... So the number of potential well locations is still high. Many of them are outside the sweet spots, but if and when oil prices rebound, a large part of potential B-TF wells may be economically viable. ..."
Nice to meet you again, Dennis! I was waiting for you. :-) The future will tell who had the best
idea. Reality may turn out to be something in between our ideas.
At least I understand for the
coming year we agree. Down down down. Prices may (and will) rise again. But I do not see another
27k wells being drilled in that North Dakota landscape. Just look at it on Google Maps. There
are wells everywhere!
Where are the North Dakotans going to drill 27k new wells? The USGS is an
important institution, but I believe they overestimate Bakken URR greatly.
There are currently 10,756 producing unconventional Bakken–Three forks wells. Even including
the shut-in wells, the total number of drilled Bakken-TF wells unlikely exceeds 12-13 k.
So the number of potential well locations is still high. Many of them are outside the sweet spots, but if and when oil prices rebound, a large part
of potential B-TF wells may be economically viable.
Qatar will lead monitoring of the output freeze agreement, the nation's Energy Minister Mohammad
bin Saleh al-Sada said at a press briefing. Low oil prices haven't been positive for the world, he
said.
"A freeze would not create an immediate U-turn, but it creates a better foundation for the
price recovery in the second half," Olivier Jakob, managing director of consultant Petromatrix GmBh,
said in a note to clients.
"... I am sure they are heading that way and there will be a cut, because I can tell you that even the very rich Saudi Arabia is suffering. It's economy is suffering from the low oil prices and its currency is coming under heavy pressure because of the low oil prices. So, Saudi Arabia is going to help cut the production. ..."
"... There's no doubt that OPEC has lost some of its influence, but it is still a powerful organisation. They account for 41% of global production, which means a lot to the oil price and to the global oil market. However, it seems that under pressure from Saudi Arabia, OPEC has deserted the production quotas. And, of course, we know that that is part of Saudi Arabia oil policy, which is to pre-empt the return of Iraq and Iran in a big way into the global oil market. Saudi does not want to lose market share to its rivals, particularly Iraq, which is able to raise its production in a very significant way. As for Iran, it is difficult for Iran to raise its production even after lifting of the sanctions. ..."
"... It didn't work, it was intended initially by the U.S. and Saudi Arabia, in a sort of political plot against Iran and against Russia. It didn't work in both cases, but they don't want to lose face and reverse their policy. We know that Saudi oil policy of flooding the global oil market with a lot of oil has been tested under Sheikh Ahmed Zaki Yamani, the former Saudi oil minister in the early 80s, and proved wanting... But, it seems that they are repeating the policy which has proven its failure. So, sooner or later, and with the pressure under only-oil economy of Saudi Arabia, they will have to reverse that policy, where they like it or not. ..."
"... Sooner or later, they have to realize that they have to cut their losses and reverse that policy and be part of OPEC and accept a cut. ..."
"... The question is the low prices has affected everybody: from the global economy to oil producers around the world: The U.S. shale oil production, even the rich members of OPEC, like Saudi Arabia, UAE, Qatar, Kuwait - all these countries, their budgets are dependent on the oil revenue to the tune of 85-90%. So, as I said, that policy of flooding the market under pressure from Saudi Arabia has failed and they are now realizing that that policy is actually damaging their economies. Testimony to that is that they are cutting the subsidies which their people enjoyed for many-many years: subsidize for gasoline, diesel, water and electricity, and they are taking so many measure as well - like, Saudi Aramco is considering selling some shares ..."
"... ibya has become a footnote in the history of oil production, because until there's peace in Libya, there's no way Libya can go back to producing 1.6 million barrels a day as they used to do up to 2011. Now they are producing less than 300,000 barrels. They are hardly exporting anything, or, in fact, they're not exporting anything, and what they are producing is hardly enough for domestic consumption. ..."
"... As for Iran, Iran currently produces around 2.7-2.8 million barrels. When they say they don't want to accept any cuts - they are right, because their quota in OPEC is 4 million barrels a day. They have never achieved that quotas since 2000, and now they are producing far less than that. So, that's irrelevant whether they accept or not. ..."
"... in my opinion, a reasonable oil price for the global economy, to encourage investment and expansion of production is $100-130, because the global economy can absorb that price easily, because we don't have to look only at the price as such - we have to look at the fact that the oil companies, the global oil sector, needs the price of $125-135 a barrel to balance their books. ..."
"... according to the World Bank and to the IMF, it is projected that the global economy will grow this year at 3.5% and furthermore, the IEA in Paris has indicated that this year, the global demand for oil is growing at 1.4% or 1.5 million barrels a day. Even China, whom they say, their economy is slowing - well, their economy grew 7% in 2015 and is projected to match this, or a bit less, this year. So, they are a far bigger economy that they were in 2007, few years ago. So, all the fundamentals are positive, so that should be reflected in the higher oil price, even if OPEC does not cut production. ..."
"... neither Saudi Arabia or OPEC could kill the U.S. shale oil production. What will kill U.S. shale oil production in the long term is geology and debts. As you appreciate, a well of shale oil production loses 72-90% of its production in the first year, in comparison with the conventional oil. Of course, shale oil producers are depending on debts. They already have $200 billion in debts and with the rise of the interest rates in the U.S., they will find it difficult to pay to interest on that. That's why many shale oil producers have gone bankrupt - but the question remains that when the oil price starts to go up, shale oil will be back, but with not such of a quantity that will affect or cause glut in the market. What will cause glut, always, is OPEC producing over their production ceiling and that is the case. ..."
"... We have seen shale oil production has lost 600,000 barrels in 2015, and if the low oil prices continue, they are projected to lose another 900,000 barrels this year. So, the shale oil production is suffering, but then, not only the shale oil is suffering. Saudi Arabia and the Gulf region is suffering. Russia is suffering, the global economy is suffering. Every oil producer is suffering. That's why I am saying that it is up to OPEC to decide and to accept that shale oil production is a fact, and they have to deal with it as a fact. When the price goes up, shale oil will go back, but not to threaten a glut e market. America is still importing 7 million barrels a day, despite the fact that they are producing shale oil. ..."
"... American refineries are limited, they are configured to use medium and heavy oil imported from around the world, that's why the Americans now are trying to sell a bit of their ultra-sweet oil to refineries in the Asia-Pacific region and Europe where it can be refined, and they are importing an equivalent amount of medium and heavy oil for American refineries to use: but you need a lot of infrastructure inside the U.S., like pipelines, to carry the light oil, very light oil into these refineries, and that will take many years to become operational. That's why America is trying to sell or export a bit of its very light oil, and import equivalent amounts to use in their refineries. ..."
With oil prices at their lowest point, nations relying on oil are suffering - and it's not
just Russia and Venezuela. Even OPEC members are in trouble, despite having the power to change
the balance on the market. But they have been unable to reach such an agreement - at least up
until now. With rumors of OPEC finally deciding to cut production, will the oil market rise
again? And why are Saudi Arabia and the Gulf nations, now being forced to cut spending,
persisting in their position on the issue? We ask international an oil economist and a World Bank
consultant. Dr. Mamdouh G. Salameh is on Sophie&Co today.
Sophie Shevardnadze: International oil economist, World Bank consultor,
Dr. Mamdouh G. Salameh , thank you for being with us today. So, doctor, Saudi officials have
denied reports that OPEC has offered a 5% oil production cut; however, there are signal coming
from Riyadh and Baghdad that they are ready to accept the cuts, if OPEC agrees on it. Iran is not
planning any cuts in the near future, and then you have President of Venezuela, an OPEC member,
saying that world's top oil producers are close to forging a deal to restore oil prices. So, who
are we to believe, who is bluffing here?
Mamdouh G. Salameh: There's no smoke without fire. Certainly, there has been
a lot of reports about possible agreements between OPEC members and Russia about cutting oil
production in order to bolster the oil price. Of course, OPEC waits for Russia also to help, but
the fact remains that OPEC was responsible in the first place about the glut in the market,
because its members have been producing 2.2 million barrels a day above their production sealing.
So they have a responsibility towards the oil prices and towards their members to cut production.
I am sure that if they do that, Russia will match their cut, but they are using, possibly, half a
million barrel a day to support the oil price.
SS: So do you think there will be a 5% cut or not?
MS: I am sure they are heading that way and there will be a cut, because I
can tell you that even the very rich Saudi Arabia is suffering. It's economy is suffering from
the low oil prices and its currency is coming under heavy pressure because of the low oil prices.
So, Saudi Arabia is going to help cut the production.
SS: We're going to talk about Saudi Arabia a bit later, but let me ask
you this: the whole point of OPEC is to ensure stability for the oil markets, but it appears to
have been failing to do so in the past year. Has OPEC lost its grip, or is it doing this on
purpose?
MS: There's no doubt that OPEC has lost some of its influence, but it is
still a powerful organisation. They account for 41% of global production, which means a lot to
the oil price and to the global oil market. However, it seems that under pressure from Saudi
Arabia, OPEC has deserted the production quotas. And, of course, we know that that is part of
Saudi Arabia oil policy, which is to pre-empt the return of Iraq and Iran in a big way into the
global oil market. Saudi does not want to lose market share to its rivals, particularly Iraq,
which is able to raise its production in a very significant way. As for Iran, it is difficult for
Iran to raise its production even after lifting of the sanctions.
SS: Dr. Salameh, we're going to get to Iran a little bit later, but Saudi
Arabia has always played the role of the swing producer in OPEC. But so far, it's been refusing
to cut oil output and that's despite pressure from other members. Is it calling the shots in
OPEC? Has OPEC become a one-man show?
MS: As it is now, it seems so. Saudi Arabia is OPEC, and Saudi Arabia is the
decisive force in OPEC. But, Saudi Arabia has different thoughts about oil and oil prices. It
seems they are following the oil strategy intended to harm Iran's economy as well as to try to
slow down if not undermine the production of U.S. shale oil; and, of course, pre-empting Iran and
Iraq asking for bigger quotas inside the OPEC.
SS: Let me ask you this: if this Saudi policy is aimed against Iran - it
doesn't seem to be working, exactly, because Tehran is doing okay, upping its production and it
shows no sign of breaking down. Why persist?
MS:It didn't work, it was intended initially by the U.S. and Saudi Arabia,
in a sort of political plot against Iran and against Russia. It didn't work in both cases,
but they don't want to lose face and reverse their policy. We know that Saudi oil policy of
flooding the global oil market with a lot of oil has been tested under Sheikh Ahmed Zaki Yamani,
the former Saudi oil minister in the early 80s, and proved wanting... But, it seems that they are
repeating the policy which has proven its failure. So, sooner or later, and with the pressure
under only-oil economy of Saudi Arabia, they will have to reverse that policy, where they like it
or not.
SS: So, this Saudi desire to bring Iran down -- is it worth the economic
fallback for Riyadh? You just said that their economy is already suffering. According to data
compiled by CNBC - Saudi Arabia may go bankrupt as early as 2018 - if the prices stay this low.
MS: Well, the IMF has warned that if low oil prices prevail for the next few
years, Saudi Arabia would have used all it is financial reserves of 5 years. So, in 5 years time,
like, by 2020, Saudi Arabia will not have any financial reserves to support itself...
SS: So that's why I am asking: is this quarrel really worth an economic
fallback that big for Riyadh?
MS: Really, it's a political decision. They have given more weight to
political decisions rather than the economic decisions. They cannot accept that that policy has
failed. But, as I said, because they cannot accept that, their economy and their currency are
suffering. Sooner or later, they have to realize that they have to cut their losses and reverse
that policy and be part of OPEC and accept a cut.
SS: I am thinking, it's not just the Saudis, because the economies of all
Gulf petrol states are dependent almost entirely on oil. What are the risks of the oil price
being low for them and since their budgets are already being cut, will the population grow
restless? Is it dangerous? I mean, Arab spring was just around the corner from them...
MS: Yes. The question is the low prices has affected everybody: from the
global economy to oil producers around the world: The U.S. shale oil production, even the rich
members of OPEC, like Saudi Arabia, UAE, Qatar, Kuwait - all these countries, their budgets are
dependent on the oil revenue to the tune of 85-90%. So, as I said, that policy of flooding the
market under pressure from Saudi Arabia has failed and they are now realizing that that policy is
actually damaging their economies. Testimony to that is that they are cutting the subsidies which
their people enjoyed for many-many years: subsidize for gasoline, diesel, water and electricity,
and they are taking so many measure as well - like, Saudi Aramco is considering selling some
shares. That would have been a science fiction a few years ago, but now it's becoming a reality
and the Deputy Crown Prince of Saudi Arabia has said in an interview with The Economist magazine
that they are considering that. He confirmed, and he said that not only Saudi Aramco but other
government-owned companies will be subject to share sale.
SS: Okay. Now, let's look at the other side. Countries like Iran and
Libya are against curbing their production, and they're saying they need higher output levels to
make up for years of wars and sanctions. Are those fair demands? What can make them change their
mind?
MS: It is irrelevant. Let's take Libya, for instance. Libya has become a
footnote in the history of oil production, because until there's peace in Libya, there's no way
Libya can go back to producing 1.6 million barrels a day as they used to do up to 2011. Now they
are producing less than 300,000 barrels. They are hardly exporting anything, or, in fact, they're
not exporting anything, and what they are producing is hardly enough for domestic consumption.
So, you can put them for the next few years on the margin, simply because that has to wait for a
political settlement. As for Iran, Iran currently produces around 2.7-2.8 million barrels. When
they say they don't want to accept any cuts - they are right, because their quota in OPEC is 4
million barrels a day. They have never achieved that quotas since 2000, and now they are
producing far less than that. So, that's irrelevant whether they accept or not.
SS: Venezuela's President Maduro has also said that a fair oil price
would almost amount to $60 a barrel. Is that the case, or the current price actually reflects the
real value of crude?
MS: Well, for the time being, it's okay if we can achieve it, shortly,
provided OPEC cuts production. However, in my opinion, a reasonable oil price for the global
economy, to encourage investment and expansion of production is $100-130, because the global
economy can absorb that price easily, because we don't have to look only at the price as such -
we have to look at the fact that the oil companies, the global oil sector, needs the price of
$125-135 a barrel to balance their books. The major seven companies in the world need that price.
They are already cutting their investment globally, and their expenditure and they are making
thousands if not hundreds of thousands of people redundant. That is undermining the global
economy - and of course the economies of the oil producing countries. So, we need a very
reasonable price, and in my opinion, the price should be between $100-130 a barrel to give the
global economy the incentive to invest heavily and globally.
SS: But is that a realistic price? Do you think we will ever see oil go
up to $125 again?
MS: It will, eventually, because, if you look now, even if the price is
around $33, to the fundamentals of the global oil markets, the fundamentals are positive, meaning
that, according to the World Bank and to the IMF, it is projected that the global economy will
grow this year at 3.5% and furthermore, the IEA in Paris has indicated that this year, the global
demand for oil is growing at 1.4% or 1.5 million barrels a day. Even China, whom they say, their
economy is slowing - well, their economy grew 7% in 2015 and is projected to match this, or a bit
less, this year. So, they are a far bigger economy that they were in 2007, few years ago. So, all
the fundamentals are positive, so that should be reflected in the higher oil price, even if OPEC
does not cut production.
SS: There's a lot of talk about Chinese economy slowing down, you know,
and this could also drive the demand for oil down: however, China is still buying a lot of oil,
record amounts. So, the fears of China recession and its effect on commodity - is this all
exaggerated?
MS: It is very much exaggerated and it has been played up so much, especially
by Western media. China is still importing oil in increasing quantities, not only for their own
consumption but for their strategic reserves as well. As I mentioned, China's GDP now is 3 times
what it was in 2007, eight years or nine years ago. So, there's only one way for China's demand
for oil and that's upwards. That's why I am saying it is politics that are affecting the oil
price and not the fundamentals of the oil market.
SS: So, will cheap crude actually help the monster economies of China and
India regain growth, demand more oil, thus driving, maybe, the prices back up?
MS: Of course. Of course. There's a correlation between economic growth and
demand for oil, even with the rationalization of the use of oil, and when the economies of these
countries start to show improvement, of course, the demand for oil will increase. Not
particularly for the European Union, because they are... it has plateaued, virtually, their
demand for oil, has plateaued but for the Asia-Pacific region, in particular, and the developing
countries around the world, the demand for oil is growing, and that should be reflected in higher
oil prices for many years to come.
SS: Another huge topic that's affecting the prices, is, of course, the
U.S. shale oil and its shale oil producers have been flooding the oil market with up to 9 mn
barrels a day, contributing to the global oil price fall. Like you've said, Saudi Arabia is
refusing to cut production, to keep its place on the U.S. market, and therefore, draw American
shale oil out of business. If that's the case, are they succeeding? What do you think? The number
of oil rigs in the U.S. has more than halved in the last year.
MS: It is not Saudi Arabia of OPEC who are adversely affecting U.S. shale oil
production, it is the oil prices.
SS: Yeah, but the oil prices are directly linked to what Saudis are doing
in the region...
MS: That is true, but the question is neither Saudi Arabia or OPEC could kill
the U.S. shale oil production. What will kill U.S. shale oil production in the long term is
geology and debts. As you appreciate, a well of shale oil production loses 72-90% of its
production in the first year, in comparison with the conventional oil. Of course, shale oil
producers are depending on debts. They already have $200 billion in debts and with the rise of
the interest rates in the U.S., they will find it difficult to pay to interest on that. That's
why many shale oil producers have gone bankrupt - but the question remains that when the oil
price starts to go up, shale oil will be back, but with not such of a quantity that will affect
or cause glut in the market. What will cause glut, always, is OPEC producing over their
production ceiling and that is the case.
SS: But talking about the shale oil production what you've just
described, how long before that actually happens?
MS: We have seen shale oil production has lost 600,000 barrels in 2015, and
if the low oil prices continue, they are projected to lose another 900,000 barrels this year. So,
the shale oil production is suffering, but then, not only the shale oil is suffering. Saudi
Arabia and the Gulf region is suffering. Russia is suffering, the global economy is suffering.
Every oil producer is suffering. That's why I am saying that it is up to OPEC to decide and to
accept that shale oil production is a fact, and they have to deal with it as a fact. When the
price goes up, shale oil will go back, but not to threaten a glut e market. America is still
importing 7 million barrels a day, despite the fact that they are producing shale oil.
SS: Here's another interesting topic: global oil producers are actually
running out of space to store all the oil surplus they have, moving the commodity to be stored in
tankers at sea - is there nowhere to sell all this oil? Are traders stockpiling the goods to sell
them later, when the price goes higher?
MS: Well, they sell when there's demand for oil and I think there's demand.
The part of the low oil price is that some of this stored oil is seeping to the market. But, the
amount they are storing is not that huge. I know, the storage in America has reached the top now,
and there's no other way except to plateau or start to decline. But, when the prices improve, I
am sure, those who have some stored oil will introduce it to the market, but the effect of that
introduction on the oil price will be short-lived and limited, because no matter how much you
store, you are producing what you can produce, and you are selling most of it at low oil prices,
so what is stored is very limited world-wide.
SS: You know, one refinery in the U.S. is already buying oil at a
negative price - that is, it gets paid for taking surplus oil off the hands of producers. Is that
the consequence of the low storage space available? I mean, what's the point of producing oil if
you then have to pay someone else to buy it?
MS: There are reports like that about American refineries, but you appreciate
also that American refineries are limited, they are configured to use medium and heavy oil
imported from around the world, that's why the Americans now are trying to sell a bit of their
ultra-sweet oil to refineries in the Asia-Pacific region and Europe where it can be refined, and
they are importing an equivalent amount of medium and heavy oil for American refineries to use:
but you need a lot of infrastructure inside the U.S., like pipelines, to carry the light oil,
very light oil into these refineries, and that will take many years to become operational. That's
why America is trying to sell or export a bit of its very light oil, and import equivalent
amounts to use in their refineries.
SS: Dr. Salameh, thank you so much for this insight. We were talking to
Dr. Mamdouh G. Salameh , international oil economist, a consultant on energy issues for the World
Bank, discussing the oil price drop and the effect it's having on the world's economic and energy
landscape. That's it for this edition of Sophie&Co, I will see you next time.
Links to an excerpt from "On Saudi Arabia" and to a NYT article on the young prince, Prince Mohammed
bin Salman, who seems to be calling the shots in Saudi Arabia:
To me the Saudi strategy looks like that they want to push everything to extreme as this
will turn the table in politics and also in the oil market more likely than a 'soft approach'.
Brilliant article. Thanks! Feudal states and the Mafia family type business don't differ much.
Many great examples throughout history. It'll b very interesting to watch KSA unwind and train
wreck.
What's unfolding is what Karen Elliott House described in her book "On Saudi Arabia."
What scares many royals and most ordinary Saudis is that the succession, which historically
has passed from brother to brother, soon will have to jump to a new generation of princes.
That could mean that only one branch of this family of some seven thousand princes will have
power, a prescription for potential conflict as thirty-four of the thirty-five surviving lines
of the founder's family could find themselves disenfranchised.
"... Understood one way, the Saudi king is CEO of a family business that converts oil into payoffs that buy political loyalty. They take two forms: cash handouts or commercial concessions for the increasingly numerous scions of the royal clan, and a modicum of public goods and employment opportunities for commoners. The coercive "stick" is supplied by brutal internal security services lavishly equipped with American equipment. ..."
"... With its political and business elites interwoven in a monopolistic network, quantities of unaccountable cash leaving the country for private investments and lavish purchases abroad, and state functions bent to serve these objectives, Saudi Arabia might be compared to such kleptocracies as Viktor Yanukovich's Ukraine. ..."
In fact, Saudi Arabia is no state at all. There are two ways to describe it: as a political
enterprise with a clever but ultimately unsustainable business model, or so corrupt as to
resemble in its functioning a vertically and horizontally integrated criminal organization.
Either way, it can't last. It's past time U.S. decision-makers began planning for the collapse of
the Saudi kingdom.
In recent conversations with military and other government personnel, we were startled at how
startled they seemed at this prospect. Here's the analysis they should be working through.
Understood one way, the Saudi king is CEO of a family business that converts oil into payoffs
that buy political loyalty. They take two forms: cash handouts or commercial concessions for the
increasingly numerous scions of the royal clan, and a modicum of public goods and employment
opportunities for commoners. The coercive "stick" is supplied by brutal internal security
services lavishly equipped with American equipment.
... ... ...
If the loyalty price index keeps rising, the monarchy could face political insolvency.
Looked at another way, the Saudi ruling elite is operating something like a sophisticated
criminal enterprise, when populations everywhere are making insistent demands for government
accountability. With its political and business elites interwoven in a monopolistic network,
quantities of unaccountable cash leaving the country for private investments and lavish purchases
abroad, and state functions bent to serve these objectives, Saudi Arabia might be compared to
such kleptocracies as Viktor Yanukovich's Ukraine.
For the moment, it is largely Saudi Arabia's Shiite minority that is voicing political
demands. But the highly educated Sunni majority, with unprecedented exposure to the outside
world, is unlikely to stay satisfied forever with a few favors doled out by geriatric rulers
impervious to their input. And then there are the "guest workers." Saudi officials, like those in
other Gulf states, seem to think they can exploit an infinite supply of indigents grateful to
work at whatever conditions. But citizens are now heavily outnumbered in their own countries by
laborers who may soon begin claiming rights.
For decades, Riyadh has eased pressure by exporting its dissenters-like Osama bin Laden-fomenting
extremism across the Muslim world. But that strategy can backfire: bin Laden's critique of Saudi
corruption has been taken up by others and resonates among many Arabs. And King Salman (who is
80, by the way) does not display the dexterity of his half-brother Abdullah. He's reached for
some of the familiar items in the autocrats' toolbox: executing dissidents, embarking on foreign
wars, and whipping up sectarian rivalries to discredit Saudi Shiite demands and boost nationalist
fervor. Each of these has grave risks.
There are a few ways things could go, as Salman's brittle grip on power begins cracking.
One is a factional struggle within the royal family, with the price of allegiance bid up beyond
anyone's ability to pay in cash. Another is foreign war. With Saudi Arabia and Iran already
confronting each other by proxy in Yemen and Syria, escalation is too easy. U.S. decision-makers
should bear that danger in mind as they keep pressing for regional solutions to regional
problems. A third scenario is insurrection - either a non-violent uprising or a jihadi
insurgency-a result all too predictable given episodes throughout the region in recent years.
The U.S. keeps getting caught flat-footed when purportedly solid countries came apart. At the
very least, and immediately, rigorous planning exercises should be executed, in which different
scenarios and different potential U.S. actions to reduce the codependence and mitigate the risks
can be tested. Most likely, and most dangerous, outcomes should be identified, and an energetic
red team should shoot holes in the automatic-pilot thinking that has guided Washington policy to
date.
"Hope is not a policy" is a hackneyed phrase. But choosing not to consider alternatives amounts
to the same thing
Brent crude futures trading at the Intercontinental Exchange (ICE) in London
surged over 7.5 percent after Iran declared its support for the oil output freeze.
Despite expressing its backing for the step, Tehran has not made any pledges
to curb to its own production.
After the initial rise, the positive market trend ended a few minutes later,
with the gain then dropping to around 6.2 percent.
WTI futures in New York also saw a reverse in earlier losses, gaining as
much as 6.3 percent, according to Bloomberg.
On Wednesday, Tehran expressed its support for the plan to freeze oil production
levels, which was put forward by Russia and Saudi Arabia a day earlier.
After meeting with energy ministers from other top crude oil producers, Iran's
Oil Minister Bijan Namdar Zanganeh said the country supported the measures that
aim to prevent a further drop in oil prices.
Iran backs the proposal, Iranian Shana news agency reported. However, the
minister did not specify whether Tehran would curb its own crude production.
Following the Moscow-Riyadh output agreement, Zanganeh met with his counterparts
from Iraq, Qatar and Venezuela in the Iranian capital. He assessed the meeting
as being positive, TASS news agency reported.
With three OPEC members – Qatar, Venezuela and Kuwait – already having said
they are ready to freeze output at January levels, and the UAE saying it's open
to cooperation, the fate of the initiative now mostly depends on Iran's participation.
The US is the dominant force in international banking. It is this position from which sanctions
are derived. Iran had to (and often did) find other ways to get paid for shipping oil than money
flow through international banking, which US and EU sanctions prohibited.
If you seek to oppose the US, you must not fight in a money arena. It's a disadvantageous battlefield.
The price of oil is determined by what? NYMEX traders? Or agreement between a refinery and
an oil exporter?
I would suggest it is the latter, which need not depend on NYMEX numbers at all.
If your goal is to destroy US shale, the last thing you would do is allow your weapon (price)
to be defined by your target (the US in general, which is where the NYMEX is). Nor would you allow
it to be defined by something as variable as free market forces. If you specify price to your
buyer, perhaps lower than his bid, you remove the marketplace from involvement in the battle.
The goal is victory. Not profit. How could you allow yourself to define victory in pieces of
paper printed by your enemy?
If your goal is to destroy US shale, the last thing you would do is allow your weapon (price)
to be defined by your target (the US in general, which is where the NYMEX is). Nor would you allow
it to be defined by something as variable as free market forces.
If your goal is to destroy US shale then the only way you can do that is to produce every barrel
of oil you possibly can. It would not be within your power to allow the price to be defined
by anyone or anything other than market forces. Of course every exporter negotiates a price with
his buyer. But that price must be within a reasonable amount of what the world oil price is at
the moment.
The price of oil is determined by supply and demand just like every commodity on the market.
Every day, there are thousands of oil buyers around the world. There are dozens of sellers,
many of them exporters. All the buyers are in competition with other buyers to get the lowest
possible price. All the sellers are in competition with other sellers to get the highest price
possible. And the price moves up and down with each trade, hourly or sometimes minute by minute.
To believe that even one of those dozens of exporters has the power to set the price oil, much
higher than everyone else is getting, is just silly. And likewise, to believe that a buyer can
get a much lower price than everyone else is getting, is just as silly.
They say that depletion never sleeps. Well, market forces never sleep either.
But that price must be within a reasonable amount of what the world oil price is at the moment.
Which is why it took the predator 18 mos to get it down to lethal levels. Just repeatedly be
willing to sell for a bit less than the bid and down it will go, because others will protect their
marketshare by matching your price (sound familiar?). Then you're no longer the only one offering
a low price.
All the sellers are in competition with other sellers to get the highest price possible.
Were this so there would exist no wiki for predatory pricing.
You aren't thinking about victory. If you seek victory, you don't fight in an arena where you
are disadvantaged. If you're the low cost producer of the lifeblood of civilization, you assert
that advantage and kill the enemy.
By your reasoning the price of oil should be close to zero, say $1/b.
Explain why that isn't the case, if "victory" is the sole objective.
Also predatory pricing is not an effective strategy especially in commodity markets where the
barriers to entry are low.
OPEC does not set the price of oil on World Markets, they simply influence it by their level
of output. In the case of the oil industry attempts at predatory pricing are not rational, it
is simply a strategy for losing money.
Which is why it took the predator 18 mos to get it down to lethal levels. Just repeatedly be
willing to sell for a bit less than the bid and down it will go, because others will protect their
market share by matching your price (sound familiar?). Then you're no longer the only one offering
a low price.
Oh good grief. I give up. You are a hopeless case.
I don't think Watcher expresses the situation very clearly, especially with words like 'predator'.
I don't see it as an apt analogy. I do however feel that the current price war/production war/phantom
production war is clearly an act of economic warfare by Saudi Arabia against their competitors.
It seems odd to me that a world oil production system that can't very accurately tell me how much
oil was produced today until months after the fact is going to start the day tomorrow by saying
'we are over supplied by 1.8 million barrels a day today' and then proceed to talk the price into
the gutter.
"... So if the question is, as Ron is posting, how much value have EIA predictions? The answer clearly is none. EIA predictions are useless. Evidence indicates that they are going to overestimate production by a large amount for as long as production goes down. ..."
"... In my view the past surge in shale production was based on the favorable conditions of the bond market (search for yield). As long as the bond market has been liquid, production could surge. However, as the recent collapse of the bond market starts affecting production (see below chart) we could see another black swan event on the downside of production. ..."
"... An analyst on CNBC had an interesting quote, which he attributed to John D. Rockefeller, to-wit, there has been more money lost to the ill advised search for yield, than in all of the bank robberies in recorded history. ..."
"... As regards the black swan event on the downside of production, we will see which financial tricks the shale guys, their bankers and investors will invent to keep shale production afloat. ..."
"... I agree if you are talking about the money the bankers and investors already have invested in shale. But the bankers and investors will not likely be looking for ways to lose more money. New investment in shale will be difficult to come by. ..."
"... I think we should view surge in shale production not as something based on the favorable conditions of the bond market but as yet another boom and bust cycle which is the hallmark of neoliberal economy. Third in the sequence dot.com-real estate-shale oil, if you wish. ..."
"... In all three cases it was reckless financing using new instruments which became available after deregulation which initiated the bubble. In this case covenant-light loans - the crappiest kind of junk. ..."
On the issue of EIA's predictions accuracy, I updated this graph from Mason Inman and added
actual oil US production.
What this graph shows is a typical very conservative estimate system. This means that on the
way up, they greatly underestimate production and on the way down, they are going to greatly overestimate
production.
This clearly shows how credible their predictions are. Although the graph is only for the US,
clearly they are going to be equally conservative (and thus equally wrong) about world oil production.
The long-term projections of U.S. LTO production are from various issues of the EIA Annual
Energy Outlook. They indeed were very conservative, even though none of them (even the AEO-2015)
did not assume such a big drop in oil prices.
As regards the actual production data (the black line), it is from the Drilling Productivity
Report and include almost 1 mb/d of conventional output, primarily from the Permian basin.
U.S. LTO production had never reached 5.5 mb/d, as the black line shows. According to the most
recent EIA presentation, the local peak (In March 2015) was around 4.6 mb/d
But the issue continues being that EIA underestimated production so much that it had to raise
its predictions by about 100% each year.
Look at the prediction for 2020:
AEO 2012: 1.3 mbpd
AEO 2013: 2.8 mbpd
AEO 2014: 4.7 mbpd
And all this without any significant change in oil price.
So if the question is, as Ron is posting, how much value have EIA predictions? The answer clearly
is none. EIA predictions are useless. Evidence indicates that they are going to overestimate production
by a large amount for as long as production goes down.
These are projections for LTO, a new resource type.
Its emergence as a new important source of global supply and its rapid growth was a "black swan"
event, which nobody could predict.
This is a good example why all such projections are just a snapshot that reflects our current
knowledge of geology, technology and other factors affecting energy supply
In my view the past surge in shale production was based on the favorable conditions of the
bond market ('search for yield'). As long as the bond market has been liquid, production could
surge. However, as the recent collapse of the bond market starts affecting production (see below
chart) we could see another 'black swan' event on the downside of production.
An analyst on CNBC had an interesting quote, which he attributed to John D. Rockefeller, to-wit,
there has been more money lost to the ill advised search for yield, than in all of the bank robberies
in recorded history.
Yes, access to cheap money (not only bonds, but also bank loans) was one of the key factors
that contributed to the shale boom.
As regards the 'black swan' event on the downside of production, we will see which financial
tricks the shale guys, their bankers and investors will invent to keep shale production afloat.
we will see which financial tricks the shale guys, their bankers and investors will invent
to keep shale production afloat.
I agree if you are talking about the money the bankers and investors already have invested
in shale. But the bankers and investors will not likely be looking for ways to lose more money.
New investment in shale will be difficult to come by.
I think we should view "surge in shale production" not as something "based on the favorable
conditions of the bond market" but as yet another "boom and bust" cycle which is the hallmark
of neoliberal economy. Third in the sequence dot.com-real estate-shale oil, if you wish.
In all three cases it was reckless financing using new instruments which became available after
deregulation which initiated the bubble. In this case covenant-light loans - the crappiest kind
of junk.
Like in all previous bubbles the deflation of the shale bubble might take some banks (this
time regional) with it and result in a real extinction of shale companies. Technological progress
achieved will remain intact and will be picked up by survivors.
The wave of bankruptcies will depress new drilling and might serve as another catalyst of the
decline of shale oil production in 2016 and 2017 (despite takeover of properties). The decline
that was not accounted for in the current forecasts.
Unlike two previous bubbles, this is a more localized disturbance and the size of CCC and lower
junk bond market is just around one and a half trillion, but it will likely spread to the broader
economy at least in six affected states due to links to mortgages, commercial real estate, municipal
bonds, etc.
And it coincides with the weakening of the US economy.
I agree. Also your point about oil prices is important, oil prices are very difficult to predict
and eventually they will affect output, though there is a significant time lag (maybe 18 to 36
months) between a change in oil prices and a change in the oil supply. I have not yet figured
out what this time lag is, but my current guess is about 24 months on average.
This will vary depending on the oil field (deep water projects have a longer lag and onshore
conventional and LTO may be somewhat shorter than the global average).
So Ace got it wrong. We have been knowing that for a long time. That's history. What's your point?
Oil production will definitely, one day, peak. The fact that past predictions of peak oil were
wrong only means they were too early. People who are predicting peak oil now, or at any time in
the future, will be 8 years closer to hitting the date than Ace did.
I am reminded of insider traders in the stock market. That is company executives buying or
selling stock in their own companies. The saying is, They are almost always right. But…
They are almost always too early.
That is, they see that something is definitely happening so they act. But they just expect
it to happen way before it really does. The same can be said about peak oil prognosticators. We
saw that peak oil was definitely going to happen. But most of us were way too early with our prognostications,
about 8 years too early :-)
Yes the time lag is different for different type of resource, different type of projects, different
producing fields, different countries and different companies.
A big question is how to calculate this time lag.
LTO was expected to be the first to react, and it indeed reacted the most. But I was expecting
much bigger declines last year.
Conventional output was almost unaffected last year (low short-term price elasticity). There
will be some negative supply-side impact this year, but the biggest cumulative impact from low
prices should be felt by 2020.
"... This year, global exploration-and-production investments will fall by $170 billion, or 20%, according to Rystad Energy. If international oil prices average $50 a barrel next year-a level many analysts said appears optimistic-investment could fall by one-fifth in 2016, the Oslo-based energy consulting firm estimates. ..."
"... That would be the first time the industry has registered two consecutive years of investment declines in 30 years, according to the International Energy Agency, a global industry monitor. . . . ..."
"... The stage is set for a supply crunch down the line, Mr. Mahesh said. Supply from existing fields will fall, while new projects wont come online to replace them. ..."
"... Barclays sees Brent reaching $85 a barrel by 2020, while others see the potential for an even steeper rise. ..."
"... You could see prices shooting up from $30 to $100 pretty quickly, said Iain Reid, head of European oil and gas at Macquarie bank. At some point the chickens will come home to roost. ..."
"... Based on the WSJ article, global upstream capex was about $1.5 Trillion in 2014 2015 combined. I dont know what the division was between crude oil and gas + associated liquids (condensate NGL), but its plausible that it took about a trillion dollars over a two year period, in order to keep our global crude oil production base approximately stable, at around 68 to 69 million bpd, versus an estimated 69 million bpd in 2005. ..."
"... If that was solely CAPEX it seems high – assuming 4 mmbpd per year is needed to be bought on line and $70 to $90,000 per bpd average development costs gives $560 to $720 billion. maybe up to $1 to $1.2 trillion with gas developments included. So maybe it includes exploration DRILLEX as well, or costs have gone up a bit (or decline is higher than Ive assumed). But I think it must include all oil and all natural gas, greenfield and brownfield. ..."
"... According to the most recent Barclays survey, the primary source of data on global upstream capex, total spending was $673.2bn in 2014; $520.5bn in 2015 and is projected at $444.4bn in 2016 ..."
With the world awash in crude*, the oil industry is contemplating a new problem the oversupply
could tee up: an oil shortage.
As the oil glut has sent prices to decade lows, plummeting investment by oil-producing countries
such as Venezuela and Russia and oil drillers such as Exxon Mobil Corp. and Royal Dutch Shell
PLC means fewer barrels will be produced.
That could leave the world in exactly the opposite situation as now: short of oil and willing
to pay more to get it.
This may herald the beginning of a cycle that other commodities, from gold to copper, find
more familiar-a cycle in which a glut leads to lower prices that lead to investment cuts, which
chokes supply and prompts the price gains that lead to renewed expansion and future gluts.
"A big gap is forming in oil-industry investment," Claudio Descalzi, chief executive of
Italian energy company Eni SpA, recently told reporters. "That will lead in two to three years
to an imbalance between supply and demand that will push prices higher."
This year, global exploration-and-production investments will fall by $170 billion,
or 20%, according to Rystad Energy. If international oil prices average $50 a barrel next year-a
level many analysts said appears optimistic-investment could fall by one-fifth in 2016, the
Oslo-based energy consulting firm estimates.
That would be the first time the industry has registered two consecutive years of investment
declines in 30 years, according to the International Energy Agency, a global industry monitor.
. . .
"The stage is set for a supply crunch down the line," Mr. Mahesh said. "Supply from
existing fields will fall, while new projects won't come online to replace them."
Barclays sees Brent reaching $85 a barrel by 2020, while others see the potential for
an even steeper rise.
"You could see prices shooting up from $30 to $100 pretty quickly," said Iain Reid,
head of European oil and gas at Macquarie bank. "At some point the chickens will come home
to roost."
*Awash in total liquids perhaps, but IMO not in actual crude oil
Based on the WSJ article, global upstream capex was about $1.5 Trillion in 2014 & 2015
combined. I don't know what the division was between crude oil and gas + associated liquids (condensate
& NGL), but it's plausible that it took about a trillion dollars over a two year period, in order
to keep our global crude oil production base approximately stable, at around 68 to 69 million
bpd, versus an estimated 69 million bpd in 2005.
If that was solely CAPEX it seems high – assuming 4 mmbpd per year is needed to be bought
on line and $70 to $90,000 per bpd average development costs gives $560 to $720 billion. maybe
up to $1 to $1.2 trillion with gas developments included. So maybe it includes exploration DRILLEX
as well, or costs have gone up a bit (or decline is higher than I've assumed). But I think it
must include all oil and all natural gas, greenfield and brownfield.
Either the current ongoing cuts, which for me go back to the cancellation of the Voyageur upgrader
in May 2013 with about $3 billion write off of sunk costs, are going to have a huge impact over
the next five years for oil. Maybe a bit longer for gas as the LNG projects are still coming on
line feeding an already large glut.
The cuts in exploration budget will impact as well, but given how little oil in large fields
has really been found since Johan Sverdrup in 2010, maybe it's not such a big deal (the lack of
discoveries with or without exploration will of course be a large impact).
This year, global exploration-and-production investments will fall by $170 billion, or 20%,
according to Rystad Energy. If international oil prices average $50 a barrel next year-a level
many analysts said appears optimistic-investment could fall by one-fifth in 2016, the Oslo-based
energy consulting firm estimates.
You're right. I was a little off with my math. They were projecting that 2015 + 2016 total
global capex (oil and gas + associated liquids) would be about $1.2 Trillion, not $1.5 Trillion.
So, then the question is the allocation between crude oil and gas reservoirs.
According to the most recent Barclays survey, the primary source of data on global upstream
capex, total spending was
$673.2bn in 2014; $520.5bn in 2015 and is projected at $444.4bn in 2016
"... KSA has cut production in 6 out of the last seven months. Cut might not be the right word though as I suspect it was not a choice. It was thrust upon them by geology. ..."
"... I feel they are producing every single barrel that they possibly can. Theyve got the peddle to that floor. No holding back. ..."
KSA has 'cut' production in 6 out of the last seven months. Cut might not be the right word
though as I suspect it was not a choice. It was thrust upon them by geology.
KSA will IMO face month after month of decreasing production. They managed a production
surge for a short while but that's all they had in them. They've shot their bolt. Iran probably
has some good increases coming but that's about it, and not all of that Iranian increase will
be exported.
The increase in Saudi oil production in the summer season was due to peak demand from the domestic
power generation for air conditioning.
As demand moderated in the past several months, KSA slightly reduced output levels, while crude
exports have actually increased.
KSA oil production and exports in 2015 – Jan. 2016
sources: JODI, OPEC
Do you believe that the slightly reduced production level of the last 6 of 7 months was optional?
I tend not to. I feel they are producing every single barrel that they possibly can. They've
got the peddle to that floor. No holding back.
How you can expand exports when Iran is very aggressively trying to get back into the market
with a very similar product at a very similar price. And somehow signed contracts for at least
0.3 Mb/d in Europe alone.
Does this mean that there is a huge deficit in the world for good quality oil or they simply
undercut competitors, including Iranians ?
OPEC member Kuwait projected a record budget deficit for the fiscal year starting April 1 on the
sliding price of oil, the finance ministry said on Thursday.
The shortfall
for the 2016-2017 fiscal year is estimated at 11.5 billion dinars ($38 billion) due to a sharp decline
in oil revenues, the ministry said on its Twitter account.
Spending was estimated at 18.9 billion dinars, just 1.6 percent lower than
in the current year, the ministry said.
Revenues were projected at 7.4 billion dinars, of which oil income is estimated
at $19.1 billion or just 78 percent of the public revenues.
In the past, income from oil contributed more than 94 percent of revenues
in the Gulf emirate, before the decline in crude prices.
Kuwait has projected a shortfall of $23 billion in the current fiscal year
which ends March 31, the first deficit after 16 years of surplus.
The Gulf state, which has a native population of just 1.3 million, has
built around $600 billion in fiscal reserves in those years.
"... The money crunch is hitting just as U.S. production is starting to decline. On Tuesday, the Energy Information Administration estimated that production is down 600,000 barrels per day since April; the agency expects production to fall at least that much again by the end of the year. Without a cash infusion, those declines will only accelerate. ..."
"... If production is falling, does that mean oil prices are going to go back up? Maybe. A popular argument in the oil patch is that the pullback in investment is sowing the seeds for the next surge in prices; oil companies won't be able to boost production quickly enough when it's needed, leading to higher prices. But even if that argument is right, it could take years for such a rebalancing to occur. And besides, as I've argued before, the conventional wisdom on oil is (almost) always wrong . ..."
Oil companies have survived low prices this long because banks and investors
were willing to lend them billions of dollars on the assumption that the price
plunge would be short-lived. But as experts become
increasingly convinced that prices will
stay low for years, Wall Street is turning off the money spigot. (It doesn't
help that the global economic slowdown is making banks more cautious, while
the Fed's decision to raise interest rates is making borrowing more expensive.)
The money crunch is hitting just as U.S. production is starting to decline.
On Tuesday, the Energy Information Administration
estimated that production is down 600,000 barrels per day since April; the
agency expects production to fall at least that much again by the end of the
year. Without a cash infusion, those declines will only accelerate.
If production is falling, does that mean oil prices are going to go back
up? Maybe. A
popular argument in the oil patch is that the pullback in investment is
sowing the seeds for the next surge in prices; oil companies won't be able to
boost production quickly enough when it's needed, leading to higher prices.
But even if that argument is right, it could take years for such a rebalancing
to occur. And besides, as I've argued before, the conventional wisdom on oil
is
(almost) always wrong.
"... At the beginning of 2014, the world was marveling in surprise as the US returned as a petroleum superpower, a role it had relinquished in the early 1970s. It was pumping so much oil and gas that experts foresaw a new American industrial renaissance, with trillions of dollars in investment and millions of new jobs. wo years later, faces are aghast as the same oil has instead unleashed world-class havoc: Just a month into the new year, the Dow Jones Industrial Average is down 5.5%. Japan's Nikkei has dropped 8%, and the Stoxx Europe 600 is 6.4% lower. ..."
"... that companies would put on hold $380 billion (and counting) in oil and natural gas field investment, and fire 250,000 industry workers around the world last year (including around 90,000 in the US). ..."
"... A lot of Americans bought houses based on confidence in the boom, and now can't make their payments -Texas has seen a 15% rise in foreclosures, and Oklahoma a whopping 36% increase, according to estimates from RealtyTrac. Morningstar, the rating agency, has put a third of some $340 million in mortgage-backed securities tied to North Dakota apartment buildings and other commercial properties on its watch list for possible default. ..."
At the beginning of 2014, the world was marveling in surprise as the
US returned as a petroleum superpower, a role it had relinquished in the early
1970s. It was pumping so much oil and gas that experts foresaw a new American
industrial renaissance, with trillions of dollars in investment and millions
of new jobs. wo years later, faces are aghast as the same oil has instead unleashed
world-class havoc: Just a month into the new year, the Dow Jones Industrial
Average is down 5.5%. Japan's Nikkei has dropped 8%, and the Stoxx Europe 600
is 6.4% lower. The blood on the floor even includes fuel-dependent industries
that logic suggests should be prospering,
such as airlines.
... ... ...
The analysts defend themselves by noting that they got this and that aspect
of oil's trajectory right, which is fair enough. But it seems all missed the
big picture: First, they failed to see that from 2011 to 2014, a surge in shale
oil production was going to become a big factor in global supplies; then, they
did not anticipate that the same oil would create the mayhem before us now.
In fact, in the case of the current turmoil, most forecast the precise opposite-economic
nirvana. Interviews with the main institutions that made the bad calls reveal
no crisis of confidence, and they are busy putting out analyses of the latest
developments.
... ... ...
Consumers have been big winners-gasoline prices have plummeted. That part
has happened. But analysts failed to anticipate that the Saudis would refuse
to cooperate with the shale gale, as it's been dubbed, and in fact would declare
war on it, even though Riyadh did precisely the same thing in the 1980s. The
analysts did not foretell that, if shale oil production rose as they projected,
it could drive down prices not only to the $80-a-barrel average that many forecast,
but much lower-so low, for so long (see chart below), that companies would
put on hold $380 billion (and counting) in oil and natural gas field investment,
and fire 250,000 industry workers around the world last year (including around
90,000 in the US).
... ... ...
Nor did they foresee that many of the companies themselves would be
at risk of bankruptcy (42
already filed as of last year). Of 155 US oil and gas companies studied
by Standard & Poor's, one third are rated B- or less, meaning they are a high
risk of default. These companies' debt is selling at just 56 cents on the dollar,
below even the level during the financial crash. As a measure of this vulnerability,
the 60 leading US independent oil and gas companies have accumulated
$200 billion in debt.
... ... ...
With the collapse in oil prices came the crash of employment in US cities
across Louisiana, North Dakota, and Texas, and in Canadian towns reliant on
the oil sands boom in Alberta. North Dakota has
lost an estimated 13,500 roughnecks and oil engineers, not to mention drivers,
restaurant cooks, barbers, and grocery store cashiers in service businesses
that sprouted up around them. The Canadian province of Alberta has
lost some 20,000 jobs, the most in any industry downturn since the early
1980s.
A lot of Americans bought houses based on confidence in the boom, and
now
can't make their payments-Texas has seen a 15% rise in foreclosures, and
Oklahoma a whopping 36% increase, according to
estimates from RealtyTrac. Morningstar, the rating agency, has
put a third of some $340 million in mortgage-backed securities tied to North
Dakota apartment buildings and other commercial properties on its watch list
for possible default.
But the echo has also been heard far from the US shale
patch. In the once-booming, toughly run petro-state of Azerbaijan, for instance,
people have
been in the streets to protest higher prices and lost jobs; the International
Monetary Fund, worried about Azerbaijan's possible collapse, is speaking with
government officials about a
$3 billion bailout.
Soup kitchens are
surfacing in Moscow, notwithstanding Russian president Vladimir Putin's
assertions that the country is coping fine, and that
things will improve
this year. African producers also have felt the pain. Like stock bourses around
the world, Nigeria's has tanked along with oil prices.
"... For decades, the royal family has used the kingdom's immense oil wealth to lavish benefits on its people, including free education and medical care, generous energy subsidies and well paid (and often undemanding) government jobs. No one paid taxes, and if political rights were not part of the equation, that was fine with most people. ..."
"... But the drop in oil prices to below $30 a barrel from more than $100 a barrel in June 2014 means that the old math no longer works. Low oil prices have knocked a chunk out of the government budget and now pose a threat to the unwritten social contract that has long underpinned life in the kingdom, the Arab world's largest economy and a key American ally. ..."
"... Like Norway, Saudi Arabia's oil money has created a generation of lazy bums who get paid a lot for doing little of importance. Lower oil prices is the only thing that'll force the Saudi population to work harder. ..."
"... Frugal. Having worked both in Norway and the middle east, I think it is unfair to put them in the same pot. There are more productive nations than Norway, but they do work much harder than the nationals of the oil-rich middle east countries. In addition, if one nation ever got the work-life balance right than it is them. ..."
"... I suppose they could try get jobs that displace the expats but it's not like they're gonna go be lumberjacks and farmers. Who the hell is hiring in KSA, Wendy's? ..."
"... As a kid I remember my dad once remarked 'never buy a house in a one resource town'. KSA is a one resource country! 30 million people with no detectable prospects whatsoever. The best any of then can do is get educated and flee. ..."
RIYADH, Saudi Arabia - In pressed white robes and clutching crisp
résumés, young Saudi men packed a massive hall at a university in the
capital city this month to wait in long lines to pitch themselves to
employers.
It was one of three jobs fairs in Riyadh in two weeks, and the high
attendance was fueled in part by fear among the younger generation of
what a future of cheap oil will mean in a country where oil is everything.
For decades, the royal family has used the kingdom's immense
oil wealth to lavish benefits on its people, including free education
and medical care, generous energy subsidies and well paid (and often
undemanding) government jobs. No one paid taxes, and if political rights
were not part of the equation, that was fine with most people.
But the drop in oil prices to below $30 a barrel from more than
$100 a barrel in June 2014 means that the old math no longer works.
Low oil prices have knocked a chunk out of the government budget and
now pose a threat to the unwritten social contract that has long underpinned
life in the kingdom, the Arab world's largest economy and a key American
ally.
Like Norway, Saudi Arabia's oil money has created a generation of lazy
bums who get paid a lot for doing little of importance. Lower oil prices
is the only thing that'll force the Saudi population to work harder.
Frugal. Having worked both in Norway and the middle east, I think it
is unfair to put them in the same pot. There are more productive nations
than Norway, but they do work much harder than the nationals of the oil-rich
middle east countries. In addition, if one nation ever got the work-life
balance right than it is them.
I suppose they could try get jobs that displace the expats but it's
not like they're gonna go be lumberjacks and farmers. Who the hell is hiring
in KSA, Wendy's?
As a kid I remember my dad once remarked 'never buy a house in a
one resource town'. KSA is a one resource country! 30 million people with
no detectable prospects whatsoever. The best any of then can do is get educated
and flee.
"... My comment: Anyway, Russia and Saudi Arabia were not expected to increase oil production this year ..."
"... Yes, but the markets don't know that Russia and Saudi Arabia cannot increase output. With this agreement they are trying to sustain oil prices or even increase them, one of the few things Saudi Arabia and Russia can agree on. ..."
"... As you can see this fake narrative of 1-2 Mb/d of "glut" is still in place. If this is not taking the price down I do not know what is. In this "fog of war" we should not blindly believe Western agencies reporting. It is even unclear what this agreement is about. ..."
"... In any case please understand the Western game to talk down oil prices down until recently included Saudis. Now they are out of this game. ..."
"... The fact output from Saudi Arabia and Russia – the world's two top producers and exporters – is near record highs also makes an agreement tricky since Iran is producing at least 1 million barrels per day below its capacity and pre-sanctions levels. ..."
"... Within the next 3 months all these trends will reverse. Seasonal demand will rise while production declines rise, and Iran's production stabilizes eliminating the new production bidding war. ..."
"... Why the hell do some people always believe that the media or agencies that track and sell data are always lying? ..."
"... A good point. Really, why some people distrust Western MSM and agencies ? Can it be for the same reasons they distrust bankers, IMF and World Bank ? ..."
"... If Congress and government are owned by banks according to senator Durbin ( "And the banks - hard to believe in a time when we're facing a banking crisis that many of the banks created - are still the most powerful lobby on Capitol Hill. And they frankly own the place." ) why do you think government agencies and major MSM are different ? ..."
"... The key point is that whenever possible we should try to compare different sources of data. That's the only way to reveal the real picture as none of us can verify the data provided by agencies and MSM. ..."
"... Plato has Socrates describe a gathering of people who have lived chained to the wall of a cave all of their lives, facing a blank wall. The people watch shadows projected on the wall from things passing in front of a fire behind them… The shadows are as close as the prisoners get to viewing reality. ..."
"... Still we can for major oil-related data to estimate the error margin and the direction of bias. Like I tried to estimate error margin for EIA data. Much depends whether you assume it to be 1% or 10%. If, for example, you think about particular source as 100% reliable that's fine, but 100% rating should be rare in this world and should never be awarded uncritically. Actually your posts for me are close. ..."
"... So non-US media, discussion forums that attract professionals like your blog, posts of professionals who try to present unbiased views like your posts, Jeffrey Brown posts, Art Berman posts (to name a few) and remnants of media still loyal to oil industry (your example of The Oil and Gas Journal ), not to Wall Street traders interests (Bloomberg) are especially important islands of sanity in this distorted, crazy, financial speculation dominated world. ..."
"... Did you ever hear about the "Great Condensate Con" hypothesis? This is an alternative to the "oil glut" hypothesis and I think it is more plausible. ..."
Nations agree to maintain output at Jan. 11 level, Naimi says
Ministers from Qatar, Venezuela also agreed to freeze"
Saudi Arabia and Russia, the world's two largest crude producers,
agreed to freeze output after talks in Qatar.
Freezing output at January levels will be "adequate" and the nation
still wants to meet the demand of its customers, Saudi Oil Minister
Ali Al-Naimi said in Doha after talks with Russian Energy Minster Alexander
Novak. Qatar and Venezuela also agreed to participated in the freeze,
Al-Naimi said.
"A freeze would not create an immediate U-turn but it creates a better
foundation for the price recovery in the second half," Olivier Jakob,
head of oil consultants Petromatrix GmBh, said in a note to clients
before the meeting concluded.
According the International Energy Agency, Saudi Arabia produced
10.2 million barrels a day in January, below the most recent peak of
10.5 million barrels a day set in June 2015. Russia produced nearly
10.9 million barrels a day in the same month, a post-Soviet record,
according to official data.
Qatar will lead monitoring of output freeze agreement, the nation's
Energy Minister Mohammad bin Saleh al-Sada said at a press briefing.
My comment: Anyway, Russia and Saudi Arabia were not expected to
increase oil production this year
Yes, but the markets don't know that Russia and Saudi Arabia cannot
increase output. With this agreement they are trying to sustain oil prices
or even increase them, one of the few things Saudi Arabia and Russia can
agree on.
"Yes, and they are successfully "talking up" oil prices over the
past 2 or 3 weeks"
What do you mean by "talking up"? Funny, but you sound like ZeroHedge.
The current prices are unsustainable and will go up talking or no talking.
Now the effect will be amplified by a short squeeze.
Those presstitutes from Reuters already proudly reported that Azerbaijan
will not join. As if it matters.
Look at the example of the current Western propaganda drivel:
Reuters reported that the meeting had echoes of a 2001 encounter
between OPEC and non-OPEC producers when Saudi Arabia pushed through
a global deal to curb output in which Russia agreed to participate.
But Moscow never properly followed through on its pledge to curb exports.
After 19 months of declines in oil prices, analyst are cautious,
however, of another short-lived bump higher based on jawboning from
producers. This is despite the fact that the impetus to agree on price-boosting
production cuts has been heightened by budgetary pain in both Russia
and Saudi Arabia.
"The noise around potential production cuts is hugely elevated;
if we don't see a cohesive response in a month or so, the speculators
will no doubt start to ramp up short positions again," IG's
chief market strategist, Chris Weston, said in a note.
And Phillips Futures cautioned, "if they allow prices move
up in the immediate term, prices would likely be remaining lower
for longer. This is because producers of oil at higher breakevens
could hedge off their exposure, resulting in strong production moving
forward. Thus, would mean that it would still be in the best interest
for oil producers, especially those who could still get by to continue
and wait it out, no matter how painful it may be."
The Tuesday price spike also masked complications in the oil industry
that have clouded the market.
One major issue is how much oil producers were actually pumping out,
UBS Wealth Management's commodities and FX strategist Wayne Gordon told
CNBC's "Street Signs."
"Some people believe that Saudi Arabia et al have been over-reporting
production and exports just so that when they go to the OPEC meeting
they can say 'Oh yeah, we cut around here and here'," he said.
The world was still swimming in 1-2 million extra barrels of oil
a day, he added.
UBS forecasts oil in the $20-$40-a-barrel range this year.
Also in focus is the fallout and snowball effect of the oil crash,
with banks now faced with decisions on what of their commodities assets
to write down, at a time when lenders are already under pressure from
the Bank of Japan's move into negative interest rates.
"On the Japanese banks side, clearly they've had to take a lot of
impairments…(over) commodities assets in the last five years… [then]
as you go into negative rates, all you're really doing is forcing banks
to take loans or lend money to higher risk propositions," Gordon warned.
As you can see this fake narrative of 1-2 Mb/d of "glut" is still
in place. If this is not taking the price down I do not know what is. In
this "fog of war" we should not blindly believe Western agencies reporting.
It is even unclear what this agreement is about.
In view of this event it looks like the recent visit of Qatar minister
to Moscow was crucial. I expect Iraq joining this agreement immediately.
In any case please understand the Western game to talk down oil prices
down until recently included Saudis. Now they are out of this game.
But Reuters still tries to play Iran card.
The fact output from Saudi Arabia and Russia – the world's two
top producers and exporters – is near record highs also makes an agreement
tricky since Iran is producing at least 1 million barrels per day below
its capacity and pre-sanctions levels.
In this "fog of war" we should not blindly believe Western agencies reporting.
It is even unclear what this agreement is about.
I can understand some political bias in what national oil companies are
reporting, or in some cases what government agencies themselves are reporting.
But I just flat do not believe that agencies like Platts, and other such
sources, are deliberately lying about what they believe a nation's oil production
really is. What reason would they have to lie? Fog of war? Shit, they are
not at war with anyone.
I do not believe that the news agencies, and agencies that track oil
production, around the world are engaged in some kind of giant conspiracy
to deceive the world into believing that either more or less oil is being
produced than it really is.
Why the hell do some people always believe that the media or agencies
that track and sell data are always lying? They don't have a dog in that
fight. Their first priority is to find out and accurately report what is
actually happening. It is in their interest to tell the truth, as near as
they can determine what the truth actually is. Because if they are caught
lying it could severely damage their reputation and deeply hurt their company
profits in the long run.
I don't believe they have an agenda, but follow normal human behavior in
following the crowd. The media coverage seems to be very one-sided at the
moment and at times poorly researched. It appears though as if the game
of the moment is to talk to "oil-price down". Headlines and world-events
that would have caused an immediate oil-spike in the last years is suddenly
seen as good opportunity to short oil. As a person working in the oil industry
this is extremely frustrating at times.
There is no spin or bias in the fact that refined product inventories
are at record highs leading to large discounts to remove winter blend
gasoline stocks.
There is no spin or bias in the fact that inventories are at record
highs. This data is tracked from multiple independent sources AND in
several different ways. There are data analytic companies that have
used satellite data to estimate storage tank usage by means of the shadow
they cast. Even this unique and statistically accurate way of measuring
changes in storage agrees that storage is well above historical highs.
There is no spin or bias in the fact that oversupply and price competition
between major producers has led the UAE to offer India free oil so long
as it stores it.
There is no spin or bias in the fact that oversupply is causing
bidding wars between major producers forcing the Saudis and others to
continuously lower prices to keep contracts.
It is glaringly obvious, from every single angle, that the world is oversupplied
at the moment. Current production declines aren't yet having an impact because
this time of year is a period of seasonally low demand. Add in Iran's need
to win contracts, and you get a temporary bidding war where every exporter
is desperately lowering prices to keep contracts. Once it gets really bad
you get things like the UAE deal with India.
Within the next 3 months all these trends will reverse. Seasonal
demand will rise while production declines rise, and Iran's production stabilizes
eliminating the new production bidding war.
Just because the market will re-balance strongly in 2016 does not mean
that it is currently in the process of re-balancing. Due to the confluence
of Iran competing for contracts, record high storage, and the seasonal lull
in demand canceling out any nascent production declines we're in the most
acute phase of oversupply relative to demand.
It doesn't matter where the market will be in 3 months. Oil produced
today needs to be bought by SOMEONE NOW. This is causing a massive bidding
war because there aren't enough buyers now that Iran entered and needed
to win contracts immediately.
No, it absolutely cannot be the same reason. Banks deal in money, news
agencies deal in news. Banks have a vested interest in secrecy, news
agencies have a vested interest in telling everything they know.
News agencies desperately want a reputation for telling the truth. Banks
desperately want a reputation for making money for their clients, investors
and stockholders. These people don't give a damn if banks lie or not as
long as they make money. Money is the only thing they care about.
Likbez, the fact that you see the same motives behind what news agencies
report and what banks do, tells me you really don't understand either.
If Congress and government are owned by banks according to senator
Durbin ( "And the banks - hard to believe in a time when we're facing a
banking crisis that many of the banks created - are still the most powerful
lobby on Capitol Hill. And they frankly own the place." ) why do you think
government agencies and major MSM are different ?
Oh for God's sake! Platts can create a banking crisis? Petroleum Intelligence
Weekly has a lobby? The Oil and Gas Journal has the same agenda as CitiBank?
The Oil and Gas Journal has the same agenda as CitiBank?
Thank you for attacking my viewpoint. That actually clarified my thinking.
Looks like our viewpoints are not that different. In my view we can (and
should) mentally rate each source information as for objectivity and bias
(for example your blog and posts vs ZeroHedge ).
The sources of information that have bias of opposite sign in comparison
with MSM are especially valuable. Even in MSM comment sections are much
more valuable then the articles published. Right now for me the most valuable
sources of information that help to reveal the bias are sources that question
the mainstream hypothesis of oil glut (and related spin about Saudis desire
to preserve market share), as well as those who were critical of shale oil
boom and are questioning EIA, IEA and friends statistics. Your mileage may
vary.
The key point is that whenever possible we should try to compare
different sources of data. That's the only way to reveal the real picture
as none of us can verify the data provided by agencies and MSM.
This is a classic situation called "Plato cave" "https://en.wikipedia.org/wiki/Allegory_of_the_Cave"
Plato has Socrates describe a gathering of people who have lived
chained to the wall of a cave all of their lives, facing a blank wall.
The people watch shadows projected on the wall from things passing in
front of a fire behind them… The shadows are as close as the prisoners
get to viewing reality.
Still we can for major oil-related data to estimate the error margin
and the direction of bias. Like I tried to estimate error margin for EIA
data. Much depends whether you assume it to be 1% or 10%. If, for example,
you think about particular source as 100% reliable that's fine, but 100%
rating should be rare in this world and should never be awarded uncritically.
Actually your posts for me are close.
So non-US media, discussion forums that attract professionals like
your blog, posts of professionals who try to present unbiased views like
your posts, Jeffrey Brown posts, Art Berman posts (to name a few) and remnants
of media still loyal to oil industry (your example of The Oil and Gas
Journal ), not to Wall Street traders interests (Bloomberg) are especially
important islands of sanity in this distorted, crazy, financial speculation
dominated world.
"sources that question the mainstream hypothesis of oil glut "
No one serious source (IEA, EIA, OPEC, Platts, Woodmac, Rystad, IHS,
energy ministries of exporting countries, oil companies, large oil traders,
etc.) questions the oversupply in the global oil market.
Right now for me the most valuable sources of information that help
to reveal the bias are sources that question the mainstream hypothesis
of oil glut
I think this is hilarious. The sources that you believe are those who
think there is no oil glut at all. The sources that believe the price of
oil has been driven from over $100 a barrel to $30 a barrel by…. some kind
of giant conspiracy.
Yeah right! Rolling in the floor laughing my ass off.
Perhaps you believe Watcher's theory. That it was all because some exporter,
Saudi I think, just kept selling at a slightly lower price until after many
months they had gotten the price down to thirty bucks a barrel.
Did you ever hear about "Great Condensate Con" hypothesis? This is
an alternative to "oil glut" hypothesis and I think it is more plausible.
Well no, it is not. While the Great Condensate Con is very real, it is
not an alternative to the oil glut. The oil glut simply deals with supply
and demand. If the supply of oil is greater than the demand for oil then
the price falls. It is as simple as that.
The increase in production by Iran and Saudi Arabia, that began in March
of 2015, was not condensate, it was crude oil. Much of the increase before
that date was condensate. But the decline in demand had nothing to do with
the Great Condensate Con. It was a decline in demand due to very high prices
and a definite decline in the world economy.
Bottom line, there is a definite oversupply of crude oil in the world
today. That is the reason we are seeing oil in the range of $30 a barrel,
and not any kind of conspiracy by anyone.
Hey! I am a peak oil advocate. I would love to say that there is a shortage
of oil in the world today as a result of crude oil peaking. But the very
obvious facts do not allow me to make such a claim. There is a glut of
oil today. That cannot be denied.
For Christ's sake, don't try to spin reality into some kind of conspiracy.
Accept reality as it is and go from there.
I have said all along that peak oil will be a time when more oil is produced
than any time in history of the world or ever will be produced in the future
of the world. And such a time will be far more likely to be perceived
as a time of an oil glut than as a time of an oil scarcity.
As usual I agree with Ron in terms of broad outlines. News agencies and
organizations as a whole or a group are more interested in the truth than
in spinning the truth, or ignoring it.
But there is no doubt at all in my mind that a lot of news organizations
spin the truth for some particular reason, emphasizing the news in such
a way as to support an agenda OTHER than getting the truth out.
WHY?
Because in this day and time, the OWNERSHIP of news organizations is
in the hands of people who have HUGE stakes in spinning the news to suit
themselves, in a lot of cases.
Business interests have bought control of news organizations as much
for the power gained thereby, as for legitimate investment purposes.
AND the organizations themselves, after a while, tend to become hotbeds
of partisan employment.
It's not that the truth doesn't matter, in terms of getting caught out
wholly in the wrong, but rather that the truth is judged expendable in terms
of certain events and issues, or at least , just something to be IGNORED.
I have no problem AT ALL with FOX NEWS when it comes to reporting earthquakes,
airplane crashes, and day to day local news. But I would be laughed out
of this forum if I said that Fox does a great job of reporting on environmental
issues. Fox does not, of course.
OTOH, FOX has actually started reporting in an even handed manner, at
least some of the time, about electrified personal automobiles.
I listen to NPR almost exclusively, whenever I turn on a radio, or else
a folk and bluegrass music station, if NPR is playing organ music.
But so far as I am personally concerned, I cannot ever REMEMBER hearing
anybody on NPR on a regular basis who sounds like a R partisan.
OTOH, I am confident I can identify the political orientation of everybody
talking on NPR, with ninety nine percent accuracy, just by reading an hour
or less of randomly selected black and white transcript of what they have
to say, word for word.
The OVERWHELMING majority are conventional stereotypical liberals, with
a few token conservative voices popping up once in a long while.
Tone of voice and choice of words can convey the message , quite as effectively
as the actual words spoken.
Note that I continue to listen to NPR.
I might listen to some other outfits, but there isn't any other programming
WORTH listening to. There is no comparable right wing radio. So called talk
radio is all about the lowest common denominator, and that denominator is
ignorance.
So if you want to hear anything that is based on knowledge and reason,
coming from the conservative pov, you are reduced to a few magazines, for
all intents and purposes.
Mac, of course news agencies like Fox News spin political news. Neither
they, nor any other news agencies would need to lie about Azerbaijan's oil
production numbers. Or China's oil production numbers. Or… well, I hope
you understand that.
To accuse Fox, or Platts, or whomever, of lying about
some Asian countries oil production, just smacks of stupid conspiracy theories.
Here we talk about peak oil and measure every uptick and downtick in production. On the other
hand oil is so abundant that they are now giving it away for free. India will get free oil from
UAE in return for offering storage.
Don't forget that of every four barrels of extra oil that we need over the next 25 years, only one
will be used to meet demand growth. Three others will just compensate for the decline of existing fields.
The number of vehicles in the world tin 2012 was over a billion (700 M cars, 300 m trucks and buses).
Notable quotes:
"... The question what will happen now with the oil prices in a short run still remains open. Iran has offered Europe a good discount to compete with Saudi Arabia depressing prices. According to National Iranian oil company , the discount on Iranian oil grades Iran Heavy (part of the OPEC basket) is $6.55 dollar while Saudi Arabia discount is $4.85 dollars per barrel. ..."
"... In this situation, in my opinion, the statement about the freezing of the production is from Saudi Arabia was just a tactical move, which hints on possible production cuts by OPEC later. A bluff if you wish. ..."
"... However, from now on the most natural trend for oil prices is up. And not due to any agreements, but due to depletion when production in most countries naturally goes down because of low capex. This is a more fundamental factor, but the agreement allow to win some time before this fundamental factor fully comes into play. ..."
"... The fact is that the oil the world economy still consumes more and more oil each year and now this trend was accelerated by low prices. As the result problems with meeting demand might arise as early ad the end of 2016 and inventories will start being depleted. ..."
"... After that we will enter a new uptrend , a new phase of higher prices of energy. But once scared twice shy and it is unlikely that oil prices will go up quickly. But I expect 2016 average in the range of $40-45 per barrel. This price range, I believe, will suit most conventional oil companies in the world. And especially Russian, which due to the devaluation of the national currency is largely compensated for falling prices of the oil on world markets... ..."
"... The key value of the Doha statement is that it implies that the restriction of volumes of production is possible, changing market expectation. Thats it. ..."
"... No one still can predict how much more time will be needed for coming to agreement to reduce oil production, and whether agreement will be reached at all, but it does change market expectations immediately. ..."
From my point of view, it is a signal that Saudi game in the oil dumping is close to the end,
from now on Riyadh is interested in raising energy prices. Another thing, again, that the Saudis
are ready to freeze and to reduce production only if Iran and Russian freeze or proportionately
reduce their production too.
"SP": How will other members of OPEN react on Doha announcement?
Other members will most probably support this decision. Already, a number of members of
OPEC with higher production costs, were in favor of restricting their production.
This is first of all Venezuela, partially United Arab Emirates, Bahrain, and Oman. And we must
understand that if for Saudi Arabia and Russia low oil prices created problems with balancing the
budgets, for Venezuela this is a real question of survival.
This alignment of interests have led to the situation with this joint statement and subsequent
reaction of the market which is currently unfolding before our eyes. One way to move another
step forward might be an emergency OPEC meeting, which could take place in early March, and on which
the proposal to freeze production by cartel members can be officially adopted.
"SP": will oil price go up from now on?
The market is essentially ready for the return of higher oil prices, therefore, it might respond
positively to this news. However, the oil market is very speculative, and responding primarily to
the expectations - the real figures of production do not play a primary role in forming the spot
price for oil.
And yet, to seriously move oil prices up, it is probably necessary to reduce the world production
by around 1.5 million barrels a day. No matter by what measures.
We also think that oil speculators might use this situation to switch the trend and try to earn
money on uptrend instead of downtrend. This is the opinion of the head of the analytical Department
of the Russian energy Security Fund Alexander Pasechnik. Even minimal 'warming" of oil market is
beneficial to the producers of "black gold", including Russia which now waist their national
treasure.
He suggested that the agreement in Doha was possible because it was impossible to wait longer
for some measures to stop speculative attacks on oil price. The possibility of creating an
artificial shortage of supply in the oil market were actively discussed for the last few months on
different levels, but no decision were made.
The question what will happen now with the oil prices "in a short run" still remains open.
Iran has offered Europe a good discount to compete with Saudi Arabia depressing prices. According
to "National Iranian oil company", the discount on Iranian oil grades Iran Heavy (part of the OPEC
basket) is $6.55 dollar while Saudi Arabia discount is $4.85 dollars per barrel.
In this situation, in my opinion, the statement about the freezing of the production is from
Saudi Arabia was just a tactical move, which hints on possible production cuts by OPEC later. A bluff
if you wish.
"SP": What are the risks for Russia, due to freeze of production at the current level?
In my opinion, there is no any significant risks. In any case we will be forced to reduce production
due to the increase of the fiscal burden on the oil industry, and the consequent reduction of investments
in the sector. Let me remind you that in 2016, the oil companies will pay 200 billion rubles of additional
taxes, and government intends to stick to this tax regime in 2017 and possibly in 2018. This means
that the coming drop of production in the Russian Federation is baked into the cake. Agreement with
Saudis for freeze production on January 2016 level does not change this reality.
On the other hand, we should not expect much from the agreements in Doha. Even if the position
the Quartet will be supported by all other members of OPEC, it does not guarantee that such
a "gentleman's agreement" will be respected by all members of the cartel.
However, from now on the most natural trend for oil prices is up. And not due to any agreements,
but due to depletion when production in most countries "naturally" goes down because of low
capex. This is a more fundamental factor, but the agreement allow to win some time before this
fundamental factor fully comes into play.
The fact is that the oil the world economy still consumes more and more oil each year and
now this trend was accelerated by low prices. As the result problems with meeting demand might arise
as early ad the end of 2016 and inventories will start being depleted.
After that we will enter a new "uptrend", a new phase of higher prices of energy. But
once scared twice shy and it is unlikely that oil prices will go up quickly. But I expect 2016 average
in the range of $40-45 per barrel. This price range, I believe, will suit most conventional oil companies
in the world. And especially Russian, which due to the devaluation of the national currency is largely
compensated for falling prices of the oil on world markets...
"The key value of the Doha statement is that it implies that the restriction of volumes
of production is possible, changing market expectation. That's it." This is how Director
of the Energy Institute Sergey Pravosudov thinks about the announcement. The key purpose of such
statements is to spook speculators pushing the oil price down, and not to push oil prices up.
No one still can predict how much more time will be needed for coming to agreement to reduce
oil production, and whether agreement will be reached at all, but it does change market expectations
immediately.
A record-breaking 5.1-magnitude earthquake struck Oklahoma early Saturday morning
… … …
"We have no reports of damage as of yet, but we did get a good rock n' roll," Cheryl Landis
with the Major County Sheriff's Department tells CNN.
The earthquake occurred at 12:07 a.m. (1:07 a.m. Friday ET) at a depth of 1 kilometer, the
USGS said.
A 3.9 magnitude earthquake around11:17 a.m., a 2.5 around 11:40 a.m. and a 3.5 around 12:21
p.m. were also recorded in the same area, according to KFOR.
This is the strongest quake to rattle the state since 2011, the Survey says.
… … …
The USGS says waste water injected into deep geologic formations is a likely contributing
factor to the seismic activity increase. This method of retrieving oil and natural gas is known
as hydraulic fracturing, or fracking.
Fracking water in OK is pristine compared to the brine that comes up with the oil production.
Further, most new wells in OK will produce more brine wastewater in their first 30 days of oil
production [not counting the frac water] than the total amount of frac water retrieved.
A while back (it had seemed
like years to me but it was actually March 23, 2012--is it just me or did this last presidential
election cycle actually stretch time?) Joules Burn posted
From Qurayyah to Khurais: Turning
Water Into Oil which contains links to part one (9:47) and two (13:06) of From Qurayyah
to Khurais
the following are direct YouTube links to the same
My end of the wire bottom of the line DSL connection made loading those clips downright painful
but it was worth it. It is a very well done animation and really fleshes out the process your
linked article describes.
"... Lets suppose that one accepts the premise that obtaining accurate figures for total world crude production is going to be problematic at best, and that we are dealing with ballpark figures, to use that term lightly. And this premise is based on the idea that statistics on oil production are undoubtedly politically motivated, and that even if transparency was as good as former American standards, we would still be dealing with rough estimates. ..."
"... Alright, if one accepts this premise, then one must conclude that dealing now with world total liquids will be even more problematic, especially in an era of permanent economic contraction and what will inevitably be defunding of areas thought to be secondary or academic. ..."
"... we should admit is that only country by country production and import/export stats have any meaning now, and even those may be largely tampered with. ..."
Let's suppose that one accepts the premise that obtaining accurate figures for total world crude
production is going to be problematic at best, and that we are dealing with ballpark figures,
to use that term lightly. And this premise is based on the idea that statistics on oil production
are undoubtedly politically motivated, and that even if transparency was as good as former American
standards, we would still be dealing with rough estimates.
Alright, if one accepts this premise,
then one must conclude that dealing now with "world total liquids" will be even more problematic,
especially in an era of permanent economic contraction and what will inevitably be defunding of
areas thought to be secondary or academic.
I suspect this is largely true now. I do enjoy these posts, but what we should admit is that
only country by country production and import/export stats have any meaning now, and even those
may be largely tampered with.
It is possible and in fact likely that world production could soar while entire countries find
themselves out of the market, or that world production could plummet even while a select few are
always able to fill their cars and jets.
This was always the danger of peak oil, wasn't it? That the forces it would unleash would in
fact undermine any attempts to properly categorize, understand, and deal with it.
"These companies have kicked
the can down the road as long as they can and now they're in danger of kicking the bucket," said
William Snyder, head of corporate restructuring at Deloitte, in an interview. "It's all about
liquidity."
"... Qatar's energy minister, Mohammad bin Saleh al-Sada, said the agreement would help stabilize the market. Saudi oil minister Ali Al-Naimi said the freeze was adequate for the market, adding the meeting was successful. He added he hoped producers inside and outside OPEC would adopt the proposal. ..."
"... The producers will meet with Iran and Iraq on Wednesday and may find significant reticence on the part of Iran to hold output steady. After years of sanctions, Iran plans to ramp up production in a bid to regain market share. ..."
Crude futures pared gains Tuesday following news that Qatar, Saudi Arabia, Russia and
Venezuela would lead an effort to freeze output at January levels, dashing hopes of a cut in
production.
The large producers met in Doha, Qatar, to discuss measures to tackle a supply glut that's
sent prices to 13-year-lows.
Qatar's energy minister, Mohammad bin Saleh al-Sada, said the agreement would help stabilize
the market. Saudi oil minister Ali Al-Naimi said the freeze was "adequate" for the market, adding
the meeting was successful. He added he hoped producers inside and outside OPEC would adopt the
proposal.
The producers will meet with Iran and Iraq on Wednesday and may find significant reticence on
the part of Iran to hold output steady. After years of sanctions, Iran plans to ramp up
production in a bid to regain market share.
... ... ...
Qatar is the current holder of the rotating OPEC presidency.
Earlier, news of the meeting news sparked hopes of an eventual deal on supply cuts, after
Saudi Arabia-led oil cartel OPEC previously persistently refused to lower its 30 million
barrel-a-day production ceiling in a strategy to squeeze out higher cost energy producers,
including U.S. shale companies.
Iran: Tehran is continuing its battle for market share with
the Saudis by cutting its price for heavy crude going to Mediterranean customers
by more than a recent Saudi cut. The selling price for Iranian Heavy crude is
now set at $6.40 below the Brent Weighted Average. For Northwest Europe and
South Africa the price is now $6.30 below the Brent Average as compared to $6.00
for Arab crude. This may only be the beginning of price wars between Iran and
the Gulf Arabs as Tehran battles to regain the market share it held before the
sanctions were imposed.
The postponement of a conference in London at which Tehran was to announce
its terms for foreign oil companies wanting to invest in developing Iranian
oil shows that there is considerable infighting within the Iranian ruling class.
Although the Iranians tried to blame the postponement on troubles getting visas
for all the Iranians who wanted to attend, the delay likely was forced by hardline
opponents of the Rouhani government who say the proposed agreements violate
Iran's constitution which decrees that none of Iran's oil reserves can be owned
for foreigners. Iran is seeking some $200 billion in foreign investment to increase
its production to 4-5 million b/d. Given the low oil prices, Iran is unlikely
to be capable of accumulating the capital to make major increases in its oil
production. Some believe the domestic political situation will become worse
after the elections when the hardliners make an effort to gain take more control
over the oil industry away from moderate President Rouhani and his government.
The lifting of the sanctions my not turn out to be as much of a boom for
Iran's economy as many Iranians had hoped. It is doubtful that in these tough
times for the oil industry many international oil companies will be interested
in deals in which they supply the money and take the risks while allowing the
Iranians all the control and most of the benefits from the projects.
In the meantime, Iran is demanding payment for its oil in euros rather than
dollars in order to stick it to Washington. The problems of insuring cargoes
of Iranian oil, however, seem to be easing. Washington will now allow non-US
persons to insure crude and oil products coming from or going to Iran.
"... "The global oil market is going through a correction and we have reached the bottom," he was quoted as saying by the official Kuwait news agency, who added that Rashidi had made his comments at a company event in London. ..."
"... Asked whether oil prices would ever reach the $100 per barrel level again, Rashidi said, "We can reach prices ranging between $60 and $80 but we need three years." ..."
Kuwait Petroleum International (KPI) said on Saturday oil prices could reach a range of $50 to
$60 a barrel by mid-2017, the official state news agency reported.
The agency quoted the company's top executive Bakheet al-Rashidi as saying prices could reach
the range of $60 to $80 a barrel in three years' time.
"The global oil market is going through a correction and we have reached the bottom," he was
quoted as saying by the official Kuwait news agency, who added that Rashidi had made his comments
at a company event in London.
Rashidi attributed the drop in oil prices to excess supply in the market and slow demand from
Asia, particularly China.
Asked whether oil prices would ever reach the $100 per barrel level again, Rashidi said, "We
can reach prices ranging between $60 and $80 but we need three years."
On Vietnam's Nghi Son refinery, Rashidi said it would start operations by the end of 2016.
"... The Norwegian statistics bureau says the economy shrank 1.2 percent in the last quarter of 2015, dragged down by poor performance in oil-based industries, while full-year growth at 1 percent was the lowest since 2009. ..."
"... Statistics Norway says the economy grew 0.1 percent in the fourth quarter, up from a flat performance in the previous quarter. The oil, gas and shipping sector contracted 5.6 percent compared with growth of 7.8 percent in the previous quarter. ..."
"... The agency said Tuesday that overall GDP last year was 1.6 percent, down from 2.2 percent in 2014. ..."
The Norwegian statistics bureau says the economy shrank
1.2 percent in the last quarter of 2015, dragged down by poor performance in
oil-based industries, while full-year growth at 1 percent was the lowest since
2009.
Statistics
Norway
says the economy grew 0.1 percent in the fourth quarter, up from a flat
performance in the previous quarter. The oil, gas and shipping sector contracted
5.6 percent compared with growth of 7.8 percent in the previous quarter.
Like other oil and gas producers, Norway was hit by low
crude prices, causing thousands of job losses and industry closures. Norway is the
largest fossil fuels producer in western Europe.
The agency said Tuesday that overall GDP last year was
1.6 percent, down from 2.2 percent in 2014.
This is the sad part Old Farmer Mac. You will not even consider going forward to horses and mules.
I spend a lot of time in Ethiopia, Africa. Humanity and coffee originated here. A large part of
their agriculture is still done with oxen plowing the fields. A public taxi in a rural town can
still be horse and cart. Donkeys carry cement to many building sites side by side with modern
trucks. Those animals are very frugal in their food and water consumption.
And then there are the do-gooders. Those damned NGO's (charities) that see it as their first mission
to buy Toyota Landcruisers to ensure their pompous leaders can be carried in perfect comfort from
one five star conference to another to discuss some project in the way waste societies do business.
These people are completely blind to the fact that they are destroying what are in all likelihood
man's oldest civilization. Ethiopians are not the ones who build the biggest castles or created
the most exquisite art. But they have been around the longest. The skeleton of Lucy is dated at
over 3 Million years . That means they know a thing or two about survival.
So you might be forgiven for assuming that people come here to LEARN and see how we could live
sustainably. Instead, they introduce "development". That is of course another term for burning
fossil fuels.
Whatever "un-developed" pockets of humanity manage to survive will be among the leaders when oil
man finally goes extinct.
Nobody can tell if Australopithecus afarensis was an ancestor species to Homo or not, but
in any case we share common ancestors with all Ethiopians since at least the emergence of anatomically
modern humans at around "only" 50,000 years ago. We have evolved the same, we have survived the
same, our ancestors have probably traveled more and picked some gene varieties from Neanderthals
that Ethiopians don't have, while they retain a bigger share of old sapiens varieties that didn't
make it out of Africa.
I'm estimating that global crude oil production* was about 69 million bpd in 2005 and 68 million
bpd in 2014. I would assume around 69 million bpd for 2015. Global total liquids production was
85 million bpd in 2005 and apparently about 96 million bpd in 2015.
So, I estimate that actual global crude oil production, as a percentage of total liquids, fell
from about 81% in 2005 to about 72% in 2015.
In regard to the US, I estimate that actual crude oil as a percentage of total liquids fell
from about 57% in 2005 (4.7/8.3) to about 49% in 2015 (7.3/14.8).
If the collective or average energy content of "other liquids" IS only seventy percent of the
energy content per barrel of conventional crude oil, then ten million barrels of conventional
are worth about twelve and a half barrels of "other liquids".
If it turns out that conventional crude HAS hit it's ultimate upper limit, as indicated by
the plateau in production of it, for the last decade, even with the price skyrocketing, then each
MILLION new barrels of "other liquids" are will be worth be worth only seven tenths of a million
barrels of actual OIL.
Of course the impact will not be quite so bad , in terms of the energy of the total liquid
fuel supply, because the total supply already consists of about twenty eight percent "other "
according to JBB's estimate.
Something tells me net energy per capita per barrel of liquid fuel is in the rear view mirror
and receding from view at a steady clip, given the growth of population.
That might not matter as much, except at a moral and humanitarian level, as we think however,
because most of the poor people of the world are never going to own and drive automobiles.
But it is reasonable to assume that even the poorest parts of the world will see substantial
percentage point increases in oil consumption, so long as oil can be bought at any price, because
the less oil you use, the greater the utility of each barrel.
A gallon burnt in a heavy truck delivering food from country side to city is worth twenty or
thirty or even forty or fifty bucks, once the truck and the road are in existence, in comparison
to the alternative of hauling it with draft animals or human muscle power.
It could turn out that the world wide economy will go downhill FASTER than the available supply
of oil, even as high cost producers drop out. If NO new oil is brought into production, the supply
will decline at somewhere between four and eight percent annually, according to all the estimates
I have seen.
Personally I find it hard to imagine the world wide economy WILL go downhill FASTER than oil
supply,barring global level Black Swan events, so I am convinced the price of oil will go up.
This is not to say the economy can't go downhill faster than oil production in the SHORT
term . It might, and so the price of oil might stay low for some time yet, until depletion
takes it's toll.
Oil producers are stubborn bastards, and will give up no faster than they go broke. Some of
them can generate some cash for decades yet to come, even at thirty or forty bucks per barrel.
If they go broke,due to not being able to pay off loans, whoever buys their wells will buy them
cheap enough to continue to produce them.
I will personally gladly pay twenty bucks per gallon, so long as I can get diesel fuel, before
I even CONSIDER going back to horses and mules.
Ya feed a car or truck PER MILE you drive it, and a farm tractor PER HOUR you run it. Ya feed
draft animals three hundred sixty five days per year. NO CONTEST, unless you CANNOT buy diesel
and gasoline at any price.
Some questions about accuracy of EIA statistics. My impression is that in certain areas they has
been playing fast and loose. I might be wrong. Among areas of some concern:
1. Is not the net effect of usage of volume instead of weight result in approximately 6% inflation
of gross totals (which include all types f fuels) and thus EIA is distorting the "peak oil" situation?
("Great Condensate Con")
2. Is not the same concern true about accounting of gasoline in those EIA totals which include
both oil and refined products ?
3. Is not (1) and (2) make EIA "mixed totals" statistics completely bogus (inflating the data
by up to 12%) ?
4. Is EIA accounting of refiner gains just an artifact of usage of volume as the metric?
a. The whole concept might be viewed as a mirage created by usage of volume as a metric (the first
law of thermodynamics).
b. How refiner gains on imported oil should be accounted? Should they be classified as domestic
production like EIA does?
5. Is EIA usage of volume acceptable in case of ethanol production? A unit of volume of ethanol
contains approximately 55% of energy in BTUs in comparison with WTI. Huge difference: 76,000 Btu/gal
vs. 138,000 BTU/gal. That affects mileage and all other usage metrics.
6. How dilutants for Canadian tar sands imported to Canada from the USA are accounted by EIA.
They are first exported to Canada and then imported as a part of Canadian oil import? So part
of the volume of Canada production was already "produced" in the USA.
7. The same question about Venezuela heavy crude.
IMHO Ron's graphs would be definitely twice more convincing if they were constructed in weight
metric instead of volume.
Well, volume is all that I have so my charts are in volume. But I am not really concerned with
NGLs, process gain or biofuels. In fact I would never post "total liquids" if I had crude, or
C+C for that data.
But all that being said, C+C is a pretty good indicator, even though it is not perfect. It
will tell us when the peak occurs, or more correctly, it will tell us when the peak occurred in
the past.
On the issue of EIA's predictions accuracy, I updated this graph from Mason Inman and
added actual oil US production.
What this graph shows is a typical very conservative estimate system. This means that on the
way up, they greatly underestimate production and on the way down, they are going to greatly overestimate
production.
This clearly shows how credible their predictions are. Although the graph is only for the US,
clearly they are going to be equally conservative (and thus equally wrong) about world oil production.
The long-term projections of U.S. LTO production are from various issues of the EIA
Annual Energy Outlook. They indeed were very conservative, even though none of them (even the
AEO-2015) did not assume such a big drop in oil prices.
As regards the actual production data (the black line), it is from the Drilling Productivity
Report and include almost 1 mb/d of conventional output, primarily from the Permian basin.
U.S. LTO production had never reached 5.5 mb/d, as the black line shows. According to the most
recent EIA presentation, the local peak (In March 2015) was around 4.6 mb/d
But the issue continues being that EIA underestimated
production so much that it had to raise its predictions by about 100% each year.
Look at the prediction for 2020:
AEO 2012: 1.3 mbpd
AEO 2013: 2.8 mbpd
AEO 2014: 4.7 mbpd
And all this without any significant change in oil price.
So if the question is, as Ron is posting, how much value have EIA predictions? The answer clearly
is none. EIA predictions are useless. Evidence indicates that they are going to overestimate production
by a large amount for as long as production goes down.
"... The big deals against oil prices are, now, the drop in (the increase) in future demand from 1.6 to 1.2%, per IEA, and the massive amount of oil that Iran is getting to lay out with unknown capital input. Supposedly glutting the market with 1.5 million more barrels with magic, I presume. However, I figure it, the drop in demand seems to indicate only about a 300k to 350k difference. ..."
"... I read where Chinas production is expected to drop from 100k to 200k in 2016, base upon the current prices and capex. A recent post by the author indicates that up to 1.5 million barrels may be lost from in field drilling of offshore wells in 2016. All of South America, Africa, and Asia, including Russia, expect drops in 2016, and 2016 is just the tip of the iceberg. ..."
"... Where are all of these figures in the garbage the EIA and IEA put out? Far as I can tell, the magical numbers put out for Iran, roughly match the drop in infield drilling offshore. ..."
"... While what is called a prediction of non-OPEC production seems to meet the definition of the word prediction it seems that the OPEC production prediction is more of what Id call an assumption. The methodology used to predict future OPEC production is basically as follows: world demand minus non-OPEC production equals OPEC production. Thats some pretty weak tea! ..."
"... It seems to me that there is a bunch of strange and interesting things all going on at once here, several of which are as follows; global peak oil production occurring as we speak is significantly probable, the price of oil is low, Cushings is full of condensate but the market calls it crude and it drops the price of crude, imports of crude to USA have recently increased despite the glut, Saudi is likely producing flat out yet production is down month over month for 6 of the last 7 months, upstream investment is down 2 years in a row, demand is up, production is going to decrease. I dont know exactly how its gonna play out but whatever it is the word train wreck is likely an apt description. ..."
"... It seems to me that there is a bunch of strange and interesting things all going on at once here, several of which are as follows; global peak oil production occurring as we speak is significantly probable, the price of oil is low, Cushings is full of condensate but the market calls it crude and it drops the price of crude, imports of crude to USA have recently increased despite the glut, Saudi is likely producing flat out yet production is down month over month for 6 of the last 7 months, upstream investment is down 2 years in a row, demand is up, production is going to decrease. I dont know exactly how its gonna play out but whatever it is the word train wreck is likely an apt description. ..."
"... As well this total liquids thing bugs me. It takes energy to produce biofuels and refinery gains. That seems like double counting to me. Like counting the global beef production once when its on the 1/4 of beef and once again when its cut with pork fat and called Ukrainian Sausage, to use Mr JJ Browns beef analogy. ..."
"... Try listening to what is said by KSA. We are not going to produce oil out of the ground for which we have no orders. ..."
"... Tanks arent filling. No one is placing orders for oil they would put in a tank. That makes no sense. And note, btw, that filling a tank is demand itself and thus would not justify a price decline if youre a supply/demand disciple. ..."
"... The price is low because sellers are willing to sell for that lower price. Period. Even if buyers would pay more, the seller insists on less. ..."
"... In my view the past surge in shale production was based on the favorable conditions of the bond market (search for yield). As long as the bond market has been liquid, production could surge. However, as the recent collapse of the bond market starts affecting production (see below chart) we could see another black swan event on the downside of production. ..."
"... The lesson for investors is to recognize and understand the thinking behind Wall Streets motivation and adjust the investment strategy accordingly. As the bond collapse is far from over, we have not yet seen the bottom of the production decline. The bond market is the major driver of oil and gas production. Any forecast which ignores changes of capital markets is very likely irrelevant. ..."
"... With LTO the production was accelerating y-o-y at a high rate, more in percentage terms than has been seen in fields before, at least since the very early days of the industry. The cut has been from that high rate to a slow decline. If the LTO production had been steady or a growth rate that was more representative of previous new fields then the decline would have been pretty steep by now. That and the different impact, and decoupled timing, of drilling and completions compared to conventional fields is what through off a lot of the predictions in my opinion. ..."
"... Note that the EIA STEO predicts Brent at $46/b in the fourth quarter of 2016. This is the reason that I believe the EIAs oil supply forecast is too high (assuming their price forecast is correct). I would expect at least a 1 Mb/d drop in 2016 average annual World C+C output compared to 2015 average output levels if the EIAs most recent oil price forecast for Brent crude is correct. ..."
"... I didnt say that $45/b is high enough to keep output flat . I said that $40-45/b is enough to cover operating costs and maintenance capex in a vast majority of the worlds currently producing conventional fields (as well as oil sands operations). ..."
The big deals against oil prices are, now, the drop in (the increase) in future demand from
1.6 to 1.2%, per IEA, and the massive amount of oil that Iran is getting to lay out with unknown
capital input. Supposedly glutting the market with 1.5 million more barrels with magic, I presume.
However, I figure it, the drop in demand seems to indicate only about a 300k to 350k difference.
Ah, the magic of OPEC will prevail, then. Even though to fully ramp up more, Saudi has to drill
in the offshore area, which I am sure is NOT $10 barrel cost of production. Iraq has to end their
internal strife to gain some traction. Venezuela is sucking wind, badly. Ecuador, while not the
massive producer of other OPEC members, currently has only one well drilling from 50 something
rigs. It is hard to keep up with the news from every country, and it is clear that neither EIA
nor IEA are really putting much effort into real data accumulation. I think OPEC is strapped for
production for the next two years, with the exception of the magical production from Iran.
On the other hand, I read Canada has some smaller oil sands shut in, while larger ones are
scheduling to cut back, or have extended periods of overhaul on production equipment. As rigs
for conventional oil have dropped significantly, I fail to see were Canada will not have a decrease
in production in 2016. Over a year ago, I said the shale production could drop by over one million,
but didn't anticipate the increase before the drop. Still from the high in March of last year,
it is still projected to drop by 1.2 million by 2017 by EIA. I still thing they are low in their
estimate of the drop, but not as much as they used to be.
I read where China's production is expected to drop from 100k to 200k in 2016, base upon
the current prices and capex. A recent post by the author indicates that up to 1.5 million barrels
may be lost from in field drilling of offshore wells in 2016. All of South America, Africa, and
Asia, including Russia, expect drops in 2016, and 2016 is just the tip of the iceberg.
Where are all of these figures in the garbage the EIA and IEA put out? Far as I can tell,
the magical numbers put out for Iran, roughly match the drop in infield drilling offshore.
But then I am not an expert, because I am not paid by a highly efficient and omniscient government
entity.
While what is called a prediction of non-OPEC production seems to meet the definition of the
word 'prediction' it seems that the OPEC production prediction is more of what I'd call an assumption.
The methodology used to predict future OPEC production is basically as follows: world demand minus
non-OPEC production equals OPEC production. That's some pretty weak tea!
It seems to me that there is a bunch of strange and interesting things all going on at
once here, several of which are as follows; global peak oil production occurring as we speak is
significantly probable, the price of oil is low, Cushings is full of condensate but the market
calls it crude and it drops the price of crude, imports of crude to USA have recently increased
despite 'the glut', Saudi is likely producing flat out yet production is down month over month
for 6 of the last 7 months, upstream investment is down 2 years in a row, demand is up, production
is going to decrease. I don't know exactly how it's gonna play out but whatever it is the word
'train wreck' is likely an apt description.
As well this 'total liquids' thing bugs me. It takes energy to produce biofuels and refinery
gains. That seems like double counting to me. Like counting the global beef production once when
it's on the 1/4 of beef and once again when it's cut with pork fat and called Ukrainian Sausage,
to use Mr JJ Browns beef analogy.
I figure in a few short years it'll be pretty clear where all this is going and it'll be a
whole new paradigm aka Hobbesian scramble.
Intro sentence should have read:
"While what is called a prediction of non-OPEC production seems to meet the definition of the
word 'prediction' it seems that the OPEC production prediction is more of what I'd call an assumption.
"
While what is called a prediction of non-OPEC production seems to meet the definition of the word
'prediction' it seems that the non-OPEC production prediction is more of what I'd call an assumption.
The methodology used to predict future OPEC production is basically as follows: world demand minus
non-OPEC production equals OPEC production. That's some pretty weak tea!
It seems to me that there is a bunch of strange and interesting things all going on at
once here, several of which are as follows; global peak oil production occurring as we speak is
significantly probable, the price of oil is low, Cushings is full of condensate but the market
calls it crude and it drops the price of crude, imports of crude to USA have recently increased
despite 'the glut', Saudi is likely producing flat out yet production is down month over month
for 6 of the last 7 months, upstream investment is down 2 years in a row, demand is up, production
is going to decrease. I don't know exactly how it's gonna play out but whatever it is the word
'train wreck' is likely an apt description.
As well this 'total liquids' thing bugs me. It takes energy to produce biofuels and refinery
gains. That seems like double counting to me. Like counting the global beef production once when
it's on the 1/4 of beef and once again when it's cut with pork fat and called Ukrainian Sausage,
to use Mr JJ Browns beef analogy.
I figure in a few short years it'll be pretty clear where all this is going and it'll
be a whole new paradigm aka Hobbesian scramble.
With tank farms, strategic storage, rows of rail tankers and flotillas of super tankers filling
up all over the planet, producers will now have to match production to demand much more closely,
else they will have to 'spill their seed upon the ground'. And there is not much money to be made
doing that.
Some producers with no where to deliver their oil to must be in very difficult positions; going
from normal production to zero in a day. From cashflow positive yesterday to being the proud owner
of a pile of useless junk and pipes wth zero income today.
Yes Watcher. The interesting moment arriving herewith is that we will now discover actual global
consumption without the smoke n mirrors of production filling tanks somewhere.
I would imagine that the impacts will be neither selective or nice. Some good paying fields
may have to be shut in if the tanks at the end of the pipe are full. Or it could be the final
straw that pricks the light tight oil bubble. We shall see.
Tanks aren't filling. No one is placing orders for oil they would put in a tank. That makes
no sense. And note, btw, that filling a tank is demand itself and thus would not justify a price
decline if you're a supply/demand disciple.
The price is low because sellers are willing to sell for that lower price. Period. Even
if buyers would pay more, the seller insists on less.
Wrap your mind around that and you understand pursuit of victory.
'… many storage operators [at Cushing] may be turning prospective customers away. Not because
they don't have available capacity but because they don't have enough heavier crude to make WTI
lookalike blends with incoming light shale grades.'
Do those full-to-the-brim mega-tankers slow-steaming in circles in the Sargasso Sea and swinging
at anchor off Singapore and Malaysia with no where to go waiting for a better time to sell into
the market in the face of rising production and exports from Iran make sense?
Producer-sellers are desperate for cashflow at any price, and the glut in supply means the
competition to be the one who gets the sale is intense. Yet at the same time the near capacity
storage available to some producers makes the potential for an individual field to be locked in
because it has nowhere to send its product to much higher, no matter how hysterical the bean counters
get.
The low price of crude is cutting the throat of many producers, who will not easily come back
on line even if the price recovers. Its going to be an interesting year
Interesting article on the RBN Energy website, about Cushing. Note that the author touches on
two key issues: (1) Insufficient heavy crude to offset the flood of condensate, thus making it
more difficult to create their "Synthetic WTI" blend and (2) Weak demand for the Synthetic WTI
blend itself.
The Reuters article from last year discusses the second point:
Many executives say that the crude oil blends being created in Cushing are often substandard
approximations of West Texas Intermediate (WTI), the longstanding U.S. benchmark familiar to,
and favored by, many refiners in the region.
Typical light-sweet WTI crude has an API gravity of about 38 to 40. Condensate, or super-light
crude that is abundant in most U.S. shale patches, ranges from 45 to 60 or higher. Western
Canadian Select, itself a blend, is about 20.
While the blends of these crudes may technically meet the API gravity ceiling of 42 at Cushing,
industry players say the mixes can be inconsistent in makeup and generate less income because
the most desirable stuff is often missing.
As I have previously stated, IMO the global total liquids oversupply is a house of cards, built
on an unstable foundation of actual global crude oil production* that requires vast amount of
capital every year, in order to keep global crude oil production from crashing.
Up the thread, I noted that a plausible estimate is that it may have taken about a trillion
dollars in 2014 and 2015 combined to keep global crude oil production around 68 to 69 million
bpd, versus my estimate of 69 million bpd in 2005.
In my view the past surge in shale production was based on the favorable conditions of the
bond market ('search for yield'). As long as the bond market has been liquid, production could
surge. However, as the recent collapse of the bond market starts affecting production (see below
chart) we could see another 'black swan' event on the downside of production.
An analyst on CNBC had an interesting quote, which he attributed to John D. Rockefeller, to-wit,
there has been more money lost to the ill advised search for yield, than in all of the bank robberies
in recorded history.
All the three bubbles of the last decade – internet bubble, housing bubble and now the shale
bubble – reflect deeply the American approach how to respond to challenges in the economy and
society: It is better to ask for forgiveness than to ask for permission. Greenspan famously said when the internet bubble burst: You can only recognize a bubble when
the bubble has burst. This approach has probably avoided also some damage ( for instance an escalating oil price
surge), yet has also done some huge damage to investors.
The lesson for investors is to recognize and understand the thinking behind Wall Street's motivation
and adjust the investment strategy accordingly. As the bond collapse is far from over, we have
not yet seen the bottom of the production decline. The bond market is the major driver of oil
and gas production. Any forecast which ignores changes of capital markets is very likely irrelevant.
Yes, access to cheap money (not only bonds, but also bank loans) was one of the key factors
that contributed to the shale boom.
As regards the 'black swan' event on the downside of production, we will see which financial
tricks the shale guys, their bankers and investors will invent to keep shale production afloat.
we will see which financial tricks the shale guys, their bankers and investors will invent
to keep shale production afloat.
I agree if you are talking about the money the bankers and investors already have invested
in shale. But the bankers and investors will not likely be looking for ways to lose more money.
New investment in shale will be difficult to come by.
"Nationalize it and this annoying little issue of profit pursuit disappears."
US banks were not "nationalized" during the 2008-2009 crisis. I very much doubt the gov't will
nationalize the Oil industry, unless there is a very drastic event that cause the price to skyrocket
suddenly (ie above $200). A KSA/Iran hot war would probably do that.
Collapsing Oil prices is just a symptom of a mounting global economic crisis. Even if the US
nationalized its Oil industry it still not going to fix problems overseas: The Middle East, China
and Europe.
The period of kicking the can with ease has reached its end. Now the World's gov't will need
to resort to ever increasing drastic actions to avoid a global depression.
"we will see which financial tricks the shale guys, their bankers and investors will invent to
keep shale production afloat."
Maybe they start investor focused campaign "World is running out of oil" meme
:-) LOL
… similar to "We are running out of land" meme during Housing bubble
:-)
Just kidding.
:-)
I think we should view "surge in shale production" not as something "based on the favorable
conditions of the bond market" but as yet another "boom and bust" cycle which is the hallmark
of neoliberal economy. Third in the sequence dot.com-real estate-shale oil, if you wish.
In all three cases it was reckless financing using new instruments which became available after
deregulation which initiated the bubble. In this case covenant-light loans -- the crappiest kind
of junk.
Like in all previous bubbles the deflation of the shale bubble might take some banks (this
time regional) with it and result in a real extinction of shale companies. Technological progress
achieved will remain intact and will be picked up by survivors.
The wave of bankruptcies will depress new drilling and might serve as another catalyst of the
decline of shale oil production in 2016 and 2017 (despite takeover of properties). The decline
that was not accounted for in the current forecasts.
Unlike two previous bubbles, this is a more localized disturbance and the size of CCC and lower
junk bond market is just around one and a half trillion, but it will likely spread to the broader
economy at least in six affected states due to links to mortgages, commercial real estate, municipal
bonds, etc.
And it coincides with the weakening of the US economy.
CCC and lower is just the canary in the mine. It is a sign of strength or weakness in the sector.
It affects also private equity, loans….
The big question now is: How far will this go? Can it escalate? As this is impossible to predict,
it is also impossible to make an accurate production forecast – even for the next two years.
It is ironic that even the FED -- having thousands of economists on its payroll -- has been a
very bad forecaster. Greenspan did not recognize the internet bubble, Bernanke had to deal with
the housing bubble ( the housing crisis is contained) and now Yellen has to face the shale bubble,
which she did not foresee (in December there was still talk about escape velocity and inflation).
It is still open how deeply the burst of the shale bubble will affect the US economy. There
could be some political events which brings out some oil production worldwide and the shale industry
will be saved for a while. However, my gut feeling tells me that this will go very deeply. It
looks like the FED has painted itself into a corner again.
I agree. Also your point about oil prices is important, oil prices are very difficult to predict
and eventually they will affect output, though there is a significant time lag (maybe 18 to 36
months) between a change in oil prices and a change in the oil supply. I have not yet figured
out what this time lag is, but my current guess is about 24 months on average.
This will vary depending on the oil field (deep water projects have a longer lag and onshore
conventional and LTO may be somewhat shorter than the global average).
So Ace got it wrong. We have been knowing that for a long time. That's history. What's your point?
Oil production will definitely, one day, peak. The fact that past predictions of peak oil were
wrong only means they were too early. People who are predicting peak oil now, or at any time in
the future, will be 8 years closer to hitting the date than Ace did.
I am reminded of insider traders in the stock market. That is company executives buying or
selling stock in their own companies. The saying is, They are almost always right. But…
They are almost always too early.
That is, they see that something is definitely happening so they act. But they just expect
it to happen way before it really does. The same can be said about peak oil prognosticators. We
saw that peak oil was definitely going to happen. But most of us were way too early with our prognostications,
about 8 years too early.
:-)
I am reminded of insider traders in the stock market. That is company executives buying
or selling stock in their own companies. The saying is, They are almost always right. But… They
are almost always too early.
Yes the time lag is different for different type of resource, different type of projects, different
producing fields, different countries and different companies.
A big question is how to calculate this time lag.
LTO was expected to be the first to react, and it indeed reacted the most. But I was expecting
much bigger declines last year.
Conventional output was almost unaffected last year (low short-term price elasticity). There
will be some negative supply-side impact this year, but the biggest cumulative impact from low
prices should be felt by 2020.
With LTO the production was accelerating y-o-y at a high rate, more in percentage terms than has
been seen in fields before, at least since the very early days of the industry. The cut has been
from that high rate to a slow decline. If the LTO production had been steady or a growth rate
that was more representative of previous new fields then the decline would have been pretty steep
by now. That and the different impact, and decoupled timing, of drilling and completions compared
to conventional fields is what through off a lot of the predictions in my opinion.
I read your reply on the previous thread and I appreciate your insight. I think I mostly agree
with your take.
One place that I may not agree is that you think $45/b is high enough to keep output flat.
I think that in the LTO plays $45/b is not enough to make the completion of drilled uncompleted
(DUC) wells financially viable so we will see a fairly steep decline in LTO output if the EIA
oil price forecast is correct.
In addition there are no doubt fields throughout the World where there are few long term projects
in the works, but have continual infill drilling that either maintains a plateau or reduces the
overall field decline rate. I would expect that even $45/b may not be enough to justify the continued
drilling of new wells in many fields.
Note that the EIA STEO predicts Brent at $46/b in the fourth quarter of 2016. This is the reason
that I believe the EIA's oil supply forecast is too high (assuming their price forecast is correct).
I would expect at least a 1 Mb/d drop in 2016 average annual World C+C output compared to 2015
average output levels if the EIA's most recent oil price forecast for Brent crude is correct.
I didn't say that "$45/b is high enough to keep output flat". I said that $40-45/b is enough
to cover operating costs and maintenance capex in a vast majority of the world's currently producing
conventional fields (as well as oil sands operations).
That doesn't mean keeping production flat. Where production was falling due to natural declines
at $90-100, it will continue to decline (probably, at higher rates) at $40-45.
Project delays and lower upstream capex will also have a negative impact on new conventional
production. But as project start-ups scheduled for 2015-17 are generally not postponed, the overall
impact on global conventional production will be relatively modest this year. However the effects
of low prices will gradually increase in the next few years and peak by 2020, even if oil prices
recover by that time.
As regards LTO, I agree that $45 is not enough to keep production flat. I guess the required
price is closer to $60.
Finally, I certainly do not expect global C+C production to drop by 1 mb/d y-o-y in 2016. Barring
unlikely OPEC cuts and unexpected large-scale supply outages, the increase in OPEC output (Iran)
should partially offset declines in non-OPEC production.
Sorry I misunderstood. Let's assume the EIA STEO oil price predictions are correct.
What would you expect for the average annual C+C output level in 2016, if that assumption were
correct?
Note that I also do not expect C+C output will fall by 1 Mb/d, but the reason will be that
the EIA's oil price prediction will be too low. I expect an average annual Brent price level for
2016 of about $55/b+/-$5/b and at that price level average annual C+C output will decline by about
500 kb/d in 2016 (about 79 Mb/d for an average output level) relative to the average 2015 output
level (about 79.5 Mb/d).
average annual C+C output will decline by about 500 kb/d in 2016 (about 79 Mb/d for an average
output level) relative to the average 2015 output level (about 79.5 Mb/d).
Through the first ten months f 2015, world C+C production has averaged 79.94 Mb/d. If we have
the decline that I expect in November and December, I believe the average for 2015 will be around
79.85 to 79.9 Mb/d.
I expect 2016 C+C production to be about 78.9 Mb/d or a decline of about 1 million barrels
per day.
Below is the 2015 C+C production, through October, according to the the EIA. The Peak so far,
was in July 2015 at 80,525,000 million barrels per day.
Future accounting problems – There have been many posts here over the past 2 years analyzing the
cost incurred by the O & G companies to produce LTO. In my opinion, some of the ability to do
that may go away.
Most companies have had to write down the balance sheet value of their LTO reserves (costs
incurred) in 2014, 2015 and probably will again in 2016. If the price of oil increases, write
ups to reinstate the value back to where it was are not permitted. So the true costs become invisible.
So, if in 2017, if the price of oil is back to $50, companies could produce income statements
that show a profit. But, some of that will be because much of the cost was written off in previous
years due to "one time, extraordinary valuation write offs."
The companies offset the oil being sold with a DD&A [depletion, depreciation and amortization]
cost. In general, that means that they ratably deduct their capitalized costs over each barrel
of oil produced. But, if they have already written off half of their capitalized cost due to a
valuation write off, then future DD&A will be one half of what it would have been without the
write off.
And, it will likely be very difficult in 2017 to separate out their 2017 operations.
Excellent point. That is why careful investors, like e.g. Warren Buffett, don't accept accounting
profit.
They calculate something like "owner earnings", in which you ignore accounting DDA and include
your own conservative estimate of the depletion/depreciation of assets.
In my opinion, there is a seriously flaw in the calculation of the accounting profit for LTO
companies. The depletion/depreciation amount doesn't fully reflect the actual reduction of the
NPV of the assets over a year. In other words, the very fast decline in production of shale wells,
and the larger variable costs later in the life of a well, are not fully accounted for. LTO companies
are in general getting away with a much smaller DDA amount, and therefore front loading profits.
Normally lowering DDA is a bad corporate strategy, because it leads to more corporate taxes, but
these companies in general also benefit from major tax deductions to compensate for this. I think
this accounting flaw has played a big role in the shale boom.
Most retail investors unfortunately take book profits and book value too seriously. Like Shallow
sand, you, and others have shown, there are much better ways to make value estimates.
Good points, as we have discussed previously.
If oil prices don't return to 2011-14 levels, tough to see how loan principal gets paid.
Asset sales to pay principal are self defeating. Due to IDC elections, depletion and depreciation,
would seem that shale asset sales would generate a lot of tax liability. A $1 billion sale may
generate only $600 million after tax?
Also, assets sales cause company wide production to fall.
Interesting how all of the companies in 2015 are reporting year over year production growth
AFTER excluding the effects of asset divestures. So we are selling production to drill more wells
to grow production. Our production is falling, but by gosh we have more new wells with 1 million
EUR.
The production they are selling tends to have higher OPEX, but lower decline, and therefore,
despite the higher OPEX, more PV per BOE.
A prime example would be Whiting, who last summer tried to sell its North Ward Estes CO2 flood.
As I recall, NWE accounted for less than 10% of company wide BOE in 2014, yet almost 20% of
PDP PV10. This despite having much higher current OPEX than the Bakken and Nirobrara assets.
I have never understood how long term value is being created by these companies. One thousand
200 BOE average wells will be 40 BOE average in 5 years, for example, yet little to no ability
to pay down debt principal.
PV10, 9, 8, or whatever discount value is appropriate does matter. Now that PDP PV10 is greatly
less than long term debt, I hope some investors pay attention to it.
SS – I believe that current asset sales generally are unlikely to result in any cash taxes being
paid. Especially since prices have fallen so much in the last year and a half. Further information
below, for those who might want to delve a little deeper, but not fully into the complexities.
As you know, the companies deduct most of their drilling/fracking costs on their tax returns
in the year that the money is spent. But, for their financial presentation books, following the
GAAP principle to match expenses with revenue, these expenses are capitalized and included in
their Oil & Gas Assets. For the financial statements these costs are rateably amortized as production
occurs as DD&A expense.
Generally speaking, the companies create significant net operating losses on their tax returns
because of those deductions. However, because in the future they will eventually deduct the costs
[DD&A], but they cannot again deduct them for tax purposes, they are required to book deferred
taxes payable as a liability.
Looking at PXD. At year end they have a $1.776 billion long term deferred tax liability. Using
a 32% tax rate, this can imply a tax net operating loss of up to $5.55 billion. Assume that they
have a producing field on the books at $500 million [GAAP using $49/bbl], with future drilling
prospects, and a zero tax basis. They sell it for $1 billion, a $500 million book profit. A 32%
tax on the book profit is $160 million, which is recorded in the income statement, but, which
does not have to be paid. It offsets some of the net operating losses. The tax return shows a
gain of $1 billion, an extra $500 million. The 32% tax on that extra $500 million offsets their
deferred tax liability of $1.776 billion, reducing their deferred tax liability to $1.616 billion.
one of the "things" that the shale industry has given the oil industry is lower "finding costs"
……at the "expense" of greater variability in outcomes (EUR / IP / PV10). Again – thankyou for
your site – outstanding work
rgds
simon
One question- I see that you have US crude imports at about 7Mbpd, where as Jan data from iea
have US net liquids import at about 5 Mbpd.
Is this difference because we export things like refined product and condensate?
A big 2 page story in the business section of today's Daily Oklahoman. Oklahoma's oil production
is up over 100,000 bbl/day starting in December – over 25%. Well, actual production is not up,
but the EIA started doing their surveys last year to get more accurate production numbers. After
months of consultation with the Oklahoma Tax Commission, they agreed that the EIA #'s are the
correct ones. The OK Tax Comm claims that they have been collecting the right amount of tax.
Apparently, the data is loaded into a 30 year old mainframe system and computer program. Any
data that does not match is kicked out of the system. That data is then processed manually but,
has never been able to be loaded back into the existing computer system. So, numbers from Oklahoma
have been understated for a long time. The Tax Comm says that they have one year left [estimate]
on a four year project to put in a new computer system that will fix their problem. Meanwhile,
the EIA is going with their survey.
At the risk of hijacking of this thread, I have several questions to pose to this group, starting
with why are petroleum imports from Canada continuing to increase? (See link to EIA below). Is
it caused in part by the anemic Canadian dollar, the need to keep pumping because cash flow generation
trumps all other considerations, or something else? Which leads to another question How much further
must the price of petroleum decline before petroleum imports from Canada start to dwindle? Until
it does–and who knows when that will happen -- I have a hard time believing that oil prices will
move higher in the current cycle.
I haven't seen this discussed, but my apologies if it is a duplicate. Paragon Offshore to file
Chapter 11 – is this the largest bankruptcy for offshore drillers so far?
"It's sad. These people never thought the day would come where a barrel of oil would be
below $30 (U.S.)," he said. "They were just living for the moment and they were making a huge
amount of money and just thought it would continue on."
The oil price collapse is also hitting the opposite side of Canada.
The fallout from the oil crisis - compounded by potential government job cuts - could hit
the province worse than the infamous cod moratorium of the 1990s, said Wade Locke, an economics
professor at Memorial University.
"A 30 per cent cut in government expenditures over three years at a time when the economy
is weak because of oil prices and less remittance income from people working in the oilfields
in Alberta?
"Yes, it's fair to say it could be harder than the moratorium," he said.
Those affects are being felt now. Fewer blue and orange ice-class cargo ships leave the
narrow entry to the St. John's harbour, loaded with supplies for the rigs 350-kilometres offshore.
And with declining output from the three producing rigs and two of four exploration rigs
temporarily shut down - two more are scheduled for shutdown in July - helicopters are bringing
fewer workers back and forth right now.
Still, resilient Newfoundlanders are quick to list off the reasons they believe the downturn
could be relatively short-term; that this is the bottom of a typical, albeit particularly painful,
commodity cycle.
After all, there's still a great deal of interest in Newfoundland's offshore oil, which
is cheaper and cleaner to extract than oilsands crude. A government land sale in the Flemish
Pass basin took in a record $1.2 billion of new oil company spending commitments. There are
an estimated 12 billion barrels of oil reserves in that area alone. The province believes the
number of job openings will increase beginning in 2019, when it anticipates major project expansion
will resume.
… … …
….new home construction has dropped by 20 per cent.
…Insolvency filings are up 22 per cent over the last year at accounting and insolvency firm
Noseworthy Chapman.
…Two of the seven offshore rigs that the base supplied in 2014 have shut down temporarily.
The marine base is taking a revenue hit, but so far there have only been a few layoffs, he
said.
…Food banks in the province provide food to nearly five per cent of people in the province,
the second highest level in the country.
…8.2% - Percentage of Newfoundland workers projected to lose their jobs in next three years,
amounting to 24,000 job losses
… $1.9B - Deficit projection in 2015-2016 fiscal update, nearly twice what was expected in
the budget
… $12.4B - Newfoundland's net debt
Looks like everything is connected those days. Or "over connected". A lot of common people
suffer consequences of those big boys games. Business bankruptcies lead to personal bankruptcies.
I wonder where they got the 12 billion barrels of reserves from. Wikipedia gives the following
numbers for the estimated oil in place:
Hibernia = 2.1 billion barrels with 700 million already produced by 2010
Terra Nova = 400 million barrels
White Rose = 440 million barrels
As far as I can tell, these are the only major oil fields off Canada's east coast.
"A government land sale in the Flemish Pass basin took in a record $1.2 billion of new oil
company spending commitments. There are an estimated 12 billion barrels of oil reserves in that
area alone."
So what is it, 12 billion barrels or 300 to 600 million barrels? Total production 1977-2005
at Prudhoe Bay = 11 billion barrels with perhaps two billion barrels of recoverable oil remaining.
Let's be generous and say 0.5 billion barrels total in the Flemish Pass Basin; 12 billion, no
bloody way.
"In late September 2013, Statoil ASA and its 35 per cent joint-venture partner, Husky Energy
Inc., announced two back-to-back light crude discoveries in the deepwater Flemish Pass Basin,
offshore Newfoundland. The larger of the two discoveries, the Bay du Nord exploration well, confirmed
the existence of 300 to 600 million barrels of 34 degree API oil recoverable."
Hebron – comes on line 2017, maybe 700 million barrels or more of heavy oil. BP and Shell each
paid about $1 billion for exploration rights offshore Nova Scotia. Shell is drilling at the moment
The author might also be considering 'equivalent' oil offshore Labrador which might have a lot
of gas (but very difficult to develop). There are a couple of areas on the border with USA which
are off limits at the moment. Against this Terra Nova and WhiteRose are well into their run down
phases and don't have much left.
Say, Ron, have you looked at the most recent Drilling Productivity Reports? A couple days ago,
they showed the major frack-oil fields having a reversal of legacy well declines. Bakken, Eagle
Ford, etc. all show an UPWARD move in the legacy graphs (in other words, they're losing less production
monthly than they were previous few months).
I think that is due to the decline rate being very high initially for new wells followed by a
long period of slower decline and more steady production over the course of a well's life. As
new producing wells were only enough in quantity to keep production flat (rather than increase
it like previous years), there was less proportionally of this initial production spike and steep
decline, and more proportionally of the slower more gradual declining production due – the composition
of the wells now being mostly older rather than many new wells.
Also as production had fallen a bit, the decline should naturally be smaller even at the same
decline rates. For instance a 10% decline on 1,000,000 mbpd will be higher than the decline at
10% on 900,000 mbpd
It does not look odd at all. That is exactly what you would expect, as Alex and Econ pointed out.
Production is declining and therefore you have less oil to decline. And fewer wells are coming
on line and older wells have a slower decline rate than new wells.
I didn't get back to say thanks for the answers to my question about condensate energy content
yesterday, or day before but thanks everybody.
Maybe somebody who can still remember their math will calculate the loss of energy per average
barrel of so called total liquids as the percentage of condensates increases, with the quantity
of conventional crude decreasing.
At first glance it looks as if the rising percentage of condensate is cutting significantly
into the energy of an "average" total liquid barrel.
I have not run across any research yet performed with the intent of designing internal combustion
engines to run mostly or entirely on condensates, but it would appear at first glance that using
straight condensate, or a very high percentage of condensate as ice fuel would be practical and
economic, so long as it continues to sell for substantially less than ordinary crude- at least
in the case of large stationary engines, or engines powering equipment that mostly stays very
close to a home base, such as farm machinery and heavy construction equipment. The condensate
could probably be hauled to a big construction job or large farm at no more trouble and expense
than LP .
Assuming the president picks a Hispanic, African American or Asian American – bonus points
if she's a woman – this could be exactly what Democrats need to re-activate the Obama coalition
that fueled his victories in 2008 and 2012. Even if he does not go with a minority candidate,
the cases on the docket will galvanize voters who are traditionally less likely to turn out.
That is exactly what I have been saying.
Keep in mind that a quarter of Nevada's population is Hispanic. Beyond being a battleground
in the presidential race, there is also an open Senate race to succeed Harry Reid. Democrats will
nominate a Latina and Republicans will nominate a white guy who is already in Congress.
This will absolutely assure that Harry Reid's seat will stay in Democratic hands.
More broadly, this could also undermine efforts by Senate Republicans to show that they
are capable of governing and not just "the party of no."
Ron, looks like a leading choice is Sri Srinivasan. I know nothing about him, other than what
I have just read. 48. Born in India, raised in Kansas, Stanford graduate. Was appointed to DC
circuit and confirmed by senate 97-0, in 2012.
Good question shallow. But I don't think he will be shot down. Even if he is the nominee McConnell
will not allow it to come up for a vote. He will just sit on it until the next president is elected.
And sit on it longer if a Republican is elected. Which is not likely.
That is just what they do. They are the party of NO!
The question is how many of those Hispanic "Nevadans" have the right to vote. I bet less than
less than half of that quarter.
And my guess is you'll see republicans very motivated to avoid an imperial presidency ruling
by decree backed by an activist court. That reminds me of Venezuela.
Ironically I used the "fishy" word too discussing CLR today.
Don't know anything they report is not correct, just seems OPEX is always very low compared
to peers operating in the same areas.
Seems odd that PUD BOE would be 57% given terrible economics for new wells.
Again, BOE reserve category percentages do not equal PV10 value percentages, but 2/3 of OAS
BOE reserves are PDP. Assume PXD is high % PDP reserves, given almost 90% of PV10 is PDP.
Also, never have figured out why all the $10+ million non core wells in places like Divide,
Stark, Elm Coulee, etc, haven't caught up with CLR. EOG, WLL, QEP and others seem to have better
wells/ locations companywide in Bakken.
Oh well, it's just speculation. Maybe the 10K's will give us more clues.
If you look at Enno's shaleprofile.com, you can get actual production curves for them and compare
them with their presentation production. I made that comparison when Enno's site first came up.
It is a remarkable difference. I don't know how much NPV they assign to any of their reserves,
but I've seen enough to know that I don't trust their reserves for volumes or dollars.
North Dakota should be releasing their December production numbers soon. A lot of people consider
North Dakota's reporting as an indicator of the trends for all shale oil. Their reporting is much
more timely than waiting 8 months to see what Texas looks like after revisions.
North Dakota surprised with small production gains for October and November. The EIA's November
Drilling Productivity Report forecast a 27 kbopd decline from November's estimated 1137 kbopd
to December's estimate of 1110 kbopd. North Dakota's report for November was 1119 kbopd. It may
be that they trade some accuracy for timeliness as their monthly numbers seem to be very erratic.
That said, I think they are due for a decline of over the forecast 27 kbopd.
I have given up any pretense of trying to understand what will happen next, then further down
the road. Except to understand, that at some point, depletion becomes unequivocally evident to
all…then it will get 'interesting'.
[Feb 15, 2016] Looks like ZH is short on oil for some ti
As Russia's oil minister meets his Saudi Arabian counterpart in
Doha on Tuesday, the world's second-largest crude producer faces numerous
obstacles in cooperating on such a deal even if Putin decides it's in
the national interest. Reducing the flow of crude might damage Russia's
fields and pipelines, require expensive new storage tanks or simply
take too long.
In Siberia, Russia's main oil province, winter temperatures can
go below minus 40 degrees Celsius (minus 40 Fahrenheit). That's a challenge
for anyone thinking of turning off the taps.
The oil and gas that flows from wells always contains water, so
once pumping stops, pipes may freeze, Mikhail Pshenitsyn, who has worked
for more than 10 years in the Russian oil industry, said by e-mail.
The problem goes away in summer, but there's still the risk of a long-term
reduction in output because a halted reservoir can become polluted with
salts and residues, he said. Production from a shut-in well might never
be restored in full, Maxim Nechaev, director for Russia at consulting
firm IHS Inc., said by phone.
Blink. Someone from IHS says oil wells can be permanently damaged?
Might want to go thru the article. It's loaded with frown inducers.
Why would anyone "produce oil" aka extract it from the ground if they
don't have an order for it. There is verbage about Russia pumping it to
store it. Hell, it's already stored. Underground. Russia isn't going to
get tax revenue from oil flow that isn't sold. The sales revs are what pay
the taxes.
People are so desperate to sprint to the oversupply narrative that they
don't think it through.
Watcher,
That part of the text that was quoted from ZH is totally wrong (like most
of the MSM garbage) in way that it looks at the tomorrow's meeting. Russia
is not negotiating any cuts at all with SA in Doha or vice versa. The whole
meeting is about a possible attempt of negotiation only of oil production
freeze of additional production in retrospect of Iran return to the oil
market.
KSA has 'cut' production in 6 out of the last seven months. Cut might not
be the right word though as I suspect it was not a choice. It was thrust
upon them by geology. KSA will IMO face month after month of decreasing
production. They managed a production surge for a short while but that's
all they had in them. They've shot their bolt. Iran probably has some good
increases coming but that's about it, and not all of that Iranian increase
will be exported.
The increase in Saudi oil production
in the summer season was due to peak demand from the domestic power generation
for air conditioning.
As demand moderated in the past several months, KSA slightly reduced output
levels, while crude exports have actually increased.
KSA oil production and exports in 2015 – Jan. 2016
sources: JODI, OPEC
Do you believe that the slightly reduced production level of the last
6 of 7 months was optional? I tend not to. I feel they are producing every
single barrel that they possibly can. They've got the peddle to that floor.
No holding back.
Looks like some negotiations are happening behind closed doors between
Saudis and Russians (probably discussion over Iran return to the world oil
market) despite thick smoke of disinformation from Bloomberg presstitutes.
With French, Italian and Greek deals (and Spain deal in pipeline) it
might well be that accommodation of Iran is already started in full force.
The question is whether they are able to produce additional volumes of oil
above 0.3 Mb/d that is expected (and actually already contracted) and if
yes, when.
Iraq and a couple Persian Gulf monarchies are on board for the cuts.
Saudis need to pander to growing Wahhabi sentiments of its population. So
they probably are not in order to "punish" Iran and Russia. Also hardliners
are now in power. But as money evaporate from their coffers even hardliners
might soften their position. Eventually.
Still here is Bloomberg disinformation in full glory:
As Russia's oil minister meets his Saudi Arabian counterpart in Doha
on Tuesday, the world's second-largest crude producer faces numerous
obstacles in cooperating on such a deal even if Putin decides it's in
the national interest. Reducing the flow of crude might damage Russia's
fields and pipelines, require expensive new storage tanks or simply
take too long.
So far Russia's top oil official have offered mixed signals. Energy
Minister Alexander Novak has said he could consider reductions if other
producers joined in. Igor Sechin, chief executive officer of the
country's largest oil company Rosneft OJSC and a close Putin ally, said
last week in London that coordination would be difficult because no
major producer seems willing to pare output.
BTW looks like Bloomberg intentionally distorted the position of Sechin.
IMHO he is onboard about a one time cut around 1 Mb/d if it is implemented
as a proportional cut by all major oil producers. As Russians most probably
have a reasonably good intelligence about Persian Gulf countries they should
understand the situation with new projects and natural decline of wells
in Gulf which now will drive the world oil production dynamics.
"… the strategy of the prince Mohammed Bin Salman is to push Iran
to the fault in causing the tensions that can go up to a risk of open
warfare that would force the west to choose Saudi Arabia against Iran
…"
"… The Prince Mohammed bin Salman is now the most powerful man in
Saudi Arabia. It has exclusive access to his father, King Salman, and
effectivly he can rule the coutries inread of him. He is head of his
office, which means that nobody can contact or be received by the King
without going through the son …"
"… Saudi Arabia is extremely disturbed by the detente with Iran on
the international scene. We are witnessing more or less a reversal of
alliances, and of countries images in the eyes of the West. A short
time ago, Iran was demonized in the West. Today, it is accepted as a
normal partner. Iran, therefore, benefits from a relatively favorable
treatment, while at the same time when the Arab monarchies, particularly
Saudi Arabia, are seen as retrograde, unable to provide for reforms
and creating the flow of Islamic radicals… The nature of Hezbollah,
interference military and terrorists of Iran is currently forgotten.
…"
"… I think it will be very difficult to see any reapprochement with
Iran in the coming months as Saudi Arabia has two hardliners in the
young rising generation of leaders. The heir and the vice-inherit the
Kingdom share the same radical line toward Iran. …"
"… Moreover, Saudi Arabia pays very dear to his strategy of crushing
oil prices, which makes it less able to buy social peace than before.
Therefore, there is an internal demand of radicalism, because the discontent
rumbles in the parts of the Saudi population fueled by the effects of
the falling oil prices. …"
"… If one wanted to summaries, we could say that to buy a peace with
Islamist Wahhabi radicals, it is necessary to kill shia… besides, the
Saudis have a genuine complex of encirclement by the Shiite states.
They try to counter it by creating an opposite ark of Sunni radicals.
…"
"… even if this does not lead to open warfare, the tension between
Saudi Arabia and Iran is sustainable, if only because this new generation
of Saudis leaders is more combative. They differ from the former kings
who belonged to a generation that was distinguished rather by its search
for a compromise and some consensus. This is absolutely not the case
for those two heirs of the throne. …"
"... All the three bubbles of the last decade – internet bubble, housing bubble and now the shale bubble – reflect deeply the American approach how to respond to challenges in the economy and society: It is better to ask for forgiveness than to ask for permission. ..."
"... The lesson for investors is to recognize and understand the thinking behind Wall Street's motivation and adjust the investment strategy accordingly. As the bond collapse is far from over, we have not yet seen the bottom of the production decline. The bond market is the major driver of oil and gas production. Any forecast which ignores changes of capital markets is very likely irrelevant. ..."
"... Yes, access to cheap money (not only bonds, but also bank loans) was one of the key factors that contributed to the shale boom. ..."
"... we will see which financial tricks the shale guys, their bankers and investors will invent to keep shale production afloat. ..."
"... I agree if you are talking about the money the bankers and investors already have invested in shale. But the bankers and investors will not likely be looking for ways to lose more money. New investment in shale will be difficult to come by. ..."
"... Nationalize it and this annoying little issue of profit pursuit disappears. ..."
"... US banks were not "nationalized" during the 2008-2009 crisis. I very much doubt the gov't will nationalize the Oil industry, unless there is a very drastic event that cause the price to skyrocket suddenly (ie above $200). A KSA/Iran hot war would probably do that. ..."
"... Collapsing Oil prices is just a symptom of a mounting global economic crisis. Even if the US nationalized its Oil industry it still not going to fix problems overseas: The Middle East, China and Europe. ..."
"... The period of kicking the can with ease has reached its end. ..."
"... Maybe they start investor focused campaign "World is running out of oil" meme :-) LOL … similar to "We are running out of land" meme during Housing bubble :-) Just kidding. :-) ..."
An analyst on CNBC had an interesting quote, which he attributed to John D. Rockefeller, to-wit,
there has been more money lost to the ill advised search for yield, than in all of the bank robberies
in recorded history.
All the three bubbles of the last decade – internet bubble, housing bubble and now the shale
bubble – reflect deeply the American approach how to respond to challenges in the economy and
society: It is better to ask for forgiveness than to ask for permission. Greenspan famously said when the internet bubble burst: You can only recognize a bubble when
the bubble has burst. This approach has probably avoided also some damage ( for instance an escalating oil price
surge), yet has also done some huge damage to investors.
The lesson for investors is to recognize and understand the thinking behind Wall Street's motivation
and adjust the investment strategy accordingly. As the bond collapse is far from over, we have
not yet seen the bottom of the production decline. The bond market is the major driver of oil
and gas production. Any forecast which ignores changes of capital markets is very likely irrelevant.
Yes, access to cheap money (not only bonds, but also bank loans) was one of the key factors
that contributed to the shale boom.
As regards the 'black swan' event on the downside of production, we will see which financial
tricks the shale guys, their bankers and investors will invent to keep shale production afloat.
we will see which financial tricks the shale guys, their bankers and investors will invent
to keep shale production afloat.
I agree if you are talking about the money the bankers and investors already have invested
in shale. But the bankers and investors will not likely be looking for ways to lose more money.
New investment in shale will be difficult to come by.
"Nationalize it and this annoying little issue of profit pursuit disappears."
US banks were not "nationalized" during the 2008-2009 crisis. I very much doubt the gov't will
nationalize the Oil industry, unless there is a very drastic event that cause the price to skyrocket
suddenly (ie above $200). A KSA/Iran hot war would probably do that.
Collapsing Oil prices is just a symptom of a mounting global economic crisis. Even if the US
nationalized its Oil industry it still not going to fix problems overseas: The Middle East, China
and Europe.
The period of kicking the can with ease has reached its end. Now the World's gov't will need
to resort to ever increasing drastic actions to avoid a global depression.
"we will see which financial tricks the shale guys, their bankers and investors will invent to
keep shale production afloat."
Maybe they start investor focused campaign "World is running out of oil" meme
:-) LOL
… similar to "We are running out of land" meme during Housing bubble
:-)
Just kidding.
:-)
On the issue of EIA's predictions accuracy, I updated this graph from Mason Inman and added
actual oil US production.
What this graph shows is a typical very conservative estimate system. This means that on the
way up, they greatly underestimate production and on the way down, they are going to greatly overestimate
production.
This clearly shows how credible their predictions are. Although the graph is only for the US,
clearly they are going to be equally conservative (and thus equally wrong) about world oil production.
The long-term projections of U.S. LTO production are from various issues of the EIA Annual
Energy Outlook. They indeed were very conservative, even though none of them (even the AEO-2015)
did not assume such a big drop in oil prices.
As regards the actual production data (the black line), it is from the Drilling Productivity
Report and include almost 1 mb/d of conventional output, primarily from the Permian basin.
U.S. LTO production had never reached 5.5 mb/d, as the black line shows. According to the most
recent EIA presentation, the local peak (In March 2015) was around 4.6 mb/d
And all this without any significant change in oil price.
So if the question is, as Ron is posting, how much value have EIA predictions? The answer clearly
is none. EIA predictions are useless. Evidence indicates that they are going to overestimate production
by a large amount for as long as production goes down.
These are projections for LTO, a new resource type. Its emergence as a new important source of
global supply and its rapid growth was a "black swan" event, which nobody could predict.
This is a good example why all such projections are just a snapshot that reflects our current
knowledge of geology, technology and other factors affecting energy supply
Interesting article on the RBN Energy website, about Cushing. Note that the author touches on
two key issues: (1) Insufficient heavy crude to offset the flood of condensate, thus making it
more difficult to create their "Synthetic WTI" blend and (2) Weak demand for the Synthetic WTI
blend itself.
The Reuters article from last year discusses the second point:
Many executives say that the crude oil blends being created in Cushing are often substandard
approximations of West Texas Intermediate (WTI), the longstanding U.S. benchmark familiar to,
and favored by, many refiners in the region.
Typical light-sweet WTI crude has an API gravity of about 38 to 40. Condensate, or super-light
crude that is abundant in most U.S. shale patches, ranges from 45 to 60 or higher. Western
Canadian Select, itself a blend, is about 20.
While the blends of these crudes may technically meet the API gravity ceiling of 42 at Cushing,
industry players say the mixes can be inconsistent in makeup and generate less income because
the most desirable stuff is often missing.
Link to my Oilpro.com article on crude versus condensate:
As I have previously stated, IMO the global total liquids oversupply is a house of cards, built
on an unstable foundation of actual global crude oil production* that requires vast amount of
capital every year, in order to keep global crude oil production from crashing.
Up the thread, I noted that a plausible estimate is that it may have taken about a trillion
dollars in 2014 and 2015 combined to keep global crude oil production around 68 to 69 million
bpd, versus my estimate of 69 million bpd in 2005.
Consistent use of energy units such as Barrel of oil equivalent (1 BOE = 1.7 MWh) would be a step
in that direction. Using volume is clearly a ploy to improve the numbers, as is the double counting
of barrels that are used for production (e.g. a BBL used to extract 2:1 shale oil counts as 3 BBL, to
make 1:1 ethanol counts as 2 BBL). This won't fool Mother Nature.
Oil produces 5,800,000 BTUs per 42-gallon barrel or around 138000 per gallon. For comparison ethonol
produces only 79000 opf just 55%. Condensate produces around 12% less. That's why it is important to
have statistics in metric tons not barrels...
Notable quotes:
"... I think the EIA has been playing fast and loose with the petroleum statistics. ..."
"... Ive previously suggested that assigning all the processing gains to US production is factually incorrect, instead the processing gains resulting from refining imported crude should be added to the total for imports. For a rough guess, using the fraction of crude imported given above, 664 mbbls/d should be subtracted from the US production and added to the import side of the accounting. ..."
"... Of course, the EIA misses the whole discussion about biofuels, especially ethanol, which require a large input of fossil fuels to produce the final product. The EIA ignores this fuel input, showing biofuels as an input to the front end of the refining process. With ethanol production now using about 40% of the US corn crop, it would be more accurate to consider this portion of the US agricultural system to have been added to the energy supply system and the energy used would thus become an internal consumption which would be subtracted from the petroleum energy available to the rest of society. Doing this calculation would increase the fraction of energy imported, which would give a more realistic picture of our situation... ..."
"... And the IEA bought into the EIAs misinformation (call it a lie) with their latest report, which means either that they dont understand the EIAs reporting or they are complicit in the act of overstating US production. Your choice... ..."
I think the EIA has been playing fast and loose with the petroleum statistics. As
noted last week, the EIA Annual Review for 2010 states that the US produced a total of 9,443 mbbls/d,
of which US crude production at 5,512 mbbls/day (which includes lease condensate), NGPL's at 2,001
mbbls/d and processing gain of 1,064 mbbls/d. The difference of 866 mbbls/d appears to be made
up by biofuels.
Total product supplied is said to have been 19,148 mbbls/d, with imports minus exports totaling
9,434 mbbls/d of that. The amount of crude imported was 9,163 mbbls/d. From these data, the total
crude supplied to the refineries was 14,675 mbbls/d, of which 62% is imported.
I've previously suggested that assigning all the processing gains to US production is factually
incorrect, instead the processing gains resulting from refining imported crude should be added
to the total for imports. For a rough guess, using the fraction of crude imported given above,
664 mbbls/d should be subtracted from the US production and added to the import side of the accounting.
This revision reduces US production to 8,779 mbbls/d and increases imports to 10,098 mbbls/d,
increasing the fraction imported from 49% to 53%.
Of course, the EIA misses the whole discussion about biofuels, especially ethanol, which
require a large input of fossil fuels to produce the final product. The EIA ignores this fuel
input, showing biofuels as an input to the front end of the refining process. With ethanol production
now using about 40% of the US corn crop, it would be more accurate to consider this portion of
the US agricultural system to have been added to the energy supply system and the energy used
would thus become an internal consumption which would be subtracted from the petroleum energy
available to the rest of society. Doing this calculation would increase the fraction of energy
imported, which would give a more realistic picture of our situation...
E. Swanson
carnot on November 22, 2012
Sorry Guys but you have missed the point on refinery gains. It is a mirage. Remember the 1st
law of thermodynamics.
Energy cannot be created or destroyed. US refiners continue to quote their refining capacities
and products in barrels - a unit of volume which is meaningless unless a density unit is
also quoted. What you should consider is the mass unit. In ALL refineries if you measure
in units of mass it should add up to 100% plus the mass of hydrogen and other inputs added which
increase the mass. ( methanol for an MTBE unit for instance).
When the crude is distiller in the crude unit it will produce a number of products with different
densities and therefore different mass per barrel. Measure the products in barrels and you will
have the following barrels per tonne.
In a cat cracker, with no hydrogen addition the mass of products is constant but because the
volume of LESS dense light products exceed the total volume of HEAVY dense products , hey presto
there is a refinery gain - in volume but not in mass.
Some refinery gain is due to the addition of hydrogen but typically this is 2-3% of the overall
mass flow. Refiners love to sell in units of volume as they can benefit form the sleight of hand
of selling a less dense and lower energy product to unsuspecting drivers. When energy density
is compared in mass units there is NO significant difference between gasoline, jet or diesel.
It is about 42-44 MJ per Kg but very different in volume units.
That is why diesels appear 30% more fuel efficient on volumetric terms but in reality the difference
is much less.
A number of people have posted the same argument each time "refinery gains" are mentioned, but
it does not universally hold true.
Cracking can be done without addition of hydrogen, either
by separately coking the heavier fractions of the crude before cracking (producing large volumes
of solid carbon-rich petroleum coke, frequently a desirable byproduct which is further improved
for use in metallurgy), or coking by deposition on the catalytic cracker unit itself (usually
simply burned off in batches).
In neither case does any non-crude-oil energy input contribute to the increased volume of the
light hydrocarbon products. Indeed the liquid products are of considerably less mass and energy
than the input crude petroleum.
Indeed to the best of my knowledge hydrogenation in cracking units is not the norm. The main
use of hydrogen in petroleum processing is in fact to remove sulfur and nitrogen from the fuel
-- in which process it does not add energy to the desulfurised fuel product, but rather to the
sulfuric and nitric acid byproducts.
Yes, thank you for clarifying that. I've tried to clarify it for people before, but your explanation
is much better. People tend to assume that "refinery gain" comes from adding hydrogen, but that's
not generally true - in most cases it comes from removing carbon, ie "coking". Refineries prefer
to do it that way because hydrogen is very expensive, and petroleum coke is a valuable product.
In either case, the EROEI is much less than unity - in the case of coking, it is less than zero.
If the refinery is breaking H-C bonds in the hydrocarbon chain molecule and producing free
C (which you call coke), then the liquids produced have shorter chain molecules (total number
of carbons reduced). Fewer H-C bonds mean lower energy. So using catalytic cracker that produces
coke removes energy from the resulting liquid.
My claim of lower net energy in the oil product still stands regardless of refining method.
In either case refinery gains should not be counted as energy production.
The US has refinery process gains of over one million barrels per day. That is almost as much
as the rest of the world combined. They have to be counting refinery process gains on imported
oil.
That is correct. The EIA is counting "refinery gain" on imported oil as "US oil production".
It is a totally bogus product by any standard, and the only reason I can imagine them doing it
is to artificially inflate US oil production statistics. This has to be politically motivated.
And the IEA bought into the EIA's misinformation (call it a lie) with their latest report,
which means either that they don't understand the EIA's reporting or they are complicit in the
act of overstating US production. Your choice...
There is an addition factor which the EIA is not going to want to make clear. US oil imports
are increasingly coming from Canada, and most Canadian oil production is now from the oil sands
as Canadian conventional oil production declines and oil sands production increases. Canada now
exports more oil to the US than it consumes itself.
The product which is exported is mostly bitumen, which is not "tar" as some people would have
you believe, but it is about the heaviest grade of oil you can buy. Midwest oil refineries no
longer have sufficient domestic oil to keep running, but there is lots of Canadian bitumen and
it is very cheap to buy (although not to produce). They upgrade it using coking, and make a ton
of money turning it into gasoline.
Despite the fact that the EROEI of coking is negative (there is an energy loss), there is a
huge refinery gain in going from very heavy bitumen to much lighter gasoline. The EIA counts this
as "US oil production" despite the fact it comes from the Canadian oil sands and involves a net
loss of energy.
That's another factor in the huge "refinery gain" the EIA and therefore the IEA is counting
in predicting the US will exceed Saudi oil production. It's not really oil, in physical terms
it's some kind of an extreme vacuum, or a form of negative energy.
Furthermore, importing extra heavy oil from Canadian bitumen (aka, tar for those who don't
understand that tar is derived from coal) sands requires the addition of some dilutant to the
mix to reduce the viscosity enough to allow the mix to flow thru pipelines. Looking quickly at
the EIS for the Keystone XL pipeline from the US State Department, one learns that the chemical
makeup of those dilutants are company proprietary information. It's likely that these are made
up of lighter fractions of crude oil, such as naphtha or even some NGPLs. The fractions with the
lowest boiling point temperature would most likely be mixed in during the coldest months of the
year when the oil would be most viscous.
The source of those dilutants is unknown, but there have been comments about building a pipeline
from the US to Alberta to provide those chemicals. If this is done, the dilutants would be (are?)
added to the export column of the EIA data, but would then be returned to the US along with the
heavy oil and then recovered at some point during the refining process. The result could be like
a loop within which (almost) no change in the total quantity of material occurs, but which appears
as a reduction in total imports due to double counting in the EIA volume based data...
Looking quickly at the EIS for the Keystone XL pipeline from the US State Department,
one learns that the chemical makeup of those dilutants are company proprietary information.
Proprietary, shmoprietary, it's only the State Deparment that doesn't know what's in it. If
you Google, "Western Canadian Select", you'll find out more than you ever wanted to know about
it. They're trying to sell it, after all.
Western Canadian Select is a Hardisty based blend of conventional and oilsands production
managed by Canadian Natural Resources, Cenovus Energy, Suncor Energy, and Talisman Energy.
Argus has launched daily volume-weighted average price indexes for Western Canadian Select
(WCS) and will publish this index in the daily Argus Crude and Argus Americas Crude publications.
...followed by a chemical analysis of the most recent sample of it.
What is going down the pipelines is a mixture of oil sands bitumen, conventional heavy oil,
synthetic crude oil, condensate, and pentanes plus. The mixture varies from day to day. The buyers
don't really care where it came from or how it was mixed, they only care that it meets specs,
i.e. the chemical analysis is right.
There are pipelines carrying diluent from the US to Canada, and it is getting to be a big business
with the increase in Canadian bitumen and heavy oil production. There are also rail cars full
of bitumen going south, and carrying condensate and pentanes plus on the backhaul.
"Refinery gain" is definitely a misleading statistic but there is a point there. It is good
to do your own refining. Jobs, value-add, refinery gain, etc.
The big deals against oil prices are, now, the drop in (the increase) in future demand from 1.6
to 1.2%, per IEA, and the massive amount of oil that Iran is getting to lay out with unknown capital
input. Supposedly glutting the market with 1.5 million more barrels with magic, I presume. However,
I figure it, the drop in demand seems to indicate only about a 300k to 350k difference.
Ah, the magic of OPEC will prevail, then. Even though to fully ramp up more, Saudi has to drill
in the offshore area, which I am sure is NOT $10 barrel cost of production. Iraq has to end their
internal strife to gain some traction. Venezuela is sucking wind, badly. Ecuador, while not the
massive producer of other OPEC members, currently has only one well drilling from 50 something
rigs. It is hard to keep up with the news from every country, and it is clear that neither EIA
nor IEA are really putting much effort into real data accumulation. I think OPEC is strapped for
production for the next two years, with the exception of the magical production from Iran.
On the other hand, I read Canada has some smaller oil sands shut in, while larger ones are scheduling
to cut back, or have extended periods of overhaul on production equipment. As rigs for conventional
oil have dropped significantly, I fail to see were Canada will not have a decrease in production
in 2016. Over a year ago, I said the shale production could drop by over one million, but didn't
anticipate the increase before the drop. Still from the high in March of last year, it is still
projected to drop by 1.2 million by 2017 by EIA. I still thing they are low in their estimate
of the drop, but not as much as they used to be.
I read where China's production is expected to drop from 100k to 200k in 2016, base upon the current
prices and capex. A recent post by the author indicates that up to 1.5 million barrels may be
lost from in field drilling of offshore wells in 2016. All of South America, Africa, and Asia,
including Russia, expect drops in 2016, and 2016 is just the tip of the iceberg.
Where are all of these figures in the garbage the EIA and IEA put out? Far as I can tell, the
magical numbers put out for Iran, roughly match the drop in infield drilling offshore. But then
I am not an expert, because I am not paid by a highly efficient and omniscient government entity.
While what is called a prediction of non-OPEC production seems to meet the definition of the word
'prediction' it seems that the OPEC production prediction is more of what I'd call an assumption.
The methodology used to predict future OPEC production is basically as follows: world demand minus
non-OPEC production equals OPEC production. That's some pretty weak tea!
It seems to me that
there is a bunch of strange and interesting things all going on at once here, several of which
are as follows; global peak oil production occurring as we speak is significantly probable, the
price of oil is low, Cushings is full of condensate but the market calls it crude and it drops
the price of crude, imports of crude to USA have recently increased despite 'the glut', Saudi
is likely producing flat out yet production is down month over month for 6 of the last 7 months,
upstream investment is down 2 years in a row, demand is up, production is going to decrease. I
don't know exactly how it's gonna play out but whatever it is the word 'train wreck' is likely
an apt description.
As well this 'total liquids' thing bugs me. It takes energy to produce biofuels and refinery
gains. That seems like double counting to me. Like counting the global beef production once when
it's on the 1/4 of beef and once again when it's cut with pork fat and called Ukrainian Sausage,
to use Mr JJ Browns beef analogy.
I figure in a few short years it'll be pretty clear where all this is going and it'll be a
whole new paradigm aka Hobbesian scramble.
While what is called a prediction of non-OPEC production seems
to meet the definition of the word 'prediction' it seems that the OPEC production prediction is
more of what I'd call an assumption.
Jimmy says:
02/13/2016 at 6:37 pm
While what is called a prediction of non-OPEC production seems to meet the definition of
the word 'prediction' it seems that the non-OPEC production prediction is more of what I'd
call an assumption. The methodology used to predict future OPEC production is basically
as follows: world demand minus non-OPEC production equals OPEC production. That's some pretty
weak tea!
It seems to me that there is a bunch of strange and interesting things all going
on at once here, several of which are as follows; global peak oil production occurring as
we speak is significantly probable, the price of oil is low, Cushings is full of condensate
but the market calls it crude and it drops the price of crude, imports of crude to USA have
recently increased despite 'the glut', Saudi is likely producing flat out yet production
is down month over month for 6 of the last 7 months, upstream investment is down 2 years
in a row, demand is up, production is going to decrease. I don't know exactly how it's gonna
play out but whatever it is the word 'train wreck' is likely an apt description.
As well this 'total liquids' thing bugs me. It takes energy to produce biofuels and refinery
gains. That seems like double counting to me. Like counting the global beef production once
when it's on the 1/4 of beef and once again when it's cut with pork fat and called Ukrainian
Sausage, to use Mr JJ Browns beef analogy.
I figure in a few short years it'll be pretty clear where all this is going and it'll
be a whole new paradigm aka Hobbesian scramble.
I haven't seen this discussed, but my apologies if it is a duplicate. Paragon Offshore to file
Chapter 11 – is this the largest bankruptcy for offshore drillers so far?
"... If we believe that world has on average 2 Mb/d surplus for at least 18 month thats one super-large tanker full of oil/condensate a day. 30 tankers a month, 365 tankers a year (over 700 Mb a year). In other words for the total duration of oil glut period 1000 Mb or more - a billion barrels of oil - should now be stored somewhere on customer sites. ..."
"... Where on the globe such a huge oil inventory is located. And where you can store such amount physically. Not of the ground - storage costs way too much and data about ground shortage does not show such a huge built-up of inventories. Not in tankers - cost of storage is even more (~1% a month if we assume $30 per barrel average price) and number of tankers of such a size is very limited and they are very expensive. ..."
"... USA is the primary glut country , but glut oil somehow definitely did not landed here. ..."
"... It is interesting to me that those inventories shot up very quickly between 1/1/15 and 5/15 and then have bounced around for the most part since, although somewhat higher now than last spring. ..."
"... Going back an looking at EIA historical data, I dont see a very strong correlation between crude prices and US commercial inventories. ..."
"... I think traders make too big of a deal about US commercial inventories. I have never heard of any US oil producer being unable to sell crude oil from a lease because commercial crude inventories were too high. ..."
"... Our crude purchaser is not happy we have shut in some wells. They want all they can buy. Further, in our little corner of the world, two more crude buyers have entered drumming up business, which is somewhat helping our basis. This is after several years of the same purchasers, no entrants or exits from 2003-2014, suddenly there are two more chomping at the bit. ..."
"... the problem is real and quite different: the US elite is afraid to go full force into oil conservation mode and preferred to drop oil price instead, adopting Madame de Pompadour "Après nous le deluge" ("after us deluge") mentality… ..."
"... What Jeffrey Brown points out over and over is the so-called 'glut' is simply another finance industry -slash- media narrative, a pleasant lie that glosses over the fact that fuel supply is declining, that purchasing power is declining along with it and that no easy solutions to these declines exist. The only solution is stringent conservation… ..."
"... Another noble lie in best Leo Strauss style, so to speak. See http://peakoilbarrel.com/collapse-of-shale-gas-production-has-begun/#comment-558479 ..."
The last few years have been very interesting in that when prices were high we saw non OPEC
producers going as hard as they can to produce oil, and now that prices are low we're seeing
OPEC members going as hard as they can to produce oil. In the non OPEC group it was Canada
and USA with the big gains. In the OPEC group it's Saudi Arabia and Iraq. This gives us a rough
indication of whose got what in their hand. Perhaps what a competitive card player/gambler
might call 'a tell'.
A real "tell". Why they are increasing production if the world is already full of unused (and
already delivered somewhere) oil? Because they are still able to sell it despite "glut".
If we believe EIA and friends it is impossible to consume all this oil. So it's the customer
who pays and then is hoarding all this cheap oil.
But the problem is that the cost of private storage is pretty high those days, especially in
the USA and ordinary companies and refineries can get only losses out of such strategy: "…limited
crude oil storage facilities caused crude oil storage costs to rise to $0.90 per barrel on February
9, 2016-compared to $0.10 per barrel in August 2015. " (
https://marketrealist.com/2016/02/crude-oil-storage-costs-rose-9-times-us-crude-oil-tests-new-limits/
)
If we believe that world has on average 2 Mb/d surplus for at least 18 month that's one
super-large tanker full of oil/condensate a day. 30 tankers a month, 365 tankers a year (over
700 Mb a year). In other words for the total duration of oil glut period 1000 Mb or more - a billion
barrels of oil - should now be stored somewhere on customer sites.
Where on the globe such a huge oil inventory is located. And where you can store such amount
physically. Not of the ground - storage costs way too much and data about ground shortage does
not show such a huge built-up of inventories. Not in tankers - cost of storage is even more (~1%
a month if we assume $30 per barrel average price) and number of tankers of such a size is very
limited and they are very expensive.
USA is the primary "glut country", but "glut oil" somehow definitely did not landed here.
EIA does not see any increase in storage in the USA since March 2015:
Europe is the same. Only China remains - it did bought some oil for strategic reserves
"The IEA says that in the first quarter the gap between China's measure of demand and
supply stood at 650,000 barrels a day – equivalent to storing 58m barrels over the three-month
period."
OK. let's assume that china absorbs 0.5 Mb/d from this glut. So we still have 1.5Mb/day glut
left.
Where are those volumes? Does this make the hypothesis of 2 MB/d "oil glut" completely absurd?
That means that all this period of sharply dropping oil prices supply and demand of physical oil
were pretty finely balanced and Iraq and Saudis were recruited to avoid shortages of physical
oil, which would spoil the whole game. If this is true, then "oil glut" existed only in "paper
oil". In other words it was artificially created. Or I misunderstand something ?
BTW Russians now feel they were taken for a ride by "casino capitalism" sharks. Below are laments
of hapless Rosneft top honcho Igor Sechin:
Oil price forecast as an instrument for oil price manipulation. Edited Google translation.
Originally from http://izvestia.ru/news/603843
In his today's speech at International Petroleum Week in London 2016 the President of the
Russian oil giant "Rosneft" Igor Sechin said that panic forecasts are a part of a selfish game
of market participants who are engaged in the game of artificial suppression of oil prices.
According to Sechin, financial market players are ready to "test" any and all levels of
oil prices, informs "RIA Novosti". "I must admit that we underestimated the fact that financial
market participants do not know any restrictions in their greed and are ready to "test" any
oil price levels - $27 in January and now down to $10 per barrel as recently forecasted by
one of the major banks. But this is nothing but "an irresponsible game" designed to fleece
oil producers said Sechin.
In the morning on the London stock exchange the price of barrel of Brent crude fell $2.5
to $30,5 for barrel.
"If we believe that world has on average 2 Mb/d surplus for at least 18 month"
According
to the EIA, the surplus exceeded 2 mb/d only in 2Q15.
The average surplus for 2015 was 1.85 mb/d, for a total of 675 million barrels.
The accumulated surplus since the beginning of 2014 is 995 million barrels.
World oil stock change & balance (global liquids supply – global liquids consumption), mb/d
Source: EIA STEO February 2016
"EIA does not see any increase in storage in the USA since March 2015"
According to the EIA,
from March 2015 to January 2016, the U.S. commercial inventory increased by 125 million barrel.
Over the period 2014-2015, the OECD commercial inventories of crude oil and refined products
increased by 493 million barrels, including 277 mbbl in the U.S. and 216 mbbl in other OECD
countries.
In January 2016, total OECD commercial inventories amounted to 3066 million barrels, of
which the U.S. acounted for 1342 million barrels.
The U.S. Strategic Petroleum Reserve remained flat at around 695 million barrels.
So the OECD in-land storage absorbed about a half of total estimated global surplus over
the period 2014-2015.
The rest is the increase in commercial and strategic inventories in China, other oil-importing
non-OECD countries, oil exporting non-OECD countries, floating storage, and the so called "balancing
items".
OECD Commercial Inventory (million barrels)
Source: EIA STEO February 2016
BTW who you think made such a huge blunder paying quite a lot of money for useless stock
(for at least another two years) plus storage fees and why ? We need to know the names of our
heroes.
Even more interesting question is who paid for other 430 Mb ? With their set of financial
problems (which include Greece, and other Southern states) all money in Europe are needed to
bail out banks. Europeans now are scroogy as hell and they definitely are not inclined to buy
useless oil. They have reliable suppliers. Only Germany has some money but they don't do such
stupid things. They have a direct pipeline from Russia. French? This would be a good joke.
They barely found money for barter with Iranians 0.2Mb/d supplies (or less) in exchange of
Iran buying several Eurojets. GB? They have their own production which is suffering huge losses
and no money.
Something is fishy here. Looks like we have several agencies under one roof in EIA each
of which produces its own set of data. In humans such condition is a symptom of schizophrenia
In no way this is "Commercial inventory" for the USA.
Those figures from EIA include strategic reserve (which is around 695 Mb; nobody knows exactly
as caverns might be leaking).
Commercial crude inventories as of Feb 5,2016 are around 500 Mb. So we should have around 1200Mb
as of today with SPR. Why EIA reports higher numbers I do not know.
On November 13, 2001, President George W. Bush ordered the SPR to be filled to approximately
700 million barrels by continuing to use the royalty-in-kind program carried out jointly between
the Department of Energy and the Department of the Interior. The royalty-in-kind program applied
to oil owed to the U.S. government by producers who operate leases on the federally-owned Outer
Continental Shelf. The producers are required to provide from 12.5 percent to 16.7 percent
of the oil they produce to the U.S. government. Under the royalty-in-kind program, the government
could either acquire the oil itself or receive the equivalent dollar value. (Note: in September
2009, the Department of the Interior announced the cancellation of the royalty-in-kind program
but honored its commitments in existing contracts. The SPR's final cargo of December 25-27,
2009, was royalty-in-kind crude oil.)
Faced with the choice between changing one's mind and proving that there is no need to do so,
almost everyone gets busy on the proof. So I am not surprised at your reaction.
Let's begin from the very beginning.
1. There is a claim that there is a huge, unpalatable world oil glut around 2Mb/d or 60 Mb/month
or 700 MB/year, give or take 100 Mb. And that this glut caused sharp drop of oil prices due lack
of "price elasticity" - the theory taken from neoclassical economics bible.
2. Due to this we need to see a rapid increase of commercial oil inventories which somehow
currently in the USA are around 500 Mb and did not grow substantially from March-April 2015.
As the USA was the country that caused "oil glut", this effect should be pronounced in the
USA crude oil inventories (moreover there was an export ban on raw oil until recently).
3. If we assume that some idiot bought this oil and stored commercially that does not mean
that there are bigger idiots who refine this oil losing even more money. So refined products,
ethanol, etc which are included in EIA figure 1,337,939 ("Total Crude and refined products excluding
SPR") for Feb 05 (which you love so much) are of no interest here. We should use only "Crude oil
commercial inventories" which are, I would like to stress again, around 500Mb as of 02/05/2016.
And they were already 471.444 MB on Mar 28, 2015. Rising only around 29 Mb for 10 month period
or 2.9Mb/month or 0.09Mb/d. And God knows how much of this oil was bought for arbitrage.
4. So logically the "oil glut" should result in a rapid growth of commercial oil inventories.
Reading with interest your debate about US crude oil commercial crude oil stocks.
It is interesting to me that those inventories shot up very quickly between 1/1/15 and
5/15 and then have bounced around for the most part since, although somewhat higher now than last
spring.
Going back an looking at EIA historical data, I don't see a very strong correlation between
crude prices and US commercial inventories.
Further, shouldn't world inventories be much more important than US commercial? What countries
have SPR's? Couldn't a country or group of them strategically empty some from a large SPR and
store it in this US?
I think traders make too big of a deal about US commercial inventories. I have never heard
of any US oil producer being unable to sell crude oil from a lease because commercial crude inventories
were too high.
Our crude purchaser is not happy we have shut in some wells. They want all they can buy.
Further, in our little corner of the world, two more crude buyers have entered drumming up business,
which is somewhat helping our basis. This is after several years of the same purchasers, no entrants
or exits from 2003-2014, suddenly there are two more chomping at the bit.
Anecdotal I know, but I still question why have been so volatile. I understand clueless's musical
chair example. But come on, there isn't hardly anything that works at $10-25 oil. Do the traders
have info we don't re worldwide production and inventories?
US inventories 2011-2014 were generally higher than 1998-1999 I believe. When it comes to the
huge importance of US commercial crude inventory on the worldwide crude price, I am more clueless
than Clueless.
I still question why [oil price] have been so volatile.
So am I. And I also do not have an answer. But what I suspect is that "glut/deficit" model
of oil price volatility based on balance of supply and demand as reported by agencies like EIA
is not valid anymore.
"Casino capitalism" model looks to me more and more plausible: price of oil in short and medium
term now is detached from the volume of production and inventories and is determined purely via
"paper oil" bought and sold in financial casino. The "glut/deficit" model is still valid in a
long run, but "in a long run we are all dead" and there can be multi-year discrepancies between
behavior of prices and behavior of supply and demand.
In other words a sharp drop of oil prices now in possible with zero or minimal glut, or glut
in a different category of petroleum products - for example condensate (as "Great Condensate Con"
hypothesis suggests).
That's what I tried to demonstrate in my discussion with Alex - the dynamics of cruse inventories
in the USA from April 2015 to Jan 2016 does not support hypothesis of correlation of oil prices
with supply/demand dynamics. We saw a huge price drop with rather stagnant commercial crude oil
inventories in the USA.
Since late 1990th the volume of "paper oil" contracts far (by orders of magnitude) exceeds
volume of physical oil and tail is wagging the dog. Oil producers are now hostages of financial
casino, pawns, not an independent players like they were in "good old days" before deregulation
of financial industry (https://en.wikipedia.org/wiki/Commodity_Futures_Modernization_Act_of_2000
)
As I have occasionally opined, you are talking about Crude + Condensate (C+C) inventories.
As US C+C inventories increased by 100 million barrels from late 2014 to late 2015, US net
crude oil imports increased from 6.9 million bpd to 7.3 million bpd (four week running average
data for last four weeks of 2014 & 2015). Most people by now know what my explanation is, but
here is a link to a post on condensate versus crude that the folks at Oilpro.com asked me to put
together:
Jeffrey. I read your Oilpro article. I like that website. Has some good content.
I read a report from the American Oil Pipeline Association that crude oil pipeline mileage
in the US increased from 49K miles in 2004 to 61K miles in 2013. I haven't been able to find 2014
and 2015 mileage statistics.
I believe EIA includes crude in pipelines as storage.
Does anyone have information as to how much "crude oil storage" has been added by crude oil
pipelines since 2004?
Not yet. Or only in a sense "The road to hell is paved with good intentions".
The article is just fear mongering. But the problem is real and quite different: the US elite
is afraid to go full force into oil conservation mode and preferred to drop oil price instead,
adopting Madame de Pompadour "Après nous le deluge" ("after us deluge") mentality…
What Jeffrey Brown points out over and over is the so-called 'glut' is simply another finance
industry -slash- media narrative, a pleasant lie that glosses over the fact that fuel supply
is declining, that purchasing power is declining along with it and that no easy solutions to
these declines exist. The only solution is stringent conservation…
Repeating after Steve: "so-called 'glut' is simply another finance industry/media narrative".
"... I don't see how shale production, with it's rapid decline rate and high costs, can act as a cap on the price of oil. Wouldn't it be more likely that foreign producers with lower costs for production will keep a cap on the price of oil? ..."
"... I think oil price will remain somewhat volatile over the next decade since it is heavily tied to transport. ..."
"... However, in a way the oil industry people may be correct in the long run. Every time the price of fuels go up, society will make more permanent changes to reduce the use of those fuels. So the long term outlook for the oil industry is downhill. Short term, probably not. ..."
"... Rep. Jared Huffman (D-CA) introduced the Keep It in the Ground Act on Thursday. Under the bill, there would be no new leases for extraction of fossil fuels - such as coal, oil, and gas - on all federal lands. ..."
"... Don't worry, none of this "keep it in the ground" noise will last very long. When prices go back up, and when peak oil ceases to be called a theory, then the "keep it in the ground" folks will be looking for a hole in the ground to hide. ..."
...THE OIL INDUSTRY GOT TOGETHER AND AGREED THINGS MAY NEVER GET BETTER
"The thousands of attendees seeking reasons for optimism didn't find
them at the annual International Petroleum Week. Instead they were greeted
by a cacophony of voices from some of the largest oil producers, refiners
and traders delivering the same message: There are few reasons for optimism.
The world is awash with oil. The market is overwhelmingly bearish."
"Producers are bracing for a tough year. Prices will stay low for
up to a decade as Chinese economic growth slows and the U.S. shale industry
acts as a cap on any rally"
Doug,
I don't see how shale production, with it's rapid decline rate and
high costs, can act as a cap on the price of oil. Wouldn't it be more likely
that foreign producers with lower costs for production will keep a cap on
the price of oil?
I think oil price will remain somewhat volatile over the next decade
since it is heavily tied to transport. As that scenario changes, oil
production will be in natural descent anyway so alternatives and efficiency
might just be playing catch-up for quite a while.
However, in a way the oil industry people may be correct in the long
run. Every time the price of fuels go up, society will make more permanent
changes to reduce the use of those fuels. So the long term outlook for the
oil industry is downhill. Short term, probably not.
Struggling oil and gas companies are maxing out revolving credit lines
typically used to cover short-term funding gaps, raising fresh concerns
about banks' exposure to the decline in energy prices.
And yet the oil industry seems to think prices will stay low for the
next decade.
Just another indicator of economic downturn, CSCL has warned of loss.
"China Shipping Container Lines (CSCL) has issued a profit warning announcing
an expected loss of RMB 2.8 billion (USD 425 million) for the financial
year ending December 31st."
Rat's congressman proposes Stranded Assets International Bioreserve
Rep. Jared Huffman (D-CA) introduced the Keep It in the Ground Act
on Thursday. Under the bill, there would be no new leases for extraction
of fossil fuels - such as coal, oil, and gas - on all federal lands.
It would also stop new leases for offshore drilling in the Pacific and the
Gulf of Mexico and prohibit offshore drilling in the Atlantic and Arctic
Oceans.
Don't worry, none of this "keep it in the ground" noise will last very
long. When prices go back up, and when peak oil ceases to be called a theory,
then the "keep it in the ground" folks will be looking for a hole in the
ground to hide.
"... When I look at the world total liquids production chart, it looks like production dropped from about 96.7mmbls/d in summer 2015 to about 95.1mmbbls/d in January – a drop of roughly 1.5 mmbbls/d from peak. ..."
"... That's a decline of 1.51 million barrels per day from August to January. I am sure that is not exactly accurate because all the January numbers are not in yet but I would think that it is pretty close. I am not really shocked by those numbers. ..."
When I look at the world total liquids production chart,
it looks like production dropped from about 96.7mmbls/d in summer 2015 to about 95.1mmbbls/d in
January – a drop of roughly 1.5 mmbbls/d from peak. Do you think this is accurate? If not, how
accurate do you think those numbers are?
That's a decline of 1.51 million barrels per day from August to January. I am sure that is
not exactly accurate because all the January numbers are not in yet but I would think that it
is pretty close. I am not really shocked by those numbers.
I am not really shocked by their projection through the end of 2017 either. But I just flat
don't believe those numbers at all.
Iran is now directly competing with Saudi in Europe regarding oil sales. A Bloomberg report earlier
this week revealed some concrete data showing that Europe is a key battleground in the market share
struggle between Iran and Saudi. From that report: "The most competitive pricing compared with Saudi
Arabian supply in 21 months underscores its intention to win back market share." [emphasis my own]
Iran Heavy oil, one of the Islamic Republic's primary export grades, will cost $1.25 less than Saudi's
most similar crude in March, releases from Iran's NIOC and Saudi Aramco both show.
During sanctions, Iran supplied Turkey and continued publishing prices for Europe. Iran's most recent
discount will be the steepest against the Saudi grade since June 2014, Bloomberg reported. Iran is
also giving steeper discounts for Iran Heavy grade in Asia.
Iran is preparing to boost oil exports by 1 M/bpd this year, and is also getting ready to introduce
a new heavy grade as it adds production, Bloomberg reports.
Marketers with Iran's NIOC can go after more than 500,000 barrels of lost daily sales in Europe alone,
Bloomberg reports, now that sanctions, which limited Iran's oil sales to six buyers (China, India,
Japan, South Korea, Taiwan and Turkey), have ended.
How young, arrogant Saudi price took other OPEC members hostage...
Notable quotes:
"... I think Saudi Arabia pushed for a strategy that will go down as one of the greatest mistakes in OPEC's history. It was a decision, I might add, that 9 of the 13 OPEC members reportedly oppose. ..."
"... But I believe they failed to fully appreciate the risk in that strategy. If the higher cost producers slash costs in an attempt to survive (which they undoubtedly would), OPEC could suffer through a period of much lower prices. That is in fact what has happened. ..."
"... OPEC has claimed several times that their strategy is working because U.S. shale oil production is falling. But the only way the strategy actually works is for OPEC to get back to the cash flow levels they had prior to 2014. They are a very long way from achieving that. ..."
"... The one big thing they have going for them is that they still control 72% of the world's proved crude oil reserves - 1.2 trillion barrels. If they ultimately manage to sell those barrels and earn a few dollars more per barrel as a result of their current strategy, it could amount to trillions of dollars ..."
Some have argued that OPEC had no choice but to defend market share instead of cutting
production to balance the market, but I disagree. I think Saudi Arabia pushed for a strategy
that will go down as one of the greatest mistakes in OPEC's history. It was a decision, I might
add, that 9 of the 13 OPEC members reportedly oppose.
... ... ...
At the time of their decision, the global markets were probably oversupplied by 1-2 million
bpd. If OPEC had merely decided to remove 2 million bpd off the world markets - only 5.5% of the
group's combined 2014 production - the price drop could have easily been arrested and maintained
in the $75-$85/bbl range. That would have still given them 38.9% of the global crude oil market.
For that matter, a production quota cut of 13% could have removed from the market a volume
equivalent to all of the U.S. shale oil production added between 2008 and 2014. (Whether the
Saudis could have actually enforced those quotas is another matter).
Why didn't they opt for that course of action?
Don't get me wrong, I understand why they did what they did. I just don't think it was necessary.
They were obviously concerned that the shale oil boom would continue to expand, with production
not only continuing to grow in the U.S. but in other countries with shale oil resources. It was a
legitimate concern, but I think the shale oil boom in the U.S. would have peaked in a few years.
Further, I am not sure any other country will see the same level of success in shale drilling for
various reasons. Some will succeed, but I don't expect they will manage to add millions of
barrels per day of new oil production in just a few years.
It was going to be a gamble either way, but I think it would be more likely that a combination of
growing global demand and a shale boom that couldn't continue to expand at the rates seen from
2008 to 2014 would have ultimately shifted power back to them after perhaps a couple of rounds of
production cuts.
OPEC of course reasoned that it didn't make sense that they, the low cost producer, should cut
production which would prop up higher cost producers. After all, that does seem backwards.
But I believe they failed to fully appreciate the risk in that strategy. If the higher cost
producers slash costs in an attempt to survive (which they undoubtedly would), OPEC could suffer
through a period of much lower prices. That is in fact what has happened.
OPEC has claimed several times that their strategy is working because U.S. shale oil
production is falling. But the only way the strategy actually works is for OPEC to get back to
the cash flow levels they had prior to 2014. They are a very long way from achieving that.
Should OPEC go on to gain back market share, and should they manage to maintain higher margins as
a result, their strategy could pay off in the long run. The one big thing they have going for
them is that they still control 72% of the world's proved crude oil reserves - 1.2 trillion
barrels. If they ultimately manage to sell those barrels and earn a few dollars more per barrel
as a result of their current strategy, it could amount to trillions of dollars. (Note that
because proved reserves are a function of price and available technology, their reserves
estimates may plummet back to what can be produced economically at a price of $30/bbl. That will
nullify much of Venezuela's heavy oil reserves).
If OPEC's strategy does ultimately pay off, it will be many years before it does so. It will
require a huge recovery in the price of oil. It won't be easy for them to earn back the trillion
dollars in foregone revenue for 2015 and 2016. At this moment in time, it is hard to conclude
that it was anything other than a big, costly miscalculation on their part. I also expect that's
what the history books will eventually say.
Economic hopes are rising in Armenia that the country can serve as a trade conduit for Iran now
that international sanctions against Tehran are being lifted.
Armenia has
long-standing
ties to Iran, and is a member
of the Russia-led Eurasian Economic Union (EEU), a factor that potentially increases its attractiveness
as a trade partner for Tehran. Yerevan is "an important avenue for both Iran to export through Armenia
into that large combined market [EEU], and as a platform for Western engagement in the now opening
Iranian market," noted Richard Giragosian, director of the non-governmental Regional Studies Center
in the Armenian capital, Yerevan.
The World Bank's country director for Armenia, Laura Bailey, told RFE/RL's Armenian service in
January that stalled energy partnerships
between Iran and Armenia could be the first sector to take off.
Indeed, National Iranian Gas Exports Company Managing Director Alireza Kameli announced on February
7 that Iran is considering increasing five-fold the 1 million cubic meters of gas it sends daily
to Armenia, state-run Iranian media reported. At the same time, plans for a new power line to increase
Armenia's electricity exports to Iran are developing.
The gas deal appears to fit into a larger, regional scheme. In December, quadripartite talks took
place during which Armenia, Iran, and the Black Sea countries of Georgia and Russia agreed to establish
a coordinating group on establishing an energy corridor linking the four countries.
"We should spare no efforts to connect the Persian Gulf with the Black Sea [via Georgia, Armenia's
northern neighbor]," Iranian President Hassan Rouhani told his Armenian counterpart, Serzh Sargsyan
in a January 24 phone conversation, Iran's MehrNews agency reported.
Negotiations already have occurred between Iran and the Georgian government about sending Iranian
gas to Georgia via Armenia, Iranian state media reported Kameli, the Iranian gas official, as saying
in early January.
Some Armenian experts are tempering their optimism with caution. Russian-owned companies control
an estimated 80 percent of Armenia's energy sector. Energy giant Gazprom runs the gas pipelines from
Iran and on to Georgia, and it tends to look askance at competitors who might try to muscle in on
their markets. At the same time, no clear sign has emerged that Moscow opposes an increase in Iranian
gas exports to Armenia. The Sputnik news agency, a Kremlin mouthpiece, promptly reported Kameli's
announcement on February 7.
Iranian affairs specialist Armen Vardanian at Yerevan's Armenian Institute of International and
Security Affairs believes that "Russia will embrace the projects that will not contradict its national
interests."
That means that most of produced petroleum liquids produced in the USA are condensate.
Notable quotes:
"... Im estimating that global crude oil production* was about 69 million bpd in 2005 and 68 million bpd in 2014. I would assume around 69 million bpd for 2015. Global total liquids production was 85 million bpd in 2005 and apparently about 96 million bpd in 2015. ..."
"... I estimate that actual global crude oil production, as a percentage of total liquids, fell from about 81% in 2005 to about 72% in 2015. ..."
"... In regard to the US, I estimate that actual crude oil as a percentage of total liquids fell from about 57% in 2005 (4.7/8.3) to about 49% in 2015 (7.3/14.8). ..."
"... since most hydrocarbon liquids are close to the (CH2)n formula, the energy content/pound is fairly constant (roughly 17,000 BTU/lb). ..."
"... Please note that while the number of BTUs per unit of weight is equal for condensate and oil, the energy content per unit of volume (barrel) is not. It is approximately 12% lower for condensate (on average). So when you measure total production in volume units not weight units, and most of your production is condensate you inflate the amount of energy extracted. With 50/50 mix of oil and condensate the inflation is around 6%. That means that to get proper comparison with, for example, Europeans data where most production is Brent crude or heavier, you need to multiply US data with factor 0.96 or so to equalize the energy content. That also imply that any claim of world petroleum liquids production glut using volume comparison is unscientific. And any claim about oil glut which is less then 1% of total volume of petroleum liquids produced (around 1 Mb/d) is pure propaganda. ..."
"... What Jeffrey Brown points out over and over is the so-called glut is simply another finance industry -slash- media narrative, a pleasant lie that glosses over the fact that fuel supply is declining, that purchasing power is declining along with it and that no easy solutions to these declines exist. The only solution is stringent conservation… ..."
"... Repeating after Steve: so-called glut is simply another finance industry/media narrative . Or, if you wish, another noble lie in Leo Strauss style. See http://peakoilbarrel.com/collapse-of-shale-gas-production-has-begun/#comment-558479 ..."
"... Looks like the US elite is afraid to go full force into oil conservation mode and was unhappy with secular stagnation of the economy. It preferred to drop oil price to solve the problem of secular stagnation or at least to postpone the day of reckoning: yet another financial crash which is immanent under neoliberalism, but which might undermine their political power. ..."
"... Instead, Obama administration adopted Madame de Pompadour Après nous le deluge ( after us deluge ) mentality… ..."
"... Also the mix of refined products you get from the unit of weight of each type of oil is different and you can never get even close in the amount of aviation kerosene and diesel from condensate as from WTI or Brent. ..."
"... Diesel became used for a reason. Ditto jet fuel. Problems arose that were only solvable by changing to that fuel. There's a sort of overly glib presumption that energy content for condensate is only down and not zero, applied to . . . not a diesel engine but to the problem addressed by the diesel engine. ..."
"... Oil is found as a liquid phase fluid in the reservoir, while condensate is found in the gas phase in the reservoir under static conditions. "Some oil people" isn't the right description. Petroleum engineers consider the initial conditions and composition of the hydrocarbon system to define how it would behave under different development and operating schemes. These groupings you listed are a very sensible and technically sound system to describe system behavior as the reservoir is produced. ..."
"... For the non specialist the separation of the crudes by API will do. Use 45 degrees, it seems to do the job. And don't worry too much about the other details. As we can see, even petroleum engineers can get s bit lost in this area, which is mostly the purview of hard core reservoir engineers and process equipment designers. ..."
"... The important point was energy per unit mass is the same. In Nicolas view if we are concerned about energy just look at mass produced. I agree. ..."
"... At high pressures, as found in gas reservoirs, things don't work the same as at atmospheric pressure on the earth's surface. There is a phenomena known as retrograde condensation where as the pressure is reduced at constant temperature, liquid condenses out of the gas (.e. condensate). If the pressure is further reduced then it will start evaporating again (which is what we are used to seeing). ..."
"... If the gas is cooled at the same time (which happens naturally when gas is let down in pressure with no heat source present, or if it cools from the hotter reservoir to ambient conditions, say in a pipeline) then there is relatively more liquid formed. In the past condensate was sometimes called drip gas as it dripped out of pipelines from a combination of these effects. ..."
Hopefully somebody handy with a calculator will try to figure out roughly how much of total world
production consists of condensates, natural gas liquids biofuels, etc.
I'm estimating that global crude oil production* was about 69 million bpd in 2005 and 68 million
bpd in 2014. I would assume around 69 million bpd for 2015. Global total liquids production was
85 million bpd in 2005 and apparently about 96 million bpd in 2015.
So, I estimate that actual global crude oil production, as a percentage of total liquids,
fell from about 81% in 2005 to about 72% in 2015.
In regard to the US, I estimate that actual crude oil as a percentage of total liquids
fell from about 57% in 2005 (4.7/8.3) to about 49% in 2015 (7.3/14.8).
I was chatting with my Norway niece (Nicole/Nikki) this morning and, I recalled, you were
asking about the distinction between "oils" and their relative energy value. Remember, I'm 75
now and the grey cells are evaporating rapidly but we had a decent connection so this is (basically)
her comment: all errors mine.
She said that any distinction between oil and condensate is artificial and arbitrary. They're
both crude in that compositions are whatever came from the well with no processing other than
simple separation. Apparently some oil people simply use five classifications for reservoir fluids:
black oil, volatile oil, retrograde gas-condensate, wet gas, and dry gas. And, since most
hydrocarbon liquids are close to the (CH2)n formula, the energy content/pound is fairly constant
(roughly 17,000 BTU/lb).
Really heavy crudes can be difficult to refine because they're more likely to be contaminated
with sulfur and heavy metals that can poison refinery catalysts, they're hard to pump, they can
leave fouling on the process equipment, and they need more processing (cracking, reforming, alkylation)
to produce light fuels (gasoline, diesel, jet fuel). According to her, the bigger concern would
be the percentage of heavy industrial gunk which is useful only for big power plants, ships, and
industrial furnaces or even road asphalt.
When she got into C12+ hydrocarbons, aromatics, benzene rings, alkenes and branched isomers
I got bored and asked about her new boyfriend. Is that any use?
Please note that while the number of BTUs per unit of weight is equal for condensate and oil,
the energy content per unit of volume (barrel) is not. It is approximately 12% lower for condensate
(on average). So when you measure total production in volume units not weight units, and most
of your production is condensate you inflate the amount of energy extracted. With 50/50 mix of
oil and condensate the inflation is around 6%. That means that to get proper comparison with,
for example, Europeans data where most production is Brent crude or heavier, you need to multiply
US data with factor 0.96 or so to equalize the energy content. That also imply that any claim
of world petroleum liquids production glut using volume comparison is unscientific. And any claim
about "oil glut" which is less then 1% of total volume of petroleum liquids produced (around 1
Mb/d) is pure propaganda.
What Jeffrey Brown points out over and over is the so-called 'glut' is simply another finance
industry -slash- media narrative, a pleasant lie that glosses over the fact that fuel supply
is declining, that purchasing power is declining along with it and that no easy solutions to
these declines exist. The only solution is stringent conservation…
Looks like the US elite is afraid to go full force into oil conservation mode and was unhappy
with "secular stagnation" of the economy. It preferred to drop oil price to solve the problem
of "secular stagnation" or at least to postpone the day of reckoning: yet another financial crash
which is immanent under neoliberalism, but which might undermine their political power.
Instead, Obama administration adopted Madame de Pompadour "Après nous le deluge" ("after us
deluge") mentality…
Also the mix of refined products you get from the unit of weight of each type of oil is different
and you can never get even close in the amount of aviation kerosene and diesel from condensate
as from WTI or Brent.
See Jeffrey Brown's post about rejection of some blends by US refineries for details.
When she got into C12+ hydrocarbons, aromatics, benzene rings, alkenes and branched isomers
I got bored and asked about her new boyfriend. Is that any use?
Well, compared to colliding
black holes and gravitational waves, and E=MC^2, organic chemistry is pretty cut and dried…
Diesel became used for a reason. Ditto jet fuel. Problems arose
that were only solvable by changing to that fuel. There's a sort of overly glib presumption that
energy content for condensate is only down and not zero, applied to . . . not a diesel engine
but to the problem addressed by the diesel engine.
The volume/weight thing is a pretty big deal, too. Fuel tank capacity is not defined by weight.
Sorry, but Nicole is wrong. Oil is found as a liquid phase fluid in the reservoir, while condensate
is found in the gas phase in the reservoir under static conditions. "Some oil people" isn't the
right description. Petroleum engineers consider the initial conditions and composition of the
hydrocarbon system to define how it would behave under different development and operating schemes.
These groupings you listed are a very sensible and technically sound system to describe system
behavior as the reservoir is produced.
For the non specialist the separation of the crudes by API will do. Use 45 degrees, it seems
to do the job. And don't worry too much about the other details. As we can see, even petroleum
engineers can get s bit lost in this area, which is mostly the purview of hard core reservoir
engineers and process equipment designers.
Nicole responds: "With respect, the term black oil is particularly imprecise and context-dependent;
to a reservoir simulation engineer like me, that means the simplifying assumption that the fluid
can be characterized by only two components, one of which can exist in only one phase whose properties
we can characterize the other component dissolves in that phase; that phase is black as in "black
box", not color. Usually the non-partitioning phase is the heavy component (separator oil may
contain dissolved gas, but the gas phase contains no oil), but it works the other way, too (separator
gas can contain condensate vapor, but condensate can dissolve no gas). When it's applicable, the
black-oil assumption saves "lots" of computational effort."
It seems if we are interested in the amount of
liquid energy produced in terms of exajoules we would pay attention to the tonnes of liquids produced
and just convert to Exajoules.
So for oil consumption data in BP's Statistical Review of World energy we would focus on the
data by weight and use a conversion to Joules (or Exajoules).
One billion metric tonnes of oil equivalent are about 41.87 EJ.
Chart below with World Liquids consumption in Exajoules per year using BP Statistical Review
of World Energy 2015.
Nicole left for her bi-monthly platform tour so I'll say if you stick to weight when doing your
rough oil/condensate energy conversions your numbers will be OK. My Proviso: I'm NOT an oil guy.
Don't include NG though, which is mostly methane (22,000 BTU/lb) ????
You know far more than me, just from your conversations with Nicole, and I believe
you are also a geophysicist, and have worked in the industry. You may not be up to date on the
latest oilfield tech, but you are very knowledgeable nonetheless.
The "liquids" are biofuels, NGL, and C+C in my chart. Methane is not included.
Barrels, BTU's, mcf, CMO, enough dungpiles -- Save us. Remember
http://www.theoildrum.com/node/2320.
Real Energy, as in MT, Calories, EJ would be so clear.
Nicole is still wrong. She answered the point I made with a rather pedantic point which failed
to address my comment: the distinction between oil and condensate is whether they are found in
the liquid or gas phase in the reservoir. Condensate is found as a gas in the reservoir. The distinction
isn't artificial nor is it arbitrary. She has a bit to learn, probably because she's too much
into her specific experience. Comments in a blog have to teach the audience whenever possible.
Hers didn't.
I am a little puzzled over condensate. If it exists in the gas phase, in the reservoir with, presumably,
high pressure, how does it condense to liquid when extracted and the pressure is reduced? I would
have expected the reverse. Am I mis-understanding something, confused or just lost the thread?
At high pressures, as found in gas reservoirs, things don't work the same as at atmospheric pressure
on the earth's surface. There is a phenomena known as retrograde condensation where as the pressure
is reduced at constant temperature, liquid condenses out of the gas (.e. condensate). If the pressure
is further reduced then it will start evaporating again (which is what we are used to seeing).
If the gas is cooled at the same time (which happens naturally when gas is let down in pressure
with no heat source present, or if it cools from the hotter reservoir to ambient conditions, say
in a pipeline) then there is relatively more liquid formed. In the past condensate was sometimes
called drip gas as it dripped out of pipelines from a combination of these effects.
That was a pretty good explanation. Several years ago I had to explain the way this works to my
boss, and I resorted to explaining that a multi component system had molecules bouncing around,
and that at high pressure we saw the lighter molecules kicking the heavier ones into the gas phase
if they ever decided to settle down into a liquid. It worked.
"... Note that the global oil and gas industry spent trillions of dollars on global upstream capex after 2005, for 2006 to 2014 inclusive (on both oil and gas projects). But if it took trillions of dollars to keep us on a post-2005 "Undulating plateau" in actual global crude oil production, what happens to global crude oil production given the large and ongoing cutbacks in global upstream capex? ..."
"... My premise is that US (and perhaps global) refiners hit - late in 2014 - the upper limit of the volume of condensate that they could process if they wanted to maintain their distillate and heavier output. This resulted in a build in condensate inventories, reflected as a year over year build of 100 million barrels in US C+C inventories. ..."
"... Therefore, in my opinion the US and (and perhaps global) C+C inventory data are fundamentally flawed when it comes to actual crude oil inventory data. Note that according to Iranian sources, the bulk of their floating offshore storage consists of condensate, which they were permitted to export under the sanctions. In my opinion, this suggests that we may be seeing both a US and a global glut of condensate in storage. ..."
Global Condensate Versus Crude Oil Production Estimates
Global dry natural gas production rose from 270 BCF/day in 2005 to 335 BCF/day in 2014. In 2014,
combined US + OPEC gas production accounted for 41% of global gas production in 2014.
If the US + OPEC condensate production estimates per BCF of dry gas production are similar to
global values, it implies that global condensate production rose from about about 5 million bpd in
2005 to about 10 million bpd in 2014, an increase of about 5 million bpd. Note that global C+C production
increased from 74 million bpd in 2005 to 78 million bpd in 2014, an increase of 4 million bpd.
Of course, the foregoing implies that actual global crude oil production (45 API Gravity and lower
crude oil) declined from about 69 million bpd in 2005 to about 68 million bpd in 2014, as annual
Brent crude oil prices doubled from $55 in 2005 to $110 for 2011 to 2013 inclusive (remaining at
$99 in 2014).
Note that the global oil and gas industry spent trillions of dollars on global upstream capex
after 2005, for 2006 to 2014 inclusive (on both oil and gas projects). But if it took trillions of
dollars to keep us on a post-2005 "Undulating plateau" in actual global crude oil production, what
happens to global crude oil production given the large and ongoing cutbacks in global upstream capex?
What's Actually in Those Storage Tanks?
We have seen a large year over year increase in US and global Crude + Condensate (C+C) inventories.
For example, EIA data show that US C+C inventories increased by 100 million barrels from late 2014
to late 2015, and this inventory build has contributed significantly to the sharp decline in oil
prices.
The question is, what percentage of the increase in US and global C+C inventories consists of
condensate?
Four week running average data showed that US net crude oil imports for the last four weeks of
December increased from 6.9 million bpd in 2014 to 7.3 million bpd in 2015. Why would US refiners
continue to import large–and increasing–volumes of actual crude oil, if they didn't have to, even
as we saw a huge build in US C+C inventories? And again, what the EIA calls "Crude oil" is actually
C+C. And as noted above, based on the EIA analysis it appears that about 40% of US Lower 48 C+C production
in 2015 exceeded the maximum API Gravity for WTI crude oil, 42 API Gravity.
The most recent four week running average EIA data shows US net crude oil imports remained at
7.3 million bpd, with net total liquids imports at 5.5 million bpd, up 17% from the 2015 average
annual value of 4.7 million bpd.
I frequently cite a 2015 Reuters article that discussed case histories of refiners increasingly
rejecting blends of heavy crude and condensate that technically meet the upper limit for WTI crude
(42 API gravity), but that are deficient in distillates. Of course, what the refiners are rejecting
is the condensate component, i.e., they are in effect saying that "We don't want any more stinkin'
condensate." Following is an excerpt from the article:
In a pressing quest to secure the best possible crude, U.S. refiners are increasingly going
straight to the source.
Firms such as Marathon Petroleum Corp and Delek U.S. Holdings are buying up tanker trucks and
extending local pipeline networks in order to get more oil directly from the wellhead, seeking
to cut back on blended crude cocktails they say can leave a foul aftertaste. . . .
Many executives say that the crude oil blends being created in Cushing are often substandard
approximations of West Texas Intermediate (WTI), the longstanding U.S. benchmark familiar to,
and favored by, many refiners in the region.
Typical light-sweet WTI crude has an API gravity of about 38 to 40. Condensate, or super-light
crude that is abundant in most U.S. shale patches, ranges from 45 to 60 or higher. Western Canadian
Select, itself a blend, is about 20.
While the blends of these crudes may technically meet the API gravity ceiling of 42 at Cushing,
industry players say the mixes can be inconsistent in makeup and generate less income because
the most desirable stuff is often missing.
My premise is that US (and perhaps global) refiners hit - late in 2014 - the upper limit of the
volume of condensate that they could process if they wanted to maintain their distillate and heavier
output. This resulted in a build in condensate inventories, reflected as a year over year build of
100 million barrels in US C+C inventories.
Therefore, in my opinion the US and (and perhaps global) C+C inventory data are fundamentally
flawed when it comes to actual crude oil inventory data. Note that according to Iranian sources,
the bulk of their floating offshore storage consists of condensate, which they were permitted to
export under the sanctions. In my opinion, this suggests that we may be seeing both a US and a global
glut of condensate in storage.
In any case, here is the critical point: If it took trillions of dollars to keep us on a post-2005
"Undulating plateau" in actual global crude oil production, what happens to global crude oil production
given the large and ongoing cutbacks in global upstream capex?
"... The price of shale oil on the US market has fallen by two-thirds while production by 15 percent,
according to the head of Russia's Rosneft Igor Sechin. "Shale oil production in the United States will
decline in the long-term and reach bottom by 2020," Sechin said . ..."
The price of shale oil on the US market has fallen by two-thirds while production by
15 percent, according to the head of Russia's Rosneft Igor Sechin. "Shale oil production in
the United States will decline in the long-term and reach bottom by 2020," Sechin said .
Being a propaganda arm of GS, Bloomberg reporting is, of course, very biased. But still you can't
hide some facts even while being Bloomberg correspondent
Notable quotes:
"... As the world runs out of places to store oil, "I wouldn't be surprised if this market goes
into the teens," said Jeff Currie, head of commodities research at Goldman Sachs Group Inc. ..."
"... Supply exceeds demand by as much as 1.7 million barrels a day, so cutting 1 million from production
would in theory make prices more "reasonable," Sechin said. ..."
"... Traders are the only ones enjoying the slump as they profit from sky-high volatility and a
market structure called contango - where prices in the future are higher than today - that means they
can make money just by keeping oil in storage tanks. ..."
"The oil industry is facing a crisis," said Patrick Pouyanne, CEO of Total SA, Europe's biggest
refiner. BP Plc boss Bob Dudley described himself as "very bearish" and joked that the surplus is
so extreme that people will soon be filling swimming pools with crude.
As the world runs out of places to store oil, "I wouldn't be surprised if this market goes
into the teens," said Jeff Currie, head of commodities research at Goldman Sachs Group Inc.
Cuts? What Cuts?
Crude prices surged briefly last month on speculation the Organization of Petroleum Exporting
Countries would team up with Russia to cut production. The head of the nation's biggest oil company
had other ideas.
"Tell me who is supposed to cut?" said Igor Sechin, CEO of Rosneft. "Will Saudi Arabia cut
production? Will Iran cut production? Will Mexico cut production? Will Brazil cut production?
Who is going to cut?"
Supply exceeds demand by as much as 1.7 million barrels a day, so cutting 1 million from production
would in theory make prices more "reasonable," Sechin said. Nevertheless, Rosneft is focused
on preserving its traditional markets against the competition, he said.
Cuts on the scale required to balance the market just aren't happening. While some fields have
started to fall victim to low prices, only 0.1 percent of global output has been curtailed because
it's unprofitable, researcher Wood Mackenzie estimates.
A Profitable Opportunity
Traders are the only ones enjoying the slump as they profit from sky-high volatility and a
market structure called contango - where prices in the future are higher than today - that means
they can make money just by keeping oil in storage tanks.
As the price of U.S. benchmark West Texas Intermediate crude slumped close to 12-year lows this
week, another opportunity emerged: super-contango. Places to store oil on land are running out in
some places, and the contango is getting so steep that it's becoming profitable to hire supertankers,
fill them with crude and anchor them offshore.
"... The price of oil is unstable right now; it can stand at $40 a barrel today and reach $80 a
barrel tomorrow… ..."
"... "Shale oil production in the United States will decline in the long-term and reach bottom by
2020," Sechin said. ..."
"... About 17,000 oil and gas workers in the US lost their jobs in 2015. ..."
"... When adding the oilfield support jobs lost in refineries and petrochemical plants, the actual
number of related layoffs grew to about 87,000, according to Michael Planet, an economist at the Dallas
Fed. ..."
"The price of oil is unstable right now; it can stand at $40 a barrel today and reach $80
a barrel tomorrow…," said Total's CEO.
The price of shale oil on the US market has fallen by two-thirds while production by 15 percent,
according to the head of Russia's Rosneft Igor Sechin. "Shale oil production in the United States
will decline in the long-term and reach bottom by 2020," Sechin said.
Falling oil prices have reduced the profitability of oil extraction which impacts drilling activity.
In the early part of last year, the US rig count was down 850 from the year before. About 17,000
oil and gas workers in the US lost their jobs in 2015.
When adding the oilfield support jobs lost in refineries and petrochemical plants, the actual
number of related layoffs grew to about 87,000, according to Michael Planet, an economist at the
Dallas Fed.
US oil and gas producers are expected to announce 2015 losses totaling over $15 billion, according
to Bloomberg analysis earlier this month. Companies have already announced huge earnings losses,
output and spending cuts.
Jacques Jacobs
Companies in the US complained that they could not effectively recruit enough people to move
to North Dakota to work in the oil industry, but many did, and bought homes, now they get laid
off and many are getting foreclosed on going into bankruptcy.
Foghorn returns
This is the only the beginning, just wait until the banksters racket starts to unravel. The
situation is a lot worse for copper. Its so bad that copper has now become a precious metal. For
real you can buy copper coins and save them in your cellar for when the whole bankster racket
falls apart.
"... I think there should be is a special place in hell for Goldman commodity traders. ..."
"... IMO, the global oversupply is a house of cards built on an unstable foundation of actual global
crude oil production* that requires massive capital investments to keep crude oil production from crashing.
..."
"... my buddy (petroleum engineer) who works in Kuwait from time-to-time insists their production
rate is maintained by massive infill drilling BUT how long will the party last: a decade? Longer? Shorter?
..."
"... I would think the second half of 2016 for a price recovery, but I thought we were in a price
recovery phase this time last year. As for the duration of a price recovery, I dont have the foggiest.
..."
"... Incidentally as noted up the thread, an interesting difference between the last oil price decline
and the current (much more protracted) decline: Global liquids consumption fell by 2 million bpd from
2007 to 2009, whereas global liquids production reportedly rose by 3 million bpd from 2013 to 2015.
..."
"... That is what is keeping two thirds of the worlds oil fields from a 5 to 6 percent decline rate.
Massive infill drilling is happening in Kuwait, Saudi, the UAE, Russia, the Gulf of Mexico and just
about everywhere else in the world. ..."
"... Normally the production profile of a field would resemble a bell curve with the top of the
curve being the 50% depletion point. But with massive infill drilling, the top of the bell just levels
out with only a slight decline, if any. But the depletion curve, if you could see it, would be dropping
like a rock. ..."
"... What infill drilling does is delay the decline curve until it too starts dropping like a rock.
..."
"... My guess is about a decade. Saudi began their infill drilling projects over a decade ago and
I believe the fields where this began is already dropping fast. But they have managed to keep production
up by bringing on three giant fields, Khurais, Manifa and Shaybah. ..."
"... But it depends entirely on the size of the field. Giant and super giant fields can maintain
infill drilling and keep production up much longer than smaller fields, like those in the GOM. ..."
"... But Kuwaits production has already started to drop and UAE production is just on the cusp.
Russia also has, for almost a decade, had a program of massive infill drilling in their Western Siberia
fields where about 60% of their oil is produced. ..."
Not sure how reliable this is, but drillinginfo index has the "new US production capacity" (oil
and gas) dropping by 24% from January to February; which would be biggest drop since the collapse
of the oilprice
Thousands of industry participants gathered in London for their annual get-together,
only to find a world awash in crude and hardly a life jacket in sight.
The thousands of attendees seeking reasons for optimism didn't find them at the annual
International Petroleum
Week . Instead they were greeted by a cacophony of voices from some of the largest oil
producers, refiners and traders delivering the same message:
There are few reasons for optimism. The world is awash with oil. The market is overwhelmingly
bearish.
No Hope
Producers are bracing for a tough year. Prices will stay low for up to a decade as Chinese
economic growth slows and the U.S. shale industry acts as a cap on any rally, according to
Ian Taylor, chief executive officer of Vitol Group, the world's largest independent oil trader.
Even refiners, whose profits have held up better than expected, are seeing a worsening outlook.
"As the world runs out of places to store oil, "I wouldn't be surprised if this market goes
into the teens," said Jeff Currie, head of commodities research at Goldman Sachs Group Inc."
I think there should be is a special place in hell for Goldman commodity traders.
IMO, the global oversupply is a house of cards built on an unstable foundation of actual global
crude oil production* that requires massive capital investments to keep crude oil production from
crashing.
Qatar is basically the poster child for post-2005 production. OPEC 12 data show that Qatar's
reported crude oil production, despite billions of dollars spent on enhanced oil recovery, fell
from 0.8 million bpd in 2005 to 0.7 million bpd in 2014 (OPEC crude only data), while EIA data
show that Qatar's C+C production increased from 1.0 million bpd in 2005 to 1.5 million bpd in
2014.
"IMO, the global oversupply is a house of cards built on an unstable foundation of actual
global crude oil production* that requires massive levels of investments to keep crude oil
production from crashing."
Please provide a scale Jeff. Not that I don't agree with you; my buddy (petroleum engineer)
who works in Kuwait from time-to-time insists their production rate is maintained by massive infill
drilling BUT how long will the party last: a decade? Longer? Shorter?
I would think the second half of 2016 for a price recovery, but I thought we were in a price
recovery phase this time last year. As for the duration of a price recovery, I don't have the
foggiest.
As an example of low probability events, two years ago if someone had asked us what we thought
the chances were that Donald Trump, in early 2016, would be the most likely GOP nominee, and that
oil prices would be in the 20's to low 30's, I wonder what we would have said.
Incidentally as noted up the thread, an interesting difference between the last oil price
decline and the current (much more protracted) decline: Global liquids consumption fell by 2 million
bpd from 2007 to 2009, whereas global liquids production reportedly rose by 3 million bpd from
2013 to 2015.
my buddy (petroleum engineer) who works in Kuwait from time-to-time insists their production
rate is maintained by massive infill drilling…
That is what is keeping two thirds of the world's oil fields from a 5 to 6 percent decline
rate. Massive infill drilling is happening in Kuwait, Saudi, the UAE, Russia, the Gulf of Mexico
and just about everywhere else in the world.
Normally the production profile of a field would resemble a bell curve with the top of
the curve being the 50% depletion point. But with massive infill drilling, the top of the bell
just levels out with only a slight decline, if any. But the depletion curve, if you could see
it, would be dropping like a rock.
What infill drilling does is delay the decline curve until it too starts dropping like
a rock.
BUT how long will the party last: a decade? Longer? Shorter?
My guess is about a decade. Saudi began their infill drilling projects over a decade ago
and I believe the fields where this began is already dropping fast. But they have managed to keep
production up by bringing on three giant fields, Khurais, Manifa and Shaybah.
But it depends entirely on the size of the field. Giant and super giant fields can maintain
infill drilling and keep production up much longer than smaller fields, like those in the GOM.
But Kuwait's production has already started to drop and UAE production is just on the cusp.
Russia also has, for almost a decade, had a program of massive infill drilling in their Western
Siberia fields where about 60% of their oil is produced.
And folks wonder why I think peak oil is at hand. Geeze, isn't it obvious?
When President Obama secretly authorized the Central Intelligence Agency to begin arming Syria's
embattled rebels in 2013, the spy agency knew it would have a willing partner to help pay for the
covert operation. It was the same partner the C.I.A. has relied on for decades for money and discretion
in far-off conflicts: the Kingdom of Saudi Arabia.
...
The support for the Syrian rebels is only the latest chapter in the decadeslong relationship between
the spy services of Saudi Arabia and the United States, an alliance that has endured through the
Iran-contra scandal, support for the mujahedeen against the Soviets in Afghanistan and proxy fights
in Africa. Sometimes, as in Syria, the two countries have worked in concert. In others, Saudi Arabia
has simply written checks underwriting American covert activities.
...
In addition to Saudi Arabia's vast oil reserves and role as the spiritual anchor of the Sunni Muslim
world, the long intelligence relationship helps explain why the United States has been reluctant
to openly criticize Saudi Arabia for its human rights abuses, its treatment of women and its support
for the extreme strain of Islam, Wahhabism, that has inspired many of the very terrorist groups the
United States is fighting. The Obama administration did not publicly condemn Saudi Arabia's public
beheading this month of a dissident Shiite cleric, Sheikh Nimr al-Nimr, who had challenged the royal
family.
...
American officials have not disclosed the amount of the Saudi contribution, which is by far the largest
from another nation to the program to arm the rebels against President Bashar al-Assad's military.
But estimates have put the total cost of the arming and training effort at several billion dollars.
...
When Mr. Obama signed off on arming the rebels in the spring of 2013, it was partly to try to gain
control of the apparent free-for-all in the region. The Qataris and the Saudis had been funneling
weapons into Syria for more than a year. The Qataris had even smuggled in shipments of Chinese-made
FN-6 shoulder-fired missiles over the border from Turkey.
...
By the summer of 2012, a freewheeling feel had taken hold along Turkey's border with Syria as the
gulf nations funneled cash and weapons to rebel groups - even some that American officials were concerned
had ties to radical groups like Al Qaeda.
...The C.I.A. was mostly on the sidelines during this period, authorized by the White House under
the Timber Sycamore training program to deliver nonlethal aid to the rebels but not weapons. In late
2012, according to two former senior American officials, David H. Petraeus, then the C.I.A. director,
delivered a stern lecture to intelligence officials of several gulf nations at a meeting near the
Dead Sea in Jordan. He chastised them for sending arms into Syria without coordinating with one another
or with C.I.A. officers in Jordan and Turkey.
...While the intelligence alliance is central to the Syria fight and has been important in the war
against Al Qaeda, a constant irritant in American-Saudi relations is just how much Saudi citizens
continue to support terrorist groups, analysts said.
"The more that the argument becomes, 'We need them as a counterterrorism partner,' the less persuasive
it is," said William McCants, a former State Department counterterrorism adviser and the author of
a book on the Islamic State. "If this is purely a conversation about counterterrorism cooperation,
and if the Saudis are a big part of the problem in creating terrorism in the first place, then how
persuasive of an argument is it?"
"... Submitted by Dalan McEndree via OilPrice.com, ..."
"... Or, alternatively, are they targeting specific global competitors and specific national markets? ..."
"... And, of course, what does the Saudi strategy beyond pumping crude portend for the Saudi approach to some OPEC members' calls for coordinated production cuts within OPEC and with Russia? ..."
"... Saudi Arabia's sustainable crude output capacity ..."
"... Rather than maintaining crude output at 2014's level in 2015, the Saudis steadily increased it after al-Naimi's announcement in Vienna as they brought idle capacity on line ..."
"... IEA monthly Oil Market Report ..."
"... exports peaked in 4Q 2015 at 7.01 million barrels per day ..."
"... The Saudis did not ship any of their incremental crude exports to the U.S.-in other words, they did not increase volumes exported to the U.S., did not directly seek to constrain U.S. output, and did not seek to increase U.S. market share. ..."
"... It is therefore not surprising that the Saudis moved aggressively in Europe in 4Q 2015-successfully courting traditional Russian customers in Northern Europe and Eastern Europe and drawing complaints from Rosneft. ..."
"... In this Saudi effort, the U.S. could be an ally. The U.S. became a net petroleum product exporter in 2012 (minus numbers in the table below indicate net exports), and net exports grew steadily through 2015. Growth continued in January, with net product exports averaging 1.802 million barrels per day, and, in the week ending February 5, 2.046 million. U.S. exports will lessen the financial attractiveness of investment in domestic refining capacity, both for governments and for foreign investors in their countries' oil industries (data from EIA). ..."
"... It may be that the Saudis will not change course until Russian output declines, Iraq's stagnates, Iran's output growth is stunted-and that receding output from weaker countries within and outside OPEC would not be enough. If this is case, the Saudis will see resilient U.S. production as increasing pressure on their competitors and bringing forward the day when they can contemplate moderating their output. ..."
"... NOTE: Nothing in the foregoing analysis should be understood as denying that the U.S. oil industry has suffered intensely or asserting that this strategy, if it is Saudi strategy, will succeed. ..."
"... NOTE: Nothing in the foregoing analysis should be understood as denying that …. IF IT IS Saudi strategy. ..."
Do the Saudis have an oil market strategy
beyond pumping crude to defend their market share? Are they indifferent to which countries' oil industries
survive? Or, alternatively, are they targeting specific global competitors and specific
national markets? Did they start with a particular strategy in November 2014 when Saudi
Petroleum and Mineral Resources Minister Ali al-Naimi announced the new market share policy at the
OPEC meeting in Vienna and are they sticking with it, or has their strategy evolved with the evolution
of the global markets since?
And, of course, what does the Saudi strategy beyond pumping crude portend for the Saudi approach
to some OPEC members' calls for coordinated production cuts within OPEC and with Russia?
Conventional Wisdom
Conventional wisdom has it that the Saudis are focused primarily on crushing the U.S.
shale industry. In this view, the Saudis blame the U.S. for the supply-demand imbalance
that began to make itself felt in 2014. U.S. production data seems to support this. Between 2009
and 2014, U.S. crude and NGLs output increased nearly 4 million barrels per day, while Saudi Arabia's
increased only 1.64 million barrels per day, Canada's 1.06 million, Iraq's 0.9 million, and Russia's
0.7 million (Saudi data doesn't include NGLs).
In addition, the Saudis, among many others, believed that U.S. shale would be the most vulnerable
to Saudi strategy, given relatively high production costs compared to Saudi production costs and
shale's rapid decline rates and the need therefore repeatedly to reinvest in new wells to maintain
output.
Yet, if the Saudis were focused on the U.S., their efforts have been unsuccessful, at least in
2015. As the table below shows, U.S. output growth in 2015 outstripped Saudi output growth and the
growth of output from other major producers in absolute terms. In addition, many observers also came
to believe that U.S. shale production will recover more quickly than production in traditional plays
once markets balance due to its unique accelerated production cycle and that this quick recovery
will limit price increases when markets balance.
Is the U.S. Really the Primary Target?
The above considerations imply the Saudis-if indeed they primarily were targeting U.S. shale-embarked
on a self-defeating campaign in November 2014 that could at best deliver a Pyrrhic victory and permanent
revenues losses in the US$ hundred billions.
Is the U.S. the primary target? U.S. import data (from the EIA) suggests the U.S. is not now the
Saudis' primary target, if it ever was. Like other producers, the Saudis operate within a set of
constraints. Domestic capacity is one. In its 2015 Medium Term Market Report (Oil), the IEA put
Saudi Arabia's sustainable crude output capacity at 12.34 million barrels per day in 2015
and at 12.42 million in 2016. Export capacity-output minus domestic demand-is another.
Rather than maintaining crude output at 2014's level in 2015, the Saudis steadily increased
it after al-Naimi's announcement in Vienna as they brought idle capacity on line (data from
the IEA monthly Oil Market Report):
This allowed them to increase average daily crude exports by 460,000 barrels in 2015 over 2014
average export levels-even as Saudi domestic demand increased-and exports peaked in 4Q 2015 at
7.01 million barrels per day (assuming the Saudis keep output at average 2H 2015 levels in 2016,
and domestic demand increased 400,000 barrels per day, as the IEA forecasts, the Saudis could export
nearly 7 million barrels per day on average in 2016):
The Saudis did not ship any of their incremental crude exports to the U.S.-in other words,
they did not increase volumes exported to the U.S., did not directly seek to constrain U.S. output,
and did not seek to increase U.S. market share. Based on EIA data, Saudi imports into the U.S.
declined from 1.191 million barrels per day in 2014 to 1.045 million in 2015-and have steadily declined
since peaking in 2012 at 1,396 million barrels per day. (OPEC's shipments also declined from 2014
to 2015, from 3.05 million barrels per day to 2.64 million, continuing the downward trend that started
in 2010). Canada, however, which has sent increasing volumes to the U.S. since 2009, increased exports
to the U.S. 306,000 barrels per day in 2015:
Also, the Saudi share of U.S. crude imports declined 1.9 percentage points in 2015 from 2014,
and has declined 2.6 percentage points since peaking at 16.9 percent in 2013; during the same two
periods, Canada's share increased 4.5 and 9.9 percentage points respectively (and has more than doubled
since 2009):
Other Markets
The Saudis presumably exported the incremental 606,000 barrels per day (460,000 from net increased
export capacity plus 146,000 diverted from the U.S.) to their focus markets. Since other countries'
import data generally is less current, complete, and available than U.S. data, where these barrels
ended up must be found indirectly, at least partially.
In its 2015 Medium Term Market Report (Oil), the IEA projected that the bulk of growth from 2015
to 2020 will come in China, Other Asia, the Middle East, and Africa, while demand will remain more
or less stagnant in OECD U.S. and OECD Europe:
The Saudis find themselves in a difficult battle for market share in China, the world's second
largest import market and the country in which the IEA expects absolute import volume will increase
the most through 2020-1.5 million barrels per day (it projects Other Asia demand to increase 2.0
million). The Saudis are China's leading crude supplier. However, their position is
under sustained attack from their major-and minor-global export competitors. For example,
through the first eleven months of 2015, imports from Saudi Arabia increased only 2.1 percent to
46.08 million metric tons, while imports from Russia increased 28 percent to 37.62 million, Oman
9.1 percent to 28.94 million, Iraq 10.3 percent to 28.82 million, Venezuela 20.7 percent to 14.77
million, Kuwait 42.6 percent to 12.68 million, and Brazil 102.1 percent to 12.07 million.
As a result of the competition, the Saudi share of China's imports has dropped from ~20 percent
since 2012 to ~15 percent in 2015, even as Chinese demand increased 16.7 percent, or 1.6 million
barrels per day, from 9.6 million in 2012 to 11.2 million in 2015. Moreover, the competition for
Chinese market share promises to intensify with the lifting of UN sanctions on Iran, which occupied
second place in Chinese imports pre-UN sanctions and has expressed determination to regain its prior
position (Iran's exports to China fell 2.1 percent to 24.36 million tons in the first eleven months
of 2015).
Moreover, several Saudi competitors enjoy substantial competitive advantages. Russia has
two. One is the East Siberia Pacific Ocean pipeline (ESPO) which directly connects Russia
to China-important because the Chinese are said to fear the U.S. Navy's ability to interdict ocean
supplies routes. Its capacity currently is 15 million metric tons per year (~300,000 barrels per
day) and capacity is expected to double by 2017, when a twin comes on stream. The second is the agreement
Rosneft, Russia's dominant producer, has with China National Petroleum Corporation to ship ~400 million
metric tons of crude over twenty-five years, and for which China has already made prepayments. Russia
shares a third with other suppliers. Saudis contracts contain destination restrictions and other
provisions that constrain their customers' ability to market the crude, whereas those of some other
suppliers do not.
Marketing flexibility will be particularly attractive to the
smaller Chinese refineries, which Chinese government has authorized to import 1 million-plus
barrels per day.
While they fight for market share in China, the Saudis also have to fight for market share in the
established, slow-growing or stagnant IEA-member markets (generally OECD member countries). Saudi
exports to these markets declined 310,000 barrels per day between 2012 and 2014, and 490,000 barrels
per day between 2012 and 2015's first three quarters. Only in Asia Oceania did Saudi export volumes
through 2015's first three quarters manage to equal 2012's export volumes. During the same period,
Iraq managed to increase its exports to Europe 340,000 barrels per day (data from IEA monthly Oil
Market Report).
It is therefore not surprising that the Saudis
moved aggressively in Europe in 4Q 2015-successfully courting traditional Russian customers in
Northern Europe and Eastern Europe and drawing complaints from Rosneft.
As with China, the competition will intensify with Iran's liberation from UN sanctions. For example,
Iran has promised to regain its pre-UN sanctions European market share-which implies an increase
in exports into the stagnant European market of 970,000 barrels per day (2011's 1.33 million barrels
per day minus 2015's 360,000 barrels per day).
Might the U.S. be an Ally?
Without unlimited crude export resources, the Saudis have had to choose in which global markets
to conduct their market share war, and therefore, implicitly, against which competitors to direct
their crude exports.
Why did the Saudis ignore the U.S. market?
First, U.S. crude does not represent a threat to the Saudis' other crude export markets.
Until late 2015, when the U.S. Congress passed, and President Obama signed, legislation lifting
the prohibition, U.S. producers, with limited exceptions, could not export crude. Even with the
prohibition lifted, it is unlikely the U.S. will become a significant competitor, given that the
U.S. is a net crude importer. Therefore, directing crude to the U.S. would not improve the Saudi
competitive position elsewhere.
Second, the U.S. oil industry is one of the least vulnerable (if not the least vulnerable)
to Saudi pressure-and therefore least likely and less quickly to crack. Low production
costs are a competitive advantage, but are not the only one and perhaps not the most important
one. Financing, technology, equipment, and skilled manpower availability is important, as are
political stability, physical security, a robust legal framework for extracting crude, attractive
economics, and access and ease of access to markets. The Saudis major export competitors-Russia,
Iran, and Iraq-are far weaker than the U.S. on all these areas, as are its minor export competitors,
including those within-Nigeria, Libya, Venezuela, and Angola-and outside OPEC-Brazil.
Third, in the U.S. market, the Saudis face tough, well-managed domestic competitors,
and a foreign competitor, Canada, that enjoys multiple advantages including proximity,
pipeline transport, and trade agreements, the Saudis do not enjoy.
Finally, the Saudis may be focused on gaining a sustainable long term advantage in
a different market than the global crude export market-the higher value added and therefore more
valuable petroleum product market. Saudi Aramco has set a target to double its global
(domestic and international) refining capacity to 10 million barrels per day by 2025. Depressed
revenues from crude will squeeze what governments have to spend on their oil industries and, presumably,
they will have to prioritize maintaining crude output over investments in refining.
In this Saudi effort, the U.S. could be an ally. The U.S. became a net petroleum product exporter
in 2012 (minus numbers in the table below indicate net exports), and net exports grew steadily through
2015. Growth continued in January, with net product exports averaging 1.802 million barrels per day,
and, in the week ending February 5, 2.046 million. U.S. exports will lessen the financial attractiveness
of investment in domestic refining capacity, both for governments and for foreign investors in their
countries' oil industries (data from EIA).
Saudi Intentions
The view that the Saudi market share strategy is focused on crushing the U.S. shale industry has
led market observers obsessively to await the EIA's weekly Wednesday petroleum status report and
Baker-Hughes weekly Friday U.S. rig count-and to react with dismay as U.S. rig count has dropped,
but production remained resilient.
In fact, they might be better served welcoming resilient U.S. production. It may be that the
Saudis will not change course until Russian output declines, Iraq's stagnates, Iran's output growth
is stunted-and that receding output from weaker countries within and outside OPEC would not be enough.
If this is case, the Saudis will see resilient U.S. production as increasing pressure on their competitors
and bringing forward the day when they can contemplate moderating their output.
NOTE: Nothing in the foregoing analysis should be understood as denying that the U.S. oil
industry has suffered intensely or asserting that this strategy, if it is Saudi strategy, will succeed.
Conventional wisdom has it that the Saudis are focused primarily on crushing the U.S.
shale industry.
Article LAST words: NOTE: Nothing in the foregoing analysis should be understood
as denying that …. IF IT IS Saudi strategy.
Does anyone with their head screwed on believe this Conventional Wisdom nonsense?
Let me give you three examples:
Isn't Saudi Arabia going into war? Where will the money come from? In a war, Saudi Arabia will
go broke before US shale.
Second: Saudi Arabia Per Capita Income:
Despite possessing the largest petroleum reserves in the world, per capita income dropped from
approximately $18,000 at the height of the oil boom (1981) to $7,000 in 2001, according to one
estimate.As of 2013, per capita income in Saudi was "a fraction of that of smaller
Persian Gulf neighbors", even less than petroleum-poor Bahrain.
The Saudi's remain committed to "helping" the US squeeze Russia at the expense of our own shale
industry, Canadian tar sands and bankrupting Venezuela and Brazil. When prices get low enough,
the Four Horseman of the Big Oil (Exxon, BP, Dutch Shell and ARAMCO) will swoop in and buy it
up, for a fraction of what it is worth.
It's just another power play to squeeze the smaller producers out of the market. When they are
finished, oil will go back up and they will make gazillions more. It's been used over and over
again for a hundred plus years.
Big fish eat small fish...same as it ever was.
Faeriedust
The Saudis are dealing with a domestic budget crisis created by the new king (and most especially
his Defense Minister son)'s attempts to impose regional hegemony in the Middle East. They are
attempting to move from the "soft power" of deep pockets to "hard power" of direct control over
formerly independent regions, in order to provide colonial positions and the opportunity for advancement
to their disaffected poor. It will not end well, and the complete collapse of the Kingdom is a
distinct possibility. But of course, they're not going to admit that anywhere it might see print.
"As I said before, even relatively small changes in oil production/consumption balance can
not only establish a trend, but also cause large fluctuations in oil prices. This is the flip side
of what is called low price elasticity of oil supply and demand. All those with long-term experience
in analyzing the oil market know this very well."
If we are to believe neoclassical economics books, then yes. There is only one minor problem with
neoclassical economics: it is a junk science.
A couple of questions:
How this statement correlates with the dominant role of "paper oil" in establishing the spot
price ?
Is not oil now trade as yet another currency ? If so then all dirty tricks that are applicable
to currency trading are applicable to oil. Did you hear about such term as attack on currency?
How supply-demand model explains continuing production of oil at prices below profitability
level, when each barrel is produced at a loss? How the role of debt is accounted for in your "supply-demand"
model?
In other words the key question is: "Is this a casino capitalism or some dreamed up world where
"supply-demand" model is the law of the land?"
"... UAE/OPEC cut rumor hits, DOW reverses over 250 points and oil bounces $1. Just one rumor affects
billions or trillions of market value. One question, is OPEC or US calling the shots? ..."
"... Yes. I know that. Just seeing violent moves in oil and stock market based on a one sentence
rumor can get the conspiracy juices flowing. Couple that with going from $102 to $21 in 21 months! LOL!
..."
"... Wow, the volatility Ive experienced since 1997. $18 to $8 to $140 to $26 to $105 to $21 today.
Quadrupling of costs from 1997 to 2014 and then a roughly 20% reduction from 2014 to now on service
and equipment. ..."
"... Clearly makes one question the wisdom of being invested in this sector. But .5% CDs are pretty
boring. LOL!! ..."
UAE/OPEC cut rumor hits, DOW reverses over 250 points and oil bounces $1. Just one rumor affects
billions or trillions of market value. One question, is OPEC or US calling the shots?
Sorry Ron, it was a conspiracy theory post, which I know you dislike and which I shouldn't jest
about.
Thought crossed my mind, oil tanks, stocks are very correlated to oil, so those markets tank.
Oil and gas price at these low levels are not helping, instead seem to be hurting US economy.
Does the US have enough sway with Gulf OPEC, due to military protection provided to require
them to cut production and/or not cut production?
Not a problem Shallow. I think you really know that someone in the State Department, or wherever,
could not call up the King of Saudi Arabia and tell him to cut production by a million barrels
per day. But it's fun to entertain such fantasies once in a while.
Yes. I know that. Just seeing violent moves in oil and stock market based on a one sentence
rumor can get the conspiracy juices flowing. Couple that with going from $102 to $21 in 21 months!
LOL!
It is noteworthy how much oil price seems to be on the front page. Go back and look at historical
oil prices. Nothing quite like this since 1930s.
Wow, the volatility I've experienced since 1997. $18 to $8 to $140 to $26 to $105 to $21
today. Quadrupling of costs from 1997 to 2014 and then a roughly 20% reduction from 2014 to now
on service and equipment.
Clearly makes one question the wisdom of being invested in this sector. But .5% CD's are
pretty boring. LOL!!
Thanks again for all of your work on this blog Ron. I appreciate it. I'll try not to do the
crazy talk. Oh how I'd love to be a fly on the wall when OPEC meets. I'd also love to be a fly
on the wall when the shale honchos talk turkey about what the heck they are going to do.
"... Producers are also betting that oil prices will eventually recover. The latest Reuters poll of oil analysts forecasts the U.S. benchmark CLc1 will average $41 a barrel in 2016, a level where most Canadian oil sands projects can break even. [OILPOLL] ..."
"... Bankers say the need to bolster balance sheets and cover oil sands losses will boost the number of Canadian energy deals this year, particularly sales of pipelines, and storage and processing facilities. ..."
Faced with record low prices for heavy crude, Canadian energy companies are sacrificing other
parts of their business to keep higher-cost oil sands production going and safeguard the billions
already invested in these multi-decade projects.
Companies including Husky Energy Inc HSE.TO, MEG Energy Corp MEG.TO and Pengrowth Energy Corp
PGF.TO are selling assets or slowing light and conventional oil exploration and production, even
as they forge ahead with oil sands projects that are in many cases bleeding money on every
barrel.
... ... ...
Producers are also betting that oil prices will eventually recover. The latest Reuters
poll of oil analysts forecasts the U.S. benchmark CLc1 will average $41 a barrel in 2016, a level
where most Canadian oil sands projects can break even. [OILPOLL]
Bankers say the need to bolster balance sheets and cover oil sands losses will boost the
number of Canadian energy deals this year, particularly sales of pipelines, and storage and
processing facilities.
According to a recent TD Securities report, virtually no oil sands projects can cover
overall costs, including production, transportation, royalties, and sustaining capital, with U.S.
benchmark crude below $30 a barrel CLc1.
The benchmark heavy Canadian blend, Western Canada Select (WCS), now trades around $16.30 a
barrel, just a few dollars above record lows hit in January.
... ... ...
Bankers say that midstream assets - pipelines, storage and processing facilities - prove popular
with buyers such as pension funds and private equity firms, which favor investments with stable
cash flows that are relatively easy to value.
"They're to a certain extent the jewels in the crown. These companies would not be looking to
sell them if they could get away with not doing it," said Citi's Kernaghan.
What does all of this mean for oil prices? The IEA sees a larger surplus now than it previously
anticipated. Excess supply of about 2 mb/d will persist through the first quarter, which will fall
to 1.5 mb/d in the second. The glut should shrink to 0.3 mb/d in the second half of the year, but
with storage levels still rising, oil prices may not rebound by much.
Separately, Jeffrey Currie, the head of global commodities research at Goldman Sachs,
said on February 9 that oil price volatility, already at multiyear highs, will probably increase
in 2016 and that he wouldn't be surprised if oil dipped below $20 per barrel. Goldman has made a
name for themselves with their bearish predictions on crude oil – and many of them have largely come
to pass.
"... Core estimates that the current production decline curve rate for U.S. production is approximately 7.8% net which will expand as 2016 progresses and could reach 10% net by the end of the year 2016. ..."
"... Core believes that the worldwide crude oil supply and demand markets will balance in the second half of 2016. ..."
"... U.S. unconventional production peaked at approximately 5.5 million barrels of oil per day in March of 2015, has since fallen by over 600,000 barrels a day owing to high decline curve rates associated with tight oil reservoirs (offset by unsustainable adds of 250,000 bopd (we had noticed the adjustments in the data stream). ..."
"... The sharp declines from U.S. land production will continue into 2016 and Core believes these decreases could reach 900,000 barrels a day by the year-end 2016. Lower levels of new wells and delayed production maintenance will exacerbate this 2016 fall in U.S. land production. ..."
"... the short gains from legacy deepwater Gulf of Mexico projects will not materialize in 2016 to offset the significant decreases in U.S. land production as they did in late 2015. ..."
"... Core estimates that the current production decline curve rate for U.S. production is approximately 7.8% net which will expand as 2016 progresses and could reach 10% net by the end of the year 2016. ..."
David Demshur, CEO of Core Labs had a lot to say in their earnings release of Jan. 28, 2016.
Regarding US oil production.
Core estimates that the current production decline curve rate for U.S. production is approximately
7.8% net which will expand as 2016 progresses and could reach 10% net by the end of the year 2016.
Regarding World oil production.
Core estimates that crude oil production decline curve has expanded to 3.1% net, up some 60
basis points from year earlier estimates. Applying the 3.1% net decline curve rate to the worldwide
crude oil production base of approximately 85 million barrels a day means that the planet will
need to produce approximately 2.6 million new barrels by this date next year to maintain current
worldwide production totals.
With the long-term worldwide spare capacity nearing zero, Core believes that worldwide producers
will not be able to offset the estimated 3.1% net production decline curve rate in 2016, leading
to falling global crude oil production by the second half of 2016.
Therefore, Core believes crude oil markets rationalize in the second half of 2016 and price
stability followed by price increases return to the energy complex. Remember, the immutable laws
of physics and thermodynamics mean that the crude oil production decline curve always wins and
that it never sleeps.
1) "Core believes that the worldwide crude oil supply and demand markets will balance in the
second half of 2016.",
2) "U.S. unconventional production peaked at approximately 5.5 million barrels of oil per day
in March of 2015, has since fallen by over 600,000 barrels a day owing to high decline curve rates
associated with tight oil reservoirs" (offset by unsustainable adds of 250,000 bopd (we had noticed
the adjustments in the data stream).
3) "The sharp declines from U.S. land production will continue into 2016 and Core believes
these decreases could reach 900,000 barrels a day by the year-end 2016. Lower levels of new wells
and delayed production maintenance will exacerbate this 2016 fall in U.S. land production."
4) "the short gains from legacy deepwater Gulf of Mexico projects will not materialize in 2016
to offset the significant decreases in U.S. land production as they did in late 2015."
5) "Core estimates that the current production decline curve rate for U.S. production is
approximately 7.8% net which will expand as 2016 progresses and could reach 10% net by the end
of the year 2016."
Trading giant
Vitol says it's already buying Iranian oil, several European oil companies
have already chartered tankers for Iranian crude. Total SA has reportedly signed
an agreement with Iran to buy 160,000 barrels per day effective from the 16th
of February.
Spanish refiner Compania Espanola de Petroleos has booked some provisional
Iranian crude cargoes to land in European ports,
according to Bloomberg, and
Glencore Plc trading house bought a cargo earlier this month.
But Lukoil's trading arm, Swiss-based Litasco, has cancelled its booking
of an Iranian cargo to Italy over insurance complications,
according to Reuters.
Japan is a step
ahead of other prospective importers of Iranian oil. In 2012, Japan's Parliament
approved government guarantees on insurance for Iranian crude oil cargoes, circumventing
European Union sanctions and allowing for the provision of up to $7.6 billion
in coverage for each Iranian crude oil tanker bound for Japan. But that
law expires on 31 March, so it may have to go back to parliament for approval
if the West hasn't sorted things out by then.
The London-based International Group of Protection & Indemnity Clubs, which
covers some 90 percent of global tonnage through reinsurance, is
reportedly in talks with Washington to figure a way out of the insurance
quagmire quickly, according to the Wall Street Journal.
Seems to me that we are approaching a zero US rig count, or at least approaching a zero oil rig
count.
In any case, I previously noted, if we define the duration of the 2008 oil price decline as
the number of months below $100, until we saw a sustained oil price recovery, the slump only lasted
four months in 2008. But it took about two years for the US rig count to get back to the pre-decline
levels, with the benefit of easy financing.
Using the same oil price decline metric, we are at 17 months at counting, and easy financing
has presumably gone bye-bye.
Meanwhile, as I noted up the thread, US liquids consumption hit a seven year high last year,
and the US is becoming increasingly dependent on net crude oil imports:
"... A group of Russian Duma deputies proposed to prohibit for 5 years the sale of raw oil abroad and develop a strategy for the development of the economy of Russia in the direction of reducing the dependence on the fluctuations of world oil prices. ..."
A group of Russian Duma deputies proposed to prohibit for 5 years
the sale of raw oil abroad and develop a strategy for the development
of the economy of Russia in the direction of reducing the dependence
on the fluctuations of world oil prices.
A letter to the Minister of Economic Development Alexei Ulyukayev
was sent by deputies from the minority party "Fair Russia", informs
"RIA Novosti".
According to the parliamentarians, the biggest problem is that Russia
still sits on an oil needle. So state reforms are needed for the domestic
economy.
"Today we need to summon all the courage to declare the abolition
of the raw oil sales to world markets. We must start to turn out economy
in the direction of increasing the level of oil processing in domestic
petrochemical industry and lessening the priority of oil extraction
industries. Russia has repeatedly demonstrated that it can rise from
the ashes. The state needs reforms which reallocates currency reserves
to ensure this path of development of the domestic economy based on
the internal opportunities of economic development " says deputies'
request.
According to the parliamentarians, the immediate introduction of
such prohibition is impossible, because Russia has obligations to the
current trading partners.
Instead Deputies proposed to adopt a government program "Development
of the economy of the Russian Federation in the direction of reduction
of its dependence on raw oil sales".
"While we procrastinate and endure the slump of oil prices waiting
for the rise of oil prices, Russian economy deteriorates and Russian
state suffers too. Why do we recklessly waste our precious natural resources
depriving future generations? To be the world's gas fueling station
is not what Russia wants to be", they wrote.
Somewhat strange. On the way down EIA typically overestimating resilience not
underestimating it.
Notable quotes:
"... By contrast, in the DPR released Monday the EIA predicts the seven major shale plays to produce 5.02 mb/d in February, 185 kb/d higher than in last month's forecast of 4.83 mb/d. The anticipated decline between the March 2015 peak levels and February 2016 is now 453 k/d compared with 638 k/d in January DPR. In general, the comparison between the EIA's DPRs of the past several months shows that the agency has been constantly underestimating the resilience of the LTO production. ..."
"... The biggest upward revisions were for the Eagle Ford (+77 kb/d for December, +100 kb/d for January, and +127 k/d for February). The EIA's estimates for the Eagle Ford remain lower than those from other sources, in particular, from Bentek Energy. ..."
It is interesting to compare the numbers from the recently released EIA
Short-Term Energy Outlook (STEO) and Drilling Productivity Report (DPR).
In today's STEO, the EIA did not change its forecast of C+C production
in the Lower 48 states (excl. GoM) for 2016-17, although projected output
in the Gulf of Mexico was slightly revised down.
By contrast, in the DPR released Monday the EIA predicts the seven
major shale plays to produce 5.02 mb/d in February, 185 kb/d higher than
in last month's forecast of 4.83 mb/d. The anticipated decline between the
March 2015 peak levels and February 2016 is now 453 k/d compared with 638
k/d in January DPR. In general, the comparison between the EIA's DPRs of
the past several months shows that the agency has been constantly underestimating
the resilience of the LTO production.
The EIA still projects the monthly decline in 7 key shales oil production
to accelerate from 73 kb/d in February to 93 kb/d in March.
Oil production in 7 major U.S. shales: EIA DPR Feb 2016 vs. Jan 2016
vs. Dec 2015
The biggest upward revisions were for the Eagle Ford (+77 kb/d for December,
+100 kb/d for January, and +127 k/d for February). The EIA's estimates for
the Eagle Ford remain lower than those from other sources, in particular,
from Bentek Energy.
Oil production in the Eagle Ford shale: EIA DPR Feb 2016 vs. Jan 2016
vs. Dec 2015
"... Daniel Yergin: "Just to put a number on that. Our numbers at IHS, 2015-2020 we see a 1.8 trillion dollar decline in upstream oil and gas investment" ..."
"... To the extent that oversupply of US shale oil (including condensate filling up US inventories) has contributed to currently low oil prices, the drama evolving now is that unconventional oil – which was originally intended to be added to stagnating conventional supplies in the 1 st phase of peaking oil production (2005-2008) – is now endangering this much larger conventional base production, including higher cost offshore fields. ..."
"... And for those who hope that oil markets will "rebalance" at $60-$70 there is no statistical evidence in the last 10 years that oil prices stayed for very long at these levels. ..."
This recent forum was about how to transition away from fossil fuels, after the UN
conference on climate change in Paris
in November 2015. Moderator Yergin – who is a known
peak oil denier – started by asking Fatih Birol what low oil and gas prices mean for the development
of renewable energies. Fatih responded by first warning about the impact of lower oil prices on investments
in the oil and gas sector:
(video 3:24) Fatih Birol: "For the oil markets what worries me the most is that: last year we have seen
oil investments in 2015 decline more than 20%, compared to 2014, for the new projects. And this was
the largest drop we have ever seen in the history of oil. And, moreover, in 2016, this year, with
the $30 price environment, we expect an additional 16% decline in the oil projects, investments.
So, we have never seen 2 years in a row oil investments declining. If there was a decline 1 year,
which was very rare, the next year there was a rebound"
Daniel Yergin: "What does that lead you to?"
Fatih Birol: "this leads me to the very fact that in a few years of time, when the global demand
gets a bit stronger, when we see that the high cost areas such as the United States start to decline,
we may well see and upward pressure on the prices as a result of market tightness. So my message,
my 1st message is: don't be misled that the low oil prices will have an impact on the oil prices
in the market in a few years' time"
Daniel Yergin: "Just to put a number on that. Our numbers at IHS, 2015-2020 we see
a 1.8 trillion dollar decline in upstream oil and gas investment"
... ... ...
The graph shows that conventional crude oil production is supposed to be basically flat. This
is designed by adjusting the yet-to-be-found wedge. Unconventional tight (shale) oil and heavy oil/bitumen
increase only slightly up to 2020. NGLs go up but these don't play a big role for transport fuels
(except LPG).
If 80% of investments are needed just to offset decline, then the additional 2016 drop leads to
such a low investment level that yet-to-be-developed projects are in danger, not to mention the assumed
production from yet-to-be-found fields. An example of the latter is
Shell ending its exploration in the Chukchi sea.
Conclusion
Changes in investment projections were already underway before the 2014 oil price drop. To
the extent that oversupply of US shale oil (including condensate filling up US inventories) has contributed
to currently low oil prices, the drama evolving now is that unconventional oil – which was originally
intended to be added to stagnating conventional supplies in the 1st phase of peaking oil
production (2005-2008) – is now endangering this much larger conventional base production, including
higher cost offshore fields.
Even if oil prices go up again US shale oil has already destabilized global oil markets by increasing
volatility. Is that what we call a swing producer? Yes, swinging oil prices and investments.
And for those who hope that oil markets will "rebalance" at $60-$70 there is no statistical evidence
in the last 10 years that oil prices stayed for very long at these levels.
While crude prices have dropped more than 70 percent over the last 20 months, a reckoning in
the nation's vast oil industry has only just begun. Until recently, companies were able to ride
out the slump using hedges to sell their oil for higher than the low market prices.
In recent months, however, most of those hedges expired, leaving a number of oil companies low on
cash and unable to pay their debt. More broadly, energy executives and their lenders are
realizing that a recovery in oil prices is at least a year away, too long for many companies to
hold out.
Energy executives and their bankers are bracing for a prolonged downturn that could remake the
energy industry in a way not seen since the turmoil of the late 1990s gave rise to mega-mergers
like Exxon Mobil.
If prices hold at such low levels - oil traded near $28 on Tuesday - as many as 150 oil and
gas companies could file for bankruptcy, according to IHS, an energy research firm.
... ... ...
Banks looking to shore up collateral on their loans - which is
typically a company's oil reserves - are requiring producers to drill new wells to prove that
their reserves can actually produce the oil.
... ... ...
Nationally, just 15 percent of oil and gas production is hedged in 2016, compared with 28
percent of production in the fourth quarter, according to IHS, the research firm.
... ... ...
As rigs go off-line, companies are using technologies to squeeze as much oil as they can out
of existing wells. But if an aging well breaks, many companies are not spending the money to fix
it, and executives predict a rapid decline in production as shale wells peter out.
Now sensing a possible bottom,
a new wave of Wall Street money is flooding the oil patch, trying to catch a recovery.
... ... ...
Adventure Exploration Partners is not drilling yet, because the price is not right. "We're
hoping to see prices stabilize and recover sometime in 2017," Mr. Lucas said.
For David M. Zusman, chief investment officer at Talara Capital in
New York, oil has reached an "inflection point" that he is not going to miss.
"... Since his appointment, there has been a genuine effort in the field of PR. the goal is to create
for him an image of a politician of an international stature. He seeks to become the counterpart, if
not the equal of the great western powers. ..."
"... It is important to be opportunistic at this level and not to alienate the fringe wahhabi elements
of Saudi Arabia is of paramount importance. A little interaction with the West it OK, too much of interactions
with the West, this is detrimental to his image and his credibility. Therefore he tries to advance his
goal, while at the same time trying not to offend nobody. It is, after all, a dive of discovery in the
international political universe. ..."
"... Regardless of his background, he needs to prove that he matters, that he is a hardliner, that
he is a good minister of Defence, and that that he is anti-shiite, he is a man capable of confronting
Iran. At the same time, he needs to satisfy needs of Saudi population which is increasingly flocks to
jihadism. ..."
"... It is necessary to remove the ground under the feet of those who believe that the monarchy
has for too long been moderate, particularly during the reign of the former king Abdallah. It is this
desire to build his leadership, which leads to the direct confrontation with the shia, including such
political decisions as the execution of the leader of shiite Nimr al-Nimr, and the increased tension
with Iran. Finally, it also represents a reaction of the Saudi monarchy, which was disappointed by the
United States. He would like to stop normalization of Iranian-American relations, because in the event
of a confrontation with Iran, the Saudis would find themselves in a difficult position without 100%
US support. ..."
"... Prince Mohammed bin Salman tenure as the head of the armed forces can be characterized as a
failure. In Yemen, there has been a stalemate ..."
"... Moreover, where he was able to displaced the allies of Iran, the radicals from Al Qaeda and
DAESH took the control of those area. Iran became firmly positioned at the southern gateway to Saudi
Arabia. It is anything but a success. ..."
"... Nevertheless, he was applauded because he stood up and responded, tried to stop to Iran. He
responded to the Iran thereat, but has not managed to achieve his goals, which was expected of him.
However, in the eyes of the Saudis, a manly reaction that tha fact that has the the will to challenge
to the hegemony of Iran in the region was positive steps. ..."
"... In addition, Mohammed bin Salman has a revenge in mind: in 2009, the houthis crossed the Saudi
border, and despite the superiority of Saudis weaponry, the Saudi troops were able to repel that offence
only after 3 months of fighting which left 130 soldiers dead. ..."
"... It is perceived as dangerous because of the war, reckless and ineffective in Yemen as well
as its strategy of tension vis-à-vis Iran. Moreover, for the Germans, Iran is a huge market. They have
relied heavily on Iran in recent years, in the logical continuation of the long tradition of trade between
the two countries. Dont forget that it is a country that lives from exports, and that it is therefore
very important for the Germans to arrive at an agreement with Iran. Moreover, Germany is a country whose
strategy is intimately linked to that of the United States and totally dependent on NATO due to the
fact that it is forbidden to have an army of its own. Germany knows that if it was a direct confrontation
between Saudi Arabia and Iran, it would be required to be supportive of Saudi Arabia – regardless of
the efforts by Barack Obama to move closer to Iran. ..."
"... the strategy of the prince Mohammed Bin Salman is to push Iran to the fault in causing the
tensions that can go up to a risk of open warfare that would force the west to choose Saudi Arabia against
Iran ..."
"... The Prince Mohammed bin Salman is now the most powerful man in Saudi Arabia. It has exclusive
access to his father, King Salman, and effectivly he can rule the coutries inread of him. He is head
of his office, which means that nobody can contact or be received by the King without going through
the son ..."
"... Saudi Arabia is extremely disturbed by the detente with Iran on the international scene. We
are witnessing more or less a reversal of alliances, and of countries images in the eyes of the West.
A short time ago, Iran was demonized in the West. Today, it is accepted as a normal partner. Iran, therefore,
benefits from a relatively favorable treatment, while at the same time when the Arab monarchies, particularly
Saudi Arabia, are seen as retrograde, unable to provide for reforms and creating the flow of Islamic
radicals... The nature of Hezbollah, interference military and terrorists of Iran is currently forgotten.
..."
"... I think it will be very difficult to see any reapprochement with Iran in the coming months
as Saudi Arabia has two hardliners in the young rising generation of leaders. The heir and the vice-inherit
the Kingdom share the same radical line toward Iran. ..."
"... Moreover, Saudi Arabia pays very dear to his strategy of crushing oil prices, which makes it
less able to buy social peace than before. Therefore, there is an internal demand of radicalism, because
the discontent rumbles in the parts of the Saudi population fueled by the effects of the falling oil
prices. ..."
"... If one wanted to summaries, we could say that to buy a peace with Islamist Wahhabi radicals,
it is necessary to kill shia... besides, the Saudis have a genuine complex of encirclement by the Shiite
states. They try to counter it by creating an opposite ark of Sunni radicals. ..."
"... even if this does not lead to open warfare, the tension between Saudi Arabia and Iran is sustainable,
if only because this new generation of Saudis leaders is more combative. They differ from the former
kings who belonged to a generation that was distinguished rather by its search for a compromise and
some consensus. This is absolutely not the case for those two heirs of the throne. ..."
Atlantico : While today Saudi Arabia play the central role in the conflicts around the Middle
East which are worried the whole world. What do we know bout young chief of the armed forces of Saudi
Arabia ?
Antoine Basbous : His position is more precarious than the last year, and it looks like
he is trying to double cross his cousin crown prince.
He tries to use the advantage of the presence of his father on the throne to become a direct successor.
It is an assumption that is pretty crazy since theoretically, Mohammed bin Salman does
not belong to the chain of the succession because of his position in the family. In addition, it
is clearly lacking experience and legitimacy, compared to its brothers and cousins, but also to public
opinion.
He is someone of impulsive, short-tempered, as we already observed in the past. He behaves somewhat
like like his father when he was young. Previously, when he was less in the spotlight, he could afford
some mistakes. But since his appointment to the ministry of defense, he embodies the virile answer
of the kingdom to the set of challenges from Iran. Now, he certainly has placed contracts with firms
of communication that has allowed him to acquire the elements of language needed to smooth impression
about himself. They also help him to appear on major foreign media : recently, he appeared in the
journal The Economist. Since his appointment, there has been a genuine effort in the field of
PR. the goal is to create for him an image of a politician of an international stature. He seeks
to become the counterpart, if not the equal of the great western powers.
It is important to be opportunistic at this level and not to alienate the fringe wahhabi elements
of Saudi Arabia is of paramount importance. A little interaction with the West it OK, too much of
interactions with the West, this is detrimental to his image and his credibility. Therefore he tries
to advance his goal, while at the same time trying not to offend nobody. It is, after all, a dive
of discovery in the international political universe.
Inside, however, his authority comes from his status of the son to the King to whom his father
is listening a lot. In one year, it has greatly expanded its power. It controls not only the military,
budgets but also key sectors of the economy. It has separated the' ARAMCO (the biggest oil company
in the world) from the ministry of oil. This dramatically increases his economic power. In addition,
the minister of oil shall soon leave the position, and should be replaced by his half-brother. Mohammed
bin Salman leaves him a ministry deprived of any substance.
For his education, we know that he has studied the Law in Saudi Arabia, but has not, to my knowledge,
pursued follow-up studies in the West. Currently, he oversees the operations of the Coalition in
Yemen, together with his cousin prince Mohammed bin Nayef, the Interior minister and deputy crown
prince. So far, they are not in rivalry, on the contrary: as the minister of the Interior had no
sons, he might appoint Mohammed bin Salman to be a crown prince since their age gap is 21 years.
Moreover, the two men appear together on the front.
Alexander del Valle : Regardless of his background, he needs to prove that he matters,
that he is a hardliner, that he is a good minister of Defence, and that that he is anti-shiite, he
is a man capable of confronting Iran. At the same time, he needs to satisfy needs of Saudi population
which is increasingly flocks to jihadism. To consolidate its legitimacy, it is obliged to give
grain to grind to the islamists because a large part of the Saudi society is seduced by the dream
of Daech. It is also in a logic of competition with her uncle, who is the current heir of the thone,
as well as with the other princes. It is necessary to remove the ground under the feet of those
who believe that the monarchy has for too long been moderate, particularly during the reign of the
former king Abdallah. It is this desire to build his leadership, which leads to the direct confrontation
with the shia, including such political decisions as the execution of the leader of shiite Nimr al-Nimr,
and the increased tension with Iran. Finally, it also represents a reaction of the Saudi monarchy,
which was disappointed by the United States. He would like to stop normalization of Iranian-American
relations, because in the event of a confrontation with Iran, the Saudis would find themselves in
a difficult position without 100% US support.
Why his actions caused the concerns of the German intelligence services ? What assessment can
we make of year tenure at the head of the armed forces of Saudi Arabia ?
Antoine Basbous : It is important to understand the origins of this report. It is not excluded
that it comes from someone with an interest to harm the image of the Kingdom or of the Prince.
Prince Mohammed bin Salman tenure as the head of the armed forces can be characterized as a failure.
In Yemen, there has been a stalemate. The conflict began in April. We are in January. Nine months
later, despite the multiple bombardments, all of the money spent, the control of the Yemen government
from Ryad remains illusive... He has not managed to clean, to conquer and to install a protected
area. Moreover, where he was able to displaced the allies of Iran, the radicals from Al Qaeda
and DAESH took the control of those area. Iran became firmly positioned at the southern gateway to
Saudi Arabia. It is anything but a success.
Nevertheless, he was applauded because he stood up and responded, tried to stop to Iran. He
responded to the Iran thereat, but has not managed to achieve his goals, which was expected of him.
However, in the eyes of the Saudis, a "manly" reaction that tha fact that has the the will to challenge
to the hegemony of Iran in the region was positive steps. Iran has claimed control of four Arab
capitals. Hassan Rohani has announced the training of 200 000 militia in the five nations in their
neighborhood. A reaction of Saudi Arabia, in the light of these elements, is not unexpected or abnormal.
However, the latter has been slow to arrive and is not manifested in the most timely, the most intelligent
or the most effective.
However, this operation was his baptism of fire. Prior to the commencement thereof, the Prince
was suffering from a bad press. This conflict, it was his moment of truth so to speak. It should
be judged on its ability to generate a "surge" of military and diplomatic activities in the region,
so that Saudi Arabia free itself the control of the Us administration, and that the country acquires
a greater autonomy. The fact that Barack Obama has approved the nuclear deal with Iran has been perceived
as a lesson for the Turks and the Saudis. In addition, Mohammed bin Salman has a revenge in mind:
in 2009, the houthis crossed the Saudi border, and despite the superiority of Saudis weaponry, the
Saudi troops were able to repel that offence only after 3 months of fighting which left 130 soldiers
dead.
Alexander del Valle : It is perceived as dangerous because of the war, reckless and
ineffective in Yemen as well as its strategy of tension vis-à-vis Iran. Moreover, for the Germans,
Iran is a huge market. They have relied heavily on Iran in recent years, in the logical continuation
of the long tradition of trade between the two countries. Don't forget that it is a country that
lives from exports, and that it is therefore very important for the Germans to arrive at an agreement
with Iran. Moreover, Germany is a country whose strategy is intimately linked to that of the United
States and totally dependent on NATO due to the fact that it is forbidden to have an army of its
own. Germany knows that if it was a direct confrontation between Saudi Arabia and Iran, it would
be required to be supportive of Saudi Arabia – regardless of the efforts by Barack Obama to move
closer to Iran.
In fact, since the Covenant of Quincy, Saudi Arabia is bound by a close alliance with the United
States and through this with the western countries. Thus, the strategy of the prince Mohammed
Bin Salman is to push Iran to the fault in causing the tensions that can go up to a risk
of open warfare that would force the west to choose Saudi Arabia against Iran. This tactic is
based on the alliance of ultra-strategic-Pact of Quincy, which was renewed in 2006 by George W. Bush
and still valid today that fact that in any conflict, as soon as Saudi Arabia is struggling with
a rival in the region, the United States should support it. This looks like what Erdogan doing shoot
down a Russian plane. It was to prevent a warming of relations between the Russians and the Americans.
What are the limits of his influence in Saudi Arabia ? In what extent his role as the Minister
of Defence is decisive for his own future in the kingdom ?
Antoine Basbous :The Prince Mohammed bin Salman is now the most powerful man in Saudi
Arabia. It has exclusive access to his father, King Salman, and effectivly he can rule the coutries
inread of him. He is head of his office, which means that nobody can contact or be received by the
King without going through the son. He also can say to anyone inside as well as abroad, "This
is the will of the King". So he has phenomenal power, and does not suffer from the luch of desire
to exercise it. As to whether his role as Defence minister, is decisive for his own future, it is
obvious. If he succeeds in this position and it shows the virility of the military success, this
can strengthen its position. On the other hand, if this gets stuck into yeme war quadmire, if the
failures multiply, it is not excluded that this will ruin completely his chances of succeeding his
father. In a situation like this, He might well became a falling star. It is vital that he achive
a good results in the war on the ground, although in a majority of arab countries, the people is
not necessarily looking very attentively at the quality of governance.
What is the analysis of personality of this key figure and the balance sheet of his first year as
the Defense minister can say about the position of Saudi Arabia on the international scene in the
comong months ? What will be developments in the relations of Saudis and Iran ?
Antoine Basbous
:Saudi Arabia is extremely disturbed by the detente with Iran on the international scene.
We are witnessing more or less a reversal of alliances, and of countries images in the eyes of the
West. A short time ago, Iran was demonized in the West. Today, it is accepted as a normal partner.
Iran, therefore, benefits from a relatively favorable treatment, while at the same time when the
Arab monarchies, particularly Saudi Arabia, are seen as retrograde, unable to provide for reforms
and creating the flow of Islamic radicals... The nature of Hezbollah, interference military and terrorists
of Iran is currently forgotten.
Mohammed bin Salman is still an "emerging" politician, politician in the course of "on the job"
training. But despite of that he is exercising functions that are extremely strategic, and he must
demonstrate whether he can adapt to situations to which the country is facing.
Alexander del Valle : I think it will be very difficult to see any reapprochement with
Iran in the coming months as Saudi Arabia has two "hardliners" in the young rising generation of
leaders. The heir and the vice-inherit the Kingdom share the same radical line toward Iran.
Moreover, Saudi Arabia pays very dear to his strategy of crushing oil prices, which makes
it less able to buy social peace than before. Therefore, there is an internal demand of radicalism,
because the discontent rumbles in the parts of the Saudi population fueled by the effects of the
falling oil prices. An increase of sympathy for jihadism can be felt with those segments of
the population. So even if the prince Mohammed bin Salman and prince Mohammed ben Nayef – heir to
the throne and minister of the Interior - were moderate, they would be obliged to give pledges to
their people, who account for more of the "appeasers of Shiites". If one wanted to summaries,
we could say that to buy a peace with Islamist Wahhabi radicals, it is necessary to kill shia...
besides, the Saudis have a genuine complex of encirclement by the Shiite states. They try to counter
it by creating an opposite ark of Sunni radicals.
I thus do not see how there could be a rapprochement with Iran. Or it can be only via the pressure
of the United States, as was the case between Greece and Turkey in the past. Therefore, even
if this does not lead to open warfare, the tension between Saudi Arabia and Iran is sustainable,
if only because this new generation of Saudis leaders is more combative. They differ from the former
kings who belonged to a generation that was distinguished rather by its search for a compromise and
some consensus. This is absolutely not the case for those two heirs of the throne.
"... I try to stay away from thinking that is not based on evidence (aka: conspiracy staff), but at this point it does not matter as long as the stock of a company as important as CHK is to LTO plays and high yield financing (aka: junk bonds), is not left sinking below 50% at, or around 2 pm (time when margins are calculated and settled). ..."
"... As I wrote before, at this point we should all pray things are stable at ALL cost: legal, ilegal, too big or too small to fail or succed it does not matter. The alternatives are so horrible that no amount of gold and non-fiat honest money , or whatever – will be able to carry us through… ..."
Do not pay attention to links above, for they don't know how the stock market works (with regard
to a listed company: i.e. chesapeake CHK)
CHK is the second largest gas producer and the 12th largest oil producer (if I'm not mistaken).
CHK stock closed at $3.06 on Friday. At one point it reached $1.50 today before closing at
$2.04.
That is more than 50% decline (even though it closed with 33.33% decline)
Per NYSE/ARCA/NASDAQ/NYMEX rules (…that's what people posting links above do not know…among
other things!), if it would have closed below %50, it would have AUTOMATICALLY triggered margin
calls (unavoidable and immediate insolvency!
That is why you heard : "it hired Attorneys…" calls only when CHK reached $1.50) and – judging
from the size of the company and its significance for the LTO revolution (read: junk bonds!),
heaven help us all involved in the oil/energy business what would have come next (with regard
to other LTO/high yield financed companies) .
Do not listen to fundamentals and people who post links they saw on Bloomberg/CNBC and know
little to what they mean.
Be happy "somebody" bought CHK in the last hour of trading and took it to $2.04, otherwise….well,
I do not want to say it…
It is coming, but hopefully not today or tomorrow…but unfortunately it is coming.
And that is the main reason why the $60-$70 oil might be a dream…. Well, I do not want to sound
like a broken record…you know where I stand.
I try to stay away from thinking that is not based on evidence (aka: conspiracy staff),
but at this point it does not matter as long as the stock of a company as important as CHK is
to LTO plays and high yield financing (aka: junk bonds), is not left sinking below 50% at, or
around 2 pm (time when margins are calculated and settled).
If investors do not have enough cash to settle margins, they will panic and sell everything
and anything at any cost… which at this point will repeat Lehman but times 10000…000…000…
Plus, since Rubin/Summers/Clinton et al repealed Glass-Stegal in 1999, all banks including
what you call TBTF are techically and legally allowed to do what you imply they do.
As I wrote before, at this point we should all pray things are stable at ALL cost: legal,
ilegal, too big or too small to fail or succed it does not matter.
The alternatives are so horrible that no amount of gold and "non-fiat" "honest" money , or whatever
– will be able to carry us through…
Pray that grammy Yellen and TBTF keep it stable…pray.
I do everyday…
Whoever tells you otherwise (at this point) knows very little of how economy truly works.
Total world consumption is around 96 mm bbp per day
Notable quotes:
"... The IEA forecast that stock building could continue in the second half of 2016 at a rate of 300 million barrels a day. It said: If these numbers prove to be accurate, and with the market already awash in oil, it is very hard to see how oil prices can rise significantly in the short term. ..."
"... find how much storage capacity there is, and essentially manufacture that number too, and then derive backwards how much is required to fill it, and then subtract another essentially imaginary number as to how much of the capacity was already filled on some arbitrary date - and you can declare how much oversupply "there must be". ..."
"A recent rise in oil prices is a "false dawn" and the oversupply of crude is set to worsen,
according to the International Energy Agency (IEA)….
The IEA forecast that stock building could continue in the second half of 2016 at a rate
of 300 million barrels a day. It said: If these numbers prove to be accurate, and with the market
already awash in oil, it is very hard to see how oil prices can rise significantly in the short
term."
This is what happens when a theory is accepted as fact.
If there's too much oversupply for storage
to exist, well then, the oversupply must have been less than thought. In fact, find how much storage
capacity there is, and essentially manufacture that number too, and then derive backwards how
much is required to fill it, and then subtract another essentially imaginary number as to how
much of the capacity was already filled on some arbitrary date - and you can declare how much
oversupply "there must be".
They would be laughed out of the room at any physics seminar.
This is not an end of oil price slum, but we might well be close to inflection point.
Notable quotes:
"... Well here is the thing about what has happened with oil production and where is it going. A year ago I have said when we saw the first glimpse of production stall that for low oil prices the best cure is low oil prices. It took a year to confirm that and sometimes it is like watching the paint dry but numbers are finally confirming that. NA production is the first one to show decrease in oil production since oil crash started. ..."
"... Shale Play: Bakken is fallen 13% from December of 2014, EF was steeper, 28% from high March 2015. ..."
"... Oil Sand/Deep water: These high-cost, low-decline projects are all cancelled meaning that in their absence decline rates are going to increase. ..."
"... Russias producers had a silver lining of comparatively lower cost of production and currency exchange rate that helped them show a paper profit but hard to see how with $33 Brent there would be any significant increase in production in the near future. ..."
"... North Dakota Active Drilling Rig List at 40 including one stacking … 137 one year ago (-71%) ..."
Well here is the thing about what has happened with oil production and where is it going.
A year ago I have said when we saw the first glimpse of production stall that for low oil prices
the best cure is low oil prices. It took a year to confirm that and sometimes it is like watching
the paint dry but numbers are finally confirming that. NA production is the first one to show
decrease in oil production since oil crash started.
Shale Play: Bakken is fallen 13% from December of 2014, EF was steeper, 28% from high March
2015. Total production from the seven shale plays is down 10% since September 2014. With
the number of active rigs there is only one way for oil production to go in the near future and
it is down.
Oil Sand/Deep water: These high-cost, low-decline projects are all cancelled meaning that
in their absence decline rates are going to increase.
The rest of the world is little bit harder to determine since I don't follow very closely.
Except few general observations that North Sea production is between rock and hard place. High
cost production considering $30-33 Brent and high cost of decommissioning so take your poison
pill wisely. Russia's producers had a silver lining of comparatively lower cost of production
and currency exchange rate that helped them show a paper profit but hard to see how with $33 Brent
there would be any significant increase in production in the near future.
OPEC – well Opec got fragmented if not totally disintegrated in 2 blocks: Sunni and
Shiite + Latino block so any talk about OPEC speaking with one voice is misplaced. So as result
every OPEC member produces as much as they can in order to keep head above water.
Quite simply it is about how oil companies were financed.
Here's Dow (emphasis mine):
But on [the subject of oil] we came away with an answer, something wiser (not smarter, wiser)
market types have been suppurating for several months: the supply pressures won't stop until
debt-financed production becomes equity-financed production. It really is that simple.
The reasoning is clear: We know you can't hold back production to get higher prices later if you
have debt to service. Only equity financed production has that luxury.
The process is also clear: The highly leveraged producers drown each other with supply
in an attempt to be the last man floating, but ultimately all sink. The equity holders get
wiped out and the bond holders become the new equity holders in exchange for writing off their debt
claims. Sometimes the new equity holders sell their claims to others in the process. Sometimes they
hold on. But either way the new owners have made time their friend instead of their enemy.
And so this is really all about the balance sheets.
Right now oil prices are low as production from both state-owned oil companies and independent
shale producers - who have both largely been funded by debt over the last several years with most
of this investing done while prices were about triple today's prices - continues to flood an already
oversupplied market.
If a company were financed mostly by equity, for example, it might slow production to keep earnings
per share afloat or push forward with selling oil at lower prices and leaving fewer earnings (or
even losses) for its equity investors.
Of course, this is something equity investors are (in theory) prepared to handle because in order
to get a potential shot at huge returns if a business in a success you take these chances on the
downside.
But, as Dow notes, since these producers need to pay back their bondholders, who have more senior
claims on the company's assets and production than equity holders, companies continue pumping oil
to get whatever price they can to bring in whatever cash possible to pay back creditors.
A recent
report out from Jaime Caruana at the Bank for International Settlements looked at the relationship
between debt and oil companies, finding that oil and gas company bonds outstanding rose from $455
billion in 2006 to $1.4 trillion in 2014 while syndicated loans to the sector increased from $600
billion to $1.6 trillion over the same period.
And recently, this debt has been under considerable stress.
(BIS)
And driving at the same idea Dow came upon, Caruana wrote:
More pertinently for the price of oil, there is an impact on production. Highly leveraged producers
may attempt to maintain, or even increase, output levels even as the oil price falls in order to
remain liquid and to meet interest payments and tighter credit conditions. Second, firms with high
debt levels face stronger imperatives to hedge their exposure to highly volatile revenues by selling
futures or buying put options in derivatives markets, so as to avoid corporate distress or insolvency
if the oil price falls further.
That, it seems, is at least one reason you end up with charts that look like this where supply
continues to outpace demand.
"... We have witnessed unprecedented volatility in E P stocks in recent months. But the commodity crash is spreading to Biotechs and even the broader technology sector with the implosion of Linkedin stock last week. ..."
"... If an investor cant rationalize valuation then they simply wont invest. That has exacerbated price movements by those who are left: shorts and algo-trades (i.e., computers). On the former, its clear that the unprecedented level of short positions in the E P space and in futures market illustrate the drivers of this volatility. ..."
"... Broadly speaking the advent of computer driven trading that captures headlines and trades off it is part of this. But also the computerization of portfolio management through low-cost ETFs has become an even greater force. And as a result, money flows are becoming increasing disconnected from fundamental price movements. ..."
"... Simply put, institutions play macro factors, such as central bank policy moves, pulling moneys in and out of ETFs irrespective of underlying stock fundamentals or valuations. It is why large-cap tech stocks have risen to ridiculous valuations, such as with AMZN, only to fall some 30 percent in weeks – again, largely tied to macro money flows. ..."
"... We are certainly in an era of extreme asset price distortion, driven by central banks and new methods of computerized investing. It isnt clear that this is a good thing. ..."
"... In September, Goldman Sachs lowered expectations for the average oil price for 2016, assuming that it will drop to $ 20 a barrel. Expectations of Goldman Sachs were whole-heartedly supported by Merrill Lynch , Bank of America and others. ..."
"... Supply contracts for actual oil makes only 2% percent of the market, the rest - speculative securities, futures and other derivatives. Prices for futures are not determined by supply and demand, but by expectations . The futures market is completely controlled by the largest US banks. This is the market of expectations, which creates a real Industry of expectations using the notorious rating agencies, independent experts and the media. ..."
"... HFT is a predatory beast that causes major market volatility, which in turn uses said volatility to take money from people that dont use HFT! ..."
Recently, I dedicated some time studying in much further depth the explosion in
volatility
in the broader market as well as in underlying stocks. We have witnessed unprecedented
volatility in E&P stocks in recent months. But the commodity crash is spreading to Biotechs
and even the broader technology sector with the implosion of Linkedin stock last week.
First, it is important to note what is driving the incremental volume as overall investor
participation in day-to-day trading wanes.Every investor has witnessed a huge decline in
overall liquidity, in part due to an investor class disenfranchised by 7 to 8 years of central bank
easing and resulting asset price distortions. If an investor can't rationalize valuation then they
simply won't invest. That has exacerbated price movements by those who are left: shorts and algo-trades
(i.e., computers). On the former, it's clear that the unprecedented level of short positions
in the E&P space and in futures market illustrate the drivers of this volatility.
But more importantly, the price surges on certain short-term headlines – such as a potential OPEC
meeting on output changes – leads to spiking prices one day, only to have them revert lower in the
days that follow. These are classic tells to short covering. Broadly speaking the advent
of computer driven trading that "captures headlines" and trades off it is part of this.
But also the computerization of portfolio management through low-cost ETFs has become an even greater
force. And as a result, money flows are becoming increasing disconnected from fundamental price movements.
This is occurring institutionally and through retail-based wealth management adoption
of new technology. It is why you see individual stocks rise and fall by double digits in
a single day when fundamental events like an earnings report are released, like LinkedIn. Simply
put, institutions play macro factors, such as central bank policy moves, pulling moneys in and out
of ETFs irrespective of underlying stock fundamentals or valuations. It is why large-cap tech stocks
have risen to ridiculous valuations, such as with AMZN, only to fall some 30 percent in weeks – again,
largely tied to macro money flows.
On the wealth management front it is getting even more ridiculous. The use of
robo-advisors, via Schwab and Wealthfront, use asset relocation computer algorithms, which are not
based on what's occurring day-to-day or month-to-month as earning miss expectations. Instead it does
so based on historical returns and individual preferences like risk appetite. The problem is that
the vehicles of choice are low-cost ETFs that are not actively managed funds by investment professionals
who allocate monies based on fundamentals.
What's more scary is that these robo- or computer-based advisors can't mitigate short- to medium-term
market risk by recommending to raise cash. Many investors probably are just now realizing
this as their "advisor" (probably a computer) maintains an allocation based on long-term goals, not
on whether we are in a secular bear market, which would suggest de-risking. All of these
factors open the door to more volatility and even severe market crashes. We already saw some of that
occur last year.
One last point. I wonder if a computer is sophisticated enough to determine the normalized
price of a commodity in order to support production growth so as to prevent a price spike in 2017?
Somehow I doubt it. More likely would be the tendency to instead weigh the swings in the
dollar or Fed policy as important price determinants. For that matter, I'm certain they failed to
foresee the bear market we are now in. We are certainly in an era of extreme asset price
distortion, driven by central banks and new methods of computerized investing. It isn't clear that
this is a good thing.
hedgeless, "Just Observing" further down
7161265
quotes "Voltairenet" (a Russian site, if I remember correctly) that blames
the banks , specifically Goldman Sachs
As such, a way more plausible theory then Central Bank manipulation, straight. because CBs
usually don't want to make their fingers dirty if they can avoid that
If they want to have gold traded the "right way", for example, they call their confidential
bank, the BIS, and have that gold desk do the trade on their behalf
Having said that, the fact that everybody is pumping (and fracking) as if there was no tomorrow
and taking off 40 years old bans and embargos has to impact the oil prices
I have to disagree HH, the CB's don't have to do a damned thing for the oil market to gyrate
in bizarre ways. They do however add a lot of fuel to the fire.....
A shallow-minded school of social philosophers, the anarchists, chose to ignore the matter
by suggesting a stateless organization of mankind. --Ludwig von Mises
When the wheels finally come off, HFT will be one of the Golden Scapegoats of the whole fiasco
(but not tho$e employing it for $ome rea$on). Politicians will rail against it, Pundits will fall
in line and do the same. However, great pains will be taken not to implicate our wonderful President
or the Fed in any capacity.
Voltairenet explains how Goldman manipulates the oil market:
Goldman Sachs makes oil prices drop by Mikhail Leontyev
Schedule of falling oil prices, adjusted in relation to the current fluctuations, has essentially
been a straight line since last September, when prices fell from $ 50 per barrel to the current
$ 29. What was so momentous that happened in the world market in September? In September,
"Goldman Sachs" lowered expectations for the average oil price for 2016, assuming that it will
drop to $ 20 a barrel. "Expectations" of "Goldman Sachs" were "whole-heartedly" supported by "Merrill
Lynch", "Bank of America" and others.
There you have it - $ 20, quoted by "Goldman Sachs", was not a forecast. It was the target.
Only our own Ministry of Economy is the one that makes forecasts, "Goldman Sachs" , on the other
hand, makes the markets. The oil market - is not the market of raw materials. Supply contracts
for actual oil makes only 2% percent of the market, the rest - speculative securities, futures
and other derivatives. Prices for futures are not determined by supply and demand, but by "expectations".
The futures market is completely controlled by the largest US banks. This is the market of expectations,
which creates a real "Industry of expectations" using the notorious rating agencies, "independent"
experts and the media.
North Sea Brent crude oil prices averaged $31/barrel (b) in January, a $7/b decrease from
December and the lowest monthly average price since December 2003. Brent crude oil prices averaged
$52/b in 2015, down $47/b from the average in 2014. Growth in global liquids inventories, which
averaged 1.8 million barrels per day (b/d) in 2015, continues to put
downward pressure
on Brent prices.
Brent crude oil prices are forecast to average $38/b in 2016 and $50/b in 2017. Forecast West
Texas Intermediate (WTI) crude oil prices are expected to average the same as Brent in both years.
However, the current values of futures and options contracts continue to suggest high uncertainty
in the price outlook. For example, EIA's forecast for the average WTI price in May 2016 of $36/b
should be considered in the context of recent Nymex contract values for May 2016 delivery (Market
Prices and Uncertainty Report) suggesting that the market expects WTI prices to range from
$21/b to $58/b (at the 95% confidence interval).
The U.S. retail regular gasoline price is forecast to average $1.98/gallon (gal) in 2016 and
$2.21/gal in 2017, compared with $2.43/gal in 2015. In January, the average retail regular gasoline
price was $1.95/gal, a decrease of 9 cents/gal from December and the first time monthly gasoline
prices averaged below $2/gal since March 2009. EIA expects the monthly average retail price of
U.S. regular gasoline to reach a seven-year low of $1.82/gal in February 2016, before rising during
the spring.
U.S. crude oil production averaged an estimated 9.4 million b/d in 2015, and it is forecast
to average 8.7 million b/d in 2016 and 8.5 million b/d in 2017. EIA estimates that crude oil production
in January was 70,000 b/d below the December level, which was 9.2 million b/d.
Natural gas working inventories were 2,934 billion cubic feet (Bcf) on January 29, 20% higher
than during the same week last year and 18% higher than the previous five-year average (2011-15)
for that week. EIA forecasts that inventories will end the winter heating season (March 31) at
2,096 Bcf, which would be 41% above the level at the same time last year. Henry Hub spot prices
are forecast to average $2.64/million British thermal units (MMBtu) in 2016 and $3.22/MMBtu in
2017, compared with an average of $2.63/MMBtu in 2015.
"... global oil demand growth is forecast to ease back considerably in 2016, to 1.2 mb/d ..."
"... Oil Market Report ..."
"... Global oil supply dropped 0.2 mb/d to 96.5 mb/d in January, ..."
"... Non-OPEC supplies slipped 0.5 mb/d from a month earlier to stand close to levels of a year ago. For 2016 as a whole, non-OPEC output is expected to decline by 0.6 mb/d, to 57.1 mb/d. ..."
"... Global refinery runs fell by 1.3 mb/d in January to 79.8 mb/d, as the onset of seasonal maintenance in the United States and weakening refinery margins curbed runs. Global throughputs nevertheless stood more than 1.7 mb/d above a year earlier, with gains particularly strong in the United States and the Middle East. ..."
"... After growing by an estimated 1.8 million b/d in 2015, global oil inventories are forecast to grow by 1.4 million b/d in the first quarter of 2016. ..."
"... With global oil inventory builds expected to continue in 2016, upward pressure on crude oil prices will be limited. Forecast Brent prices will average $38/b in 2016, $3/b lower than forecast in last months STEO. The largest inventory builds occur in the first half of 2016, helping keep Brent prices below $40/b through August. ..."
"... Forecast West Texas Intermediate (WTI) crude oil prices average the same as Brent crude oil prices through the forecast period, compared with $2/b lower than Brent in 2016 and $3/b lower in 2017 in the prior STEO. The price parity of WTI with Brent in the forecast period is based on the assumption of competition between the two crudes in the U.S. Gulf Coast refinery market, as transportation differentials are similar to move the crudes from their respective pricing points to that market. ..."
Having peaked, at a five-year high of 1.6 million barrels per day (mb/d) in 2015, global oil
demand growth is forecast to ease back considerably in 2016, to 1.2 mb/d, pulled down by notable
slowdowns in Europe, China and the United States, the newly released IEA Oil Market Report(OMR)
for February informs subscribers. Early elements of the projected slowdown surfaced in the last quarter
of 2015.
Global oil supply dropped 0.2 mb/d to 96.5 mb/d in January, as higher OPEC output only
partly offset lower non-OPEC production. Non-OPEC supplies slipped 0.5 mb/d from a month earlier
to stand close to levels of a year ago. For 2016 as a whole, non-OPEC output is expected to decline
by 0.6 mb/d, to 57.1 mb/d.
OPEC crude oil output rose by 280 000 barrels per day in January to 32.63 mb/d as Saudi Arabia,
Iraq and a sanctions-free Iran all turned up the taps. Supplies from the group during January stood
nearly 1.7 mb/d higher year-on-year.
OECD commercial stocks built counterseasonally by 7.6 mb in December to stand at 3 012 mb at month
end, 350 mb above average. Refined products covered 32.3 days of forward demand, 0.1 day above the
level at end-November. Preliminary information indicates that inventories have continued building
into January.
Global refinery runs fell by 1.3 mb/d in January to 79.8 mb/d, as the onset of seasonal maintenance
in the United States and weakening refinery margins curbed runs. Global throughputs nevertheless
stood more than 1.7 mb/d above a year earlier, with gains particularly strong in the United States
and the Middle East.
Global Crude Oil Prices
Brent crude oil spot prices decreased by $7/b in January to a monthly average of $31/b, the lowest
monthly average price since December 2003. Ongoing growth in global oil inventories and uncertainty
over future global demand growth continued to put downward pressure on oil prices during January.
After growing by an estimated 1.8 million b/d in 2015, global oil inventories are forecast to grow
by 1.4 million b/d in the first quarter of 2016.
During January, daily changes in crude oil prices were highly correlated with daily changes in
global equity indexes. The increased co-movement and higher volatility likely reflect increased uncertainty
about future global economic growth. Changes in overall demand for risk assets, such as commodities
and equities, by investors and market participants may also be playing a larger role in price discovery
across global asset markets compared with previous months.
With global oil inventory builds expected to continue in 2016, upward pressure on crude oil prices
will be limited. Forecast Brent prices will average $38/b in 2016, $3/b lower than forecast in last
month's STEO. The largest inventory builds occur in the first half of 2016, helping keep Brent prices
below $40/b through August.
Brent prices are forecast to average $50/b in 2017, with upward price pressure concentrated later
in that year. At that point, the market is expected to experience small inventory draws, with the
possibility of further draws beyond the forecast period. Brent prices are forecast to average $56/b
in the fourth quarter of 2017.
Forecast West Texas Intermediate (WTI) crude oil prices average the same as Brent crude oil prices
through the forecast period, compared with $2/b lower than Brent in 2016 and $3/b lower in 2017 in
the prior STEO. The price parity of WTI with Brent in the forecast period is based on the assumption
of competition between the two crudes in the U.S. Gulf Coast refinery market, as transportation differentials
are similar to move the crudes from their respective pricing points to that market.
The current values of futures and options contracts continue to suggest both heightened volatility
and high uncertainty in the price outlook (Market
Prices and Uncertainty Report). WTI futures contracts for May 2016 delivery, traded during the
five-day period ending February 4, averaged $35/b, while implied volatility averaged 57%. These levels
established the lower and upper limits of the 95% confidence interval for the market's expectations
of monthly average WTI prices in May 2016 at $21/b and $58/b, respectively. The 95% confidence interval
for market expectations widens over time, with lower and upper limits of $19/b and $85/b for prices
in December 2016. At this time last year, WTI for May 2015 delivery averaged $52/b, and implied volatility
averaged 52%. The corresponding lower and upper limits of the 95% confidence interval were $33/b
and $81/b.
"After spending many years in Wall Street and after making and losing millions of dollars I
want to tell you this: it never was my thinking that made the big money for me. It was always
my sitting. Got that? My sitting tight!
Those who can both be right and sit tight
are uncommon. I found it one of the hardest things to learn."
Jesse Livermore
I had such a feeling that these jokers were going get stuffed on the usual Non-Farm Payrolls precious
metals hit. And I may have had some modest wagers in that direction from this morning.
But for most of us, and for most of my own portfolio, we do not wager against The Bucket Shop
and exhaust ourselves trying to play their short term wiggles, dodges and headfakes ...
We 'get right and sit tight.' And I am seeing confirmation after confirmation that the
fundamentals ... are solid, to be understated about it perhaps when so many will be going hyperbolic.
There are still difficulties, and things could turn rather ugly on the political fronts.
Who can predict that sort of thing? But based on the knowable, things are unfolding in a
very rational manner for those who can see past the noisome rantings of the financiers and their
economic status quo.
... The top dogs in the oilfield services patch-Schlumberger and Halliburton-paint an even more
dismal picture.
In late January, Schlumberger (NYSE:SLB) cut 10,000 jobs after reporting losses of $1.02 billion,
with a 38 percent contraction in revenue from its peak in the third quarter of 2014 to the fourth
quarter of 2015.
As recently as 2014, Schlumberger had posted profits of $302 million, but has since fallen around
44 percent over the past year and a half. In just this past year, Schlumberger reported a 27 percent
fall in revenues, and a 39 percent drop in the fourth quarter alone.
January's job cuts bring Schlumberger's total job cuts up to 34,000-or 26 percent of its workforce-since
the third quarter of 2014. That tops Weatherford's 14 percent workforce loss.
The No. 2 player in this patch, Halliburton (NYSE:HAL), has laid off some 22,000 workers, or 25
percent of its global workforce. The most recent cuts came in the last week of January, when the
company announced it had cut an additional 4,000 jobs coming off fourth quarter 2015 reports showing
a net income loss of $28 million for the quarter, or 79 cents per share for the full year.
"The brutality and length of this down cycle has challenged the entire industry, both our customer
base as well as our peers," Weatherford's top executive Bernard J. Duroc-Danner said in a statement.
The first wave of energy industry job cuts came in January 2015, from the producers. This January
was the culmination of the snowball effect that has reached the oilfield services segment-and none
is immune, with Weatherford's story par for the course and no better or worse than its peers. This
year will be darkest for oil services because the bottom hit its customers first.
Shale economics have significantly changed over the last two years to worse
as depletion never sleeps
Notable quotes:
"... In my view shale economics have significantly changed over the last two
years. The monthly decline rate (see below chart) reached in the Eagle Ford oil
basin nearly 12%. ..."
"... Legacy decline is close to 150 kb/d and month since a few months now and
production is declining and currently stands at around 1.2 mill b/d. The above decline
rate is legacy decline divided by actual production. ..."
"... Of course the actual decline is lower as there is also production from
new wells, yet my chart shows the internal decline which has to be replaced by companies
and is just an indicator how fast the Red Queen has to run. ..."
"... It is in my view exactly the increasing demand for capital to keep oil
and gas production stable, which weakens the bond market, which then spills over
to the economy and stock market. As companies did not want to curb production voluntarily,
they are forced now to do so over a collapsing bond market. ..."
"... The real wall is when it takes 1 unit of energy to get 1 unit of energy
out. Ehh – no – that cant be. What equipment would they use to get that out? So
we need a functioning steel industry. We actually need a bit more than that. An
oil platform incorporates pretty much everything modern in this world, engines and
motors of all kinds. Computers. And we might want to get to the platform. So we
need some helicopters. A complicated machine. ..."
"... Depletion never sleeps. ..."
"... The 10% decline rate without continuous infill drilling is particularly
worrying. Mostly infill drilling accelerates production but does little for overall
capture (sometimes a bit of increase in recovery, but sometimes it can have the
opposite effect) so the more they are used the more the decline rate will increase
after the peak. I know the 10% figure is for offshore fields but a) this is not
encouraging for the prospects of deepwater development b) there have been recent
large infill drilling programs in Russia and ME – if the result is that their declines
tend towards 10% rather than 2 or 3 in the near term then look out. ..."
"... The export issue is also relevant to consider. Say a 10% reduction in production
would likely be a 20% reduction in export availability (maybe a bit more because
of EROI issues and growing domestic use, especially if wars and social unrest escalate)
– which would crush most European and a good few developing countries economies
even if they were looking reasonably healthy, which they obviously arent, and without
the ever increasing waves of refugees coming their way. ..."
In my view shale economics have significantly changed over the last
two years. The monthly decline rate (see below chart) reached in the Eagle
Ford oil basin nearly 12%.
Although Marcellus has somewhat stabilized and Utica, which is still
in its infancy, even improved, it is in my opinion just a matter of time
when decline rates increase for all shale plays.
This trend has not been baked into many economic and forecasting models
– quietly assuming constant decline rates – and comes now as a surprise
for many analysts and investors.
It comes from the EIA drilling report. Legacy decline is close to
150 kb/d and month since a few months now and production is declining and
currently stands at around 1.2 mill b/d. The above decline rate is legacy
decline divided by actual production.
Of course the actual decline is lower as there is also production
from new wells, yet my chart shows the internal decline which has to be
replaced by companies and is just an indicator how fast the 'Red Queen'
has to run.
It is in my view exactly the increasing demand for capital to keep
oil and gas production stable, which weakens the bond market, which then
spills over to the economy and stock market. As companies did not want to
curb production voluntarily, they are forced now to do so over a collapsing
bond market.
As Eagle Ford is one of the most mature plays, it serves in my opinion
as a blueprint for more recently started basins such as Marcellus and Utica.
Interested in this, as North Dakota's decline rate stalled (i.e. many years
stopped declining all together, or even grew) in October and November as
operators opened the chokes on their old wells.
This was completely predictable; I just didn't think it would slow down
by 2015/2016…I thought the head of steam might have lasted till ~ 2018-2021
or so.
Will the boom times come roaring back, bigger and crazier than ever?
None of us know.
What we do know: The Earth is finite, the amount of FFs in the ground
is finite, and depletion never sleeps, and the distribution of FF deposits
(size, frequency) seems to follow the power law…and the cost to raise each
bbl of oil and mcf of methane and ton of coal will continue to rise.
Barring a breakthrough which produces inexpensive, compact, ubiquitous
'Mr. Fusion' power reactors, the outlook looks bleak. Even with a 'Mr. Fusion'
breakthrough, other source and sink limits would end up eating humanity's
lunch if population increase was no slowed, stopped, and reversed at some
point, and the seemingly endless increase in per capita consumption slowed
and then reversed as well. But a 'Mr. Fusion' breakthrough would sure give
us some breathing room to mature as a species and figure out how to bring
our existence into some kind longer-term sustainable future, one in which
we do not exterminate many of the other species on Earth.
I would bet that Ron's "lead pipe cinch" prognosis will turn out to be
correct.
As grim as the depletion curves from Campbell et al looked like, those were
best case scenarios.
The real wall is when it takes 1 unit of energy to get 1 unit of
energy out. Ehh – no – that can't be. What equipment would they use to get
that out? So we need a functioning steel industry. We actually need a bit
more than that. An oil platform incorporates pretty much everything modern
in this world, engines and motors of all kinds. Computers. And we might
want to get to the platform. So we need some helicopters. A complicated
machine.
And even if we have all of that, we still done have any energy left for
the rest of the economy.
"As grim as the depletion curves from Campbell et al looked like, those
were best case scenarios."
That was pretty much my thought as well. This is one of the more depressing
posts here. I've been thinking we'd muddle through for a good few more years
even as oil depleted but if these figures are born out I'm not so sure.
The 10% decline rate without continuous infill drilling is particularly
worrying. Mostly infill drilling accelerates production but does little
for overall capture (sometimes a bit of increase in recovery, but sometimes
it can have the opposite effect) so the more they are used the more the
decline rate will increase after the peak. I know the 10% figure is for
offshore fields but a) this is not encouraging for the prospects of deepwater
development b) there have been recent large infill drilling programs in
Russia and ME – if the result is that their declines tend towards 10% rather
than 2 or 3 in the near term then look out.
In addition for the ME – I cannot see how the ruling regimes can be maintained
once serious decline sets in and is recognised as such by the populace (i.e.
that there will be no recovery). As the cradle to grave social programs
have to be continuously cut then there must be some kind of uprising, which
you'd expect would lead to significant, and maybe permanent, disruption
of production (and therefore less overall recovery).
The export issue is also relevant to consider. Say a 10% reduction
in production would likely be a 20% reduction in export availability (maybe
a bit more because of EROI issues and growing domestic use, especially if
wars and social unrest escalate) – which would crush most European and a
good few developing countries' economies even if they were looking reasonably
healthy, which they obviously aren't, and without the ever increasing waves
of refugees coming their way.
Compare this with recent Moragan staney fearmongering (Morgan Stanley has forecast that Brent
crude oil prices could average $31 per barrel in 1Q16 and $30 per barrel in both 2Q16 and 3Q16. The
previous forecast was $42, $45 and $48 in 1Q16, 2Q16, and 3Q16, respectively.)
Notable quotes:
"... And finally, the answer to the question that everyone wants to know: where do you see oil prices going this year? ..."
"... And do you see that persisting through 2017, or going up dramatically, or is it just too hard to tell? ..."
Oilprice.com recently spoke with Carl Larry, Director of Oil and Gas at Frost &
Sullivan, a consultancy that conducts research on oil and gas markets, to get his thoughts on the
state of oil in 2016.
OP:And finally, the answer to the
question that everyone wants to know: where do you see oil prices going this year?
CL: Well, I think the funny thing is
that in past years we have all had a price target, where we all forecasted. Now I think it is
about a range. It's about where are oil prices going to stay in the next year and probably the
next couple of years, at least with this pace of economic growth and oil production.
So, I'd say between $35 and $55 right now. And I think to
narrow that down I'd probably say that $45 to $48 is going to be an average price for the year.
And I do think that there is definitely more risk to the upside than there is to the downside at
this point.
OP:And
do you see that persisting through 2017, or going up dramatically, or is it just too hard to
tell?
CL: I think it goes up. I think that
definitely the tensions in the Middle East are not going to go away. That is something that is
historically not going to go away. It is never going to go away. I think that if there are more
economies that slowdown or break off from production, we could definitely see that issues like
growth in the U.S. pick up the pace of WTI price more than Brent. So I definitely think that is
something that could continue over the next couple of years.
Iran signed an agreement to supply crude oil with Hellenic Petroleum SA,
a Greek oil refinery, in what may be the Persian Gulf producer's first such
deal with a European company since the removal of international sanctions this
month.
Deliveries will begin immediately, Hellenic Petroleum said in an e-mailed
statement on Friday. The agreement also includes an adjustment for a financial
backlog owed to Iran's state oil company after sanctions imposed four years
ago, according to the statement. Iran's Deputy Oil Minister Amir Hossein Zamaninia
discussed potential energy co-operation with Greek Energy Minister Panos Skourletis
earlier on Friday in Athens.
The oil market is bracing itself for a ramp up in supplies from Iran amid
a global supply glut that pushed prices down to a 12-year low. Oil analysts
surveyed by Bloomberg anticipate the nation will ship 100,000 barrels a day
more crude within a month of sanctions ending, and four times that within half
a year. Iran says it will boost exports by 500,000 barrels a day right away.
Europe had been Iran's second-biggest oil customer before sanctions were
introduced, purchasing nearly 600,000 barrels a day from the Middle East nation
in 2011, according to the U.S. Energy Information Administration. Greece was
one of the biggest European importers, buying about 120,000 barrels a day in
2011, data from the International Energy Agency shows.
The return of Iranian oil could send prices even lower, as it fills in the
gap left by the decline in U.S. shale production, the IEA warned on Jan. 19.
Flows of Iranian crude to Europe may displace similar grades sold by Russia
and Iraq, which may in turn be diverted to the U.S., Citigroup Inc. predicts.
European oil companies such as Royal Dutch Shell Plc, Eni SpA and Total SA
have said they're interested in returning to Iran to develop its oil reserves,
which are the fourth-biggest in the world.
"... Deals signed just over a week ago when Iranian President Hassan Rouhani
met his French counterpart, Francois Hollande, in Paris included some 20 agreements
and a $25-billion accord under which Iran will purchase 73 long-haul and 45 medium-haul
Airbus passenger planes to update its ageing fleet. Carmaker Peugeot-which was forced
to pull out of Iran in 2012--also agreed to return to the Iranian market in a five-year
deal worth $436 million. ..."
"... In the reverse flow of the new deal, Total has agreed to buy between 150,000
and 200,000 barrels of Iranian crude a day, with company officials also noting that
Total would be looking at other opportunities as well in oil, gas, petrochemicals
and marketing. ..."
"... According to Iranian media , Total will start importing 160,000 barrels
per day in line with a contract that takes effect already on 16 February. ..."
"... Total will likely want back in on this project, and buying Iranian oil
surely helps. And Iran, likewise, is eagerly seeking out European markets, with
the Iranian Oil Ministry now saying that it's crude oil sales to Europe have exceeded
300,000 barrels per day , counting the Total deal. ..."
"... Iran has recently signed oil contracts not only with French Total, but
also with Russian Lukoil's trading arm, Litasco, and Spanish refiner Cepsa. The
Ministry says that Italian oil giant Eni is interested in buying 100,000 bpd from
Iran, and that such a contract will be discussed soon in Tehran. ..."
"... Iran is seeking to bill its new crude oil sales in euros in order to reduce
dependence on the U.S. dollar, the news agency reported, citing an anonymous NIOC
source. ..."
"... Washington is not going to appreciate this additional threat to the petro
dollar . This would add Iran to the growing list of countries that, over the past
few years, have begun to pose a challenge to the current system by forming pacts
to transact oil in local currencies. ..."
As Airbus and Peugeot finally return to post-sanctions Iran, the trade-off
is Iranian oil, with French Total SA taking the plunge in an agreement to buy
up to 200,000 barrels per day of Iranian crude--but the catch is that
sales will be in euros.
Deals signed just over a week ago when Iranian President Hassan Rouhani
met his French counterpart, Francois Hollande, in Paris included some
20 agreements and a $25-billion accord under which Iran will purchase 73
long-haul and 45 medium-haul Airbus passenger planes to update its ageing fleet.
Carmaker Peugeot-which was forced to pull out of Iran in 2012--also agreed to
return to the Iranian market in a five-year deal worth $436 million.
In the reverse flow of the new deal, Total has agreed to buy between
150,000 and 200,000 barrels of Iranian crude a day, with company officials also
noting that Total would be looking at other opportunities as well in oil, gas,
petrochemicals and marketing.
According to Iranian media, Total will start importing 160,000 barrels
per day in line with a contract that takes effect already on 16 February.
Total never really left Iran, though. While it
stopped all oil exploration and production activities there in 2010, making
it one of the last to withdraw, it still maintained an office there.
Since 1990, Total has been a key investor in Iranian energy, playing a role
in the development of Iran's Sirri A&E oil and South Pars gas projects. Sanctions
also halted its planned involvement in the LNG project linked to Iran's South
Pars Phase 11.
But Total's work in Iran hasn't been without its problems-even without sanctions.
In May 2013, Total agreed to pay
$398.2 million to settle U.S. criminal and civil allegations that it
paid bribes to win oil and gas contracts in Iran. U.S. authorities claimed
that between 1995 and 2004, Total paid about $60 million in bribes to an Iranian
government official to win lucrative development rights in three South Pars
project oil and gas fields. While French prosecutors had recommended that Total
and its then-CEO, Christophe de Margerie, be tried on these charges,
De Margerie's premature death in a Moscow plane crash put paid to that and
the case was discontinued.
At stake here is Iran's prized South Pars, which holds some 14 trillion cubic
meters of natural gas and 18 billion barrels of gas condensates. Or in other
words, 7.5 percent of the world's natural gas and half of Iran's total reserves.
And
Phase 11 of this project is what the supermajors are eyeing. Total was dismissed
from Phase 11 in 2009 and its portion of the project was awarded to China National
Petroleum Corporation (CNPC), which then pulled out in 2012 under the bite of
sanctions.
In September 2015, the National Iranian Oil Company (NIOC) transferred the
uncompleted portions of Phase 11 to Iranian companies.
Total will likely want back in on this project, and buying Iranian oil
surely helps.And Iran, likewise, is eagerly seeking out European markets, with
the Iranian Oil Ministry now saying that it's crude oil sales to Europe
have exceeded 300,000 barrels per day, counting the Total deal.
Iran has recently signed oil contracts not only with French Total, but
also with Russian Lukoil's trading arm, Litasco, and Spanish refiner Cepsa.
The Ministry says that Italian oil giant Eni is interested in
buying 100,000 bpd from Iran, and that such a contract will be discussed
soon in Tehran.
But there is a catch,
as reported by Reuters. Iran is seeking to bill its new crude oil sales
in euros in order to reduce dependence on the U.S. dollar, the news agency reported,
citing an anonymous NIOC source.
Washington is not going to appreciate this additional
threat to the petro dollar. This would add Iran to the growing list of countries
that, over the past few years, have begun to pose a
challenge to the current system by forming pacts to transact oil in local
currencies.
Signs of troubles for the USA natural gas production. This is a larger player and if it is in trouble
the whole US shale gas industry is in trouble too.
Notable quotes:
"... Keep oil at $30 and gas at $2 through summer and there will be a very long list of these. ..."
"... Note how the Dow/S P continues to trade lockstep with crude. ..."
"... Not until the executives have configured themselves to the extent possible within insider trading regs. After that, maybe theyll have plans . ..."
"... A total of 74 energy companies, including Energy XXI Gulf Coast Inc. and Halcon Resources Corp., are expected to have significant difficulties sustaining their debt, according to the report. ..."
"... BTW, Halcon is down 12.8% today, 67.5% year-to-date, and 96% in one year. ..."
The number of U.S. companies that have the highest risk of defaulting on their debt is nearing
a peak not seen since the height of the financial crisis.
With the energy industry crumbling amid record low oil prices, the number of companies with the
lowest credit ratings reached 264 as of Feb. 1, just shy of the high of 291 set in April 2009,
according to a report by Moody's Investors Service Wednesday. That's a 44 percent jump in the
past 12 months, Moody's said.
"The majority of new additions came from oil & gas ….
A total of 74 energy companies, including Energy XXI Gulf Coast Inc. and Halcon Resources
Corp., are expected to have significant difficulties sustaining their debt, according to the report."
BTW, Halcon is down 12.8% today, 67.5% year-to-date, and 96% in one year.
"There is undoubtedly a lot of oil in the ground still," said Mason Inman, who has written
a biography of M. King Hubbert - the Shell Oil geologist who popularized the peak oil concept
- due in April. But the higher-risk, less conventional barrels are "getting more and more expensive
to extract," he added.
Oil producers need higher oil prices to offset the greater costs of extracting
and refining unconventional crude. In Canada's oil sands region, where tar-like crude is mined or
melted out of the ground, many projects are unprofitable at prices of $65 to $75 a barrel. For many
U.S. shale drillers, the breakeven point is around $50 to $60 a barrel. Ambitious Arctic oil drilling
projects need oil prices at around $95 a barrel to cover the high costs of extracting crude in a
frigid, dangerous environment.
When the price of oil surged past $100 a barrel, these unconventional projects gained appeal.
But U.S. crude prices have plummeted around 70 percent since the mid-2014 peak of $105 a barrel,
leaving many companies mired in debt and grappling with shrinking revenue. In response, drillers
have laid off tens of thousands of workers and shelved development of new wells.
The U.S. oil rig count has dropped from a peak of 1,609 drilling rigs in October 2014 to 467 rigs
last week, energy services firm Baker Hughes Inc.
reported.
As existing wells run dry and new projects stall, U.S. crude production is projected to drop
7.4 percent this year from an average of 9.4 million barrels a day in 2015 to 8.7 million barrels
in 2016
... ... ...
Worldwide, oil companies delayed making decisions on 68 major projects in 2015, accounting for
around 27 billion barrels of oil and equivalent natural gas spending. All told, the industry deferred
spending $380 billion last year, energy consultancy Wood Mackenzie
found in
a January report.
Tim Hess, a petroleum analyst with the Energy Information Administration, said the delays in both
shale drilling projects and longer-term, multibillion-dollar exploration projects make it difficult
to project exactly how much oil the world will produce.
"How are changes in investment going to affect production in the very short term?" he asked. "Producer
sensitivity to low prices is a major uncertainty." The outlook for global demand is similarly murky,
subject to the strength or weakness of emerging economies like China.
As a result, projections for oil prices are all over the map. The energy agency found the market's
expectations range from prices between $22 a barrel and $82 a barrel for December 2016, according
to its statistical analysis at a 95 percent confidence interval.
"There's just a high level of uncertainty," Hess said.
Hirsch, the senior energy adviser at Management Information Services Inc., said he no longer thinks
of the oil market's trajectory as a mountainous peak with a swift decline. Instead, he sees a plateau.
"What's more likely is that oil production will reach a maximum and flatten out," he explained.
"The production doesn't increase for some period of time, and then production will begin to fall.
And when production declines, then there will be shortages, and when people realize that there's
a problem, then panic will ensue."
He said the "good oil" - the conventional crude and the easiest to extract and refine - will start
declining "within a matter of years. It's not decades."
Mueller, who heads the peak oil network, said the plunge in oil prices is reinvigorating discussions
within the community of engineers and analysts.
"Higher [oil] prices brought forth more supply. It's the low price that's highlighted that this
stuff doesn't come out of the ground by itself," he said. "If there's not infinite demand and the
ability to pay for it, then supply won't happen."
"... Any system with pure time lags is inherently unstable, and for oil the financial system seems to act as a positive (enhancing) feedback in the short term rather than helping to smooth things out. ..."
You could also look at it from the other direction – between 2005 and 2014 prices increased four
fold but supply went up not at all in the short term and only slowly longer term, and this might
have as much to do with low interest rates as price. Now prices have crashed supply is declining
equally slowly short term.
There is an intrinsic time lag in the supply balance of at least one
year to eighteen months for companies making investment decisions and about five years for most
project development cycles.
Any system with pure time lags is inherently unstable, and for oil
the financial system seems to act as a positive (enhancing) feedback in the short term rather
than helping to smooth things out.
Ron, I appreciate your thoughts of $60 oil later this year. My concern is what happens to North
American producers if that doesn't occur.
I looked closely at ConocoPhillips earnings release over the weekend. Remember they produce
as much oil per day as some of the small OPEC nations.
They are in serious trouble at $30 WTI and $2 gas. The one thing which somewhat helps them
is they do sell a decent amount of gas internationally. On the other hand, they also sell a decent
amount of condensate and bitumen, and sub $10 per barrel really hurts them.
This got me to thinking about the transition from oil. The $10 per barrel tax proposal stunned
me. I understand it wont pass a Republican congress. However, it was proposed by a two term President
elected by a majority of those citizens who chose to vote. The proposal has to be taken seriously.
I look at the state of the US coal industry. Is oil next? I have no answers. I do think this
transition is going to be very messy, and those, such as President Obama, do not understand the
ramifications of the failure of both the US coal industry and US oil industry within a fairly
short period of time.
I am not trying to start another fossil v alternative discussion with this comment. I just
don't think transitioning away from coal and oil will occur without a large amount of economic
pain.
If prices do not go up, ConocoPhillips will fail. I don't know when, but they will. So will
almost all others in the industry. So will the exporting countries. Again, don't know when, but
they will.
I am just looking at this based upon the financials I am reviewing. The losses are truly staggering
for 2015, and we are now so much lower in early 2016. We are relying on 15-20K foot wells with
huge fracks, and selling the product at inflation adjusted prices which are at or lower than in
the 1940s and 1950s. During that era, oil was coming from shallow, vertical wells.
People in the industry are either scared to death or in complete denial. Our politicians are
neither, they appear to be without a clue. I am not an Obama hater. He is a very intelligent man.
I just don't think he understands the economic upheaval if the US oil industry goes BK. Maybe
it is necessary for the world's long term, I'm not commenting to debate that. I commenting because
his successor needs to understand that the US economy will be in bad shape if the entire industry
goes under.
One small example. The quick end of US oil refineries will mean a huge loss of very high paying,
stable jobs. It will also mean billions of dollars of remediation and clean up, all that will
be paid for by the US taxpayer. The BK refiners wont pay that bill. What is the plan? Again, not
arguing good or bad, just pointing out reality.
How about the hundreds of thousands of US gas stations? What is the plan to deal with them?
I may be too close to this, but just my view. Again, it may be necessary, but those who are
chomping at the bit to quickly end US fossil fuel industries need to have a plan to deal with
the ramifications, or at least be cognizant of them.
I hope this is just another cycle, and transition will be slow and smooth. Right now, I am
doubtful.
This "doom and gloom" situation will not last forever. The US elite already is worried about
ramifications of "low oil prices for too long". They are not stupid, even if "a very intelligent
man" Obama in this particular situation is (judging from his statements). Bush clan is oilmen
clan.
" My concern is what happens to North American producers if that doesn't occur."
Think about major US producers as a part of the USA military industrial complex and you will
understand that they will not fail. Small fish will be fried. Majors will be saved.
"So will the exporting countries. Again, don't know when, but they will. "
I respectfully disagree. Only weaker countries might fail. This BTW is a perfect way for Western
oil majors to grab some resources for pennies on a dollar. Countries with more diversified industries
or huge foreign reserves will be the last man standing. Nor GCC, nor Russia, nor Iran will fail
anytime soon. KAS is the weakest link here but it might last another 6 to 10 years just on foreign
reserves. Russia and Iran are mostly self-sufficient and in areas were they are not, they can
use China as supplier for barter or local currency. They probably can live without oil dollars
with dropped standard of living for a long time, if not forever. Russia has problems due to religious
and ethnic diversity but the level of hate toward the USA for the Ukrainian coup will probably
keep Russia together politically. At least in a short time perspective.
likbez. WTI has again breached $30. RBOB breached 97 cents.
I do not know what the future holds.
I do know that if prices do not improve there will be serious problems.
I also know if a $10 per barrel tax were imposed now, barring a significant price increase,
most North American oil producers will fail.
I personally know several small oil producers. One example, one who produces 20 bopd, net,
works 365 days per year, by himself. He tells me he breaks even at $25, he works for free at that
price. He will receive $24 per barrel when the 1/16 oil check comes later this month. He is living
off savings and his wife's income. He has no debt, yet is in a bind.
A $10 per barrel tax would cost him $73,000 annually, despite the fact that he will show a
loss at $24, doing almost all the work himself (he contracts electrical and pulling only).
Nobody knows. Looks like tech bubble might pop. What matters now is the situation with "paper
oil". It's not completely bad:
… investors in Brent crude now hold more futures and options contracts that bet on the price
rising than at any time since the InterContinental Exchange's records began in 2011, data from
the exchange showed.
Money managers raised their net long position in Brent crude futures and options by 31,346
contracts to 292,300 lots in the week to Feb. 2.
Roughly eight years ago, at the peak of the last recession, oil drilling began to transform these
remote corners of the plains into an economic beacon, attracting billions of dollars in new investments
and thousands of workers in search of good-paying jobs and an escape from America's economic pain.
But now, as oil prices have skidded to $30 a barrel, new drilling has dried up here, and the flood
of wealth and workers is ebbing.
... ... ...
It is hardly a bust - unemployment is low, and there are still plenty of help-wanted ads for the
area - but the slowdown opens an uncertain second chapter for a place that has spent heavily on new
roads, schools, hotels and developments over the past five years.
"We're overbuilt," said Marcus Jundt, a businessman who followed the boom to Williston and owns
several restaurants here, including the Williston Brewing Company, the place that serves the rib-eyes
and brownies. "We have too many hotel rooms, too many apartments, too many restaurants. People are
going to go broke. People are going to lose their jobs. It's going to be painful."
The slowdown has hammered governments across North Dakota, forcing some to cut spending or dip
into reserves. Williston expects $151 million in revenue this year, down about 23 percent from two
years ago. Real estate prices have come down, giving a welcome break to many renters, but agents
say there is a glut of about 300 to 400 homes for sale, with more being built. At the State Capitol,
Gov. Jack Dalrymple last Monday ordered 4 percent budget cuts and tapped $497 million from a rainy-day
fund to close a $1 billion budget shortfall.
Rural towns that spent the past years building, spending and taking on debt are now facing grim realities.
Williston, for one, has taken on $215 million in debt, and governments around the region are spending
to build infrastructure, including a sewer plant and recreation center for the growing population.
Some local officials, business owners and academics express optimism, saying the economy here
is taking a breather after years of unsustainable growth.
"Those communities out there were drinking out of a fire hose," said Nancy Hodur, a research assistant
professor at North Dakota State University who has been studying the boom. "A lot of those communities
would come right out and say that pace of growth isn't good, isn't sustainable. They're still playing
catch-up."
Local leaders say they have faith that oil will rebound and fuel decades of economic opportunity.
As evidence, they point to rising school enrollments across the Bakken oil patch and rising population
numbers statewide. New neighborhoods are filling up with full-time residents, recent arrivals who
seem to represent a vote of confidence in the staying power of an oil-based economy that also offers
a paradise for hunters and anglers.
... ... ...
North Dakota's unemployment rate is still an enviable 2.7 percent, and the jobless rate is even
lower here in Williams County - 2.2 percent, up a percentage point from a year ago.
... ... ...
They talked about how many drilling rigs were operating (46 across the state, compared with 190
two years ago), their falling overtime pay and friends who had gone elsewhere for work.
"If you get fired tomorrow, you get fired," said Scott Benson, 32, an electrical worker who was
heading out to make sure compressor parts did not freeze over in the bitter cold. "Just calm down
and go to work."
Three offshore workers died in a fire outbreak that struck an
offshore platform operated by the Mexican oil company Pemex
on Sunday.
According to Pemex, two deceased workers were
Pemex employees, one of which died in a hospital, while the
third worked for Cotemar. Nine workers, including the one who
died at the hospital, were injured in the incident.
The accident happened aboard the Abkatun A platform in the
Campeche Bay. According to Pemex, the fire is under control.
Pemex further said that there was no need to evacuate the
Abkatun A, as the fire was already isolated.
This is not the first time the Abkatun platform has been
involved in a fatal accident. In April 2015, at least four
workers died when a fire hit the platform, causing a
substantial damage.
What is more, the news of the latest accident comes only
two weeks after Pemex evacuated workers from its Zaap E
production platform in the Gulf of Mexico due to a fire
outbreak on Friday. No injuries were reported during the
incident.
"... Venezuelas oil minister Eulogio Del Pino, who was on a tour of oil producers to lobby for action to prop up prices, said his meeting with Naimi was productive. ..."
NEW YORK (Reuters) - Oil prices were down 2 percent on Monday
as supply overhang concerns grew after a Saudi-Venezuela meeting at the weekend showed few signs
of coordination to boost prices.
No tangible signs emerged from a meeting on Sunday between
Saudi Arabia's oil minister Ali al-Naimi and his Venezuelan counterpart that OPEC and non-OPEC suppliers
were ready to meet to discuss the price slump.
After a flurry of diplomacy over the last two weeks about
a possible production cut roiled oil markets, Sunday's meeting between cash-strapped Venezuela and
the kingpin of the Organization of the Petroleum Exporting Countries was seen as "make or break"
for a possible deal to boost prices that have slumped 70 percent since mid-2014.
Venezuela's oil minister Eulogio Del Pino, who was on a tour
of oil producers to lobby for action to prop up prices, said his meeting with Naimi was "productive."
"But does 'productive' mean less production? The market thinks
not, at least right now," said Phil Flynn, an analyst at Price Futures Group in Chicago.
Note that total product supplied for 2015, 19.5 million bpd, was up by a million bpd from 2012
and it was the highest since 2008 (also 19.5 million bpd).
Annual total liquids net imports were down year over year, from 2014 to 2015, but monthly total
liquids net imports were up from 4.5 million bpd in 12/14 to 5.1 million bpd in 12/15 (as we saw
a 100 million barrel increase in US C+C inventories).
US net crude oil imports rose from 6.9 million bpd at the end of 2014 (four week running average
data) to 7.3 million bpd at the end of 12/15.
Here's a link to the most recent four week running average Weekly Supply Data (ending 1/29/16):
Based on the four week running average weekly data (through end of January, 2016), total product
supplied was up to 19.7 million bpd, and the pattern of increasing net imports continued. Net
crude oil imports were up to 7.5 million bpd, and total liquids net imports were up to 5.7 million
bpd.
In other words, it would appear that the US is becoming increasingly dependent on imported
oil, especially imports of actual crude oil, as total product supplied last year was at a seven
year high.
As I have occasionally opined, I suspect that US refiners (and perhaps global refiners too)
in late 2014 hit the upper limit of how much additional condensate that they could process, if
they wanted to maintain their output of distillates and of heavier products.
And I suspect that much, if not all, of the build in US and global C+C inventories in 2015
consisted of condensate. Therefore, IMO, oil traders are acting on fundamentally flawed data when
it comes to the inventories of the product that actually corresponds to the price indexes, i.e.,
WTI and Brent crude oil.
"... while historically OPEC exercised a rational production strategy, as of the 2014 OPEC Thanksgiving
massacre, there is no more OPEC, as can be seen by the relentless attempts by roughly half the members
to call an OPEC meeting unsuccessfully, confirming what we said in late 2014 - OPEC no longer exists,
which means it is every oil producer for themselves. ..."
Whether it's $50 or $70 by the end of 2016 will largely be determined by the global economy, he added,
reiterating the same flawed thesis he used to justify his bullishness a year ago: "We're still building
inventories, and we will for the next several months. And then we'll start to draw," Pickens said.
"Once you start to draw, you're not going to start back building again. The draw will come here in
the next few months. It'll become pretty clear."
He was wrong then, and he will be wrong this time
again for the simple fact that while historically OPEC exercised a rational production strategy,
as of the 2014 OPEC Thanksgiving massacre, there is no more OPEC, as can be seen by the relentless
attempts by roughly half the members to call an OPEC meeting unsuccessfully, confirming what we said
in late 2014 - OPEC no longer exists, which means it is every oil producer for themselves.
Putting T Boone's forecasts in context, in a CNBC commentary in October, Pickens conceded his
prediction for $70 oil by the end of 2015 wasn't going to happen, because worldwide demand did not
go up as much as he thought and supply did not markedly go down. Oil closed the year at $37: his
prediction was off by 50%.
Hell, nothing is certain here. Anything could happen. All I am doing is just making a wild
ass guess, a guess that is just as likely to be wrong as right.
By Nick Cunningham is definitely short-sider. It is clear from the way he interprets
the data. For example 100 Mb/d the he sites does not include natural depletion which is more strong
source to diminishing volume when capex is cut to the bones. Also it is unclear what Wood Mackenzie
means by "cash negative' and how "break even" price was calculated. If it is just lifting price it should
be doubles to get more realistic estimate of break even". Without understand of components of
prices Wood Mackenzie uses this is pure propaganda.
Worldwide, oil companies delayed making decisions on 68 major projects in 2015, accounting for around
27 billion barrels of oil and equivalent natural gas spending. All told, the industry deferred spending
$380 billion last year, energy consultancy Wood Mackenzie
found in a
January report.
Notable quotes:
"... We expect significant cuts in upstream production as the companies cut output at loss-making fields, ..."
"... In the U.S., there are signs of adjustment as well, although very slowly. Continental Resources gutted its spending program for 2016, reducing capex by 66 percent. That will translate in a dip in production. ..."
"... Overall, the EIA expects U.S. production to fall by 700,000 barrels per day by the end of 2016 to 8.5 mb/d, or more than 1 mb/d below the 2015 peak. ..."
"... A new report from Wood Mackenzie finds that 3.4 mb/d of oil production is cash negative at todays prices, equivalent to about 3.5 percent of global production. But shutting down has its own costs, and could make restarting more difficult and expensive. For some oil fields, shutting down could cause permanent damage to reservoirs ..."
"... there are significant volumes underwater. Wood Mackenzie says that the 2.2 mb/d of expensive oil sands in Canada are in the red. Venezuela is also sitting on 230,000 barrels per day of heavy oil is being produced at a loss. Offshore in the North Sea is another high-cost area, and there is about 220,000 barrels per day of "cash negative" production there. Nevertheless, instead of shutting down, most companies producing at a loss – even at a loss! – will continue to produce, and divert their production into storage rather than suffer the costs of shutting down. ..."
"... That, of course, will mean that it will take much longer than expected for oil prices to rebound, which will only occur when demand rises and soaks up the excess supply and/or natural depletion saps global production. Maintenance or mechanical problems could knock some output offline as well. But the whole process will take still more time. ..."
"... Morgan Stanley cut its estimated oil price for 2016. The bank now expects oil prices to continue falling through the year instead of rebounding in the second half. The investment bank expects Brent to average $29 per barrel in the fourth quarter, rather than its previous estimate of $59 per barrel issued just last month. ..."
"We expect significant cuts in upstream production as the companies cut output at loss-making
fields," Neil Beveridge, an analyst at Sanford C. Bernstein & Co, told Bloomberg in an
interview. "Chinese explorers need to take more radical action to cut operating costs and increase
efficiency." China's Cnooc, one of its main oil producers, probably has a breakeven price near $41
per barrel. The company says that it will spend less and produce less in 2016.
In the U.S.,
there are signs of adjustment as well, although very slowly. Continental Resources
gutted its spending program for 2016, reducing capex by 66 percent. That will translate in a
dip in production. Output will fall steadily over the course of the year, and the company expects
to close out the fourth quarter with production of 180,000 to 190,000 barrels of oil equivalent per
day, which could be 10 to 15 percent below its 2015 average. Continental Resources might be
illustrative of the ravages of low oil prices, since it had much less of its output hedged at
higher prices over the past year after liquidating a lot of its hedged positions in 2014. As such,
many more companies could begin suffering the same misfortune of lower production as their hedges
roll off.
Overall, the EIA expects U.S. production to fall by 700,000 barrels per day by the end of
2016 to 8.5 mb/d, or more than 1 mb/d below the 2015 peak.
However, the oil markets are still suffering terribly because of the ongoing glut. Much of that
can be pinned on the fact that oil producers are reluctant to shut in production, even if they are
losing money on every barrel sold. A new report from Wood Mackenzie finds that 3.4 mb/d of oil
production is "cash negative" at today's prices, equivalent to about 3.5 percent of global production.
But shutting down has its own costs, and could make restarting more difficult and expensive. For
some oil fields, shutting down could cause permanent damage to reservoirs
... .... ...
That means many companies have every incentive to keep as much production online as possible, even
if it ends up being a net-loss. "Given the cost of restarting production, many producers will continue
to take the loss in the hope of a rebound in prices," Robert Plummer, VP of investment research at
Wood Mackenzie said, according to
Reuters. "Curtailed
budgets have slowed investment which will reduce future volumes, but there is little evidence of
production shut-ins for economic reasons."
Wood Mackenzie came up with a pretty shocking figure that will make the hearts of every oil bull
sink: only 100,000 barrels per day of global production – out of total global output of 96.1 mb/d
– has actually been shut in so far (output declining because of natural depletion is a separate thing.
This refers to production intentionally shut down because of economic reasons).
It is an unbelievable statistic, given today's prices, and it demonstrates the difficulty that
the oil markets will have in finding some sort of equilibrium.
Still, there are significant volumes underwater. Wood Mackenzie says that the 2.2 mb/d of
expensive oil sands in Canada are in the red. Venezuela is also sitting on 230,000 barrels per day
of heavy oil is being produced at a loss. Offshore in the North Sea is another high-cost area, and
there is about 220,000 barrels per day of "cash negative" production there. Nevertheless, instead
of shutting down, most companies producing at a loss – even at a loss! – will continue to produce,
and divert their production into storage rather than suffer the costs of shutting down.
That, of course, will mean that it will take much longer than expected for oil prices to rebound,
which will only occur when demand rises and soaks up the excess supply and/or natural depletion saps
global production. Maintenance or mechanical problems could knock some output offline as well. But
the whole process will take still more time.
In a dramatic move, Morgan Stanley
cut its estimated oil price for 2016. The bank now expects oil prices to continue falling through
the year instead of rebounding in the second half. The investment bank expects Brent to average $29
per barrel in the fourth quarter, rather than its previous estimate of $59 per barrel issued just
last month.
Then again, what if OPEC and Russia meet in February to coordinate production cuts? It still seems
unlikely, but unless that happens, oil prices may not stage a rally this year.
"... At peak levels in 2014 total North American E P spending was about $200bn, but this included Canada and US conventional ..."
"... If we look at the increases in yearly average output in 2014 and 2015, it was 1250 kb/d vs 730 kb/d. So decreased investment of $70 B, reduced the production gain by about 520 kb/d. ..."
"... In any case, somewhere between 96B and 132B is enough to get flat output in the US (replacing about 500 kb/d of decline at a 6% annual rate or 920 kb/d if we assume a 10% annual decline rate). ..."
"... Under most plausible oil price scenarios, 2018 US production may be flat or only slightly above 2017, and growth in 2019 will still be moderate. I now think that 2015 record level of (9.7 mb/d in April) may not be reached even in 2020. However, with higher prices, peak levels could be achieved in the next decade. ..."
"... What you consistently fail to realize is that the EIAs DPR gives a very bad estimate of legacy decline. As fewer new wells are added the legacy decline gets smaller. ..."
"... The EIAs estimate for legacy decline in the Bakken and Eagle Ford are incorrect. For the Bakken/Three Forks the legacy decline in Nov 2015 was 4 kb/d and if the rate that new wells are added remains at the Nov 2015 level the legacy decline rate falls to an average rate of 3 kb/d for Dec 2015 to Nov 2016, output only falls by 140 kb/d in this scenario. ..."
"... If no new wells are added over the next 12 months output in the North Dakota Bakken/Three Forks only falls by 350 kb/d. ..."
The decline and legacy rates are huge for shale. According to the latest drilling report, the
monthly legacy rate for all shale plays has reached nearly 400 000 b/d and month, which is annualized
over 4 mill b/d of decline. Add the legacy rate for shale natural gas, which is nearly 20 bcf/d
and year.
Together with conventional oil and gas, the US oil and gas industry has to replace every year
close to 10 mill boe/d which is 50% of capacity of oil and gas production.
And the situation gets worse every year. The decline rate for worldwide conventional oil production
is just 6%.
The cost for 1 mill b/d (either buying from the shelf or building from scratch) stands around
USD 50 bn. So the US oil and gas industry has to invest every year USD 500 bn for keeping production
stable – and gets just 250 bn revenue for this investment.
This is a financing gap of USD 250 bn every year. As the total high yield bond market adds
up to USD 1500 bn, the oil industry taps 17% of the high yield bond market.
I think this explains the high the leverage in the oil and gas market. The cost for keeping
the USD stable is now astronomical. Something has to give here. Either the dollar or the bond
market collapses or 3mill b/d come out of the market immediately.
If we look at the increases in yearly average output in 2014 and 2015, it was 1250 kb/d
vs 730 kb/d. So decreased investment of $70 B, reduced the production gain by about 520 kb/d.
The decreased investment of $45B less in 2016 vs 2015.would be expected to reduce the production
gain by 330 kb/d, so we could potentially see an increase in output of 400 kb/d (2016 average
output vs 2015 average output) if the investment spending estimates are correct and the previous
trend holds.
This simple linear model is not likely to be correct because if we assume zero investment spending
in 2016, the result is flat output, which is highly unlikely.
I would expect output will be flat at best with 96 billion investment and oil is likely to
be down by 500 to 700 kb/d.
In inherent problem with the way I have done this is investment in natural gas production has
been ignored. We don't have enough detail here to know how the investment was divided between
natural gas and oil, though we could divide it up based on gross revenue or some other metric.
In any case, somewhere between 96B and 132B is enough to get flat output in the US (replacing
about 500 kb/d of decline at a 6% annual rate or 920 kb/d if we assume a 10% annual decline rate).
1) It is important to note, that today's upstream capex will affect output levels about 6 months
from now. So high capex in 2014 resulted in relatively high production levels in 1H15.
But lower capex in 2015 will affect production in 2016, and even lower capex in 2016 will negatively
affect production in 2017.
2) Annual average growth in 2015 vs. 2014 reflects strong monthly growth in 2014.
Monthly output was declining since April 2015 and will continue to decline in 2016 and probably
for most of 2017. Furthermore, decline rates are likely to accelerate this year and may only moderate
in 2017.
The EIA expects annual average US C+C production in 2016 to be 0.7 mb/d lower than in 2015,
including a 0.8 mb/d y-o-y decline in Lower 48 onshore output.
They are projecting annual average decline of 270 kb/d for US C+C in 2017, including 380 kb/d
in Lower 48 onshore.
Even "shale optimists" like Goldman Sachs and Citi expect a decline of ~0.5 mb/d in 2016 (I do
not know their longer-term projections).
Under most plausible oil price scenarios, 2018 US production may be flat or only slightly
above 2017, and growth in 2019 will still be moderate. I now think that 2015 record level of (9.7
mb/d in April) may not be reached even in 2020. However, with higher prices, peak levels could
be achieved in the next decade.
I think the EIA may be too pessimistic. The annual decline rate trend for March to Nov 2015
is about 500 kb/d. (See chart). I think there will be some oil price rise by mid year (maybe to
$45/b) and that the decline rate will moderate towards the end of 2016 as oil prices rise further
(to over $60/b by Dec 2016). I think the average US C+C output levels will be about 400 kb/d less
in 2016 compared to average 2015 output levels.
See chart for trend (note the assumption of a linear trend which is likely to overstate the
decline).
This was 2014 when legacy declines were much lower (around 20%). I am talking about 2016, which
includes also the rest of this year (total legacy rate 50%). In addition shale represents close
to two thirds of the oil and gas market in 2016. This share has been much lower in 2014.
If the US oil and gas industry does not spend as much, production will decline accordingly.
I cannot emphasize enough how much shale has changed the dynamics of the oil market. It is important
to recognize the change in the markets and not rely on past numbers.
The Bakken and Eagle Ford Models do not rely on past numbers except as a check on the model
(the Bakken Model has actually been lower than actual output, the Eagle Ford has been a little
closer, but also on the low side).
Now I take a model which has matched actual output fairly well over time and assume well profiles
remain the same as the past two years and that the new wells are added at half the rate of recent
months (39 new wells per month rather than 78 new wells), a similar exercise is done for the Eagle
Ford.
Enno Peters work confirms what I have found for the Bakken (which is based on data gathered
from the NDIC by Enno Peters.)
What you consistently fail to realize is that the EIA's DPR gives a very bad estimate of
legacy decline. As fewer new wells are added the legacy decline gets smaller.
Think about it a moment, if 200 new wells per month are added, the legacy decline is high
and if 50 new wells per month are added the legacy decline will be lower (by roughly a factor
of 4), surely you can see this.
In the Bakken about 170 new wells per month were being added each month during 2012 to 2014,
lately only about 77 new wells have been added, so legacy decline will be smaller.
Bottom line, the DPR has Bakken legacy decline increasing and that is not correct, it will
decrease until the rate that new wells are added each month starts to increase.
The EIA's estimate for legacy decline in the Bakken and Eagle Ford are incorrect. For the
Bakken/Three Forks the legacy decline in Nov 2015 was 4 kb/d and if the rate that new wells are
added remains at the Nov 2015 level the legacy decline rate falls to an average rate of 3 kb/d
for Dec 2015 to Nov 2016, output only falls by 140 kb/d in this scenario.
If no new wells are added over the next 12 months output in the North Dakota Bakken/Three
Forks only falls by 350 kb/d. That scenario is not very likely.
If 39 new wells per month (half as many as Nov 2015) are added each month for the next 12 months
(somewhat plausible at low oil prices), ND Bakken/Three Forks output falls by 250 kb/d.
The Eagle Ford will fall a little more maybe 350 kb/d, the Permian is likely to be flat, the
rest of the US LTO might fall by 200 kb/d at most, so about 800 kb/d decline is about all we will
see for LTO decline over the next 12 months.
GOM output has been increasing lately so overall US C+C decline might be 700 kb/d from Dec
2015 to Nov 2016 (next 12 months of data).
As I have said before, your method for coming up with a 4 million barrel per day decline in
US output hits very wide of the mark, you are off by almost a factor of 6. Use the EIA's DPR at
your peril if you are an investor.
Excellent plan, the black stuff is far too valuable to piss up the wall as we currently are, it
is so underpriced in the world's biggest economy, giving an appalling market signal to waste it
as fast as possible. Tax is a more important too to get right than almost anything else, and no,
dear Americans, that doesn't mean eliminating it. Tax the right things, and incentivize the right
things. And for the oil patch, done right, this should also mean the restoration of decent margins.
"We're living at a dangerous moment because… 'empire', is in its last gasp, and empire, when
it's in its last gasp will do anything to sustain itself… The US does not want to see the indigenous
view of water, or natural gas, or oil, or resources in the ground to prevail… I was in a meeting
of U'wa people who are fighting oil development in Colombia… and [the way] they talk about oil…
[is] completely alien to the western development and corporate development model– it just can't
be understood even. So as a result, corporations, and US and prevailing western powers, don't
think anything negative at all about going in and overpowering that if they can get away with
it." ~ Jerry Mander
, 'Alternatives to Economic Globalization: A Better World Is Possible'
"... There is no way to detect oil glut or deficit less then 1Mb/d based on accuracy of world oil production/consumption data. ..."
"... Price of oil in casino capitalism is detached from producers and is determined via paper oil bought and sold in financial casino. ..."
"... There is a strong institutional bias of all major Western agencies including EIA and IEA as well as mass media toward low oil prices as it is plausible that high oil prices cause secular stagnation in world and, especially, Western economies. ..."
"... Recent oil glut was by-and-large condensate glut (aka Great condensate con , the effect discovered by Jeffrey Brown http://www.resilience.org/stories/2016-01-17/the-great-condensate-con-is-the-oil-glut-just-about-oil ) caused by tremendous increase of gas production and extraction of associated liquids and false equivalence reporting by major agencies which overstated the real supply picture. ..."
"... Dropping of the price of oil was probably a political decision. A join decision of USA and Saudis governments among other things. Also it looks like that the point of lifting sanction from Iran also was chosen strategically. ..."
"... Obama revealed that it was a part of our rationale that the only thing keeping Russian economy afloat was the price of oil. ..."
"... Sanctions only made Russian economy more vulnerable to the inevitable oil price disruptions. Theyd have enormous difficulty managing it, Obama said. ..."
I would like to know how much oversupply or undersupply causes how much price change. Is a 5%
oversupply enough to get a price drop like this or is it 10%? And looking forward, how much would
a short supply of 10% mean in price hike?
We know that our civilization needs oil to function, in fact it exists because of oil. Much
of our consumption is inelastic. I think the current oversupply is relatively small. Producing
nations are pumping like mad because they need the cashflow. They cannot make long term decisions
to wait out a higher price.
We are adding some 40-50 Million motor vehicles to the world's fleet every year. There is a
finite amount in the ground with ever increasing cost and decreasing Energy Return on Energy Invested.
We also have declining net exports.
I would like to know how much oversupply or undersupply causes how much price change. Is
a 5% oversupply enough to get a price drop like this or is it 10%? And looking forward, how
much would a short supply of 10% mean in price hike?
You asked a very difficult question. Oil oversupply/undersupply are not only economic but also
political categories as oil is a strategic product. Almost everybody in 2014 and 2015 underestimated
the severity and the length of the current drop of oil prices. Despite the fact that oversupply
was minor (2 Mb/d or less) and partially fictional (see condensate vs oil issue below). So there
might well be no any solid correlation between those two in view of "casino capitalism" effects
on oil price.
Here some general "cause-effect" considerations:
1. There is no way to detect "oil glut" or deficit less then 1Mb/d based on accuracy of
world oil production/consumption data. So any deficit or glut less then 1Mb/d reported by
MSM or agencies is pure propaganda. The four meaningful digits reported by EIA (aka "Energy Disinformation
Agency") is also pure propaganda. Their data does not allow more then two meaningful digits.
So tail is wagging the dog. That means that price is detached from the situation on the ground
and only shortages of "physical oil" that can't be hidden can move the prices either way. So the
regime of "suppressed price" might well last longer then most of us expect, and definitely longer
then some hypothetical point in time at which balance of world supply and demand is achieved.
You need shortage not a balance to move the price. So oil price moves probably overshoot as they
will be accompanied by "short squeeze".
3. There is a strong institutional bias of all major Western agencies including EIA and
IEA as well as mass media toward low oil prices as it is plausible that high oil prices cause
"secular stagnation" in world and, especially, Western economies. That's why "Fuser law"
of predicting breakeven price of oil (BEPO) reported by MSM (BEPO=0.8 * current_WIT_price
) works so amazingly well.
As condensate processing facilities were insufficient and some refineries refused shipments
of blended oils that caused growth of condensate storage which was interpreted as oversupply of
oil.
5. Dropping of the price of oil was probably a political decision. A join decision of USA
and Saudis governments among other things. Also it looks like that the point of lifting sanction
from Iran also was chosen strategically.
Obama said that Russian economy "was already contracting and capital was fleeing even before
oil collapsed."
Obama revealed that it was a "part of our rationale" that the "only thing" keeping Russian
economy "afloat" was the price of oil.
Sanctions only made Russian economy more vulnerable to the "inevitable" oil price disruptions.
"They'd have enormous difficulty managing it," Obama said.
The US should be "firm with the Russians" when it comes to issues like Ukraine….
That suggest that low oil price regime might well last for the duration of Obama administration
unless Russia folds.
6. It might well be that the decision to crush oil prices was also in part caused by the desire
to save Western economies from the new recession as there were sign that they started sliding
into recession earlier and that bought the USA and G7 almost two years of relative prosperity.
In any case shale oil boom was one of the main factor of lifting the USA from the Great Recession
and it probably served the same role as subprime mortgage boom in lifting the USA economy from
dot com crisis of 2000-2002. It also improved exports/imports ratio. All produced oil (by virtue
of decreasing imports) and most equipment used can be counted as manufactured in the USA product
creating a short-lasted revival in the USA heavy machinery manufacturing.
Breakeven production cost ("Lifting Costs") is not equal to positive "cash flow" as formally
production costs include only raw materials and labor. These are the costs incurred to operate
and maintain wells and related equipment and facilities, including depreciation and applicable
operating costs of support equipment and facilities and other costs of operating and maintaining
those wells
Production cost:
== quote ==
A cost incurred by a business when manufacturing a good or producing a service. Production
costs combine raw material and labor. To figure out the cost of production per unit, the cost
of production is divided by the number of units produced. A company that knows how much it
will cost to produce an item, or produce a service, will have a clearer picture of how to better
price the item or service and what will be the total cost to the company.
Cash flow:
== quote ==
Cash flow is the net amount of cash and cash-equivalents moving into and out of a business.
Positive cash flow indicates that a company's liquid assets are increasing, enabling it to
settle debts, reinvest in its business, return money to shareholders, pay expenses and provide
a buffer against future financial challenges. Negative cash flow indicates that a company's
liquid assets are decreasing. Net cash flow is distinguished from net income, which includes
accounts receivable and other items for which payment has not actually been received. Cash
flow is used to assess the quality of a company's income, that is, how liquid it is, which
can indicate whether the company is positioned to remain solvent.
== quote ==
"... In other words, it is a given that production is going to decline. So if demand stays constant, or rises, then the price of oil will definitely rise. We know what is going to happen to supply. We have no idea what is going to happen to demand. ..."
"... Your analysis is perfect. 2016 is going to see a bigger reduction in oil production than the second half of 2015. That is the effect of oil price reductions that have already taken place, so not even a recovery in oil prices could prevent it. Now we should take the analysis a little bit further in the two possible scenarios: ..."
"... Oil demand does not decrease. This means that the global economy is stable. Oil price will increase. As long as oil price doesn't get too high, the decline in oil production will be slowed and with luck halted or even reversed. We buy some more time. ..."
In other words, it is a given that production is going to decline. So if demand stays constant,
or rises, then the price of oil will definitely rise. We know what is going to happen to supply.
We have no idea what is going to happen to demand.
Your analysis is perfect. 2016 is going to see a bigger reduction in oil production than the second
half of 2015. That is the effect of oil price reductions that have already taken place, so not even
a recovery in oil prices could prevent it. Now we should take the analysis a little bit further in
the two possible scenarios:
1. Oil demand does not decrease. This means that the global economy is stable. Oil price will
increase. As long as oil price doesn't get too high, the decline in oil production will be slowed
and with luck halted or even reversed. We buy some more time.
2. Oil demand also decreases. This means that the global economy enters recession. Oil price will
remain low and the decline in oil production will continue and probably accelerate. We might enter
a tail spin oil/economy situation that could produce a hard crash getting us much closer to civilization
decline.
Peak oil in 2015. We will have to watch the global economy as we already know what the oil production
is going to be doing. Thanks for sharing your knowledge and view.
In other words it was another artificially created bubble. Like in dot com book, there were
parallel technological breakthrough that enabled this bubble to inflate.
Notable quotes:
"... But your shale oil players were accumulating massive amounts of debt even before 2015. Which seems hard to understand with such economics. ..."
"... LTO production was growing very aggressively, therefore even with high oil prices, producers were outspending cash flow. This is how the mountain of debt was built, despite 2010-2014 strong oil prices. ..."
"... I think we get caught up in the idea that production in US is not falling as fast as expected, I know I do. However, if we look at the year over year change, it will likely approach 2 million bopd. Production grew 1.4 million bopd in 2014, and may have fallen as much as .6 million bopd in 2015. (Numbers off the top of my head, and 2015 is still yet to be determined). ..."
"... Also, the current price is extremely low, much lower than 2015. If this price holds for several months, look for continued decreases in production from many parts of the world. $10s and $20s is what most oil is selling for in the world at present. That is simply not economic is the majority of the producing areas of the world, and definitely not in North America, where the 2010-2014 production growth predominantly came from. ..."
"... The drillers havent been making money, they have all be losing/underwater. Even the bigs and nationals have been losing: they have been throwing away value for some useless numbers … numbers which are all borrowed. ..."
"... Producing nations are pumping like mad because they need the cashflow. They cannot make long term decisions to wait out a higher price. ..."
"... We are adding some 40-50 Million motor vehicles to the worlds fleet every year. There is a finite amount in the ground with ever increasing cost and decreasing Energy Return on Energy Invested. We also have declining net exports. ..."
How does the shale irr of 45% and payback of 2 years line up with the mountain of debt and
other info (aka bertman). Does not seem to make sense??
Ron Patterson, 02/07/2016 at 1:39 pm
Daniel, I think you missed the point. That was a year and a half ago, when it was expected
that the future price of oil, 2014 to 2020, would average about $90 a barrel. I thought I made
that clear. Things are totally different today. In fact, that chart was meant to show just how
much things have changed in a year and a half.
daniel, 02/07/2016 at 2:45 pm
Thanks Ron. I get that things are much worse now. But your shale oil players were
accumulating massive amounts of debt even before 2015. Which seems hard to understand with
such economics.
LTO production was growing very aggressively, therefore even with high oil prices, producers
were outspending cash flow. This is how the mountain of debt was built, despite 2010-2014 strong
oil prices.
I think we get caught up in the idea that production in US is not falling as fast as expected,
I know I do. However, if we look at the year over year change, it will likely approach 2 million
bopd. Production grew 1.4 million bopd in 2014, and may have fallen as much as .6 million bopd
in 2015. (Numbers off the top of my head, and 2015 is still yet to be determined).
Also, the current price is extremely low, much lower than 2015. If this price holds for several
months, look for continued decreases in production from many parts of the world. $10s and $20s
is what most oil is selling for in the world at present. That is simply not economic is the majority
of the producing areas of the world, and definitely not in North America, where the 2010-2014
production growth predominantly came from.
The drillers haven't been making money, they have all be losing/underwater.
Even the bigs and nationals have been losing: they have been throwing away value for some useless
'numbers' … numbers which are all borrowed.
Don't forget Jeffrey Brown: when you ask the price, you get the price of top sirloin, when you
ask the quantity you get the amount of meat. Not all oil sells for the price of Brent or WTI.
I would like to know how much oversupply or undersupply causes how much price change. Is a 5%
oversupply enough to get a price drop like this or is it 10%? And looking forward, how much would
a short supply of 10% mean in price hike?
We know that our civilization needs oil to function, in fact it exists because of oil. Much
of our consumption is inelastic. I think the current oversupply is relatively small. Producing
nations are pumping like mad because they need the cashflow. They cannot make long term decisions
to wait out a higher price.
We are adding some 40-50 Million motor vehicles to the world's fleet every year. There is a
finite amount in the ground with ever increasing cost and decreasing Energy Return on Energy Invested.
We also have declining net exports.
What the above chart tells me is that it now costs a
lot more to produce a barrel than it once did. And… unless crude oil hits at least
$60 a barrel soon a lot more projects will have to be cancelled. But… all that being
said, I think it is now obvious that oil production will drop, rather dramatically,
beginning sometime in 2016. And that drop will lead to a rise in the price of oil, at
least to $60 a barrel and likely higher.
That
is unless some black swan event happens. That could be a collapse in several
economies of the world… or a collapse of the economy in one country, China. In other
words, it is a given that production is going to decline. So if demand stays
constant, or rises, then the price of oil will definitely rise. We know what is going
to happen to supply.
We have no idea what is going to happen to demand.
But if BAU continues as normal, the price of oil is going up.
Weeks after the Royal Bank of Scotland advised its investors to "sell
everything," Citi has decided to provide its own clients with fodder for a panic attack. In a
report released Thursday, the bank warned that the global economy appears to be "trapped" in a "death
spiral."
Here's a thumbnail sketch of the deathly cycle that Citi forecasts: Weak global growth spurs demand
for the U.S. dollar; a stronger U.S. dollar drives down the global price of commodities; and low
commodity prices hurt developing economies dependent on exporting raw materials, thereby weakening
global growth, which spurs demand for the U.S dollar, ad infinitum. This process repeats until we
arrive at "Oilmageddon," an economic apocalypse defined by perpetually low oil prices and "a 'significant
and synchronized' global recession and a proper modern-day equity bear market," writes Citi strategist
Jonathan Stubbs.
Crude-oil prices have collapsed by 70 percent since mid-2014, while the U.S. dollar has risen
by 20 percent against foreign currencies, according to CNBC.
However, Citi's report predicts that the global economy will find its way out of this trap. Although
the bank suggests a continuation of the status quo would eventually lead to ruin, it predicts that
policymakers will find a way out of the status quo.
"The death spiral is in nobody's interest. Rational behavior, most likely, will prevail," Stubbs
writes.
Ron, very interesting, thank you. Reading your conclusion, we then can expect that markets will
do all possible to cause the collapse of one or more countries. So, Oil production will peak,
while our economies (US and Europe) could not to.
Daniel, I think you missed the point. That was a year and a half ago, when it was expected that
the future price of oil, 2014 to 2020, would average about $90 a barrel. I thought I made that
clear. Things are totally different today. In fact, that chart was meant to show just how much
things have changed in a year and a half.
Thanks ron. I get that things are much worse now. But your shale oil players were accumulating
massive amounys of debt even before 2015. Which seems hard to understand with such economics.
The reason for the greatly different OE for the UK and Norway is simply due to geology. Although
they share the same basin and the reserves for each nation are very similar UK oil sits in many
fields and Norway's oil is concentrated in fewer large fields.
One thing is for damned sure. The oil biz must have been generating UNGODLY UNIMAGINABLE PROFITS
up until a year ago, if the figures Ron just posted are even ball park accurate.
Have they really been making that much money,as a percentage of revenues, even before taxes,
royalties, etc?
It has been my belief , as the result of reading this site, and the old TOD, etc, that it costs
a hell of a lot more than the figures listed, to produce oil, as a general thing.
We all know that tax lawyers and accountants can work miracles, and that the oil industry can
afford the best, but ………….?????
If the oil industry has TRULY been making this kind of money, how is it that oil stocks weren't
going up FAST?
My seat of the pants impression is that the production cost figures given are highly slanted
so as to make the industry look better during this downturn, and keep people for selling oil stocks,
etc.
Don't forget Jeffrey Brown: when you ask the price, you get the price of top sirloin, when you
ask the quantity you get the amount of meat. Not all oil sells for the price of Brent or WTI.
"... Rystad Energy's analysis makes a lot more sense, that the shale drillers were completing more than they drilled, to conserve current cash, then the often stated line saving DUCs for the future . Especially when the shale players are fighting for a future that may not exist for them. ..."
Data from Rystad Energy show the number of completed wells
have by far outpaced the number of wells spudded (drilled) since 4Q14. Indeed,
the number of well completions per month continued to increase several months
after the rig count started to drop off, peaking at more than 1,600 wells in
December 2014. The number of completions are still outpacing the number of new
wells drilled, and as a result, the number of uncompleted wells, or the
frack-log, has been cut down from its peak of around 4,600 wells hit at the end
of 2014 to around 3,700 wells currently.
This seems to make a total mockery of all the claims in the media, that they
were drilling cheaper wells, and saving them for future production, with an
ever increasing number of DUCs.
Rystad Energy's analysis makes a lot more sense, that the shale drillers were
completing more than they drilled, to conserve current cash, then the often
stated line saving DUCs for the future . Especially when the shale players are
fighting for a future that may not exist for them.
Pretty interesting interview Jan Stuart, despite that fact that it was on Bloomberg... he
conveniently ignore the destructive role of Wall Street in amplifying oil price move, but other then
that it was a good interview. Good point is that futures curve is even more wrong then
economists. But due to futures curve that exist now a lot of people will lose their jobs,
despite the fact that it predict that production of oil will continue at any price. It is
essentially predict that demand will not go up and oil will ever be produced at low costs. Both
those postulates are wrong and we already know that situation is not sustainable. Unless china
has hard landing demand will go up. Slow supply response in the very last month. When you look
back at 2015 its is clear people overspend by very significant amount which was very start or not so
smart, Some people though we are almost done with price slide. That are now for rude awakening.
that also means that at the end of the year or somewhere in 2017 price can well be higher then $65
Shale operators now are forced into reducing their production. This process already started in
the USA for shale as money to finance "carpet bombing" fields with wells are no longer here and
there are just so many "sweet spots". The desire to survive slow down this process as when companies
are put against the wall they became more innovative in reducing costs. For conventional wells the
reduction of production due to depletion also is automatic (say at least 6% per year). So the key
question is how many new projects are cancelled or delayed. In other words the reduction of
production is achieved mainly via cancellation of new drilling/new projects and is achieved with
substantial delay. BTW even 2% of 95MB/d is a substantial figure.
I heard this morning that Linn had its revolving credit facilities ( not sure if I am
phrasing that correctly) taken away. I think it was close to $800 million. So I think you are
correct about Linn's fate.
Several of my geologist friends worked for Linn in the Wolfberry play. They saw this coming
2 years ago when Linn traded its Wolfberry acreage to Exxon for Hugoton Field acreage. Mngmt told
them they were trading to get low decline properties in the 6% annual range.
My guys response: " You know why it's a 6% annual decline? Because the Hugoton is mostly depleted
dumbass!"
Arceus, 02/06/2016 at 1:22 pm
Check out Linn's latest 8K filing.
LINN just maxed out its credit facility withdrawing the whole enchilada of $919MM and quickly
giving a big chunk of that to Senior Management via million dollar cash payouts – 18 months of
salary and DOUBLE their target bonuses .
Senior management has done the equivalent of gutting the business by selling anything of
value, then setting fire to the place to collect the insurance money.
Drawing down the credit line was hostile. CEO Mark Ellis, voted worst CEO of the year, now
appears to be making nice with the future owners of the company – equity of course will be wiped
out. He knows where his future millions will come from.
"... It could be that KSA production is about to fall off a cliff, so to speak. It's hard to know what to think but given KSA's strange, and perhaps desperate, geopolitical and geoeconomics maneuvers as of late it seems likely that something is afoot. They've been playing a lot of silly little games the last 18 months or so. It causes me great suspicion. ..."
I found this old article when I was reminiscing and google searching some old stories about wikileaks
and KSA's overstated oil reserves. I believe the wikileaks cable mentioned KSA overstated oil
reserves by 300 billion barrels. I believe KSA is now owning to having less less than 300 billion
barrels in proven oil reserves these days.
It could be that KSA production is about to fall off a cliff, so to speak. It's hard to know
what to think but given KSA's strange, and perhaps desperate, geopolitical and geoeconomics maneuvers
as of late it seems likely that something is afoot. They've been playing a lot of silly little
games the last 18 months or so. It causes me great suspicion.
1. We are not going to produce oil for which
we have no orders. That verbiage was from them at $110/b.
Think carefully about that today, because it has to still be true.
2. We are not going to lose market share.
To whom? They have said they don't compete with shale. They don't. They don't produce light
oil. They don't sell to the same refineries. So how would they lose market share? By having a
producer of their weight/type oil undercut their price. They have to match a competitor price.
If Urals gets priced at $30/b then so must theirs, regardless of who asked for how much.
(Giving rise again to that sticky question of who is placing orders for oil they can't sell
or burn)
"... the global oil market is not a market like those for smartphones, automobiles or ladies purses. The global oil ( gas) market is a STRATEGIC one. Which goes on to say that the core states, such as first of all, North America, then NW Europe get to have the first and final say. ..."
"... This problem is compounded by the fact that high oil prices enable geo-strategic rivals such as Russia/Iran/Iraq/Venezuela to be more defiant than they would otherwise be. ..."
"... The oil rich countries that are directly controlled by the US co (the US Empire) also known as GCC, follow an oil production policy that largely suits the core states themselves, depending on the situation and their ability to affect the global market. ..."
"... As North America was a massive oil importer circa 2009 (Canada cannot be seen in isolation, but as appendix to the US) this increased oil production went a lot way in: a)boosting economic growth (North America has easily outpaced other advanced economies since the Lehman crisis) b) Minimize the US trade deficit and therefore: c) Boosting the value of the US dollar. ..."
"... Countries outside of the US, Canada (to a lesser extent UK, Norway ) that are major oil producers, need to accrue massive profits from their oil sales, since they universally divert most of those funds into financing the government, the military and social spending, while they must also keep some for re-investments into their oil sectors. US Canada are uber-happy if they can more or less break-even. ..."
Could this have been due to the special place US has in the hierarchy.
When camels are thirsty
they are chewing thistle to relieve their thirst, but the thistle is dry, so in fact their own
blood relieve their thirst.
Dogs chew old bones but there is nothing in them, but pieces of splited bone pierce their mouth
ceiling and fresh blood makes them think there is food in there.
This is what US has done f.ed the little economic moment it still had because is the forefront
of the empire, he is going for the fresh blood of shale.
As I have repeatedly stated on this blog, the global oil market is not a market like those
for smartphones, automobiles or ladies purses. The global oil (& gas) market is a STRATEGIC one.
Which goes on to say that the core states, such as first of all, North America, then NW Europe
get to have the first and final say.
The problem for the US, Canada, Norway and the UK (the only wealthy countries producing large
quantities of oil) is that their oil reserves are extremely marginal and can only be accessed
with high oil prices (in the long-run) This problem is compounded by the fact that high oil
prices enable geo-strategic rivals such as Russia/Iran/Iraq/Venezuela to be more defiant than
they would otherwise be.
The oil rich countries that are directly controlled by the US & co (the US Empire) also
known as GCC, follow an oil production policy that largely suits the core states themselves, depending
on the situation and their ability to affect the global market.
In my view, this is what preceded the recent oil market collapse:
NATO-GCC to Russia in 2011/12: "Give up Assad, or we'll fill our media with BS stories
about you. We will also 'encourage' our corporations to not invest in your country"
Russia to NATO-GCC: "You have been doing that for ages, who cares for even more propaganda.
Assad stays"
NATO-GCC to Russia in 2013/14: "Give up Assad, or we will turn Ukraine against you, there
will be serious trouble for you, as now we will make our economic warfare against you, official.
Moreover, our 'regime-change' efforts will intensify"
Russia replies to NATO-GCC: "Bring it on, Assad stays"
NATO-GCC to Russia in 2014: "We will pummel the oil price into oblivion*, we promise that
you will feel the strain, just give up on Assad or we will destroy you"
Russia replies to NATO-GCC: "I have seen worse. Assad stays"
*Notice that NATO-GCC did not use the oil-price weapon until one of two things happened:
a) Time-pressure on regime-changing-Syria became serious.
b) The shale and tar sands infrastructure had been already put in place under high oil prices.
But back to Ron's core (and largely correct) claim that the global oil production gains of
recent years have been a North American phenomenon (I would also add Iraq)
North America has been able to ramp-up production spectacularly in recent years because of
the following reasons:
a) It's capital rich. Instead of diverting all of that QE-enabled loans to the parasitic "housing
market" and lots of inane Silicon Valley start-ups (that fail 99 times of 100) it was wiser to
have some dough flow into the "shale oil & gas miracle" as well as Alberta's vast tar sands deposits.
Which made both economic as well as strategic sense.
b) As North America was a massive oil importer circa 2009 (Canada cannot be seen in isolation,
but as appendix to the US) this increased oil production went a lot way in: a)boosting economic
growth (North America has easily outpaced other advanced economies since the Lehman crisis) b)
Minimize the US trade deficit and therefore: c) Boosting the value of the US dollar.
As I have noted many times before on this blog, some (maybe several) countries around the world
have massive oil reserves that are far more prolific than those currently being exploited in North
America. But these countries, do not enjoy neither the political/military clout over the GCC,
nor remotely the financial capital to engage in such massive (and risky) investments.
Countries outside of the US, Canada (to a lesser extent UK, Norway ) that are major oil
producers, need to accrue massive profits from their oil sales, since they universally divert
most of those funds into financing the government, the military and social spending, while they
must also keep some for re-investments into their oil sectors. US & Canada are uber-happy if they
can more or less break-even.
But the peak-oil-environmental bias of many, does not allow them to see this.
Your strategic analyses are very interesting Stavros, and fit many of the things we all know are
true. However I have a problem with the "We will pummel the oil price into oblivion" part.
The available evidence is that the price of oil followed very closely the supply/demand ratio.
The chart below is from Dr. Ed's blog.
I am always skeptical of interpretations that are not supported by evidence. There are multiple
theories about who caused the oil price to go down and why. I rather stick with the data, it is
not a PO bias but quite the opposite. A supply/demand mismatch caused it and nobody wanted to
cut production unilaterally.
The oil rich countries that are directly controlled by the US & co (the US Empire) also
known as GCC, The oil rich countries that are directly controlled by the US & co (the US Empire)
also known as GCC, follow an oil production policy that largely suits the core states themselves,
depending on the situation and their ability to affect the global market.
That statement makes no sense whatsoever. Just who is/are "US & Co"? Would that be Obama? Or
perhaps the US Congress? Or perhaps the US Oil Companies? Then in the second half of that long
sentence, you completely contradict the first half of the sentence. You say: follow an oil
production policy that largely suits the core states themselves," Now which is it? Are they
controlled by US & co, or are do they pay no attention to whomever in the US that is doing the
controlling and follow a policy that simply suits themselves?
I would definitely agree with the second half of your sentence, the GCC states do exactly what
they damn well please. And I would definitely disagree with the first half of your sentence. They
would pay no attention to any US politician or businessman that might call them up and try to
tell them what to do.
But back to Ron's core (and largely correct) claim that the global oil production gains
of recent years have been a North American phenomenon (I would also add Iraq).
Well no, that's not what I said. Yes, recent oil production gains have been from US, Canada,
Iraq and Saudi Arabia. But what I said was:
The recent surge in world production that was brought about by high prices…
The recent gains in Iraq and Saudi Arabia were after the price already started to fall. Those
gains were not brought about by high prices. They were despite a steep decline in prices.
That statement makes no sense whatsoever. Just who is/are "US & Co"?
"US and Co" is essentially a codename for NATO. It is ruled by international financial elite
(Davos crowd) which BTW consider the USA (and, by extension, NATO) as an enforcer, a tool for
getting what they want, much like Bolsheviks considered Soviet Russia to be such a tool.
The last thing they are concerned is the well-being of American people.
Berkshire Hathaway's stock price was 227,000 USD per share. It is now 192,000 and a few dollars
more per share. Losing shipments of 3000 petroleum carloads per week will extract a pound of flesh.
LAGOS, Nigeria - The Nigerian National Petroleum Corp. says it lost 267 billion naira ($1.3
billion) in 2015, even as it tried to pump more oil to counter slashed world prices. The
corporation's monthly report posted at its website Thursday shows the biggest losses recorded at
its headquarters, by three refineries and a subsidiary that sources and distributes refined
products. ...
I saw that article this AM too, and am wondering what some of the well informed posters here think
that would do to the oil industry. $10 a barrel is no small amount of money. Maybe he's starting
off at 10 knowing it will get whittled down to 1 or less a barrel, which would mean he's learned
something about negotiating.
Is this proposed $10 tax suppose to be,
1/ A tax on US production?
2/ A tariff on imported oil?
3/Both of the above?
A tariff would be real hard to bring in, in these days of supposed free trade. Especially from
the NAFTA countries. But the US some how seems to think international agreement only apply to
other counties when push comes to shove.
If the $10 is only applied to US production, then it just shuts down large parts of the US oil
production and increases imports. Is that the plan?
As much of this money, is suppose to be going to improved transport optiona and infrastructure,
surely the easiest an most logical increase in oil tax would be to increase tax on Gasoline and
diesel! But there seems to be a unwritten constitutional amendment stating no increases in road
fuel taxes in the US.
You fellas do make life difficult for yourselves,when the logic is so simple!
Good luck.
How would it go over if he proposed a 30 cent for each dollar of grain sold tax on all grain that
is raised in a non-organic manner, and/or with equipment that burns fossil fuels?
How about a 30 cent tax on each dollar of wages earned if the laborer gets to and from work
by a fossil fueled vehicle or works in an industry which accomplishes anything by way of fossil
fuels.
What is wrong with shared sacrifice for the common good?
The tax may be at the petrol pump. So $10/b would be about 24 cents per US gallon (or 6 cents
per liter). By European standards this would be quite low. Currently the volume weighted US average
Federal, state and local tax is about 48 Cents per gallon, so the increase would be about 50%.
Currently in the US the average gallon of petrol is $1.76/ US gallon ($0.46/liter), so the tax
would raise the price to $2/gallon.
Note that the Federal tax on gasoline is 18.4 cents per US gallon and it was last raised in
1993 (23 years ago). The tax is not indexed to inflation.
It is certainly a good time to raise the tax.
Real gasoline prices (in constant dollars) have not been this low in the US since 2002 (annual
average was $1.79/gallon that year in 2015$). The annual average gasoline price in 1993(2015$)
was $1.82/gallon.
At one time, Boone Pickens advocated putting a tax on US gasoline/diesel that would bring US fuel
prices more in line with European fuel prices, offset by cutting the US Payroll Tax. This would
of course have been a per gallon tax far in excess of what Obama apparently suggested.
Texas oilman T. Boone Pickens, who believes global oil production is near peak, advocates
raising gasoline taxes to keep pump prices around $5 a gallon, encourage conservation, and
create revenues enabling payroll-tax cuts.
"... Some of you may recall the Economist Magazine cover story, published in early 1999, which predicted–because of advances in technology and productivity gains (sound familiar?)–that we were looking at an extended long term period with oil prices in the $5 to $10 range. ..."
"... In any case, here is an excerpt from the March, 1999 Economist Magazine cover story on oil prices: ..."
"... Here is a thought: $10 might actually be too optimistic. We may be heading for $5. Thanks to new technology and productivity gains, you might expect the price of oil, like that of most other commodities, to fall slowly over the years. Judging by the oil market in the pre-OPEC era, a "normal" market price might now be in the $5-10 range. Factor in the current slow growth of the world economy and the normal price drops to the bottom of that range. ..."
"... I think that I have made a strong case that the trillions of dollars spent on upstream global oil & gas capex since 2005 have only been sufficient to keep us on an undulating plateau in actual global crude oil production (45 API Gravity and lower crude oil), and because of the large and ongoing declines in global upstream capex, even the Wall Street Journal is expressing concerns about a future oil price spike, as supply falls. ..."
"... The Cornucopian Crowd, which is basically making the same argument as the Economist Magazine writer in 1999, is arguing that advances in technology have indefinitely postponed any kind of production peak to the distant future. ..."
"... In my opinion, the reality is that global crude oil production has probably effectively peaked, while global natural gas production and associated liquids (condensate and natural gas liquids) have so far continued to increase. ..."
"... Furthermore, I suspect that all, or virtually all, of the large build in US (and probably global) Crude + Condensate (C+C) inventories in 2015 consists of condensate, and therefore oil traders are trading on fundamentally flawed data when it comes to the inventories of the product that actually correspond to the index prices. ..."
"... In the case of WTI (light/sweet) crude oil contracts, the maximum API gravity is 42, and recent EIA data suggest that about 40% of US Lower 48 C+C production in 2015 exceeded the maximum API limit for WTI crude oil, i.e., 42 API Gravity. ..."
"... Last year, Reuters ran a story about US refiners increasingly rejecting "foul" blends of heavy crude and condensate that technically fell below the upper API limit for WTI crude oil, but that were deficient in distillate content. ..."
"... In my opinion, these two items, i.e., the estimate that about 40% of US Lower 48 C+C production exceeded the maximum API Gravity limit for WTI crude oil in 2015 and case histories of US refiners increasingly rejecting blends of heavy crude and condensate, go a long way toward explaining why US refiners increased their net oil imports (from 12/14 to 12/15) as we saw 100 million barrel build in US C+C inventories from late 2014 to late 2015. ..."
"... Furthermore, Iranian sources claim that the majority of their floating storage consists of condensate, which they were permitted to export under the sanctions. This of course suggests that we might be seeing both a US and a global oversupply of condensate–but not necessarily of actual crude oil (less than 45 API gravity crude oil). ..."
Of course, the big production decline will come from investments not made. However, as I have
once, or twice, or thrice noted, it seems very likely that despite trillions of dollars in upstream
(oil & gas) global capex since 2005, we have seen little or no increase in actual global crude
oil production (45 API and lower crude).
An except from a memo I'm preparing for some industry guys:
Perpetually Low Oil Prices Versus The Laws of Physics
Some of you may recall the Economist Magazine cover story, published in early 1999, which
predicted–because of advances in technology and productivity gains (sound familiar?)–that we
were looking at an extended long term period with oil prices in the $5 to $10 range.
While I suppose it's possible that this time the conventional wisdom is right, i.e., that
we are looking at perpetually low oil prices, my bet is that the laws of physics will prevail,
especially in regard to the high, and rising, rates of decline in existing US oil & gas production.
In any case, here is an excerpt from the March, 1999 Economist Magazine cover story on oil
prices:
Here is a thought: $10 might actually be too optimistic. We may be heading for $5. Thanks
to new technology and productivity gains, you might expect the price of oil, like that of
most other commodities, to fall slowly over the years. Judging by the oil market in the
pre-OPEC era, a "normal" market price might now be in the $5-10 range. Factor in the current
slow growth of the world economy and the normal price drops to the bottom of that range.
Enclosed is a chart* showing constant dollar monthly WTI Crude oil prices, in 2016 dollars.
Note that the March, 1999 Economist Magazine article corresponded pretty much to the all time
record low constant dollar oil price for the past 40 years.
I think that I have made a strong case that the trillions of dollars spent on upstream global
oil & gas capex since 2005 have only been sufficient to keep us on an undulating plateau in
actual global crude oil production (45 API Gravity and lower crude oil), and because of the
large and ongoing declines in global upstream capex, even the Wall Street Journal is expressing
concerns about a future oil price spike, as supply falls.
The Cornucopian Crowd, which is basically making the same argument as the Economist Magazine
writer in 1999, is arguing that advances in technology have indefinitely postponed any kind
of production peak to the distant future.
I think that the reality is much more prosaic.
In my opinion, the reality is that global crude oil production has probably effectively
peaked, while global natural gas production and associated liquids (condensate and natural
gas liquids) have so far continued to increase.
Furthermore, I suspect that all, or virtually all, of the large build in US (and probably
global) Crude + Condensate (C+C) inventories in 2015 consists of condensate, and therefore
oil traders are trading on fundamentally flawed data when it comes to the inventories of the
product that actually correspond to the index prices.
In the case of WTI (light/sweet) crude oil contracts, the maximum API gravity is 42, and
recent EIA data suggest that about 40% of US Lower 48 C+C production in 2015 exceeded the maximum
API limit for WTI crude oil, i.e., 42 API Gravity.
Last year, Reuters ran a story about US refiners increasingly rejecting "foul" blends of
heavy crude and condensate that technically fell below the upper API limit for WTI crude oil,
but that were deficient in distillate content.
In my opinion, these two items, i.e., the estimate that about 40% of US Lower 48 C+C production
exceeded the maximum API Gravity limit for WTI crude oil in 2015 and case histories of US refiners
increasingly rejecting blends of heavy crude and condensate, go a long way toward explaining
why US refiners increased their net oil imports (from 12/14 to 12/15) as we saw 100 million
barrel build in US C+C inventories from late 2014 to late 2015.
Furthermore, Iranian sources claim that the majority of their floating storage consists
of condensate, which they were permitted to export under the sanctions. This of course suggests
that we might be seeing both a US and a global oversupply of condensate–but not necessarily
of actual crude oil (less than 45 API gravity crude oil).
"... Pickens then doubled-down on his wrong call from last year, telling CNBC's Squawk Box that oil prices will rise to at least $52 per barrel by the end of the year. That said, he was at least honest enough to admit that his virtually identical call from last year, when he thought prices would strongly rebound, was wrong. ..."
"... Yet while being merely wrong is excusable, being a legendary hypocrite is not. Earlier today, literally days after he predicted oil would double from its $26 bottom , Pickens told Bloomberg that he has cashed out. ..."
Just four days ago, on Monday afternoon, "legendary" oilman T Boone Pickens said that crude
has hit bottom at $26 per barrel, and predicted that prices should double within 12 months.
Pickens then doubled-down on his wrong call from last year, telling CNBC's "Squawk Box"
that oil prices will rise to at least $52 per barrel by the end of the year. That said, he was at
least honest enough to admit that his virtually identical call from last year, when he thought
prices would strongly rebound, was wrong.
Whether it's $50 or $70 by the end of 2016 will largely be determined by the global economy,
he added, reiterating the same flawed thesis he used to justify his bullishness a year ago:
"We're still building inventories, and we will for the next several months. And then we'll start
to draw," Pickens said. "Once you start to draw, you're not going to start back building again.
The draw will come here in the next few months. It'll become pretty clear."
He was wrong then, and he will be wrong this time again for the simple fact that while
historically OPEC exercised a rational production strategy, as of the 2014 OPEC Thanksgiving
massacre, there is no more OPEC, as can be seen by the relentless attempts by roughly half the
members to call an OPEC meeting unsuccessfully, confirming what we said in late 2014 - OPEC no
longer exists, which means it is every oil producer for themselves.
Putting T Boone's forecasts in context, in a CNBC commentary in October, Pickens conceded his
prediction for $70 oil by the end of 2015 wasn't going to happen, because worldwide demand did
not go up as much as he thought and supply did not markedly go down. Oil closed the year at $37:
his prediction was off by 50%.
Yet while being merely wrong is excusable, being a "legendary" hypocrite is not. Earlier
today, literally days after he predicted oil would double from its $26 "bottom", Pickens told
Bloomberg that he has cashed out.
MSM honchos are completely detached form reality and all they can is to repeat somebody else talking
points.
Notable quotes:
"... Starting in 2012 a new effort is being done to reverse the decline that produced strong increases in late 2012, and late 2013. The effort is increased in 2014 with the falling prices producing a larger increase in late 2014. ..."
"... However the increase in late 2015 is missing. The last reversion of the decline might have come to an end. If that is the case, we could see a new loss of 2 Mb/d in less than two years from non-OPEC less USA Canada. ..."
"... USA Canada might lose another 2 Mb/d in the next two years, leaving a loss of 4 Mb/d for OPEC to compensate. ..."
"... No wonder they have been so fast to lift sanctions on Iran. We are going to be very short on oil. ..."
"... Look at how much $$ the large players such as ExxonMobil, Chevron and ConocoPhillips lost in US lower 48 in 2015 with average WTI of about $50 and natural gas of $2.60. Current WTI hovering around $30 and gas hovering around $2. ..."
"... Yep. I believe I have discovered the LTO pundit formula for determining the break even price. Take the current price of WTI then subtract 20% =Break Even Price ..."
There's more info to be extracted from last chart.
Non-OPEC less USA & Canada is in decline even if Russia is not (FSU including Russia is in
decline).
The decline proceeded through 2005-2008, but their income was maintained through increasing
prices.
They reacted to the loss of income in 2008 by pumping enough to reverse the decline. Once they
recovered their income the decline was allowed to proceed, but showed an increased rate of decline
than before due to the previous increased pumping.
Starting in 2012 a new effort is being done to reverse the decline that produced strong
increases in late 2012, and late 2013. The effort is increased in 2014 with the falling prices
producing a larger increase in late 2014.
However the increase in late 2015 is missing. The last reversion of the decline might have
come to an end. If that is the case, we could see a new loss of 2 Mb/d in less than two years
from non-OPEC less USA & Canada.
USA & Canada might lose another 2 Mb/d in the next two years, leaving a loss of 4 Mb/d
for OPEC to compensate.
No wonder they have been so fast to lift sanctions on Iran. We are going to be very short
on oil.
Would love to hear what others and Art Berman have to say. Seems to good to be true unless
they are trying to goose the shale market investors one last time.
Thanks Ron for providing such a valuable forum on this crucial topic
Look at how much $$ the large players such as ExxonMobil, Chevron and ConocoPhillips lost
in US lower 48 in 2015 with average WTI of about $50 and natural gas of $2.60. Current WTI hovering
around $30 and gas hovering around $2.
We have discussed LTO break even ad nauseum here since 2014. I am sure if oil
goes below $10 WTI there will be claims of $1 break even by LTO pundits.
Yep. I believe I have discovered the LTO pundit formula for determining the break even price.
Take the current price of WTI then subtract 20% =Break Even Price
When glut of condensate is called glut of oil production that's one thing, but when the
situation is distorted and Broomberg published articles about how shale oil became cash position at
$35 per barrel is another. That's casino stooges propaganda.
Wood Mackenzie's latest global oil production analysis indicates that 3.4 MMbpd of production
is cash negative at a Brent oil price of $35. Since the dramatic drop in prices from late 2014,
there have been few halts in production-with around 100,000 bpd shut-in globally to date.
According to Wood Mackenzie, the areas with the largest volumes shut-in so far have been
Canada onshore and oil sands, conventional U.S. onshore projects and aging UK North Sea fields.
However, Wood Mackenzie cautions that the number of shut-ins is unlikely to increase at the
rate some might expect, as many producers hold out in the hope of a price rebound.
"Our latest 2016 production data indicates that with Brent crude oil prices at $35/bbl
3.4 MMbpd of oil production is cash negative, which equates to 3.5% of global supply," Stewart
Williams, V.P. of upstream research at Wood Mackenzie, explained.
Wood Mackenzie's study collates oil production data from over 10,000 fields and calculates
the cash operating costs-identifying the price at which the fields turn cash negative, and
the volume of oil production associated with this price level.
What is being affected, far more than current production, is profits. And profits determine
upstream investment in exploration and new drilling. This will affect production for several
years to come.
3.4 million barrels per day (b/d) of oil production is cash negative at a Brent oil price of
US$35, but the number of projects that have ceased production is minimal. With the oil price hitting
a record 12-year low recently, why aren't more producers turning off the taps? Using our Upstream
Data Tool and global team of analysts, we have created exclusive insight into economics of production.
Using our global database of over 10,000 oil producing fields –which account for total liquids
production of 79.7 million b/d – we have concluded that less than 0.1% of global production has
stopped. This represents around 100,000 b/d shut in so far globally; a very low number considering
the amount of producing wells that become uneconomic in this sustained low crude price.
What assets have stopped producing?
The areas hit the hardest have been Canada onshore and oil sands, aging UK North Sea fields
and conventional US onshore projects. Oil sand projects are suffering because of their high costs
and distance from the market place, while the North sea closures are mainly aged wells coming
to the end of their lifespan being sacrificed to wider project economics.
Conventional US onshore projects that have turned off the taps can be accounted for by ultra-low
output wells, or US "stripper" wells. This points to a lack of significant assets that have stopped
producing. Our analysis highlights that this is unlikely to increase at the rate some might expect.
Why are there not more production shut-ins?
Many companies will opt to take the loss, holding out for a rebound in prices. There is a cost
attached to restarting production that many will wish to avoid, offsetting the loss against capex
reductions in other areas. In other areas, the logistics of halting production is too complicated
and expensive to remain a viable option.
This still leaves the fact that 3.5% of 96.1 million b/d global supply is cash negative. Although
companies are cutting costs in other areas as our 2016 pre-FID insight highlights, this fall below
breakeven is not sustainable in the long term for many.
EDINBURGH/HOUSTON 5th February 2016 – Wood Mackenzie's latest global oil production analysis
indicates that 3.4 million barrels per day (b/d) of oil production is cash negative at a Brent
oil price of US$35. Since the dramatic drop in prices from late 2014, there have been few halts
in production – with around 100,000 b/d shut-in globally to date. According to Wood Mackenzie,
the areas with the largest volumes shut-in so far have been Canada onshore and oil sands, conventional
US onshore projects and aging UK North Sea fields. However, Wood Mackenzie cautions that the number
of shut-ins is unlikely to increase at the rate some might expect, as many producers hold out
in the hope of a price rebound.
Stewart Williams, Vice President of upstream research at Wood Mackenzie explains: "Our latest
2016 production data indicates that with Brent crude oil prices at US$35 per barrel ($/bbl), 3.4
million b/d of oil production is cash negative, which equates to 3.5% of global supply (96.1 million
b/d)."
Wood Mackenzie's latest study collates oil production data from over 10,000 fields and calculates
the cash operating costs – identifying the price at which the fields turn cash negative, and the
volume of oil production associated with this price level.
Mr Williams continues: "Since the drop in oil prices from late 2014, there have been relatively
few production shut-ins with less than 0.1% of global production halted so far – around 100,000
b/d globally."
So why aren't producers turning off the taps? Robert Plummer, Vice President of investment
research at Wood Mackenzie explains: "Being cash negative simply means that production costs are
higher than the price that the producer receives and does not necessarily mean that production
will be halted altogether. Curtailed budgets have slowed investment which will reduce future volumes,
but there is little evidence of production shut-ins for economic reasons.
"Given the cost of restarting production, many producers will continue to take the loss in
the hope of a rebound in prices. In terms of our current oil price forecast, we have recently
revised our annual average to $41 per barrel for Brent in 2016. The operator's first response
is usually to store production in the hope that the oil can be sold when the price recovers. For
others the decision to halt production is more complex and we expect that volumes are more likely
to be impacted where mechanical or maintenance issues arise and operators can't rationalise further
investment at current prices," Mr Plummer adds.
The areas hardest hit are Canada onshore and oil sands, conventional US Onshore projects and
some aging UK North Sea fields. Wood Mackenzie attributes the hit on Canadian production from
oil sands and conventional onshore to high costs and distance from market place. There have also
been production shut-in from US 'stripper' wells (onshore, ultra-low output wells) and in the
North Sea, where some operators have prematurely ceased production of aged fields.
Mr Plummer elaborates: "At a Brent oil price of US$35, Canada has 2.2 million b/d of production
which has a negative cash operating cost – predominantly from oil sands and small producing conventional
wells in Alberta and British Colombia. Venezuela is second with 230,000 b/d from its heavy oil
fields, followed by the UK with 220,000 b/d."
Mr Williams adds in closing: "In the past year we have seen a significant lowering of production
costs in the US, which has resulted in only 190,000 b/d being cash negative at a Brent price of
US$35. In fact, the biggest reductions have been from tight oil, the majority of which only becomes
cash negative at Brent prices well-below US$30/bbl."
It is clear that US shale industry now does not matter that much in this game anymore. Even if
we believe absurd extrapolation of breakeven cost that now are propagated by MSM and "Fuser law"
of breakeven price for LTO. "The Moor has done his duty, the Moor can go." (
http://canadafreepress.com/article/the-moors-can-go
). Revolutions tend to eat its own children.
What measures such counties will be able to take take outside of growing of own refining and
petrochemical sector is difficult to say, but I suspect that such measures will be taken by most
oil producing countries other then completely dysfunctional or in the state of civil war (Libya,
Iraq). Barter deals and direct swaps of currencies which avoid using dollars might became more
common. If I were Russia I would dump Western Europe market in favor of Asia and watch how they
would scramble to adjust using Saudis and Iran to compensate for those losses. Such a swap of
customers with Saudis and Iran might be a sufficient shock to change market dynamics. For example,
using "sanctions" as a justification ( by adopting the law that prohibit to sale of Russian oil
to countries that implemented sanctions against Russia ). It' a gamble but possible losses might
well be compensated by jump in global oil prices due to this shock therapy.
I suspect that the second half of this year and the next year probably will be much more interesting
and provide more surprises for linear extrapolation lovers then the second half of 2014 and 2015.
The current "glut theory" (aka "Great condensate con") is still promoted by EIA (aptly named
here "Energy Disinformation Agency"), IEA and thier friends in MSM by all means including tossing
biofuels in the mix and reporting "bloated" inventories". Until some "the last straw that broke
the camel back" moment arrives (aka "tipping point"
http://www.amazon.com/The-Tipping-Point-Little-Difference/dp/0316346624 ). At which moment
panic might start.
I doubt that in such a destabilized system we can avoid the tipping point.
One unexpected blowback of "Operation Oil Glut" is that deflation of "shale bubble" might well
take some "Internet economy" companies with it. LinkedIn today skids 40%, erases $10B in market
cap.
Susan Strange was probably the first to analyze this new "casino capitalism" model for oil boom
and bust. Here is a relevant quote from her book (1997):
As with interest rates, the problem with oil prices is not so much that they have been high,
but rather that they have also been so unpredictable and so unstable. Again the instability
has engendered a new game in the great financial casino – oil futures.
This evolved in the following way. In the 1980s as OPEC's command over the oil market weakened,
with some producers desperate for foreign exchange ready to undercut the agreed price with
secret, under the-counter deals, more and more oil cargoes came to be traded on what is rather
misleadingly called the Rotterdam spot market.
But this is not a market in the ordinary sense in which buyers and sellers are identifiable
and prices known to everyone. It is just a network of about a hundred oil traders and brokers,
connected with each other by long distance intercontinental telephone and telex. Like other
brokers in grain or porkbellies or frozen orange-
juice, they are often tempted to increase their profits by talking the market price up or down.
As late as 1978, the spot market deals still accounted for only 5 per cent of all trade
in oil. They now account for 40 per cent or more.
Inevitably, because of the close connection between oil prices, generally denominated in
dollars, and the price of the dollar in foreign exchange markets, there has grown up in London
and New York a futures market in 'paper barrels' to match the forward and futures markets in
dollars and dollar assets.
These 'paper barrel' contracts can change hands as many as 50 times, and do not need to
be based on barrels of real oil. Futures contracts on the British Brent blend of North Sea
oil are thought to add up to as much as eight times the total annual output of the Brent field
(Hooper, 1985).
In short, while there is little doubt that the instability of exchange rates has helped
to destabilize the oil market, the oil market is now adding its own gambling game to all the
others.
The picture so far is one of an international financial system in which the gamblers in
the casino have got out of hand, almost beyond, it sometimes seems, the control of governments.
The question has occurred already to a good many people whether it is the governments that
have got weaker over the past 15 years, or whether it is a fortuitous coincidence of economic
forces that have combined to make the markets more powerful. It is an important question, for
the answer will dictate what has to be done to control, to moderate, or to close down the great
financial gambling game.
That question is linked with a second one: have all states weakened in relation to markets,
or only one, or perhaps just a few of the more important governments? Those who think that
all governments have weakened tend to find rather broad general explanations of how this has
come about. If they offer solutions they are apt to be of the most vague and general kind.
In contrast, those who think the explanation lies with the few, or even just with the USA as
the dominant power in the international financial system – as all the figures show it to be
– tend to be much more specific both in the explanations they put forward and in the solutions
they suggest.
I think in 1997 the term "neoliberalism" was not yet common and "casino capitalism" was used
as a substitute for depiction of essentially the same phenomenon. She "feels the pain" but did
not understand that it was a "quite coup" that installed neoliberalism as a dominant social system
all over the world, displacing both New Deal Capitalism and Socialism. Kind of global coup
detat of financial oligarchy. So governments were already captured and can't serve as a countervailing
force for gambling.
Quote above is cited from
Casino Capitalism Reprint Edition, by Susan Strange. Paperback: 224 pages. Publisher: Manchester
University Press; Reprint edition (October 16, 1997)http://www.amazon.com/gp/product/0719052351?keywords=Susan%20Strange%20Casino%20capitalism
I wonder who writes this stuff? "3.4 million b/d of oil production is cash negative, which equates
to 3.5% of global supply (96.1 million b/d)." Which I would instead identify as "more than twice
as much as the current oversupply."
And, a comedian could not do better than this: "Being cash
negative simply means that production costs are higher than the price that the producer receives."
WTF!! Tell every company that has ever filed for bankruptcy that you "simply" spent more money
than you received. [And, so you "simply" committed financial suicide. Nothing to see here, move
along.]
"Being cash negative simply means that production costs are higher than the price that the
producer receives and does not necessarily mean that production will be halted altogether. .."
"Given the cost of restarting production, many producers will continue to take the loss in the
hope of a rebound in prices."
Shutting and then restarting wells is not as easy as to turn off and again turn on the tap
in your bathroom. It may be costly and it can damage the reservoir. It many cases it is easier
and less costly to continue producing at loss for several months
"To abandon one of the North Sea's bigger platforms, and plug up to 30 wells, can cost more
than £700m. As a result, even at $30 a barrel, some operators may prefer to keep pumping."
The posted oil price here is around $16 bbl now. On a drive I took earlier this week, I counted
9 pump jacks that were idle, and 6 pumping. I know that some of the idle pumps may be on a timer
where they pump intermittently, but it seems likely to me that many of the wells have been shut-in.
There isn't a lot of production in this area, and whats here is mostly old conventional stripper
production.
The Woodmac report references $35 oil so we don't know exactly when it was prepared. With the
declines of January , and high differentials, many areas are now at $15 to $20 oil. At that price
a lot of these wells will be producing revenue of much less than cash costs. I would think that
operators would be forced into reducing their production if prices stay this low for a while.
But, if Woodmac says they aren't shutting in, maybe they are not.
Since the dramatic drop in prices from late 2014, there have been few halts in production-with
around 100,000 bpd shut-in globally to date.
Only 100,000 barrels per day has been shut
in so far. Yet according to the EIA, Non-OPEC C+C production peaked in December 2015 at 47,207
and as of October, stood at 46,444 bpd, a drop of 763,000 barrels per day.
Obviously, production growth has stopped and the decline has begun, regardless of Wood Mackenzie's
figures.
100 kb/d mentioned by Woodmac is production shut-in due to high oil prices. This does not include
the effects of natural declines, lower drilling activity and delayed projects.
The IEA says Non-OPEC production was up 1.3 million bpd in 2015 but will be down 0.7
million bpd in 2016. Below are their numbers. They do not include biofuels or process gain.
2014 51.8
2015 53.1
2016 52.4
The IEA has Non-OPEC liquids in December 2015 down about 650,000 bpd compared to December 2014
Well, production has followed price in the USA and Canada. But elsewhere everyone just seems
to be producing flat out regardless of the price. Just as the price was peaking in early 2011,
Non-OPEC production, less USA and Canada, began to decline. Production in this chart is only
through October.
The recent surge in world production that was brought about by high prices was a USA and
Canadian phenomenon only.
"Asiri's announcement came shortly after Russia said it suspects Turkey of planning a military
invasion of Syria. Ministry spokesman Maj. Gen. Igor Konashenkov said Thursday in a statement
that the Russian military has registered "a growing number of signs of hidden preparation of the
Turkish armed forces for active actions on the territory of Syria.""
Who has ongoing military operations in Syria?
1. Syria
2. ISIS
3. IRAN
4. NATO (US, EU)
5. TURKEY (NATO, but for a non-NATO agenda)
5. KSA?
All we need is China to join in, to make it an official global war ( contained inside of one
small third world nation for the moment)
In general, Russia, Iran and Assad are winning. They are about to wipe out the rebels holding
Aleppo. That would effectively eliminate anyone for the US to support.
It also would pretty
solidly assure that no GAZPROM challenging pipeline of Qatar gas to Europe is going to happen.
How the heck is Saudi going to get troops into Syria? No shared border there. Through Iraq? Can't
see that happening because Iraq is aligned with Iran. Through Israel? Bwahahahaahahahahaha! Through
Jordan? Eh, well I guess that might work. Reasonably short supply lines too.
Well, let's get
this party really rockin' and rollin'! C'mon everybody! Let's do the twist!
Saudi Arabia won't let the plunge in oil prices derail a regional agenda that includes waging
war in Yemen and funding allies in Syria and Egypt, Foreign Minister Adel al-Jubeir said in an
interview.
"Our foreign policy is based on national security interests," al-Jubeir said on Thursday at the
Ministry of Foreign Affairs headquarters in the kingdom's capital, Riyadh. "We will not let our
foreign policy be determined by the price of oil."
The bankruptcy of the corrupt, medieval, bigot, terrorist exporting regime of Saudi Arabia would
be one of the few positive things of continuing low oil prices.
Saudi troops are going to get their ass kicked so hard. It's going to be pathetic. Saudis are
soft. Their leadership is incompetent. Their army has never seen battle on any reasonable scale.
I don't know whether to laugh at the very idea of Saudi troops fighting in Syria or cry for the
poor buggers that are gonna be turned into buzzard feed.
"... The question is whether 56 year old Crown Prince Mohammed bin Nayef (King Salman's nephew) or 30 year old Deputy Crown Prince Mohammed bin Salman (King Salman's son), or someone else, will succeed King Salman. ..."
"... King Salman, the deputy crown prince has shifted into high gear as the kingdom's minister of defense, economic czar and ultimate boss of Aramco, the national oil company that bankrolls the kingdom. Not since the 1960s has a prince his age held such power. . . . ..."
"... Some of Mohammed bin Salman's uncles and cousins insist that the senior members of the family are organizing to meet with the king in the "near future" to ask him to restrain or remove his son. ..."
"... "Is he a prince? A businessman? Or a politician?" asks one of the king's octogenarian half brothers. "I don't know when this play will end. Government is not theater. King Salman needs to open his heart and his mind to his brothers." ..."
Karen Elliott House, author of "On Saudi Arabia," has an Op-Ed in the WSJ in regard to the question
of succession in Saudi Arabia.
The question is whether 56 year old Crown Prince Mohammed bin Nayef (King Salman's nephew)
or 30 year old Deputy Crown Prince Mohammed bin Salman (King Salman's son), or someone else, will
succeed King Salman. An excerpt from the Op-Ed, "Some of Mohammed bin Salman's uncles and cousins
insist that the senior members of the family are organizing to meet with the king in the "near
future" to ask him to restrain or remove his son."
Inside the Turmoil of Change in the House of Saud
As oil prices drop and external threats mount, a 30-year-old crown prince is suddenly ascendant.
Can an audacious young prince make his tradition-bound family bow to his will and force
his somnolent society to wake up? With the sweeping powers recently bestowed on 30-year-old
Saudi Deputy Crown Prince Mohammed bin Salman, the Saudi royal family, its 30 million subjects
and the outside world may soon find out.
For the past two decades Saudi Arabia's geriatric rulers have steered the kingdom at a glacial
pace as if it were an antique car. Given the wheel last year by his father, King Salman, the
deputy crown prince has shifted into high gear as the kingdom's minister of defense, economic
czar and ultimate boss of Aramco, the national oil company that bankrolls the kingdom. Not
since the 1960s has a prince his age held such power. . . .
Prince Mohammed bin Salman, a risk-taker, has rallied much of the country behind him by
acting decisively-without deferring to the U.S.-to sever diplomatic ties with Tehran and confront
Iranian meddling in Yemen and Syria, to pursue a new 34-nation Islamic coalition against terrorism,
and to meet a parade of world leaders, including Russia's Vladimir Putin and China's Xi Jinping,
to show Washington that Riyadh has options.
As a result, there is a palpable air of anticipation in the kingdom. A growing number of
Saudis believe that the deputy crown prince will leapfrog his older cousin, 56-year-old Crown
Prince Mohammed bin Nayef, to succeed the 80-year-old King Salman. To these Saudis, especially
the younger generations, the youthful prince, with his energy and activism, is a leader whose
time has come. Some 70% of Saudis are the deputy crown prince's age or younger. To others,
including many in the royal family, he is a whirlwind about to wreak havoc in the kingdom and
create more chaos in the region. . . .
Yet some in the royal family believe this king and his son are bent on excluding the
bulk of the 7,000-member family in favor of only one line. Since 1953, the throne has passed
from brother to brother largely by seniority among the 36 sons of the founder Abdulaziz ibn
Saud. Some of Mohammed bin Salman's uncles and cousins insist that the senior members of the
family are organizing to meet with the king in the "near future" to ask him to restrain or
remove his son.
"Is he a prince? A businessman? Or a politician?" asks one of the king's octogenarian half
brothers. "I don't know when this play will end. Government is not theater. King Salman needs
to open his heart and his mind to his brothers."
Useful to remember that accuracy is not the goal of reports reported by . . . almost anyone. If
a study says something that suggests a client company is going to be destroyed, do you really
think such a study is going to see the light of day? That's like expecting a management consultant
to come in and tell management they are incompetent.
While in 2016 the supply-side response to low oil prices should be quite
significant in the U.S. LTO sector, it will be more limited outside U.S.
2. "All deep water developments will also lose money this year and
the exploration activity might grind to a halt as discrepancy between the
current price and the price of production is too extreme. That spells troubles
for future GOM production. "
A large number of new deep water projects were delayed in 2014-15, but
this will impact production levels several years from now. Existing deep
water production will continue as opex does not exceed $30-35. Most of the
projects at final stages of development will not be postponed and will start
production in time, like they did in 2015. One important exception may be
Brazil, where some project start-ups could be postponed by 1 or 2 years.
Also note, that outside Brazil, deepwater projects are operated by the oil
majors, which have much stronger balance sheets than the US E&Ps or Petrobras.
3."Carnage in Canadian oil sands."
Some projects were delayed, but oil sands production will slightly increase
this year, according to all forecasts.
5. "Several oil producing countries with higher costs or large budget
deficit in 2015 will be on the wedge of bankruptcy at the end of the year.
"
That does not mean that they will decrease oil production, the key source
of fiscal revenues.
6. "KSA will lose another hundred billions and might lose its current
credit rating."
KSA's foreign reserves decreased by some $100 bn last year, they might
lose another $100 billion in 2016, but they will still have more than $500
billion. And how declining FX reserves should impact oil production?
Russia's credit rating was lowered in 2014, but production continued to
increase in 2014 and 2015.
8. "Losses of investors might well black mark this area of investment
for the next three years. Energy funds and ETFs shrink as "naïve" investors
simply flee."
Again, you mention what might happen in the future. How this can impact
oil production volumes this year? And as soon as oil prices start to recover,
investors will return. We have seen this many times in the past.
In general, those who expect a quick supply-side response to lower oil
prices ignore the fact that lower prices and lower investments tend to have
a much delayed impact on production levels.
"... The media puts forth a continuous stream of completely unadulterated crap to its readership. Saudi Arabia is not going to spend $175 billion per year to put out of business producers that produce an entirely different product, and which sells to an entirely different market. LTO is as much like Saudi crude as Shetland Ponies are to an Arabian race horses. The similarities stop at horse. ..."
"... LTO is a very light hydrocarbon that is used as a diluent, and feed stock. Its API is 45. It is used to thin heavier hydrocarbons like Canadian bitumen to allow it to be transported by pipe. It is used as a feedstock to make hundreds of different products from paint to plastic pipe. ..."
"... Saudis light sweet crude has an API 45, and the heavier ones, API 40, deliver entirely different products as show in the graph below: ..."
"... Goldman Sachs is an unscrupulous pack of thieves who have no qualms about lying to their clients, or the public if it serves their purposes. They, and others in the shale financing business will continue to push the Saudi/ US LTO myth for as long as they can find investors that are credulous enough to believe them. ..."
"... Some see only what they want to see. Others see the whole forest. Bloomberg and Goldman are both habitual liars and thieves. Goldman says it and Bloomberg backs it up, as if either have any credibility left. ..."
"... Short has it correct. All you see in the US MSM is bullshit in ever higher and smellier piles. As we approach the end, the cries will be louder, shriller and continuous. Wait and see. ..."
"A deal is not only "highly unlikely," in the estimation of Goldman Sachs, but "self-defeating"
for the Saudis. By cutting production now and boosting prices, Saudi Arabia would effectively
bail out U.S. shale producers just as the Saudi strategy of keeping prices low to squeeze them
out of the market is beginning to work, Goldman's Jeff Currie argues."
The media puts forth a continuous stream of completely unadulterated crap to its readership.
Saudi Arabia is not going to spend $175 billion per year to put out of business producers that
produce an entirely different product, and which sells to an entirely different market. LTO is
as much like Saudi crude as Shetland Ponies are to an Arabian race horses. The similarities stop
at horse.
LTO is a very light hydrocarbon that is used as a diluent, and feed stock. Its API is >
45. It is used to thin heavier hydrocarbons like Canadian bitumen to allow it to be transported
by pipe. It is used as a feedstock to make hundreds of different products from paint to plastic
pipe.
Saudi's light sweet crude has an API 45, and the heavier ones, API < 40, deliver entirely
different products as show in the graph below:
Saudi's light sweet crude, and LTO are entirely different products that sell to entirely different
markets. Saudi's crude is no competition to LTO and LTO is no competition for Saudi's crude.
Goldman Sachs is an unscrupulous pack of thieves who have no qualms about lying to their
clients, or the public if it serves their purposes. They, and others in the shale financing business
will continue to push the Saudi/ US LTO myth for as long as they can find investors that are credulous
enough to believe them.
makati1 on Thu, 4th Feb 2016 7:59 pm
Some see only what they want to see. Others see the whole forest. Bloomberg and Goldman
are both habitual liars and thieves. Goldman says it and Bloomberg backs it up, as if either have
any credibility left.
Short has it correct. All you see in the US MSM is bullshit in ever higher and smellier
piles. As we approach the end, the cries will be louder, shriller and continuous. Wait and see.
"... Have heard from someone who I believe knows better than the Bloomberg writer that "there are likely little to no Wolfbone wells in Reeves country that are even close to being economic at $45 dollar oil." ..."
"... I'm ready to give up. If the massive losses experienced in 2015 do not make believers out of anyone, neither will the upcoming even greater 2016 losses. ..."
"... Funny how we get this Bloomberg report at the same time both oxy and apache are trying to bail on wells and large undeveloped acreage positions in the same freaking location. I also recently pointed out another oxy package in Loving Co., with one strong well and two weak ones. Bloomberg touts it as low cost too. ..."
"... the operational aspects that are enabling far higher resource recovery at far shorter time frames is not open to debate. ..."
"... Bringing 11 wells from one pad online at an average cost way less than $3 million, like PDC just did in the Niobrara, will become the norm in certain areas, not the exception. ..."
"... Drilling two laterals 500 apart, and having each well produce almost 500 MMcf of natgas per month, like Rice's Blue Thunder wells, is becoming the standard in eastern Ohio. ..."
"... Employing far more effective fracs via proppant type, amount, and precise placement not only is boosting initial output, it is enabling more long lasting conductivity to the wellbore. ..."
"... EOG and Whiting are leading the way, along with a handful of smaller, entrepreneurial Canadian operators. ..."
"... I attended a dinner tonight at the Midland Petroleum Club. My wife and I sat next to a former local banker. He told us that one of the banks in town has 26 bank examiners in its office this week. ..."
"... no amount of talk can change the fact that the US E P industry is completely toast if $30 WTI and $2 natural gas persist. ..."
"... I am starting to think many desire that very result, including the current White House occupant. ..."
Texas has a message for $30 crude doomsayers: Bring it on.
A handful of shale patches in the state, which would be the world's sixth-largest oil producer
if it were a country, are profitable with crude below $30 a barrel, according to an analysis
by Bloomberg Intelligence. In the Eagle Ford's DeWitt County, which produced more than 100,000
barrels a day in November, the average well can be profitable with U.S. benchmark crude at
$22.52 a barrel, $4 below the lowest level this year.
Drive 200 miles southwest to Dimmit County, and drillers need $58 oil. The wide range of
break-evens, a term for the price at which a well goes from profitable to unprofitable, illustrates
one reason why shale production from exploration and production companies has been more resilient
than expected.
"It may be harder to kill many U.S. E&Ps than analysts originally thought," Bloomberg Intelligence
analyst William Foiles said in the presentation. "The wide range of break-evens undermines
efforts to come up with a single threshold for U.S. shale producers."
It's easier to survive low oil in some places than in others. Bloomberg Intelligence analyzed
everything from the average well output to the amount of local school taxes to learn the average
break-even cost for drilling in different rock formations in counties across Texas's two big
shale regions, the Eagle Ford in south Texas and the Permian Basin.
Nine areas had break-even costs at $30 or below, including some of the biggest oil-producing
counties in Texas, such as DeWitt, Midland, Martin and Reeves, with had combined output of
430,000 barrels a day in November, according to the Texas Railroad Commission.
Oil prices can be even lower to justify completing wells that have already been drilled
but haven't yet been hydraulically fractured, or fracked. Companies have built up a fracklog
of more than 4,000 of those wells in the U.S. It's economic to complete wells in 18 different
areas in the Permian and Eagle Ford at sub-$30 oil. In Reeves County in the Permian, oil prices
above $14 justify fracking an already-drilled well.
Even within one county, break-even costs can vary widely depending on which company is drilling
and the richness of the rocks they're tapping, said Kathryn Downey Miller, a principal at Lakewood,
Colorado-based energy research firm BTU Analytics LLC. In DeWitt, for example, about 45 percent
of wells drilled in 2014 would have been profitable with oil below $20, but another 5 percent
needed $70 oil.
"You see a great amount of variability between operators, even in a small geographic area like
a county," she said by phone.
That variability makes it difficult to tell when companies will give up drilling. For instance,
while companies reduced the number of new wells coming online in Dimmitt County to 65 in the
third quarter last year from 226 in the first quarter, they increased activity in DeWitt County
by 77 percent.
"The good news is we're primed and ready for when we need to see a return to activity in
North America," Miller said. "This lower price environment is making companies defer big oil
projects, so there will be an opportunity for U.S. shale producers to contribute to production
growth, and they'll be better able to compete than they've ever been."
Have heard from someone who I believe knows better than the Bloomberg writer that "there are
likely little to no Wolfbone wells in Reeves country that are even close to being economic at
$45 dollar oil."
"Oil prices can be even lower to justify completing wells that have already been drilled
but haven't yet been hydraulically fractured, or fracked.
Companies have built up a fracklog of more than 4,000 of those wells in the U.S. It's
economic to complete wells in 18 different areas in the Permian and Eagle Ford at sub-$30 oil.
In Reeves County in the Permian, oil prices above $14 justify fracking an already-drilled well."
Probably this amazing insight was discovered after a field trip to a local bar and in-depth communication
with locals. As if money spend on initial drilling can just be written off and does not hang on
the company balance sheet.
OXY has a 19 well Wolfbone package for sale in Pecos Co., which shares a border with Reeves Co.
100% GWI, 75% NRI. 16 producing, 1 SWD, 2 already plugged. 8/8 production is 300 bopd, 496 mcfpd.
Wells completed 2014-2015.
So I suppose for OXY and the rest we ignore wells like the above, and continue with the $22 break
even BS because someone hit a few good wells the next county over?
I'm ready to give up. If the massive losses experienced in 2015 do not make believers out
of anyone, neither will the upcoming even greater 2016 losses.
shallow sand, 02/05/2016 at 1:01 am
Ironically, just after posting this I see a flyer in my email. Apache has 6 Wolf bone wells
plus large acreage tract for sale in Reeves and Pecos counties.
The 6 wells are producing 220 bopd gross, 165 net. Those likely don't break even at $92, let alone
$22.
Funny how we get this Bloomberg report at the same time both oxy and apache are trying to
bail on wells and large undeveloped acreage positions in the same freaking location. I also recently
pointed out another oxy package in Loving Co., with one strong well and two weak ones. Bloomberg
touts it as low cost too.
The break even price point can seem sometimes like an endless discussion, but the operational
aspects that are enabling far higher resource recovery at far shorter time frames is not open
to debate.
It is happening and will continue to happen. Bringing 11 wells from one pad online at an
average cost way less than $3 million, like PDC just did in the Niobrara, will become the norm
in certain areas, not the exception.
Drilling two laterals 500′ apart, and having each well produce almost 500 MMcf of natgas
per month, like Rice's Blue Thunder wells, is becoming the standard in eastern Ohio.
Employing far more effective fracs via proppant type, amount, and precise placement not
only is boosting initial output, it is enabling more long lasting conductivity to the wellbore.
EOG and Whiting are leading the way, along with a handful of smaller, entrepreneurial Canadian
operators.
While the attention may be drawn to the financials, the underlying 'how it's getting done'
continues, IMHO, to be the big story.
I attended a dinner tonight at the Midland Petroleum Club.
My wife and I sat next to a former local banker. He told us that one of the banks in town has
26 bank examiners in its office this week.
"... Overall expenditures to build or expand major oil sands projects in 2015 are expected to be $15 billion, down more than 30% from 2014. NEB said cancelled or deferred projects due to low oil prices now total more than 700,000 b/d. ..."
"... NEB said bitumen extraction by mining uses large mining shovels and trucks to excavate near-surface deposits, while in-situ involves the drilling of wells and "typically uses the application of steam stimulation to recover bitumen from subsurface deposits." ..."
In situ production will be responsible for the majority of the increase, but production from mining
will also increase.
The November oil sands production number represents 60% of Canada's total oil production of 4.1
million b/d.
Overall expenditures to build or expand major
oil sands projects
in 2015 are expected to be $15 billion, down more than 30% from 2014. NEB said cancelled or deferred
projects due to low oil prices now total more than 700,000 b/d.
NEB said bitumen extraction by mining uses large mining shovels and trucks to excavate near-surface
deposits, while in-situ involves the drilling of wells and "typically uses the application of steam
stimulation to recover bitumen from subsurface deposits."
The Saudis, of course, have no intention of cutting production by themselves so that Iran can
regain its former market share. In order for any production cutting agreement to work, there
would have to be cuts by all or most of the major exporting countries, including Russia, Iran,
Iraq, and the Gulf Arab states. Given the current size of world stocks and the pace at which
they are increasing, it would require a large production cut to bring markets back into balance
and whittle down the surplus. While $30 oil is taking a toll on the economies of all the
exporters, there is a general fear that rising prices would simply encourage US shale oil
producers to increase drilling again as they did during the price jump last summer.
The weekly stocks' report showed US crude and gasoline inventories increasing by 8.4 million and
3.5 million barrels respectively, but colder weather lowering the distillate inventory by 4.1
million barrels and the propane inventory by 6.2 million barrels. The EIA says that US domestic
crude production fell by only 14,000 b/d last week to 9.2 million b/d.
Low oil prices have led to $14 billion in losses for independent oil explorers last year. Major
US shale oil companies such as Hess, Continental Resources, and Noble Energy announced major
cutbacks in capital spending in the coming year. The cuts were steeper than analysts had
expected. Halliburton oil services company reported a 9 percent drop in revenue, year over year,
in the fourth quarter. The company reported a loss of $28 million in the fourth quarter as
compared to a $901 million profit in the last quarter of 2014.
The Canadian oil
giant has lowered costs and delayed projects to weather collapsing prices that are making many oil-sands
operations unprofitable. The 2016 spending cuts come after the company eliminated more than 1,000
jobs and slashed its budget last year.
"... With that, yesterday we said "buy oil when there's blood in the streets." With the fourth largest oil company in the world trading like it's going bankrupt, there was (and is) certainly blood in the streets. ..."
"... With that in mind, despite another bearish oil inventory report for oil this morning, oil reversed course and climbed more than 9% in just a few hours today. ..."
Yesterday we talked about the dangerously weak price of
oil. At this stage in the global economic recovery (or
crisis, however you like to look at it), weak oil is like
the bursting of the housing bubble. If it persists, we're
looking at a calamitous fall-out that will ultimately be
worse than the "great recession." And, of course, because
of that potential outcome, we discussed the likely forms
of intervention that can avert that disaster.
With that,
yesterday we said "buy oil when there's blood in the
streets." With the fourth largest oil company in the
world trading like it's going bankrupt, there was (and is)
certainly blood in the streets.
As we said, one of the common sense solutions for weak
oil is the outright purchase of oil by a central bank.
The best suited is the Bank of Japan. And overnight, the
head of the BOJ reiterated in a prepared speech that there
are "no limits" to what they can buy
within their QE program (i.e. oil is fair game).
With that in mind, despite another bearish oil
inventory report for oil this morning, oil reversed course
and climbed more than 9% in just a few
hours today.
So, what could be the signal across markets that get
traders and investors believing that the bottom is in for
oil and, therefore, the elevated risk in global markets
will be abating? It just might be the dollar.
Because most commodities are priced in, and trade in,
dollars, the dollar tends to have periods of tight inverse
correlation (i.e. move in the opposite direction) with
commodities – oil, among them. And today the dollar
technically cracked and gave the world a signal to buy
commodities.
Statoil losses increasing, 11% capital budget reduction for 2016, but no
announcement of additional layoffs that I have seen:
"Norwegian oil giant
Statoil has posted a net loss for the fourth quarter of 2015. Net loss for
the quarter was NOK 9.2 billion, down from a net loss of NOK 8.9 billion a
year ago. For the full year 2015, the company's net loss was NOK 37.3
billion."
The Canadian
oil giant has lowered costs and delayed projects to weather collapsing prices that are making
many oil-sands operations unprofitable. The 2016 spending cuts come after the company eliminated
more than 1,000 jobs and slashed its budget last year.
As crude oil prices (New York Mercantile Exchange: @CL.1) rally back above $30 per barrel, the
chairman of India's Vedanta Resources (London Stock Exchange: VED-GB) told CNBC that the only way
for the commodity was up.
Unless Morgan Stanley predicts recession this is pretty unconvincing
Notable quotes:
"... The bank lowered its average 2016 Brent price forecast to $30 per barrel, down from $49 previously. The bank now expects an average price of $40 per barrel in 2017 as oversupply persists, before climbing past $50 by the end the year to average $70 by 2018. ..."
"... To rebalance the market, we maintain that demand must 'catch up' to supply, as production is unlikely to retrench materially. The challenge is that demand growth is slowing. ..."
Morgan Stanley has downgraded its outlook for oil prices, expecting low prices to persist for
longer than previously thought as the supply and demand imbalance looks set to continue for at
least another two years.
The bank lowered its average 2016 Brent price forecast to $30 per barrel, down from $49
previously. The bank now expects an average price of $40 per barrel in 2017 as oversupply
persists, before climbing past $50 by the end the year to average $70 by 2018.
"To rebalance the market, we maintain that demand must 'catch up' to supply, as production
is unlikely to retrench materially. The challenge is that demand growth is slowing. When
combined with seasonality and lagged data, confirmation of large draws and rebalancing now may
not be apparent until mid-2017 in our base case," said analysts led by Andrew Sheets at the
group.
Sheets said any recovery will need to be a "three step" process, where an oversupplied market
needs to rebalance by cutting production and increasing demand, working off high oil inventories
and allowing producer hedging to run its course.
It hasn't been pretty. Two out of every three drilling rigs in the U.S. have
been idled and scores of roughnecks who worked them laid off. Law firm Haynes
and Boone says 42 companies already filed for bankruptcy as of Jan. 6. For the
most part, though, it has worked. U.S. output last week was 9.2 million
barrels, the highest January level since 1971 and just 5 percent down from last
year's peak.
It's easier to survive low oil in some places than in others.
Bloomberg Intelligence analyzed everything from the average well output to the
amount of local school taxes to learn the average break-even cost for drilling
in different rock formations in counties across Texas's two big shale regions,
the Eagle Ford in south Texas and the Permian Basin, which contains several
shale layers such as the Spraberry and Wolfcamp.
Nine areas had break-even costs at $30 or below, including some of the
biggest oil-producing counties in Texas, such as DeWitt, Midland, Martin and
Reeves, with had combined output of 430,000 barrels a day in November,
according to the Texas Railroad Commission.
Even Lower
Oil prices can be even lower to justify completing wells that have already
been drilled but haven't yet been hydraulically fractured, or fracked.
Companies have built up a fracklog of more than 4,000 of those wells in the
U.S. It's economic to complete wells in 18 different areas in the Permian and
Eagle Ford at sub-$30 oil. In Reeves County in the Permian, oil prices above
$14 justify fracking an already-drilled well.
Even within one county, break-even costs can vary widely depending on which
company is drilling and the richness of the rocks they're tapping, said Kathryn
Downey Miller, a principal at Lakewood, Colorado-based energy research firm
BTU Analytics LLC. In DeWitt, for example, about 45 percent of wells
drilled in 2014 would have been profitable with oil below $20, but another 5
percent needed $70 oil.
"You see a great amount of variability between operators, even in a small
geographic area like a county," she said by phone.
More Activity
That variability makes it difficult to tell when companies will give up
drilling. For instance, while companies reduced the number of new wells coming
online in Dimmitt County to 65 in the third quarter last year from 226 in the
first quarter, they increased activity in DeWitt County by 77 percent.
While shale drillers have been battered during the price downturn, there may
be a silver lining. Those who can maintain the cost reductions and productivity
improvements when prices eventually rise may be stronger than before the crash.
"The good news is we're primed and ready for when we need to see a return to
activity in North America," Miller said. "This lower price environment is
making companies defer big oil projects, so there will be an opportunity for
U.S. shale producers to contribute to production growth, and they'll be better
able to compete than they've ever been."
And what about loss of production in the USA ? Something around 0.8 Mb/d.
Notable quotes:
"... Morgan Stanley expects Brent to average $31 a barrel in the first three months of this year and $30 in the second and third quarters. This compares with earlier targets of $42, $45 and $48, respectively. The contract for April settlement rose 32 cents, or 0.9 percent, to $35.36 a barrel at 2:10 p.m. Singapore time. ..."
"... "Demand growth has slowed, with even gasoline and the global consumer showing signs of deceleration," ..."
Venezuela said five other members of the Organization of Petroleum Exporting Countries would
join non-OPEC producers Russia and Oman should an extraordinary meeting be called. There are
growing calls for producers around to world to act to stem the decline in oil prices, which
plunged to the lowest level in more than a decade last month. OPEC effectively abandoning its
production ceiling in December and Russia pumping at a record is exacerbating a global glut, with
U.S. inventories at the highest level since 1930 as the nation's shale fields remain resilient.
Morgan Stanley expects Brent to average $31 a barrel in the first three months of this
year and $30 in the second and third quarters. This compares with earlier targets of $42, $45 and
$48, respectively. The contract for April settlement rose 32 cents, or 0.9 percent, to $35.36 a
barrel at 2:10 p.m. Singapore time.
"Demand growth has slowed, with even gasoline and the global consumer showing signs of
deceleration," said Longson. "Global supply remains resilient and grows in 2016 on a
combination of producer incentives, follow-through on longer lead time projects and the return of
additional volume from Iran."
Data from Rystad Energy show the number of completed wells have by far outpaced
the number of wells spudded (drilled) since 4Q14. Indeed, the number of well completions per month
continued to increase several months after the rig count started to drop off, peaking at more
than 1,600 wells in December 2014. The number of completions are still outpacing the number of
new wells drilled, and as a result, the number of uncompleted wells, or the frack-log, has been
cut down from its peak of around 4,600 wells hit at the end of 2014 to around 3,700 wells currently.
This seems to make a total mockery of all the claims in the media, that they were drilling
cheaper wells, and saving them for future production, with an ever increasing number of DUCs.
Rystad Energy's analysis makes a lot more sense, that the shale drillers were completing more
than they drilled, to conserve current cash, then the often stated line saving DUCs for the future
. Especially when the shale players are fighting for a future that may not exist for them.
"... Saudi Arabia won't let the plunge in oil prices derail a regional agenda that includes waging war in Yemen and funding allies in Syria and Egypt, Foreign Minister Adel al-Jubeir said in an interview. ..."
Saudi Arabia won't let the plunge in oil prices derail a regional agenda that includes waging
war in Yemen and funding allies in Syria and Egypt, Foreign Minister Adel al-Jubeir said in an
interview.
"Our foreign policy is based on national security interests," al-Jubeir said on Thursday at the
Ministry of Foreign Affairs headquarters in the kingdom's capital, Riyadh. "We will not let our
foreign policy be determined by the price of oil."
The bankruptcy of the corrupt, medieval, bigot, terrorist exporting regime of Saudi Arabia would
be one of the few positive things of continuing low oil prices.
The Middle Eastern OPEC countries that aren't already up in smoke are tinderboxes, and Saudi
Arabia's King Salman has just reached for the matches. His government ushered in the new year by
beheading a top Shia dissident cleric. It was a calculated goading by the Sunni monarchy,
triggering protests and the trashing of the Saudi embassy in Iran.
Those of us who remember the "Tanker War" in the '80s, when Iranian and Iraqi jets chased each
other's oil tankers up and down the Gulf firing missiles at them, know how things can escalate.
Kuwait found this out the following decade when Iraq accused it of slant drilling under the fence
and helping itself to Iraqi oil. Kuwait was invaded and all its oil wells were deliberately
torched.
All Gulf OPEC members have tense border disputes with at least one neighbor, so offshore
islands and oil platforms in the region bristle with radar and missiles. Iran regularly threatens
to close the Strait of Hormuz to shipping, as Sunni and Shia conflicts smolder on Saudi borders
to the north, east and south.
On these governments – and on the accuracy of Saudi gunners in shooting down incoming missiles
fired at oil installations by Iranian-backed rebels in Yemen – depend the fortunes of Albertan
drillers. Aside from the short-term economic weapon of cheap oil, the Saudi kingdom also has a
medium-term weapon in its economic arsenal – the sun. During peak seasonal power demand, as much
as 700,000 bpd of crude burn in Saudi power stations. Of its planned 41 gigawatts of solar power
capacity, the kingdom's only built small plants so far. But it only takes two years to build a
solar farm, releasing more oil for export. Even launching the first phase of this project would
impact oil prices.
The kingdom has another powerful motive to do this: money. The World Bank estimates Saudi
Arabia spends 10 percent of its GDP on energy subsidies, or about $80 billion a year. These are
subsidies that it is now having to cut, risking social unrest. Wars cost money. The IMF says the
kingdom's estimated $640 billion in foreign reserves will run out in five years at this rate. But
Riyadh thinks it has greater stamina than Iran and its ally Russia, whose oil dollars buy weapons
for Saudi enemies. The country warily eyes Iran's unleashing of 500,000 bpd onto a post-sanctions
market.
The Saudi kingdom needs lower oil prices now, to squeeze Iran's depleted coffers tighter and
faster, which it hopes will also strangle North American producers.
Washington, Riyadh, Tehran … no one mentions Ottawa, despite Canada being a top oil exporter.
Accessing only one market and having no effective national strategy to get our crude to tideline,
Canada can do little to influence global energy politics. To find out when the sun will once
again rise over the oil sands, face east – and look all the way to the Arabian Gulf.
The IEA Oil Market Report,
full issue, is now available to the public. Some interesting observations:
Non-OPEC oil supplies are nevertheless seen sharply lower in December. Overall supplies are estimated
to have slipped by more than 0.6 mb/d from the month prior, to 57.4 mb/d. A seasonal decline in
biofuel production, largely due to the Brazilian sugar cane harvest, of nearly 0.4 mb/d was the
largest contributor to December's drop. Production in Vietnam, Kazakhstan, Azerbaijan and the
US was also seen easing from both November's level and compared with a year earlier. Persistently
low production in Mexico and Yemen were other contributors to the year-on-year decline.
As such, total non-OPEC liquids output slipped below the year earlier level for the first time
since September 2012. A production surge in December 2014 inflates the annual decline rate, but
the drop is nevertheless significant should these estimates be confirmed by firm data. Already
in November, growth in non-OPEC supply had slipped to 640 kb/d, from as much as 2.9 mb/d at the
end of 2014, and 2.4 mb/d for 2014 as a whole. For 2015, supplies look likely to post an increase
of 1.4 mb/d for the year, before contracting by nearly 0.6 mb/d in 2016. A prolonged period of
oil at sub-$30/bbl puts additional volumes at risk of shut in as realised prices fall close to
operating costs for some producers.
"... They insist on lumping biofuels with crude oil etc. I would call them the Energy Disinformation Agency. ..."
"... Alex, they lump everything in the discussions and most tables intended for public distribution. I spend a lot of time explaining to people their graphs and most data tables are covering up what happens to crude oil and condensate. I consider their practices to be deceitful. ..."
Alex, they lump everything in the discussions and most tables intended for public distribution.
I spend a lot of time explaining to people their graphs and most data tables are covering up what
happens to crude oil and condensate. I consider their practices to be deceitful.
shortonoil on Thu, 4th Feb 2016 2:27 pm
Some of this data looks very anomalous. For instance, if one looks at the US rig count vs Us
C+C production between June '09 and Sept '11, rig count increased by 800 or 500%.
During that same period US C+C production stayed flat.
What were these guys doing, playing poker for 26 months? From spud to IP was no more than 8
months even back in the dark ages (2009) of shale production.
Assuming 4 wells per year per rig that would have been about 1500 new wells.
The decline rate of conventional US wells was probably about 5% or 250,000 b/d per year. Without
some kind of explanation it is hard to take this data seriously.
"... The production life indicator shows the production months left if there are no new wells drilled. So, in 2014 companies had to replace the current production within 13 months through new production. However, during 2015 this indicator shows that production has to be replaced within 8.5 months, which is 40% faster. ..."
"... The 'Red Queen' had to run 40% faster just to keep production stable – and needs therefore also 40% more capex – just to keep production even. ..."
"... Capex for oil and gas has been around USD 200 bn in 2014, yet with the strong declines in 2016 close to USD 500 bn are required to keep production stable. The huge capital required significantly weakened the US bond market by end of last year and threatens to bring down the whole US economy. ..."
"... Something has to give now: either the dollar falls or the bond market weakens even further or at least 3mill bbl/d will come out of the market and oil will rise again. ..."
In my view Wall Street has been surprised by the recent dynamics of shale economics.
In below chart I have tried to develop an indicator which depicts at which speed the 'Red Queen'
has to run.
The production life indicator shows the production months left if there are no new wells
drilled. So, in 2014 companies had to replace the current production within 13 months through
new production. However, during 2015 this indicator shows that production has to be replaced within
8.5 months, which is 40% faster.
The 'Red Queen' had to run 40% faster just to keep production stable – and needs therefore
also 40% more capex – just to keep production even.
Below chart also shows that this trend accelerates and it is very likely that the time for
replacement of current production sinks to 5 months this year. In other words companies in the
Eagle Ford have to replace current production twice every year, which is an enormous task and
requires much more capital than in previous years.
Capex for oil and gas has been around USD 200 bn in 2014, yet with the strong declines
in 2016 close to USD 500 bn are required to keep production stable. The huge capital required
significantly weakened the US bond market by end of last year and threatens to bring down the
whole US economy.
Something has to give now: either the dollar falls or the bond market weakens even further
or at least 3mill bbl/d will come out of the market and oil will rise again.
This article is purely stupid. Nobody can lower the cost so much. The best way is to lay off
people but it will impact the production soon. I was laid off last year from an oil company. But
the cost only drops marginally. It makes the company easier to borrow though. That is it. This
article sounds like whistling while through the graveyard. They are lying. The secret is piling
on dedt. This is a race who can borrow more.
This guy must be kidding or telling a straight-faced lie. US rig count has dropped from an
average 1600s to 500s and canadian number from nearly 600 to 250. Does this mean lower than spot
break even cost? What bunch of BS. US production has come down 600k barrels a day.
This is horseshit... all of a sudden they're profitable at sub 30? I smell horseshit. More
likely that one or more of the primary dealers is financing this scam with fresh Yellenbucks to
keep this train rolling until "someone" across the pond folds like a cheap suit... there's no
fucking way these guys are "profitable" sub 30... just another fucking tall tale...put it on the
pile with the others...
Output from Russia, which vies with Saudi Arabia and the U.S. as the world's
top producer, may fall this year by as much as 150,000 barrels a day, or about
1.3 percent, according to analysts including Neil Beveridge, at Sanford C. Bernstein
& Co.
The country's production set a post-Soviet high in January as output of crude
and a light oil called condensate climbed 1.5 percent from a year earlier to
10.878 million barrels a day, according to the Energy Ministry's CDU-TEK unit.
"... We got wealthy, while Africa and the Middle East got poorer, due in part to the predations of our empire building of the previous century. But they acquired our weaponry, and began to emulate our methods of wholesale slaughter. Now much of the Middle East and swathes of Africa are economic basket cases. ..."
"... So the instinct for survival being what it is, they are looking hungrily at Europe, just as we Europeans looked hungrily at Africa in the 17/1800s. They see our prosperity, and want a piece of it. And so the invasion has begun. Poetic justice perhaps. ..."
"... We Europeans dont have wars any more -- we want to do the right thing . But now we realize we have limits -- and demand that our borders be shut. ..."
"... So do we revert to more traditional armed border guarding? And if we do-are we going to shoot at the boatloads of unarmed people crossing into Greece -- sink the boats and let a few drown to deter the others? ..."
"... This is just hypothesis –- but as the invasion continues, it will materialize in hard choices. Shut the door by all means –- but face up to what must happen next ..."
"... There is much comment on here about defending homesteads when the SHTF-well, as far as the Syrians heading for the plenty of Europe are concerned, the shit has already hit the fan. Theres nothing left for them to go back to. ..."
"... Things are a bit more homogenous now. You dont have to secure resources. You can destroy competing consumption instead. Actually much easier. ..."
When one tribe recognizes that another tribe has greater access to resources than they do, then
invasion and attempts at conquest are inevitable.
check back through history, virtually every conflict kicked off that way.
Shutting borders won't work unless you are prepared to back it up with force of arms.
Ask yourself that question, and consider your answer thoughtfully. Answer it when you've read
this. here in Europe we have been at war with one another from the time the Romans left, until
1945
Then we decided to get civilized and like each other-sort of.
That brought us a few decades of prosperity under the auspices of the EU. Which was formed
incidentally as a common market for coal and iron originally–to prevent us fighting over it again.
Like all such organizations it grew and grew–finding justification for its own expansion and
existence.
We got wealthy, while Africa and the Middle East got poorer, due in part to the predations
of our empire building of the previous century. But they acquired our weaponry, and began to emulate
our methods of wholesale slaughter. Now much of the Middle East and swathes of Africa are economic
basket cases.
So the instinct for survival being what it is, they are looking hungrily at Europe, just
as we Europeans looked hungrily at Africa in the 17/1800s. They see our prosperity, and want a
piece of it. And so the invasion has begun. Poetic justice perhaps.
And we Europeans, having become "civilized" offer a helping hand. Unfortunately that encourages
more and more, so now we have a million migrants a year demanding to be let in. Now we are faced
with a different form of conflict-so far a passive one. We Europeans don't have wars any more
-- we want to "do the right thing". But now we realize we have limits -- and demand that our borders
be shut.
We can't put up "CLOSED" signs, we can't physically police 000s of miles of land and sea access.
So now what? We cannot go on to 10m–20m, but they will keep coming unless stopped. The word is
out that we currently have no choice but to accept everyone.
So do we revert to more 'traditional' armed border guarding? And if we do-are we going
to shoot at the boatloads of unarmed people crossing into Greece -- sink the boats and let a few
drown to deter the others?
This is just hypothesis –- but as the invasion continues, it will materialize in hard choices.
Shut the door by all means –- but face up to what must happen next.
The refugees could easily head for the wealthy gulf states for refuge -– they don't, because
they are aware of the reception they'd get.
There is much comment on here about defending homesteads when the SHTF-well, as far as
the Syrians heading for the plenty of Europe are concerned, the shit has already hit the fan.
There's nothing left for them to go back to.
So this would appear to be a choice we are all going to have to make in the not too distant
future.
Right now, Europe can feed and house a million immigrants, but soon the European economic model
will collapse, nevertheless our guests will still demand to be fed and housed.
When it is is financially impossible to do that , when Europeans can't even feed themselves,
the adversaries in next European war will be clearly defined by desperation to survive.
When one tribe recognizes that another tribe has greater access to resources than they do,
then invasion and attempts at conquest are inevitable. Check back through history, virtually
every conflict kicked off that way.
Things are a bit more homogenous now. You don't have to secure resources. You can destroy
competing consumption instead. Actually much easier.
"... OPECs Secretary-General Abdulla al-Badri decided to go all-in right out of the gate, saying that well see oil hit $200 per barrel. ..."
"... According to North Dakotas Department of Mineral Resources, prices need to stay above $55 per barrel for production to continue growing: ..."
"... Click Table to Enlarge ..."
"... That said, keep in mind that the break-even price for new drilling isnt the same throughout the Bakken. In fact, I mentioned to my readers recently that two-thirds of North Dakotas oil production takes place in just three counties. ..."
"... Of course, the break-even prices in these counties are approximately $36/bbl, $30/bbl, and $29/bbl. ..."
"... Perhaps the worst-kept secret in the Williston Basin is the severe lack of infrastructure. Essentially, there are three options that all Bakken producers have when it comes to transporting their crude oil: pipeline, rail, or truck. The latter two of these options come at an added cost. ..."
"... Today, producers really only have two options: rail and truck. Remember, North Dakota only has a pipeline capacity of about 443,000 barrels per day. ..."
"... no matter how high or low crude prices move ..."
"... A true insider in the energy markets, Keith is one of few financial reporters to have visited the Alberta oil sands. His research has helped thousands of investors capitalize from the rapidly changing face of energy. Keith connects with hundreds of thousands of readers as the Managing Editor of Energy Capital as well as Investment Director of Angel Publishings Energy Investor. For years, Keith has been providing in-depth coverage of the Bakken, the Haynesville Shale, and the Marcellus natural gas formations - all ahead of the mainstream media. For more on Keith, go to his editors page . ..."
The soothsayers have been out in full force lately, yet none can agree on where oil is headed.
In some cases, the disparities are staggering.
Just weeks after oil began rallying from a fresh 52-week low of $43.58 per barrel on January 29th,
it seems like both sides of the fence are adamant that theirs is the correct forecast.
But whom do we trust?
OPEC's Secretary-General Abdulla al-Badri decided to go all-in right out of the gate, saying
that we'll see oil hit $200 per barrel.
... ... ....
One thing we do know for certain is that U.S. oil production cannot possibly continue growing
at the same pace.
With
crude prices now hovering slightly north of $50 per barrel, expecting our tight oil output to
increase by a million barrels per day is foolish.
Not that we haven't enjoyed the fruits of an oil boom, mind you. The EIA recently reported that
the U.S. contributed almost 1.6 million barrels per day to global oil supply growth last year:
Even combined, the competition doesn't come close.
The current low-price environment, however, will be enough to significantly slow growth in the
U.S.
The IEA weighed in on this subject recently, suggesting that U.S. tight oil will eventually pick
up, growing to 5.2 million barrels per day by 2020.
But what's the breaking point for booming states like North Dakota?
The good part is that we have more reliable sources than OPEC when it comes to this question.
According to North Dakota's Department of Mineral Resources, prices need to stay above $55 per
barrel for production to continue growing:
Click Table to Enlarge
That said, keep in mind that the break-even price for new drilling isn't the same throughout the
Bakken. In fact, I mentioned to my readers recently that two-thirds of North Dakota's oil production
takes place in just three counties.
Of course, the break-even prices in these counties are approximately $36/bbl, $30/bbl, and $29/bbl.
Unfortunately, there are much bigger obstacles ahead for oil companies in North Dakota.
North Dakota's Fate: Boom or Bust
Let's be honest, unless we want to increase oil imports from places like Saudi Arabia
and revert back to the days when OPEC was able to manipulate global prices at will, it's in the United
States' best interest to keep developing its tight oil resources.
And while we're being honest, both you and I know full well that the Bakken oil industry won't
crumble.
Perhaps the worst-kept secret in the Williston Basin is the severe lack of infrastructure. Essentially,
there are three options that all Bakken producers have when it comes to transporting their crude
oil: pipeline, rail, or truck. The latter two of these options come at an added cost.
Here's the catch...
Today, producers really only have two options:
rail and truck. Remember, North Dakota only has a pipeline capacity of about 443,000 barrels per
day.
That point was reached as far back as July of 2011!
By 2017, the state will more than double its pipeline and refining capacity over its 2013 levels,
far outpacing the growth in oil-by-rail.
More importantly, these projects won't encounter the same excruciatingly slow delays that TransCanada
is having in getting a green light for its Keystone XL pipeline.
The smart money, however, isn't necessarily in the companies physically
laying pipe all over the state. Rather, the opportunity for you lies in a play that helps these
companies bypass the contentious debate over whether these pipelines are safe.
It's one of the few win-win situations for individual investors, no matter how high or low
crude prices move - and I'll send you my full report on this burgeoning investment this Thursday
morning.
A true insider in the energy markets, Keith is one of
few financial reporters to have visited the Alberta oil sands. His research has helped thousands
of investors capitalize from the rapidly changing face of energy. Keith connects with hundreds of
thousands of readers as the Managing Editor of Energy
& Capital as well as Investment Director of Angel Publishing's
Energy Investor. For years, Keith has been providing
in-depth coverage of the Bakken, the Haynesville Shale, and the Marcellus natural gas formations
- all ahead of the mainstream media. For more on Keith, go to his editor's
page.
"... Weatherford International Plc plans to lay off an additional 6,000 workers, about 15 percent of its workforce, over the first half of this year to cope with the worst crude market downturn in 30 years. ..."
"... The latest round of cuts brings to 20,000 the number of people who have been or will be let go by the world's fourth-largest oilfield services supplier as oil prices tumbled by more than two thirds. ..."
"... The oil industry has slashed more than 250,000 jobs and trimmed more than $100 billion in spending in the last year, with more cuts expected this year. The service providers, who are now embarking on their fourth round of layoffs, were the first to feel the pain and have so far contributed the largest chunk of job cuts. ..."
Weatherford International Plc plans to lay off an additional 6,000 workers, about 15
percent of its workforce, over the first half of this year to cope with the worst crude market
downturn in 30 years.
The latest round of cuts brings to 20,000 the number of people who have been or will be let
go by the world's fourth-largest oilfield services supplier as oil prices tumbled by more than
two thirds.
"We have geared the company, and will increasingly do so, for a prolonged period of very low
activity," Chief Executive Officer Bernard Duroc-Danner said Wednesday in an earnings statement.
"We are ready for as protracted a downcycle as markets will dictate."
The oil industry has slashed more than 250,000 jobs and trimmed more than $100 billion in
spending in the last year, with more cuts expected this year. The service providers, who are now
embarking on their fourth round of layoffs, were the first to feel the pain and have so far
contributed the largest chunk of job cuts.
Schlumberger Ltd., the world's largest oil services provider, said last month it cut another
10,000 jobs in the fourth quarter, while its closest rival Halliburton Co. let go of nearly 4,000
additional workers.
Bigger Loss
Weatherford's fourth-quarter net loss widened to $1.2 billion, or $1.54 a share, from $475
million, or 61 cents, a year earlier, the Baar, Switzerland-based company said. Excluding certain
items, the company posted a 13-cent loss, better than the 19-cent average of 33 analyst estimates
compiled by Bloomberg.
HOUSTON-Home sellers are slashing prices and offering incentives to keep buyers from walking
away from contracts as an 18-month oil slump buffets this city's once-booming housing market.
Do FT honchos know that the USA is importer of natural gas and will stay as such in foreseeable
future due to decimation of shale oil/gas sector. See
http://www.eia.gov/dnav/ng/ng_move_impc_s1_a.htm
Notable quotes:
"... Finally, like Saudi Arabia in oil, Gazprom is one of the lowest-cost gas producers. According to calculations by Mr Henderson at OIES, the cost to Gazprom of delivering its gas to Germany is $3.5 per mmbtu (million British thermal unit) - compared with an estimated $4.3 per mmbtu break-even for US LNG supplies despite US gas prices trading near 16-year lows. ..."
"... Gazprom's contract prices, which are largely tied to oil prices, have kept pace with the spot gas market decline and are likely to fall further in the next six to nine months. ..."
Just as Saudi Arabia is the main swing producer for the global oil market thanks to its ability
to ramp up production if needed, Gazprom is the main holder of spare capacity in the global gas market.
According to Gazprom executives, the company has about 100bn cu m of spare production capacity
- thanks largely to investments made on over-optimistic assumptions about future gas demand - equivalent
to almost a quarter of its production and about 3 per cent of world output.
And just as Saudi Arabia has been unnerved by the prospect of US shale oil
producers eroding its market share, Gazprom faces a similar prospect in the gas market. The flood
of cheap gas unleashed by the
US shale boom has prompted a wave of US LNG projects in recent years. The first cargo of LNG
from the "lower 48" contiguous states of the US is due to be shipped in the next two months, and
the total export capacity under
construction is equivalent to two-thirds of Gazprom's exports to Europe.
Finally, like Saudi Arabia in oil, Gazprom is one of the lowest-cost gas producers. According
to calculations by Mr Henderson at OIES, the cost to Gazprom of delivering its gas to Germany is
$3.5 per mmbtu (million British thermal unit) - compared with an estimated $4.3 per mmbtu break-even
for US LNG supplies despite US gas prices trading near 16-year lows.
Put all those facts together, and it would seem to make sense for the Russian company to push
down prices to keep US LNG out of the market.
"Now the market is getting excited about it; but also the Russians have done their maths and they
know they can win if it happens," says Thierry Bros, European gas analyst at Société Générale in
Paris.
Such a move would be cheaper to implement now because European gas prices have already fallen
dramatically - spot UK gas prices are down 50 per cent in the past two years. Gazprom's contract
prices, which are largely tied to oil prices, have kept pace with the spot gas market decline and
are likely to fall further in the next six to nine months.
Mr Bros estimates it would cost Gazprom $1.3bn in lost revenues to price US LNG out of the market
this year - less than 1 per cent of its historical annual sales.
Gazprom executives have studied the economics of the price war approach and are discussing the
issue, according to people familiar with the company's thinking.
At a
meeting with investors in New York this week, Alexander Medvedev, Gazprom's deputy chief executive,
argued that low spot prices in Europe had already made US LNG supplies uneconomical. "Despite the
prevailing view on the market that North American LNG can change the current pricing model in Europe,
in reality this is not the case at all," he said.
"... Investment in Canada's oil and gas industry is forecast to fall 13 percent this year, making for a total decline of 48 percent less than during 2014. That is a steeper decline than investment in oil and gas production worldwide, which is expected to drop by 40 per cent over 2014-16 as forecast by analyst Wood Mackenzie. Some oil-sands companies are losing money on every barrel they sell, and are looking at ways to cut production. (1/26) ..."
"... The US oil-rig count dipped below 500 for the first time in years. It fell by 12 to 498 in the latest week, according to Baker Hughes Inc., accelerating a recent streak of declines. There are now about 68 percent fewer rigs from a peak of 1,609 in October 2014. According to Baker Hughes, the number of U.S. gas rigs declined in the latest week by 6 to 121. (1/30) ..."
"... Oil markets might be nearing readjustment as the pain for producers becomes overwhelming with some grades selling at below cost and products such as fuel oil fetching almost nothing, one of the biggest oil traders said. Some fuel in the U.S. is currently sold close to zero due to the application of contractual discounts to the benchmark. ..."
"... The value of debt issued by junk-rated US energy companies has plummeted to the lowest level for more than two decades, sending a warning signal about the outlook for the North American oil industry. The average high-yield energy bond has slid to just 56 cents on the dollar, below levels touched during the financial crisis in 2008-09, as investors brace for a wave of bankruptcies. ..."
"... Chevron, the first super-major oil producer to report fourth-quarter results, posted its first loss since 2002 on Friday and said it's bracing for a review of its credit rating. The oil price crash has forced the company to write down the value of its fields. ..."
"... Halliburton reported a $28 million loss for the 4th quarter of 2015, driven largely by steep declines in North American market revenues (down 39%). Total revenue was down 9%. ..."
"... Phillips 66 on Friday reported its profit dropped 43 percent in the final quarter of the year as low commodity prices dragged on the energy giant's results. ..."
Global energy demand will increase 25 percent between 2014 and 2040,
driven by population growth and economic expansion, ExxonMobil forecasts in the 2016 edition of its
annual The Outlook for Energy. At the same time, energy efficiency gains and increased use of renewable
energy sources and lower carbon fuels, such as natural gas, are expected to help reduce by half the
carbon intensity of the global economy. (1/26)
Oil and stock markets have moved in lockstep this year, a rare coupling that highlights fears
about global economic growth. (1/26)
Worldwide offshore rig utilization stood at 57.2 percent on Jan. 21, 2016, which was far below
the 74.2 percent posted a year ago and the 78.5 percent recorded two years earlier. Once a rig is
cold-stacked, bringing it back to work require further investment which may no longer be worth it.
Combine that with an over-supplied market and a broad industry downturn and there may be a lot of
scrapping of jackups during 2016. (1/30)
International Monetary Fund and World Bank officials are heading to Azerbaijan to discuss a possible
$4 billion emergency loan package in what risks becoming the first of a series of bailouts stemming
from the tumbling oil price. Might Brazil, Ecuador and Venezuela be next? (1/28)
Tanker slowdown: The world's biggest oil companies are asking tanker operators to slow down delivery
of crude amid an ever-expanding supply glut on land. Tankers hauling 2 million-barrel cargoes are
delivering them at speeds of about 13 knots, compared with a maximum of 15. The slower speeds might
result in a voyage that would normally take 40 days instead lasting 48. (1/28)
WTI vs. Brent pricing: A change to the North Sea Brent crude oil futures contract will alter the
way prices for Brent futures are compared to futures prices for West Texas Intermediate (WTI) crude
oil. (1/27)
In the United Arab Emirates, the price of the cheapest grade of gasoline is $1.55 a gallon. That
compares with $1.32 a gallon for the lowest regular fuel in Houston, where drivers haven't paid less
on average than Abu Dhabi pump prices since 2008. While low prices for crude oil are cutting gas
costs to US consumers, Saudi Arabia, the U.A.E., Qatar, Oman and Bahrain have reduced or eliminated
fuel subsidies over the past six months, effectively raising their prices. (1/27)
Japan's crude oil imports last year fell to the lowest level since 1988 as demand weakened 2.3
percent over 2014 amid a declining population and more efficient vehicles. (1/27)
CNPC, China's largest energy company, said that in collaboration with Chevron it started commercial
gas production from a field located in the Sichuan basin in southwest China. The Chuandongbei project
has a production capacity of around 345 million cubic feet per day. China's demand for natural gas
is expected to increase from around 6 percent of total energy consumption to more than 10 percent
by the end of the decade. (1/27)
PetroChina, China's biggest oil and gas producer, expects its 2015 profit to have fallen 60 percent
to 70 percent from a year earlier because of the slump in energy prices. (1/29)
African downer: Years of rapid economic growth across sub-Saharan Africa fueled hopes of a prosperous
new era. To many, the world's poorest continent was finally emerging, with economies that were no
longer dependent on the fickle global demand for Africa's raw resources. But as China's economy slows
and its once seemingly insatiable hunger for Africa's commodities wanes, many African economies are
tumbling, quickly. Since the start of this year, the outlook across the continent has grown grimmer,
especially in its two biggest economies, Nigeria and South Africa. (1/26)
Egypt will get about $20 billion in oil products from Saudi Arabia over five years, a government
official said, marking the kingdom's latest display of support for its struggling North African ally.
The deal grants Egypt easy payment terms. (1/25)
Nigeria is set to take back one of Africa's richest oil blocs from oil giants Shell and Eni. Not
only will the two oil giants lose OPL 245, they will also be fined billions of dollars for illegal
activities, including paying bribes to public officials and private citizens in order to secure the
bloc. The controversial oil bloc is estimated to contain about 9 billion barrels of crude. (1/26)
The markets expect Venezuela to default on its debt in the very near future. The country is basically
bankrupt. That's not an easy thing to do when you have among the larger oil reserves in the world,
but Venezuela has managed it. (1/30)
The Mexican government is considering a capitalization of Pemex to bolster its working capital,
but requires that the state oil company come up with a plan to cut costs and maximize profitability
at a time of low oil prices. The government is concerned about Pemex contractors and suppliers who
last year saw their payment times increased from 20 days to 180 days. (1/28)
Investment in Canada's oil and gas industry is forecast to fall 13 percent this year, making for
a total decline of 48 percent less than during 2014. That is a steeper decline than investment in
oil and gas production worldwide, which is expected to drop by 40 per cent over 2014-16 as forecast
by analyst Wood Mackenzie. Some oil-sands companies are losing money on every barrel they sell, and
are looking at ways to cut production. (1/26)
In Canada, two proposed pipeline projects will have to wait longer for a verdict from the government
and will have to submit to carbon-emissions testing to gain approval as part of temporary measures
announced Wednesday. The interim measures, which affect Kinder Morgan's proposed Trans Mountain Pipeline
and TransCanada's Energy East project, come as Ottawa plans broader changes to Canada's environmental-assessment
process. (1/28)
Canada's efforts to curb greenhouse-gas emissions are calling into question oil majors' ability
to tap the world's third-largest oil reserves. (1/25)
Alberta on Friday said it would introduce a new oil-and-gas royalty rate system next year designed
to penalize higher-cost producers. Oil-sands producers will be exempted from the new system and retain
their existing rates. The royalty review keeps the current commodity price-based system, but will
levy rates once the cost of a well has been recouped based on whether it is above or below industry
expense averages. The revised royalty rates, which will be calculated based on industry averages
for drilling costs in Alberta, will apply only to new wells from 2017 onward. (1/30)
The US oil-rig count dipped below 500 for the first time in years. It fell by 12 to 498 in the
latest week, according to Baker Hughes Inc., accelerating a recent streak of declines. There are
now about 68 percent fewer rigs from a peak of 1,609 in October 2014. According to Baker Hughes,
the number of U.S. gas rigs declined in the latest week by 6 to 121. (1/30)
In North Dakota, the number of rigs exploring for oil and natural gas is down roughly 20 percent
from the start of the year. The North Dakota Industrial Commission reports 47 rigs in active service
as of Monday. A state report from mid-January said the drilling rig count was more or less steady
from October through December, but has fallen dramatically this month. There were no major weather
events that would account for a drop in rig activity. (1/26)
TX downer: Though oil production continues to withstand weaker prices, the Texas oil and gas sector
is in decline. Last week, the state-wide rig count fell below 300 for the first time in more than
15 years. Continued deterioration of market conditions likely signals additional industry downsizing
and job loss in the coming months. Crude oil production in Texas last year outpaced the previous
year by 11.5 percent, with each month of the year in 2015 eclipsing the output from the same month
in 2014. Nevertheless, this resilience may be short-lived. (1/28)
Total US petroleum deliveries, a measure of consumer demand, averaged 19.7 million b/d in December,
a 1.1 percent increase over December 2014, according to the American Petroleum Institute. (1/29)
Oil markets might be nearing readjustment as the pain for producers becomes overwhelming with
some grades selling at below cost and products such as fuel oil fetching almost nothing, one of the
biggest oil traders said. Some fuel in the U.S. is currently sold close to zero due to the application
of contractual discounts to the benchmark. (1/27)
The value of debt issued by junk-rated US energy companies has plummeted to the lowest level for
more than two decades, sending a warning signal about the outlook for the North American oil industry.
The average high-yield energy bond has slid to just 56 cents on the dollar, below levels touched
during the financial crisis in 2008-09, as investors brace for a wave of bankruptcies. (1/25)
California imports of crude-by-rail averaged 4,800 b/d in 2015, down 69 percent from a modest
15,700 in 2014. The economics of crude-by-rail are very poor right now. (1/29)
Oklahoma's governor approved $1.38 million in one-time costs to support earthquake research to
be directed by the Oklahoma Corporation Commission and the Oklahoma Geological Survey. A study from
the US Geological Survey found the rate of seismic activity in Oklahoma has increased since 2009
at a faster rate than any other time during the 20th century.
Offshore California: The federal government has agreed to stop approving oil fracking until it
studies whether the practice is safe for the environment, according to legal settlements filed Friday.
(1/30)
... ... ...
Chevron, the first super-major oil producer to report fourth-quarter results, posted its first
loss since 2002 on Friday and said it's bracing for a review of its credit rating. The oil price
crash has forced the company to write down the value of its fields. (1/30)
Halliburton reported a $28 million loss for the 4th quarter of 2015, driven largely by steep declines
in North American market revenues (down 39%). Total revenue was down 9%. (1/26)
Phillips 66 on Friday reported its profit dropped 43 percent in the final quarter of the year
as low commodity prices dragged on the energy giant's results. (1/30)
Bakken shale producer Oasis Petroleum unveiled a rough capital spending plan that would allow
production to drop 5 percent in 2016 while spending 33 percent less than last year. Oasis expects
to produce 46,000-50,000 b/d of oil equivalent this year, down from 50,477 boe/d in 2015. Still,
last year's 50,477 boe/d of output was 11% higher than in 2014. (1/29)
Continental Resources said first quarter production will average around 215,000 barrels of oil
equivalent per day and drop around 13 percent to 185,000 boe in Q4. For the year, Continental said
it had a budget of around $920 million, a 66% reduction from last year. (1/28)
Hess said it took a net loss of $396 million for the fourth quarter against $53 million in income
year-on-year, after announcing that their 2016 exploration budget will be 40 percent below their
2015 spending. (1/28)
More M&A coming: A year-and-a-half on from the start of the worst crude-oil price crash in a generation,
the biggest US and European energy companies have delayed projects and made such deep budget cuts
that they will soon struggle to replace the oil they pump out of the ground with new reserves. In
some cases, it is now cheaper for energy companies to buy one another rather than drill for crude.
Expect more mergers and acquisitions this year. (1/29)
"... Tehran had a big week as President Rouhani stormed around Europe signing
oil contracts and spending Iran's windfall of newly freed up cash by making many
major purchases. In Italy, he signed deals including shipbuilding, steel, and energy
worth some $18 billion. In France, he bought 118 Airbus airliners for $24 billion,
made a $400 million car manufacturing deal with Peugeot, and signed a deal with
Total for 200,000 b/d of Iranian crude. This should help Rouhani in the upcoming
elections as a man who keeps his promises to revive the Iranian economy. ..."
Tehran had a big week as President Rouhani stormed around Europe signing
oil contracts and spending Iran's windfall of newly freed up cash by making
many major purchases. In Italy, he signed deals including shipbuilding, steel,
and energy worth some $18 billion. In France, he bought 118 Airbus airliners
for $24 billion, made a $400 million car manufacturing deal with Peugeot, and
signed a deal with Total for 200,000 b/d of Iranian crude. This should help
Rouhani in the upcoming elections as a man who keeps his promises to revive
the Iranian economy.
Beijing is making a major effort to improve its relations with Tehran. During
the sanctions, China continued to build a new $200 million steel mill for the
Iranians, circumventing the restrictions imposed by the US and Europe. Last
week a freight train set off on the 6,000 mile trip to Tehran from eastern China,
marking the first rail connection between the two countries along the new "silk
road." China is hoping that Iran will become a major gateway for selling its
products into the Middle East and will become a source of oil.
Based on tanker loading schedules, Tehran is due to increase its oil exports
in January and February by 20 percent over last year. Iran's exports look to
be about 1.5 million b/d in January and 1.4 million in February. This compares
with an average of 1.2 million b/d last year. Much of this oil was already stored
on tankers which provided storage for unsold crude during the sanctions. How
much oil was in storage has been debated, but a recent Reuters report puts the
amount at 40 million barrels– mostly condensate which has to be sold quickly
to free up Iran's tankers for regular crude deliveries. Many western shippers
still have concerns about doing business with Tehran as there are still numerous
sanctions in place which could lead to heavy penalties for doing business with
Iranians, especially if the Republican Guard is somehow involved.
"... Looking at the smaller half of companies traded on the NYSE and Nasdaq, more than half of those companies are burning cash fast enough to be out within six months (based on their cash flow in the last two reported quarters). ..."
"... As of the last complete quarter, the largest publicly traded energy companies on the two exchanges - companies like Exxon Mobil and Royal Dutch Shell , and the large Chinese and Brazilian companies - often still have positive cash flows. ..."
"... To be sure, those large integrated companies are widely expected to report slashed revenue and profit figures in the upcoming round of earnings. Chevron posted a loss of 31 cents a share on Friday - its first quarterly loss in more than 13 years - and announced sharp capital spending reductions. At least for the moment, the big companies also have ruled out dividend cuts in the face of oil prices that are hovering near 12-year lows. ..."
"... Large integrated companies may be able to afford that promise, because theyve been able to rely so far on income from their refining operations, which are in a stronger position during periods of oil weakness. Out of 28 oil refiners and distributors in CNBCs analysis, only one was at risk of running short on cash in the next six months ..."
"... Adding to the gloom, Hess and Noble Energy also have announced budget cuts, while earlier this month, Moodys said that 120 energy firms would be reviewed for a downgrade. ..."
"... Of the 25 publicly traded American companies on that list, all but two were in the smaller half of companies. Those include companies like Approach Resources, Matador Resources, Parsley Energy, Jones Energy and Rice Energy. These companies all have less than a years worth of cash based on our calculations from the most recent filings. A downgrade would just make it that much harder for companies to raise cash going forward. ..."
The deep slide in global oil prices may start claiming the scalps of a number of oil companies.
One in 5 energy companies could be out of cash in less than six months, while 1 in 3 will hit
that threshold in less than a year, according to a Big Crunch analysis.
Publicly traded energy companies as a whole may have $284 billion in cash and short-term assets
on their books, but more than 80 percent of that money belongs to the 25 largest companies. Those
entities also tend to still have positive cash flows - even the few that are negative have enough
cash to last at least two years, according to Big Crunch calculations.
Yet the smallest energy companies - the ones whose names are not as well-known as
ExxonMobil ,
BP or
Chevron - are not as lucky. Dozens
of small energy companies had already filed for bankruptcy by December, owing a collective $13 billion,
according to
law firm Haynes and Boone . Many more could join them in the next year, and some
may be scooped up by opportunistic buyers. Expects say that as many as a third of American oil
and gas companies and
half of U.S. shale drillers could disappear into insolvency before oil prices recover.
Looking at the smaller half of companies traded on the NYSE and Nasdaq, more than half of those
companies are burning cash fast enough to be out within six months (based on their cash flow in the
last two reported quarters).
Here's what the overall market looks like, with every energy stock with reported data - blue companies
have positive cash flow and the dark red shade means less than a year of cash at that company's burn
rate.
As of the last complete quarter, the largest publicly traded energy companies
on the two exchanges - companies like Exxon Mobil and
Royal Dutch Shell , and the large
Chinese and Brazilian companies - often still have positive cash flows.
Even the larger companies with negative cash flows in recent quarters like Chevron,
ConocoPhillips and the Italian multinational
oil and gas company Eni often have
large cash stockpiles. At their current loss rates, that money could last anywhere from a few years
to several decades.
To be sure, those large integrated companies are widely expected to
report slashed revenue and profit figures in the upcoming round of earnings. Chevron posted a
loss of 31 cents a share on Friday - its first quarterly loss in more than 13 years - and announced
sharp capital spending reductions. At least for the moment, the big companies also have ruled out
dividend cuts in the face of oil prices that are hovering near 12-year lows.
Large integrated companies may be able to afford that promise, because they've been able to
rely so far on income from their refining operations, which are in a stronger position during
periods of oil weakness. Out of 28 oil refiners and distributors in CNBC's analysis, only one
was at risk of running short on cash in the next six months . Smaller companies, however, may
not be as fortunate.
Here are the same data as in the graphic above, but excluding the 30 largest companies traded
on American exchanges.
Excluding the largest companies makes it clear that the smallest energy companies
are the most at risk. Some companies have already begun to take action in the face of dwindling cash
reserves. With such low or nonexistent margins, companies can continue running through financing
or reduce expenditures until oil recovers.
Continental Resources, North Dakota's second-largest oil producer,
announced this week that it would cut its 2016 budget by 66 percent in an effort to preserve
cash. To be profitable once more, the company said that oil would have to be at $37 a barrel, at
least a few dollars higher than current levels.
Adding to the gloom, Hess and
Noble Energy also have announced budget
cuts, while earlier this month, Moody's said that 120 energy firms would be reviewed for a downgrade.
"Lower oil prices will further weaken cash flows for E&P companies and the upstream portion
of integrated oil and gas companies. This will cause further deterioration in financial ratios,
including deeper negative free cash flow. Most companies are unable to internally fund sustaining
levels of capital spending at current market prices," said Moody's.
Of the 25 publicly traded American companies on that list, all but two were in the smaller half
of companies. Those include companies like Approach Resources, Matador Resources, Parsley Energy,
Jones Energy and Rice Energy. These companies all have less than a year's worth of cash based on
our calculations from the most recent filings. A downgrade would just make it that much harder for
companies to raise cash going forward.
"... The median of 17 oil price forecasts compiled by Bloomberg since January 1st: WTI seen averaging near $46 a barrel in Q4; Brent at about $48 ..."
"... Everything is possible, but the scenario with smooth sailing for the whole year with gradual increases of prices and $39 average for the year looks questionable. This is a typical Wall Street extrapolation (or statistical porno, if you wish). I doubt that in such an unstable system prices will behave so smoothly. Please remember that most future developments require price above $60. ..."
"... A death sentence for a large number remaining the USA shale players. With those prices they simply might not last till 2017. Looking at the smaller half of companies traded on the NYSE and Nasdaq, more than half of those companies are burning cash fast enough to be out within six months (based on their cash flow in the last two reported quarters). ..."
"... Well, there was a lot of money to be made by not listening to these same analysts when they made their forecasts at the beginning of 2014. But as John Maynard Keynes said, markets can stay irrational longer than you can stay solvent. ..."
"... I agree that the oil price curve for the rest of 2016 will not be smooth. But analysts are not trying to forecast the trajectory of daily oil prices. They are forecasting quarterly average prices. And the trend in quarterly average prices may be similar to their projections. See, for example, how oil prices were recovering in 2009. ..."
"... When the Haynesville first started opening up gas prices were high and everyone was looking for the next big field, and this was all fueled by the industry being flooded with cheap credit. Improving oilfield technology (deviated drilling and HP/HT capable equipment) allowed the Haynesville to potentially be that big field. Everybody jumped in but then gas prices collapsed, the first wells completed were showing steeper than expected declines, and well drilling/completion costs remained more than double that of wells in other fields. This caused a mass exodus as companies moved rigs and equipment to more profitable fields. The remaining rigs were drilling wells primarily to maintain mineral rights, not to service debt. ..."
"... So what's my point? The prolonged low gas prices only served to keep rigs drilling in the most profitable (or least unprofitable) fields. ..."
I like the way Wall Street stooges like Bloomberg are thinking about this problem. They think
about themselves as "masters of the universe" and everybody else need to serve them and enrich
them. I hope this will not happen despite all their games with oil futures as in:
"While prices continue to fluctuate, buy the December 2016 WTI contract below $40 a barrel
because prices are forecast to average $48 by the end of the year, according to Mark Keenan,
the head of commodities research for Asia at Societe Generale in Singapore. There may be "meaningful
signs" of shale production balancing in the second half, Keenan predicts.
Everything is possible, but the scenario with smooth sailing for the whole year with gradual
increases of prices and $39 average for the year looks questionable. This is a typical Wall Street
extrapolation (or statistical porno, if you wish). I doubt that in such an unstable system prices
will behave so smoothly. Please remember that most future developments require price above $60.
Let's translate into common language what they predict in this graph (the article itself is
more positive then the graph and to a certain extent contradict it):
1. A death sentence for a large number remaining the USA shale players. With those prices
they simply might not last till 2017. Looking at the smaller half of companies traded on the NYSE
and Nasdaq, more than half of those companies are burning cash fast enough to be out within six
months (based on their cash flow in the last two reported quarters).
2. All deep water developments will also lose money this year and the exploration activity
might grind to a halt as discrepancy between the current price and the price of production is
too extreme. That spells troubles for future GOM production.
3. Carnage in Canadian oil sands.
4. Stripper wells production will be decimated.
5. Several oil producing countries with higher costs or large budget deficit in 2015 will be
on the wedge of bankruptcy at the end of the year.
6. KSA will lose another hundred billions and might lose its current credit rating.
7. Troubles in oil junk bond area possibly spilling into regional banks.
8. Losses of investors might well black mark this area of investment for the next three years.
Energy funds and ETFs shrink as "naïve" investors simply flee.
11) Brazil economy collapses completely, coupled with continuing drought or El Nino induced
flooding and general ill feeling about Olympics costs and PetroBras corruption leads to widespread
social unrest.
12) At least 30 to 40% of oil industry experienced workers lost and not available to pick up
development if prices ever do recover.
13) Grants from Sunni nations to Egypt are reduced leading to increased Isis gains and further
unrest.
Well, there was a lot of money to be made by not listening to these same analysts when they
made their forecasts at the beginning of 2014. But as John Maynard Keynes said, markets can stay
irrational longer than you can stay solvent.
I agree that the oil price curve for the rest of 2016 will not be smooth. But analysts
are not trying to forecast the trajectory of daily oil prices. They are forecasting quarterly
average prices. And the trend in quarterly average prices may be similar to their projections.
See, for example, how oil prices were recovering in 2009.
Daily and quarterly average Brent oil prices in 2009
Nick, 02/03/2016 at 3:59 pm
There are a few flawed assumptions in all of this. I was an engineer on the ground in the Haynesville
in 08/09/10 and I think I can paint a more accurate picture of the dynamics at play.
When the Haynesville first started opening up gas prices were high and everyone was looking
for the next big field, and this was all fueled by the industry being flooded with cheap credit.
Improving oilfield technology (deviated drilling and HP/HT capable equipment) allowed the Haynesville
to potentially be that big field. Everybody jumped in but then gas prices collapsed, the first
wells completed were showing steeper than expected declines, and well drilling/completion costs
remained more than double that of wells in other fields. This caused a mass exodus as companies
moved rigs and equipment to more profitable fields. The remaining rigs were drilling wells primarily
to maintain mineral rights, not to service debt.
So what's my point? The prolonged low gas prices only served to keep rigs drilling in the
most profitable (or least unprofitable) fields. These are not the only fields available,
the Haynesville could see that peak production matched with the same rig activity as before.
When gas prices rise again with the falling production, the rigs will be reactivated and production
will come back. Hopefully this time around though companies will use more capital and less debt
to finance all of this, and will be more cautious about increasing production.
"... "We'll see higher oil prices" with "supply and demand tightening in the second half of the year," Bob Dudley, chief executive officer of BP Plc, said in a Bloomberg Television interview Tuesday. ..."
"... While prices continue to fluctuate, buy the December 2016 WTI contract below $40 a barrel because prices are forecast to average $48 by the end of the year, according to Mark Keenan, the head of commodities research for Asia at Societe Generale in Singapore. There may be "meaningful signs" of shale production balancing in the second half, Keenan predicts. ..."
"... "The combination of continued demand growth and falling U.S. production will eventually help create a floor in the market from where it will be able to rally back towards the $40 to $50 range by year-end," Ole Hansen, head of commodity strategy at Saxo Bank A/S, said by e-mail. ..."
"We'll see higher oil prices" with "supply and demand tightening in the second half
of the year," Bob Dudley, chief executive officer of BP Plc, said in a Bloomberg Television
interview Tuesday. The market will remain "tough and choppy" in the first half as
it contends with a surplus of 1 million barrels a day, he said.
A worldwide oversupply contributed to a 30 percent slump in WTI and 35 percent
decline in Brent last year. U.S. crude supplies have swelled to a record and the Organization
of Petroleum Exporting Countries have effectively abandoned output targets as they
seek to defend market share.
"We need to see supply giving up and I think that all falls to the U.S.," Dominic
Schnider, the head of commodities and Asia-Pacific foreign exchange at UBS's wealth-management
unit in Hong Kong, said Friday in a Bloomberg Television interview. Schnider at the
beginning of this year correctly
predicted Brent would drop near $30 a barrel. "We're still oversupplied."
Ratings Cut
Natixis SA lowered its forecasts for 2016 and 2017 over concerns that Iran will
boost exports after sanctions were lifted and on the possibility a more stable Libyan
government will increase production. The Paris-based bank projects WTI will average
$38 a barrel in the fourth-quarter, the lowest of 17 estimates compiled by Bloomberg.
And while the IEA sees supply outside OPEC sliding, it warned last month that "the
oil market could
drown in oversupply."
The price slump prompted Exxon Mobil Corp. to cut its
drilling budget to the lowest in 10 years, while Standard & Poor's reduced Chevron
Corp.'s credit rating for the first time in almost three decades. The agency also
cut Royal Dutch Shell Plc's debt rating to the lowest since S&P began coverage in
1990.
There are signs supply and demand will start to come back into
balance this year, OPEC Secretary-General Abdalla El-Badri said Jan. 25 at a conference
in London. Global demand is forecast to increase by about 1.3 million barrels a day,
while supply from outside the producer group is expected to contract by about 660,000
a day, he said.
... ... ...
While prices continue to fluctuate, buy the December 2016 WTI contract below $40 a barrel
because prices are forecast to average $48 by the end of the year, according to Mark Keenan, the
head of commodities research for Asia at Societe Generale in Singapore. There may be "meaningful
signs" of shale production balancing in the second half, Keenan predicts.
"The combination of continued demand growth and falling U.S. production will eventually help
create a floor in the market from where it will be able to rally back towards the $40 to $50 range
by year-end," Ole Hansen, head of commodity strategy at Saxo Bank A/S, said by e-mail.
"... it appears to me that the increase in take away capacity and adequate demand, is what was required in the NE to increase production. ..."
"... Yesterday's Northeast production estimate was revised up from 22.29 Bcf/d to 22.83 Bcf/d, making February 1 the new all-time high, surpassing the previous all-time high of 22.55 set just this past weekend. ..."
Not sure how this fits in to the theme of the guest post, but it appears to
me that the increase in take away capacity and adequate demand, is what was
required in the NE to increase production.
Yesterday's Northeast production estimate was revised up from 22.29
Bcf/d to 22.83 Bcf/d, making February 1 the new all-time high, surpassing
the previous all-time high of 22.55 set just this past weekend. This was
driven by an increase to yesterday's Appalachian-Ohio figure of 0.25 Bcf/d
and a 0.18 Bcf/d increase in the PA Northeast Dry.
This helped drive a 1.3 Bcf/d upward revision to yesterday's dry US production, bringing it to 73
Bcf/d, the highest it has been all year.
Production fell 0.4 Bcf/d today
with the Northeast and Texas accounting for the majority of this. US Demand
increased by 2.9 Bcf/d, with ResComm accounting for about 2.4 Bcf/d of this
driven by a 1 Bcf/d increase in the Southwest. Total powerburn climbed to
23.3 Bcf/d, as increases of 0.3 Bcf/d and 0.2 Bcf/d in the Southwest and
Southeast, respectively, offset modest declines in Texas, the Northeast, and
the Midcon Market.
Half of oil production from future developments is uneconomic at US$60/bbl Brent. These comprise
of conventional projects which have yet to receive final investment decision (pre-FID) and future
drilling in US onshore Lower 48 plays; which are critical for future oil supply.
By 2025, production from pre-FID projects and US Lower 48 future drilling could be nearly 15 million
b/d. Only 7.6 million b/d comes from projects which achieve commerciality at US$60/bbl, a likely
screening criteria.
Production from most future developments is required to fill the supply gap between declining
commercial fields and projected growth in demand.
Under our Macro Oils supply-demand outlook over 22 million b/d is needed from new developments
by 2025 to meet demand. We expect the pre-FID pipeline to contribute around half of this. However,
the number of deferred pre-FID projects is growing as the oil price remains low. Without significant
structural cost deflation, the majority of these projects, are at risk of further delay or a major
overhaul of development plans.
Prices need to support the development of the next tranche of supply. This breakeven analysis
provides support for an oil price floor in the longer term of above US$70/bbl.
Deepwater and ultra-deepwater projects sit high on the cost curve and are at greatest risk of
delay. Production from Angola, Nigeria, US Gulf of Mexico and Brazil is at risk due to weak project
economics. Over 80%, or around 16 billion barrels, of deepwater and ultra-deepwater reserves are
uneconomic at $60/bbl.
The economics are relatively robust within onshore, tight oil and shallow water projects. In fact
US Lower 48 is now the key low cost area and by 2025 contributes 70% of volumes produced under
$60/bbl.
Total global liquids supply in 2040: 136 mb/d,
or 133 mb/d excluding refinery processing gains.
or 129 mb/d ex. proc. gains and biofuels.
Note, that AEO 2015 was issued in early 2015 and apparently prepared in late 2014, when oil
prices were significantly higher.
The AEO 2015 projects Brent price at $71 in 2016 gradually rising to $141 (in $2013) by 2040.
I expect AEO 2016 global liquids supply projections to be lower than last year's issue.
Total global liquids supply in 2040: 121.7 mb/d,
or 118,8 mb/d excluding refinery processing gains.
or 114.5 mb/d ex. proc. gains and biofuels.
Note, that AEO 2015 was issued in early 2015 and apparently prepared in late 2014, when oil
prices were significantly higher.
The AEO 2015 projects Brent price at $71 in 2016 gradually rising to $141 (in $2013) by 2040.
I expect AEO 2016 global liquids supply projections to be lower than in last year's issue.
If they showed a chart with declining production would anyone use their services anymore?
Maybe that is why they are so "optimistic".
The "Yet to be found" and "Yet to be developed" looks suspicious since it is exactly the amount
needed to keep us on the same level as today for conventional production.
How can they predict we will find more oil 2040 than in 2025? Sounds fishy.
Sorry, I thought that was a WoodMac chart not an IEA chart.
Shows what I know.
Having worked for some consulting companies (not in oil), sales and billable hours trumps everything
(except anything that risks legal claims against the owners /partners personal assets).
Otherwise you will go out of business and not exist.
If WoodMac is predicting a better scenario than that chart Alex posted, it is sales commissions
and/or billable consultants.
Anyway…I should probably let the smart guys discuss…lol
Enhanced recovery don't seem to get much credit here.
Notice that the IEA don't have us reaching 80 mbd, C+C, until 2030, a point that the EIA says
we are at today. They, the IEA, has us at about 75 million barrels per day today. My guess is
that is about right.
The IEA has conventional oil + tight oil+oil sands + GTL and CTL at ~75 mb/d and NGLs at @
15 mb/d in 2014
Total (ex. biofuels and processing gains) ~ 90 mb
The EIA has conventional oil + tight oil+oil sands + GTL and CTL at ~79.4 mb/d and NGLs at
@ 9.5 mb/d in 2014
Total (ex. biofuels and processing gains) ~ 89 mb
The IEA has included all OPEC NGLs and condensate in global NGLs number.
The EIA apparently classifies large part of OPEC NGLs and condensate as condensate (part of global
conventional C+C).
(Total OPEC NGLs and condensate production in 2014 was 6.36mb/d)
Thanks for the clarification. Looks like about 4-5 Mb/d of condensate is produced in the World.
As long as this can be easily blended into liquid fuels (such as gasoline) at refineries, it makes
sense to call it "oil" as there is a wide range of stuff we are willing to call oil (such as bitumen).
We have been counting crude plus condensate for a long time, excluding C2, C3, and C4 makes
sense to me, but excluding C5 does not. Just one person's opinion.
the IEA is including only OPEC crude in global C+C numbers both in the monthly reports (OMR)
and WEO.
NGLs and total OPEC condensate is classified as NGLs.
For other countries, the IEA includes condensate in C+C.
The EIA somehow separates "OPEC NGLs" into NGLs and lease condensate. The later is included
in global C+C numbers.
The EIA puts US Lower 48 C+C production in excess of 45 API Gravity at about 2 million bpd in
2015 (so total US 45+ in 2015, inclusive of Alaska, was presumably a little in excess of 2 million
bpd), and OPEC 12 Implied Condensate* was 2.5 million bpd in 2014.
The US and OPEC 12 combined accounted for 53% of global C+C production in 2014.
In any case, as I have previously said, the issue of crude versus condensate quality is something
of a red herring.
My point is and has been is that the data strongly suggest that actual global crude oil production
(45 API Gravity and lower) has been on an undulating plateau since 2005, while global gas and
associated liquids, condensate and NGL, have so far continued to increase.
*EIA OPEC 12 C+C less OPEC 12 Crude Only, subject of course to usual caveats about data quality
Given that for the past five years oil discoveries have been getting steadily less (and I think
this year so far there may not have been any really new ones – only a some gas and one oil confirmation
find) and that reservoir growth has mostly been associated with large, conventional fields, of
which there are no more, the "yet to find" wedges in all these charts might be a bit optimistic.
Why does the "yet to be developed" wedge expand continuously? This implies that discoveries
we know about would be bought on line over the next 25 years and more and be able to compensate
for decline in previous (new) developments plus add more capacity (i.e. they'd be growing in development
size over time). It should surely look like a bulge with a taper to zero over time.
Presumably the NGL, oil sands and tight oil sections have their own components of development
required, maybe a larger proportion than for the conventional oil as well. There's a lot of development
money needs to be spent to fill the gaps, and pretty much from a standing start where we are at
the moment.
Why does the "yet to be developed" wedge expand continuously?
George, that is mostly OPEC "proven" but undeveloped reserves that the IEA assumes will be
brought on line as needed.
OPEC claims 1.2 trillion barrels of reserves. And about two thirds of that is "yet to be developed".
And it will forever remain "yet to be developed" because it does not exist.
I disagree with the 2 out of 3 barrels missing and the 400 Gb OPEC reserve estimate.
Jean Laherrere estimates OPEC 2P reserves in 2010 at about 500 Gb for C+C less extra heavy
(which leaves out Orinoco belt reserves in Venezuela) and that is a very conservative estimate.
Most astute observers realize the Orinoco reserves are overstated and indeed for these 220
Gb of claimed reserves, the 2 of 3 missing barrels may be apt.
For the C+C less extra heavy OPEC reserves in 2010, BP has 940 Gb. Based on Jean Laherrere's
estimate it would be roughly 1 out of 2 barrels are missing.
I agree OPEC overstates its reserves. I think that the 1 of 3 barrels is real graphic (which
is cute) overstates the "missing barrels" case.
I disagree with the 2 out of 3 barrels missing and the 400 Gb OPEC reserve estimate.
I don't. I think 400 Gb is likely an overestimate. That is, if
OPEC's estimate
of Non-OPEC reserves of 286.9 billion barrels is anywhere close to being correct. Not counting
bitumen or oil sands, OPEC does not have more reserves than Non-OPEC.
Every country in the world produces every barrel they possibly can. And the more oil they have
to produce the more oil they do produce…. on average that is. According to the EIA, Non-OPEC
produces 58% of the world' C+C and OPEC produces 42%. To assume that OPEC has three times the
proven reserves as Non-OPEC is truly absurd. How can anyone believe such shit?
Ron – that makes sense, thanks. If I was country or region with 800 billion barrels of undeveloped
reserves that's what I'd be talking up. I wouldn't be promoting tight gas and renewables to free
up oil for export; or pre-salt, deep sea exploration to find new reserves (which is what Saudi
and Kuwait have been doing), and we wouldn't be seeing , what looks like, peaks for most of the
OPEC members developing (if you assume a peak is at about 50% depletion they shouldn't be peaking
for a good few years yet if there are another 1.2 trillion barrels available).
For oil remaining now I think I'd go with Sadad al-Husseini from a few years ago (2010) who
indicated there are maybe only 1.2 to 1.5 trillion barrels left (found and unfound). Since then
we've produced about 150 billion and maybe 100 to 200 billion might not be there or can't be developed
(in Arctic and Deep Sea). So we may have only 850 to 1150 billion left now, which would put us
well past 50% URR (although maybe condensate and NGL may be higher and compensate somewhat).
"... If the 2016 OPEC basket oil price does average around $35/bbl it will be about $15/bbl lower than the $49.49/bbl average basket price in 2015, meaning that OPEC will lose yet another $130 billion in annual oil revenues if it maintains production at current levels. ..."
If the 2016 OPEC basket oil price does average around $35/bbl it will be about $15/bbl lower
than the $49.49/bbl average basket price in 2015, meaning that OPEC will lose yet another $130 billion
in annual oil revenues if it maintains production at current levels.
Can OPEC survive another hit like this? Well, those waiting for a prediction are going to
be disappointed because I'm not going to make one.
There are just too many unknowns. We'll just have to wait and see.
"... Were going on 2 yrs since the price decline began, what . . . about 20 months ago? Just how
long is that long run were supposed to be waiting for to see sharp production decline? ..."
MOSCOW, Feb 2 (Reuters) – Oil production in Russia hit a post-Soviet high in January, reaching
an average of 10.88 million barrels per day (bpd), preliminary data released by the Energy Ministry
showed on Tuesday.
------------
My comment:
At 7.3 barrels / ton ratio, production in January was 10,834 kb/d vs. 10,76o kb/d (revised) in
December 2015 and 10,613 in January 2015 (year-on-year increase of 2.1%)
Russian crude and condensate production (mb/d)
source: Russian Energy Ministry
Two new mid-sized fields came onstream, one in December and one in January
Several new field start-ups are expected for 2016, including a relatively large Filanovskogo project
in Northern Caspian.
The numbers in tons (as stated in Ministry's report and in b/d)
(sorry, the last column is January 2016)
People are going to have to wrap their minds around reality. Production doesn't have to fall
because of price - especially in locales with total government control.
We're going on 2 yrs since the price decline began, what . . . about 20 months ago? Just
how long is that long run we're supposed to be waiting for to see sharp production decline?
Estimates of decline are varied from none to 0.5Mb/d, but when it can start and how sharp it
will be is anybody guess.
I think it will not be sharp as Russian producers are partially isolated from oil price slump
by the currency depreciation and long term contracts that they typically use.
== quote ==
The economics of Russian production provide a glimpse of how painful current prices are. According
to ESAI Energy's analysis in the accompanying chart, when the Urals price is $30 per barrel,
a producer's net revenue after paying the crude export duty and Mineral Extraction tax is $17.
But since their costs are paid in rubles, the value of which has plummeted, lifting costs and
pipeline transport from West Siberia are roughly $8 per barrel.
These numbers indicate Russian producers can withstand prices as low as even $20 per barrel
without them having a significant impact on production in 2016. That said, oil companies like
Lukoil and Rosneft, which together account for 5.5 million b/d of Russian production, might
participate in production limits were the Putin regime to pursue them.
"... The changes can be very big. Look at the line that comes to a halt in April 2015, these are the numbers from the May 2015 Short Term Energy Outlook, those estimates were about 340,000 bbls per day less than what the EIA now think. About as much as people are estimating Iran might be able to add to the market and which is now causing fear and trepidation amongst oil bulls. On that point I am a tad sceptical , not having been born under a gooseberry tree. ..."
"... But on the 27th January the EIA published a revision to the numbers (which will be used in the February 2016 STEO) which bucked that trend and started to revise the past downwards. That is the dark blue line on the chart, which tracks the pale blue line for most of the year but includes a 140,000 bbls per day reduction in the estimate of November 2015 production. ..."
"... We can be confident of one thing the revisions to the past aren't finished, and given the dramatic fall in the oil price from November to January, and the drastic cuts in US operators budgets for 2016 it seems to me that US production will soon decline below 9 million barrels per day, my estimate is that that threshold will be crossed in February and that the US will exit 2016 producing about 8.4 mmbbls/day. ..."
The changes can be very big. Look at the
line that comes to a halt in April 2015, these are the numbers from the May 2015 Short Term
Energy Outlook, those estimates were about 340,000 bbls per day less than what the EIA now think.
About as much as people are estimating Iran might be able to add to the market and which is now
causing fear and trepidation amongst oil bulls. On that point I am a
tad sceptical, not having been born under a gooseberry tree.
The same then happened on the way down. As the oil price collapsed and rigs were stacked, it
seemed in September that the decline was well established and that the US would soon be producing
less than 9 million barrels per day. I confidently tweeted that projection, but I was dead wrong.
Month after month the previous estimates were raised and the impending collapse was deferred.
This continued right up to the last estimate of historic monthly production, published at the end
of December, and used in the January 2016 Short Term Energy Outlook, the pale blue line on the
graph. At that time, virtually the whole of 2015 was revised upwards by nearly 100,000 bbls per
day.
But on the 27th January the EIA published a
revision to the numbers
(which will be used in the February 2016 STEO) which bucked that trend and started to revise the
past downwards. That is the dark blue line on the chart, which tracks the pale blue line for most
of the year but includes a 140,000 bbls per day reduction in the estimate of November 2015
production.
We can be confident of one thing the revisions to the past aren't finished, and given the
dramatic fall in the oil price from November to January, and the drastic cuts in US operators
budgets for 2016 it seems to me that US production will soon decline below 9 million barrels per
day,
my
estimate is that that threshold will be crossed in February and that the US will exit 2016
producing about 8.4 mmbbls/day.
But take that all with a pinch of salt. It is hard enough estimating the past let alone,
predicting the future.
"... The decline and legacy rates are huge for shale. According to the latest drilling report, the monthly legacy rate for all shale plays has reached nearly 400 000 b/d and month, which is annualized over 4 mill b/d of decline. Add the legacy rate for shale natural gas, which is nearly 20 bcf/d and year. ..."
"... At peak levels in 2014 total North American E P spending was about $200bn, but this included Canada and US conventional ..."
"... If we look at the increases in yearly average output in 2014 and 2015, it was 1250 kb/d vs 730 kb/d. So decreased investment of $70 B, reduced the production gain by about 520 kb/d. ..."
"... In any case, somewhere between 96B and 132B is enough to get flat output in the US (replacing about 500 kb/d of decline at a 6% annual rate or 920 kb/d if we assume a 10% annual decline rate). ..."
"... Under most plausible oil price scenarios, 2018 US production may be flat or only slightly above 2017, and growth in 2019 will still be moderate. I now think that 2015 record level of (9.7 mb/d in April) may not be reached even in 2020. However, with higher prices, peak levels could be achieved in the next decade. ..."
"... I think the average US C+C output levels will be about 400 kb/d less in 2016 compared to average 2015 output levels. ..."
"... For the Bakken/Three Forks the legacy decline in Nov 2015 was 4 kb/d and if the rate that new wells are added remains at the Nov 2015 level the legacy decline rate falls to an average rate of 3 kb/d for Dec 2015 to Nov 2016, output only falls by 140 kb/d in this scenario. ..."
"... If no new wells are added over the next 12 months output in the North Dakota Bakken/Three Forks only falls by 350 kb/d. That scenario is not very likely. ..."
"... If 39 new wells per month (half as many as Nov 2015) are added each month for the next 12 months (somewhat plausible at low oil prices), ND Bakken/Three Forks output falls by 250 kb/d. ..."
"... The Eagle Ford will fall a little more maybe 350 kb/d, the Permian is likely to be flat, the rest of the US LTO might fall by 200 kb/d at most, so about 800 kb/d decline is about all we will see for LTO decline over the next 12 months. ..."
"... GOM output has been increasing lately so overall US C+C decline might be 700 kb/d from Dec 2015 to Nov 2016 (next 12 months of data). ..."
The decline and legacy rates are huge for shale. According to the latest drilling report, the
monthly legacy rate for all shale plays has reached nearly 400 000 b/d and month, which is annualized
over 4 mill b/d of decline. Add the legacy rate for shale natural gas, which is nearly 20 bcf/d
and year.
Together with conventional oil and gas, the US oil and gas industry has to replace every year
close to 10 mill boe/d which is 50% of capacity of oil and gas production.
And the situation gets worse every year. The decline rate for worldwide conventional oil production
is just 6%.
The cost for 1 mill b/d (either buying from the shelf or building from scratch) stands around
USD 50 bn. So the US oil and gas industry has to invest every year USD 500 bn for keeping production
stable – and gets just 250 bn revenue for this investment.
This is a financing gap of USD 250 bn every year. As the total high yield bond market adds
up to USD 1500 bn, the oil industry taps 17% of the high yield bond market.
I think this explains the high the leverage in the oil and gas market. The cost for keeping
the USD stable is now astronomical. Something has to give here. Either the dollar or the bond
market collapses or 3mill b/d come out of the market immediately.
If we look at the increases in yearly average output in 2014 and 2015, it was 1250 kb/d
vs 730 kb/d. So decreased investment of $70 B, reduced the production gain by about 520 kb/d.
The decreased investment of $45B less in 2016 vs 2015.would be expected to reduce the production
gain by 330 kb/d, so we could potentially see an increase in output of 400 kb/d (2016 average
output vs 2015 average output) if the investment spending estimates are correct and the previous
trend holds.
This simple linear model is not likely to be correct because if we assume zero investment spending
in 2016, the result is flat output, which is highly unlikely.
I would expect output will be flat at best with 96 billion investment and oil is likely to
be down by 500 to 700 kb/d.
In inherent problem with the way I have done this is investment in natural gas production has
been ignored. We don't have enough detail here to know how the investment was divided between
natural gas and oil, though we could divide it up based on gross revenue or some other metric.
In any case, somewhere between 96B and 132B is enough to get flat output in the US (replacing
about 500 kb/d of decline at a 6% annual rate or 920 kb/d if we assume a 10% annual decline rate).
1) It is important to note, that today's upstream capex will affect output levels about 6 months
from now. So high capex in 2014 resulted in relatively high production levels in 1H15.
But lower capex in 2015 will affect production in 2016, and even lower capex in 2016 will negatively
affect production in 2017.
2) Annual average growth in 2015 vs. 2014 reflects strong monthly growth in 2014.
Monthly output was declining since April 2015 and will continue to decline in 2016 and probably
for most of 2017. Furthermore, decline rates are likely to accelerate this year and may only moderate
in 2017.
The EIA expects annual average US C+C production in 2016 to be 0.7 mb/d lower than in 2015,
including a 0.8 mb/d y-o-y decline in Lower 48 onshore output.
They are projecting annual average decline of 270 kb/d for US C+C in 2017, including 380 kb/d
in Lower 48 onshore.
Even "shale optimists" like Goldman Sachs and Citi expect a decline of ~0.5 mb/d in 2016 (I do
not know their longer-term projections).
Under most plausible oil price scenarios, 2018 US production may be flat or only slightly
above 2017, and growth in 2019 will still be moderate. I now think that 2015 record level of (9.7
mb/d in April) may not be reached even in 2020. However, with higher prices, peak levels could
be achieved in the next decade.
I think the EIA may be too pessimistic. The annual decline rate trend for March to Nov 2015
is about 500 kb/d. (See chart). I think there will be some oil price rise by mid year (maybe to
$45/b) and that the decline rate will moderate towards the end of 2016 as oil prices rise further
(to over $60/b by Dec 2016). I think the average US C+C output levels will be about 400 kb/d
less in 2016 compared to average 2015 output levels.
See chart for trend (note the assumption of a linear trend which is likely to overstate the
decline).
This was 2014 when legacy declines were much lower (around 20%). I am talking about 2016, which
includes also the rest of this year (total legacy rate 50%). In addition shale represents close
to two thirds of the oil and gas market in 2016. This share has been much lower in 2014.
If the US oil and gas industry does not spend as much, production will decline accordingly.
I cannot emphasize enough how much shale has changed the dynamics of the oil market. It is important
to recognize the change in the markets and not rely on past numbers.
The Bakken and Eagle Ford Models do not rely on past numbers except as a check on the model
(the Bakken Model has actually been lower than actual output, the Eagle Ford has been a little
closer, but also on the low side).
Now I take a model which has matched actual output fairly well over time and assume well profiles
remain the same as the past two years and that the new wells are added at half the rate of recent
months (39 new wells per month rather than 78 new wells), a similar exercise is done for the Eagle
Ford.
Enno Peters work confirms what I have found for the Bakken (which is based on data gathered
from the NDIC by Enno Peters.)
What you consistently fail to realize is that the EIA's DPR gives a very bad estimate of legacy
decline.
As fewer new wells are added the legacy decline gets smaller.
Think about it a moment, if 200 new wells per month are added, the legacy decline is high and
if 50 new wells per month are added the legacy decline will be lower (by roughly a factor of 4),
surely you can see this.
In the Bakken about 170 new wells per month were being added each month during 2012 to 2014,
lately only about 77 new wells have been added, so legacy decline will be smaller.
Bottom line, the DPR has Bakken legacy decline increasing and that is not correct, it will
decrease until the rate that new wells are added each month starts to increase.
The EIA's estimate for legacy decline in the Bakken and Eagle Ford are incorrect.
For the Bakken/Three Forks the legacy decline in Nov 2015 was 4 kb/d and if the rate that
new wells are added remains at the Nov 2015 level the legacy decline rate falls to an average
rate of 3 kb/d for Dec 2015 to Nov 2016, output only falls by 140 kb/d in this scenario.
If no new wells are added over the next 12 months output in the North Dakota Bakken/Three
Forks only falls by 350 kb/d. That scenario is not very likely.
If 39 new wells per month (half as many as Nov 2015) are added each month for the next
12 months (somewhat plausible at low oil prices), ND Bakken/Three Forks output falls by 250 kb/d.
The Eagle Ford will fall a little more maybe 350 kb/d, the Permian is likely to be flat,
the rest of the US LTO might fall by 200 kb/d at most, so about 800 kb/d decline is about all
we will see for LTO decline over the next 12 months.
GOM output has been increasing lately so overall US C+C decline might be 700 kb/d from
Dec 2015 to Nov 2016 (next 12 months of data).
As I have said before, your method for coming up with a 4 million barrel per day decline in
US output hits very wide of the mark, you are off by almost a factor of 6. Use the EIA's DPR at
your peril if you are an investor.
Foreign Minister Sergey Lavrov told reporters in the United Arab Emirates on Tuesday that
Moscow is "open for other forms of cooperation, if there is general interest in holding a meeting
between OPEC members and producer countries."
Heinrich Leopold considerations are very interesting but probably wrong. As Dennis Coyne pointed
out shale/ight oil production in the USA is very resilient due to huge amount of wells drilled.
Notable quotes:
"... However, after an initial phase of economic weakness, lower US production will drive the USD down and increase worldwide economic activity again. The question remains how far the USD will fall and as a consequence volatility will rise. So, shale production does not mean the end of the world, yet increased volatility and the challenge how to control it. ..."
"... Together with conventional oil and gas, the US oil and gas industry has to replace every year close to 10 mill boe/d which is 50% of capacity of oil and gas production. And the situation gets worse every year. The decline rate for worldwide conventional oil production is just 6%. ..."
"... In any case, somewhere between 96B and 132B is enough to get flat output in the US (replacing about 500 kb/d of decline at a 6% annual rate or 920 kb/d if we assume a 10% annual decline rate). ..."
"... But lower capex in 2015 will affect production in 2016, and even lower capex in 2016 will negatively affect production in 2017. ..."
"... The EIA expects annual average US C+C production in 2016 to be 0.7 mb/d lower than in 2015, including a 0.8 mb/d y-o-y decline in Lower 48 onshore output. They are projecting annual average decline of 270 kb/d for US C+C in 2017, including 380 kb/d in Lower 48 onshore. Even shale optimists like Goldman Sachs and Citi expect a decline of ~0.5 mb/d in 2016 (I do not know their longer-term projections). ..."
"... Under most plausible oil price scenarios, 2018 US production may be flat or only slightly above 2017, and growth in 2019 will still be moderate. I now think that 2015 record level of (9.7 mb/d in April) may not be reached even in 2020. However, with higher prices, peak levels could be achieved in the next decade. ..."
"... I think the EIA may be too pessimistic. The annual decline rate trend for March to Nov 2015 is about 500 kb/d. (See chart). I think there will be some oil price rise by mid year (maybe to $45/b) and that the decline rate will moderate towards the end of 2016 as oil prices rise further (to over $60/b by Dec 2016). I think the average US C+C output levels will be about 400 kb/d less in 2016 compared to average 2015 output levels. ..."
"... If no new wells are added over the next 12 months output in the North Dakota Bakken/Three Forks only falls by 350 kb/d. That scenario is not very likely. ..."
"... If 39 new wells per month (half as many as Nov 2015) are added each month for the next 12 months (somewhat plausible at low oil prices), ND Bakken/Three Forks output falls by 250 kb/d. ..."
"... The Eagle Ford will fall a little more maybe 350 kb/d, the Permian is likely to be flat, the rest of the US LTO might fall by 200 kb/d at most, so about 800 kb/d decline is about all we will see for LTO decline over the next 12 months. ..."
"... Enno Peters charts for ND Bakken show a similar decline of ~1/3 in combined output if no new wells are drilled ..."
"... Yes, the US is very energy intensive. Yes, I also believe oil and gas production will decline (and not only in the US). A few energy companies will default. Maybe we will have another recession – it is about time. But in the end, yes, you are going to die. Okay, tell us something new here! ..."
"... I would think that Daniel is noting that the laterals are longer and that they have gone to staged fracking. With staged fracking, instead of doing one frack per lateral, they are doing like 30 or more separate fracs in stages of a few hundred feet each in each lateral. If not, Daniel can tell us. ..."
Agree with the article about shale gas. However, after an initial phase of economic weakness,
lower US production will drive the USD down and increase worldwide economic activity again. The
question remains how far the USD will fall and as a consequence volatility will rise. So, shale
production does not mean the end of the world, yet increased volatility and the challenge how
to control it.
What has changed to make natural gas prices more volatile than in the past?
In the case of oil we can point to a major change in the behavior of OPEC, do you think the
volatility in oil prices will filter through to the natural gas market through the bond market?
The energy companies produce both oil and natural gas so there is certainly the financial tie
in as far as oil price volatility affecting the oil and gas industry in general.
The decline and legacy rates are huge for shale. According to the latest drilling report, the
monthly legacy rate for all shale plays has reached nearly 400 000 b/d and month, which is annualized
over 4 mill b/d of decline. Add the legacy rate for shale natural gas, which is nearly 20 bcf/d
and year.
Together with conventional oil and gas, the US oil and gas industry has to replace every year
close to 10 mill boe/d which is 50% of capacity of oil and gas production. And the situation gets
worse every year. The decline rate for worldwide conventional oil production is just 6%.
The cost for 1 mill b/d (either buying from the shelf or building from scratch) stands around
USD 50 bn. So the US oil and gas industry has to invest every year USD 500 bn for keeping production
stable – and gets just 250 bn revenue for this investment.
This is a financing gap of USD 250 bn every year. As the total high yield bond market adds
up to USD 1500 bn, the oil industry taps 17% of the high yield bond market. I think this explains
the high the leverage in the oil and gas market. The cost for keeping the USD stable is now astronomical.
Something has to give here. Either the dollar or the bond market collapses or 3mill b/d come out
of the market immediately.
If we look at the increases in yearly average output in 2014 and 2015, it was 1250 kb/d vs
730 kb/d. So decreased investment of $70 B, reduced the production gain by about 520 kb/d.
The decreased investment of $45B less in 2016 vs 2015.would be expected to reduce the production
gain by 330 kb/d, so we could potentially see an increase in output of 400 kb/d (2016 average
output vs 2015 average output) if the investment spending estimates are correct and the previous
trend holds.
This simple linear model is not likely to be correct because if we assume zero investment spending
in 2016, the result is flat output, which is highly unlikely.
I would expect output will be flat at best with 96 billion investment and oil is likely to
be down by 500 to 700 kb/d.
In inherent problem with the way I have done this is investment in natural gas production has
been ignored. We don't have enough detail here to know how the investment was divided between
natural gas and oil, though we could divide it up based on gross revenue or some other metric.
In any case, somewhere between 96B and 132B is enough to get flat output in the US (replacing
about 500 kb/d of decline at a 6% annual rate or 920 kb/d if we assume a 10% annual decline rate).
1) It is important to note, that today's upstream capex will affect output levels about
6 months from now. So high capex in 2014 resulted in relatively high production levels in
1H15. But lower capex in 2015 will affect production in 2016, and even lower capex in 2016
will negatively affect production in 2017.
2) Annual average growth in 2015 vs. 2014 reflects strong monthly growth in 2014.
Monthly output was declining since April 2015 and will continue to decline in 2016 and probably
for most of 2017. Furthermore, decline rates are likely to accelerate this year and may only moderate
in 2017.
The EIA expects annual average US C+C production in 2016 to be 0.7 mb/d lower than in 2015,
including a 0.8 mb/d y-o-y decline in Lower 48 onshore output. They are projecting annual average
decline of 270 kb/d for US C+C in 2017, including 380 kb/d in Lower 48 onshore. Even "shale optimists"
like Goldman Sachs and Citi expect a decline of ~0.5 mb/d in 2016 (I do not know their longer-term
projections).
Under most plausible oil price scenarios, 2018 US production may be flat or only slightly
above 2017, and growth in 2019 will still be moderate. I now think that 2015 record level of (9.7
mb/d in April) may not be reached even in 2020. However, with higher prices, peak levels could
be achieved in the next decade.
I think the EIA may be too pessimistic. The annual decline rate trend for March to Nov
2015 is about 500 kb/d. (See chart). I think there will be some oil price rise by mid year (maybe
to $45/b) and that the decline rate will moderate towards the end of 2016 as oil prices rise further
(to over $60/b by Dec 2016). I think the average US C+C output levels will be about 400 kb/d less
in 2016 compared to average 2015 output levels.
See chart for trend (note the assumption of a linear trend which is likely to overstate the
decline).
This was 2014 when legacy declines were much lower (around 20%). I am talking about 2016, which
includes also the rest of this year (total legacy rate 50%). In addition shale represents close
to two thirds of the oil and gas market in 2016. This share has been much lower in 2014. If the
US oil and gas industry does not spend as much, production will decline accordingly. I cannot
emphasize enough how much shale has changed the dynamics of the oil market. It is important to
recognize the change in the markets and not rely on past numbers.
The Bakken and Eagle Ford Models do not rely on past numbers except as a check on the model
(the Bakken Model has actually been lower than actual output, the Eagle Ford has been a little
closer, but also on the low side).
Now I take a model which has matched actual output fairly well over time and assume well profiles
remain the same as the past two years and that the new wells are added at half the rate of recent
months (39 new wells per month rather than 78 new wells), a similar exercise is done for the Eagle
Ford.
Enno Peters work confirms what I have found for the Bakken (which is based on data gathered
from the NDIC by Enno Peters.)
What you consistently fail to realize is that the EIA's DPR gives a very bad estimate of legacy
decline.
As fewer new wells are added the legacy decline gets smaller.
Think about it a moment, if 200 new wells per month are added, the legacy decline is high and
if 50 new wells per month are added the legacy decline will be lower (by roughly a factor of 4),
surely you can see this.
In the Bakken about 170 new wells per month were being added each month during 2012 to 2014,
lately only about 77 new wells have been added, so legacy decline will be smaller.
Bottom line, the DPR has Bakken legacy decline increasing and that is not correct, it will
decrease until the rate that new wells are added each month starts to increase.
"As fewer new wells are added the legacy decline gets smaller."
This is an interesting (and counterintuitive) paradox. Like you pointed out it is based on
the fact that the total number of wells is large and the decline curve flattens with years (after
the third year of production).
So paradoxically if you do not drill for three years you will get almost zero decline in output
during the forth year as all your wells will be "legacy wells".
In other words even with minimal drilling Bakken and other shale/tight oil plays in aggregate
are much more resilient output-wise that the decline of the production curve for a single well
suggests. See
http://peakoilbarrel.com/bakken-single-well-economics/
So companies will have substantial financial losses but total output decline will be not that
pronounced as each well produces oil for, say, 8 years.
If it was Saudis gamble to drop oil price to eliminate the US shale production, they badly
miscalculated. They need nearly a decade of low prices to eliminate substantial part of the USA
shale output.
Other factors such as exhaustion of "sweet spots" are probably more important in the future
drop of production.
Your above table confirms my view about a strong production decline in 2016. USD 500 bn are
necessary to keep production flat and compensate for future decline rates in 2016. If just USD
100 bn are spent in 2016, production of oil and gas will decline by 6 to 8 mill boe/d (more than
3 mill b/d of oil and the rest in natgas).
The EIA's estimate for legacy decline in the Bakken and Eagle Ford are incorrect.
For the Bakken/Three Forks the legacy decline in Nov 2015 was 4 kb/d and if the rate that new
wells are added remains at the Nov 2015 level the legacy decline rate falls to an average rate
of 3 kb/d for Dec 2015 to Nov 2016, output only falls by 140 kb/d in this scenario.
If no new wells are added over the next 12 months output in the North Dakota Bakken/Three
Forks only falls by 350 kb/d. That scenario is not very likely.
If 39 new wells per month (half as many as Nov 2015) are added each month for the next
12 months (somewhat plausible at low oil prices), ND Bakken/Three Forks output falls by 250 kb/d.
The Eagle Ford will fall a little more maybe 350 kb/d, the Permian is likely to be flat,
the rest of the US LTO might fall by 200 kb/d at most, so about 800 kb/d decline is about all
we will see for LTO decline over the next 12 months.
GOM output has been increasing lately so overall US C+C decline might be 700 kb/d from Dec
2015 to Nov 2016 (next 12 months of data).
As I have said before, your method for coming up with a 4 million barrel per day decline in
US output hits very wide of the mark, you are off by almost a factor of 6. Use the EIA's DPR at
your peril if you are an investor.
Well, please, stop this dramatic "we all going to die. Gold and silver will save you."! What are
you going to do with your gold and silver (when the economy has ground to a halt)? Eat it? Fill
it in your car? Who wants to trade it against really useful stuff in this situation?
Yes, the US is very energy intensive. Yes, I also believe oil and gas production will decline
(and not only in the US). A few energy companies will default. Maybe we will have another recession
– it is about time. But in the end, yes, you are going to die. Okay, tell us something new here!
Be careful with rig counts: one rig 5y ago was very different than today (today they are longer,
being fracked several times etc.)
Daniel may think the rig and well are the same thing. Many people think of old pictures of
well blowouts where the old wooden rigs are in place and think that the rig remains in place after
the well has been drilled.
Personally the only rig I have seen in person was a small rig used to drill a water well on
my property. (A toy relative to the rigs used for 20,000 foot wells in the Bakken.)
I believe you have pointed out that the average rig in service in the US is more efficient
at present because it is mostly the older rigs that have been stacked.
So we are probably seeing more feet drilled per rig today than 3 years ago.
Also Jeffrey Brown's point that there is more associated gas from oil wells (particularly in
the Eagle Ford) and more liquids focused gas drilling (aiming for gas with a lot of NGL) to improve
profitability.
US natural Gas output will decline a bit until natural gas prices and oil prices rise and make
increased drilling profitable.
This is really a problem of oversupply driving prices down and now the supply will decrease
and prices will rise, eventually (after a 6 to 12 month delay) supply will increase.
I would think that Daniel is noting that the "laterals" are longer and that they have gone
to "staged" fracking. With staged fracking, instead of doing one frack per lateral, they are doing
like 30 or more separate fracs in stages of a few hundred feet each in each lateral.
If not, Daniel can tell us.
The state of the industry according to John England, US Oil & Gas leader, Deloitte LLP
As 2015 comes to a close, I am struck by what a unique year this was in the always-fascinating
and dynamic world of oil and gas. 2014 was a year marked by a price shock that rapidly brought us
from our "new normal" (or so we thought) of $90-$100/barrel to prices around $60/barrel by the end
of the year. In 2015, oil prices continued to trend lower, getting down to the $40-50/barrel range
since mid-summer and dipping below $40/barrel in December. In less than a year, upstream oil and
gas companies faced 50 percent drop in revenues.
The industry responded by experiencing the five stages of grief:
Denial : "This is just a blip and won't last long" (this view died by March)
Anger : "It's OPEC's fault" (for producing as much as they can…a lot like US producers)
Bargaining : "If only we had invested for returns, not growth, for the past five years"
Depression : "Cash flows continue to diminish, and balance sheets continue to weaken"
Acceptance : "I guess we'd better prepare to ride this out for as long as it takes"
(current view of most players)
For the most part, 2015 saw the exploration and production sector of the industry pull out the
1980's playbook for a severe price decline:
Cut capital expenditures and defer major capital projects
Cut operating expenditures and headcount
Push suppliers for better pricing
Hope for better prices
The first three have been quite effective at reducing costs and preserving cash. The fourth one
is still in progress, and although I often hear "hope is not a strategy," it sure beats "no hope,"
at least when it comes to morale.
Today's low crude prices are forcing powerful innovation in the way oil is being developed and
produced.
Looking ahead to 2016
We do see some positive development that should get us to a better place from a pricing perspective:
Demand : US demand is responding to lower oil prices in the usual let's-go-buy-a-new-car,
or better yet, a-massive-SUV kind of way. As auto sales go up, expect to see increased US demand.
More broadly, Asian demand, beyond just China is showing strong growth. China itself, despite
the stock market jitters of the summer, remains a huge source of global demand and China's move
to allow two children per family, rather than one, promises to double the numbers of drivers (and
thus, fuel buyers) at some point in the future. (Let's just say I used very rough math on this
prediction).
Decline : Why is decline in the hope section? Because natural reservoir production
decline, which has historically been four to five percent globally, means that even without demand
growth, the oil and gas industry must produce another four million barrels per day every year
just to keep up with current demand. This naturally puts upward pressure on pricing.
Production : As noted above, total US production finally started to decline and that
trend is expected to continue in 2016. More broadly, billions of dollars of investments have been
deferred due to the low price environment, which translates to millions of barrels that will not
be produced in the years to come. This sets the stage for a price rally.
A leaner, stronger industry : More than anything else in business, I believe in the
power of free markets. Just as I believe the high prices of natural gas were a critical impetus
for the development of the shale gas revolution, I believe today's low crude prices are forcing
an equally powerful innovation in the way oil is being developed and produced. Price forces innovation
and I believe we are still in the early stages of what can be achieved in terms of reducing unit
costs of oil production and ultimately increasing unit margin and achieving higher return on capital
employed. The endgame is an oil and gas industry that will be stronger, leaner, and built to last.
"... ExxonMobil asserts Growth comes mostly from non-conventional supply but actually shows declining conventional supply – even after including Deepwater production. ..."
"... Only increasing use of higher priced Nonconventional hydrocarbons shows some global growth – but much lower than historical growth. ..."
"... In terms of gallons of condensate per MCF of dry gas, it would be 0.8 gallons/MCF in 2005, rising to 1.2 gallons per MCF in 2014, if my math is correct. ..."
"... Condensate, like natural gas liquids, is a byproduct of natural gas production. The US and OPEC 12 countries accounted for 41% of global dry gas production in 2014. ..."
"... If US + OPEC 12 estimated condensate production numbers per BCF of dry gas production from 2005 to 2014 are approximately indicative of world trends, estimated global condensate production in 2005 would be 4.9 million bpd (rounded off to 5 million bpd), and estimated global condensate production in 2014 would be 9.7 million bpd (rounded off to 10 million bpd), an estimated increase of about 5 million bpd in global condensate production from 2005 to 2014. ..."
"... Note that the increase in global C+C production from 2005 to 2014 was 4 million bpd (74 to 78 million bpd, rounded off to the nearest one million bpd). ..."
"... The foregoing analysis would of course suggest that actual global crude oil production (45 API and lower gravity crude oil) was down slightly from 2005 to 2014, down from about 69 million bpd in 2005 to about 68 million bpd in 2014–as annual Brent crude oil prices doubled from $55 in 2005 to $110 for 2011 to 2013 inclusive, remaining at $99 in 2014. ..."
"... Based on the foregoing scenario, total global condensate production would have increased from about 4.9 million bpd in 2005 (call it 5 million bpd) to about 8.8 million bpd in 2014 (call it 9 million bpd), in implied increase of 4 million bpd, which would of course mean that rising condensate production accounted for virtually all of the 2005 to 2014 increase in global C+C production. ..."
"... As the amount of BTUs per unit of weight is probably close to constant that means that energy-wise condensate with API 60 contains approximately 12% less of energy then oil with API 40. ..."
"... In other words, mixing them in statistics inflates the total amount of energy produced. If uniform statistics is desirable they should be counted using factor 0.9. This recalculation will make peak oil phenomenon more visible in all graphs of world and countries production. ..."
"... That also mean that countries and agencies reporting production in metric tons are doing better job then countries reporting production in volume measures such as barrels. In other words EIA sucks :-) ..."
"... My principal point is that the available data strongly suggest that actual global crude oil production has been on an Undulating Plateau since 2005, while global natural gas production and associated liquids, condensate and NGL, have so far continued to increase. ..."
"... The second factor affecting the condensates/crude balance is the huge North Field, and the consequent expansion of natural gas output in the country. This has led to a surge in the production of condensates on the back of new wells and projects aimed at feeding Qatars liquefied natural gas and gas-to-liquids sectors. Indeed, if the QNB figure of 724,000 bpd of crude is compared with the BP figure of 1.995m bpd of total oil production – which includes crude oil, light oil (from condensates), oil sands and natural gas liquids – then condensates are likely responsible for over 1m bpd of Qatars oil production. ..."
"... with condensate production exceeding crude oil production in 2012, when it hit 900,000 bpd. . . . ..."
ExxonMobil released its 2016 Outlook for Energy: A View to 2040. Buried on page 62, its
Liquids Outlook by Type clearly shows conventional crude oil ("Crude + Condensate") peaked
about 2005. Global conventional oil ("Crude + Condensate") declines through 2040. ExxonMobil
asserts "Growth comes mostly from non-conventional supply" but actually shows declining conventional
supply – even after including "Deepwater" production.
Only increasing use of higher priced Nonconventional hydrocarbons shows some global
growth – but much lower than historical growth. Only by adding Bitumen (aka "Oil Sands"),"tight
oil", natural gas liquids (NGL), "other" and biofuels does ExxonMobil project about 20% total
growth over 25 years (from the current 93 million bbl/day to about 112 million bbl/day.)
I think ExxonMobil's estimate of future tight oil production is way overly optimistic. But
not nearly as overly optimistic as their estimate of "new conventional crude and condensate development".
Here's a somewhat different approach to my attempts, using available data, to differentiate between
actual crude oil, generally defined as 45 API Gravity and lower crude oil, from condensate, generally
defined as Crude + Condensate (C+C) with an API Gravity greater than 45.
Since condensate, like Natural Gas Liquids (NGL), is a byproduct of natural gas production,
it occurred to me that what is important is the estimated condensate yield per BCF of global dry
natural gas production.
US & OPEC 12 Condensate Production Estimates as Indicators of Global Condensate Production,
2005 to 2014
Natural Gas Data
US Natural Gas Production (BP):
2005: 50 BCF/day
2012: 71 BCF/day
OPEC 12 Natural Gas Production (BP):
2005: 42 BCF/day
2014: 68 BCF/day
US + OPEC 12 Natural Gas Production (BP):
2005: 92 BCF/day
2014: 139 BCFday
Global Natural Gas Production (BP):
2005: 270 BCF/day
2014: 335 BCF/day
Condensate Data & Estimates
Implied OPEC 12 Condensate Production
(EIA OPEC 12 C+C less OPEC Crude Only)
2005: 1.2 million bpd
2014: 2.4 million bpd
Estimated US Condensate Production (45+ API Gravity C+C Production)
2005: 0.5 million bpd
2014: 1.7 million bpd
(EIA puts US Lower 48 45+ API C+C production at 2 million bpd in 2015, and they estimated that
US 45+ API Gravity C+C production increased by about one million bpd from 2011 to 2014)
Implied OPEC 12 Condensate + Estimated US Condensate Production
2005: 1.7 million bpd
2014: 4.1 million bpd
OPEC 12 + US Condensate Estimates Per BCF of Dry Gas Production
2005: 18,000 barrels/BCF
2014: 29,000 barrels/BCF
(In terms of gallons of condensate per MCF of dry gas, it would be 0.8 gallons/MCF in 2005,
rising to 1.2 gallons per MCF in 2014, if my math is correct.)
Condensate, like natural gas liquids, is a byproduct of natural gas production. The US
and OPEC 12 countries accounted for 41% of global dry gas production in 2014.
If US + OPEC 12 estimated condensate production numbers per BCF of dry gas production from
2005 to 2014 are approximately indicative of world trends, estimated global condensate production
in 2005 would be 4.9 million bpd (rounded off to 5 million bpd), and estimated global condensate
production in 2014 would be 9.7 million bpd (rounded off to 10 million bpd), an estimated increase
of about 5 million bpd in global condensate production from 2005 to 2014.
Note that the increase in global C+C production from 2005 to 2014 was 4 million bpd (74
to 78 million bpd, rounded off to the nearest one million bpd).
The foregoing analysis would of course suggest that actual global crude oil production
(45 API and lower gravity crude oil) was down slightly from 2005 to 2014, down from about 69 million
bpd in 2005 to about 68 million bpd in 2014–as annual Brent crude oil prices doubled from $55
in 2005 to $110 for 2011 to 2013 inclusive, remaining at $99 in 2014.
Note that I am estimating that US + OPEC 12 condensate production increased by about 2.4 million
bpd from 2005 to 2014 (from 1.7 to 4.1 million bpd), with an estimated condensate yield of about
18,000 barrels per BCF of dry gas in 2005 and 29,000 barrels per BCF of dry gas in 2014 (note
that the condensate yield per BCF of wet gas would of course be lower).
In any case, if the condensate yield for non-US + non-OPEC gas was the 18,000 barrels per BCF
in 2005, but only rose to 24,000 barrels per BCF in 2014 (versus 29,000 barrels per BCF for US
+ OPEC), non-US + non-OPEC condensate production would have increased from about 3.2 million bpd
in 2005 to about 4.7 million bpd in 2014 (again, if my math is correct).
Based on the foregoing scenario, total global condensate production would have increased
from about 4.9 million bpd in 2005 (call it 5 million bpd) to about 8.8 million bpd in 2014 (call
it 9 million bpd), in implied increase of 4 million bpd, which would of course mean that rising
condensate production accounted for virtually all of the 2005 to 2014 increase in global C+C production.
In any case, note that the doubling in annual Brent crude oil prices from $55 in 2005
to $110 for 2011 to 2013 inclusive (remaining at $99 in 2014) provided an enormous incentive for
global oil and gas producers to increase their liquids production, wherever and however they could.
My principal point is that the available data strongly suggest that they weren't able to show
a material increase in actual global crude oil production (45 API and lower gravity crude oil)–despite
trillions of dollars spent post-2005 on global upstream oil and gas projects, Qater being a perfect
example.
Here is another argument supporting your position about distinguishing crude and condensate.
They really should be reported separately in oil production statistics.
Condensate energy content per unit of volume is less that oil as API gravity is an inverse
measure of a petroleum liquid's density relative to that of water.
In other words a barrel of, say, 60 API condensate (average of a typical 45-75 range) has less
energy (in BTU) than a barrel of 39.6 API oil (WTI). Using standard formula for number of barrels
in metric ton (API+131.5)/(141.5*0.159) we will get 8.5 barrels and 7.6 barrels per metric ton,
respectively.
As the amount of BTUs per unit of weight is probably close to constant that means that energy-wise
condensate with API 60 contains approximately 12% less of energy then oil with API 40.
In other words, mixing them in statistics inflates the total amount of energy produced. If
uniform statistics is desirable they should be counted using factor 0.9. This recalculation
will make peak oil phenomenon more visible in all graphs of world and countries production.
That also mean that countries and agencies reporting production in metric tons are
doing better job then countries reporting production in volume measures such as barrels. In
other words EIA sucks :-)
Here is an interesting article, I think that was published in 2015, on crude oil versus condensate
production in Qatar (of course, Qater is a member of OPEC). As I have previously discussed, the
crude oil versus condensate quality issue is not my principal point.
My principal point is that the available data strongly suggest that actual global crude
oil production has been on an "Undulating Plateau" since 2005, while global natural gas production
and associated liquids, condensate and NGL, have so far continued to increase.
Note that the OPEC 12 data that Ron compiled for me show that Qatar's reported crude oil production
fell from 0.8 million bpd in 2005 to 0.7 million bpd in 2014 (OPEC crude only data), while EIA
data show that Qatar's C+C production increased from 1.0 million bpd in 2005 to 1.5 million bpd
in 2014.
The global market is far more competitive these days, and 2014 saw a dramatic decline in
oil prices, which continued into 2015. In March 2015 Brent Crude was retailing at $57 per barrel.
Behind this is a global oversupply – Bloomberg reported that the UAE and Qatar estimated this
to be in the region of 2m barrels per day (bpd) in mid-January 2015. This is primarily the
result of surging US output, which was at a three-decade high. However, this output seems likely
to taper off, as falling prices make some of the fracking on which US production is based no
longer economically feasible. Furthermore, in 2014 Washington decided to allow exports of condensates
for the first time – oil exports having been banned since the 1970s oil crisis. Thus, the global
condensates market is also seeing a major supply surge, with press reports suggesting that
the US could add up to 1m bpd of these light oils to the export market during the next 10 years.
This is particularly relevant to Qatar, as condensates have come to represent a larger proportion
of the state's output than crude.
DEPLETION OF RESERVES: This has been for two main reasons. First, there is the depletion
of existing oilfields. Qatar Petroleum's (QP's) Dukhan field, the oldest, sent out its first
export cargo in 1939, although it remains one of the two largest fields in the country, along
with Maersk Oil's Al Shaheen. Qatar National Bank (QNB) figures show that total output has
declined continuously in recent years, from a peak of 845,000 bpd in 2007 to 733,000 bpd in
2010, 724,000 bpd in 2013 and 681,000 bpd in November 2014.
This is despite major investment in enhanced oil recovery (EOR). Some $6.6bn has been invested
in crude oil projects under Qatar's 2010-14 development plan, with much of this going into
EOR. At the same time, reports in local media state that Occidental is investing $3bn in water
injection to sustain production at the Idd Al Sharqi field, while ExxonMobil has made further
investments in Dukhan. Indeed, most of the investments currently ongoing in the oilfields are
of this kind, with the aim of maintaining and stabilising production.
"Our overall objective for the field is more to minimise production decline," Guillaume
Chalmin, the managing director and group representative of Total E&P Qatar, told OBG, referring
to his group's Al Khalij field. "This takes priority over increasing production."
. . . . CONDENSATES: The second factor affecting the condensates/crude balance is the
huge North Field, and the consequent expansion of natural gas output in the country. This has
led to a surge in the production of condensates on the back of new wells and projects aimed
at feeding Qatar's liquefied natural gas and gas-to-liquids sectors. Indeed, if the QNB figure
of 724,000 bpd of crude is compared with the BP figure of 1.995m bpd of total oil production
– which includes crude oil, light oil (from condensates), oil sands and natural gas liquids
– then condensates are likely responsible for over 1m bpd of Qatar's oil production. QNB
figures quoted by Business Quartermagazine in 2013 stated that while crude oil reserves were
an estimated 2.3bn barrels in 2011, condensate reserves were an estimated 22.3bn barrels,
with condensate production exceeding crude oil production in 2012, when it hit 900,000
bpd. . . .
HIGH-VALUE PRODUCTS: Condensates are hydrocarbons that exist in a gaseous state underground,
but which liquefy during the production process. They are thus a low-density mixture of hydrocarbons
and come from both oil wells, as associated gas, and from natural gas wells, where they exist
alongside raw natural gas and are known as non-associated or wet gas. Condensates can also
be produced from dry gas – natural gas that has no associated component – in gas processing
plants; this variety is known as plant condensate.
"... Hopefully after reading your comment, those who believe that the US is not an empire, shall have at least a bit clearer understanding of the fact(s) that: ..."
"... Japan, although de jure a developed democracy, is de facto the 51st state of the US and it is not its democracy and economic might that keeps China from sinking it, but indeed the 50000 US Military personal permanently staged in Okinawa ..."
"... It is not the South Korean peoples will that keeps the fat, ugly Kim (and the other fatter and uglier Kim-s before him) from turning Seoul into an ashtray within an hour, but indeed the 50000 US Military personal permanently staged there…. ..."
"... US does not spend more than the next 20 countries COMBINED in war/military just for the fun of it – but indeed to secure its unchallenged hegemony throughout the world. ..."
"... US does not maintain and pay for more than 200 military bases and installations (1/3 of them on a permanent status) throughout the globe just to enjoy the climate and eat sushi…, but indeed to influence affairs in EVERY corner of the globe. ..."
"... By directly and indirectly creating, fueling and influencing every (and I mean that literally: every and all!) war and conflict throughout the world since WWII gives a full and complete meaning to: ..."
"... Not only is the US an Empire, but it is an Empire that puts to shame all preceding ones ~ Stavros H ..."
"... Russia is at a massive disadvantage vis-a-vis NATO-GCC in anything other than nuclear capability: ..."
"…Our first objective is to prevent the re-emergence of a new rival, either on the territory of
the former Soviet Union or elsewhere, that poses a threat on the order of that posed formerly
by the Soviet Union. This is a dominant consideration underlying the new regional defense strategy
and requires that we endeavor to prevent any hostile power from dominating a region whose resources
would, under consolidated control, be sufficient to generate global power…" ~ 02/18/1992 Defense
Planning Guidance (aka: the Wolfowitz Doctrine). Authored by Under Secretary of Defense for Policy
Paul Wolfowitz and Scooter Libby.
Dear Stavros,
I have to say that your comment is a "must read" for the multitude of un-initiated commentators
who naively think the US is not an empire , or for those who have the 15 century understanding
of "Empire" and think that to be an empire the US must include more than Puerto Rico and the Virgin
Islands in/on its map…
The best and most synthetic comment (within the time/space limits of a blog akin to this) with
regard to history and geopolitics of the US Empire.
With the exception of a few outdated and "linear" thinking passages (i.e.: "…with Russia openly
defying the entire North-American-EU-Turkey-GCC-Israel complex despite a relative balance of forces
that is on paper nothing less than catastrophic (for Russia)…" – what Mr. Fermi did in Chicago
in 1942 and Mr. Oppenheimer et al, did in New Mexico in the Summer of 1945, reduce to irrelevancy
the amount and size of the adversaries of countries like Russia and the US when it comes to war…hint:
there will be no adversaries left and nothing to conquer afterwards!), I fully agree with your
assessment and comprehension of the "puzzle".
Hopefully after reading your comment, those who believe that the US is not an empire, shall have
at least a bit clearer understanding of the fact(s) that:
Japan, although de jure a developed democracy, is de facto the 51st state of the US and
it is not its democracy and economic might that keeps China from "sinking" it, but indeed the
>50000 US Military personal permanently staged in Okinawa (and GOD knows how many more "civilian"
personal). Young Chinese minds – whose most important history lesson taught in school to this
day is : "The rape of Nankin" know that very well!
It is not the South Korean people's will that keeps the fat, ugly Kim (and the other fatter
and uglier Kim-s before him) from turning Seoul into an ashtray within an hour, but indeed
the >50000 US Military personal permanently staged there….
US does not spend more than the next 20 countries COMBINED in war/military just for the
fun of it – but indeed to secure its unchallenged hegemony throughout the world.
US does not maintain and pay for more than 200 military bases and installations (1/3 of
them on a "permanent" status) throughout the globe just to enjoy the climate and eat sushi…,
but indeed to "influence" affairs in EVERY corner of the globe.
By directly and indirectly creating, fueling and influencing every (and I mean that literally:
every and all!) war and conflict throughout the world since WWII gives a full and complete
meaning to:
"Not only is the US an Empire, but it is an Empire that puts to shame all preceding ones"
~ Stavros H
I am impressed and will read you more attentively in the future.
Regarding my comment on Russia being "catastrophically" outgunned by the NATO-GCC-Israel complex
opposing her, allow me to attempt a clarification/elaboration.
Obviously, the existence of nuclear weapons (both tactical & strategic) and Russia's very own
formidable arsenal of such weapons almost certainly forestalls any hopes/plans that her enemies
may have had in launching some kind of 21st century Operation Barbarossa/Napoleonic invasion.
Notice that I say "almost" since at least a few western "security experts" believe that a surprise
decapitating "First Strike" could potentially neutralize Russia's nuclear deterrent and pave the
way for victory.
But, this being a 21st century Global Hybrid War, conventional/unconventional military assets
are not the only factor at play.
Russia is at a massive disadvantage vis-a-vis NATO-GCC in anything other than nuclear capability:
a) Conventional Air and Naval Forces. NATO's (read; US's) fleet roams the oceans. NATO's drone
fleet also handily exceeds Russia's in both quantity and quality.
b) Geostrategic reach. US-NATO boasts proxies and military bases bestriding most of the globe's
surface. NATO even has proxies on Russia's borders (a tremendous threat to Russia) That includes
the Baltic states (only minutes of flight between them and St. Petersburg) Georgia in the Caucasus,
as well most importantly and recently, Ukraine. Ukraine is now an open wound for Russia as well
as an existential threat.
c) Most importantly, NATO-GCC is immensely superior to Russia in economic terms. GDP, financial
assets, ability to issue currency, you name it. This allows NATO-GCC not only to buy more influence
around the global chessboard, but also to at least inflict short-term economic pain on Russia.
If Russia fails to cope, it will become much more than that.
d) "Soft Power". The "West" culturally dominates the world. And when I say culturally, I use
that term in its broadest sense. Not only films, music and fashion, but also in terms of language,
education, political and behavioral norms etc. Moreover, and this is quite crucial, NATO-GCC outguns
Russia in terms of propaganda outlets. Russia only boasts one state-funded TV network and a couple
websites and also has to rely on several "alternative media" websites in the West itself (which
it does not control or fund) but who are I think, its most prized asset in the "informational
war" sphere. People who feel disenfranchised in the West itself (mostly the far-left and the far-right)
have largely sided with Russia on this one. This is so for obvious reasons that I don't have to
go into right now.
On the other hand, NATO, possesses an entire global behemoth of propaganda factories, some
state funded, others partially so, others wholly private, but all of them with direct links to
western Intelligence Agencies, pushing a particular narrative in myriads of ways, at all times
adjusted to the targeted audience.
You must also add the so-called NGO's to the equation. In this arena, Russia owns little if
any assets. Her enemies on the other hand, again possess entire armies of "international agencies",
"charities", "watchdogs", "think-tanks" etc. All are designed to push the NATO agenda around the
globe, subverting any and all governments that step out of line. Their first and foremost target
is of course, you guessed it. These include: HRW, AI, SOHR, PHR and so on and so on ad infinitum.
Russia is of course scrambling to find asymmetrical ways to partially counter for this imbalance,
with some success, it has to said. It is in this vein that I made that claim.
No arguments what so ever! Fully agree, but just for the sake of discussion:
1- "Notice that I say "almost" since at least a few western "security experts" believe that
a surprise decapitating "First Strike" could potentially neutralize Russia's nuclear deterrent
and pave the way for victory." ~ Stavros
Those who say that (i.e: McCain, Graham etc) are first class morons!
Even if we had 90% success rate during that first strike would live them with 800+ high yield
heads which will assure there will be no winners.
Even if we had 99% destruction rate during the first strike (impossible even if we new where
they hide them…and I mean all 8000+ of war heads they possess.
They have more then all the others combined!) will still live them with 80+ deliverable high
yield heads – which still assures NO winners!
That is why smart people in the '60s and '70s called it MAD (mutually assured destruction).
2- "Conventional Air and Naval Forces. NATO's (read; US's) fleet roams the oceans. NATO's
drone fleet also handily exceeds Russia's in both quantity and quality."
Those are WWII technology which are successful against countries like Iran/Iraq/Vietnam/Granada/Libya/Argentina/Brasil
etc, etc.
But against Russia/China and the new generation hyper-sonic anti ship weaponry and EMP/electronic
jamming technology they are truly and utterly VERY expensive sitting ducks.
However the flip side of the steep Shale decline curves in a high drilling
environment is much flatter decline curves in a low drilling environment.
So once the initial drop is weathered Shale oil will produce much more steadily
albeit at a lower rate from existing wells. Add some drilling and completions
and the supply from Shale will chug along undramatically. Even if a number
or even all of the over-indebted players crash, their wells will still be
there, snapped up cheaply and still produce.
Still Shale has shot its bolt, done its worst, and the story of marginal
supply turns back to the Middle East, after all, while so many in the MSM
were banging on about the KSA or their arch rival Iran, it has been Iraq
that added the extra 1 mbps over last 18 months: 3.2 to 4.2 mbps mid 2014-2015.
Has this trajectory got more legs? If so it may happily replace Shales
flop till it flattens out, preventing any major price correction to get
the roustabouts rigging up again on baleful steppes of North Dakota.
How was the development in Iraq funded – my guess is various sources of
very low interest loans? All the new production has involved western, Chinese
or Russian oil companies which would have had low interest funds available
and the IMF has made some money available directly to the Iraq government.
Iraq and Kurdistan are going bust at the moment.
So it looks a lot like the shale plays: cheap money -> over investment
-> over production -> low prices -> pump harder to cover the losses -> bankruptcy
-> something far worse in Iraq than will be seen in ND and Texas I expect.
"…it has been Iraq that added the extra 1 mbps over last 18 months: 3.2
to 4.2 mbps mid 2014-2015. Has this trajectory got more legs? "
From IEA World Energy Outlook 2014:
"Iraq remains the largest source of global oil production growth over the
entire period to 2040, even though our outlook is progressively getting
closer to the "Delayed Case" examined in WEO-2012, in which institutional
and political obstacles were assumed to hold back upstream investment in
Iraq."
Projected C+C+NGL production in Iraq and Iran (mb/d)
source: IEA WEO-2014
The article is weak and one-sided, but some facts (or more correctly fuzzy estimates) are
interesting. While this is not an objective assessment of russian conditions, it is pretty good
assement of Western sentiments toward Russia as reflected in MSM.
Notable quotes:
"... in the key Soviet-era fields in western Siberia, the annual rate of depletion is averaging 8 percent to 11 percent, while new projects are being curtailed. ..."
"... According to the Telegraph [ article by Ambrose Evans-Pritchard ( 14 Jan 2016)], Transneft, the Russian crude and product pipeline monopoly, estimated that Russian crude exports could decrease in 2016 by some 460,000 barrels per day, based on producer applications for pipeline capacity. ..."
"... At the end of Q3, Rosneft's net debt stood at $24 billion. ..."
"... Rosneft likely cannot generate the cash to cover its investment, interest, and debt repayment obligations. ..."
Until recent weeks, the Russian government had some basis to
harbor hope that GDP, after contracting ~3.5 percent in 2015, would
return to growth within this two year window. As late as Q3 2015,
the IMF estimated that in 2016, GDP would grow, if only anemically
at below 1 percent.
Recent crude price action, however, has dashed such hopes and
instead has raised the prospect of a deeper and longer recession.
In a "stress" test it conducted in November, the Russian Central
Bank estimated that with Ural crude prices
below $40 per barrel between 2016-2018, the Russian economy
would contract five percent in 2016, inflation would run at 7-to-9
percent, and that these conditions "would also raise risks to
inflation and financial stability.
Central Bank efforts to stabilize the Ruble and contain
inflation are one reason the "stress" test results may prove
prescient. The plunge in crude prices is preventing the Central
Bank from easing monetary policy to stimulate the economy. Friday,
January 29, it announced that it would keep its benchmark interest
rate at 11 percent, to support the Ruble (which fell as low as
~R82.5/US$ last week before recovering to ~RUB75.5/US$ on January
29) and contain inflation. In its announcement, it noted that its
next move could be to raise rather than lower the benchmark rate,
were inflationary pressures to increase.
.... ... ...
The Russian government is also contemplating asset sales
(including part of its stake in Rosneft and in VTB, a major bank),
but such sales would provide one-time boosts to revenue and in any
case would take time to organize. Borrowing is a possibility, since
Russia's sovereign debt is low, but the Russian government can't
access U.S. and European capital markets, closed to it due to U.S.
and EU sanctions related to the conflict over Ukraine).
The Russian energy industry is also a target-and potentially a
lucrative one, given the structure of Russian taxes on the
industry. In 2015's first three quarters, for example, low crude
prices decreased the revenues the Russian government collected in
export customs duties from Rosneft, Russia's largest producer, by
RUB 520 billion (RUB 1058 billion to RUB 738 billion), while taxes
other than income taxes increased only RUB 80 billion, from RUB 919
billion to RUB 1009 billion).
It is therefore not surprising that in September, the Russian
Finance Ministry attempted to increase the mineral extraction tax.
Industry opposition and opposition from other Russian
ministries-citing the negative impact on investment and
output-forced it to back down (Venezuela is an example, admittedly
extreme, of what happens when government raids on industry revenues
to fund current operations squeezes investment). It proposed
instead to slow down the planned decrease in crude export duty rate
(from 42 percent to 36 percent. Also under consideration is a
windfall profits tax on Russian energy exporters benefitting from
the Ruble's depreciation.
Deteriorating Energy Industry Conditions
The situation of Russian energy producers is also difficult. The
Telegraph (UK) in early January quoted Russia's deputy finance
minister, Maxim Oreshkin, as telling TASS earlier this month that
low crude prices could lead to "hard and fast closures in coming
months." The article also said noted that in the key Soviet-era
fields in western Siberia, the annual rate of depletion is
averaging 8 percent to 11 percent, while new projects are being
curtailed.
According to the
Telegraph
[ article by Ambrose Evans-Pritchard ( 14 Jan 2016)], Transneft, the Russian crude and
product pipeline monopoly, estimated that Russian crude exports
could decrease in 2016 by some 460,000 barrels per day, based on
producer applications for pipeline capacity.
In an interview with TASS, the Russian news agency last week,
Lukoil Vice President Leonid Fedun commented that Lukoil
was unlikely to produce the one hundred million tons it
produced in 2015. He also said that it made more economic sense to
sell one barrel of oil for $50 than two barrels for $30.
Gazprom, Russia's natural gas giant, shows signs of stress. In
recent weeks, it has instituted a series of cuts in investments.
January 11, Reuters reported Gazprom cancelled one tender in
December and three tenders in January for work on the construction
of the Ukhta-Torzhok pipeline, a domestic key component of pipeline
system which will transport natural gas directly to Germany through
the Nord Stream II pipeline. According to Reuters, Gazprom Neft (of
which Gazprom is the majority shareholder) recently
terminated negotiations to acquire a 49 percent stake in
Vietnam's Binh Son Refining and Petrochemical, a subsidiary of
Vietnam's state-owned PetroVietnam.
A January 15
Reuters article quoted "sources close to Gazrpom" as saying
that Chinese economic problems and low energy prices have reduced
the volume of natural gas Gazprom expects to export to China via
the Power of Siberia pipeline-the project on which Gazprom has bet
its future-when it is completed. Given the already questionable
economics of the Power of Siberia project, reduced volumes will
intensify doubts about the project's financial viability and future
(Putin
Is Taking A Big Risk With China Gas Deals).
Overleveraged, Rosneft's Pain is Particularly Acute
The pain for Rosneft, the company which the Russian government
hoped would gain the size necessary to compete on equal terms with
Western oil majors, is particularly acute. As part of its effort to
gain scale, the company in 2013 took on massive debt-$40 billion
according to Reuters-to finance its acquisition of Russian
competitor TNK-BP for $55 billion.
To help pay down debt, Rosneft, also in 2013, concluded an
agreement with Chinese National Petroleum Corporation to supply 400
million metric tons of crude over twenty five years, under which
Rosneft was entitled to receive prepayment equal to 30 percent of
the contract's value (Rosneft received RUB 1027 billion in 2015
Q3).
At the end of Q3, Rosneft's net debt stood at $24 billion. Yet, Alexey Bulgakov, a fixed income analyst at Sberbank CIB
estimates that Rosneft may already have accessed the maximum amount
of cash it can under the deal, given the decline in price from
~$100-plus per barrel in 2013 to ~$30 per barrel now and the terms
of the agreement.
And, should crude prices remain at current levels, Rosneft
likely cannot generate the cash to cover its investment, interest,
and debt repayment obligations.
Russian government officials and energy producers argue that a
depreciating Ruble has attenuated the impact of lower crude prices,
since each US$ generates more Rubles, which is important given that
the bulk of their expenses are in Rubles. This, however, isn't the
only impact of a weak Ruble. It can also cause inflation, and this
has been the case in Russia.
Dalan McEndree has a BA in history, MA in European History, M.Phil. in Russian and Soviet
history, Soviet economics, and International economics, and MBA in finance and marketing. He also
studied at the East European Institute of Berlin's Free University and the U.S. Army Russian
Institute in Garmisch, Germany (now the George C. Marshall European Center for Security Studies).
His career has focused on the Soviet Union and Russia, and has included fifteen years in Russia
as a U.S. diplomat, in business, working both for international and Russian businesses, and in
consulting. He is also the author of several self-published Russia-focused murder mysteries, and
two satires.
"... oil prices will rise to at least $52 per barrel by the end of the year, though he reiterated his admission that he got last years call wrong when he thought prices would strongly rebound. ..."
"... Were still building inventories, and we will for the next several months. And then well start to draw, Pickens said. Once you start to draw, youre not going to start back building again. The draw will come here in the next few months. Itll become pretty clear. ..."
"... Were [only] on 1 million to 1.5 million [barrels per day] oversupplied in the market, he added, pointing to the glut in the mid-1980s that he said was 15 million barrels per day oversupplied. ..."
Oilman
Boone Pickenssaid Monday U.S. crude hit bottom at just above $26 per barrel,
and based on history, prices should double within 12 months.
Pickens predicted on CNBC's "Squawk Box" that oil prices will rise to at least $52 per barrel by the end
of the year, though he reiterated his admission that he got last year's call wrong when he thought
prices would strongly rebound.
Whether it's $50 or $70 by the end of 2016 will largely be determined by the global economy, he
added.
West Texas Intermediatecrude, the U.S. benchmark, was under pressure again Monday - losing around 3 percent mid-morning
and trading below $33 per barrel.
"We're still building inventories, and we will for the next several months. And then we'll start
to draw," Pickens said. "Once you start to draw, you're not going to start back building again. The
draw will come here in the next few months. It'll become pretty clear."
"We're [only] on 1 million to 1.5 million [barrels per day] oversupplied in the market," he added,
pointing to the glut in the mid-1980s that he said was 15 million barrels per day oversupplied.
In a CNBC commentary in October, Pickens conceded his prediction for $70 oil
by the end of 2015 wasn't going to happen, because worldwide demand did not go up as much as he thought
and supply did not markedly go down.
On the final trading day of last year, WTI settled at around $37 per barrel.
As crude accelerated to the downside in 2016, Pickens told CNBC's "Mad Money" on Jan. 6 that oil was close to its floor, and predicted $70 to
$75 prices by year end. The low for the year on WTI was
$26.55 per barrel on Jan. 20.
With more than a half century in the oil and gas business, Pickens spent most of his career building
Mesa Petroleum into a powerhouse. After selling Mesa in 1996, he founded BP Capital Management, an
investment firm focusing on the energy industry.
According to Barclays, the amount of bond debt owed by junk-rated energy producers expanded
eleven fold to $112.5 billion at the height of the shale boom from 2004 through 2014.
... ... ...
According to the Wall Street Journal, citing financial research firm IPREO, oil and gas
companies raised
$255.7 billion through various public offerings and bond issues from 2007 through 2014. The
total debt of the U.S. oil and gas companies, excluding Chevron and ExxonMobil, is expected to
increase to more than $200 billion when all the 2015 financials come out. That's a
55 percent
increase since 2010-all fueled by higher oil prices at that time.
"... 1. Undeveloped nations will become more developed, ..."
"... 2. Populations will grow (from 7.2 billion people worldwide today to nine billion in 2040), and ..."
"... 3. Global energy demand will increase by 25 percent. About a third of the energy used will come from oil. Natural gas will be the biggest winner, with consumption up by about 40 percent. Renewable energy use will increase substantially and coal will be the big loser. ..."
"... No one in the energy industry should believe that we live in a static economic model where oil continues to be king forever and there is no room for alternative energy sources. The costs of alternative energy will continue to decrease and the benefits of those sources under specific circumstances and for specific purposes will increase. ..."
"... Oil and gas aren't going anywhere. Petroleum engineers and geologists entering college next year will work their entire careers exploring for hydrocarbons. ..."
"... While we are going through a historic down cycle in oil and gas, failure to plan for a future that includes those commodities risks shortages that could make the costs astronomical. ..."
"... Somewhat higher (and predictably stable) oil and gas prices help every part of the energy pie. Low prices are killing the oil and gas sector, but they are also making it impossible for renewables to thrive without subsidies. ..."
"... Incentives for efficiency promise to provide us with the greatest long-term bang for the buck. ..."
"... Government policies need to be grounded in the reality that fossil fuels are going to be with us for a long time to come and that renewables will take time to prove themselves. Policies need to reflect a mixed and balanced approach to the full array of energy sources, the "all of the above" policy that the Administration once talked about but never fully embraced. Let's note that none of the Presidential candidates from either party are talking about a balanced energy policy either. ..."
"What we have here is a failure to communicate."
That's what the warden says to Paul Newman in the movie
Cool Hand Luke, right after he knocks
him into a ditch.
... ... ...
... the President missed, or chose not to recognize, another trend – the world is not decreasing
its use of oil and gas; it is increasing it. That information was highlighted a couple of weeks later
when the ExxonMobil analysis was
released. That study looks ahead to the year 2040 and projects that fossil fuels will still provide
80 percent of the world's energy need.
The Cliff Notes version of the analysis is that:
1. Undeveloped nations will become more developed,
2. Populations will grow (from 7.2 billion people worldwide today to nine billion in 2040),
and
3. Global energy demand will increase by 25 percent. About a third of the energy used will
come from oil. Natural gas will be the biggest winner, with consumption up by about 40 percent. Renewable
energy use will increase substantially and coal will be the big loser.
That is a changed landscape to be sure, and not the sort of change that should cause policymakers
to think they can ignore any energy source to fuel world growth. Interestingly, one of the biggest
changes predicted in the report has less to do with energy sources and more to do with using our
energy more efficiently. Where the study predicts that world energy use will go up 25 percent, we
could see twice that increase if we don't adopt efficiency measures. To put it another way, we need
to be aggressive in implementing efficiency measures or we may not have enough energy to meet growth
demands.
Looking at one measure, light vehicles are predicted to use about 40 percent less fuel, not because
we will all be driving electric cars, but because stingier gas-powered vehicles could get 45 miles
per gallon.
To some extent, the difference between the State of the Union address and ExxonMobil's vision
of the future is a tale of two cities, Washington and Houston. One is driven by the optics of politics
and the limitations of the legislative process. The other is driven by the realities of the marketplace
and the simple realities of statistical analysis. But it also sounds like a tale of two planets –
one world in which energy sources can be changed with a flip of a switch and one world where people
and governments continue to act in their own best interests.
So where is the common ground? How do we stop the massive failure to communicate? How about this:
No one in the energy industry should believe that we live in a static economic model where
oil continues to be king forever and there is no room for alternative energy sources. The costs of
alternative energy will continue to decrease and the benefits of those sources under specific circumstances
and for specific purposes will increase.
Oil and gas aren't going anywhere. Petroleum engineers and geologists entering college next
year will work their entire careers exploring for hydrocarbons.
While we are going through a historic down cycle in oil and gas, failure to plan for a future
that includes those commodities risks shortages that could make the costs astronomical.
Somewhat higher (and predictably stable) oil and gas prices help every part of the energy pie.
Low prices are killing the oil and gas sector, but they are also making it impossible for renewables
to thrive without subsidies.
Incentives for efficiency promise to provide us with the greatest long-term bang for the buck.
Government policies need to be grounded in the reality that fossil fuels are going to be with
us for a long time to come and that renewables will take time to prove themselves. Policies need
to reflect a mixed and balanced approach to the full array of energy sources, the "all of the above"
policy that the Administration once talked about but never fully embraced. Let's note that none of
the Presidential candidates from either party are talking about a balanced energy policy either.
That approach is the only way to replace our failure to communicate with the type of public policy
that transitions us into the future. To borrow from a guy who was pretty successful in communicating
his message to the America people eight years ago, that would be "change we can believe in."
Ken Wells is President of Lifeline Strategies, a Houston-based company that helps clients
manage public policy, branding and safety initiatives.
"... Basically, the overwhelming majority of the shale gas extracted at the Haynesville was done so at a complete loss. So, why do they continue drilling and producing gas in the Haynesville? ..."
"... What we see in the Haynesville Shale play are companies that blindly seek production volumes rather than value, and that care nothing for the interests of their shareholders . The business model is broken. It is time for investors to finally start asking serious questions. ..."
"... Chesapeake is one of the larger shale gas producers in the Haynesville as well as in the United States. According to its recent financial reports, Chesapeake received $1.05 billion in operating cash in the first three-quarters of 2015, but spent $3.2 on capital expenditures to continue drilling. Thus, its free cash flow was a negative $2.1 billion in the first nine months of 2015 . And this doesnt include what it paid out in dividends. ..."
"... The reason these companies continue to produce shale gas at a loss is to keep generating revenue and cash flow to service their debt. If they cut back significantly on drilling activity, their production would plummet. This would cause cash flow to drop like a rock, including their stock price, and they would go bankrupt as they couldnt continue servicing their debt. ..."
"... Basically, the U.S. Shale Gas Industry is nothing more than a Ponzi Scheme. ..."
"... Now that the major shale gas producers are saddled with debt and many of the sweet spots in these shale gas fields have already been drilled, I believe U.S. shale gas production will collapse going forward. If we look at the Haynesville Shale Gas Field production profile, a 50% decline in 4 years represents a collapse in my book. ..."
"... As I stated in several articles and interviews, ENERGY DRIVES THE ECONOMY, not finance. So, energy is the key to economic activity. Which means, energy output and the control of energy are the keys to economic prosperity. ..."
"... The collapse of U.S. shale oil and gas production are two nails in the U.S. Empire coffin. Why? Because U.S. will have to rely on growing oil and gas imports in the future as the strength and faith of the Dollar weakens. I see a time when oil exporting countries will no longer take Dollars or U.S. Treasuries for oil. Which means… we are going to have to actually trade something of real value other than paper promises. ..."
"... Berman has been yelling Ponzi Scheme for years. In his view, all extractive businesses must be Ponzi Schemes. His claims had nothing to do with a prediction of lower NG prices, just lack of reserves. While producers may have been off on the price forecasts, it is obvious from the production numbers that they did a great job in reducing costs and delivering the reserves. ..."
"... I live in PA and drilling is all around me; but the gas companies have stopped opening up new wells because the price of gas fell so low. Meanwhile, a geologist friend says theres enough gas in the Marcellus to last several decades, and theres oil under that. I cant see production coming to a complete halt but, yes, my royalties are also dropping because production fell. ..."
"... I imagine in 10 years from now ZH will still be babbling about the demise of USA. Hell, we managed before shale so whats the big deal. TD gets his rocks from hyperventilating from his fever dreams of US destruction. ..."
"... All that is needed is for the petrodollar to disappear, and believe me, things will get very difficult in the States. Now having said that, the US still has the best innovators in the world, and all that is needed is to bring back manufacturing and scale back globalization a bit. ..."
"... It will be a multi-polar world. Already is to a degree. The only problem I see is if only one country cuts the cake. Regardless, I know that the US has the best innovation and only needs to bring back manufacturing and protect its economy a bit and it will still be a large power. ..."
The U.S. Empire is in serious trouble as the collapse of its domestic shale gas production has begun.
This is just another nail in a series of nails that have been driven into the U.S. Empire coffin.
Unfortunately, most investors don't pay attention to what is taking place in the U.S. Energy Industry.
Without energy, the U.S. economy would grind to a halt. All the trillions of Dollars in financial
assets mean nothing without oil, natural gas or coal. Energy drives the economy and finance steers
it. As I stated several times before, the financial industry is driving us over the cliff.
The Great U.S. Shale Gas Boom Is Likely Over For Good
Very few Americans noticed that the top four shale gas fields combined production peaked back
in July 2015. Total shale gas production from the Barnett, Eagle Ford, Haynesville and Marcellus
peaked at 27.9 billion cubic feet per day (Bcf/d) in July and fell to 26.7 Bcf/d by December 2015:
As we can see from the chart, the Barnett and Haynesville peaked four years ago at the end of
2011. Here are the production profiles for each shale gas field:
According to the U.S. Energy Information Agency (EIA), the Barnett shale gas production peaked
on November 2011 and is down 32% from its high . The Barnett produced a record 5 Bcf/d of shale gas
in 2011 and is currently producing only 3.4 Bcf/d. Furthermore, the drilling rig count in the Barnett
is down a stunning 84% in over the past year.
The Haynesville was the second to peak on Jan 2012 at 7.2 Bcf/d per day and is currently producing
3.6 Bcf/d. This was a huge 50% decline from its peak . Not only is the drilling rig count in the
Haynesville down 57% in a year, it fell another five rigs this past week. There are only 18 drilling
rigs currently working in the Haynesville.
The EIA reports that shale gas production from the Eagle ford peaked in July 2015 at 5 Bcf/d and
is now down 6% at 4.7 Bcf/d. As we can see, total drilling rigs at the Eagle Ford declined the most
at 117 since last year. The reason the falling drilling rig count is so high is due to the fact that
the Eagle Ford is the largest shale oil-producing field in the United States.
Lastly, the Mighty Marcellus also peaked in July 2015 at a staggering 15.5 Bcf/d and is now down
3% producing 15.0 Bcf/d currently. The Marcellus is producing more gas (15 Bcf/d) than the other
top three shale gas fields combined (12.1 Bcf/d).
I have posted the Haynesville shale gas production chart below to discuss why U.S. Shale Gas production
will likely collapse going forward:
What is interesting about the Haynesville shale gas field, located in Louisiana and Texas, is
the steep decline of production from its peak. On the other hand, the Barnett (chart above in red)
had a much different profile as its production peak was more rounded and slow. Not so with the Haynesville.
The decline of shale gas production at the Haynesville was more rapid and sudden. I believe the Eagle
Ford and Marcellus shale gas production declines will resemble what took place in the Haynesville.
All you have to do is look at how the Eagle Ford and Marcellus ramped up production. Their production
profiles are more similar to the Haynesville than the Barnett. Thus, the declines will likely behave
in the same fashion. Furthermore drilling and extracting shale gas from the Haynesville was a "Commercial
Failure" as stated by energy analyst Art Berman in his
Forbes article on Nov 22 2015 :
The Haynesville Shale play needs $6.50 gas prices to break even. With natural
gas prices just above $2/Mcf (thousand cubic feet), we question the shale gas business model that
has 31 rigs drilling wells in that play that cost $8-10 million apiece to sell gas at a loss into
a over-supplied market.
At $6 gas prices, only 17% of Haynesville wells break even (Table 3) and approximately
115,000 acres are commercial (Figure 2) out the approximately 3.8 million acres that comprise
the drilled area of the play.
The Haynesville Shale play is a commercial failure. Encana exited the play in late August.
Chesapeake and Exco, the two leading producers in the play, both announced significant write-downs
in the 3rd quarter of 2015.
Basically, the overwhelming majority of the shale gas extracted at the Haynesville was done
so at a complete loss. So, why do they continue drilling and producing gas in the Haynesville?
The reason Art Berman states is this:
What we see in the Haynesville Shale play are companies that blindly seek production volumes
rather than value, and that care nothing for the interests of their shareholders . The business
model is broken. It is time for investors to finally start asking serious questions.
Chesapeake is one of the larger shale gas producers in the Haynesville as well as in the United
States. According to its recent financial reports, Chesapeake received $1.05 billion in operating
cash in the first three-quarters of 2015, but spent $3.2 on capital expenditures to continue drilling.
Thus, its free cash flow was a negative $2.1 billion in the first nine months of 2015 . And this
doesn't include what it paid out in dividends.
The same phenomenon is taking place in other companies drilling for shale gas in the other fields
in the U.S. This insanity has Berman perplexed as he states this in
another article
from his site :
This has puzzled me because the shale gas plays are not commercial at less than about $6/mmBtu
except in small parts of the Marcellus core areas where $4 prices break even. Natural gas prices
have averaged less than $3/mmBtu for the first quarter of 2015 and are currently at their lowest
levels in more than 2 years.
The reason these companies continue to produce shale gas at a loss is to keep generating revenue
and cash flow to service their debt. If they cut back significantly on drilling activity, their production
would plummet. This would cause cash flow to drop like a rock, including their stock price, and they
would go bankrupt as they couldn't continue servicing their debt.
Basically, the U.S. Shale Gas Industry is nothing more than a Ponzi Scheme.
The Collapse Of U.S. Shale Gas Production Even At Higher Prices
I believe the collapse of U.S. shale gas production will occur even at higher prices Why? Because
the price of natural gas increased from $2.75 mmBtu in 2012 to $4.37 mmBtu in 2014, but the drilling
rig count continued to fall:
As the price of natural gas increased from 2012 to 2014, gas drilling rigs fell 40% from 556 to
333. Furthermore, drilling rigs continued to decline and now are at a record low of 127 . Just as
Art Berman stated, the average break-even for most shale gas plays are $6 mmBtu, while only a small
percentage of the Marcellus is profitable at $4 mmBtu.
Looking at the chart again, we can see that the price of natural gas never got close to $6 mmtu..
the highest was $4.37 mmBtu. Thus, the U.S. Shale Gas Industry has been a commercial failure.
Now that the major shale gas producers are saddled with debt and many of the sweet spots in
these shale gas fields have already been drilled, I believe U.S. shale gas production will collapse
going forward. If we look at the Haynesville Shale Gas Field production profile, a 50% decline in
4 years represents a collapse in my book.
The Two Nails In The U.S. Empire Coffin
As I stated in several articles and interviews, ENERGY DRIVES THE ECONOMY, not finance. So,
energy is the key to economic activity. Which means, energy output and the control of energy are
the keys to economic prosperity.
While the collapse of U.S. shale gas production is one nail in the U.S. Empire Coffin, the other
is Shale Oil. U.S. shale oil production peaked before shale gas production:
This chart is a few months out of date, but according to the EIA's Productivity Reports, domestic
oil production from the top four shale oil fields peaked in April of 2015… three months before the
major shale gas fields (July 2015).
Unfortunately for the United States, it was never going to become energy independent. The notion
of U.S. energy independence was built on hype, hope and cow excrement. Instead, we are now going
to witness the collapse of U.S. shale oil and gas production.
The collapse of U.S. shale oil and gas production are two nails in the U.S. Empire coffin.
Why? Because U.S. will have to rely on growing oil and gas imports in the future as the strength
and faith of the Dollar weakens. I see a time when oil exporting countries will no longer take Dollars
or U.S. Treasuries for oil. Which means… we are going to have to actually trade something of real
value other than paper promises.
I believe U.S. oil production will decline 30-40% from its peak (9.6 million barrels per day July
2015) by 2020 and 60-75% by 2025. The U.S. Empire is a suburban sprawl economy that needs a lot of
oil to keep trains, trucks and cars moving. A collapse in oil production will also mean a collapse
of economic activity.
Thus, a collapse of economic activity means skyrocketing debt defaults, massive bankruptcies and
plunging tax revenue. This will be a disaster for the U.S. Empire.
Papa Roach is correct. Just look at this quote from the article:
As the price of natural gas increased from 2012 to 2014, gas drilling rigs fell 40%
from 556 to 333.
Price has an increase, # rigs falls, but volumes continue with the big increases. The fewer
rigs replaced production declines and increased deliveries. That happened because the tech improved
to get much more hole drilled for the same rig time. Also latterals were able to be extended,
requiring less verticle hole and with the use of the same pad to drill multiple wells. Berman
fails to consider the cost reductions and productivity improvements. Frac jobs that once took
over a week are not done in a few days.
Berman has been yelling Ponzi Scheme for years. In his view, all extractive businesses
must be Ponzi Schemes. His claims had nothing to do with a prediction of lower NG prices, just
lack of reserves. While producers may have been off on the price forecasts, it is obvious from
the production numbers that they did a great job in reducing costs and delivering the reserves.
A NG price in the $4 range makes it pretty profitable for the producers. Relatively affordable
for consumer and energy equiv. to oil at < $30.
Gas has peaked because the number of rigs is off. Most of the gas in North Dakota is still
flared off because it is too cheap to make it worth transporting it. When we start exporting it
in bulk, the price will go up and the supply will go up.
I live in PA and drilling is all around me; but the gas companies have stopped opening
up new wells because the price of gas fell so low. Meanwhile, a geologist friend says there's
enough gas in the Marcellus to last several decades, and there's oil under that. I can't see production
coming to a complete halt but, yes, my royalties are also dropping because production fell.
Exactly. When the market price is below production cost, and even capture cost from wells drilled
primarily for oil, there will be less gas produced. Even in 2014 when the market price for gas
was $2 higher than it is now, it was more cost effective for most wells in the Permian to just
flare it off.
I imagine in 10 years from now ZH will still be babbling about the demise of USA. Hell,
we managed before shale so what's the big deal. TD gets his rocks from hyperventilating from his
fever dreams of US destruction.
All that is needed is for the petrodollar to disappear, and believe me, things will get
very difficult in the States. Now having said that, the US still has the best innovators in the
world, and all that is needed is to bring back manufacturing and scale back globalization a bit.
It will be a multi-polar world. Already is to a degree. The only problem I see is if only
one country cuts the cake. Regardless, I know that the US has the best innovation and only needs
to bring back manufacturing and protect its economy a bit and it will still be a large power.
Are you an anti-commie? Using the term commie as your username is really out of touch.
Maybe only North Korea is communist these days.
That is an outstanding thread on a very high quality site.
If you did not view the video on Haliburton's CobraMax DM BHA that Lenny Masseras (sp?) embedded
in that thread, you may greatly appreciate checking it out.
I think that is the approach Haliburton is pushing for both frac'ing and refrac'ing.
The tsunami of expected bad news is starting. Freeport McMoran announced late last week that it
is immediately idling all 3 of its drillships in the Gulf of Mexico. The 3 are under leases that
extend into 2017 for amounts that average over $500,000 per day. They are recording a charge of
about $1.5 billion IIRC. If they continued to drill with them, they said that their spend would
be double that. So they are trying to conserve cash and also will be trying to negotiate amended
contracts. Today Ultra Petroleum was downgraded to junk as it appears that they will not be able
to meet a $62 million debt payment due in March. Restructuring ahead. Traded at $100 in 2008.
The good news might be that 60 days from now, everyone will realize that either the oil industry
is going away or that prices have to rise. By then, it should be obvious that production is going
to fall significantly.
Today, Michael Rothman [he used to be Merrill Lynch's chief oil analyst for many years dating
back to the at least the early 90's, and who is now on his own] said that after the winter is
over, it will be pretty obvious that supply and demand are in fairly close balance. His prediction
– back to $85 by year end. He always was a very analytical numbers guy. He also said that once
you start to see a draw in inventories, it will be a long time before they start building again.
Today, Pickens called the $26.10 as the bottom, with a double by year end.
In January, China had a record number of tankers under contract to fill storage. As you know,
they are building an oil reserve like the US has. That should be "permanent" storage for the foreseeable
future.
I think that Ron's call of an oil production peak for the 12 month period ending in October
2015 (?) should be good for at least four years, if not forever.
"... Bentek: The average oil production from the Eagle Ford in December was 1.5 million barrels per day. On a year-over-year basis, that is down about 7%, or about 110,000 barrels per day, from December 2014. ..."
"... EIA DPR: The average oil production from the Eagle Ford in December was 1.29 mb/d. That is down 22,4%, or 374 kb/d, from December 2014. ..."
"... According to Bentek, crude oil production in the North Dakota section of the Bakken shale formation of the Williston Basin dipped by less than 1% month over month in December, or about 9,000 b/d ..."
"... According to the EIA DPR, the decline in the Bakken was 19 kb/d . ..."
Oil production from key shale formations in North Dakota and Texas dropped slightly in December
versus November, according to Platts Bentek, an analytics and forecasting unit of Platts, a leading
global provider of energy, petrochemicals, metals and agriculture information.
Oil production from the Eagle Ford was relatively unchanged in December, increasing about 11,000
barrels per day (b/d), or less than 1%, versus the previous month, the latest analysis showed.
This marks the first time since March 2015 that the Eagle Ford shale did not decline. Conversely,
crude oil production in the North Dakota section of the Bakken shale formation of the Williston
Basin dipped by less than 1% month over month in December, or about 9,000 b/d, continuing the
trend of marginal decline that began in the summer.
The average oil production from the Eagle Ford basin in December was 1.5 million barrels per
day. On a year-over-year basis, that is down about 7%, or about 110,000 barrels per day, from
December 2014, according to Sami Yahya, Platts Bentek energy analyst. The average crude oil production
from the North Dakota section of the Bakken in November was 1.2 million b/d, about 6% lower than
year ago levels.
'The small increase in crude production in the Eagle Ford shale is attributed to a slight resurgence
in drilling activity in the region,' said Yahya. 'In December, the number of active rigs in the
Eagle Ford reached 80, an increase of five rigs over the previous month. The brief rebound of
active rigs is likely due to producers balancing their drilling programs and budgets for the fourth
quarter and meeting their goals for wells drilled for the year.'
Recapping the year-on-year production drop in the Eagle Ford shale, Yahya emphasized the importance
of efficiency gains realized in 2015. Back in January of 2015, the Eagle Ford shale utilized over
200 rigs, while now, in January of 2016, the number of active rigs shrunk to under 70 rigs, a
drop of over 65%. And yet, production did not meet a similar fate. Producers back in January of
2015 could drill less than two wells per rig per month, compared to nearly three wells per month
currently.
'It is survival of the fittest: the best and most efficient rigs and crews remain standing
on the field,' Yahya noted. 'The number of active rigs in the Bakken shale formation of the Williston
Basin went from nearly 150 rigs in early 2015 to around 50 rigs currently. At the same time, producers
were able to increase their drilling rates from about 1.5 wells per rig per month to about 2.2
wells per rig per month.'
However, Yahya explained that going forward, crude production would need more than just efficiency
gains to grow.
'Last year, optimization and hedging programs helped production stay largely afloat. But unless
the pricing of the oil barrel improve, producers are in for a difficult year ahead. Based on latest
Platts Bentek forecast data, both the Eagle Ford and the Bakken shales are expected to continue
declining throughout most of the year. Certainly, the availability of wells in backlog inventory
where drilling cost is already sunk would be a helpful factor in partially sustaining production
volumes in both shales.'
'If prices remain sub-$40/barrel and producers are unable to further bring down completion
costs, then they might defer completions until the pricing market makes a comeback,' said Yahya.
Platts Bentek analysis shows that from November 2014 to November 2015, total U.S. crude oil
production has increased by about 265,000 b/d. -------------- It is interesting to compare Bentek data with the latest EIA Drilling productivity report.
According to Bentek, oil production from the Eagle Ford increased 11kb/d versus the previous month.
According to the DPR, it declined 71 kb/d.
Bentek: "The average oil production from the Eagle Ford in December was 1.5 million barrels per
day. On a year-over-year basis, that is down about 7%, or about 110,000 barrels per day, from December
2014.
EIA DPR: The average oil production from the Eagle Ford in December was 1.29 mb/d. That is down
22,4%, or 374 kb/d, from December 2014.
According to Bentek, "crude oil production in the North Dakota section of the Bakken shale formation
of the Williston Basin dipped by less than 1% month over month in December, or about 9,000 b/d"
According to the EIA DPR, the decline in the Bakken was 19 kb/d .
The y-o-y decline, according to bentek was 6% vs. 9.6% in the EIA DPR statistics.
An excellent article-but as someone pointed out above, much of it we already know.
However, what this piece fails to point out are the political consequences of the crash in US
oil and gas production. This is going to be worse than the energy crash itself.
Citizens of the United States, along with just about everyone else in the industrialised world
are in denial mode right now. Everything is fine: gas pumps work and the lights are still on,
what's the problem?
There is an absolute certainty that the energy crisis, if it should manifest itself to any meaningful
degree, is merely a political problem that can be dealt with by voting the right leader into office.
Back in 2011, in the run up to the 2012 presidential election, I wrote the following, (you'll
have to take my word for it):
--–
1……It's not the 2012 election you have to worry about, it's 2016 or 2020.
While a lot of us laugh at this kind of loonytoon politics, millions of desperate people don't.
2……Now look ahead to 2016 or 2020. We've already seen whack-job candidates up for election
as president, luckily they were laughed out of court. In 4 or 8 years time when the economy has
really collapsed, some real godnuts will surface to offer 'solutions' and voters will be ready
to grasp at any form of insanity if it promises 'salvation' and restoration of 'the American Dream'.
----
My only error was that Trump isn't a godnut. He is however a fascist, which extreme religious
type mania requires one to be. He promises to make America "great again" without the slightest
idea of what made America great in the first place.
He, and the millions who believe his rantings, are convinced that we live in an economy supported
by endless cashflow that must of itself deliver endless prosperity. As this article makes clear,
(obvious to anyone willing to think) we live in an economy dependent on endless energy flow.
But very few do think, and the certainty persists that prosperity can be voted into office. It
won't work of course, and if by some insane twist of fate Trump got into office, his empty posturings
will sow the seeds of anarchy as the nation sinks deeper into the mire of energy depletion.
So by 2020, with Trump shown to be impotent, the next incumbent is likely to offer ever more
radical solutions, and the desperate millions will vote him into office as a repeated act of desperation.
The politics of 2020? Almost certainly a theocracy-nothing else will have worked by then. But
prayers will not refill the oilwells either and there will be less and less energy available to
hold the nation together. That makes break up inevitable, despite violent resistance to that breakup.
The cracks are already there along ethnic, religious and geographic lines. Add in the inequalities
of food and water production/distribution (entirely energy dependent) and you have the scenario
for secession into at least 5, maybe 6 separate nation states, during the coming century, or maybe
only a decade or two.
"... Saddam Hussein as the boogie man was a creation of media hype. He was a garden variety psycho-dictator who was completely ruthless in his attempts to hold onto power. But he was our boy. And on one was more shocked than he was when we turned on him. You say you are interested in keeping the oil flowing from Iraq? What was Saddam going to do with it? Drink it? The falling out between Saddam and the Bushes was a personal issue. ..."
"... Stemming from the first Gulf war. He thought that Bush I had his back because of his fight with Iran and the fact that the Kuwaitis were stealing Iraqi oil via horizontal drilling. Of course he was an idiot, but there is little doubt that this is what he thought. Given our support of his regime in their struggle with Iran he had every reason to consider us his ally. The fact that otherwise intelligent people buy into the revisionist history of this period still amazes me after all these years. ..."
"... For instance, the F-35 program alone might pay the extra cost of the oil. And why would a U.S. in a basically defensive posture require an F-35 (or least one that actually worked)? ..."
"... But we get most of our imports from Canada and Mexico. Besides, the exporters will continue to *sell*, just at a higher price. And if we could shave a few hundred billion off the security budget, it would probably be more than enough to offset. ..."
The "Empire" dissolved after the neocons got their war on in Iraq. This exposed the limits of
military power in the 21st century and although we spend more than every other nation on Earth
combined on conventional weaponry we demonstrated for all to see that this is insufficient to
impose your will on a recalcitrant population. A lesson that the right wing in this country has
yet to fully absorb.
"that this is insufficient to impose your will on a recalcitrant population. A lesson that
the right wing in this country has yet to fully absorb."
I would not be so sure and smug about that conclusion. The oil is still flowing, to anybody
with the wherewithal to pay for it.
Do you think it would be flowing freely if Saddam Hussein had been left in power? Do you think
it will flow freely if ISIS is allowed to come to undisputed power in two or three major oil exporting
countries?
There is no good evidence, so far as I can see, to indicate that Uncle Sam, along with a few
friends, will not send as many troops as necessary back to Sand Country to KEEP it flowing, if
necessary.
Those of us who are opposed to right wing type thinking and policies generally fail to recognize
what CAN be accomplished with military power.
It is true that we might have to go back to Iraq, etc, once in a while, but given the choice
of paying that price, and paying the price of doing without a world market in oil, freely traded.
HRC, or Bernie Sanders, or the Trump Chump, or whoever winds up in the White House, pay
the price, again, if necessary, and send the troops. The opposition will go along, as it has gone
along in the past.
Fighting an unpopular war is less of a political problem than dealing with a deep economic
depression, and the inability to import oil would certainly bring on a very deep depression very
quickly indeed. ( And for what it is worth, the msm know which side their bread is buttered on,
and that their existence is based mostly on advertising revenues. No bau, DAMNED LITTLE AD REVENUE!
)
The doves will make a lot of hay about five or ten thousand dead young Americans, but the truth
is we kill that many in automobile accidents alone, as fast or faster than we have gotten them
killed in combat in recent times.
We will finally quit mucking around in Sand Country when there is no longer enough oil left
there to make the mucking around profitable to us, or until oil becomes obsolete. I personally
think the oil will run out sooner than we will learn how to get by with out it.
I may come across as redneck warmonger, but that is not my intent. My intent is to be realistic.
I am a hard core advocate of building renewables , pedal to the metal, from here on out, in large
part to reduce the likelihood of more hot resource wars.
We can't prevent them all, but we can certainly reduce the number THAT MIGHT OTHERWISE HAPPEN.
Yes, such wars are ruinously expensive, but they are still a hell of a lot cheaper than
full blown economic depressions or outright economic collapse.
Saddam Hussein as the boogie man was a creation of media hype. He was a garden variety psycho-dictator
who was completely ruthless in his attempts to hold onto power. But he was our boy. And on one
was more shocked than he was when we turned on him. You say you are interested in keeping the
oil flowing from Iraq? What was Saddam going to do with it? Drink it? The falling out between
Saddam and the Bushes was a personal issue.
Stemming from the first Gulf war. He thought that Bush I had his back because of his fight
with Iran and the fact that the Kuwaitis were stealing Iraqi oil via horizontal drilling. Of course
he was an idiot, but there is little doubt that this is what he thought. Given our support of
his regime in their struggle with Iran he had every reason to consider us his ally. The fact that
otherwise intelligent people buy into the revisionist history of this period still amazes me after
all these years.
Cast your mind back to the early 80's when Iran was the devil that took our hostages and
plucky little Iraq was fighting the good fight against these heathens. I remember a 60 Minutes
segment with Leslie freakin Stahl in the trenches with Saddam damn near worshipping the fool.
Even after he invaded Kuwait Bush wasn't going to do a damn thing about it until Maggie Thatcher
shamed him into it by questioning his manhood. Christ the whole thing is just a sick joke.
But you're not running the numbers: What is your estimate of the additional cost to the U.S. if
there was less of an export market in petroleum?
… and …
How much do you think we could save by not trying to project military power around the globe?
For instance, the F-35 program alone might pay the extra cost of the oil. And why would
a U.S. in a basically defensive posture require an F-35 (or least one that actually worked)?
But we get most of our imports from Canada and Mexico. Besides, the exporters will continue
to *sell*, just at a higher price. And if we could shave a few hundred billion off the security
budget, it would probably be more than enough to offset.
Might not even hurt our balance of payments that much, considering how much money is spent
with foreign contractors in this age of "privatization"
SW, "A lesson that the right wing in this country has yet to fully absorb."
I do not think this process even started. May be with a new POTUS in 2017. And as for foreign
policy Dems are not that different from the right wing. Obama administration actions were from
the playbook of Bush II administration almost 100%. See also
It seems to me the story here is that peak was avoided because 100s of billions in mal-investment
opened up some new production and allowed expensive production to continue. In fact the true total
is in the trillions when you include the global QE that was necessary because of economic collapse
related to FF peak.
ALL the optimist here seem to ignore this fact and believe that high prices
will get things going again and the march toward global growth will resume, "renewables" will
ramp up and the transition will occur.
Can anyone flesh out this fantasy world a bit more? How does a more expensive everything world
translate to an economy that can thrive and in fact transition? There is simply no historical
precedent for this and indeed the physical world guarantees it can't happen. Has everyone just
read too many sic-fi novels and are unable to see things any other way?
More likely is massive deflation where everything doesn't get more expensive. In fact it gets
less expensive but no one can afford it. How in this kind of reality does everything just cruz
along and eventually transition? None of you flesh this out in any realistic way that holds water.
likbez,
Jef,
"It seems to me the story here is that peak was avoided because 100s of billions in mal-investment
opened up some new production and allowed expensive production to continue. In fact the true total
is in the trillions when you include the global QE that was necessary because of economic collapse
related to FF peak. "
Good point. Thank you --
As Arthur Berman aptly said: "Shale is not a revolution, it's a retirement party".
But some new technologies were also developed as they should such as continental fracking and long
horizontal drilling as well as deep sea subsurface pumps, better platforms, etc), a better prediction
where oil can be, which cuts the number of dry holes and allow finding small deposits.
So there was some technological progress too out of this financing bonanza. Not all those billions
of "unlimited financing bonanza" were wasted.
IMHO it was like a mini-replay of subprime mortgages in "subprime oil" domain. When any company "with
live breath" could get a loan or sell junk bonds.
That definitely alloed the USA "prolong the agony" and postpone the next recession. But on a negative
side it destroyed conservation efforts creating an SUV boom in the USA, drop of sales of EV and hybrids
cars, almost completely stop of transitioning to natural gas of city public transportation (buses)
and other negative for oil conservation developments.
In this sense current dramatic drop of oil prices due to condensate glut , Saudis, Wall Street games,
or whatever was a the "Last Hurrah", just postponed facing cruel reality for, most probably, three
years or so (AlexS now thinks that more then that).
This article is based on the EIA's Monthly
Energy Review which was released on 27th January and which states November 2015 production was
9,181,000 bbls/day. Oddly, the Petroleum & Other Liquids monthly data which was released on 29th
January says November 2015 production was 9,318,000 bbls/day. Which one is the one the EIA intend
us to use?
As I have said before the US Energy Information Agency (the EIA) has a thankless task, compiling
data from thousands of oilfields and operators to come up with an estimate of how much oil the
USA actually produces. Some data is timely and accurate, Alaska is a case in point, some, not
so much.
So every month as well as giving us a new estimate for the month just passed, we get revisions
of the historic data. It is instructive to take a look at that data to see how far off the early
estimates were. Big revisions are a sign of a dislocation in the system, a sign that the old rules
of thumb aren't working any more. The EIA has suffered from this phenomenon on the way up, as
US shale output outstripped any reasonable estimates of how it might perform; and now on the way
down, as somehow the whole US oil industry did a passable impersonation of Wile E. Coyote, well
beyond the edge of the cliff but somehow defying gravity.
Monthly Energy Review data for November and December is forecast.
MER data for the most recent 2 month has never been reliable.
By contrast, Petroleum Supply Monthly numbers released on January 29th are more correct, in my
view.
There were some revisions compared with the previous PSM: September 2015 -11 kb/d;
October 2015 +23 kb/d.
The data for November was only -2 kb/d compared with the January STEO estimate.
In general, the EIA has been making mostly upwards revisions for 2015 C+C production
Been a while since I responded to one of your comments. That being said, we must
remember, MONEY = ENERGY. However, it's not that we need more money to get more drilling, we need
MORE DEBT. As Gail Tverberg implies in her recent articles, we are now at a conundrum. We can't
afford to service the debt we have right now, so it's impossible to add even more debt to bring
on more energy.
This is the reason why we have Zero & Negative Interest Rates. The U.S. will never again have
a normal interest rate, unless it gets rid of all its debt. And if the debt is forgiven, then
collapse happens because the other side of that debt was assets in the public and wealthy hands.
Thus, we are now facing the COLLAPSE of DEBT… which means we can't really afford to bring on
more expensive energy. Even when the price of NatGas increased from 2012-2014, the drilling rig
count fell considerably.
To really turn the Shale Gas Industry around, I would imagine a price of $7-$8 is needed. Don't
know if we ever get there again due to the massive debt already in the system.
Don't defaults on private debt happen all the time? That is the price one pays for
buying junk debt, high risk in exchange for high interest payments.
There is a simple solution to low interest rates. More debt. If people are willing to lend
to a government at zero or negative interest rates, then roll over old debt and replace it with
low (or no) interest debt.
In fact economic theory would suggest in an economy at less than full employment more government
borrowing at low interest rates is very sensible. Increase aggregate demand by investing in water
systems, roads, bridges, rail, grid improvements, and anything else deemed useful by society (education
maybe). The increased demand leads to higher income and more profitable businesses that demand
more loans.
The increased borrowing drives up interest rates to normal levels at which point the government
stops borrowing and gradually reduces the level of public investment (cutting spending) while
gradually raising taxes if necessary to balance the budget.
All that is needed is a functioning government (rather than what currently exists in the US).
I imagine a parliamentary government with enlightened leadership (Canada might be a good example)
could implement such a plan.
I believe the debt defaults that are coming are much bigger than we have ever experienced.
The day the U.S. Treasury Market defaults will be the BIG ONE. And it's coming. I am not saying
it's coming this year or next… but probably by 2020.
Regardless, Japan stunned the markets on Friday by announcing Negative Interest Rates. This
was why we saw a surge in World Indices on Friday. However, this is not a long-term solution.
When you hit Negative Interest Rates, it's hard to go too negative. So, there is very little
room to continue dropping interest rates. All that remains is QE to infinity. But, again… this
next QE that is done will likely cause serious inflation.
The U.S. Financial System will likely collapse more suddenly than most realize.
QE will only cause inflation if the economy is doing well.
Very unlikely that the US would default on debt, at low interest rates the US government should
try to spur investment through tax breaks or public private partnerships, or borrow to offer low
interest refinancing of student loans, there are many possibilities for productive investments
that can be undertaken when private business is unwilling to invest.
The debt situation in the US is really not as bad as you think.
I respectfully disagree about the debt not being a problem.
It can be defaulted on, but the consequences for that are generally severe especially for the
huge debts we have.
Our chances of outgrowing our debt is very slim (equivalent of this generation robbing future
generations of funds).
Unless we learn to live within our means (really too late for that),
we are in for a bad lesson.
BTW- I suggest seeing the movie The Big Short.
US assets about $200 billion and total debt about $45 billion. A 25% debt to assets
ratio is not a big problem.
Debt to GDP around 250%, also not a problem in my view.
I agree lower would be better, if the economy continues to improve debt will decrease at the
federal level as tax revenue will increase and spending on unemployment benefits and welfare will
decrease.
Jef you have your head up your own backside so far you will never see daylight.
Dennis has FORGOTTEN more than you can ever hope to learn.
He is a mainstay of this forum, and when Ron retires, which must happen before too long, considering
his age, if ANYBODY keeps it going, perhaps with a new name, you can bet your ass Dennis will
be one of the most important people involved.
There would be no one who could buy it, among other
preposterous implausibilities.
Therefore those assets can't be worth 200 trillion marked-to-market.
An asset is only worth what someones pays for it at purchase time. Otherwise, it is an estimate
of what it is worth.
I don't question that you can estimate that usa total assets are 200 trillion.
Unless Jesus multiplies the loaves, fishes and gold nuggets those assets cannot be exchanged
for 200 trillion dollars.
Maybe we can sell the US military to China! They would be possibly the only country that could
afford it based on what those assets are being valuated at.
Debt is accurate to the penny. It is a legal obligation. And interest rates will go up due
to the laws of thermodynamcs. There is no such thing as a free lunch .
I wasn't just talking about government debt. There is corporate debt, household debt, farmer debt,
pension fund debt, etc.
Lets not even get into the groundwater debt.
Maybe you are comfortable with living far out on the edge of the thin ice, but I'm just not.
Private debt is a huge problem. The best way to deal with it is… for the government to convert
it into government debt and then inflate it away. Money problems are simple if you have a government
willing to deal with them.
Real resource problems like global warming and peak oil are another
matter entirely and much harder.
If there is secular stagnation due to low labor productivity growth,
interest rates will never rise and it may be that deflation is more of a problem than inflation.
If there is deflation then many private debts will be defaulted on. Yes debts are a legal obligation,
bankruptcy is how the defaults are dealt with legally.
If we assume the debts are held mostly by the wealthy and liabilities belong mostly to poorer
folks, the defaults redistribute wealth from rich to poor.
Now in a more normal economy there is at least some inflation so that the real value of debt
in inflation adjusted money is reduced over time, this has been true since fiat money has been
used.
Keep in mind there is a distinction between the real economy and the monetary economy. Thermodynamics
applies to the real economy, but not so much to the monetary part.
Think of the price assigned to a good at an auction, how does thermodynamics apply there? Price
is an arbitrary number assigned to an object based on the supply of and demand for that object,
thermodynamics and physics have very little to do with it. Price discovery is a social interaction.
The end of American growth is here. See economist Robert Gordon's magisterial 768 page new
book. Total factor productivity has been falling since the 70's.
His opinions are not shared by many economists, I agree that growth in advanced economies
will be slower, that is a good thing.
The unequal wealth distribution will need to be addressed, at some point the poorer members
of society may get behind a populist that advocates real change to address the problem. The internet
could potentially link many people together to form such a movement.
It's not possible for the US Treasuries to default, unless a deranged President (Trump?) *decides*
to make them default.
What is possible is that the US will simply print money to pay interest
on the Treasuries. This could cause inflation, but if the economy is in bad shape, it won't.
The debt situation in the US is really not that dire.
Total assets of the US were about 200 trillion in 2009. Total federal and private non-financial
debt was about $43 trillion in 2014 ($36 trillion in 2009) so debt to assets is only about 25%.
There is no way you could liquidate all those 200 trillion of "assets".
Therefore their value is not 200 trillion.
The debt is accurate to the penny and a legal obligation.
An asset is only worth what someone can pay for it. Who has 200 trillion laying around?
Interest rates have hit rock bottom. There is no where to go but up.
When they start going up, all the governments, companies, entities that have been playing the
"roll your debt over to lower interest rates" games will be in deep shit.
It will be "roll your debt over to higher interest rates that you haven't budgeted for" game.
When interest rates increase it will be because the economy is improving.
Government revenues will be higher so some debt can be retired, and corporate profits will be
higher so higher interest rates can be paid. Higher interest rates are the sign of a more robust
economy. So we disagree and asset values matter. That is why the house is appraised.
Probably very little debt has been retired, it mostly gets rolled over. The debt grows
more slowly than the economy so debt to GDP decreases. After World War 2 government debt was high
(as a percentage of GDP) and has fallen until 1973 and then began to rise again. See
I agree that interest rates will influence the price of the asset for the reason you
say.
Consider the following thought experiment, how low would the price go due to higher interest
rates? It would depend on the condition of the house and the cost to build something like it plus
land cost in a similar neighborhood in the vicinity.
Interest rates will influence the asset value, but they will not determine it, it will be mostly
a matter of supply and demand in the housing market.
Also keep in mind the interest rates will affect the value of all houses and the price of a
house is a relative thing, how much is house A relative to house B.
I agree wealth distribution is a big problem. The simple solution is elimination
of tax loopholes and tax shelters, higher estate taxes (on inherited assets over 1 million adjusted
for inflation), and more progressive income tax (similar to pre-1965 US tax code adjusted for
inflation).
If the private debts are defaulted on, that would accomplish a lot of wealth redistribution
right there.
"... The U.S. Empire is in serious trouble as the collapse of its domestic shale gas production has begun. This is just another nail in a series of nails that have been driven into the U.S. Empire coffin. ..."
"... Unfortunately, most investors don't pay attention to what is taking place in the U.S. Energy Industry. Without energy, the U.S. economy would grind to a halt. All the trillions of Dollars in financial assets mean nothing without oil, natural gas or coal. ..."
"... As I stated several times before, the financial industry is driving us over the cliff. ..."
The U.S. Empire is in serious trouble as the collapse of its domestic shale gas production has
begun. This is just another nail in a series of nails that have been driven into the U.S. Empire
coffin.
Unfortunately, most investors don't pay attention to what is taking place in the U.S. Energy
Industry. Without energy, the U.S. economy would grind to a halt. All the trillions of
Dollars in financial assets mean nothing without oil, natural gas or coal. Energy drives
the economy and finance steers it. As I stated several times before, the financial industry
is driving us over the cliff.
"... Demand growth is projected to slow down anyway, but not necessarily due to high oil prices. ..."
"... What happens to the price of oil depends on the change in the supply of oil relative to how demand for oil changes over time. How this plays out in the future is difficult to predict at best. ..."
I think that, with the continued decline in oil use per unit of GDP, $90-100/bbl by
2020-2025 should not have a significant negative impact on global economic growth and oil demand.
Demand growth is projected to slow down anyway, but not necessarily due to high oil prices.
You may be correct that oil prices may not be the main reason for a reduction in demand,
it will be a combination of slower population growth, maturing economies, and reduced oil intensity
(oil use per unit of GDP). The oil price is simply the mechanism that allocates the oil to its
most efficient uses (when externalities are properly taxed and the subsidies for oil use are minimized
so the market is allowed to work.)
What happens to the price of oil depends on the change in the supply of oil relative to how
demand for oil changes over time. How this plays out in the future is difficult to predict at
best.
Re: Ron's Ronpost . . . anyone have a source for NGL prices?
Previous Ronpost - Doug noted that
in his experience every geologist in China doesn't have their words filtered by Beijing. So there
is truth to be found in provincial quotes of things oil related. If the matter became more overtly
national security related, of course that would change.
I'm reminded of how often EIA and NoDak's DMR have quoted numbers in conflict with each other
of late. Not that this need be conspiratorial. We somewhat know EIA numbers come from a model that
likely is as worthless as most. This would be a case of provincial data having not been . . . filtered,
or smoothed, or seasonally adjusted or whatever else is the change mechanism du jour.
"... I would understand the US empire as an economic domination as reflected in the dollars role in the worlds economy. ..."
"... The only constant is that the empire has always been backed by military supremacy. ..."
"... As Colonel Bacevich noted the USA did not fundamentally change its foreign policy after the Cold War, and remains focused on an effort to expand its control and propagate neoliberalism all over the world, crushing any regime that offer resistance. ..."
"... As the only surviving superpower at the end of the Cold War, the U.S. should focus on world dominance according to former Under Secretary of Defense for Policy Paul Wolfowitz in 1991. His so called Wolfowitz doctrine was a blueprint for Iraq, Libya and Syria invasions and a set of neoliberal color revolutions accomplished by the USA since 1991. ..."
"... May be neoliberal hegemony is a better term then empire. The influential set of US politicians are called neoconservatives (that includes Jeb!, Hillary, Rubio and Cruz, but not Trump). Foreign policy of all administrations since Clinton was based on the recommendations of the Project for the New American Century https://en.wikipedia.org/wiki/Project_for_the_New_American_Century ..."
"... I oppose military interventions in foreign countries as a question of principle. I did oppose the second Gulf war, and I did oppose the intervention in Libya. My country participated in both in a supporting role. I guess my position has been vindicated by developments. ..."
"... Ron, the USA does have an oil policy. Its called The Carter Doctrine. I can think of only one reason why the USA cares about the Persian Gulf. Unless theres something other than oil behind the Carter Doctrine then Id say its an oil policy within foreign policy. ..."
"... Come on, Ron. The issue in the first Iraq war was Kuwait doing horizontal drilling under the border. Iraq felt that this was tantamount to stealing its oil ..."
I would understand the US empire as an economic domination as reflected in the dollar's role
in the world's economy.
From the Spanish empire that was all about land dominance to the British empire that was built
on commerce and the US empire on economic dominance, there has been an evolution of the empire
concept as the world changed. The only constant is that the empire has always been backed
by military supremacy.
It seems I did not explain myself. The dollar's role in the world economy is a reflection of the
US economic dominance, not its basis. Quite a few countries have had their currencies pegged to
the dollar or their economies directly dollarized.
Military dominance is not required to enforce the role of the dollar, but to command the respect
that makes it difficult to be challenged. US has used its military dominance to enforce its oil
policy through several oil wars and interventions.
"According to academics from the Universities of Portsmouth, Warwick and Essex, foreign intervention
in a civil war is 100 times more likely when the afflicted country has high oil reserves than
if it has none. The research is the first to confirm the role of oil as a dominant motivating
factor in conflict, suggesting hydrocarbons were a major reason for the military intervention
in Libya, by a coalition which included the UK, and the current US campaign against Isis in northern
Iraq."
US Oil policy has been to guarantee an adequate supply of oil from the Middle East at a stable
affordable price. That has always been the motivation behind interventions, and alliances policy
with the Middle East countries. All the rest is just lies for public consumption.
Javier says he is smart – "foreign intervention in a civil war is 100 times more likely when the
afflicted country has high oil reserves."
Right with respect to the US? Let's see – Korea in 1950; Vietnam in 1965; Nicaragua in 1980's;
all "civil wars" but, NO OIL. Grenada in 1980's – not a "civil war" and NO OIL.
Iraq/Kuwait – Not a "civil war." Iraq in 2003 – not a "civil war." Afghanistan 2002 – "maybe"
a civil war, but NO OIL.
Clueless, to have a clue about someone's position perhaps you should at least glance at the information
provided on which it is based.
From the third link (scientific article):
"The US for most of the period studied here provides an example at the high end of the
oil dependence spectrum (i.e., high reserves, high demand for oil). Consistent with this we
see recurrent US involvements in the civil wars and internal affairs of Angola from 1975 until
the end of the cold war. The US was the country with the highest demand for oil during this
period, and it was known from the 1970s that Angola had oil reserves. Oil in Angola was first
discovered in 1955, and many US corporations, like Chevron, have been operating in the oil-rich
Cabinda region for more than fifty years. The US has also intervened in a number of other countries
with proven large oil reserves, such as in Guatemala, Indonesia and the Philippines over the
period covered by our dataset (1945-1999)."
And no, I do not claim to be smart. That is something that it is either recognized by others
or it isn't. Instead of claiming to be smart you should start acting likewise.
As Colonel Bacevich noted the USA did not fundamentally change its foreign policy after
the Cold War, and remains focused on an effort to expand its control and propagate neoliberalism
all over the world, crushing any regime that offer resistance.
Skeptics of your position should read his book AMERICAN EMPIRE
As the only surviving superpower at the end of the Cold War, the U.S. should focus on world
dominance according to former Under Secretary of Defense for Policy Paul Wolfowitz in 1991. His
so called "Wolfowitz doctrine" was a blueprint for Iraq, Libya and Syria invasions and a set of
neoliberal color revolutions accomplished by the USA since 1991.
May be neoliberal hegemony is a better term then empire. The influential set of US
politicians are called neoconservatives (that includes Jeb!, Hillary, Rubio and Cruz, but not
Trump). Foreign policy of all administrations since Clinton was based on the recommendations of
the Project for the New American Century
https://en.wikipedia.org/wiki/Project_for_the_New_American_Century
Compared with traditionalist conservatism and libertarianism, which are non-interventionist,
neoconservatism emphasizes confrontation, and regime change in countries hostile to the interests
of the United States. It is extremely jingoistic creed. The unspoken assumptions of neocons ideology
have led the United States into a senseless, wasteful, and counter-productive posture of perpetual
war. It is a foreign policy equivalent to Al Capone idea that "You can get much farther with a
kind word and a gun than you can with a kind word alone". It is very close to the idea that "War
is a natural state, and peace is a utopian dream that induces softness, decadence and pacifism."
The problem here is that it's the person who promotes this creed can be shot. Of course neocons
are chickenhawks and prefer other people die for their misguided adventures.
John McGowan, professor of humanities at the University of North Carolina, states, after an
extensive review of neoconservative literature and theory, that neoconservatives are attempting
to build an American Empire, seen as successor to the British Empire, its goal being to perpetuate
a Pax Americana. As imperialism is largely considered unacceptable by the American media, neoconservatives
do not articulate their ideas and goals in a frank manner in public discourse but use "noble lie"
approach.
== quote ==
Frank neoconservatives like Robert Kaplan and Niall Ferguson recognize that they are proposing
imperialism as the alternative to liberal internationalism. Yet both Kaplan and Ferguson also
understand that imperialism runs so counter to American's liberal tradition that it must… remain
a foreign policy that dare not speak its name… While Ferguson, the Brit, laments that Americans
cannot just openly shoulder the white man's burden, Kaplan the American, tells us that "only
through stealth and anxious foresight" can the United States continue to pursue the "imperial
reality [that] already dominates our foreign policy", but must be disavowed in light of "our
anti-imperial traditions, and… the fact that imperialism is delegitimized in public discourse"…
The Bush administration, justifying all of its actions by an appeal to "national security",
has kept as many of those actions as it can secret and has scorned all limitations to executive
power by other branches of government or international law.
Clueless, you forgot Somalia, no oil. All those places shoots the hell out of that "100 times
more likely" bullshit.
US Oil policy has been to guarantee an adequate supply of oil from the Middle East
at a stable affordable price. That has always been the motivation behind interventions,
and alliances policy with the Middle East countries.
Yeah right. That's the reason we went to war with Iraq when they tried to confiscate Kuwait?
That being said, even if it was, just who the hell was the beneficiary of keeping Saddam from
invading Saudi Arabia and eventually taking over the entire Middle East oil supply?
Was it only the US? Or perhaps every importing nation on earth was just as much the beneficiary
as was the US. We footed the bill and sacrificed the lives but Germany, Spain, Brazil, Japan,
South Korea, and all of Europe got the benefit.
If the US has a policy of trying to stabilize the world, then all the rest of the civilized
world outside the Middle East is the beneficiary including your home country Javier. Or
perhaps you would rather we let Saddam have Kuwait… then Saudi Arabia, then then the UAE, then
Oman, then…..
You know, sometimes this "knock America" bullshit just starts to wear thin.
"All those places shoots the hell out of that "100 times more likely" bullshit."
If you are going to contradict a published scientific study you should do it on something
more than your opinion, don't you think? The article analyzes hundreds of civil wars between
1945-1999 for third party interventions. Military interventions are very expensive. Being a
country with significant oil reserves and oil exports makes a foreign military intervention
a lot more likely. Had Kuwait not have any oil I doubt a lot of countries would have bothered.
Regarding "knock America" I do not espouse any of that. I have not criticized US policy.
I just have stated what it is. I am a realist, but pardon me for not thinking that America's
main interest is to improve the world. Any country is primarily interested in defending its
interests and USA is no different. My country being in the same alliance both benefits and
pays a price, and stays in that alliance because it suits its interests.
If you are going to contradict a published scientific study you should do it on something
more than your opinion, don't you think?
I did, there were 5 civil wars listed that had nothing to do with oil. 100 to 1 would mean
there had to be 495 that did deal with oil.
The article analyzes hundreds of civil wars between 1945-1999 for third party interventions.
Welllllll, I have a problem here Javier. A quote from the article:
The report's starkest finding is that a third party is 100 times more likely to intervene
when the country at war is a big producer and exporter of oil than when it has no reserves.
That is pure bullshit. Of the top 28 countries, other than the US, all those that produce
more than half a million barrels per day, only two, Iraq and Libya, did the US have any interface
with.
But the article goes on to say:
The study, published in the Journal of Conflict Resolution, analysed 69 civil wars
between 1945 and 1999,
69 ain't hundreds Javier. And of all the countries in the world, only 29, counting the USA,
that produced more than half a million barrels per day. And only two had American intervention.
They are listed below along with the oil they produced in June 2015. The numbers are thousand
barrels per day.
10,240 Saudi Arabia
10,234 Russia
9,296 United States
4,409 China
4,325 Iraq
3,608 Canada
3,300 Iran
2,820 UAE
2,550 Kuwait
2,500 Venezuela
2,396 Brazil
2,283 Mexico
2,220 Nigeria
1,850 Angola
1,595 Norway
1,567 Kazakhstan
1,537 Qatar
1,370 Algeria
1,010 Colombia
993 Oman
880 United Kingdom
867 Azerbaijan
822 Indonesia
771 India
620 Malaysia
541 Ecuador
534 Argentina
511 Egypt
410 Libya
"In the 344 armed interventions in civil wars that took place from 1945 to 1999"
There can be military interventions from multiple countries in a single war as we have seen.
The data they have used is from other independent studies. Perhaps their study or their
model is wrong, but I don't see much reason to doubt their result. We all know about resource
wars, and oil is the main resource. I don't see that their result is controversial.
Our interest is your interest.
Mostly yes, but I oppose military interventions in foreign countries as a question of
principle. I did oppose the second Gulf war, and I did oppose the intervention in Libya. My
country participated in both in a supporting role. I guess my position has been vindicated
by developments.
Ron, the USA does have an oil policy. It's called The Carter Doctrine. I can think of only
one reason why the USA cares about the Persian Gulf. Unless there's something other than oil
behind the Carter Doctrine then I'd say it's an oil policy within foreign policy.
Come on, Ron. The issue in the first Iraq war was Kuwait doing horizontal drilling under
the border. Iraq felt that this was tantamount to stealing its oil
When Saddam complained to the Bush administration, he was told that the U.S. regarded
this as purely an inter-Arab affair. The fact that Bush immediately jumped on the invasion
as an excuse for war strongly suggests that Iraq was being "set up".
Or, Kuwait was being "set up" in order to agree to a big U.S. military presence. Either
interpretation suggests a conscious extension of "empire".
The alleged Syrian peace process now enters its Geneva charade stage. This could last
months; get ready for lavish doses of posturing and bluster capable of stunning even Donald Trump.
The notion that Geneva may be able to impersonate Damascus in a suit-and-tie pantomime
is ludicrous to begin with. Even the UN envoy, the sartorially superb
Staffan
de Mistura, admits the Sisyphean task ahead - even if all relevant players were at the table.
Then we have Syrian "opposition figure" George Sabra announcing that no delegation from the
Riyadh-based High Negotiations Committee will be at the table in Geneva. As if Syrians needed
an "opposition" instrumentalized by Saudi Arabia.
So in the interest of providing context, here's an extremely concise recap of recent, crucial
facts on the Syrian ground which the "new capital" Geneva may ignore at its own peril.
Let's start with last summer, when Iranian Quds Force superstar commander Qasem Soleimani laid
down the law, in person, in Moscow, establishing without a doubt the grim situation across the
Syrian theater of war.
Essentially Soleimani told the Kremlin and Russian intelligence that Aleppo might be about
to fall; that Jabhat al-Nusra was at the doors of southern Damascus; that Idlib had fallen; and
Latakia - home to Russia's naval base at Tartus - would be next.
One can imagine the effect of this jolt of realpolitik on President Putin's mind. That clinched
his resolution to stop the fall of Syria, and prevent it from becoming a Libyan remix.
The Russian Air Force campaign turned out to be the ultimate game-changer.
It is in the process of securing the Damascus-Homs-Latakia-Hama-Aleppo network - the urban, developed
Western Syria that holds 70 percent of the country's population. ISIS/ISIL/Daesh and/or Jabhat
al-Nusra, a.k.a. al-Qaeda in Syria, have zero chances of taking over this territory. The rest
is mostly desert.
Jaysh al-Islam - a motley crew weaponized by Saudi Arabia - still holds a few positions north
of Damascus. That's containable. The country bumpkins in Daraa province, south of Damascus, could
only make a push towards the capital in an impossible 1991 Desert Storm context.
"Moderate rebels" - that Beltway concoction - did try to hold Homs and Al-Qusayr, cutting off
the resupply of Damascus. They were repelled. As for the gaggle of "moderate rebels" who took
all of Idlib province, they are being pounded mercilessly for four months now by the Russian Air
Force. Aleppo's southern front is also being secured.
Don't bomb "our" rebels
It's easy to pinpoint who's livid with all the Russian action: Saudi Arabia, Turkey and - last
but not least - the 'Empire of Chaos', all at the table in Geneva.
Jabhat al-Nusra - remote-controlled by Ayman al-Zawahiri - is intimately linked to a gaggle
of Salafi-jihadists in the Saudi-sponsored Army of Conquest, as well as tactically allied with
myriad outfits nominally grouped in the nearly extinct Free Syrian Army (FSA).
The CIA, using the Saudis for plausible deniability, fully weaponized "vetted" FSA outfits,
which received, among other things, TOW anti-tank missiles. Guess who "intercepted" virtually
all the weapons: Jabhat al-Nusra.
The follow-up was nothing short of hilarious: Washington, Ankara and Riyadh furiously denouncing
Moscow for bombing their "moderate rebels" and not ISIS/ISIL/Daesh.
Slowly but surely, the Syrian Arab Army (SAA), parallel to the Russian offensive, retook the
initiative. The "4+1" - Russia, Syria, Iran (Special Forces, many of them from Afghanistan), Iraq,
plus Hezbollah - started coordinating their efforts. Latakia Province - which hosts not only Tartus
but the Khmeimim Russian airbase - is now under total control by Damascus.
And that brings us to Ankara's nightmares. Russian Air Force smashed most of Ankara's Turkmen
proxies - heavily infiltrated by Turkish fascists - in northwest Syria. That was the key reason
for Sultan Erdogan's desperate move of shooting down the Su-24.
It's by now clear that the winners, as it stands, on the ground, are the "4+1", and the losers
are Saudi Arabia and Turkey. So no wonder the Saudis want at least some of their proxies at the
negotiating table in Geneva, while Turkey tries to change the subject by barring the Syrian Kurds:
these are accused of being terrorists, much more than ISIS/ISIL/Daesh.
Exit Geneva, enter Jarabulus
As if this was not messy enough, US 'Think Tankland' is now spinning there is an "understanding"
between Washington and Ankara for what will be, for all practical purposes, a Turkish invasion
of northern Syria, under the pretext of Ankara smashing ISIS/ISIL/Daesh in northern Aleppo.
This is utter nonsense. Ankara's game is three-pronged; prop up their heavily battered Turkmen
proxies; keep very much alive the corridor to Aleppo - a corridor that crucially includes the
Jihadi Highway between Turkey and Syria; and most of all prevent by all means necessary that YPG
Kurds bridge the gap from Afrin to Kobani and unite all three Syrian Kurd cantons near the Turkish
border.
None of this has anything to do with fighting ISISL/ISIL/Daesh. And the nuttiest part is that
Washington is actually assisting the Syrian Kurds with air support. Either the Pentagon supports
the Syrian Kurds or Erdogan's invasion of northern Syria; schizophrenia does not apply here.
A desperate Erdogan may be foolish enough to confront the Russian Air Force during his purported
"invasion". Putin is on the record saying response to any provocation will be immediate, and lethal.
To top it off, the Russians and Americans are actually coordinating airspace action in northern
Syria.
This is bound to be the next big thing, fully eclipsing the Geneva pantomime. The YPG and its
allies are planning a major attack to finally seize the 100-kilometer stretch of the Syria-Turkey
border still controlled by ISIS/ISIL/Daesh - thus reuniting their three cantons.
Erdogan was blunt; if the YPG pushes west of the Euphrates, it's war. Well, looks like war
then. The YPG is getting ready to attack the crucial towns of Jarabulus and Manbij. Russia most
certainly will aid the YPG to reconquer Jarabulus. And that will directly pit - once again - Turkey
against Russia on the ground.
Geneva? That's for tourists; the capital of the Syrian horror show is now Jarabulus.
Generally pretty standard replies, but juxtaposition of views of optimists (Flynn, Cohen) vs.
pessimists
(Gheit) is somewhat interesting. I wonder what Gheil is smoking with such analysis as "We expect
flat to small declines in supply as capital-expenditure cuts will be largely offset by efficiency gains
and better allocation of capital." Most of possible improvement were already realized in 2015. The basket
is empty.
Notable quotes:
"... Now everybody's going to be afraid to bring production back on, which means they're probably not going to act quickly enough when prices come back up. ..."
"... We don't think the current price levels are sustainable for medium-term growth of supply in order to meet the demand that's been spurred on by these lower prices. Therefore, we expect we'll see an adjustment back up into the $60 range in the second half of next year, and that that price level is going to be required to have enough supply to meet demand. ..."
"... The simulative actions by the government will provide support to demand, and it could surprise to the upside. ..."
Over the past year, oil has been having a rough and ugly ride. From a peak of more than $106 a
barrel last June to a trough of less than $38 this August, oil prices faced one of their worst declines
in modern history in 2014 and 2015. Oil companies responded by sharply reducing their investments
in new U.S. wells, but is it enough to finally stabilize the market?
ETF Report sat down with three experts to answer that question and get their insights on other
key issues facing the oil market heading into 2016: Phil Flynn, an analyst at futures brokerage Price
Futures Group; Michael Cohen, head of energy markets research at Barclays; and Fadel Gheit, managing
director and senior analyst covering the oil and gas sector at Oppenheimer & Co.
Where do you see oil prices going in 2016?
Phil Flynn: We'll see prices rebound because you're going to see a massive
cut in capital spending that's already started to take its toll on supplies. One of the worst
things that happened is that little double dip that we had in oil prices. Prices recovered in
July and they brought back all these oil rigs and everybody thought the worst was over, but then
prices crashed again because of China and Europe and Iran. Now everybody's going to be afraid
to bring production back on, which means they're probably not going to act quickly enough when
prices come back up. Low prices will stimulate demand at a time when production is cut back.
I think we'll average $57 next year, but see a spike as high as $80.
Michael Cohen:We don't think the current price levels are sustainable
for medium-term growth of supply in order to meet the demand that's been spurred on by these lower
prices. Therefore, we expect we'll see an adjustment back up into the $60 range in the second
half of next year, and that that price level is going to be required to have enough supply to
meet demand.
Fadel Gheit: We expect oil price volatility to continue in a narrow range
below $50.
What's your outlook for supply? Is the recent drop in U.S. production something that'll
continue?
Flynn: It will drop by 1 million barrels per day. I think most people are
behind the curve on those estimates. We're already seeing evidence of the decline in Cushing,
Oklahoma, where supplies are falling faster than anticipated.
Cohen: Over the next two to three months, we're likely to see supply continue
to decline. However, once the market realizes it needs U.S. shale output to continue to grow at
a decent pace of 100,000 or 200,000 barrels a day per year, there will be a price impact later
on in 2016. Once that happens, you could get U.S. crude output back up to 9.6 million or 9.7 million
barrels a day. We don't really see a scenario in which U.S. production declines steeply, because
there will be a market impact from that. Most of the U.S. producers that are sitting on a backlog
of wells that they want to complete and bring on will do so at higher prices. By doing that, they'll
support overall output and mitigate the decline from existing fields, and there won't be a steep
trajectory down.
Gheit: We expect flat to small declines in supply as capital-expenditure
cuts will be largely offset by efficiency gains and better allocation of capital. Production from
new major project startups will offset shale production declines.
Demand is growing faster this year thanks to lower prices, but will the slowdown in China
and emerging markets derail that next year?
Flynn: China definitely is slowing, but we haven't really seen that in its
energy demand as of yet. The simulative actions by the government will provide support to
demand, and it could surprise to the upside.
Cohen: If China grows much slower than the 5 to 7% the market expects, that
could have ramifications for other Asian economies and other economies that trade with China.
That's the kind of scenario in which we could see another dip in prices below where we are even
right now. That's not part of our base case, but it's a possibility.
Gheit: Demand growth is expected to remain anemic because of slower economic
growth and conservation.
Do you see geopolitical risks from these low oil prices?
Flynn: The biggest risk is the Syrian war spreading. This thing could get
out of control; it really could.
Cohen: Certain countries are able to weather these prices. Russia and Saudi
Arabia are some of those that fall on the spectrum of being best prepared for this kind of environment.
Then there are other countries on the complete other side of the spectrum-like Libya, Nigeria,
Iraq-that are much worse prepared for a lower-for-longer price environment.
Gheit: Eventually, oil exporting countries will have to get used to the low
oil price, as it's likely to be the new normal. They have to live within their means, diversify
their economies to be less dependent on oil export revenues, and gradually reduce fuel subsidies.
Anything else you'd like to add?
Flynn: The downside risk for prices is if the global economy really falls
apart next year. It's obvious the Fed is concerned about the lack of inflation, so it will likely
err on the side of being more accommodative, which is supportive for prices.
Cohen: The market is struggling now, trying to understand how much incremental
oil Iran can sell to the market when it begins to export again. The forward curve and the price
of oil reflect that Iran will likely add around 500,000 to 700,000 barrels a day from current
levels to the market. If we see a slip in when implementation of the Joint Comprehensive Plan
of Action [nuclear deal] occurs, then the market would likely have to readjust the assumptions
about incremental exports from Iran.
Gheit: Continued low oil prices are likely to lead to industry consolidation,
resulting in bigger and much stronger companies both operationally and financially that are more
resilient to low oil prices.
"... Even under a scenario with a modest recovery from current prices, producing companies and the drillers and service companies that support them will experience rising financial stress with much lower cash flows ..."
"... This means far less value going to equity as the companies lurch ever deeper into financial distress, unless of course oil does rebound back to $100, which paradoxically can only happen - if only briefly - after a massive default wave ..."
"... a substantial risk that prices may recover much more slowly over the medium term than many companies expect, as well as a risk that prices might fall further ..."
Moody's said it was likely to conclude the review by the end of the first quarter which could include
multiple-notch downgrades for some companies, particularly in North America, in other words, one
of the biggest event risks toward the end of Q1 is a familiar one: unexpected announcements by the
rating agencies, which will force banks to override their instructions by the Dallas Fed and proceed
to boost their loss reserves dramatically.
What Moody's admitted is something profound, and which not even the equity holders of many energy
companies have realized, namely that "Even under a scenario with a modest recovery from current prices,
producing companies and the drillers and service companies that support them will experience rising
financial stress with much lower cash flows," it said. This means far less value going to equity
as the companies lurch ever deeper into financial distress, unless of course oil does rebound back
to $100, which paradoxically can only happen - if only briefly - after a massive default wave (which
ultimately will lower the all in cost of production).
Worse, Moody's also said that it sees "a substantial risk that prices may recover much more slowly
over the medium term than many companies expect, as well as a risk that prices might fall further."
But the most dire warning from the rating agency which is suddenly showing far more perceptiveness
than is typical, is the admission that China, as a source of global debt-funded demand, is no more:
"Moody's believes that this downturn will mark an unprecedented shift for the mining
industry. Whereas previous downturns have been cyclical, the effect of slowing growth in China
indicates a fundamental change that will heighten credit risk for mining companies."
Jack Burton
What evidence do we have that any Ratings Agency is anything but a bunch of liars and
manipulators and a part of the scheme to skim as much wealth as possible off of the underlying
real economy?
No much I reckon.
DIGrif
Oil rebounded 9+% on Friday? Sorry but I am throwing a major BULLSHIT flag on that one.
Manipulation is so apparent Stevie Wonder could see it a mile away.
Looney
All rating agencies should switch to the new Ratings Model:
Low oil prices have led to $14 billion in losses for independent oil explorers last year.
Major US shale oil companies such as Hess, Continental Resources, and Noble Energy announced
major cutbacks in capital spending in the coming year. The cuts were steeper than analysts had
expected. Halliburton oil services company reported a 9 percent drop in revenue, year over year,
in the fourth quarter. The company reported a loss of $28 million in the fourth quarter as
compared to a $901 million profit in the last quarter of 2014.
... ... ....
China's economy and stock markets are still having troubles. A new inquiry into the National
Bureau of Statistics has again raised the issue of whether China's economic growth is anywhere
near the claimed 7 percent. Many outside observers are saying that 3-4 percent is more realistic
given that electricity consumption did not grow last year.
"... Without much higher oil prices, oil production in the U.S. could be destined for a dramatic decline, and could exceed the modest 700,000 bpd decline that the EIA is projecting this year. ..."
"... I also think that the media has greatly exaggerated the state of oversupply in the oil market. There is a lot of hype about overflowing oil storage levels, but the record storage levels in the U.S. only amount to about 4 to 5 days above the long-term average. But the media has chosen to hype the absolute levels rather than storage in terms of 'days of supply.' ..."
The Fed statement
today basically admitted that the economy has hit a rough patch, and it dialed down some expectations
for a rate hike. With
news today that Russia might be more cooperative with OPEC on coordinated production cuts, it
appears that the moons are aligning for a rally, particularly as we emerge from seasonal refinery
maintenance and U.S. output declines continue at an accelerated pace in 2016.
One fly in the ointment
is demand, which according to the EIA is beginning to wane. That would make sense given the assumption
that we might be headed for a recession. The EIA reported a decline in gasoline demand by over 2
percent year over year. Although I am highly skeptical of the integrity of this data, it does correspond
to overall economic signals.
Thus, until pro-growth government policies are put in place, there will be a limit to an oil recovery,
as demand destruction will set in from a weak economy, offsetting some of the supply cuts. Additionally,
as overall equity markets continue to decline – reflecting a possible recession – it will put additional
pressure on commodity prices.
However, a modest recovery in the near-term is likely, especially given
the record high net-short positions in oil, which are just now reacting to the policy changes above.
Without much higher oil prices, oil production in the U.S. could be destined for a
dramatic decline, and could exceed the modest 700,000 bpd decline that the EIA is projecting this
year. As the E&P space de-levers, credit facilities continue to remain constrained and will
result in capex cuts. I remain steadfast in this belief and I also think that the media has
greatly exaggerated the state of oversupply in the oil market. There is a lot of hype about
overflowing oil storage levels, but the record storage levels in the U.S. only amount to about 4
to 5 days above the long-term average. But the media has chosen to hype the absolute levels
rather than storage in terms of 'days of supply.'
"... When the peak is reached, supply will either remain flat or decline regardless of the price of oil ..."
"... There will also be a demand response to high oil prices over the medium to long term (3 to 10 years), with higher oil prices (I am thinking $150/b or more in 2016$) ..."
There will certainly be responses on both the supply and the demand side.
When the peak is reached, supply will either remain flat or decline regardless of the price
of oil . The price of oil will affect mostly the rate of decline (high oil price will
reduce the decline rate ceteris paribus). There will also be a demand response to high oil
prices over the medium to long term (3 to 10 years), with higher oil prices (I am thinking $150/b
or more in 2016$) leading to better urban design, more public transportation, goods shipped
by rail, electrification of rail and water shipping, more plug-in hybrids and EVs in rural areas,
possibly excess renewable energy used to produce hydrogen to power fuel cell vehicles in rural
areas, along with the development of an HVDC grid.
These will be the types of responses to the cost of all fossil fuels rising as the peak in
energy output from all fossil fuels might be in 2027. The scenario below is based on medium scenarios
for oil (URR=510 Gtoe of C+C+NGL), coal (URR=510 Gtoe or 1050 Gt), and natural gas (URR=490 Gtoe
or 19,000 TCF).
The total URR is about 1500 Gtoe (billions of tonnes of oil equivalent) or 63,000 EJ (exajoules=1E18
J). This is about the same as Steve Mohr's medium (case 2) URR for all fossil fuels which was
61,000 EJ (1460 Gtoe). The scenario peaks in 2027 at 13.1 Gtoe/year and decline rates for all
energy from fossil fuels remain under 1.5% per year until 2056 and remain below 1.9% until 2100.
For comparison 2014 fossil fuel output was 11.5 Gtoe/year.
This scenario assumes demand for fossil fuels remains robust until 2070 and can be seen as
the maximum possible output given the URR assumptions. A major World recession and/or a relatively
fast transition to an increased use of wind, solar, geothermal, nuclear, and other types of non-fossil
fuel energy would reduce the output of fossil fuels relative to this scenario.
"... He explained that Iran will not be able to access much of its money that
has been locked up overseas due to sanctions because the money has already been
committed elsewhere. ..."
"... On Wednesday, Lew estimated that Iran's demand for domestic investment
surpasses $500 billion, and that it will cost between $100 billion and $200 billion
to restore production levels in its oil and gas sector. ..."
Why do Republicans put out the notion that the Iran deal was Obama's
idea and that Iran gets $150 billion. This is totally incorrect. It's a
deal from the 5 countries in the UN Security Council + Germany & the EU
and Iran. This from the Huffington Post:-
"WASHINGTON -- Iran will receive approximately $55 billion in sanctions
relief once the nuclear deal is implemented, said Treasury Secretary Jack
Lew -- a fraction of the $150 billion that critics of the agreement have
claimed will go to the country.
"There is a lot of discussion out there that Iran is going to somehow
get $150 billion as soon as sanctions are lifted. That is incorrect," said
Lew, speaking at a breakfast hosted by the Christian Science Monitor on
Wednesday. He explained that Iran will not be able to access much of
its money that has been locked up overseas due to sanctions because the
money has already been committed elsewhere.
Last week, Lew told a group of senators that over $20 billion of Iran's
frozen assets has already been committed to infrastructure projects with
China, and that Iran owes an additional "tens of billions" of dollars on
nonperforming loans to its energy and banking sectors.
On Wednesday, Lew estimated that Iran's demand for domestic investment
surpasses $500 billion, and that it will cost between $100 billion and $200
billion to restore production levels in its oil and gas sector.
Of course the forecasts by WoodMac, IEA, EIA, etc are little more than posturing. Predictions,
after all, are claims on the present, not information from the future. Whoever controls the image
of the future controls resources now. Conservatives want you only to fear terrorism and not pollution,
and Conservationists the reverse [I like those two words; they have the same root of course].
Here for example are driving predictions from English Department for Transport and Washington
State DoT. Like every single Transportation Dept [read; road builders] they constantly predict
more driving for ever and ever. No matter how many years they get this wrong, they've got to predict
more because these predictions set their budgets for ever more fancy-arsed road projects.
Are WoodMac really going to say growth in the sector is over? Haha. And the alphabet institutions
[EEEEEIIIIAAA] are extrapolationists, they're never going to catch discontinuity.
Dang, won't accept the attachments again; here's the link:
"Of course the forecasts by WoodMac, IEA, EIA, etc are little more than posturing. Predictions,
after all, are claims on the present, not information from the future. Whoever controls the image
of the future controls resources now. "
Well said. Thank you!
"Whoever controls the image of the future controls resources now. "
That's what propaganda is about. Agencies such as EIA and IEA are as much propaganda outlets
as they are statistics gathering bodies. As we all know there are three types of lies: "Lies,
damned lies, and statistics".
As Watcher observed: "Countries strive for victory over their enemies. They have nothing to
gain by providing accurate information."
Always the argument is between the trend and the status quo. BAUists will insist we look backwards
by demanding data which of course can only be historical. This is an important corrective to theory
but never shows the whole picture, because it always of course supports no change, or at most
an extrapolation of the past. Never fundamental change.
Why won't oil's future follow where
coal is now? I find this at least a highly plausible possibility. It is not unlikely that a combination
of electric supply and climate policies will strand a great deal of oil at any price. How, economics
of course:
What is always less clear is how long this takes, if I have learnt anything following global
change is that it usually both takes way longer than I first think, and then can also happen very
suddenly: Straws do break camels' backs.
"Why won't oil's future follow where coal is now?"
Because predictions are difficult, especially
about the future. So far coal was partially replaced in the only role where new technologies are
somewhat competitive - electrical power generation - and this happened not only because the rise
of wind and solar, but also because the price of natural gas dropped so substantially. Without
the last factor the situation might reverse itself. Not everywhere coal is replaced. High quality
coal is indispensable in metallurgy.
Everything depends on technologies available. Actually the initial idea of diesel engine was
to run it on coal powder. It failed. But now with the new level of technology achieved I wonder
if something along those lines ("nanoparticles") might be feasible at least for large ships.
At some level of oil prices coal might also be used to produce liquid fuels for transportation
like Germany did during the WWII.
Natural gas is also well positioned to penetrate heavy truck and marine fuel markets if the
price remains low.
"... First is the price of tar sands in Canada is likely running at a loss and or it should also be shut down because it compares to the Venezuelan to tar sands which is a known brew of cancer causing chemicals that cant be cleaned from the water and has spread death and destruction. ..."
"... When our scientists say we have to leave 4/5 of the known reserves in the ground what better place to start than the dirtiest? We saw in Canada their right wing government put pedal to the metal with Hillary and Republicans to flood the world with endless fossil fuels. So Canada left their manufacturing sector to wither and now the loon is falling and some say it will take ten years to get their manufacturing back to balance their economy. ..."
"... So for Venezuela to bet their economy on the same dirty oil just show another bad bet that both right and left are guilty of. Two cent gas to have people speed up driving around like chickens with their heads off was a bad bet and now many may go back to chickens in the back yard, diversify their economy, cooperate, keep foreign demands for their oil down and out, and before we know it we could be looking at a country that is leading the way to where we need to go or away from burning life on planet earth four times over with the known reserves. ..."
"... The fact of the matter is that Venezuela had never had pure socialism in its economy. That is a LIE. Venezuela had a mixed economy, same as most, if not all countries of the world. ..."
"... Venezuelas problem is that our State Department did not like the fact that Chavez was not conforming to our dictates, so we were going to disrupt their economy similar to what Kissinger did in Allendes Chile. It worked in Chile, but so far it is not working as effectively in Venezuela. The one caveat is that Allende did not have the Chinese to help. ..."
Venezuela's extra-heavy crude needs to be
blended or
refined - neither of which is cheap - before it can be sold. So Venezuela just hasn't been able
to churn out as much oil as it used to without upgraded or even maintained infrastructure. Specifically,
oil production
fell 25 percent between 1999 and 2013.
The rest is a familiar tale of fiscal woe. Even triple-digit oil prices, as
Justin Fox points out, weren't enough to keep Venezuela out of the red when it was spending more
on its people but producing less crude.
billwilson18041 , 11:57 AM EST
It would be good to think of a few positives and perspective. First is the price of tar
sands in Canada is likely running at a loss and or it should also be shut down because it compares
to the Venezuelan to tar sands which is a known brew of cancer causing chemicals that can't be
cleaned from the water and has spread death and destruction.
When our scientists say we have to leave 4/5 of the known reserves in the ground what better
place to start than the dirtiest? We saw in Canada their right wing government put pedal to the
metal with Hillary and Republicans to flood the world with endless fossil fuels. So Canada left
their manufacturing sector to wither and now the loon is falling and some say it will take ten
years to get their manufacturing back to balance their economy.
So for Venezuela to bet their economy on the same dirty oil just show another bad bet that
both right and left are guilty of. Two cent gas to have people speed up driving around like chickens
with their heads off was a bad bet and now many may go back to chickens in the back yard, diversify
their economy, cooperate, keep foreign demands for their oil down and out, and before we know
it we could be looking at a country that is leading the way to where we need to go or away from
burning life on planet earth four times over with the known reserves. God forbid the right
and left sit down and cooperate for a better country or at least that will be the call of the
God and guns here
elize88 , 11:49 AM EST
Most Americans have no clue about Venezuela, or Venezuelans. We see the world through our narrow
focus. The reason why we try to solve problems through our military, only, is that we think the
world so much wants to be like us, and would just give their lives to be like us.
No...the world wants to be left alone to live the way they see fit. We can't stand the fact
that we are not the savior of the world. Our leaders do stupid things for all the wrong reasons,
simply because, they like us, are ignorant of the rest of the world.
JoeCit, 11:47 AM EST
This 'fine' unbiased 'journalist' made the following statement, and in journalistic terms such
statements should be backed up with 'facts', of which I see no evidence of: "The first step was
when Hugo Chávez's socialist government started spending more money on the poor, with everything
from two-cent gasoline to free housing. Now, there's nothing wrong with that - in fact, it's a
good idea in general - but only as long as you actually, well, have the money to spend. And by
2005 or so, Venezuela didn't."
I will 'editorialize' that handouts only 'work' when such giving doesn't make them lazy and
entitlement-oriented, and doesn't end in a permanent state of expectation.
I think this 'article' should be, at best, considered a (biased) opinion piece. Shame on you
Washington Post.
elize88, 11:26 AM EST [Edited]
The fact of the matter is that Venezuela had never had pure socialism in its economy. That
is a LIE. Venezuela had a mixed economy, same as most, if not all countries of the world.
Venezuela's problem is that our State Department did not like the fact that Chavez was
not conforming to our dictates, so we were going to disrupt their economy similar to what Kissinger
did in Allende's Chile. It worked in Chile, but so far it is not working as effectively in Venezuela.
The one caveat is that Allende did not have the Chinese to help.
ThomasFiore, 11:38 AM EST
They tried to cut the wages of people in their oil sector below the prevailing wage in the
rest of the world. The people left.
Back under Bush I remember Condi Rice trying to support the military government after an attempted
coup and that's our bad but that was the military intelligence side and not State. Venezuela has
worked to make itself an enemy to the US in the same way that Castro did with Cuba (the politics
of the Cold War don't work as well now that it's over so that hasn't really worked), but their
problems are their own and not our fault. It will be interesting to see what happens in the coming
decade since they have aligned themselves with China and China seems to be turning inward.
elize88, 11:14 AM EST
Perhaps we need to travel a bit outside our little cocoon and see how others live. We think
that the rest of the world do think like us and share our cultural value. No...the world does
not consist of a monolithic thinking. That is our problem.
I travel quite a bit and see the emphasis on different culture values. Venezuelans or Latin
Americans may want the same "material" things as Americans, but the whole premise that of achieving
those goals may not be as a premium in their lives.
Get out into the world sometimes. Staying in a protective resort will not get you the understanding
you need.
Philosphical , 11:12 AM EST [Edited]
Socialists, socialists, it's all socialists. The USA is more likely to go bankrupt than socialist
Europe. We have the same or similar government expenditures as these terrible socialists, but
our politicians won't face reality and collect the taxes to pay for what they have to spend to
maintain our country and its people. We just have a lot more ability to borrow than Venezuela,
but it can't go on indefinitely, sooner or later there will be a day of reckoning for us. Of course,
the 1 per cent of I per cent who are paying our politicians will be largely unaffected by that
day of reckoning.
CapnRusty , 11:26 AM EST
The Federal Reserve "printed" trillions over the past seven years. The difference is that most
of that money went into our stock market, and caused the income disparity in America to grow.
Epaminondas Vindictor, 10:00 AM EST
Yeah, we know - socialism doesn't work. But having a welfare state, if managed fairly well
does work. We only need to look to Canada as a nearby example.
Yet Canada is not Cuba or Venezuela. And if you believe that Canadians are just itching to
ditch their health care system, look again. Even the previous conservative prime minister, Stephen
Harper, tried to privatize their health care system. No country wants a health care system like
that in the USA.
The 'free market' is not necessarily a competitive one. In the USA, it's more about plutocracy.
Facing Bosnian Sniper Fire, 10:05 AM EST
Good point! I don't want obamacare either!
bromisky, 10:11 AM EST
Remember, what you call Obamacare came from the Heritage Foundation...a conservative think
tank...
Tim the Enforcer, 1/29/2016 12:59 PM EST
Lemme guess: "Real socialism wasn't tried in Venezuela."
God Loves Me Best, 11:03 AM EST
Lemme guess: "Real capitalism didn't lead to the Great Depression, the Bush Recession, or any
of the dozen or so major "panics" in U.S. economic history."
Jessica20151, 1/29/2016 12:48 PM EST
My only guess is that Matt O'Brien has never been out from his day time job at the Washington
Post, typing stuff on his laptop computer he doesn't know, because he has never been to Venezuela.
My brother is an Engineer at British Petroleum at Valencia, Venezuela and I just came from
vacations from Venezuela, I found everything at the supermarkets, including a bottle of Scotch
Whiskey imported from England. My brother just purchased a brand new venezuelan built Toyota "machito"
for just $5,000 dollars. And people in Venezuela enjoys free public transportation, free hospitals,
free health care system, free medicines, free doctors, free dentists, elderly people and students
don't need to pay a single cent to ride the Valencia Subway or the Caracas Subway (Metro). And
people are employed, the unemployment rate in Venezuela is 2%. The economy is doing fine, I have
seen more people dragging carts full of trash and begging for money in the streets of Washington
DC than in Caracas. And please, stop watching FoxLiesNews.
"... It's not just oil companies that are exposed, however. Regional banks that lend to the energy industry could suffer as a result of a default wave, the OFR report noted, adding that "the ultimate magnitude of losses in these industries and regions is uncertain. ..."
"... The real pain will come when these firms need to refinance debt. Chesapeake, for example, has $2 billion in liabilities coming due in 2017 (against a current market capitalization of just $2.1 billion)… ..."
A financial watchdog set off the alarm bells on corporate debt Wednesday in its
annual report to Congress. With companies feeling growing pressure from painful
exchange rates and energy prices, the U.S. is at a higher risk of seeing a wave
of corporate defaults, the report said.
The report from the Office of Financial Research, a division of the Treasury
Department, listed credit risk as one of the top three financial stability
dangers facing the economy in 2016….
It's not just oil companies that are exposed, however. Regional banks that
lend to the energy industry could suffer as a result of a default wave, the OFR
report noted, adding that "the ultimate magnitude of losses in these industries
and regions is uncertain."
S&P said Monday it has cut its 2016 and 2017 forecast for WTI crude by 20
percent. And also dropped its forecast price for Henry Hub natural gas by 15
percent for the next two years.
That prompted S&P to issue an immediate credit downgrade on one major oil
and gas player: shale specialists Chesapeake Energy. A move that caused a
single-day, 16 percent fall in Chesapeake's share price….
The real pain will come when these firms need to refinance debt. Chesapeake,
for example, has $2 billion in liabilities coming due in 2017 (against a
current market capitalization of just $2.1 billion)…
"... This week, the Permian basin horizontal rig count fell by 13 while the Bakken and Eagle Ford were unchanged. ..."
"... I have shown that those plays are commercially less attractive than the Bakken and Eagle Ford because of lower EUR and comparable costs. A positive aspect of the plays is higher early flow rates and, therefore, more cash flow. ..."
The U.S. land rig count fell 17 to 590 and the horizontal land rig count fell 13 to 487.
This week, the Permian basin horizontal rig count fell by 13 while the Bakken and Eagle Ford were
unchanged.
Is this a moment of truth for the Permian basin plays?
I have shown that those plays are commercially less attractive than the Bakken and Eagle
Ford because of lower EUR and comparable costs. A positive aspect of the plays is higher early
flow rates and, therefore, more cash flow.
"... Looks like about 4-5 Mb/d of condensate is produced in the World. As long as this can be easily blended into liquid fuels (such as gasoline) at refineries, it makes sense to call it "oil" as there is a wide range of stuff we are willing to call oil (such as bitumen). ..."
Total global liquids supply in 2040: 121.7 mb/d,
or 118,8 mb/d excluding refinery processing gains.
or 114.5 mb/d ex. proc. gains and biofuels.
Note, that AEO 2015 was issued in early 2015 and apparently prepared in late 2014, when
oil prices were significantly higher.
The AEO 2015 projects Brent price at $71 in 2016 gradually rising to $141 (in $2013) by
2040.
I expect AEO 2016 global liquids supply projections to be lower than in last year's issue.
Enhanced recovery don't seem to get much credit here.
;-)
Notice that the IEA don't have us reaching 80 mbd, C+C, until 2030, a point that the EIA says
we are at today. They, the IEA, has us at about 75 million barrels per day today. My guess
is that is about right.
The IEA has conventional oil + tight oil+oil sands + GTL and CTL at ~75 mb/d and
NGLs at @ 15 mb/d in 2014
Total (ex. biofuels and processing gains) ~ 90 mb
The EIA has conventional oil + tight oil+oil sands + GTL and CTL at ~79.4 mb/d and NGLs
at @ 9.5 mb/d in 2014
Total (ex. biofuels and processing gains) ~ 89 mb
The IEA has included all OPEC NGLs and condensate in global NGLs number.
The EIA apparently classifies large part of OPEC NGLs and condensate as condensate (part
of global conventional C+C).
(Total OPEC NGLs and condensate production in 2014 was 6.36mb/d)
Thanks for the clarification. Looks like about 4-5 Mb/d of condensate is
produced in the World. As long as this can be easily blended into liquid fuels (such
as gasoline) at refineries, it makes sense to call it "oil" as there is a wide range
of stuff we are willing to call oil (such as bitumen).
We have been counting crude plus condensate for a long time, excluding C2, C3, and
C4 makes sense to me, but excluding C5 does not. Just one person's opinion.
"... These are the most important data points on earth, and they are not known to high confidence. This is what one would expect. Countries strive for victory over their enemies. They have nothing to gain by providing accurate information. ..."
"... If for instance Saudi Arabia says last years production was ten million barrels per day average, exactly, how far off do you think that might be, one tenth of a percent? two percent? ..."
"... Some countries are going to be notorious liars of course, and their figures might be off by ten percent or more. ..."
"... The trend in the reported quantity of oil available on international markets ought to be likewise accurate, even though the actual reported quantity of oil available on world markets might have been off by a percent or even two percent or more. ..."
"... I would assume that EIA has error margin close or above 100,000 bbls/day. So the accuracy of EIA data is just two significant digits maximum. The fact that they provide more digits is just an attempt to be a better Catholic then Pope, if you wish ;-). ..."
"... Generally they should have strong institutional bias toward lower oil prices and that bias can influence their oil production and consumption numbers. So it is rational to assume that they tend to overestimate the production and underestimate consumption growth. In other words they are predisposed to "revealing" oil glut even if it does not exists. ..."
"... Some people like Steve Brown recommend reducing their production numbers by 100,000 bbl/day just in case ..."
At times there are numerous comments questioning the reliability of oil production figures reported
by various countries and by different outfits sucth as the IEA etc.
No doubt there are serious errors.
What I would like to know, is this.
How big do you guys who crunch a lot of numbers think the errors are ?
How much higher, or lower might the true total world wide production of C plus C be , if it
were possible to know?
How big might the errors be in the worst case countries?
The errors can be very big.
In the World Energy Outlook 2008, the IEA projected global total liquids demand at 106.4 mb/d
by 2030.
In the latest WEO-2015, they are projecting 103.5 mb/d by 2040.
The trend in the past 10 years was towards lower medium and long-term supply and demand projections
Generally speaking, when dealing with massive amounts of data, the "errors" largely offset each
other. That is, if almost every figure is subject to being either to high or too low, after adding
them all up, the total is surprisingly close to what the "real" total should be. Obviously, if
you could posit a situation in which every number is likely to be too high (or too low) that would
not be the case.
So, with an individual country, like say Venezuela, maybe it is off by a significant amount.
As regards global oil (liquids) supply and demand projections, there were not just
statistical errors, but very significant conceptual errors. All agencies have been significantly
overestimating global demand and supply.
These are the most important data points on earth, and they are not known to high confidence.
This is what one would expect. Countries strive for victory over their enemies. They have nothing
to gain by providing accurate information.
If I were China, I'd make oil production a state
secret, too.
I doubt China is playing games with reported oil production capability. I had an
office in Harbin for many years where most of my time was spend assessing reserves for NA oil
companies who wanted access to Chinese oil. As such I was in contact with numerous local oilmen
who freely gave me access to their reservoir data. The Chinese were duplicitous in one respect,
in my opinion, by leading American companies into believing they were entertaining potential JV
partners when, in fact, they simply wanted to massage business contacts in general. On China's
production I expect the following is accurate:
"… China's crude oil output has stagnated for the past two years despite intense drilling activity
on land and offshore. In late 2014, CNPC essentially threw in the towel on its workhorse field,
Daqing, announcing that it would allow the field to essentially enter a phase of managed decline
over the next five years. Under this new approach, the field's oil production will fall from 800,000
barrels per day (kbd) in 2014 to 640 kbd by 2020: a 20 percent decrease. To highlight the importance
of PetroChina's decision, consider that Daqing currently accounts for approximately one in every
five barrels of oil currently pumped in China – on par with the role Alaska's massive Prudhoe
Bay field has played in US oil production…"
Thanks guys, but I did not mean to ask about PREDICTED oil production but rather about ACTUAL
production, this year, and in past years.
If for instance Saudi Arabia says last years production was ten million barrels per day
average, exactly, how far off do you think that might be, one tenth of a percent? two percent?
Some countries are going to be notorious liars of course, and their figures might be off
by ten percent or more.
But even though the total reported world production might be wrong by a percent or more, in
either direction, up or down, the TREND in reported production still ought to be accurate.
The trend in the reported quantity of oil available on international markets ought to be
likewise accurate, even though the actual reported quantity of oil available on world markets
might have been off by a percent or even two percent or more.
I would assume that EIA has error margin close or above 100,000 bbls/day. So the accuracy
of EIA data is just two significant digits maximum. The fact that they provide more digits is
just an attempt to be a better Catholic then Pope, if you wish ;-).
Generally they should have strong institutional bias toward lower oil prices and that bias
can influence their oil production and consumption numbers. So it is rational to assume that they
tend to overestimate the production and underestimate consumption growth. In other words they
are predisposed to "revealing" oil glut even if it does not exists.
The margin or error is different for different types of oil with those areas that are served
by pipelines more precise (offshore is one example here).
Some people like Steve Brown recommend reducing their production numbers by 100,000 bbl/day
just in case :-)
"... By Perry Mehrling, a professor of economics at Barnard College. Originally published at his website . ..."
"... Yes, the money creation process has been a big lie for a long time. In any case the Bank of England came clean a couple of years ago and admitted that standard story of money creation was false. They even acknowledge that it is not properly explained in most money and banking textbooks, which is a staggering admission. ..."
"... Paul Krugman wrote a column a couple of months ago where he claimed that banks take in savings from depositors and lend them out to borrowers which tells you either: 1) he doesnt know how banking works or 2) he is part of the conspiracy to keep the public in the dark. ..."
"... The truth right from the mouth of the worldss oldest central bank. http://www.bankofengland.co.uk/publications/Documents/quarterlybulletin/2014/qb14q102.pdf ..."
"... Yeah, I saw that. It is amazing that a supposedly foremost Princeton Nobel winning economist apparently doesnt understand where money comes from… ..."
"... There is evidence that Krugman seems to have great difficulty admitting he was wrong. ..."
"... And what he writes makes me think he doesnt know how banking works. I find it difficult to believe he is part of any conspiracy. But I may be wrong. ..."
"... My take is that the fractional reserve and intermediation models are just ways of obfuscating the way banking actually works and the credit creation model is the accurate one. I have some advice for anyone who is struggling with the concepts which is as follows: always merge all the banks in the banking system into one bank in your mind. Assuming multiple banks as the author above does is irrelevant to the analysis and only serves to add confusion. ..."
"... I enjoyed the article very much. And it does seem to me that money creation is made to seem very, very, complex. Now maybe Im just too stupid, but it always strikes me that when people simply describe something, they either really dont know, or they are trying to bamboozle you… ..."
By Perry Mehrling, a professor of economics at Barnard College. Originally published
at
his website .
In his recent paper, "A Lost Century
in Economics: Three Theories of banking and the conclusive evidence" , Richard Werner argues
that the old "credit creation theory" of money is true (empirically "accurate"), while both the newer
"fractional reserve theory" and the presently dominant "debt intermediation theory" are false. For
him, this matters mainly because the false theories are guiding current bank regulation and development
policy, leading down a blind alley.
But it matters also simply because we need correct understanding of how the economy actually works,
"we" meaning not just economists but also the general public. "Today, the vast majority of the public
is not aware that the money supply is created by banks, that banks do not lend money, and that each
bank creates new money."
Why is the public ignorant of the truth? Much of Werner's paper is devoted to an account of how
the correct theory was pushed out of the conversation, first in the 1930s by the fractional reserve
theory, and then after WWII by the debt intermediation theory. One culprit was a shift toward deductive
and away from inductive methods. Another culprit, he suggests, was the self-interested "information
management" by central banks, i.e. direct suppression of truth in their own publications. And in
this suppression, he further suggests, Keynesian academics were at the very least complicit: "attempts
were made to obfuscate, as if authors were at times wilfully trying to confuse their audience and
lead them away from the important insight that each individual bank creates new money when it extends
credit."
In this history, Werner gives special attention to Keynes himself since Keynes seems to have held
each of the three theories in succession throughout his life. Keynes' own intellectual trajectory
thus foreshadows the subsequent evolution of monetary thought, and so probably is partly responsible
for leading successive generations astray. Just so, one apparent legacy of Keynes is that the Bank
of England is currently holding all three theories at the same time! "Since each theory implies very
different approaches to banking policy, monetary policy and bank regulation, the Bank of England's
credibility is at stake." BoE credibility is thus a third reason that all of this matters.
But is it really true, as Werner claims, that these three theories are "mutually exclusive"?
He is at considerable pains to show that they are mutually exclusive, by using a succession of
stylized balance sheet examples. The credit creation theory says that banks make loans by creating
deposits, essentially expanding their balance sheets on both sides by the same amount. (The borrower
of course also expands his own balance sheet, the loan being his liability and the deposits being
his asset. In my own "money view", I call this a swap of IOUs.) In this way, money (bank deposits)
is created that was not there before.
By contrast, the debt intermediation view says that banks make loans by lending reserves that
they are already holding, essentially swapping one asset for another, these reserves having previously
been obtained by someone's deposit. The balance sheet expands when the deposit is made, not when
the loan is made. Banks merely intermediate between savers and borrowers, and do not create money.
In between these two views, the fractional reserve view says that individual banks make loans
by lending reserves, but that the banking system as a whole can and does create money, up to a multiple
of reserve holdings. The banking system does create money, but only after and as a consequence of
the central bank increasing reserves–this is the famous "money multiplier".
So the difference between the theories seems clear, and it also seems like that difference should
be testable empirically simply by watching actual bank balance sheets and seeing what happens when
a loan is made. Does the balance sheet expand or does it not? With the cooperation of an actual bank,
Werner books a dummy loan and finds that the balance sheet of the bank does in fact expand. This
he takes to be scientific proof that the credit creation theory is correct and the others are false.
Not so fast. Let's look a bit closer.
Let me begin by admitting my sympathy for Werner (as I have already hinted by mentioning my own
"money view" as a version of the credit creation view). In fact, Werner's heroes–H.D. McLeod and
Joseph Schumpeter–are my own heroes as well, and I suspect that graduate school exposure to these
authors sent him off on his own intellectual journey just as it did me. Even more, thirty years after
that initial exposure, I find Werner's (co-authored) money and banking textbook
"Where Does Money
Come From?" one of the best introductions to the subject. Last fall I assigned Chapters 2 and
4 in the first two weeks of "Economics of Money and Banking" which I teach at Barnard College, Columbia
University. I'm sympathetic.
But I don't think these three theories are quite as mutually exclusive as he makes them out to
be.
Let us suppose, with Werner, that Citibank makes a mortgage loan to me of $200,000, simply by
swapping IOUs. I then transfer my new asset (the new Citibank deposit) to you, and you transfer your
house to me. As my payment clears, you have a new deposit in your own bank (let's say Chase, to make
it interesting), Citibank has a "due to" at the clearinghouse, and Chase has a "due from". Again,
to make it interesting, let's suppose that Citibank has no reserves, so it enters the interbank market
to borrow some, from Chase. At the end of the day, what we see is that the Citibank balance sheet
is still expanded, so is Chase's, and so is mine. Only your balance sheet stays the same size, since
you have swapped one asset (your house) for another (money). That's the payments perspective.
What about the funding perspective? If we follow the balance sheets through, it is clear that
your money holding is the ultimate source of funds for my borrowing. (You lend to Chase, which lends
to Citi, which lends to me.) In this sense, we can think of both Chase and Citibank as intermediaries,
channeling funds from one place in the economy to another. But, in this example, there is no saving
and there is no investment. The sale of the house adds nothing to GDP, it is just a transfer of ownership.
The expansion of the banking system has facilitated that transfer of ownership by creating a liability
(the deposit) that you apparently prefer to your house, at the same time acquiring an equivalent
asset of its own (the loan). Citibank collects the spread between the mortgage rate and the interbank
rate; Chase collects the spread between the interbank rate and the deposit rate.
But all of that is only what happens right at the moment of payment. What happens afterwards depends
on the further adjustment of all of these balance sheets. One way this could all work out is that
Citibank packages my mortgage with others to create a mortgage backed security, and that you spend
your Chase deposit to acquire a mortgage backed security (perhaps indirectly through a mutual fund
that stands in the middle). In this scenario, the newly created money is newly destroyed, the balance
sheets of both Citi and Chase contract back to their original size, and the end result is that you
are funding my loan directly. But again, no saving and no investment, just a change in your asset
allocation, away from money toward fixed income investment.
Obviously this final scenario is a limiting case on one side. The limiting case on the other side
is that you (or whoever you transfer your money to) are willing to hold the newly created money balances
as an asset, so you continue to fund my loan indirectly. Now when Citibank securitizes and sells,
it is able to repay its interbank liability to Chase, and for simplicity let's say that Chase uses
that payment to acquire a different money market asset. One way this could all work out is that a
shadow bank–money market funding of capital market lending–acquires the security and uses it as collateral
for wholesale money market borrowing from Chase. Again, no saving and no investment, but the new
money stays in circulation and is not destroyed.
These are the limiting cases, and obviously anything in between is also possible, depending on
the portfolio decisions of Citibank, Chase, and you. But in all the cases, the debt intermediation
view of banking is perfectly consistent with the credit creation view of banking. One focuses on
the ultimate funding, while the other focuses on the initial payment.
That said, I have to agree with Werner that the credit creation process is all too commonly left
out of the story–most modern courses never even mention the payments system–and it is a real (and
important) question how this came to be so. It is a further real (and important) question why the
intellectual memory of how the process actually works was left to marginalized sections of academia–Werner
mentions specifically the Austrians and post-Keynesians. I'm not so sure that it was a central bank
plot, though I do think that the shift in academic fashion toward studying equilibrium of a system
of simultaneous equations played a role in obscuring the kind of dynamic balance sheet interactions
that are the essence of the story.
What I would emphasize however is not the negative but the positive. The fact of the matter is
that today the credit creation view is out of the shadows, and no longer the exclusive property
of the marginalized . In evidence of this, I would direct your attention to the two Bank
of England papers that Werner himself cites:
here and
here . But I would add to that also the most recent report coming out of the Group of 30
"Fundamentals
of Central Banking, Lessons from the Crisis" . On page 3 you will find the following:
"In a barter economy, there can rarely be investment without prior saving. However, in a world
where a private bank's liabilities are widely accepted as a medium of exchange, banks can and do
create both credit and money. They do this by making loans, or purchasing some other asset, and simply
writing up both sides of their balance sheet."
That's the truth that Werner wants central banks to admit, and now it appears that they have admitted
it. The next question is what difference it makes, and that's a question for next time. Already it
should be clear that progress toward answering that question will require us to be more careful about
issues of payment versus funding.
P.S. BTW, the title of this post [at Merhling's site, which is "Great and mighty things which
thou knowest not" [?]] is taken from Jeremiah 33:3 which Werner references in a footnote to his title:
"should grains of wisdom be found in this article, the author wishes to attribute them to the source
of all wisdom." Werner is apparently listening to powers higher than just McLeod and Schumpeter!
I think another aspect that should be considered is the preservation of surplus money through
government debt.
For example, Volcker is credited with curing inflation through higher interest rates, but that
slowed the economy as well and so reduced the need for money. It wasn't until Reagan had increased
the deficit to 200 billion in 82 that inflation seemed to come under control enough that they
could lower rates.
Now one way to create higher rates is for the Fed to sell debt it bought to create the money
in the first place. So what is the difference between the Fed selling debt it is holding and the
Treasury issuing fresh debt, other than the Fed destroys its money and the Treasury spends it
on public works, thus Keynsian pump priming.
So who buys this debt, but those wealthy enough to have surplus money. Which suggests that
if there is a surplus of money in the system, causing inflation, the easiest place to remove it
is from those with a surplus of money.
Now money really does function as an enormous, glorified voucher system and what is more destructive
of such a system, than enormous amounts of surplus vouchers?
So given that those with lots of such excess vouchers consequently have leverage over the rest
of the system, what way to better preserve this wealth, than to have the public borrow it back
and pay interest, even if much of what it gets spent on doesn't produce sufficient income to pay
that interest, if not actually lost?
Eventually though even the public can't afford to keep this up, so what is the alternative?
Now most people save for predictable reasons, from raising children, housing, healthcare, to
retirement and funerals. So what if the government, i.e., the public, were to threaten to tax
excess money back out of the system, rather than just borrow it? Necessarily people would quickly
find means to invest into these future needs directly, rather than trying to save up notational
value. The problem is that we don't know exactly what we will need for what, which would mean
we would have to invest into community and public projects, rather than save for our own specific
needs.
While this might seem onerous, consider that we currently live in a highly atomized society,
that is largely mediated by that failing financial mechanism. So if we had to start functioning
as a more holistic group, with more organic interactions and public spaces and commons, people
might have to come out of their shells a little more and deal with lots of other social and personal
issues, which might not be a bad thing.
Basically we treat money as both medium of exchange and store of value, but these are different
functions, as a medium is dynamic and a store is static. For instance, in the body, blood is the
medium and fat is the store. Try storing fat in the arteries and you get clogged arteries, poor
circulation and high blood pressure to compensate, which is analogous to our financial issues,
with a clogged banking system, poor circulation to the rest of the economy and quantitive easing
to compensate.
While the brain might need more blood than the feet, it does neither any good for the feet
to rot and die from lack of circulation, nor does it do the brain any good to have excess blood.
Similarly we need a stronger social structure and a leaner, more efficient economic medium, in
which the excess is stored as the muscle of a stronger society and a healthier environment, rather
than just treating them as stores of wealth to be monetized and siphoned away.
Yes, the money creation process has been a big lie for a long time. In any case the Bank of England came clean a couple of years ago and admitted that standard
story of money creation was false. They even acknowledge that it is not properly explained in
most money and banking textbooks, which is a staggering admission.
Paul Krugman wrote a column a couple of months ago where he claimed that banks take in savings
from depositors and lend them out to borrowers which tells you either: 1) he doesn't' know how
banking works or 2) he is part of the conspiracy to keep the public in the dark.
In the mainstream world money is just a "veil" that obscures your view of how the divine markets
work. They deliberately leave it out because it just confuses things…
No wonder no one in that world saw the GFC coming, they still all claim whocuddaknowed?
There is evidence that Krugman seems to have great difficulty admitting he was wrong. He even
contends that using IS-LM is a good too for introducing students to the macroeconomy, even when
they must unlearn it when they delve deeper in to the workings of the macroeconomy, and this is
after Hicks himself rejected it as being an inaccurate depiction of the macroeconomy later in
his life. I can't say what Krugman is thinking, but then I don't have to. I can go just by what
he writes. And what he writes makes me think he doesn't know how banking works. I find it difficult
to believe he is part of any conspiracy. But I may be wrong.
Yes it's hard to believe that Krugman might not know how money/banking works but he is a very
ideological guy. I happen to be sympathetic to many of his ideological views but any one who is
intensely ideological is rarely a critical and independent minded thinker. Ideology is way of
simplifying complex things and making your self more comfortable, and doesn't lead to knowledge.
I am no expert on money and banking but I have read ten books on the subject over the last four
years and numerous papers. I am pretty sure I understand it now. I think this guy Werner is right.
It seems probable that there was an orchestrated campaign to obfuscate how banking and money creation
work and one can imagine why that might have happened. Banking is quite literally a pyramid scheme
under even the most conservative circumstances! Such a system can work and makes sense if it is
prudently managed, regulated and limited in scope.
My take is that the fractional reserve and intermediation models are just ways of obfuscating
the way banking actually works and the credit creation model is the accurate one. I have some
advice for anyone who is struggling with the concepts which is as follows: always merge all the
banks in the banking system into one bank in your mind. Assuming multiple banks as the author
above does is irrelevant to the analysis and only serves to add confusion.
I enjoyed the article very much. And it does seem to me that money creation is made to seem
very, very, complex. Now maybe I'm just too stupid, but it always strikes me that when people
simply describe something, they either really don't know, or they are trying to bamboozle you…
I think the article would have been more enlightening though if the example had been for a
house that was TO BE BUILT.
Using that as an example, it seems to me that money is LOANED into existence – the person who
wants the home loan has a good reputation, but the whole point of the loan is that they don't
have nearly enough money to buy the house.
The carpenters and other workers don't get paid until they have done work (they loan their
work to their employer), i.e., produced a house (or some portion of it). The money in the loan
becomes real because a house that didn't exist now exists. There is more stuff in the world, and
there is more money. And I think it explains something important – not any loan is useful. A house
worth 100K that is sold for 1000K but than is foreclosed upon – somebody has to take a real loss
– either the person who got the home loan, and to the extent that they can't pay the loan back,
a builder or the bank takes the loss (if the foreclosed value is less than the original loan value)
So, is that correct?
Again, thanks for the article and I am looking forward to the next one!
Pick any year post WWII (because the data is readily accessible).
Compare the levels of federal spending and credit expansion.
Federal spending created more money every year except for the years 1998 thru 2007, where it
was about even, and for 2006 and 2007 credit expansion was some 50% higher.
Then we got the mother of all credit crises.
Over that post WWII period federal spending created ~$78T while credit created ~$46T.
The common refrain is that federal taxes subtract from federal spending so it ends up being
less.
Except in what universe do income taxes accrue only against income resulting from federal spending?
It's nonsense and should be derided as such. It's an accounting convenience that does not reflect
what is actually happening.
It may make sense for National Accounting (and to keep banksters in the drivers seat) but it
makes zero sense in a rational analysis of a real-world system. That is the only way banks could
be touted as the source of most of our money.
Despite an otherwise sound argument this article perpetuates the myth.
The banksters apparently have a hold on everyone, including the so-called 'good guys'.
Some justification based on the level of bank reserves or some other convoluted argument in
5,4,3,2,1 …
Very interesting and I'm looking forward to your next installment.
I'm especially interested in the transfer of reserves from Chase to Citi and as you further
point out 'Chase possibly using its reserves to acquire a different money market asset. One way
this could all work out is that a shadow bank–money market funding of capital market lending–acquires
the security and uses it as collateral for wholesale money market borrowing from Chase.'
This seems to be a transmission mechanism for asset appreciation as Eric Tymoigne is getting
into is his excellent series:
"post 7 will start the private-bank posts) on monetary policy and the QE -asset price channel
will be explained. But here is a short answer:
No bank's don't use cash to buy assets. If they deal with non-bank agents they just credit bank
accounts, if banks deal with a fed account holder they debit their reserve balances to make payments.
The link works through interest rate, arbitrage, search for yield, and the fact that QE reduces
the quantity of securities available in the market."
"the issue is how they would transfer the funds to make the purchase? They could buy securities
if they find a fed account holder willing to sell them securities: Treasury is one, GSE is another
one. Non-financial institutions no."
All they do is talk about how the parts of the machine move - which is itself an amazing problem
of conceptual collinearity - but not the phenomenon of the machine itself.
More and more you just say "Why not go to Youtube and check out a Rhianna video, rather than
read another one of these essays."
Eventually maybe they'll get it. But when they study economics their whole adult life - and
nothing else - it makes it hard. It's not like they're dumb or that they lack mental ability.
In fact, they're all intelligent individuals who are quite capable in most areas of thinking.
It's just that the conceptual language they need to use in order to perceive the phenomenon itself
is a language they do not know. And so they look at reality and they try to make sense of it using
the language they do know, and because words themselves and the ideas in the words catalyze perception,
their limited language is not fully adequate, and they don't see or know that. What can you do?
Everybody has to see it for themselves.
At any rate, you'd think by now it wouldn't be so hard. But most people aren't interested in
this sort of thing so progress is really slow. Most people just go right to Youtube.
Adenosine triphosphate. The example several years ago in the comments, by a biologist, that
it would be an extinction event for a colony of amoeba if a few of them decided to short amoeba
futures and just hoard all the adenosine triphosphate – the one chemical every amoeba must have
to transfer energy. Wish it had been an analogy to symbolic ADP which had usurped the real stuff
and was being hoarded to make sure it maintained its value.
You assured me susan was a bona ride adjunct professor of theosophical studies at the University
of Magonia. I want, nay, I demand my tuition fee, which apparently I had to pay in advance because
otherwise 42 other Chinese applicants would be in line for my place, back.
Dunno why they have all these theories. It's simple. The Fed lowers interest rates, the mark
to market value of bank assets go up, which greatly improves cap ratios, then banks don't need
liabilities anymore. They just can make endogenous money and give it out to borrowers' banks.(it's
all done electronically and fast so no one notices) All the Big Guy econ types know that.
All the rest of it is just details banks go thru just for show. Plus they can securitize and
sell any assets they think may drop in value. They're smart people.
Now, the other thing all the Big Guy econ dudes always say is once us little folk figure it
out, something wonderful is supposed to happen. Maybe I missed it, but what thing is that???
Let us suppose, with Werner, that Citibank makes a mortgage loan to me of $200,000, simply
by swapping IOUs. I then transfer my new asset (the new Citibank deposit) to you, and you transfer
your house to me. As my payment clears, you have a new deposit in your own bank (let's say Chase,
to make it interesting), Citibank has a "due to" at the clearinghouse, and Chase has a "due from".
Again, to make it interesting, let's suppose that Citibank has no reserves, so it enters the interbank
market to borrow some, from Chase. At the end of the day, what we see is that the Citibank balance
sheet is still expanded, so is Chase's, and so is mine. Only your balance sheet stays the same
size, since you have swapped one asset (your house) for another (money). That's the payments perspective.
Is the house owned free and clear? If not, the exchange eliminates that original liability/asset
on someone else's balance sheet so everything is now at a net zero as far as new money circulating
in the economy. Banks did not create anything new. They only exchanged one Asset/Liability
for another Asset/Liability. Even if the house was paid off 20 years ago, there is no new money
created from this transaction. The only way "new money" is created would be through interest
paid on Treasuries, and direct deficit spending by federal government.
As the commenters on the post at Prof. Mehrling's site have observed, his argument is logically
flawed. He concludes: "But in all the cases, the debt intermediation view of banking is perfectly
consistent with the credit creation view of banking."
The intermediation view of banking "says that banks make loans by lending reserves that they
are already holding," as he explains at the beginning of his piece. In his example, the deposit
that is created by the banking system funds the loan. Of course, in both case intermediation takes
place but the nature of the intermediation is not comparable.
In the first case, banks have no special status in the economy. After all any of us who has
a balance of $100 can lend out that balance of $100. In the second case, the only reason the bank
can make the loan is because of a social norm in which the public trusts the banking system and
is willing to keep its money in banks. This fact has always been a fundamental component of the
credit creation theory of money - it is founded on the public's trust in the banking system. This
trust allows banks to expand the money supply - at the potential expense of the public.
While I have great respect for Prof. Mehrling, it is far from clear that he has a good understanding
of the credit creation view of money.
When I looked into the data about 5 years ago, it appeared that only a few large banks were
actually operating on a credit-creation basis. Most banks (meaning your local, independent banks
and credit unions) appeared to be operating on an intermediation model. Deposits are always the
cheapest way to fund a loan, and for small banks, that looks like pretty much the only way they
do it – iirc, loans were 60-80% of deposits in most banks. However, at JPM, BofA, etc, their loans
were well over 100% of their deposits…like waaaay over. So it looked to me like just a few big
players were driving endogenous money creation, while most banks actually were doing, essentially,
what fractional-reserve theory says they do.
That's my understanding, but I don't claim to be an expert.
Banks no longer keep their loans on balance sheet, so a simple static analysis of their balance
sheet doesn't tell us much about how much credit creation they are doing. To study the degree
to which banks create money you have to look at the role they play in the shadow banking system
as well.
Too some degree… my concerns about the shadow sector vastly out weigh the traditional sector
e.g. has the traditional sector become [increasingly] just a front house op to generate velocity
for the shadow sector, and the latter just needs a – store of – when the economy gets a black
eye.
Therein lies the rub e.g. some fixate on one component of a veritable galaxy of operational
scope, so at this juncture on can surmise that new universes of credit are created and inserted
into the multiverse to survive on their own [inhabitants luck of the draw]. Maybe theoretical
physics would be a better methodology of describing credit activity's at this juncture than thermodynamics,
ideology, or socio-economic-political optics…
There's a confusion here. Suppose a bank with reserves R and corresponding deposits X, in addition
to other balance-sheet items, has
R X.
at the top of its balance sheet. It makes loan L, which creates new deposit D to obtain balance
sheet
L D *
R X.
The borrower/deposit-holder transfers her deposit to another bank, so the original bank's balance
sheet drops down to
L X,
while the new bank gains this on its balance sheet:
R D.
So the sequence is (1) create new deposit D and (2) transfer the deposit to the new bank. This
is the money-creation model in action. It is correct.
When we imagine that reserves are being loaned instead, we are actually skipping the balance
sheet marked * above. Comparing the balance sheet before and after the skipped one, we come to
believe that reserves have been turned into a loan. This is incorrect. The newly created deposit
is simply in a different bank. To see what is really going on, we have to consider the loan and
transfer separately.
Can anyone tell me where that $100 came from? Or the $200,000 to buy that archetypical house?
We got lots of "blind philosophers feeling their part of the elephant and pronouncing its essence"
but where does "wealth" originate, as opposed to money and "assets?"
"In the first case, banks have no special status in the economy. After all any of us who has
a balance of $100 can lend out that balance of $100"
yes you can lend it out, but the bank is 1) at the top of collectors line 2) has backing from
the FDIC. When you loan 100$ to someone, you dont have that money anymore. When you lend 100$
to the bank, you still have that money, and about 10 other people have it as well.
I'm sure it must be obvious to brighter and more subtle folks than me, but where does that
$100 that's referenced here come from?
I have an antique wood-bodied block plane (the woodworking kind) made by my great-grandfather
( except for the perfect cast iron blade and two nails). He used tools he made or bought to carve
the body and chisel out the throat and make the wedge. I was offered $100 for it recently. Where
does the wealth or value that my ancestor's plane, now mine by inheritance and survival, come
from? Or all the other $100s that make up " the economy" that the MorgulBankers are conjuring
derivatives out of?
. . .I was offered $100 for it recently. Where does the wealth or value that my ancestor's
plane, now mine by inheritance and survival, come from?
From your ancestor's labor in creating the plane and an ongoing demand from people interested
in acquiring the plane.
Where the $100 offer comes from is the perceived value of the plane compared to other planes
on offer, such as for example the Chinese made crap in Home Depot.
Since it sounds like you didn't sell it for $100, you value it at a higher price. Wondrous
market eh.
What is truly amazing about this is that in year 2016 there is still massive confusion and
ambiguity about how money and banking work. How can that be? Bizarre!
A. Easily: "the false theories are guiding current bank regulation and development policy,
leading down a blind alley." If correct understanding would lead to a correct regulation, then
those whose interests would no be served by correct regulation will obfuscate correct understanding.
Baby yoga for kids living in the forest, who never go outside alone; the highest real mortality
rate in the US; and the prototype for Family Law feeding Obamacare in the big city – does it get
any dumber than that?
The psychologists are just smart enough to get the majority killed. The markets are an exercise
in control, a game, and nothing more, until Little Johnny jumps off Science Building and shorts
the insanity all together. Did you see that last impulse, transferring wealth to the Soros clan,
now demanding another bailout?
The assumption of emotion-based decisions, lest one be a robot, is ludicrous, but that is the
basis of empire marketing. The majority short-circuits itself, with the false assumptions presented
by empire media broad band, the frequency it chooses to occupy, to mirror itself, and obsessive-compulsive
behavior begets itself. The brain stem is a geared Archimedes Screw.
Because the body is grounded to earth, the dc side of the brain is self-obsessed, and LSD offsets
the signal into the noise of the clutch, is no reason to hand your life over to a psychologist
printing money. Because the predicitive subconscious exists in a feedback loop with adaptation
doesn't mean that everyone is sick, stuck on an empire frequency, and mentally ill if they don't
seek diagnosis. Money is not reality, except for those who choose it.
Wall Street sells mortgages with increasing duration, Madison Avenue produces crap for compliance
at increasing cost, and the majority indentures future generations with bonds, until they can't.
Global finance simply liquidates natural resources and moves, in planetary rotation. Relative
to unincorporated farming, the land is largely fallow, but the participants have TV, cardboard
and gadgets, dependent upon empire for a battery.
Net, populations vacillate between denial and depression, with growing impulses of anger, in
a market for psychologists who see others as a reflection of themselves. Married people raising
independent children cannot afford to be quite so stupid. And without such children, the economy
can only implode, reflecting the psychologists' own self-obsession.
Do you remember that story about the natives not seeing Christopher's ship, until the shaman
pointed it out, when the natives were slaughtered by war, disease and poverty?
Females can breed on equal rights for a thousand years, with males providing the technology,
but they will just end up a thousand years behind the curve. Women are bred to think in linear
time, and men to think in frequency, because that is what children need. One is the counterweight
and the other is the cab.
The majority, focused on self, rides the counterweight to floors on one side, all dead ends,
and is jealous of children exiting on the other side. The choice at the crossroad is always the
same, investment or consumption. The majority is not experiencing falling living standards and
increasing income inequality because some banker provided the money, an excuse, for multicultural
unicorn dreaming.
Retired people generally prefer a Fred and Wilma economy, city kids generally prefer a rat
race, and once separated for the purpose, the police are generally dispatched to slice and dice
families into sausage to feed the former, by authorities always pleading ignorance, majority vote.
Once you see those cops, promoting gang awareness, it's time to go. At empire cycle begin, you
have plenty of time; now you have none.
When I began writing this, I had no idea where the focus would be, but I do have a pattern
database and a linear time translator, such as it is. My wife can tell you the weather 25 years,
3 months and 10 days ago. Choose a wife that enjoys living in the moment, and a husband that enjoys
an independent frequency, compliments capable of trust in an untrustworthy world.
My mind is a steel trap, my wife's is Disneyland, and we live in the feminist capital of the
world, as you might suspect with an ac mind. Your perspective is your own, if you choose to have
one, and we all go through phases, climbing and descending the ladder of consciousness. I am simply
sharing, after decades of listening and saying not a damn word, in the empire, on the eve of WWIII.
From the perspective of legacy, which has no clue what is in those libraries, the Internet
was designed to extend linear thinking, to nowhere. From the perspective of labor, the Internet
was designed to demonstrate the fallacy of limiting yourself to linear thinking. Contrary to popular
mythology, choice is not about the color of your tennis shoes made in China.
If it's not anonymous cash, it cannot store value, because independent children are reared
beyond empire's grasp, the physical manifestation of intellectual self-obsession, which Sweden
is now learning, way to late, a slave to Germany, and Austria in particular. Knowing what needs
to be done and doing it are two different things. The psychologists in New Hampshire produce drug
addiction, their solution is drug rehab, and Iowa is supposed to be nuts.
You didn't think Keynes sprang from nothing did you?
Thanks. The wife likes to keep track of water. She's like a human testing machine. Best water
I had was up at bay of fungi, big moose. That document on Ford's car made of hemp and plastic
was pretty cool, before he was told he would be making cars out of steel, finance.
Always thought I would end up in Australia, but like the doctor thing, the critters have to
destroy everything they touch.
"Contradictions, of which money is merely the palpable manifestation, are then to
be transcended by means of all kinds of artificial monetary
manipulations. It is no less clear that many revolutionary
operations with money can be carried out, in so far as an attack on
it appears only to rectify it while leaving everything else
unchanged. We then beat the sack on the donkey's back, while
aiming at the donkey. But so long as the donkey does not feel the
blows, one actually beats only the sack, not the donkey;
contrariwise, if he does feel the blows, we are beating him and not
the sack."
At the end of the day, what ultimately needs to be impacted is not the pieces of paper.
All we can ever do with those is hand people claims against future production.
And when the theory of "managing" an economy stops at the control of aggregate numbers as its
only allowable tool to influence the process, it can never accomplish the objective of avoiding
major crises.
"... Half of oil production from future developments is uneconomic at US$60/bbl Brent. These comprise of conventional projects which have yet to receive final investment decision (pre-FID) and future drilling in US onshore Lower 48 plays; which are critical for future oil supply. ..."
"... Production from most future developments is required to fill the supply gap between declining commercial fields and projected growth in demand. ..."
"... Prices need to support the development of the next tranche of supply. This breakeven analysis provides support for an oil price floor in the longer term of above US$70/bbl. ..."
"... Over 80%, or around 16 billion barrels, of deepwater and ultra-deepwater reserves are uneconomic at $60/bbl. ..."
"... The economics are relatively robust within onshore, tight oil and shallow water projects. In fact US Lower 48 is now the key low cost area and by 2025 contributes 70% of volumes produced under $60/bbl. ..."
Half of oil production from future developments is uneconomic
at US$60/bbl Brent. These comprise of conventional projects which have yet to receive final investment
decision (pre-FID) and future drilling in US onshore Lower 48 plays; which are critical for future
oil supply.
By 2025, production from pre-FID projects and US Lower 48 future drilling could be nearly
15 million b/d. Only 7.6 million b/d comes from projects which achieve commerciality at US$60/bbl,
a likely screening criteria.
Production from most future developments is required to fill the supply gap between declining
commercial fields and projected growth in demand.
Under our Macro Oils supply-demand outlook over 22 million b/d is needed from new developments
by 2025 to meet demand. We expect the pre-FID pipeline to contribute around half of this. However,
the number of deferred pre-FID projects is growing as the oil price remains low. Without significant
structural cost deflation, the majority of these projects, are at risk of further delay or a major
overhaul of development plans.
Prices need to support the development of the next tranche of supply. This breakeven analysis
provides support for an oil price floor in the longer term of above US$70/bbl.
Deepwater and ultra-deepwater projects sit high on the cost curve and are at greatest risk
of delay. Production from Angola, Nigeria, US Gulf of Mexico and Brazil is at risk due to weak
project economics. Over 80%, or around 16 billion barrels, of deepwater and ultra-deepwater
reserves are uneconomic at $60/bbl.
The economics are relatively robust within onshore, tight oil and shallow water projects.
In fact US Lower 48 is now the key low cost area and by 2025 contributes 70% of volumes produced
under $60/bbl.
"Officials from the International Monetary Fund and the World Bank are heading to Azerbaijan to
discuss a possible $4bn emergency loan package in what risks becoming the first of a series of
bailouts stemming from the tumbling oil price. The fund and the bank have also been monitoring
developments in other oil-producing countries"
http://www.ft.com/cms/s/0/9759f42a-c51b-11e5-b3b1-7b2481276e45.html#axzz3yWDvV55d
"... Looking to the current year, the Company expects first quarter 2016 production will be in a range of 210,000 and 220,000 Boe per day and expects to exit 2016 with fourth quarter production between 180,000 and 190,000 Boe per day, reflecting reduced drilling and a lower level of well completion activity. ..."
"... Non-acquisition capital spending is expected to be approximately $300 million in first quarter 2016, down from an estimated $395 million in the fourth quarter of 2015. By fourth quarter 2016, capital expenditures are expected to decline to approximately $200 million. ..."
"... The Company estimates its 2016 capital expenditures budget will be cash flow neutral at an average WTI price of $37 per barrel for the full year. At an average WTI price of $40, the Company estimates 2016 results would be cash flow positive in excess of $100 million. ..."
"... even if the industry is hedged at, say, 10 percent overall for the industry, that would imply some 900,000 bbl per day to be removed in 2016. ..."
"... Oil storage levels would begin drawing down as a result. Since storage levels, calculated in 'days of supply,' is only about 4-5 days over the long-term average, a 10 percent drop in production should rebalance the market closer to the 25 days' worth of supply, a level that the U.S. saw for years (compared to the 29-30 days of supply that the U.S. has in storage right now). ..."
"... Further I find it hard to believe that oil production can be sustained into 2017 when cap ex gets cut 50 percent, given that depletion by then will kick in, resulting in at least 30% drop in production from new wells in 2016. Barring a dramatic rebound in prices, the industry just won't be able to compensate for falling output. ..."
"... this is the new normal and will result in a much slower ramp up in production even if prices rise, as new investment must now be funded with CF vs external financing. ..."
"... Eventually that will sow the seeds of a bull market as supply flat lines and demand, driven by better economic growth, starts to fuel price increases in 2017. Any production increases will be very gradual and will only follow prices, as capital will not readily be available as it was in the past. ..."
For CLR to remain a viable entity, it can just cover its cap ex via FCF at $40 oil. To earn an
adequate return for its shareholders of about 20 percent would imply oil prices probably normalizing
in the $50s, enough to sustain the industry at least.
2016 Guidance Detail
Looking to the current year, the Company expects first quarter 2016 production will be in
a range of 210,000 and 220,000 Boe per day and expects to exit 2016 with fourth quarter production
between 180,000 and 190,000 Boe per day, reflecting reduced drilling and a lower level of well completion
activity.
Non-acquisition capital spending is expected to be approximately $300 million in first quarter
2016, down from an estimated $395 million in the fourth quarter of 2015. By fourth quarter 2016,
capital expenditures are expected to decline to approximately $200 million.
The Company estimates its 2016 capital expenditures budget will be cash flow neutral at an
average WTI price of $37 per barrel for the full year. At an average WTI price of $40, the Company
estimates 2016 results would be cash flow positive in excess of $100 million.
... ... ...
...However even if the industry is hedged at, say, 10 percent overall for the industry, that
would imply some 900,000 bbl per day to be removed in 2016.
Oil storage levels would begin drawing down as a result. Since storage levels, calculated
in 'days of supply,' is only about 4-5 days over the long-term average, a 10 percent drop in production
should rebalance the market closer to the 25 days' worth of supply, a level that the U.S. saw for
years (compared to the 29-30 days of supply that the U.S. has in storage right now).
Further I find it hard to believe that oil production can be sustained into 2017 when cap
ex gets cut 50 percent, given that depletion by then will kick in, resulting in at least 30% drop
in production from new wells in 2016. Barring a dramatic rebound in prices, the industry just won't
be able to compensate for falling output.
You notice also a change in the way senior management is managing the business, shifting
from EBITDA vs FCF as it de-levers or at least avoids any additional debt to fund cap ex.
As I have previously stated: this is the new normal and will result in a much slower
ramp up in production even if prices rise, as new investment must now be funded with CF vs external
financing.
Eventually that will sow the seeds of a bull market as supply flat lines and demand, driven
by better economic growth, starts to fuel price increases in 2017. Any production increases will
be very gradual and will only follow prices, as capital will not readily be available as it was in
the past.
... ... ...
You can find a video commentary
with this post via Twitter @ lbrecken13.
Leonard is a portfolio manager and principal at Brecken Capital LLC, a hedge fund focused on
domestic equities
"... Thanks to a great post from John Kemp from Reuters we now know who is behind the magically higher imports starting in 2015 and that continues. This incremental 500,000 barrels per day of imports has been the primary reason for why the U.S. market remains imbalanced (although not nearly as much as what is portrayed in media). ..."
"... The motives for Saudi Arabia's oil market strategies today – whether for vengeance, ego, politics or irrationality – cannot be known for sure. But it surely was not economics, given the price drop in 2015. A 50 percent drop in price on 9 million barrels per day (mb/d) was not made up by a 500,000 bpd [exports] increase. ..."
"... I should also note that almost all of the Saudi production ramp up in 2015 went to fuel this surge. We should recall a U.S. State Department visit to Saudi Arabia in late summer 2014 when all of this started, as the dollar rose and Russia Ruble imploded. In light of the recent EPA methane crack down and tax levy on U.S. wells, one has to wonder how much of a coincidence all this is, as there is clearly a war on fossil energy as the global warming agenda ramps up. ..."
The so-called experts know this yet they continue to cloud the issue with ideologically based
biased spin.
Thanks to a great post from John Kemp from Reuters we now know who is behind the magically
higher imports starting in 2015 and that continues. This incremental 500,000 barrels per day of imports
has been the primary reason for why the U.S. market remains imbalanced (although not nearly as much
as what is portrayed in media).
The motives for
Saudi Arabia's oil market strategies today – whether for vengeance, ego, politics or irrationality
– cannot be known for sure. But it surely was not economics, given the price drop in 2015. A 50 percent
drop in price on 9 million barrels per day (mb/d) was not made up by a 500,000 bpd [exports] increase.
I should also note that almost all of the Saudi production ramp up in 2015 went to fuel this
surge. We should recall a U.S. State Department visit to Saudi Arabia in late summer 2014 when all
of this started, as the dollar rose and Russia Ruble imploded. In light of the recent EPA methane
crack down and tax levy on U.S. wells, one has to wonder how much of a coincidence all this is, as
there is clearly a war on fossil energy as the global warming agenda ramps up.
"... Profitability is not enough. At some point quantity (price/EROEI) turns into quality ( secular stagnation ). Estimates vary but there is some evidence that EROEI in single digits is an invitation to troubles. Some researchers suggest that a minimum EROEI of 7 (average for all sources of energy used; individual sources can probably be lower if high EROEI sources are present in the mix) is necessary for avoiding secular stagnation . ..."
"... I dont think we need to measure EROEI, because I am of the opinion that EROEI is reflected quite well in the cost of production. For example Canadian synthoil has a very low EROEI, and that is reflected in its high input costs that give it a high break-even cost. ..."
The decision to produce or consume oil, natural gas, or coal is not decided based on EROEI,
which is not very well measured, and estimates of EROEI vary a lot.
The EROEI concept applies to the economy as a whole for all energy resources. As long as the
net energy of all energy used by the economic system is adequate to keep the system functioning
then various types of energy will be produced as long as it can be done profitably (in money terms).
As net energy becomes scarce, energy in general will become more expensive and those types
of energy with higher EROEI will become cheaper than low EROEI types of energy and society will
move towards those types of energy.
In addition as energy becomes more expensive it will be used more efficiently.
The transition will be difficult, maybe not possible, but we will do the best we can.
On your "low price removes surplus", not really.
Low prices removes the highest cost energy, which has the lowest surplus energy, so very little
surplus energy is removed by low prices.
If we look at the average amount of surplus energy per unit energy in the energy produced when
energy prices are low, we would find that the surplus energy per unit energy produced had increased
as the high cost (low surplus energy) production was shut down due to low energy prices.
"As long as the net energy of all energy used by the economic system is adequate to keep the
system functioning then various types of energy will be produced as long as it can be done profitably
(in money terms)."
Profitability is not enough. At some point quantity (price/EROEI) turns into quality ("secular
stagnation"). Estimates vary but there is some evidence that EROEI in single digits is an invitation
to troubles. Some researchers suggest that a minimum EROEI of 7 (average for all sources of energy
used; individual sources can probably be lower if high EROEI sources are present in the mix) is
necessary for avoiding "secular stagnation".
This comment refers to the old 2013 paper that compared electrical power generations alternatives
(Weißbach et al. "Energy Intensities, EROIs (energy Returned on Invested), and Energy Payback
Times of Electricity Generating Power Plants." Energy 52 (April 1, 2013): 210–221. doi:10.1016/j.energy.2013.01.029).
the paper is behind pay wall but the link to the spreadsheet with result exists:
The key they have found is to normalize not just across power quantity, but also quality. A
key aspect of quality is "usability," which is the degree to which the supply of power matches
the real-time demand. Intermittent and invariable baseload power sources must be adjusted for
the amount of buffering necessary to match their output to the real world of variable demand.
The study authors did this by requiring each source to have the overcapacity and storage necessary
to be compatible with a large international European grid scenario, and they used pumped-hydro
power storage parameters since it is today's most cost-effective option for storage and buffering.
The study is behind a paywall…
In their analysis, they found that a minimum EROI of 7:1 was necessary for economic viability.
With that in mind, here are their results:
PV solar 2.3:1
Biomass Boiler: 3.5:1
Onshore Wind: 3.9:1
CSP Solar : 9.6:1
Natural Gas: 28:1
Coal: 30:1
Run-of-River Hydro: 35:1
PWR Nuclear: 75:1
== end of quote ==
BTW EROEI of ethanol is around 2 and oil sands below 7 which puts them at the bottom for liquid
fuels
== quote ==
Approximately 1.0–1.25 gigajoules (280–350 kWh) of energy is needed to extract a barrel of bitumen
and upgrade it to synthetic crude. As of 2006, most of this is produced by burning natural gas.[57]
Since a barrel of oil equivalent is about 6.117 gigajoules (1,699 kWh), its EROEI is 5–6. That
means this extracts about 5 or 6 times as much energy as is consumed. Energy efficiency is expected
to improve to average of 900 cubic feet (25 m3) of natural gas or 0.945 gigajoules (262 kWh) of
energy per barrel by 2015, giving an EROEI of about 6.5.[58]
Coyne – You are sounding more and more like a computer generated entity. Your response is no
response at all. You dismiss all of what I said with a wave of your mouse.
I said energy AND revenue… you can't make a coherent argument by just considering one and then
make another argument considering the other. Also trying to dismiss EROEI by stating that it is
"not very well measured" is getting very old and is specious at best, EROEI does matter no matter
what you say.
"As long as the net energy of all energy used by the economic system is adequate to keep the
system functioning".
Well how well is the global economic system functioning? My Point AGAIN is it is obviously
not functioning and to any degree that it is not out right collapsing is purely a function of
financial/monetary policy and intervention which AGAIN is not news to anyone with a brain but
has nothing to do with physical reality.
I thoroughly disagree. You sound a lot more like a man who has made his mind up,for good, and
is unwilling to consider that he might not be in sole possession of the truth, the whole truth,
and nothing but the truth, than Dennis Coyne.
EROEI is indeed not well measured, and estimates DO vary all over the place, especially when
renewables are concerned.
I am not in the energy business, but for sure low prices tend to remove any excess production
from any commodity market.
No doubt the world wide economy would be functioning BETTER if energy were cheaper, but there
are MANY reasons it is not functioning too well these days, and there is no reason in particular,
that I have seen that is clearly elucidated, to think THE KEY to current economic problems is
the cost of energy.
I do agree that the cost of energy, and EROEI is A key to understanding economic issues and
problems.
At one time, a few years back, I was sure the world would go to hell in a hand basket rather
suddenly, with little warning, as the result of running short of various depleting natural resources,
and still believe this MIGHT happen.
But while the fossil fuel age is going to be over in an eyeblink, in terms of history, it is
still going to last out the next couple of generations of men, at the very least.
The amount of adaptation men are capable of in just ONE generation is almost beyond belief,
when necessity puts the steel toed boot to the collective backside of a society.
EROEI is definitely important, but it is not a limit we are bumping up against, yet. Oil is
still a bargain, in terms of the utility of it. The tar sands industry can BURN IT'S OWN feedstock,
if necessary, and still deliver millions of barrels a day to market, at a good profit, when oil
goes back up to seventy or eighty bucks.
Renewable wind and solar power may actually scale up to the point that ENERGY IN hardly matters
at all, because the "IN "will be free and non depleting.
I usually find it necessary to open a couple of windows in our sun room on sunny winter days
even when it is only around freezing outside, or else it gets uncomfortably hot.
It's FREE energy, you see, and it costs NOTHING to waste it.;-)
As oil and gas prices double, we will eventually adapt and use oil and gas twice as efficiently,
unless something upsets the Business As Usual apple cart before we have time enough to adapt.
Dennis sees it, I see it, and just about anybody with an open mind sees it. Of course at some
point, we will have to not only use energy more efficiently, we are simply going to have to use
a LOT less all the way around, unless we hit the renewables jackpot………….
If I were young, I would be installing solar panels, and buying a used Volt or Leaf, and damned
near free myself of the necessity of buying gasoline for personal purposes. I have already fixed
up the old farmhouse to get by with a quarter of the energy we used to use to heat it, maybe less.
I don't think we need to measure EROEI, because I am of the opinion that EROEI is reflected
quite well in the cost of production. For example Canadian synthoil has a very low EROEI, and
that is reflected in its high input costs that give it a high break-even cost.
Similarly renewables that require heavy subsidizing to be installed are reflecting between
other things a low EROEI.
So if we assume that true cost of production is a good proxy for EROEI the matter simplifies
itself quite a lot. The true cost of production is a lot easier to calculate.
You expressed my thoughts about money and EROEI better than I did.
The only real hole in the argument of using money cost as a proxy is that sometimes one form
of fossil fuel energy is a LOT cheaper than another, for instance the energy in natural gas sells
for a lot less than the energy in oil.
This is because gas is not as useful as oil, for running cars and trucks, etc, but still relevant.
A product made using a lot of gas can sell cheaply enough that a lot of gas gets used up for
trivial purposes, and gas gets burnt here in the USA, wasting most of it, heating poorly insulated
houses and businesses.
"... As regards the future, I agree that Russia is on a plateau, with potential +/- 1-2% annual fluctuations around 2014-2015 average levels. ..."
"... Is it possible that there is some political bias in those reports by the Russian Oil Minister? ..."
"... Not any more likely than political bias by the EIA or NEB, imo. I think EIA numbers for the US are pretty good, NEBs numbers for Canada are best and the Russian Energy Ministry numbers for Russia would be best. ..."
"Russia peaked in January at 10,246,000 bpd and in Octber was down 106,000 bpd to 10,140,000 bpd.
Russia appears to be on a plateau, likely before a slow decline that begins in 2016."
Oh yes, the EIA doesn't know exactly how much oil is produced in the U.S., but they surely
know better than the Russian Energy Ministry what are production volumes in Russia.
As regards the future, I agree that Russia is on a plateau, with potential +/- 1-2% annual fluctuations
around 2014-2015 average levels.
Alex, the EIA depends entirely on other sources for its Russian oil production reports. This is
very similar to OPEC's "Secondary Sources". The EIA and JODI, for the last three years or so,
are extremely close with their Russian production numbers. They both report numbers well below
what the Russian Oil Minister reports. And they both often report a monthly decline in production
when the official Russian numbers report an increase in production.
Is it possible that there is some political bias in those reports by the Russian Oil Minister?
Not any more likely than political bias by the EIA or NEB, imo. I think EIA numbers for the
US are pretty good, NEB's numbers for Canada are best and the Russian Energy Ministry numbers
for Russia would be best.
Dennis, I do appreciate your input but sometimes you just try way too hard to be fair.
;-) What motive
would the EIA or the NEB have for fudging the numbers? And which way would they fudge them if
they did?
A perfect example: If you go to OPEC's
MOMR
and check the production numbers for each OPEC nation, you will find two different sets
of numbers. One set will be from "Secondary Sources" and the other set will be from "Direct Communication".
The direct communication numbers, for several countries, is always off by several hundred barrels
per day. For others the two sets of numbers are relatively close. The difference is some have
a motive for fudging the numbers, others do not. And also, secondary sources, such as Platts and
others, is almost always more accurate than the numbers produced by direct communication with
the country itself.
Also Dennis, I must ask, and this is very important, does the EIA or NEB have a reputation
of producing propaganda? Does the Soviet Government have a reputation of producing propaganda?
Now I do fault the EIA in some of their numbers. But they do not fudge the numbers deliberately.
But due to budget restraints or lack of a good data source they sometimes just seem to insert
a number. But there is no malicious intent here. They don't have a good number so they just use
the last good number they had… again.
As to those Russian numbers. JODI, when they reduced Russia's numbers significantly a few years
ago, was highly criticized for doing so. (They just brought them into line with what the EIA was
already reporting.) They said they had several sources for those numbers and stood by them. Now
the JODI numbers and the EIA numbers still vary but not by any significant amount. Prior to that
adjustment JODI had been using Russia's direct communication numbers.
Bottom line, I trust the EIA's and JODI's "Secondary Sources" far more than I trust Russia's
"Direct Communication".
You may not have noticed, but the Soviet Union no longer exists.
;-)
AlexS is very sharp, if the Russian Energy ministry was fudging its numbers he would be aware.
I have no evidence that the Russian Energy ministry is fudging any numbers and to assume otherwise
is a mistake in my opinion.
I agree the OPEC numbers based on direct communication may be fudged, there is no auditing
of OPEC data.
The Russians report in metric tonnes rather than barrels or cubic meters so the output numbers
depend on the appropriate average density of the oil.
The difference between US and Russian data may be a matter of how C5 is reported, in the US
C5 produced in the field is counted with crude and C5 produced in a natural gas processing plant
is considered NGL.
This is a strange distinction unique to the United States. In Canada all pentanes and pentanes
plus are grouped together regardless of where they are produced, perhaps Russia does the same.
If so, it is the US EIA which is not accounting for C+C properly rather than the Russians,
so I am being both fair and logical if my guess is correct.
I don't know Russian so I cannot read the Russian Energy Ministry website. Perhaps AlexS can
comment on how pentanes( and C5+) from natural gas processing plants in Russia are reported. Are
they included in C+C output numbers (similar to the way Canada reports its data)?
Hi AlexS. It would be nice to have a link to the source of that data. Looking at the discrepancy
to other datasets I work with, I would guess it is not reporting exactly the same products. The
EIA C+C dataset is pretty restrictive (as it should be), for instance, it only includes fossil
products that are stable in liquid state at the surface.
The numbers are in tons per months. I am using 7.3 barrels/ton ratio to convert into b/d. Condensate is included, but not NGLs.
More detailed data by each company and by each subsidiary of large vertically integrated companies
is available in the CDU TEK (a Russian analogue of the EIA) website, but it's not free.
These detailed numbers are republished in a number of Russian oil&gas industry journals (also
not free). Detailed monthly and annual averages in kb/d are also published by Energy Intelligence (paid site)
http://www.energyintel.com/pages/login.aspx?fid=art&DocId=913740
But they are using 7.33 conversion ratio, so their numbers in kb/d are slightly higher than mine.
>
"... In North Dakota, abandoned wells not plugged and the landscape not restored, equipment remaining
at the site, not producing paying production, the well is forfeited to the state. No longer property
of the producer, there it was gone. The State of North Dakota has rules, you must abide by them or lose
your assets. ..."
"... After a well has been in abandoned-well status for one year, the wells equipment, all well-related
equipment at the well site, and salable oil at the well site are subject to forfeiture by the commission.
..."
"... As I previously noted, the 2008 oil price decline was, compared to this one, a micro-decline.
If we define the price slump as the number of months since an average monthly price of $100–before seeing
a sustained price increase–prices only fell for four months in 2008, before starting a sustained price
increase (monthly Brent prices). Based on same metric, we are at 17 months and counting. ..."
"... I suspect that the US needs to put on line around 1.5 million bpd of new C+C production and
around 17 BCF/day of new dry gas production this year, just to offset declines from existing wells,
with a total rig count that is currently in the low 600s versus 1,700 to 2,000 in recent years. ..."
In North Dakota, abandoned wells not plugged and the landscape not restored, equipment remaining
at the site, not producing paying production, the well is forfeited to the state. No longer property
of the producer, there it was gone. The State of North Dakota has rules, you must abide by them
or lose your assets.
Drilling is probably going to go to zero as soon as all leases expire. Just a hunch, nothing
else.
2017 is the best guess when it will all come to a screeching halt.
Page 12: N.D.C.C. 38-08-04.1L – The placing of wells in abandoned-well status which have not
produced oil or natural gas in paying quantities for one year. A well in abandoned-well status
must be promptly returned to production in paying quantities, approved by the commission for temporarily
abandoned status, or plugged and reclaimed within six months. If none of the three preceding conditions
are met, the industrial commission may require the well to be placed immediately on a single-well
bond in an amount equal to the cost of plugging the well and reclaiming the well site. In setting
the bond amount, the commission shall use information from recent plugging and reclamation operations.
After a well has been in abandoned-well status for one year, the well's equipment, all well-related
equipment at the well site, and salable oil at the well site are subject to forfeiture by the
commission. If the commission exercises this authority, section 38-08-04.9 applies. After
a well has been in abandoned-well status for one year, the single-well bond referred to above,
or any other bond covering the well if the single-well bond has not been obtained, is subject
to forfeiture by the commission.
2017 is the best guess when it will all come to a screeching halt.
Not likely. Prices are already starting to rise and by 2017 they will likely be high enough
for activity to continue. I would not venture a guess as to what that price may be however, or
just how much activity will continue.
As I previously noted, the 2008 oil price decline was, compared to this one, a micro-decline.
If we define the price slump as the number of months since an average monthly price of $100–before
seeing a sustained price increase–prices only fell for four months in 2008, before starting a
sustained price increase (monthly Brent prices). Based on same metric, we are at 17 months and
counting.
Note that it took about two years for the US total rig count to return to prior levels, after
the "V" shaped 2008 oil price decline (even with the benefit of very easy financing).
And as I have also previously noted, I suspect that the US needs to put on line around
1.5 million bpd of new C+C production and around 17 BCF/day of new dry gas production this year,
just to offset declines from existing wells, with a total rig count that is currently in the low
600's versus 1,700 to 2,000 in recent years.
The benefit of $1.50 gasoline v. $2.50 gasoline is outweighed by the massive business failures
at $15-25 well head oil, v. $55-65 well head oil.
Says the producer. The aggregate annualized expenditure decline of $450 billion for U.S. consumers
at $30 relative to $100 oil disagrees. Says the consumer.
Finally, how much of the $450 billion is taken out of the pockets of labor and business owners
in the United States?
Why are the markets not booming with these low gasoline prices, which, combined with gas mileage
for the fleet, are possibly the lowest since the 1960s?
Grain is low, is this helping the consumer also?
Copper is low, is this also helping the consumer?
Don't get me wrong, commodity price spikes hurt. But the commodity prices here are deflationary,
IMO.
> The aggregate annualized expenditure decline of $450 billion for U.S. consumers at $30 relative
to $100 oil disagrees.
> Says the consumer.
Think about this not as savings for US consumers but as a re-distribution of 450 billions up
to the top 1%.
Those $450 billion are partially paid with destroyed jobs, reduced maintenance, bankruptcies
and huge (50% or more) losses for investors in energy companies, mutual find, ETFs and oil ETNs
(here naïve investors were simply wiped out).
Oil producing countries will take measures to stem this damage in the future by bumping up
their refining capacities and cutting exports from G7 countries to the bones. Oil producing countries
were major buyers of G7 exports. Russia already made such a cut. Germany alone lost around 40
billions in exports to this country. And those exports will not return even if oil prices recover.
They are mostly gone. The US oil majors might also be affected with this backlash as this slump
is widely considered to be US+Saudi conspiracy. I wonder if some nations might try to kick them
out.
As energy is around 7% of S&P500, many 401K accounts are also affected. For older people who
have larger sums in 401K losses from this may exceed savings at the pump.
Also investors in energy ETFs and mutual funds suffered huge losses (50% or more) and those
who invested in ETN were wiped out. Few of those who sold their holdings and took losses will
ever return to this sector.
In five states with shale oil patch damage from low oil prices collapse spread to municipal
bonds, real estate and retail. Those states are effectively back in 2008.
Oil conservation efforts were slowed down and in some cases reversed (SUV boom in the USA)
.
So even for the US consumers this oil price slump is a mixed blessing. The only winners are
Wall street sharks. Again, this is yet another redistribution of wealth up. This is how neoliberalism
works..
"Want to know how much further oil prices might fall? Don't ask Wall Street. Analysts at big banks
have been scrambling to lower their oil-market forecasts after prices plunged to 12-year lows below
$30 a barrel in January. As recently as November, banks were expecting the global Brent contract for
oil to average $57 a barrel in 2016..."
Excerpt from a missive I sent to some industry guys (I swiped and used a constant dollar oil price
chart that Alex prepared):
Some of you may recall the Economist Magazine cover story, published in early 1999, which predicted–because
of advances in technology and productivity gains (sound familiar?)–that we were looking at an
extended long term period with oil prices in the $5 to $10 range. While I suppose it's possible
that this time the conventional wisdom is right, i.e., that we are looking at perpetually low
oil prices, my bet is that the laws of physics will prevail, especially in regard to the high,
and rising, rates of decline in existing US oil & gas production.
In any case, here is an excerpt from the March, 1999 Economist Magazine cover story on oil
prices:
Here is a thought: $10 might actually be too optimistic. We may be heading for $5. Thanks
to new technology and productivity gains, you might expect the price of oil, like that of most
other commodities, to fall slowly over the years. Judging by the oil market in the pre-OPEC
era, a "normal" market price might now be in the $5-10 range. Factor in the current slow growth
of the world economy and the normal price drops to the bottom of that range.
Enclosed is a chart showing constant dollar monthly WTI Crude oil prices, in 2016 dollars.
Note that the March, 1999 Economist Magazine article corresponded pretty much to the all time
record low constant dollar oil price for the past 40 years.
And as I noted, I think that I have made a strong case that the trillions of dollars spent
on upstream global oil & gas capex since 2005 have only been sufficient to keep us on an undulating
plateau in actual global crude oil production (45 API Gravity and lower crude oil), and because
of the large and ongoing declines in global upstream capex, even the Wall Street Journal is expressing
concerns about a future oil price spike, as supply falls.
The Cornucopian Crowd, basically making the same argument as the Economist Magazine writer
in 1999, is arguing that advances in technology have indefinitely postponed any kind of production
peak to the far distant future.
I think that the reality is much more prosaic.
In my opinion, the reality is that global crude oil production has probably effectively peaked,
while global natural gas production and associated liquids (condensate and natural gas liquids)
have so far continued to increase. Furthermore, I suspect that all, or virtually all, of the large
build in US (and probably global) C+C inventories in 2015 consists of condensate.
[Jan 29, 2016] US rigs down 18, oil rigs down 12, gas rigs down 6, Texas down 13
The
Baker
Hughes Rig Count is out. US rigs down 18, oil rigs down 12, gas rigs down 6. Texas down 13. Canadan
rigs down when they should be going up. They usually peak in February.
"... Note that US C+C inventories rose by 100 million barrels from late 2014 to late 2015. So, as we saw a 100 million barrel increase in US C+C inventories, US net total liquids were up by 13%, from 12/14 to 12/15? Almost makes one think that most, if not all, of the C+C build consists of something besides actual crude oil. ..."
"... This is yet another indirect confirmation of "Great Condensate Con" hypothesis. ..."
Based on foregoing, annual 2015 US net total liquids imports were still down in 2015, versus
2014, but US net total liquids imports rose from 4.5 million bpd in December, 2014 to 5.1 million
bpd in December, 2015.
Note that US C+C inventories rose by 100 million barrels from late 2014 to late 2015. So, as
we saw a 100 million barrel increase in US C+C inventories, US net total liquids were up by 13%,
from 12/14 to 12/15? Almost makes one think that most, if not all, of the C+C build consists of
something besides actual crude oil.
(As usual, there appear to be some discrepancies between the EIA Weekly Supply data and the
Annual Energy Review data in regard to total liquids net imports. In any case, the four week running
average data show that US net crude oil imports rose from 6.9 million bpd in December, 2014 to
7.3 million bpd in December, 2015. Net crude oil imports are not broken down separately in Annual
Energy Review.)
likbez, 01/29/2016 at 1:12 pm
This is yet another indirect confirmation of "Great Condensate Con" hypothesis.
By reducing oil prices, Saudi Arabia is waging a secret war against Russia and Iran, according to
political analyst Bassam Tahhan.
In
an
interview with RT , political analyst Bassam Tahhan said that Saudi Arabia and the other countries
of the Gulf Cooperation Council are trying to force down oil prices in order to harm Iran and a number
of other oil-producing countries, including Russia.
"A secret war is being waged by
Saudi Arabia and Gulf Cooperation Council states which are slashing oil prices so as to strangle
Iran, Russia, Algeria and Venezuela, as well as the entire 'anti-American' axis created by these
countries," Tahhan said.
He explained that all those countries had refused to adhere to Washington's demands with regard
to
Ukraine , Syria and
Yemen .
According to Tahhan, the oil spat between Riyadh and Tehran is unlikely to lead to a war, given
Iran's military potential and the sheer territory of the country.
What's more, he said, Saudi Arabia will fail to prod the UN or the West to issue a resolution
to condemn Iran and authorize invasion of the country.
Rather, Saudi Arabia itself may be attacked by Iran's allies, such as Yemen, a scenario that Tahhan
said may see Saudi oil fields destroyed and oil prices rise.
At the same time, he noted that
the United States is unlikely to say "no" to the war between Saudi Arabia and Iran, because Washington
could supply arms to both parties to the conflict.
Earlier this month, international business analyst
Ralph Winnie told Sputnik that Saudi Arabia has dropped its oil prices to try and wreck the Iranian
economy and keep Tehran's oil exports out of major European markets.
"The Saudis are looking to gain a competitive advantage: this is a response to the lifting of
Western economic sanctions on Iran , which allow the Iranians to reenter the global energy marketplace,"
he said.
His remarks came after the Saudi oil giant Aramco announced that it would cut oil prices for Europe,
apparently in preparation for Iran's resumption of oil exports to the region later this year.
He was echoed by Executive Intelligence Review senior editor
Jeff Steinberg , who said in a separate interview with Sputnik that by slashing their oil prices,
the Saudis were targeting US and Russian oil producers as well as the Iranian ones.
"... EIA oil price predictions have been and are too linear. The oil price will be in my opinion much more volatile than predicted in the STEO2016. ..."
"... As soon as the year over year decline (in my above chart) turns around, prices will go up again. I expect huge swings in the oil price as the leverage in the oil market is now enormous (very low net exports are now available). The next price rise could be ferocious and could go over 200 USD per barrel in a very short time period. ..."
"... What is in my view important is that the time of a stable long term price band width as we have seen it over decades, is over. There is simply too much leverage in the system – on the downside as well as the upside. ..."
"... As consumption of oil influences very much global current account balances – and thus changes capital flows and currencies in a huge way – the system is unstable. ..."
"... So, no – we will not get a stable fair price of oil of around 60 USD/barrel for a long time. As soon as the market turns around we will shoot up way above 60 USD/barrel. Shale changed the oil market for sure, but it created also volatility. ..."
"... At some point OPEC will realize that the price volatility does not serve them well. Hopefully high cost producers will be cautious about thinking that OPEC will bail them out if they overproduce in the future and a little more discipline will be shown in the oil industry. Lenders might also be a little less willing to lend in the future after they have lost their shirts. ..."
"... I agree however that volatility is the most likely scenario with oil swinging from $50 to $150 and back in annual cycles (or less), not a great investment climate (as the cycles will be highly irregular). ..."
"There will be some continued investment in drilling new wells, an assumption of zero investment
in the oil industry is not a good one, so realistically decline might be 2 Mb/d. There are also
long term projects that already have huge sunk costs which will go forward even at low oil prices,
so decline in 2016 is more likely to be 1 Mb/d than 2 Mb/d."
I agree. Actually the decline of production might be even smaller due to "Great Condensate
Con" (GCC). But my point is that the reduction of capex now create qualitatively new environment:
"un-creative destruction" environment for "raw" oil exports so to speak.
With money becoming tight for oil industry (at current oil price level) and redirection of
capex on creation of new refineries and chemical plants as well as increased domestic consumption
in Asia, I think that the decline in oil exports (not production, but exports) in 2016 will be
larger then the decline in oil production and larger then EIA forecast. That's about it, as for
my forecasting capabilities ;-)
In view of this effect there a secondary phenomena that can happen: rumpling up investment
in case oil prices became "more normal" might well occur with the usual lag of around 18 months
and exports remain declining for a longer period then production, while the demand for transportation
and internal consumption by chemical industries in oil producing countries and Asia stimulated
by low oil prices will continue to increase continually.
So with an appropriate trigger event during the those hypothetical 18 months there can be an
oil price spike. Quite violent price spike because the system a whole (aka neoliberal economy)
is not stable and move of oil prices up might well be amplified by Wall Street in the same manner
as the current move down.
In other words, certain preconditions now were created for an oil price spike far above usual
"fair" $70-$80 level and may be for setting a new record. Whether it materialize remains to be
seen.
EIA oil price predictions have been and are too linear. The oil price will be in my opinion
much more volatile than predicted in the STEO2016. Depending on the consequences of the recent
bond market crash, it is important to observe the reaction of the companies. BHP has for instance
canceled any rig in Fayetteville and Haynesville. I guess the production cuts are coming now very
quickly. As soon as the year over year decline (in my above chart) turns around, prices will go
up again. I expect huge swings in the oil price as the leverage in the oil market is now enormous
(very low net exports are now available). The next price rise could be ferocious and could go
over 200 USD per barrel in a very short time period.
What is in my view important is that the time of a stable long term price band width as we
have seen it over decades, is over. There is simply too much leverage in the system – on the downside
as well as the upside.
As consumption of oil influences very much global current account balances
– and thus changes capital flows and currencies in a huge way – the system is unstable.
The shale
boom stabilized somewhat currencies, yet created a massive imbalance in the bond market. So oil
will go down as long as something breaks (in this case it is in my view the US high yield bond
market) and then it will go up in the other direction again. So, no – we will not get a stable
'fair price' of oil of around 60 USD/barrel for a long time. As soon as the market turns around
we will shoot up way above 60 USD/barrel. Shale changed the oil market for sure, but it created
also volatility.
Increased volatility in price is surely coming; as unsustainable lows [for producers] reduce forward
supply and push up price only to hit a weak demand response. Sure we've seen some steady demand
return in US and continue in China, but given the price signal that looks fairly muted, and will
prove, under price stress, to be weak. So I suggest that recent marginal consumption rise will
be able to be shed fairly quickly in times of higher price.
Marginal demand in mature economies [and China is maturing fast] looks to be 'induced' by supply
availability at a lower price; if we are around peak supply, we are clearly around peak demand
too. The recent bounce in US consumption [or 'demand' if you must] followed lower price, so it
isn't some quantity without which western civilisation will fall. Please note I am talking about
recent increases in consumption, not the bulk 90%.
All price action indeed takes place at the margins; of supply and consumption.
Gonna be messy, with many competing theories in MSM. And price volatility is a difficult environment
for attracting investment.
At some point OPEC will realize that the price volatility does not serve them well. Hopefully
high cost producers will be cautious about thinking that OPEC will bail them out if they overproduce
in the future and a little more discipline will be shown in the oil industry. Lenders might also
be a little less willing to lend in the future after they have lost their shirts.
I agree however that volatility is the most likely scenario with oil swinging from $50 to $150
and back in annual cycles (or less), not a great investment climate (as the cycles will be highly
irregular).
"... A year-and-a-half on from the start of the worst crude-oil price crash in a generation, the biggest U.S. and European energy companies have delayed projects and made such deep budget cuts that they will soon struggle to replace the oil they pump out of the ground with new reserves. ..."
"... Exxon and its peers are set to begin reporting fourth-quarter earnings this week, starting with Chevron on Friday. Analysts estimate that combined profits at the four biggest publicly traded Western oil companies will be about $22 billion, the weakest results since 1998, according to S P Capital IQ. Shell, Chevron, Exxon and BP declined to comment. ..."
"... "With the low price environment, you will see the economics around drilling getting worse and worse," he said. "More companies will be buying assets rather than continuing to develop." ..."
"... In round numbers, I suspect that the annual loss of US C+C production from existing wells has skyrocketed, from about 0.25 million bpd in 2008 to probably around 1.5 million bpd this year, and I don't think that changing the ownership of proven producing properties will have a material impact. ..."
A year-and-a-half on from the start of the worst crude-oil price crash in a generation,
the biggest U.S. and European energy companies have delayed projects and made such deep budget
cuts that they will soon struggle to replace the oil they pump out of the ground with new reserves.
That conundrum could have serious implications for Exxon Mobil Corp. , BP PLC, Chevron Corp.
and Royal Dutch Shell PLC because oil-and-gas reserves are critical to evaluating their growth
prospects.
Exxon and its peers are set to begin reporting fourth-quarter earnings this week, starting
with Chevron on Friday. Analysts estimate that combined profits at the four biggest publicly
traded Western oil companies will be about $22 billion, the weakest results since 1998, according
to S&P Capital IQ. Shell, Chevron, Exxon and BP declined to comment.
Facing poor returns for drilling and severe challenges to long-term growth, some big oil
companies have little choice but to turn to deals, said Anish Kapadia, an energy analyst at
Tudor Pickering Holt & Co. . . .
At current prices U.S. shale producers are losing more than $2 billion a week, according
to consulting firm AlixPartners LLP. That means as oil's crash grinds on, some shale companies
may be forced to fall into the arms of a willing buyer this year.
Oil-patch deals now look more attractive than they have in years, said Robin Bertram, the
oil-and-gas resource evaluation leader at Deloitte LLP. That is especially true for some of
the biggest oil companies, which largely sat on the sidelines during the U.S. shale boom.
"With the low price environment, you will see the economics around drilling getting
worse and worse," he said. "More companies will be buying assets rather than continuing to
develop."
Of course, changing the ownership of proven producing properties does not materially change
remaining recoverable reserves (the only positive effect might be that the acquiring party has
more money to put into enhancing existing production).
In round numbers, I suspect that the annual loss of US C+C production from existing wells
has skyrocketed, from about 0.25 million bpd in 2008 to probably around 1.5 million bpd this year,
and I don't think that changing the ownership of proven producing properties will have a material
impact.
By drilling new wells is what I assume you meant, but my point is that I don't expect to see
changes in ownership having a material impact on the remaining recoverable reserves from existing
producing wells.
Years ago at the Oil Drum, one article posted a chart that predicted Norway would decline, then
halt for a while around 2014, then after a few years begin declining again.
"... I feel KSA is waiting for non OPEC producers (Russia) to get on board with agreeing to production quotas. At the moment KSA is demonstrating just how volatile things can be for everybody in the oil production business. Once everyone is on board with quotas then some price stability can be more easily predicted. ..."
"... EIA expects global consumption of petroleum and other liquid fuels to grow by 1.4 million b/d in both 2016 and 2017. ..."
With consumption increasing and production decreasing I feel safe forecasting a price stabilization
or rise. Although Iran production will increase I don't think it'll be entirely exported. Some
will be consumed domestically to power manufacturing and agricultural production and exports.
Iraq is a wildcard. Maybe Iraqi increases will simply offset unconventional and LTO declines and
production will stay flat. The real wildcard is OPEC. The price will go up as soon as they have
a meeting and decide it does. I feel KSA is waiting for non OPEC producers (Russia) to get
on board with agreeing to production quotas. At the moment KSA is demonstrating just how volatile
things can be for everybody in the oil production business. Once everyone is on board with quotas
then some price stability can be more easily predicted.
EIA estimates global consumption of petroleum and other liquid fuels grew by 1.4 million b/d
in 2015, averaging 93.8 million b/d for the year. EIA expects global consumption of petroleum
and other liquid fuels to grow by 1.4 million b/d in both 2016 and 2017. Forecast real gross
domestic product (GDP) for the world weighted by oil consumption, which increased by an estimated
2.4% in 2015, rises by 2.7% in 2016 and by 3.2% in 2017.
Consumption of petroleum and other liquid fuels in countries outside the Organization for Economic
Cooperation and Development (OECD) increased by an estimated 0.8 million b/d in 2015, considerably
lower than the 1.4 million b/d increase in 2014 mainly because of the slowdown in Eurasia, which
saw a contraction in its consumption, and to a lesser degree because of China's slightly slower
demand growth. Non-OECD consumption growth is expected to be 1.1 million b/d in both 2016 and
2017, reflecting higher growth in the Middle East and Eurasia.
OECD petroleum and other liquid fuels consumption rose by 0.6 million b/d in 2015. OECD consumption
is expected to continue rising in both 2016 and 2017 by 0.3 and 0.4 million b/d, respectively,
driven by an increase in U.S. consumption. OECD Europe demand is also expected to increase through
the forecast period, albeit at a slower pace than the 0.3 million b/d increase in 2015. U.S. consumption
is forecast to increase by 0.2 and 0.3 million b/d in 2016 and 2017, respectively. Consumption
in Japan is forecast to decline by less than 0.1 million b/d in both 2016 and 2017.
Another oil market analyst, Dominic Haywood of Energy Aspects, predicts that such situation with
oil prices will remain in place at least for the next few months, "but should pick up into the second
half of 2016."
The reasons for the recovery at the end of 2016 will be "declines in non-OPEC production and continued
strong light ends [the more volatile products of petroleum refining] demand," Haywood said.
Nevertheless, there have been signs recently of OPEC's intentions to take some real steps.
On January 21, news of a possible OPEC extraordinary meeting in March emerged after remarks by
Nigerian Petroleum Resources Minister Emmanuel Ibe Kachikwu at the World Economic Forum in Davos.
The organization had previously agreed to hold a meeting in case prices fell below the $35 per barrel,
according to the minister.
"I think if Russia contributes and joins at least in the meetings, without necessarily joining
the OPEC , then they
will be motivated to take that initiative. As Russia has a big role to play… So there is a good opportunity
to make difference by joining OPEC discussions," Doshi said.
CHANCE TO SELL AS MUCH FOSSIL FUEL AS POSSIBLE
According to Doshi, major oil producers and exporters are also driven by the fear that oil will
not stay the main source of energy for long, which is particularly topical after the recent climate
change agreement achieved at the 21st UN Climate Change Conference (COP21) in Paris.
"There is now competition to take out as much as they can," he stressed.
"Right now in the Middle East many of our clients are thinking that may be fuel could be left
in the ground forever. We call it 'unburnable carbon.' Unburnable means that market cannot support
it. There is a fear that in 15-year time the world will stop using oil not because there is no oil,
but simply because there are better technologies," he explained.
FIGHTING FOR CLIENTS
Recent changes in the oil sector,
such as price fluctuations and appearance of the United States and Iran at the European oil market,
prompt players to behave more aggressively, the PwC expert believes.
"It is an aggressive market, even if publicly they talk nicely. Middle East players are negotiating
to sign term crude supply contracts with players in Poland, which are Russian customers. They are
offering good discounts, to take that market share where ever they can… Europe is the main market
for such a battle for share. So there is a bit of panic over volume," Doshi stressed.
In the first week of January, the United States sent its first two shipments of light crude oil
after the 40-year oil export ban was officially lifted in December. At the time the ban was lifted,
prices of West Texas Intermediate oil (WTI) nearly converged with Brent crude prices. That narrow
spread has remained through January.
Iran has also started signing contracts after sanctions were lifted, and the country's officials
say Tehran is ready to double its oil exports within three months.
"US oil does not impact supply-demand balances at the moment because the arbitrage to export US
to international markets is closed… Iranian oil will weigh on balances at a time where the world
does not need more sour crude or condensate," Haywood said.
For the time being, it remains to be seen whether OPEC cartel indeed convenes at an emergency
meeting in less than two months and manages to overcome geopolitical tensions and economic selfishness
to help recover many currencies and economies around the world.
Based on Pemex data, it looks like Mexico's total petroleum liquids production was 2.6
million bpd in 2015 (I had been guessing 2.4 to 2.5). Assuming flat consumption at 2.0 million
bpd, 2015 net exports were down to about 0.6 million bpd in 2015.
2014 total liquids + other liquids production was 2.8, with consumption of 2.0, so net exports
of 0.8 million bpd.
Year over year (2014 to 2015) exponential rates of decline in production and net exports would
be 7.4%/year and 29%/year respectively (assuming flat consumption).
2004 to 2015 exponential rates of decline in production and net exports would be 3.4%/year
and 10%/year respectively.
Based on the 2004 to 2015 (11 year) rate of decline in their ECI Ratio (ratio of production
to consumption), Mexico would approach zero net exports in about six years.
The zero hedge article stoked my interest as pertains to American Eagle Energy.
What reasons will the same fate not befall the other primarily Bakken players, assuming the
financing dries up?
Clearly American Eagle Energy's metrics were worse than their Bakken peers, but not maybe as
bad as might be expected.
The thing that I keep wonder is when do we see the M &A in the Bakken, or any of the LTO plays,
for that matter?
Why not a hostile bid for WLL, trading at $6, or OAS at $4, etc? What, if anything, do the
supermajors know? Or are they just as scared as the rest of us, not knowing what to think?
AlexS, why wouldn't a Russian supermajor take a shot at one of the US LTO companies? They might
be able through that to get a leg up on the tech needed to exploit Russian LTO later on, when
the price of oil makes sense to do so?
Due to the high legacy decline rate, shale companies are not backed by worthwhile assets (long
term producing wells). It is better for big companies to start a shale operation from scratch
– if they think it is a good option. In the recent shale bankruptcies bondholders have got a maximum
of 15 cents on the dollar, which is in many cases not enough to cover legal fees. This explains
also the extreme nervousness of bondholders as their holdings are backed basically by nothing.
Slowly investors are waking up to this fact. It still takes time, yet it turns increasingly into
a panic. Men go mad in herds, yet recover their senses one by one.
debt is the reason nobody wants to buy these companies out. Quicksilver just sold itself for
$250 million. Company debt was in excess of $2.35 billion, so debt holders recovered 10-12% of
invested money. That is a really horrific recovery level for debt. The company claimed its assets
were worth $1.2 billion when initially filing for bankruptcy in March of 2015. American Eagle
sold for $45 million with debt at $215 million, so a slightly better recovery, but keep in mind
those properties sold in October when oil was in mid-to-high $40s.
WLL, OAS, and a number of other names have too much debt, which would need to be made whole
if somebody purchases companies outright. Nobody would step up to the plate until these guys are
bankrupt. Once bankruptcies take place buyers will emerge.
I agree with Dan's assessment. Why buy the company, saddled as it is with catastrophic debt levels,
when you can either buy bonds at very low prices to get the assets, or alternatively wait for
BK and buy the assets at knock-down prices in an auction? And regarding tech, again, wait for
BK and snap up the newly unemployed star engineers.
So do you think all of the LTO companies will go BK? Is Wall Street still overvaluing these companies?
I completely understand the responses to my question. However, look at where companies such
as Marathon Oil, Anadarko, Apache, Hess and ConocoPhilips are trading. Yet little merger talk,
other than Anadarko/Apache recently.
equity in all of these names is priced as if oil is at $60. All shale companies are technically
bankrupt as none have full-cycle costs below $60. Drilling within cash flows (without hedges)
would result in declining production unless prices go back to $60-65 range. Even then, drilling
within cash flows would allow for flat production for less levered Permian names and maybe EOG,
while the rest would still witness declining production.
MRO, APC, APA, HES, and COP are considerably leveraged and in COP's case management is stubbornly
keeping that hefty dividend payout.
Considering where equity is still priced for these names, I have to believe that market expects
oil prices to double in a very short time. In October they were pricing oil at $70-75, now they
are down considerably and are pricing WTI around $60. Of course, we are nowhere close to those
levels, thus equity is still way overpriced.
"... I do find this "Saudi Arabia flooding the market" narrative highly annoying when, according to the graph SA production doesn't appear to have varied as much as plus or minus a million barrels per day, while the US has increased production almost 6 mbpd and spent a small fortune doing it to boot. ..."
"... It is clear that LTO was a game-changer for the global oil market, but Saudi Arabian production undoubtedly contributed to the oil glut in 2015. That said, the US and Saudi production have been on decline since May and July 2015, respectively ..."
I do find this "Saudi Arabia flooding the market" narrative highly annoying when, according to
the graph SA production doesn't appear to have varied as much as plus or minus a million barrels
per day, while the US has increased production almost 6 mbpd and spent a small fortune doing it
to boot.
The US has increased oil production by 4.7 mb/d from 2008 average to April 2015.
Saudi Arabia has increased production by 950 kb/d between November 2014 (when OPEC decided not
to cut production) and June 2015.
It is clear that LTO was a game-changer for the global oil market, but Saudi Arabian production
undoubtedly contributed to the oil glut in 2015.
That said, the US and Saudi production have been on decline since May and July 2015, respectively
Hess Corp. announced Fourth quarter 2015 production today.
BOEPD increased from 362K in Q4 2014 to 368K in 2015.
HOWEVER.
All of the below are in terms of BOEPD for Q4, 2014 and 2015
Crude oil in 2014 was 241K. In 2015 DROPPED to 233K.
Natural gas liquids was 32K in 2014. INCREASED to 40K in 2015.
Natural gas was 89K in 2014, INCREASED to 95K in 2015
Furthermore, there was a substantial drop in US crude oil production Q3 to Q 4. 152K to 141K.
That is a big quarter over quarter drop. Can someone with better math skills than I annualize that
one?
I think these numbers should be of particular interest to Jeffrey J. Brown, who is constantly
pilloried by the CC crowd, as he has dubbed them.
Further, there are many others here who I am sure will take note of the increasing GOR (Rune,
are you still out there?)
I further note that the product mix for Continental Resources was 70% oil 30 gas and NGLs for
2014. It went 65/35 in 2015 and company guidance for 2016 is 60/40.
Will be interesting to see what other companies report in the next 30 or so days.
Looks like about a 28% annualized decline for HES U.S. oil production. Applied to
the entire U.S. that will put us under 7 million by next january. Wow!! And HES just reduced capex
another 25% I believe.
Oil sands operations have been steadily decreasing their costs, and they still have room for
further improvements.
But to be fair, the above example is only operating cost and doesn't look at capital expenditure.
For that let's look at Fort Hills – this is the major project currently under construction.
The capital costs, capacity and project life is all publicly available information via google.
I have to estimate some numbers, but I'll try to error on the conservative side.
Total estimated construction cost: $13.5 billion (wow that's a lot!)
Daily capacity: 180,000 barrels
Annual capacity: 60 million barrels (these plants run 24/7/365, but I rounded down by 5.7M to
account for down time)
Estimated life of the project: 50 years
Total barrels produced over it's life: ~ 3 Billion
Let's say that oil stays at $70 for the next 50 years just to keep things really simple.
Let's also say that their operating cost is $30 per barrel and stays there, although that's
probably a bit high.
That leaves $40 profit on every barrel produced (less any transportation costs, exchange rate,
etc.)
3 billion barrels x $40 profit = $120 B profit – $13.5 capex = $106.5 BILLION NET PROFIT on
this project.
And remember, this is assuming oil stays at only $70!
It would great to see charts of production per well over time. My own analysis has shown Bakken
per well productivity has been dropping for a good few years. More wells to produce the same amount
of oil is not a good sign.
Meanwhile, here are excerpts from an article in Platts':
"When North Dakota oil production broke above 1 million b/d for the first time in April 2014,
many expected that the 2 million b/d threshold would be breached in relatively short order.
Now, rather than striving for 2 million b/d, state officials are hoping to maintain production
above 1 million b/d.
And there are indications that a significant drop in Bakken supply may already be underway.
While Lynn Helms, the state's top oil regulator, called recent production numbers "quite a
surprise" amidst market shifts largely unsupportive of domestic production, he indicated the relative
success would be short lived.
While North Dakota supply has remained steady amid falling prices, it's unclear what has happened
since the end of November as prices began their steady dip below $40/b and, eventually, $30/b,
a pricing environment where Helms believes the majority of Bakken producers cannot survive.
"We cannot sustain production at sub-$30/b prices," Helms told reporters following the release
of the latest state supply data.
Helms believes that WTI spot prices will need to average roughly $50/b in order for current production
to be maintained. If prices return to the $30-$40/b range, production will likely stay above 1
million b/d, but will likely stay just above that level and will fall steadily, by about 10,000
b/d each month, if prices do not climb above $40/b in the near term, Helms said."
"... For instance, in 2014, as the U.S. added some million barrels of daily production, it had to produce 2.2 million new barrels of production to do so. The slope of that foundation required 1.2 million new barrels to just flatten it out. ..."
"... First year production in the U.S. has had a blended annual decline that has increased from 41 percent in for 2010 era wells to 47 percent for 2013 era wells. Therefore, 2014 era wells were likely to have declined 49 percent and 2015 by 51 percent in their first year. ..."
"... Depending on the variability of the second year declines, this could range from 400 mbpd to well over 1MM bpd. ..."
First, people will produce existing wells at rates that aren't sustainable to preserve cash flow
or compete for market share, because the cost to drill and bring online is already sunk. Second,
new wells will not be drilled if there isn't at least an outlook to breakeven producing them. That
means an expectation of a sustained price over 1-3 years or until the well has been paid out.
U.S. Production Rates
Image Source: Drillinginfo Production Report for Unconventional U.S. Onshore Plays (Combined
MBOE 20:1) over last six years. Note the lag in production reporting means Q42015 and even some Q32015
reports are not finalized.
First, let's look at the U.S., the simplest and most transparent of the "Pick 6" issues bandied
about as a price driver. Certainly the unconventional revolution has been a huge factor in global
production increases over the last 6 years. The item NOT generally recognized is that production
typically lags drilling by some 5 months, thus the drilling in December 2014 is discernible in production
records in April 2015. That analysts were alarmed at increasing production and supply during the
1st half of the year suggested that they did not understand this dynamic, nor did the business press.
We predicted in April that monthly production would peak in May and then jump around between
-100 mbpd and -350 mbpd for the rest of the year. When looking at additional production month over
month, it is important to remember that it is building on a sloping foundation of natural decline.
For instance, in 2014, as the U.S. added some million barrels of daily production, it had
to produce 2.2 million new barrels of production to do so. The slope of that foundation required
1.2 million new barrels to just flatten it out.
First year production in the U.S. has had a blended annual decline that has increased from
41 percent in for 2010 era wells to 47 percent for 2013 era wells. Therefore, 2014 era wells were
likely to have declined 49 percent and 2015 by 51 percent in their first year.
Second year declines show less of a pattern, ranging from 10-20 percent decline from the end of
the prior year.
Depending on the variability of the second year declines, this could range from 400 mbpd to
well over 1MM bpd.
So, the U.S. isn't going to be the bringer of oil glut news going forward. In fact, the U.S. oil
patch has severely damaged its capacity to rebound from an oil field services point of view, with
companies foregoing normal maintenance to just survive. This deferred maintenance will have permanent
consequences.
"... Financial media is designed to whip up the lemmings to perform the role of bagholder. ..."
"... No production is sustainable at $44/barrel--more likely itll be closer to his previous prediction of $80 in a year or two (or less) than $44. ..."
"... Price discovery now is like a daily weed trip ..."
"... The 1% put just enough on the table for the paper shuffles. Cannablism has begun among the top 10% and they call it M A. ..."
"... How much savings and jobs dependent on the financial paper economies ? ..."
More gurus falling. They wear eye shades in deformed and rigged markets. Price discovery
now is like a daily weed trip. It's the debt that all these Shamans are trying to spin away.
Real prices reverting to the real and underground economies when you have to buy/sell with not
credit. Take credits from anyone who offer and that's a discount. Crash or no crash in paper markets
do not matter. The end is still the same bonfire of the papers. The 1% put just enough on
the table for the paper shuffles. Cannablism has begun among the top 10% and they call it M &
A.
How much savings and jobs dependent on the financial paper economies ? Shudder to
just imagine the ripples. Cans kicked down roads are simplistic, You really think that the Millenials
are that stupid not to walk off from their debt inheritances; more like the rise of more zombie
financial institutions. Great markets in that it is a once in a generation mega meltdown that
you can even pick pennies by just not participating in the weed dances and stay with the physicals.
"The world economy will need seven million more barrels a day by 2020. Natural depletion on
existing fields implies a loss of a further 13 million barrels a day by then."
The current
price crisis has just made sure we do not get those extra 20 million barrels in 5 years. The shit
is going to hit the fan real soon. We will not make it to 2020 without a global crisis that will
make the Great Financial Crisis of 2008 look like a picnic. I just can't see any way renewable
energies can prevent it.
"... Iraq's Prime Minister, Haider al-Abadi, said in Davos that his country was selling its crude for US$22 a barrel, and half of this covered production costs. ..."
"... Right now, however, US frackers are in the eye of the storm. Some 45 listed shale companies are already insolvent or in talks with creditors. ..."
"... The buccaneering growth of the shale industry was driven by cheap and abundant credit. ..."
"... Many shale bonds are trading at distress level below 50c on the dollar. ..."
"... Banks are being careful not to push them into receivership but they themselves are under pressure. Regulators fear that the energy industry may be the next financial bomb to blow up on a systemic scale. ..."
"... The Fed and the US Federal Deposit Insurance Corporation have threatened to impose tougher rules on leverage and asset coverage for loans to fossil-fuel companies. ..."
"... The question is whether even US shale can ever be big enough to compensate for coming shortage of oil as global investment collapses. ..."
"... There has been a US$1.8 trillion reduction in spending planned for 2015 to 2020 compared to what was expected in 2014, said Yergin. ..."
"... The world economy will need seven million more barrels a day by 2020. Natural depletion on existing fields implies a loss of a further 13 million barrels a day by then. ..."
"Venezuela is beyond the precipice. It is completely broke," said Yergin.
Iraq's Prime Minister, Haider al-Abadi, said in Davos that his country was selling its
crude for US$22 a barrel, and half of this covered production costs.
"It's impossible to run the country, to be honest, to sustain the military, to sustain jobs,
to sustain the economy," he said.
It is understood that KKR, Warburg Pincus, and Apollo are all waiting on the sidelines,
looking for worthwhile US shale targets. Major oil companies such as ExxonMobil have vast sums in
reserve, and even Saudi Arabia's chemical giant SABIC is already nibbling at US shale assets
through joint ventures.
Yergin is the author of The Prize: The Epic Quest for Oil, Money and Power, and is widely
regarded as the guru of energy analysis.
He said shale companies had put up a much tougher fight than expected and were only now
succumbing to the violence of the oil price crash, 15 months after Saudi Arabia and the Gulf
states began to flood the global market to flush out rivals.
"Shale has proven much more resilient than people thought. They imagined that if prices fell
below US$70 a barrel, these drillers would go out of business. They didn't realise that shale is
mid-cost, and not high cost," he told the Daily Telegraph.
Right now, however, US frackers are in the eye of the storm. Some 45 listed shale
companies are already insolvent or in talks with creditors.
The fate of many more will be decided in coming months when about 300,000 barrels a day of
extra Iranian crude hit an already saturated market.
The buccaneering growth of the shale industry was driven by cheap and abundant credit.
The guillotine came down even before the US Federal Reserve raised interest rates in December,
leaving frackers struggling to roll over loans. Many shale bonds are trading at distress
level below 50c on the dollar.
Banks are being careful not to push them into receivership but they themselves are under
pressure. Regulators fear that the energy industry may be the next financial bomb to blow up on a
systemic scale.
The Fed and the US Federal Deposit Insurance Corporation have threatened to impose tougher
rules on leverage and asset coverage for loans to fossil-fuel companies.
Yet even if scores of US drillers go bust, the industry will live on, and a quantum leap in
technology has changed the cost structure irreversibly.
"US$60 is the new US$90. If the price of oil returns to a range between US$50 and US$60, this
will bring back a lot of production. The Permian Basin in West Texas may be the second-biggest
field in the world after Ghawar in Saudi Arabia," said Yergin.
Zhu Min, the deputy director of the International Monetary Fund, said US shale had entirely
changed the balance of power in the global oil market and there was little Opec could do. "Shale
has become the swing producer. Opec has clearly lost its monopoly power and can only set a bottom
for prices. "As soon as the price rises, shale will come back on and push it down again," he
said.
The question is whether even US shale can ever be big enough to compensate for coming
shortage of oil as global investment collapses.
"There has been a US$1.8 trillion reduction in spending planned for 2015 to 2020 compared to
what was expected in 2014," said Yergin.
Yet oil demand is still growing briskly. The world economy will need seven million more
barrels a day by 2020. Natural depletion on existing fields implies a loss of a further 13
million barrels a day by then.
Adding to the witches' brew, global spare capacity is at wafer-thin levels - perhaps as low as
1.5 million barrels a day - as the Saudis, Russians and others produce at full tilt.
Yergin said those hoping for a quick rescue from Opec were likely to be disappointed.
"He said shale companies had put up a much tougher fight than expected and were only now succumbing
to the violence of the oil price crash, 15 months after Saudi Arabia and the Gulf states began
to flood the global market to flush out rivals."
With regards to the above, this is BS. Saudi
Arabia didn't flood the market, the US did. Saudi Arabia just maintained production. So many media
commentators fail to understand this. Look at the data.
And Saudi net exports (total petroleum liquids + other liquids) fell from 9.5 million bpd in 2005
to 8.4 million bpd in 2014 (EIA data except for 2014 BP consumption data).
Are they dreaming or forgot to remove this line from previous projections?
Only 4 years are left till 2020. You need to compensate for all the USA imports and that means
that they forecast more then 8 Mb/d of oil production growth for the continent or more then 2
Mb/d per year. This and the next year should probably be written off as the necessary capex are
not here. So we have two years left.
That means 4 Mb/d growth is needed for 2018 and 2019. Even with prices over $100 per barrel
this is a difficult task. I wonder which countries in North America are capable to grow oil production
over 1 Mb/d ? Dramatic USA shale/tight production growth is probably in the past.
"... Given the availability of abundant oil and natural gas reserves in the Western Hemisphere and the potential future abundance of alternative energy systems, why should the Persian Gulf continue to qualify as a vital U.S. national security interest? ..."
Energy Security: Given the availability of abundant oil and natural
gas reserves in the Western Hemisphere and the potential future abundance of alternative energy systems,
why should the Persian Gulf continue to qualify as a vital U.S. national security interest?
Back
in 1980, two factors prompted President Jimmy Carter to announce that the United States viewed the
Persian Gulf as worth fighting for. The first was a growing U.S. dependence on foreign oil
and a belief that American consumers were guzzling gas at a rate that would rapidly deplete domestic
reserves. The second was a concern that, having just invaded Afghanistan, the Soviet Union
might next have an appetite for going after those giant gas stations in the Gulf, Iran, or even Saudi
Arabia.
Today we know that the Western Hemisphere contains more than
ample supplies of oil and natural gas to sustain the American way of life (while also
heating up the planet). As for the Soviet Union, it no longer exists - a decade spent chewing
on Afghanistan having produced a fatal case of indigestion.
No doubt ensuring U.S. energy security should remain a major priority. Yet in that regard,
protecting Canada, Mexico, and Venezuela is far more relevant to the nation's well-being than protecting
Saudi Arabia, Kuwait, and Iraq, while being far easier and cheaper to accomplish. So who will
be the first presidential candidate to call for abrogating the Carter Doctrine? Show of hands,
please?
One year ago, analysts at Bank of America Merrill Lynch
drew a parallel between the subprime mortgage crash and the disorderly fall in the price of oil.
Led by Chris Flanagan, a veteran of the securitization space, the team drew attention to Markit's
ABX Index, better known as the mother of all synthetic subprime credit indexes.
Created in January 2006 and consisting of a basket of credit default swaps (CDS) tied to the welfare
of subprime mortgages, it allowed a bevy of investors to bet on the future direction of riskier home
loans and helped inflate the massive amounts of leverage tied to the U.S. housing bubble. More recently
it played a starring role in the film version of Michael Lewis's The Big Short-when protagonists
Christian Bale, Steve Carell, et al. are tracking their bets against the U.S. housing market, they
are
tracking the ABX.
Fast-forward to today and the BofAML analysts provide an update to their previous thesis, which
was that the downward spiral in the price of oil was shaping up to look a lot like the negative trend
that engulfed the subprime space circa the year 2007.
Here's what they say:
The pattern of the decline in the price of oil that began in mid-2014 is remarkably similar
to the 2007-2009 pattern of the price decline of ABX, the credit derivative index that referenced
subprime mortgages and, ultimately, the U.S. housing market (Chart 1). The ABX history suggests
that oil will see more declines in the next couple of months and find a floor somewhere in the
low 20s in the March-April time frame. Both the duration of the decline (1.5+ years) and the scale
of the decline (100 neighborhood starting price down to the sub-30 neighborhood) are similar.
Given that both housing and oil prices were fueled to spectacular heights in the two periods
by massive credit expansion, it's probably more than just coincidence that the respective "bubble"
bursting patterns are so similar.
Consider how things tend to work. Denial on what constitutes fair value is a big component of
bubbles, on the part of both market participants and policymakers. When perceived "bubbles" burst,
markets take their time in steadily shredding views of the perception of fundamental value, as
prices move lower and lower. Along the way, many will cite "technical factors" as the cause of
the decline, which in some way suggests the price decline may not be real when in fact it is all
too real. In the end, the technicals drive the fundamentals, as credit flees and borrowers go
bust, and a feedback loop lower kicks in. Lower prices beget accelerated selling, as asset
owners need to raise cash. It could be margin calls or it could be producer selling needs, it
doesn't really matter: the selling becomes inevitable and turns into forced selling.
Source: BofAML
The point here is not that oil is necessarily the new subprime crisis per se but that the recent
action in the price of crude resembles nothing if not the
bursting of a bubble and the sudden
realization that the asset has been overvalued for too long. More worrying for oil investors will
be BofAML's idea of forced selling. As Flanagan notes: "The systemic margin call of 2008 seems to
be back for now, albeit to a far lesser degree."
"... all the talk about cheaper oil giving a boost to the economy was misplaced because of the immediate loss of oil-related employment and of revenues to companies and to governments which, of course, tax the oil. ..."
"... The continuing rout in oil prices began to underline not only the weakness in the global economy, but also the unclear situation at major banks holding large energy-related loan portfolios. ..."
"... Essentially, the Dallas Fed was telling banks to ignore losses in their energy portfolios until further notice so as not to cause a panic. ..."
"... The truth in this particular instance may not matter since what we do know–that energy-related junk bond losses are at 2008 crisis levels–could suggest that energy-related losses at the world's banks may end up being the size associated with the subprime mortgage crisis that brought the global economy to its knees in 2008. It is worth remembering that in 2007 then-Federal Reserve Chairman Ben Bernanke assured the U.S. Congress that "the impact on the broader economy and financial markets of the problems in the subprime market seems likely to be contained." ..."
A year ago I said the crash in commodity prices signaled a weak economy and that financial
markets would eventually have to reflect this fact. The widely watched S&P 500 Index closed
at 1,994.99 on January 30, 2015 just prior to the publication of the linked piece. Last Friday's
close was 1906.90. The U.S. stock market hasn't exactly reflected the weakness in commodities,
but it hasn't gained any ground either.
In addition, last August I wrote that low oil prices were also a reflection of this weakness
and that all the talk about cheaper oil giving a boost to the economy was misplaced because
of the immediate loss of oil-related employment and of revenues to companies and to governments
which, of course, tax the oil. The S&P 500 is down about 200 points since then, but any significant
adjustment still looks like it lies in the future.
Of course, starting in August stock markets around the world began to fall. Central banks
reacted with words of support, and the U.S. Federal Reserve Board of Governors put off a long-anticipated
interest rate hike because of weak market conditions.
Stock prices then rebounded to near their previous levels and all was forgotten…until the
beginning of this year. The continuing rout in oil prices began to underline not only the weakness
in the global economy, but also the unclear situation at major banks holding large energy-related
loan portfolios. The Dallas Federal Reserve Bank was reported to have encouraged banks in its
jurisdiction to forebear on energy loans. Essentially, the Dallas Fed was telling banks to
ignore losses in their energy portfolios until further notice so as not to cause a panic. The
reserve bank quickly denied any such guidance to member banks.
The truth in this particular instance may not matter since what we do know–that energy-related
junk bond losses are at 2008 crisis levels–could suggest that energy-related losses at the
world's banks may end up being the size associated with the subprime mortgage crisis that brought
the global economy to its knees in 2008. It is worth remembering that in 2007 then-Federal
Reserve Chairman Ben Bernanke assured the U.S. Congress that "the impact on the broader economy
and financial markets of the problems in the subprime market seems likely to be contained."
These and other anxieties moved stock markets and oil down sharply last week before a bounce
that was in part inspired by central bankers in Europe, Japan and China who all signaled the
possibility of more easing.
"... This is the worst oil bust in USA, post Great Depression. The benefit of $1.50 gasoline v. $2.50 gasoline is outweighed by the massive business failures at $15-25 well head oil, v. $55-65 well head oil. ..."
"... even with the massive CAPEX cuts announce, LTO companies will STILL be cash flow negative. Why are creditors not demanding all cash flow go to debt principal reduction? Dont they see how little these assets are worth, based on the BK sales? ..."
"... Continental Resources Inc., Oklahoma City, has reported a capital expenditures budget for 2016 of $920 million, a 66% reduction from the planned $2.7 billion for 2015 ..."
"... Hess Corporation is planning a 2016 capital and exploratory budget of $2.4 billion, a 40% reduction from its 2015 actual spend of $4 billion ..."
"... From CLR release. ..."
"... Production exit 2016 at 180K BOEPD. Down from 220K in 2015. Oil decline much worse, by my math 145 bopd to 108 bopd. ..."
Longtimber, the reason low oil prices are not helping is the low prices are too extreme, IMO.
This is the worst oil bust in USA, post Great Depression. The benefit of $1.50 gasoline v.
$2.50 gasoline is outweighed by the massive business failures at $15-25 well head oil, v. $55-65
well head oil.
Yet, despite the stories of massive CAPEX cuts, there is apparently too much oil. And, even
with the massive CAPEX cuts announce, LTO companies will STILL be cash flow negative. Why are
creditors not demanding all cash flow go to debt principal reduction? Don't they see how little
these assets are worth, based on the BK sales?
Kind of like there is supposedly too much corn, yet local grain elevators began paying .30
ABOVE big board prices, because they are low on corn.
More CAPEX cuts in USA tight oil and gas (from Oil and Gas Journal):
Continental Resources Inc., Oklahoma City, has reported a capital expenditures budget for 2016
of $920 million, a 66% reduction from the planned $2.7 billion for 2015
Hess Corporation is planning a 2016 capital and exploratory budget of $2.4 billion, a 40% reduction
from its 2015 actual spend of $4 billion and 20% below its preliminary 2016 guidance of $2.9-3.1
billion provided in October:
"... At the moment KSA is demonstrating just how volatile things can be for everybody in the oil production business. Once everyone is on board with quotas then some price stability can be more easily predicted. ..."
With consumption increasing and production decreasing I feel safe forecasting a price stabilization
or rise. Although Iran production will increase I don't think it'll be entirely exported. Some
will be consumed domestically to power manufacturing and agricultural production and exports.
Iraq is a wildcard. Maybe Iraqi increases will simply offset unconventional and LTO declines and
production will stay flat.
The real wildcard is OPEC. The price will go up as soon as they have
a meeting and decide it does. I feel KSA is waiting for non OPEC producers (Russia) to get on
board with agreeing to production quotas.
At the moment KSA is demonstrating just how volatile
things can be for everybody in the oil production business. Once everyone is on board with quotas
then some price stability can be more easily predicted.
EIA estimates global consumption of petroleum and other liquid fuels grew by 1.4 million b/d
in 2015, averaging 93.8 million b/d for the year. EIA expects global consumption of petroleum
and other liquid fuels to grow by 1.4 million b/d in both 2016 and 2017. Forecast real gross domestic
product (GDP) for the world weighted by oil consumption, which increased by an estimated 2.4%
in 2015, rises by 2.7% in 2016 and by 3.2% in 2017.
Consumption of petroleum and other liquid fuels in countries outside the Organization for Economic
Cooperation and Development (OECD) increased by an estimated 0.8 million b/d in 2015, considerably
lower than the 1.4 million b/d increase in 2014 mainly because of the slowdown in Eurasia, which
saw a contraction in its consumption, and to a lesser degree because of China's slightly slower
demand growth. Non-OECD consumption growth is expected to be 1.1 million b/d in both 2016 and
2017, reflecting higher growth in the Middle East and Eurasia.
OECD petroleum and other liquid fuels consumption rose by 0.6 million b/d in 2015. OECD consumption
is expected to continue rising in both 2016 and 2017 by 0.3 and 0.4 million b/d, respectively,
driven by an increase in U.S. consumption. OECD Europe demand is also expected to increase through
the forecast period, albeit at a slower pace than the 0.3 million b/d increase in 2015. U.S. consumption
is forecast to increase by 0.2 and 0.3 million b/d in 2016 and 2017, respectively. Consumption
in Japan is forecast to decline by less than 0.1 million b/d in both 2016 and 2017.
The World Bank has slashed its forecast for crude oil prices by $14 to $37 per barrel for 2016,
it said on Tuesday, amid growing supply and weak demand prospects from emerging markets. In its annual Commodity Markets Outlook, the World Bank lowered its price forecast for 37 of 46 commodities,
including oil, saying that weak demand from emerging economies is likely to continue.
World Bank economists said weak demand would continue even as oil supply grows with the resumption
of Iranian exports, continued U.S. production and a mild Northern Hemisphere winter.
Oil prices should decline another 27 percent in 2016 after plummeting by 47 percent last year,
according to the outlook. The World Bank uses an average of Brent, Dubai and West Texas Intermediate
oil, equally weighted.
"Low prices for oil and commodities are likely to be with us for some time," said John Baffes,
senior economist and lead author of the report. World Bank economists said they expect a gradual recovery in oil prices over the course of 2016 but
the rebound will be smaller than in previous years that followed sharp declines, including 2008,
1998 and 1986.
A Reuters poll in January showed that crude oil prices were unlikely to rally much in 2016 because
of subdued demand and rising supply, even though non-OPEC output was expected to moderate.
Earlier in January, the World Bank cut its forecast for global economic growth due to the weak
performance of emerging economies.
All main commodity price indexes are likely to fall in 2016 amid a supply glut and a slowdown
in demand for industrial commodities from emerging economies.
Emerging market economies have been the main sources of growth in demand for commodities since
2000. ==================================
Credit Suisse cuts oil price forecasts by more than $10 on supply glut
Credit Suisse on Tuesday cut its crude oil price forecasts by more than $10 for 2016 and 2017
citing high inventories and slower demand growth.
The bank slashed its 2016 price forecast for Brent crude to $36.25 per barrel from $58.00 earlier,
while lowering its 2017 outlook to $54.25 per barrel from $65.
It also cut its 2016 WTI crude price outlook to $37.75 per barrel from $56.44, and for 2017 to $54.25
from $63.31 per barrel.
The Swiss bank, however, said prices were likely to converge back to the $60 per barrel levels required
to grow American shale in the next few years.
"... A sharp drop in stripper-well output, currently estimated at a million barrels a day, or 11% of total U.S. production, would be nearly impossible to observe as it happens, but it could still shrink the glut that continues to weigh on prices, surprising the market, analysts say. ..."
"... In some states, including Illinois and New York, stripper wells account for all, or most, oil output. With oil prices still near six-year lows, stripper-well operators are facing new pressure to let damaged wells lie dormant, or even shut down production. ..."
"... If oil prices fall back below $40 a barrel and stay there, half of stripper-well production could be shut down, said David Pursell, managing director at Tudor, Pickering, Holt Co., a Houston investment bank. The U.S. oil benchmark on Friday lost 70 cents, or 1.5%, to close at $46.05 a barrel on the New York Mercantile Exchange. ..."
Steve Plants, vice president of Plants & Goodwin Inc. in Shinglehouse, Pa., still pumps crude oil
from wells drilled in the 1890s.
But with the price of crude below $50 a barrel, some of those low-producing wells, known as
stripper wells, don't turn a profit. Mr. Plants has permanently closed 10 wells, he says, and
plans to plug another 10 by the end of the year.
"We're losing money every day," said Mr. Plants, who operates about 200 wells in Pennsylvania and
New York. "If we were pumping wells every day, we might be pumping them once a week now," to save
on costs.
Mr. Plants, and thousands of individual operators like him, could turn out to be a key element in
ending the oil-price rout, rather than a large producing country like Saudi Arabia or a big
public company. A sharp drop in stripper-well output, currently estimated at a million
barrels a day, or 11% of total U.S. production, would be nearly impossible to observe as it
happens, but it could still shrink the glut that continues to weigh on prices, surprising the
market, analysts say.
While investors are closely watching public companies for signs of when crude production is
set to slow, many are ignoring the country's 400,000 stripper wells, most of which produce less
than five barrels a day. Stripper wells-so called because they "strip" the remaining oil out of
the ground-are mostly aging ones that continue to produce oil, but at much lower rates than when
they were drilled.
In some states, including Illinois and New York, stripper wells account for all, or most, oil
output. With oil prices still near six-year lows, stripper-well operators are facing new pressure
to let damaged wells lie dormant, or even shut down production.
If oil prices fall back below $40 a barrel and stay there, half of stripper-well production
could be shut down, said David Pursell, managing director at Tudor, Pickering, Holt & Co., a
Houston investment bank. The U.S. oil benchmark on Friday lost 70 cents, or 1.5%, to close at
$46.05 a barrel on the New York Mercantile Exchange.
"If you saw half-a-million barrels a day of stripper-well production come off line at the end of
the year," he said, "the market would tighten earlier in 2016."
From 2008 to 2014, the U.S. added nearly 5 million barrels per day (bpd) of oil production to the
market. This lessened the U.S. need for OPEC's oil, and by 2014 OPEC's share of global oil production
had fallen slightly to 41.2 percent in 2014.
Historically OPEC - and more specifically Saudi Arabia,
which is responsible for over 30 percent of the group's oil production - has functioned as the world's
swing producer for crude oil. If the world needed more oil production, OPEC could usually bring more
barrels online. If the world needed less, some could be idled. The group often stressed the need
for a stable oil price to ensure that global supply met global demand.
Because they were losing market share - but perhaps more importantly because they saw that trend
continuing - that strategy was abandoned at their November 2014 meeting. It was then that OPEC announced
they would defend market share that was being lost due to the rise of non-OPEC production, especially
from the United States. Some have argued that OPEC had no choice but to defend market share instead
of cutting production to balance the market, but I disagree. I think Saudi Arabia pushed for a strategy
that will go down as one of the greatest mistakes in OPEC's history. It was a decision, I might add,
that 9 of the 13 OPEC members reportedly oppose.
To review, crude oil had shown signs of being oversupplied in early 2014, and by summer prices
had started to soften. By the time of their November 2014 meeting, the price had dropped from about
$100/bbl in mid-summer to ~$75/bbl. In making their decision, I think OPEC believed that oil prices
could fall somewhat below $75/bbl for a short period of time, and that would be enough to bankrupt
a lot of the shale oil companies and allow OPEC to recapture market share. Instead, the shale oil
producers slashed costs, and while some producers have gone bankrupt - and other bankruptcies are
undoubtedly on the way - shale oil production has proven to be much more resilient than the Saudis
and OPEC expected. It is declining at a much slower rate than they anticipated.
After that November 2014 meeting the Saudis were committed, and they have reiterated their strategy
at 2 subsequent meetings. To change strategies now would be to admit they had been wrong. Following
that initial meeting and the 2 subsequent meetings, oil prices have dropped to lower and lower support
levels. As a result the annual difference in the price OPEC is getting today for their crude, and
the price they were getting prior to their November 2014 meeting is over $500 billion per year for
the group.
At the time of their decision, the global markets were probably oversupplied by 1-2 million
bpd. If OPEC had merely decided to remove 2 million bpd off the world markets - only 5.5 percent
of the group's combined 2014 production - the price drop could have easily been arrested and
maintained in the $75-$85/bbl range. That would have still given them 38.9 percent of the global
crude oil market. For that matter, a production quota cut of 13 percent could have removed from
the market a volume equivalent to all of the U.S. shale oil production added between 2008 and
2014. (Whether the Saudis could have actually enforced those quotas is another matter).
Russia's Federal Statistics Service says the country's economy contracted 3.7 percent last
year. This corresponds to the prediction from the Economic Development Ministry.
Unemployment in Russia grew to 7.4 percent last year or 4.2 million jobless.
Retail trade turnover fell by 10 percent compared to the previous year at 27.6 trillion rubles
(or $452.5 billion at 61 rubles per dollar, average exchange rate in 2015). Capital investment
decreased by 8.4 percent to $230 billion.
Car manufacturing and industrial production have also seen a decline. In 2015, Russia's
automobile production was down 27.7 percent. Industrial production contracted 3.4 percent from
2014.
Positive news came from the agricultural sector. Preliminary estimates for agricultural
production show an increase of 3 percent to $82 billion. This figure includes data for all
farmers - from households to large holdings.
Last week, the International Monetary Fund predicted a 3.7 percent contraction for the Russian
economy in 2015. The IMF also forecast Russia's GDP to drop this year from negative 0.6 percent
to negative one percent.
In its 2016 outlook, the Economic Development Ministry is forecasting a 0.8 percent GDP fall
revising its previous projection of 0.7 percent growth, according to business daily Vedomosti.
The main reason for the downgrade is collapsing oil prices that have fallen $6 per barrel this
year to $31 which is still a rebound from last week's 12-year low of $26. Brent crude was trading
at $31.1 per barrel at 2:00pm GMT on Monday, while US WTI oil stood at $31.27
Tom Brite
As Russia's inflation reached double-digits last year, Russians saw their real wages
decline by 9.5 percent compared to 2014, data published by the Rosstat state statistics
service showed Monday.
In December 2015, real wages of Russians dropped 10 percent when compared to the same month
in 2014, according to Rosstat data. The average monthly salary in Russia last year was
30,311 rubles ($381).
"... Yeah, distillate yield is the big deal. Gasoline doesnt move food. ..."
"... insofar as condensate is concerned, the biggest problem with too much condensate as a percentage of Crude + Condensate (C+C) refining feedstock is that condensate is deficient in distillate (jet fuel, heating oil, diesel, etc.) plus heavier components. ..."
"... we have been on an Undulating Plateau in actual global crude oil production (45 API and lower crude oil) since 2005, while global natural gas production and associated liquids, condensate and NGL, have (so far) continued to increase. ..."
"... I suspect that US (and perhaps global) refiners hit, in late 2014, the upper limit of how much condensate that they could process if they wanted to maintain their output of distillates and heavier products, which plausibly contributed to the 100 million barrel build in US C+C inventories, from late 2014 to late 2015, as US refiners increased their net crude oil imports from December, 2014 to December, 2015. ..."
"... EIA data indicate that about 40% of US Lower 48 C+C production in 2015 exceeded 42 API Gravity, which is the maximum upper limit for WTI crude oil. ..."
Of all the contributors on this site, you have highlighted the problems inherent in counting
condensates as crude. I am not a petroleum chemist so am not so familiar with the limitations
of condensates. Could you briefly tell me what you can and can not use condensates for? I get
that one can refine 30-45 WTI into gasoline and other useful fuels like jet fuel, but: Can you
drive on condensates? or am I correct in believing the condensates can only be turned into heating
fuels.
It is also harmful to modern engines due to its low octane rating ( about 30 to 50) and possible
presence of cancerogenius additives (benzene) and sulfur. Before 1930 it was used as an ICE fuel
in low RPM, low compression engines. Both Karl Benz engines, and early Wright brothers aircraft
engines used it. It has a distinctive smell when used as a fuel, which allows police to catch
people using condensate illegally.
The white gas sold today as a fuel for stoves is a condensate with the benzene and sulfur removed.
Adding ethanol improves the octane number (https://en.wikipedia.org/wiki/Octane_rating)
and makes it possible to drive regular cars on distillate. You need E85 mix for that.
My impression is that the drive to blend ethanol with gasoline (most of the gasoline now sold
in the United States contains some ethanol) and introduction of E10, E15, and E85 that happened
in the USA was at least partially dictated by the desire to blend condensate (as a substitute
for gasoline) with ethanol killing two birds with one stone. Moreover denaturized ethanol contains
at least 2% of condensate. All gasoline engine vehicles can use E10 so some amount of condensate
is present in US gasoline almost by definition.
E85 (used only in flexible-fuel vehicles (FFV) ) allows blending of considerable amount of
reprocessed condensate (probably 40-50%) with ethanol and still getting acceptable octane number.
E85 is an abbreviation for an ethanol fuel blend of 85% denatured ethanol fuel and 15% gasoline
or other hydrocarbons by volume, although the exact ratio of fuel ethanol to hydrocarbons can
vary considerably while still carrying the E85 label. The ethanol content is adjusted according
to the local climate to maximize engine performance. ASTM 5798 specifies the allowable fuel ethanol
content in E85 as ranging from 51% to 83%.
Condensate has a very low viscosity and often used to dilute highly viscous heavier oils that
cannot otherwise be efficiently transported via pipelines.
I'm actually not anywhere close to be a refining expert, and I think that Fernando can give you
more detailed answers, but insofar as condensate is concerned, the biggest problem with too
much condensate as a percentage of Crude + Condensate (C+C) refining feedstock is that condensate
is deficient in distillate (jet fuel, heating oil, diesel, etc.) plus heavier components.
However, the quality issue, in my opinion, is something of a Red Herring.
My principal point is not that the liquid partial substitutes for crude oil, i.e., condensate,
natural gas liquids (NGL) and biofuels, are deficient in quality compared to crude oil; my principal
point is that the available data, at least in my opinion, strongly suggest that we have been
on an "Undulating Plateau" in actual global crude oil production (45 API and lower crude oil)
since 2005, while global natural gas production and associated liquids, condensate and NGL, have
(so far) continued to increase.
The obvious question is that if it took trillions of dollars in post-2005 global upstream capex
(spent on oil & gas projects) to keep us on an undulating plateau in actual global crude oil production,
what happens to global crude oil production given the large, and ongoing, cutbacks in global upstream
capex?
But in regard to refinery yields, here is a chart of refinery yields by API Gravity. Note that
Cat Feed + Distillate Yield drops from about 55% at 39 API gravity (approximately the average
API value for Brent & WTI) to about 20% at 42 API Gravity (which is the maximum upper limit for
WTI crude oil).
Here's a link to, and an excerpt from, the source document for the chart:
The figure below illustrates the product yield for six typical types of crude oil processed
in Canada. It includes both light and heavy as well as sweet and sour crude oils. A very light
condensate* (42 API) and a synthetic crude oil are also included. The chart compares the different
output when each crude type is processed in a simple distillation refinery. The output is broken
down into five main product groups: gasoline, propane and butane (C3/C4), Cat feed (a partially
processed material that requires further refining to make usable products), distillate (which
includes diesel oil and furnace oil) and residual fuel (the heaviest and lowest-valued part
of the product output, used to make heavy fuel oil and asphalt).
As I have previously discussed, I suspect that US (and perhaps global) refiners hit, in
late 2014, the upper limit of how much condensate that they could process if they wanted to maintain
their output of distillates and heavier products, which plausibly contributed to the 100 million
barrel build in US C+C inventories, from late 2014 to late 2015, as US refiners increased their
net crude oil imports from December, 2014 to December, 2015.
*The more common dividing line between crude & condensate is 45 API Gravity, but EIA data
indicate that about 40% of US Lower 48 C+C production in 2015 exceeded 42 API Gravity, which is
the maximum upper limit for WTI crude oil.
"Iraq's oil ministry said on Monday that the country had record output in
December, with its fields in the central and southern regions producing
as much as 4.13 million barrels a day."
Iraq may further raise oil output this year, reaching levels as high
as 4 million barrels per day (bpd) from the country's south, a senior Iraqi
oil official, who asked not to be named, said on Monday.
Iraq has been producing from its southern fields around 3.7-3.8 million
bpd in recent months.
Looks like the article is very superficial. Gail thinks that about 20 million bbl per day has a cost or production below the current price of
oil. This is oil produced by Saudi Arabia, Iran, Iraq and Kuwait. All other producers (USA, Canada,
Russia, China, Venezuela, UK, Norway and everybody else) are losing money on each barrel they sell.
A few countries can get oil out of the ground for $30 per barrel. Figure 1 gives an approximation
to technical extraction costs for various countries. Even on this basis, there aren't many countries
extracting oil for under $30 per barrel–only Saudi Arabia, Iran, and Iraq. We wouldn't have much
crude oil if only these countries produced oil.
Figure 1. Global breakeven prices (considering only technical extraction costs) versus production.
Source: Alliance Bernstein, October 2014
The growing cost of oil extraction that we have been encountering in the last 15 years
represents one form of diminishing returns. Once the cost of making energy products becomes high,
an economy is permanently handicapped. Prices higher than those maintained in the 2011-2014
period are really needed if extraction is to continue and grow. Unfortunately, such high prices
tend to be recessionary.
"... According to the IEA, 60% of Iran's initial 500,000 b/d of new exports
could be made up of Iranian Heavy, 30% of Iranian Light and the remainder consisting
of a new heavy grade called West of Karun, which is due to make its debut in the
second quarter. ..."
"... Fesharaki says the volume of condensate is somewhere between 30 and 50
million barrels whereas the volume of crude stored afloat is between 10 and 15 million
barrels. ..."
The IEA also highlights the marketing challenge and expects Iran not only to
be competitive in its pricing policy, but also to be open to crude-for-product
swaps and deferred payment terms.
In the meantime, the IEA believes Iran has
made considerable progress in readying its oil network and identifying prospective
buyers and reckons an additional 300,000 b/d of crude could be flowing by the
end of the March this year, although it does make the point that for now this
volume is speculative.
It estimates that Iran increased production by 40,000 b/d between November
and December to help fill storage tanks at the Kharg Island loading terminal
in preparation for the lifting of sanctions and expects Iranian oil flows to
rise towards pre-sanctions capacity of 3.6 million b/d within six months.
According to the IEA, 60% of Iran's initial 500,000 b/d of new exports
could be made up of Iranian Heavy, 30% of Iranian Light and the remainder consisting
of a new heavy grade called West of Karun, which is due to make its debut in
the second quarter.
... ... ...
Fereidun Fesharaki, chairman of consultancy Facts Global Energy, expects
a 300,000 b/d export boost by end-March and another 300,000 b/d by end-June.
Early volumes will head largely to Asia, where mechanisms for taking Iranian
crude are already in place, he says in a note, while operational and banking
issues will delay the European ramp-up to the second quarter.
... ... ...
Fesharaki says the volume of condensate is somewhere between 30 and 50
million barrels whereas the volume of crude stored afloat is between 10 and
15 million barrels. The bulk of the floating condensate is likely to go
to China, Japan and South Korea, he says.
Iran will need to free up its tanker fleet as soon as possible to deliver
crude but selling these condensate barrels, given their "specialized nature,"
could prove to be tough, the agency says. So, until substantial volumes of this
ultra-light oil can be sold, Iran will likely concentrate on selling crude from
Kharg Island.
"... Yeah, distillate yield is the big deal. Gasoline doesnt move food. ..."
"... insofar as condensate is concerned, the biggest problem with too much condensate as a percentage
of Crude + Condensate (C+C) refining feedstock is that condensate is deficient in distillate (jet fuel,
heating oil, diesel, etc.) plus heavier components. ..."
"... we have been on an Undulating Plateau in actual global crude oil production (45 API and lower
crude oil) since 2005, while global natural gas production and associated liquids, condensate and NGL,
have (so far) continued to increase. ..."
"... I suspect that US (and perhaps global) refiners hit, in late 2014, the upper limit of how much
condensate that they could process if they wanted to maintain their output of distillates and heavier
products, which plausibly contributed to the 100 million barrel build in US C+C inventories, from late
2014 to late 2015, as US refiners increased their net crude oil imports from December, 2014 to December,
2015. ..."
"... EIA data indicate that about 40% of US Lower 48 C+C production in 2015 exceeded 42 API Gravity,
which is the maximum upper limit for WTI crude oil. ..."
Of all the contributors on this site, you have highlighted the problems inherent in counting
condensates as crude. I am not a petroleum chemist so am not so familiar with the limitations
of condensates. Could you briefly tell me what you can and can not use condensates for? I get
that one can refine 30-45 WTI into gasoline and other useful fuels like jet fuel, but: Can you
drive on condensates? or am I correct in believing the condensates can only be turned into heating
fuels.
It is also harmful to modern engines due to its low octane rating ( about 30 to 50) and possible
presence of cancerogenius additives (benzene) and sulfur. Before 1930 it was used as an ICE fuel
in low RPM, low compression engines. Both Karl Benz engines, and early Wright brothers aircraft
engines used it. It has a distinctive smell when used as a fuel, which allows police to catch
people using condensate illegally.
The white gas sold today as a fuel for stoves is a condensate with the benzene and sulfur removed.
Adding ethanol improves the octane number (https://en.wikipedia.org/wiki/Octane_rating)
and makes it possible to drive regular cars on distillate. You need E85 mix for that.
My impression is that the drive to blend ethanol with gasoline (most of the gasoline now sold
in the United States contains some ethanol) and introduction of E10, E15, and E85 that happened
in the USA was at least partially dictated by the desire to blend condensate (as a substitute
for gasoline) with ethanol killing two birds with one stone. Moreover denaturized ethanol contains
at least 2% of condensate. All gasoline engine vehicles can use E10 so some amount of condensate
is present in US gasoline almost by definition.
E85 (used only in flexible-fuel vehicles (FFV) ) allows blending of considerable amount of
reprocessed condensate (probably 40-50%) with ethanol and still getting acceptable octane number.
E85 is an abbreviation for an ethanol fuel blend of 85% denatured ethanol fuel and 15% gasoline
or other hydrocarbons by volume, although the exact ratio of fuel ethanol to hydrocarbons can
vary considerably while still carrying the E85 label. The ethanol content is adjusted according
to the local climate to maximize engine performance. ASTM 5798 specifies the allowable fuel ethanol
content in E85 as ranging from 51% to 83%.
Condensate has a very low viscosity and often used to dilute highly viscous heavier oils that
cannot otherwise be efficiently transported via pipelines.
I'm actually not anywhere close to be a refining expert, and I think that Fernando can give you
more detailed answers, but insofar as condensate is concerned, the biggest problem with too
much condensate as a percentage of Crude + Condensate (C+C) refining feedstock is that condensate
is deficient in distillate (jet fuel, heating oil, diesel, etc.) plus heavier components.
However, the quality issue, in my opinion, is something of a Red Herring.
My principal point is not that the liquid partial substitutes for crude oil, i.e., condensate,
natural gas liquids (NGL) and biofuels, are deficient in quality compared to crude oil; my principal
point is that the available data, at least in my opinion, strongly suggest that we have been
on an "Undulating Plateau" in actual global crude oil production (45 API and lower crude oil)
since 2005, while global natural gas production and associated liquids, condensate and NGL, have
(so far) continued to increase.
The obvious question is that if it took trillions of dollars in post-2005 global upstream capex
(spent on oil & gas projects) to keep us on an undulating plateau in actual global crude oil production,
what happens to global crude oil production given the large, and ongoing, cutbacks in global upstream
capex?
But in regard to refinery yields, here is a chart of refinery yields by API Gravity. Note that
Cat Feed + Distillate Yield drops from about 55% at 39 API gravity (approximately the average
API value for Brent & WTI) to about 20% at 42 API Gravity (which is the maximum upper limit for
WTI crude oil).
Here's a link to, and an excerpt from, the source document for the chart:
The figure below illustrates the product yield for six typical types of crude oil processed
in Canada. It includes both light and heavy as well as sweet and sour crude oils. A very light
condensate* (42 API) and a synthetic crude oil are also included. The chart compares the different
output when each crude type is processed in a simple distillation refinery. The output is broken
down into five main product groups: gasoline, propane and butane (C3/C4), Cat feed (a partially
processed material that requires further refining to make usable products), distillate (which
includes diesel oil and furnace oil) and residual fuel (the heaviest and lowest-valued part
of the product output, used to make heavy fuel oil and asphalt).
As I have previously discussed, I suspect that US (and perhaps global) refiners hit, in
late 2014, the upper limit of how much condensate that they could process if they wanted to maintain
their output of distillates and heavier products, which plausibly contributed to the 100 million
barrel build in US C+C inventories, from late 2014 to late 2015, as US refiners increased their
net crude oil imports from December, 2014 to December, 2015.
*The more common dividing line between crude & condensate is 45 API Gravity, but EIA data
indicate that about 40% of US Lower 48 C+C production in 2015 exceeded 42 API Gravity, which is
the maximum upper limit for WTI crude oil.
"... US condensate production increased from 231 mb in 2011 (start of shale oil boom) to 326 mb in 2014 ..."
"... So IEAs estimate of 36 mb x 0.67 = 24 mb would be 7.4 % of 2014 US condensate production ..."
"... There are some reporting issues regarding Lease condensate, i.e., I suspect that a good deal of condensate production is reported as crude oil production. And in fact, the EIA refers to Crude + Condensate (C+C) as Crude oil. ..."
"... Im a little uncertain about the figures because your link takes you to a page, under the heading Natural Gas, titled Natural Gas Liquids Lease Condensate. To me, lease condensate means wellhead condensate and that is not associated with NGLs; condensate also comes out at the NGL-separation stage down the line. ..."
"... Most of the stored oil is condensate that contains a sulfur compound, which complicates sales because many refineries cant process it, said Victor Shum of IHS Inc. and Robin Mills at Dubai-based Manaar Energy Consulting. To market this large amount of oil within three months - the equivalent of about half a million barrels a day - Iran will have to resort to offering deep discounts, they said. ..."
"... Iran may need to spur sales of its sulfur-heavy condensate by offering discounts of at least 10 to 15 percent, Shum said. Its main condensate customer, Dragon Aromatics Zhangzhou Co. of China, stopped buying after a fire at its plant in April and an Iranian refinery designed to use it wont be ready until 2017, causing stockpiles to build, he said. ..."
"... If theyre already having difficulty shifting it, adding another half million barrels will be even more difficult, he said by phone. Theyll manage, but at what discount? ..."
He does not ask himself an important question, what all those tankers contain. Is this crude or
condensate? Or some refined products like heating oil too.
There are some reporting issues regarding "Lease condensate," i.e., I suspect that a good
deal of condensate production is reported as crude oil production. And in fact, the EIA refers
to Crude + Condensate (C+C) as "Crude oil."
A survey that the EIA did last year estimated that 22%, or about 2 million bpd, of US Lower
48 C+C production consists of condensate (45 API +). And about 40% of US Lower 48 C+C production
exceeded the maximum API Gravity for WTI crude oil (42 API Gravity).
I'm a little uncertain about the figures because your link takes you to a page, under the
heading Natural Gas, titled Natural Gas Liquids Lease Condensate. To me, "lease condensate" means
wellhead condensate and that is not associated with NGLs; condensate also comes out at the NGL-separation
stage down the line. If it is the latter that the chart refers to, then the figure is not
total production of condensate but only that recovered from the NGL stream.
"With no clear timeline for a restart at petrochemicals producer Dragon Aromatics, one of Tehran's
key condensate buyers, after its April fire, Iran hoped new buyers in South Korea, Japan as well
as in China would pick up the slack, traders said.
The CNOOC-Shell petrochemical plant in southeastern Guangdong province could also be a replacement
buyer for condensate, they said. The plant was forced to drop a regular supply pact in mid-2012
when the European Union put an embargo on trading Iranian oil."
"Iran may roil global oil markets with plans to sell about 45 million barrels of fuel stored
in tankers in the Persian Gulf within three months of the removal of sanctions on its economy,
according to analysts.
Most of the stored oil is condensate that contains a sulfur compound, which complicates
sales because many refineries can't process it, said Victor Shum of IHS Inc. and Robin Mills at
Dubai-based Manaar Energy Consulting. To market this large amount of oil within three months -
the equivalent of about half a million barrels a day - Iran will have to resort to offering deep
discounts, they said."
The condensate … is pumped from the offshore South Pars natural gas deposit.
Iran may need to spur sales of its sulfur-heavy condensate by offering discounts of at
least 10 to 15 percent, Shum said. Its main condensate customer, Dragon Aromatics Zhangzhou Co.
of China, stopped buying after a fire at its plant in April and an Iranian refinery designed to
use it won't be ready until 2017, causing stockpiles to build, he said.
"There will have to be a major impact on the market of selling that condensate," said Manaar
Energy's Mills, who worked for Royal Dutch Shell Plc on projects in Iran from 1998 to 2003.
"If they're already having difficulty shifting it, adding another half million barrels will
be even more difficult," he said by phone. "They'll manage, but at what discount?"
There are still significant discrepancies between the EIA monthly and weekly data for U.S. C+C
production.
Weekly numbers show an increase of 139 kb/d from September 25 to January 15, including an uninterrupted
growth (of 71 kb/d) over the past 6 weeks from December 4.
This large discrepancy between weekly and monthly data suggests that sources are at least partially
different and somewhat incompatible. This also puts a shadow on the accuracy of EIA data in general,
especially provided by the monthly short term energy outlook.
I think similar problems exist in other statistical data that EIA the short term energy outlook
provides.
Previously I asked a similar question about reliability of their world C+C production and consumption
data, but I did this from the point of view of accuracy individual country data (which are probably
less then 1%):
We have many times discussed the [un]reliability of the EIA U.S. oil production statistics.
They have previously relied on the state-level data, which in many cases is uncomplete, with few
exceptions (like North Dakota). The EIA was adjusting these numbers according to their old methodology.
But their numbers were still inaccurate and had to be revised many times during the next 12 months.
The EIA now has a new methodology: they get production data directly from the largest companies,
which account for about 90% of total output in each state. This survey-based approach now covers
15 individual states and the federal Gulf of Mexico, where the bulk of U.S. C+C is produced. The
EIA claims that the new methodology has improved the quality of their estimates. But, as can be
seen from the chart below, the numbers still need to be revised, and all of the revisions over
the past 4 months were upward (see the chart below).
In 2015, the EIA has not only underestimated U.S. oil production numbers for the past months,
but its predictions for the next several months were also too low. As a result, the most recent
numbers for some months are up to 0.5 mb/d higher than earlier estimates.
The EIA weekly numbers are based on completely different methodology, and they were always
seen as very inaccurate. Furthermore, unlike monthly statistics, weekly numbers are never revised.
What is interesting, weekly statistics from my chart above show a rising trend in U.S. oil
production from October to January, while monthly numbers suggest a declining trend. But monthly
numbers for October may again be revised upward, while the numbers from November are forecast,
rather than estimate. We may not know the more or less exact numbers for end-2015 until mid-2016.
U.S. C+C production estimates from the last 5 issues of the EIA Short-Term Energy Outlook
There are several hypothesis that can be advanced based on the data accuracy and a huge lag of
EIA and IEA data (as somebody aptly noted: the main purpose of IEA data is to please Americans):
1. Any talk about world glut below 1 Mb/d should be dismissed as statistical noise as the accuracy
of supply/demand data for most countries does not allow to defect such a glut or oil shortage.
2. EIA is not only statistical outlet but also a propaganda outlet as well providing (sometimes
false) signals to Wall street traders and as such having outsize influence on the dynamic of oil
prices. They literally can move oil up or down.
3. "The Great Condensate Con" was probably intentional and essentially is equal to creating
an artificial additional pressure on oil prices via manipulated statistics.
4. The only data that can counterbalance EIA/IEA bias can come from OPEC, but taking into account
outsize influence of Saudis within the organization chances are slim.
5. Rebound of prices, if any, can be pretty abrupt as lack of supplies will be detected only
when it becomes acute.
6. Repeating Watcher "It is indeed astounding that oil numbers, the most important numbers
for all civilization, are not reliable."
"... On January 14, respected oil and gas research outfit Wood Mackenzie released a study indicating low oil prices have resulted in the delay of US$380 billion in capital projects globally in the latter half 2015 alone. These were classified as pre-final investment decision (FID) developments put on hold until economics improve. In total, 68 projects that would ultimately yield 27 billion barrels of oil equivalent have been shelved. ..."
"... Wood Mackenzie estimated these projects would have added 1.5 million barrels per day of incremental production by 2021 and 2.9 million barrels a day by 2025. The main cutbacks have been in deep water offshore ..."
"... In 2008, research firm IHS estimated global oil reservoir decline rates at 4.5 percent. That same year, the International Energy Agency determined it was closer to 6.7 percent. The average is 5.5 percent. In a world producing 95 million b/d this means 5.2 million b/d of production will fall off the table in the next 12 months without continued investment. Wood Mackenzie has made it clear the spending which created current market conditions will not continue. ..."
"... the IEA sees the world exiting 2016 with oil demand at 96.49 million b/d, nearly 6 million b/d higher than just three years ago. ..."
"... The IEA sees non-OPEC production declining by only 600,000 b/d, which will neutralize their estimate of Iran adding 600,000 b/d. ..."
"... The tone of the IEA's report is mostly negative, but the numbers it published for the last half of this year are positive and have not changed significantly in the past four monthly reporting periods. ..."
"... Two Canadian investment managers have concluded the current oil price is unsustainably low and therefore the share prices of Canadian oil producers are grossly oversold. ..."
"... the Sprott Energy Fund is now 100 percent invested in Canadian oil stocks after being as high as 70 percent cash twice last year. ..."
"... "The biggest risk today isn't being invested in energy stocks. It's not being invested in energy stocks." ..."
"... Pelletier wrote, "Having covered the industry as a sell-side analyst, I've seen my fair share of reservoir models and production profiles. Shale wells have what is termed a hyperbolic decline curve, meaning they have upwards of a 75 percent decline rate in production in the first two years before they stabilize at substantially lower levels. They require continual drilling and a lot of capital reinvestment just to keep production flat, let alone grow it. Capital markets closed for business early last year and debt markets quickly followed suit, so these producers have had to rely on rapidly falling cash flows to continue drilling wells. The average U.S. producer was using more than 80 percent of its cash flow just to service interest payments when oil was at US$50 a barrel. ..."
There's an old saying
in journalism that goes, "Never let the facts ruin a good story." This
accurately describes what should be called The Incredible Shrinking
Oil Price.
Combined with sagging world stock markets, a global
economy that has all but quit growing because near-zero interest rates
are no longer stimulating the economy and the continued strength of
the U.S. dollar, oil cannot hide from the overall bearishness. Shorting
commodities may be the only thing traders can make money at nowadays.
After all, to earn quick profits trading anything, prices have to move.
The direction is less important than volatility.
At this moment, short-sellers are delighted by two major international
events which, on the surface, appear to reflect a continued world oil
glut and little hope of returning to crude prices that reflect something
related to replacement cost. International sanctions against Iran were
dropped January 17, allowing that country to resume exporting oil to
anyone who wants to buy it. Meanwhile, China is having difficulties
maintaining its rampant economic growth. Apparently, the official 6.9
percent growth rate that country reported in 2015 is appallingly low,
adding more credibility to the case commodity prices should stay at
historic low levels.
Noteworthy is the fact world oil markets started pricing the return
of Iranian crude exports six months ago when the framework of the agreement
to end international sanctions was announced in July - the last time
WTI traded over US$50 a barrel. While Iran has been all over the map
on how much oil it can produce and when, a Bloomberg News article January
17 quoted several analysts,
none of whom believed Iran could add 1 million barrels a day (b/d)
of production to export markets this year. Iran admits it needs some
US$100 billion in new investment to significantly raise output. Others
think this number is low. At US$30 a barrel, most oil companies don't
want to invest anywhere, let alone Iran. As oil prices fell again the
day after Iranian sanctions were dropped, markets did not care that
a single additional barrel of Iranian oil had yet to be sold. How many
times can you price the same news into one commodity price?
Meanwhile, whatever economic problems China experienced did not
affect that country's oil consumption in 2015. A Reuters
story January 19 reported Chinese oil demand may have hit an all-time
record of 10.32 million b/d last year, 2.5 percent higher than 2014.
In fact, China has put in place a floor price of US$40 a barrel for
its consumers to encourage domestic production and discourage accelerated
demand growth. There is no question China is consuming less iron ore,
coal and copper than in the past as its economy retools to be less
export oriented and focus more on domestic personal consumption. But
that means transportation and transportation means hydrocarbon fuel.
On top of world events, two major reports emerged in the past week
which send completely contradictory signals to global oil markets.
In a way, all this information actually leads to higher oil prices.
The trillion-dollar question is when.
On January 14, respected oil and gas research outfit Wood Mackenzie
released a study indicating low oil prices have resulted in the delay
of US$380 billion in capital projects globally in the latter half 2015
alone. These were classified as pre-final investment decision (FID)
developments put on hold until economics improve. In total, 68 projects
that would ultimately yield
27 billion barrels of oil equivalent have been shelved.
Wood Mackenzie estimated these projects would have added 1.5 million
barrels per day of incremental production by 2021 and 2.9 million barrels
a day by 2025. The main cutbacks have been in deep water offshore (Brazil
has officially delayed its so-called "pre-salt" reservoirs which were
thought to contain billions of recoverable barrels) and in Canada's oilsands. Rig counts are falling all over the world, except for some
countries in the Middle East.
Combined with the annual decline rates of every oil source in the
world except oilsands mining, one would have thought this information
would be in some way positive for oil prices. In 2008, research firm IHS estimated global oil reservoir decline rates at 4.5 percent. That
same year, the International Energy Agency determined it was closer
to 6.7 percent. The average is 5.5 percent. In a world producing 95
million b/d this means 5.2 million b/d of production will fall off
the table in the next 12 months without continued investment. Wood
Mackenzie has made it clear the spending which created current market
conditions will not continue.
However, the International Energy Agency (IEA) once again sided
with the bears in its January 19
monthly report. Calling world oil markets massively oversupplied,
the IEA reported supply would exceed demand by about 1.5 million b/d
in the first half 2016. The IEA admitted world oil demand grew in 2015
at one of the highest rates this century, but did not foresee this
level of demand growth being sustained in 2016, despite the most attractive
(read low) fuel prices since 2003. The IEA recited the global economic
slowdown that has dominated headlines so far this year as the basis
of its pessimism (despite what appears to be contrary data coming out
of China).
On the plus side, the IEA sees the world exiting 2016 with oil demand
at 96.49 million b/d, nearly 6 million b/d higher than just three years
ago.
The IEA sees non-OPEC production declining by only 600,000 b/d,
which will neutralize their estimate of Iran adding 600,000 b/d. While
the IEA does not forecast supply with the same granularity it estimates
demand, in the latter half of the year the agency sees output exceeding
consumption by the lowest amount in two years. The tone of the IEA's
report is mostly negative, but the numbers it published for the last
half of this year are positive and have not changed significantly in
the past four monthly reporting periods.
Two Canadian investment managers have concluded the current oil
price is unsustainably low and therefore the share prices of Canadian
oil producers are grossly oversold. In an interview with the
Globe and Mail on January 18 Eric Nuttall of Sprott Asset Management
revealed the Sprott Energy Fund is now 100 percent invested in Canadian
oil stocks after being as high as 70 percent cash twice last year. Nuttall admits he invested too soon but still believes a "meaningful
price recovery" is imminent. He told the Globe, "The biggest risk today
isn't being invested in energy stocks. It's not being invested in energy
stocks." Following short-term volatility, he sees a meaningful oil
recovery in Q2 or Q3 and some handsome gains to be made by investing
at the bottom, which he thinks is now.
On January 19, Martin Pelletier, a portfolio manager with TriVest
Wealth Counsel in Calgary, wrote an article in the
Financial Post titled, "Why the price of oil will recover faster
than you think." He sees the crude production declines required to
make a meaningful impact on the global supply / demand equation coming
from U.S. light tight oil (shale) producers. Pelletier wrote, "Having
covered the industry as a sell-side analyst, I've seen my fair share
of reservoir models and production profiles. Shale wells have what
is termed a hyperbolic decline curve, meaning they have upwards of
a 75 percent decline rate in production in the first two years before
they stabilize at substantially lower levels. They require continual
drilling and a lot of capital reinvestment just to keep production
flat, let alone grow it. Capital markets closed for business early
last year and debt markets quickly followed suit, so these producers
have had to rely on rapidly falling cash flows to continue drilling
wells. The average U.S. producer was using more than 80 percent of its cash flow just to
service interest payments when oil was at US$50 a barrel. Imagine the
situation at US$29 a barrel, or even
negative oil prices for North Dakota Sour crude."
Looking at the big decline in U.S. drilling, Pelletier concludes,
"When that impact comes, both the speed and magnitude of the fall in
production may surprise many and there will be little that can be done
to stop it, given the massive staffing cuts at North American service
and production companies and a quickly aging and under-maintained fleet
of service and production equipment."
CIBC Institutional Equity Research came to a similar conclusion
in its January 17 research note titled, "U.S. Rig Count Now >40$ Below
the Level Needed to Maintain Flat Production." CIBC wrote, "…we believe
the Lower 48 market could lose somewhere between 700 to 1,000 MBbl/d
(thousands of barrels per day) by YE (year end 2016) and, after taking
into account the incremental volume adds in the oilsands and GoM (Gulf
of Mexico) in 2016 and the reductions we're forecasting in the WCSB
conventional market, we believe North America is on course to lose
500-700 MBbl/d of output in 2016."
This is in sharp contrast to the IEA which sees total non-OPEC production
worldwide declines in 2016 of only 600,000 barrels. Somebody is clearly
wrong.
There are a few inescapable conclusions from the foregoing. Sustaining
supply requires drilling and investment, which is in precipitous decline
because of low oil prices. Demand will continue to grow at these prices
and, as China proved in 2015, possibly at faster rates than macroeconomic
models may reveal. The price is so low right now that production is
being withdrawn from the market, which will help rebalance it. Oil
is selling at a fraction of replacement cost while supplies dwindle
and demand grows. Something's gotta give.
Therefore, oil prices will rise once more people study the long-term
dynamics of oil markets instead of trading on and exploiting the short-term
news. Futures markets seem to agree. On the Chicago Mercantile Exchange,
WTI for delivery in February 2017 closed at US$37.08 a barrel on January
19, 23 percent higher than the market closing price for the day.
"... Estimated total U.S. oil and natural gas well completions fell by 51 percent in the fourth quarter of 2015 compared to year-ago levels, according to API's 2015 Quarterly Well Completion Report, Fourth Quarter. ..."
"... For 2015, total well completions decreased 35 percent overall compared to 2014 levels. Oil completions were down 37 percent and natural gas completions were down 28 percent). Total footage drilled was down 27 percent overall. ..."
"... I never had much doubt drilling and deferring completions was a viable option. Companies with deep pockets can do it and hold completions for up to three years as long as they get all the required permits and approvals to do so. ..."
WASHINGTON, January 19, 2016 – Estimated total U.S. oil and natural gas well completions fell
by 51 percent in the fourth quarter of 2015 compared to year-ago levels, according to API's 2015
Quarterly Well Completion Report, Fourth Quarter.
Estimated development oil well completions in 2015 fourth quarter fell 55 percent compared
to 2014 fourth quarter estimates. Estimated development gas completions decreased 37 percent over
the same period.
For 2015, total well completions decreased 35 percent overall compared to 2014 levels. Oil
completions were down 37 percent and natural gas completions were down 28 percent). Total footage
drilled was down 27 percent overall.
I never had much doubt drilling and deferring completions was a viable option. Companies with
deep pockets can do it and hold completions for up to three years as long as they get all the
required permits and approvals to do so.
"... I think the shorts, etc have hit critical mass on what they wanted to accomplish. As the oil market and stock market are now highly correlated, I am looking for the tide to turn. $26 was just too far. ..."
"... I don't think OPEC or Russia want to deal with a year or two of $30 oil. Given the connectivity of the global financial markets, I have a feeling we are going to see some big short covering. ..."
"... I also think if we have any decent recovery, the banks are going to insist shale live within cash flows for awhile. ..."
"... So, it would seem to me regardless of where prices go, a shale well earns less money on a per barrel basis over time because these costs are spread over fewer and fewer barrels every year. It is no wonder that shalies kept borrowing to drills. The new production provided high margin barrels in the early years to offset the worsening margins of legacy production. Am I looking at this correctly? ..."
"... If so, I think the upcoming numbers for the shalies will be horrific. With less new drilling, production will decline. Producers will be producing less barrels and earning a lower margin on each barrel produced as production from legacy wells makes up a larger percentage of production. Add in lower oil prices and the hemorrhaging could be quite bad. ..."
"... LOE varies greatly, but many range $10-$18,000 per month, not including down hole repairs. This comes straight from joint interest billings I have reviewed. Granted, there is some G A in those, some are tough to decipher. However, I have noticed as wells get down under 1000 BO per month, water hauling decreases, and LOE tends to be around $10-12,000 per month. ..."
"... I agree that Q4 will be horrible. But, if we stay around $30 WTI in Q1, it will really open some eyes. Right now there is very little cash flow with BOE realized being $18-22 in the Bakken, worse in more gassy areas. ..."
"... I am hoping for either a flush down to $10, which will force OPEC and Russia's hand, or a shift takes hold in the money center banks, where they decide oil shorting needs to stop. This slow drift since July has been horrible. ..."
"... Look at Parshall field. 6-8 year old wells making mostly 10-30 barrels per day. This is North Dakotas best. Not much cash flow, yet the wells really are not that old in my view. ..."
"... This implies a tremendous mismatch between debt levels and remaining cumulative net cash flow from production. ..."
"... The way the companies stay alive at these levels is through under the table bank bailouts (i.e. ignoring reserve based lending standards). ..."
"... In its 2014 10K, CLR noted that its PV10 all categories fell from $22 billion to $9 billion, simply by replacing 2014 SEC product pricing with 2/15/15 product pricing. 2/15/15 product pricing was SUSTANTIALLY better than present. ..."
Looking at year end reports here, comparing to past years. Really puts into
perspective how much 2015 deviated from prior years in the P & L, which is what
matters.
Plugging in average price thus far in 2016, using 2015 expenses is yet another
pretty stark reminder of just how low we are. It makes 2015 look good.
I think the shorts, etc have hit critical mass on what they wanted to accomplish.
As the oil market and stock market are now highly correlated, I am looking for
the tide to turn. $26 was just too far.
I don't think OPEC or Russia want to deal with a year or two of $30 oil. Given
the connectivity of the global financial markets, I have a feeling we are going
to see some big short covering.
I also think if we have any decent recovery, the banks are going to insist shale
live within cash flows for awhile.
You've written much before on well economics. Would you say that
most operating expenses for operating a well are mainly fixed? Electricity,
fuel and other expenses would seem to be the same regardless of whether the
well was producing 50 barrels per day or 25 b/day. Workovers and repairs seem
to be needed to be conducted regularly enough that in a sense they are fixed
costs as well.
So, it would seem to me regardless of where prices go, a shale well earns
less money on a per barrel basis over time because these costs are spread over
fewer and fewer barrels every year. It is no wonder that shalies kept borrowing
to drills. The new production provided high margin barrels in the early years
to offset the worsening margins of legacy production. Am I looking at this correctly?
If so, I think the upcoming numbers for the shalies will be horrific. With
less new drilling, production will decline. Producers will be producing less
barrels and earning a lower margin on each barrel produced as production from
legacy wells makes up a larger percentage of production. Add in lower oil prices
and the hemorrhaging could be quite bad.
John Keller. I do not know how quickly we will see this effect, but it will
be there.
Below are my views of Bakken wells.
LOE varies greatly, but many range $10-$18,000 per month, not including
down hole repairs. This comes straight from joint interest billings I have
reviewed. Granted, there is some G &A in those, some are tough to decipher.
However, I have noticed as wells get down under 1000 BO per month, water
hauling decreases, and LOE tends to be around $10-12,000 per month.
A year ago, tubing leaks were costing in the $70,000 range to repair,
down hole pump changes around $30,000. This was on rod lift wells.
A year ago I looked at several wells operated by Marathon Oil. Wells completed
2008-2010 ranged from $13-$55 per BOE to operate per the joint interest billings.
There were some re fracked wells, that were running under $3 per BOE, as
I recall. I did a post on this information.
I agree that Q4 will be horrible. But, if we stay around $30 WTI in Q1,
it will really open some eyes. Right now there is very little cash flow with
BOE realized being $18-22 in the Bakken, worse in more gassy areas.
We have shut in a lot of wells. We are just running water floods, plus
a few low cost wells that make almost straight oil. $20s in the field is
devastating for the US industry. For conventional producers, few are operating
at a profit.
I am hoping for either a flush down to $10, which will force OPEC and
Russia's hand, or a shift takes hold in the money center banks, where they
decide oil shorting needs to stop. This slow drift since July has been horrible.
Look at Parshall field. 6-8 year old wells making mostly 10-30 barrels
per day. This is North Dakotas best. Not much cash flow, yet the wells really
are not that old in my view.
As I have previously noted, given an ongoing decline in wellhead revenue,
due to falling production and/or falling product prices, unless total operating
costs (LOE and pro-rated G&A) fall at the same rate as, or at a rate faster
than, the rate of decline in wellhead revenue, the resulting rate of decline
in net cash flow from a given lease will decline at a rate faster than the
rate of decline in wellhead revenue, and the rate of decline in net cash
flow will accelerate with time.
This implies a tremendous mismatch between debt levels and remaining cumulative
net cash flow from production.
Jeffrey. Yes, thus my constant harping regarding PDP PV10. I would wager
up to 25% of all Bakken/Three Forks wells drilled and completed since
the year 2007 are losing money on an operating basis at today's prices,
and thus are not assets, but liabilities.
I suspect at $30 WTI and $2
Henry Hub, PDP PV10 of $10 million based on 2014 product pricing falls
to maybe $1 million at present product pricing in the Williston basin,
for Bakken/Three Forks wells completed since 2007.
At 2014 pricing, a 100 BOEPD well was likely netting 8-9 times what
a 100 BOEPD well is netting under current product pricing.
The way the companies stay alive at these levels is through under the
table bank bailouts (i.e. ignoring reserve based lending standards).
Almost NONE of the LTO companies in the United States are in a position
to have ANY further credit extended to them under traditional reserve
based lending standards. Almost ALL of them have total debt exceeding
65% of PDP PV10 at the current futures strips for WTI and Henry Hub. MANY
have total debt which exceeds PDP PV10, which, in my book, makes them
technically insolvent.
In its 2014 10K, CLR noted that its PV10 all categories fell from $22
billion to $9 billion, simply by replacing 2014 SEC product pricing with
2/15/15 product pricing. 2/15/15 product pricing was SUSTANTIALLY better
than present.
"... The exceptions are in OPEC, Russia, and other countries where strategic considerations control the pace. Thus the price will, in a rough fashion, be dictated by these large player strategic needs. And I suspect they will feel more comfortable with prices above $80 per barrel. I think they will try as much as possible to stifle competition from marginal producers such as the USA and Canada, but to accomplish this all they have to do is try to keep prices in that 80 to 100 range. ..."
Shallow, for what it's worth, many deep water, extra heavy oil, and marginal
conventional oil projects I reviewed over the last five years need $90 plus
per barrel to move forward. I reviewed these as a consultant, therefore I
can't discuss details.
My impression is that a lot of what's on the shelf waiting to be
developed requires high prices. The exceptions are in OPEC, Russia, and
other countries where strategic considerations control the pace. Thus the
price will, in a rough fashion, be dictated by these large player strategic
needs. And I suspect they will feel more comfortable with prices above $80
per barrel. I think they will try as much as possible to stifle competition
from marginal producers such as the USA and Canada, but to accomplish this
all they have to do is try to keep prices in that 80 to 100 range.
Rumailia estimated 17 billion barrels remaining proven and recoverable.
(BP targets output of 2.1 mbpd. 22 yrs of flow. 2.1 is up from 1.6 mbpd
now)
Majnoon estimated 13 billion barrels remaining proven and recoverable.
(Petronas and RDS have the contract and target 1.8 mbpd within 7 yrs (of
2009), interim target from 45K bpd in March 2010 to 175K bpd in 2012. Latest
RDS website bragging says now 210K bpd. They ain't gonna hit 1.8 mbpd this
year)
West Qurna estimated 43 billion barrels remaining proven and recoverable.
(Exxon RDS won the Phase 1 (9B in reserves) contract planning 0.27 mbpd
to 2.2 mbpd. 7 yrs from 2009. 480K bpd in 2013)
(Lukoil now owns 75% of the rights to WQ Phase II 13B remaining proven
and recoverable, planning for raising from 180K bpd in 2012 to 1.8 mbpd
by 2020).
Several other single digit billion barrel fields in Iraq.
Globally, we consumed about 270 GB of C+C in past 10 years, and as I have
occasionally opined, it seems likely that actual global crude oil production
has been on an "Undulating Plateau" since 2005.
"... for what it's worth, many deep water, extra heavy oil, and marginal conventional oil projects I reviewed over the last five years need $90 plus per barrel to move forward. I reviewed these as a consultant, therefore I can't discuss details. ..."
Shallow, for what it's worth, many deep water, extra heavy oil, and marginal conventional oil projects
I reviewed over the last five years need $90 plus per barrel to move forward. I reviewed these as
a consultant, therefore I can't discuss details.
My impression is that a lot of what's on the shelf waiting to be developed requires high prices.
The exceptions are in OPEC, Russia, and other countries where strategic considerations control the
pace. Thus the price will, in a rough fashion, be dictated by these large player strategic needs.
And I suspect they will feel more comfortable with prices above $80 per barrel. I think they will
try as much as possible to stifle competition from marginal producers such as the USA and Canada,
but to accomplish this all they have to do is try to keep prices in that 80 to 100 range.
"The forecasting error for global consumption was much larger, at an average of 400,000 barrels
per day, with a standard deviation of as much as 1.1 million barrels per day (tmsnrt.rs/1S9kIZz)."
Completely meaningless. Can't depend on what is compared to.
It is indeed astounding that oil numbers, the most important numbers for all civilization,
are not reliable.
"... And yet the alliance persists, kept afloat on a sea of Saudi money and a recognition of mutual self-interest. In addition to Saudi Arabia's vast oil reserves and role as the spiritual anchor of the Sunni Muslim world, the long intelligence relationship helps explain why the United States has been reluctant to openly criticize Saudi Arabia for its human rights abuses ..."
"... Although the Saudis have been public about their help arming rebel groups in Syria, the extent of their partnership with the CIA's covert action campaign and their direct financial support had not been disclosed. Details were pieced together in interviews with a half-dozen current and former American officials and sources from several Persian Gulf countries. Most spoke on the condition of anonymity because they were not authorized to discuss the program. ..."
"... Months later, Mr. Obama gave his approval for the CIA to begin directly arming and training the rebels from a base in Jordan, amending the Timber Sycamore program to allow lethal assistance. Under the new arrangement, the CIA took the lead in training, while Saudi Arabia's intelligence agency, the General Intelligence Directorate, provided money and weapons, including TOW anti-tank missiles. ..."
"... The Qataris have also helped finance the training and allowed a Qatari base to be used as an additional training location. But American officials said Saudi Arabia was by far the largest contributor to the operation. While the Obama administration saw this coalition as a selling point in Congress, some, including Senator Ron Wyden, an Oregon Democrat, raised questions about why the CIA needed Saudi money for the operation, according to one former American official. Mr. Wyden declined to be interviewed, but his office released a statement calling for more transparency. "Senior officials have said publicly that the U.S. is trying to build up the battlefield capabilities of the anti-Assad opposition, but they haven't provided the public with details about how this is being done, which U.S. agencies are involved, or which foreign partners those agencies are working with," the statement said. ..."
"... While the Saudis have financed previous CIA missions with no strings attached, the money for Syria comes with expectations, current and former officials said. "They want a seat at the table, and a say in what the agenda of the table is going to be," said Bruce Riedel, a former CIA analyst and now a senior fellow at the Brookings Institution . ..."
"... "The more that the argument becomes, 'We need them as a counterterrorism partner,' the less persuasive it is," said William McCants, a former State Department counterterrorism adviser and the author of a book on the Islamic State . "If this is purely a conversation about counterterrorism cooperation, and if the Saudis are a big part of the problem in creating terrorism in the first place, then how persuasive of an argument is it?" ..."
"... Prince Mohammed bin Nayef, the Saudi interior minister who took over the effort to arm the Syrian rebels from Prince Bandar, has known the CIA director, John O. Brennan, from the time Mr. Brennan was the agency's Riyadh station chief in the 1990s. Former colleagues say the two men remain close, and Prince Mohammed has won friends in Washington with his aggressive moves to dismantle terrorist groups like Al Qaeda in the Arabian Peninsula. ..."
"... The roots of the relationship run deep. In the late 1970s, the Saudis organized what was known as the "Safari Club" - a coalition of nations including Morocco, Egypt and France - that ran covert operations around Africa at a time when Congress had clipped the CIA's wings over years of abuses. ..."
"... In the 1980s, the Saudis helped finance CIA operations in Angola, where the United States backed rebels against the Soviet-allied government. While the Saudis were staunchly anticommunist, Riyadh's primary incentive seemed to be to solidify its CIA ties. "They were buying good will," recalled one former senior intelligence officer who was involved in the operation. ..."
"... In perhaps the most consequential episode, the Saudis helped arm the mujahedeen rebels to drive the Soviets out of Afghanistan. The United States committed hundreds of millions of dollars each year to the mission, and the Saudis matched it, dollar for dollar. ..."
"... Prince Bandar pledged $1 million per month to help fund the contras, in recognition of the administration's past support to the Saudis. The contributions continued after Congress cut off funding to the contras. By the end, the Saudis had contributed $32 million, paid through a Cayman Islands bank account. ..."
WASHINGTON - When President Obama secretly authorized the
Central Intelligence Agency to begin arming
Syria 's embattled rebels in 2013, the spy agency knew it would have a willing partner to help
pay for the covert operation. It was the same partner the
CIA has relied on for decades for money and discretion in far-off conflicts: the Kingdom of
Saudi Arabia .
Since then, the CIA and its Saudi counterpart have maintained an unusual arrangement for the
rebel-training mission, which the Americans have code-named Timber Sycamore. Under the deal, current
and former administration officials said, the Saudis contribute both weapons and large sums of money,
and the CIA takes the lead in training the rebels on AK-47 assault rifles and tank-destroying missiles.
The support for the Syrian rebels is only the latest chapter in the decadeslong relationship between
the spy services of
Saudi Arabia and the United States, an alliance that has endured through the Iran-contra scandal,
support for the mujahedeen against the Soviets in Afghanistan and proxy fights in Africa. Sometimes,
as in
Syria , the two countries have worked in concert. In others, Saudi Arabia has simply written
checks underwriting American covert activities.
Decades of Discreet Cooperation
The joint arming and training program, which other Middle East nations contribute money to, continues
as America's relations with Saudi Arabia - and the kingdom's place in the region - are in flux. The
old ties of cheap oil and geopolitics that have long bound the countries together have loosened as
America's dependence on foreign oil declines and the Obama administration tiptoes toward a diplomatic
rapprochement with Iran.
And yet the alliance persists, kept afloat on a sea of Saudi money and a recognition of mutual
self-interest. In addition to Saudi Arabia's vast oil reserves and role as the spiritual anchor of
the Sunni Muslim world, the long intelligence relationship helps explain why the United States has
been reluctant to openly criticize Saudi Arabia for its human rights abuses, its treatment of
women and its support for the
extreme strain of Islam, Wahhabism , that has inspired many of the very terrorist groups the
United States is fighting. The Obama administration did not publicly condemn Saudi Arabia's
public beheading this month of a dissident Shiite cleric, Sheikh Nimr al-Nimr, who had challenged
the royal family.
Although the Saudis have been public about their help arming rebel groups in Syria, the extent
of their partnership with the CIA's covert action campaign and their direct financial support
had not been disclosed. Details were pieced together in interviews with a half-dozen current and
former American officials and sources from several Persian Gulf countries. Most spoke on the condition
of anonymity because they were not authorized to discuss the program.
From the moment the CIA operation was started, Saudi money supported it.
"They understand that they have to have us, and we understand that we have to have them," said
Mike Rogers, the former Republican congressman from Michigan who was chairman of the
House Intelligence Committee when the
CIA operation began. Mr. Rogers declined to discuss details of the classified program.
American officials have not disclosed the amount of the Saudi contribution, which is by far the
largest from another nation to the program to arm the rebels against President Bashar al-Assad's
military. But estimates have put the total cost of the arming and training effort at several billion
dollars.
The White House has embraced the covert financing from Saudi Arabia - and from Qatar, Jordan and
Turkey - at a time when Mr. Obama has pushed gulf nations to take a greater security role in the
region.
Spokesmen for both the CIA and the Saudi Embassy in Washington declined to comment.
When Mr. Obama signed off on
arming the rebels in the spring of 2013, it was partly to try to gain control of the apparent
free-for-all in the region. The Qataris and the Saudis had been funneling weapons into Syria for
more than a year. The Qataris had even smuggled in
shipments of Chinese-made FN-6 shoulder-fired missiles over the border from Turkey.
The Saudi efforts were led by the flamboyant Prince Bandar bin Sultan, at the time the intelligence
chief, who directed Saudi spies to buy thousands of AK-47s and millions of rounds of ammunition in
Eastern Europe for the Syrian rebels. The CIA helped arrange some of the arms purchases for the
Saudis, including a large deal in Croatia in 2012.
By the summer of 2012, a freewheeling feel had taken hold along Turkey's border with Syria as
the gulf nations funneled cash and weapons to rebel groups - even some that American officials were
concerned had ties to radical groups like Al Qaeda.
The CIA was mostly on the sidelines during this period, authorized by the White House under
the Timber Sycamore training program to deliver nonlethal aid to the rebels but not weapons. In late
2012, according to two former senior American officials, David H. Petraeus, then the CIA director,
delivered a stern lecture to intelligence officials of several gulf nations at a meeting near the
Dead Sea in Jordan. He chastised them for sending arms into Syria without coordinating with one another
or with CIA officers in Jordan and Turkey.
Months later, Mr. Obama gave his approval for the CIA to begin directly arming and training
the rebels from a base in Jordan, amending the Timber Sycamore program to allow lethal assistance.
Under the new arrangement, the CIA took the lead in training, while Saudi Arabia's intelligence
agency, the General Intelligence Directorate, provided money and weapons, including TOW anti-tank
missiles.
The Qataris have also helped finance the training and allowed a Qatari base to be used as
an additional training location. But American officials said Saudi Arabia was by far the largest
contributor to the operation. While the Obama administration saw this coalition as a selling point
in Congress, some, including Senator Ron Wyden, an Oregon Democrat, raised questions about why the
CIA needed Saudi money for the operation, according to one former American official. Mr. Wyden
declined to be interviewed, but his office released a statement calling for more transparency. "Senior
officials have said publicly that the U.S. is trying to build up the battlefield capabilities of
the anti-Assad opposition, but they haven't provided the public with details about how this is being
done, which U.S. agencies are involved, or which foreign partners those agencies are working with,"
the statement said.
When relations among the countries involved in the training program are strained, it often falls
to the United States to broker solutions. As the host, Jordan expects regular payments from the Saudis
and the Americans. When the Saudis pay late, according to a former senior intelligence official,
the Jordanians complain to CIA officials.
While the Saudis have financed previous CIA missions with no strings attached, the money
for Syria comes with expectations, current and former officials said. "They want a seat at the table,
and a say in what the agenda of the table is going to be," said Bruce Riedel, a former CIA analyst
and now a senior fellow at the Brookings Institution
.
The CIA training program is separate from another program to arm Syrian rebels, one the Pentagon
ran that has since ended. That program was designed to train rebels to combat Islamic State fighters
in Syria, unlike the CIA's program, which focuses on rebel groups fighting the Syrian military.
While the intelligence alliance is central to the Syria fight and has been important in the war
against Al Qaeda, a constant irritant in American-Saudi relations is just how much Saudi citizens
continue to support terrorist groups, analysts said.
"The more that the argument becomes, 'We need them as a counterterrorism partner,' the less
persuasive it is," said William McCants, a former State Department counterterrorism adviser and the
author of a book
on the Islamic State . "If this is purely a conversation about counterterrorism cooperation,
and if the Saudis are a big part of the problem in creating terrorism in the first place, then how
persuasive of an argument is it?"
In the near term, the alliance remains solid, strengthened by a bond between spy masters.
Prince Mohammed bin Nayef, the Saudi interior minister who took over the effort to arm the Syrian
rebels from Prince Bandar, has known the CIA director, John O. Brennan, from the time Mr. Brennan
was the agency's Riyadh station chief in the 1990s. Former colleagues say the two men remain close,
and Prince Mohammed has won friends in Washington with his aggressive moves to dismantle terrorist
groups like Al Qaeda in the Arabian Peninsula.
The job Mr. Brennan once held in Riyadh is, more than the ambassador's, the true locus of American
power in the kingdom. Former diplomats recall that the most important discussions always flowed through
the CIA station chief.
Current and former intelligence officials say there is a benefit to this communication channel:
The Saudis are far more responsive to American criticism when it is done in private, and this secret
channel has done more to steer Saudi behavior toward America's interests than any public chastising
could have.
The roots of the relationship run deep. In the late 1970s, the Saudis organized what was known
as the "Safari Club" - a coalition of nations including Morocco, Egypt and France - that ran covert
operations around Africa at a time when Congress had clipped the CIA's wings over years of abuses.
"And so the kingdom, with these countries, helped in some way, I believe, to keep the world safe
at a time when the United States was not able to do that," Prince Turki al-Faisal, a former head
of Saudi intelligence, recalled in a speech at Georgetown University in 2002.
In the 1980s, the Saudis helped finance CIA operations in Angola, where the United States
backed rebels against the Soviet-allied government. While the Saudis were staunchly anticommunist,
Riyadh's primary incentive seemed to be to solidify its CIA ties. "They were buying good will,"
recalled one former senior intelligence officer who was involved in the operation.
In perhaps the most consequential episode, the Saudis helped arm the mujahedeen rebels to
drive the Soviets out of Afghanistan. The United States committed hundreds of millions of dollars
each year to the mission, and the Saudis matched it, dollar for dollar.
The money flowed through a CIA-run Swiss bank account. In the book "
Charlie
Wilson's War ," the journalist George Crile III describes how the CIA arranged for the account
to earn no interest, in keeping with the Islamic ban on usury.
In 1984, when the Reagan administration sought help with its secret plan to sell arms to Iran
to finance the contra rebels in Nicaragua, Robert C. McFarlane, the national security adviser, met
with Prince Bandar, who was the Saudi ambassador to Washington at the time. The White House made
it clear that the Saudis would "gain a considerable amount of favor" by cooperating, Mr. McFarlane
later recalled.
Prince Bandar pledged $1 million per month to help fund the contras, in recognition of the
administration's past support to the Saudis. The contributions continued after Congress cut off funding
to the contras. By the end, the Saudis had contributed $32 million, paid through a Cayman Islands
bank account.
When the Iran-contra scandal broke, and questions arose about the Saudi role, the kingdom kept
its secrets. Prince Bandar refused to cooperate with the investigation led by
Lawrence E. Walsh , the independent counsel.
In a letter, the prince declined to testify, explaining that his country's "confidences and commitments,
like our friendship, are given not just for the moment but the long run."
"... While playing down the importance of government gains, Saleh said military aid from the rebels' foreign backers - including Saudi Arabia and Turkey - was not enough to confront offensives that are also backed on the ground by Iran. ..."
"... These are among the difficulties facing the FSA on the ground especially since the aerial bombing is affecting some headquarters, equipment, cars and personnel ..."
... The government last week made one of its most significant
gains since the start of the Russian intervention, capturing the town of Salma in Latakia province.
While recent gains do not appear to mark a tipping point in the conflict, with rebels fighting
back and regaining positions in some places, insurgents describe high levels of attrition on the
front lines of western Syria.
Officials close to Damascus say sealing the northwestern border with Turkey is the priority. A
Syrian military source said rebel supply lines from Turkey, which backs the insurgents, were under
pressure from Russian and Syrian air strikes.
... ... ...
"Most opposition-held areas turned to defense because of the huge mobilization by Russians troops
and the use of a large number of planes with unlimited munitions," said Jamil al-Saleh, commander
of a rebel Free Syrian Army (FSA) group.
While playing down the importance of government gains, Saleh said military aid from the rebels'
foreign backers - including Saudi Arabia and Turkey - was not enough to confront offensives that
are also backed on the ground by Iran.
"These are among the difficulties facing the FSA on the ground especially since the aerial
bombing is affecting some headquarters, equipment, cars and personnel and the aid given is little
compared to the ferocious attack," he told Reuters.
Saudi Arabia's support for the opposition has yet to be translated into the kind of heavier weapons
the rebels are seeking, notably anti-aircraft missiles.
The military source, speaking on condition of anonymity, said rebels were suffering from the destruction
of their weapons depots, made possible by good intelligence. Their appeals for more support showed
they had "lost a lot of field capacities", the source said.
"... Greg Valliere, chief global strategist at Horizon Investments, is surprised Congress hasnt seemed to notice the oil crash, calling it a looming crisis. ..."
"... The shocking drop in the price of oil will soon get Washingtons attention, as unemployment spikes in Texas, Oklahoma, the Dakotas -- and as bankruptcies threaten to spiral out of control, Valliere wrote in a recent client note. ..."
"... John Kilduff, founding partner of energy hedge fund Again Capital, wrote a CNBC column making the case for a bailout. He said it should include payments to oil producers that shut down production, loan guarantees, revamping the bankruptcy code and having government agencies buy land with drilled-but-uncompleted wells. ..."
"... It is time to send out an S.O.S., before its too late, Kilduff wrote, adding that his version of S.O.S. stands for Save Our Shale industry. ..."
"... Unlike the collapse of the financial and auto industries in 2008/2009, a collapse of the oil industry here would not threaten the entire economy. That's because it's only a part of the oil industry that is affected...oil producers. Oil transportation, storage and refining are largely unaffected by this drop in the price of oil. ..."
"... It's a very curious stance and one that makes me wonder who backs the PPA. The bottom line is that an average barrel of oil in the U.S. costs about $ 70 for an energy company to produce. In OPEC nations, that number is around $ 20. That means on every barrel of oil a U.S. producer sells, they are losing more than half their money right now. Unfortunately, because so many of the newer, smaller producers are so highly leveraged, they don't have the option to sit on production until the price of oil increases. ..."
"... At that point, those larger companies will gobble their smaller counterparts up for pennies on the dollar, and trigger an increase in oil prices when they slow production. ..."
Greg Valliere, chief global strategist at Horizon Investments, is surprised Congress hasn't
seemed to notice the oil crash, calling it a looming crisis.
"The shocking drop in the price of oil will soon get Washington's attention, as unemployment
spikes in Texas, Oklahoma, the Dakotas -- and as bankruptcies threaten to spiral out of control,"
Valliere wrote in a recent client note.
To be sure, there doesn't appear to be an actual bailout in the works for the oil industry to
turn down. But talk about a federal rescue grew louder this month as crude oil crashed below $35
a barrel to as low as $26 this week.
John Kilduff, founding partner of energy hedge fund Again Capital, wrote a
CNBC column making the case for a bailout. He said it should include payments to oil producers
that shut down production, loan guarantees, revamping the bankruptcy code and having government agencies
buy land with drilled-but-uncompleted wells.
It is time to send out an S.O.S., before it's too late," Kilduff wrote, adding that his version
of S.O.S. stands for "Save Our Shale" industry.
However, many lawmakers don't want to be viewed as helping Big Oil -- especially not when a presidential
election hangs in the balance. There may also be bailout fatigue given the unpopular rescues of the
banking and auto industries in 2008 and 2009.
splifferton
Taxpayers currently subsidize the oil industry by as much as $4.8 billion a year, with
about half of that going to the big five oil companies-ExxonMobil, Shell, Chevron, BP, and
ConocoPhillips-which get an average tax break of $3.34 on every barrel of domestic crude they
produce.
I'm thinking they get enough already...
lmacmil
Funny, I hadn't read about anyone calling for a bailout of any energy-industry related
companies until I read this article. In fact, haven't really heard about any looking at
bankruptcy either (except Freeport-McRoRan in today's NY Times.) Where did this even come
from? It's not even close to what we were looking at in 2008. Must be a slow news day.
boatnmaniac
Unlike the collapse of the financial and auto industries in 2008/2009, a collapse of
the oil industry here would not threaten the entire economy. That's because it's only a part
of the oil industry that is affected...oil producers. Oil transportation, storage and refining
are largely unaffected by this drop in the price of oil.
Let the market forces work here. Those producers who lack the cash to stay in business will
go out of business and their assets will be bought up on the cheap by producers who are more
financially stable.
boatnmaniac
@chriss747 @boatnmaniac The problem with the auto industry was 2-fold. Unlike with oil
producers which have a lot of competition and where the healthier companies would be more than
willing to pick up failed producers' assets on the cheap, the auto companies could find no
buyers...nada.
The 2nd part of that is that an auto industry collapse would have had a large ripple effect
on all the down-stream suppliers which is a huge segment of our country's manufacturing
capacity. That would have been not only a huge risk to the economy but it was a huge risk to
national security because the auto industry supply chain industrial complex is extremely
critical to our country's ability to support the military.
There's simply no way the Fed Gov't could permit the auto industry to fail because of this.
evilbravoman
"We're asking the federal government to get out of the way and allow America's free-market
principles to work," the group said, referring to government support for competitors like
renewable energy sources like solar and wind.
Translation - we have a monopoly on energy here and we don't want anything else to affect
that!! We want everyone to stay on oil until the last drop is pumped out of the ground!!!
Typical short sited greed of Wall Street...
bzscorpio
It's a very curious stance and one that makes me wonder who backs the PPA. The bottom
line is that an average barrel of oil in the U.S. costs about $ 70 for an energy company to
produce. In OPEC nations, that number is around $ 20. That means on every barrel of oil a U.S.
producer sells, they are losing more than half their money right now. Unfortunately, because
so many of the newer, smaller producers are so highly leveraged, they don't have the option to
sit on production until the price of oil increases.
My guess is the PPA is mostly backed by large energy companies (like Exxon, BP, Shell, etc.)
who realize it's only a matter of time before the smaller oil producers in the U.S. go
bankrupt when oil doesn't rebound to 2014 levels and they run out of money. At that point,
those larger companies will gobble their smaller counterparts up for pennies on the dollar,
and trigger an increase in oil prices when they slow production. While I am certainly not
a fan of bailouts, I do understand when they are necessary, and I certainly think the
government bailing out small oil companies (whether it be with interest-free loans, subsidies,
etc) would be a worthwhile investment, if for no other reason than the wide-ranging economic
benefits of maintaining lower oil prices. Low gas prices help every American consumer, a very
wide-range of American companies (couriers, car manufacturers, airlines, etc), and also help
our trade deficit by keeping our dollar strong, not to mention protecting the jobs of
employees of these small oil companies.
Of course, the PPA doesn't want these small companies to remain in business because it would
prevent the large oil producers to buy them out on the cheap when they go bankrupt, which
almost every economist who follows the energy industry is predicting will start happening on a
large scale within the next 12-18 months, if not sooner.
mitchgam
The pain on the downswing is not only to the oil corporations but to the workers,
homeowners and business people in the communities effected.
When the prices go up, the pain is to the consumers across the nation.
Maybe now is the time to apply the same principals and solution that the GOP applies to
domestic farmers to the oil industry. (Price supports)
And if you, like me disagree with doing so, why do we do it for some industries and not
others?
Tom Evans
We use oil primarily for transportation in the US. Transitioning to electric vehicles will
be a long process that will be prolonged by cheap oil. I don't see airlines, railroads or
trucking transitioning from oil for a very long time, if ever.
Broncos2014
@mitchgam @Broncos2014 @Rektm
2. Chevron
The oil giant pay among the highest tax rates because of overseas royalties that float with
the price of oil.
Income tax expense: $20 billion
Net income: $26 billion
Effective tax rate: 43%
7. ConocoPhillips
Conoco paid the highest effective tax rate of any company on the list.
Income tax expense: $7.9 billion
Net income: $8.4 billion
Effective tax rate: 51.5%
Econimica
Iteresting to note it was the Fed's implementation of QE and ZIRP that was the underlying
premise for the oil price from Dec '08 til now...and it was the Fed's cheap money (lower for
longer) which created the massive overcapacity in global oil by providing credit to US /
Canadian "marginal" shale and tar sands producers who brought 90% of all new oil to the global
market from '09 til now...this is what created the massive over supply to the
market...consider:
---Oil prices bottomed in Dec '08...the same month QE was implemented
---Oil began it's fall in Aug '14...as QE was tapering out and oil was tumbling by the time QE
terminated Oct '14...and oil has collapsed since.
---When the Fed stopped accumulating Treasury's via QE in late 2014...why did foreigners do
likewise (stop accumulating)??? What is the impact on the US markets and economy of all
Treasury buying shifting to domestic sources?
---What is the linkage of QE, the dollar, Treasury's, and oil?
---What is the likelihood of a Fed U-turn in 2nd half of 2016 and re-implementing QE to weaken
the dollar and offer a whole lot of support for oil?
A look at the correlation and/or causation in the links. http://bit.ly/20hKX2W
When one adds in the fact that the days of a growing pie for everybody are nearly over...many
pieces to be considered. http://bit.ly/1mS9Of0
So EIA and IEA figures are just educated guesses or propaganda or both
Notable quotes:
"... I believe net export capacity if far more important than overall production numbers. ..."
"... Not only data are very difficult to come by, but the accuracy is low. I think well below 1%. So all talk about glut of less then 1 Mb/d is essentially a talk about statistical noise. In no way glut of less then 1 Mb/d can be reliably detected from those figures as with world production of over 90 Mb/d their accuracy does not allow such a detection. In other words it is equal to balance. Similarly deficit below 1 Mb/d also can not be reliably detected and is equal to a balance of supply and demand. ..."
"... If you look closely at methods by which EIA collects their information 1% accuracy is a very charitable estimate. Even in the USA, they rely of states data. ..."
"... So as for foreign countries their last month data are probably not much different in accuracy from their short term forecasts. ..."
Do we have any good data for 'net export' by country? Perhaps I have missed it. I believe
net export capacity if far more important than overall production numbers.
Yes, export capacity is the most important and that is what everyone is missing. And at the same
time if you have the least expensive oil you are suddenly "swing" producer but not in the sense
that you control the price but that you can outlast the price downturn.
Not only data are very difficult to come by, but the accuracy is low. I think well below
1%. So all talk about "glut" of less then 1 Mb/d is essentially a talk about statistical noise.
In no way "glut" of less then 1 Mb/d can be reliably detected from those figures as with world
production of over 90 Mb/d their accuracy does not allow such a detection. In other words it is
equal to balance. Similarly deficit below 1 Mb/d also can not be reliably detected and is equal
to a balance of supply and demand.
If you look closely at methods by which EIA collects their information 1% accuracy is a
very charitable estimate. Even in the USA, they rely of states data.
That introduces tremendous lag. So only with time their figures about foreign countries probably
became close to 1% margin of error, if at all. My impression is that more recent figures are often
not more then educated guesses or propaganda (and EIA is partially a propaganda/political organization
of the US government; it was created as a reaction to Arab oil embargo with a specific political
agenda). So as for foreign countries their "last month" data are probably not much different
in accuracy from their short term forecasts.
"... There remains about 4.8 million bpd of shale oil still in production, but facing natural decline rates of more than 15% per year - enough to erase some 600,000 bpd of U.S. production this year. ..."
"... "Canary in the Oil Well. If $BOKF is having problems you can bet Every bank is pretty much now in 'holy-crap' mode." ..."
"... Balance sheets may be turning to rubble, but the banks will continue to work companies as long as they are worth more alive than dead and they are honest. Almost all of them, he said, are both. Three months from now might be a different story. ..."
There remains about 4.8 million bpd of shale oil still in production, but facing natural decline
rates of more than 15% per year - enough to erase some 600,000 bpd of U.S. production this year.
In Canada, oil sands crude is now fetching less than $10 a barrel. That price was finally too
much for Canadian Oil Sands , which yesterday agreed to be acquired by Suncor for $2.9 billion –
a third of what the company's stock was valued at back in 2014.
The Middle Eastern oil giants can survive these prices, with Kuwait, Saudi Arabia and Iraq still
profitable into the low $20s, according to Rystad Energy. Saudi exports are trending at 7-month highs.
Rystad figures Iran's break even price is in the high $20s. Even so, a report today from the U.S.
Energy Information Administration figures that Iran will increase output from 2.8 million to 3.1
million this year, and 3.6 million in 2017.
...demand remains strong, set to grow 1.2 million bpd this year,
according to
the International
Energy Agency, to more than 96.5 million bpd. Even Chinese demand will grow, though at a slower pace
of 250,000 bpd this year, compared with 300,000 bpd in 2015, according to the Energy Aspects consultancy
... ... ...
What's unclear is what else will transpire between now and "eventually." There are more than
50 oil and gas producers generating negative EBITDA, even after slashing their capital spending.
... ... ...
The underappreciated story in the oil bust is what's happening at the banks. Lenders like
Wells Fargo
and
J.P. Morgan have made tens of
billions of dollars in secured loans to oil companies. Some, like
BOK Financial and
Regions Financial have
begun to increase loan-loss provisions. BOK, the parent company of Bank of Oklahoma, last
week announced fourth quarter credit losses of $22.5 million, compared with previous guidance of
no more than $8.5 million. BOK, chaired by Tulsa billionaire George Kaiser, has a reputation as a
very conservative lender. As The Ox (@adoxen) summed up on Twitter last week: "Canary in the
Oil Well. If $BOKF is having problems you can bet Every bank is pretty much now in 'holy-crap'
mode."
Meanwhile, the Dallas branch of the Federal Reserve
has reportedly urged banks to be patient, forget about marking loans to market and to not force
insolvent shale drillers into bankruptcy. Should we be worried that this kind of behavior portends
a second coming of the subprime mortgage collapse that led to the 2008 credit crunch? Back then the
reasoning was that the best way out of the housing collapse would be to bulldoze a couple million
houses. Today the best way out of the oil bust would be to put a match to half a billion barrels
of stockpiled oil.
Of course bankers don't think apocalypse 2.0 will come for them. When oil was
closer to $40 than $30 I spoke with two bankers who have overseen billions in loans to oil companies.
Both said there's nothing for bankers to gain by pushing oil companies into default because then
they'd have to run the companies until they could find someone to buy them. Banks won't capitulate,
said one. Balance sheets may be turning to rubble, but the banks will continue to work companies
as long as they are worth more alive than dead and they are honest. Almost all of them, he said,
are both. Three months from now might be a different story.
"... Paal Kibsgaard unleashes some very uncomfortable truthiness on his audience this morning during the earnings call, in which he revealed what likely was a wake up moment of truth for the US energy sector ..."
"... On land in both the U.S. and Canada, the weakening activity resulted in additional commercial pressure for all product lines, and in particular in pressure pumping, where pricing levels dropped further into unsustainable territory for both operating margins and cash flow . ..."
"... The burgeoning market conditions added to the pressure to the deep financial crisis throughout the oil and gas value chain and prompted operators to make further cuts to the already low EMP investment levels . ..."
"... For many of our customers, available cash and annual budgets were exhausted well before the halfway point for the fourth quarter, leading to unscheduled and abrupt activity cancellations, creating an operating environment that is increasingly complex to navigate, and where the traditional year-end product and multi-client site mix sales were largely muted. ..."
"... Oddly enough, I have been saying the same for months. Doing the math on fracking is not hard. What has kept the wells pumping and drills drilling was the large Hedge that many frackers had put in place, those have all run their course now. So reality sets in. Price per barrel versus cost of production. ..."
"... I mean, everyone knows Fracking was on the high cost end of the production cost curve world wide. Saudi pumps at 1/10th the cost or less, same for Russia, same for Iran. ..."
"... The books of frackers are not magical, grade school math can do those numbers, and my grade school math said they were screwed more than 6 months ago, as all my posts have said. ..."
"... Everybody is expecting events to follow their normal course in a peacetime economy. What part of economic warfare dont you understand ? The rules are different in war, very different. Your shorts will be rammed up your butt crack if you gamble by peacetime rules.. ..."
"... Price per barrel versus cost of production. I dont think that is the equation - it is cost of production plus interest payments to banks and where there are cross default provisions in the Bank Indenture Agreement that will dictate whether interest is paid on the Bonds no cross default - no payment on the bonds will be made - ALL CASH Flow will go to the banks -- the minute the interest isnt paid to the banks they have major reclassification problem beyond normal metrics / ratios default in the loan agreement ..."
For many of our customers, available cash and annual budgets were exhausted well before the
halfway point for the fourth quarter ... as pricing levels for frackers has dropped into unsustainable
territory .
Kibsgaard started by explaining why his firm has unveiled the massive layoffs and cost cuts:
we have faced the most severe industry downturn in 30 years
Then explained that this situation is unsustainable for American frackers...
On land in both the U.S. and Canada, the weakening activity resulted in additional commercial
pressure for all product lines, and in particular in pressure pumping, where pricing levels dropped
further into unsustainable territory for both operating margins and cash flow .
Which means, the pain has already started...
The burgeoning market conditions added to the pressure to the deep financial crisis throughout
the oil and gas value chain and prompted operators to make further cuts to the already low EMP
investment levels .
For many of our customers, available cash and annual budgets were exhausted well before
the halfway point for the fourth quarter, leading to unscheduled and abrupt activity cancellations,
creating an operating environment that is increasingly complex to navigate, and where the traditional
year-end product and multi-client site mix sales were largely muted.
While not ready to call a bottom in the oil market for this year, Kibsgaard said he didn't think
2017 would be worse ... but then again he said that at the start of 2015 too?
"as pricing levels for frackers has dropped into unsustainable territory ."
Oddly enough, I have been saying the same for months. Doing the math on fracking is not
hard. What has kept the wells pumping and drills drilling was the large Hedge that many frackers
had put in place, those have all run their course now. So reality sets in. Price per barrel versus
cost of production.
I mean, everyone knows Fracking was on the high cost end of the production cost curve world
wide. Saudi pumps at 1/10th the cost or less, same for Russia, same for Iran.
I think fracking fit the political aspirations of most Americans, thus they clung to it as
almost a magical dream that could not burst. But if you are a high cost producer in a low price
market, you are gonna be in trouble.
The books of frackers are not magical, grade school math can do those numbers, and my grade
school math said they were screwed more than 6 months ago, as all my posts have said.
One fellow tore me a new ass hole, over his claim that cost reductions in the fracking process
would cover the lower prices. I think it his his ass hole that is now dual, not mine!
If someone told you 2 months ago that oil would be at $30 on Jan 22 and the market would be
up 200 points on the news, you would have told them to take their meds.
If a bank doesn't call a loan in the forest, will anybody hear it ?
Everybody is expecting events to follow their normal course in a peacetime economy. What
part of "economic warfare" don't you understand ? The rules are different in war, very different.
Your shorts will be rammed up your butt crack if you gamble by peacetime rules..
"Price per barrel versus cost of production." I don't think that is the equation - it is
cost of production plus interest payments to banks and where there are cross default provisions
in the Bank Indenture Agreement that will dictate whether interest is paid on the Bonds no cross
default - no payment on the bonds will be made - ALL CASH Flow will go to the banks -- the minute
the interest isn't paid to the banks they have major reclassification problem beyond normal metrics
/ ratios default in the loan agreement
At the time it was called Fractech. A wholly owned Texas family company. Today it is called
FTS, Intl. A British-Chinese conglomerate. Last I checked, its largest shareholder was Temasek
(Singapore). It was part of Chesapeake, but I think that has been sold off. Most energy companies,
with probably the exceptions of Halliburton and Baker Hughes are British-Chinese conglomerates.
Schlumberger has always been a European company (France), but with heavy presence in America since
inception. My Alma Mater sits today on a former Schlumberger R&D and regional HQ in Austin, TX.
That property went for a mint, that included a wildlife preserve. The existing structures still
used by the school, are quite impressive. Practically one big sprawling atrium.
It was stupid money back then. I was an e-tech. Which meant I did anything on the pad from
changing light bulbs to programming the satellite dish. But most of time you found yourself trouble-shooting
the electronics on the pumpers and blenders. Replacing transducers/cables and whatnot. I was making
base of $17.25 / hr. But would clock in anywhere between 60 to 120 hours per week with overtime
(time and half). Plus per diem. So roughly you could realize 90k per year. I only worked the summer,
at $7500 per month gross.
I guess price per barrel back then was $50+ avg. At prices approaching $10 per barrel, fracking
has to just shut down completely. The more you frack/drill, the more production going into existing
supply. There is more supply than demand world wide. And, Iran is not fully online. Russia could
still add more if they choose. It is just like shipping. Shipping companies are staying in port,
because once their ships leave port with goods, they lose money. So, to not lose money, the ships
stay in port.
How is this fixed? As an American, I can only speak towards the American segment of the equation.
At some point, and hopefully sometime very soon, as Bill Holter and Jim Sincalir and others agreeing
with them have opined, everything will simply have to shut down and reset. Or, restart and/or
regroup. Once that happens, America cannot go back to the global economy. It must isolate itself
for a time. How long? That depends on many variables. It has to reboot its own domestic industry.
That means shutting down every else (American owned) abroad. Including especially the military
bases.
There are plans in place. If implemented quickly, restoration can be achieved in a decade or
less. Dramatic and positive changes can be realized in as little as one year or so. These plans
have been in conception since the winter of 1980 via a very select [Presidential] task force.
All but one of the original members of this TF has passed away. The one remaining today was the
most key member. I will let him speak from here on ..
I finally caved and filled up my 4K gallons of on-farm diesel this morning for $ 1.21/gallon.
dyed off road fuel. i was hoping for sub $ 2.00, but I think there will soon be a full court press
to ramp the oil back to the mid 40's...don't discount the possibility of a major refinery glitch
or some fucking raghead CIA ops taking down a refinery or major pipeline. I live in So IL...and
am in the LIttle Egypt basin....fucking layoffs here are astounding....everything has come to
a halt. A major fracking operation in our counties has disappeared....thousands of acres leased
for near $ 400.00/acre....someone has lost some serious money in that investment scam. Shit is
getting real on the ground....don't let these pumped markets skew your views of reality.....it's
ugly....and we're just getting started on this party.
"... I agree it will be shorter this time, somewhere between your guess (2017 process start to rise?) and mine (oil prices start to rise by third quarter of 2016). Definitely agree that nobody knows. ..."
"... I do not think oil supply will be adequate at $40 to $50 per barrel until 2020, US output would decrease by 2 Mb/d or more, Canada would also decrease by o,5 Mb/d and I doubt demand will not grow over the next 5 years, I doubt OPEC will be able to increase output enough to make up for declines in non-OPEC output at those prices. What are you assuming for World real GDP growth rates with oil prices remaining at that level? ..."
"... My guess is that production will be at least 5% less than average production in 2015 before we see WTI at $80. I would also guess is that the longer it takes for production to fall, the lower production will be when when prices finally start to rise. In other words a quick decrease in production would lead to higher prices sooner and at a higher production point. ..."
"... I dont think production has to fall that much, probably 1% would do it, demand will continue to grow so even flat output would eventually bring the market back into balance. I agree a quicker decline in output will bring prices back up more quickly. Our estimates of both supply and demand are not very good so it is all very much a black box. If most of the oil price forecasts are correct, I expect the supply forecasts will be too high and the demand forecasts may be too low, of course that will make the price forecasts too low as well. ..."
Comparing two long oil price cycles: 1970-1998 and 1999-…..
Are we in the beginning of a multi-year low oil price phase (like in 1986-1998)?
I think this time it will be much shorter, but who knows for sure ….
I agree it will be shorter this time, somewhere between your guess (2017 process start to rise?)
and mine (oil prices start to rise by third quarter of 2016). Definitely agree that nobody knows.
I'm guessing it'll be a minimum of 5 years because I think the Saudis have the ability to keep
prices down that long. And because I think their power to do so gets stronger every year as renewables
take market share. And because I think Iran's government is smart enough to hold off on really
heavy overseas sales until the price goes back up a bit - so rather than forcing prices down to
$10/bbl, they will keep prices at $30 or $40 for longer. So I'm betting 2020 or later.
I do not think oil supply will be adequate at $40 to $50 per barrel until 2020, US output would
decrease by 2 Mb/d or more, Canada would also decrease by o,5 Mb/d and I doubt demand will not
grow over the next 5 years, I doubt OPEC will be able to increase output enough to make up for
declines in non-OPEC output at those prices. What are you assuming for World real GDP growth rates
with oil prices remaining at that level?
We would need World real GDP to be under 1% per year
over the next 5 years to make your price forecast reasonable, in my opinion. So in a Petro scenario,
possibly we get $40 to $50/b or possibly $10/b would be more reasonable in Petro's view (which
is pretty nebulous) in 2020. I find such scenarios to be low probability (1% or less imo).
The question I have is what will production be when prices start to rise. Will production be
like today, 2% below today's production, 5% below today's production? What will production be the
next time we have WTI at $80?
My guess is that production will be at least 5% less than average production in 2015 before
we see WTI at $80. I would also guess is that the longer it takes for production to fall, the
lower production will be when when prices finally start to rise. In other words a quick decrease
in production would lead to higher prices sooner and at a higher production point.
I don't think production has to fall that much, probably 1% would do it, demand will continue
to grow so even flat output would eventually bring the market back into balance. I agree a quicker
decline in output will bring prices back up more quickly. Our estimates of both supply and demand
are not very good so it is all very much a black box. If most of the oil price forecasts are correct,
I expect the supply forecasts will be too high and the demand forecasts may be too low, of course
that will make the price forecasts too low as well.
"... Congress held hearings amid a sense the statistics and forecasts prepared by oil and gas producers and the U.S. Department of the Interior had been either inaccurate or deliberately manipulated. ..."
"... It is all well and good for Exxon and other firms to say well, we have been providing the statistics and the figures. The trouble is there have been no independent statistics, one congressman complained during a hearing in 1974. ..."
"... The EIA and IEA, statistics twins, have improved the comprehensiveness, quality and availability of data on the oil market significantly ( IEA: The First 20 Years, volume 2, Scott, 1994). ..."
"... But information on international markets remains much less comprehensive and accurate, mostly as a result of data collection problems in emerging markets and the deliberate secrecy of the oil producers. ..."
"... And data collection and forecasting can still generate controversy when analysts believe the agencies have made errors affecting market views of the supply/demand/stocks balance and hence prices. ..."
"... The longer the IEA arrogantly refuses to admit that its supply and demand analysis has some flaws, and the longer the agency holds to a belief that massive amounts of petroleum are still hiding somewhere, the greater the risk becomes that oil markets might crash again on another perception of oversupply. ..."
"... Even worse, this misguided information could accidentally create a situation where oil supply falls too much and a bona fide physical shortage is created, he grumbled. ..."
"... Simmons claimed the IEA had over-estimated the amount of oil being exported from OPEC countries; the missing barrels never existed ( There Are No Missing Barrels: Our Oil Markets Are Tightening 1999). ..."
"... Statistics can be surprisingly political. ..."
"... A notional 1 billion barrels was added to global inventories over 2014/15 and our latest supply and demand balances suggest builds will persist with up to 285 million barrels expected to be added to stocks over the course of 2016, the IEA wrote in its latest monthly assessment. ..."
"... The problem is that only part of the stock build is visible. Some analysts, particularly those with a bullish view on oil prices, are once again accusing the IEA of getting its estimates wrong. ..."
"... This time, the view seems to be the IEA is underestimating demand. Consumption is notoriously difficult to estimate and forecast even in the advanced economies; in most emerging markets it involves a large amount of guesswork because their domestic reporting and statistical systems are so weak. ..."
"... Based on past performance, it is possible the IEA underestimated oil consumption in 2015, and is forecasting too little oil demand in 2016. ..."
"No other industry begins to offer the data problems that are presented by petroleum," wrote John
Blair, a former U.S. government official exactly 40 years ago ("The Control of Oil", Blair, 1976).
The production of basic statistics and forecasts about oil reserves, production, consumption and
stocks ought to be a matter of routine.
But it has at times sparked fierce debate and even political controversy when statisticians and
forecasters have been accused of making significant errors ("The Politics of Mistrust," Wildavsky
and Tenenbaum, 1981).
Doubts about the reliability of energy statistics were a major part of the "energy crisis" that
erupted during the 1970s.
As late as 1968, the United States reportedly had 4 million barrels per day of spare production
capacity and thousands of wells across Texas and Louisiana were being operated for fewer than 10
days per month.
But by March 1972, spare capacity had dropped to zero, every well was at maximum production, domestic
output was falling, and politicians began to speak of an energy crisis.
The oil embargo, announced in October 1973, intensified the sense that something had gone badly
wrong, leaving the country unprepared. ("Energy Policy in America since 1945," Vietor, 1984).
Politicians and the media blamed a conspiracy between domestic producers and the Organization
of the Petroleum Exporting Countries for engineering the crisis to drive up prices and profits.
Congress held hearings amid a sense the statistics and forecasts prepared by oil and gas producers
and the U.S. Department of the Interior had been either inaccurate or deliberately manipulated.
One outcome of the crisis was the creation of a new U.S. Department of Energy and within it a
new Energy Information Administration (EIA) in 1977 to produce more accurate and independent data.
Another was the creation of the International Energy Agency (IEA) in 1974 to gather better statistics
and bring greater transparency to the international energy markets.
Prior to the energy crisis, most data and forecasters were confidential and under the control
of oil and gas producers themselves.
"It is all well and good for Exxon and other firms to say 'well, we have been providing the
statistics and the figures.' The trouble is there have been no independent statistics," one congressman
complained during a hearing in 1974.
After the energy crisis, data collection and forecasting would be led by impartial civil servants
at national and international levels.
The EIA and IEA, statistics twins, have improved the comprehensiveness, quality and availability
of data on the oil market significantly ("IEA: The First 20 Years," volume 2, Scott, 1994).
Improvements in data collection and forecasting in the United States, led by the EIA, have largely
quelled controversy about domestic oil production, consumption and stocks.
But information on international markets remains much less comprehensive and accurate, mostly
as a result of data collection problems in emerging markets and the deliberate secrecy of the oil
producers.
And data collection and forecasting can still generate controversy when analysts believe the
agencies have made errors affecting market views of the supply/demand/stocks balance and hence prices.
MISSING BARRELS IN 1998/1999
The most notorious controversy in the post-crisis era erupted in the late 1990s when the IEA data
showed a large discrepancy between the amount of oil reportedly produced but not reported in the
consumption numbers or visible in the recorded stocks.
"It is just over a year since the saga of the 'missing barrels' began," the IEA wrote in June
1999. "Oil prices tumbled as a result of the Asian financial crisis, a mild winter, increasing production
from Iraq and an OPEC quota increase in November 1997."
The agency went on to wonder: "Millions of barrels of unneeded oil were placed in storage around
the world; many of them have yet to reappear ... Did the barrels reported as produced, but that have
not shown up in OECD stocks, ever really exist?"
Fast-forward six months and the agency was confident it had found the answer. Its December 1999
monthly report entitled "an un-fond farewell to the missing barrels" explained:
"During the first half of 1998 a large amount of the excess supply in the oil market was unaccounted
for ... There was strong disagreement at the time as to whether these 'missing barrels' were the
result of statistical errors, or whether they represented a large increase in oil stored in non-OECD
areas.
"Almost two years later ... the weight of evidence is that the missing barrels did exist and
that they have now returned to the market."
But the missing barrels in the IEA's statistical system brought a withering response from some
analysts, notably Matthew Simmons, who wrote a blistering critique faulting the agency.
"The longer the IEA arrogantly refuses to admit that its supply and demand analysis has
some flaws, and the longer the agency holds to a belief that massive amounts of petroleum are
still hiding somewhere, the greater the risk becomes that oil markets might crash again on another
perception of oversupply."
"Even worse, this misguided information could accidentally create a situation where oil
supply falls too much and a bona fide physical shortage is created," he grumbled.
Simmons claimed the IEA had over-estimated the amount of oil being exported from OPEC countries;
the missing barrels never existed ("There Are No Missing Barrels: Our Oil Markets Are Tightening"
1999).
Statistics can be surprisingly political.
NOTIONAL BARRELS IN 2015/2016
The missing barrels controversy is now stirring again because of the huge stock builds implied
by the IEA's estimates for crude supply and demand between 2014 and 2016.
"A notional 1 billion barrels was added to global inventories over 2014/15 and our latest
supply and demand balances suggest builds will persist with up to 285 million barrels expected
to be added to stocks over the course of 2016," the IEA wrote in its latest monthly assessment.
In the fourth quarter of 2015, global oil stocks swelled by a notional 1.8 million barrels per
day, according to the IEA ("Oil Market Report", January 2016).
The problem is that only part of the stock build is visible. Some analysts, particularly those
with a bullish view on oil prices, are once again accusing the IEA of getting its estimates wrong.
This time, the view seems to be the IEA is underestimating demand. Consumption is notoriously
difficult to estimate and forecast even in the advanced economies; in most emerging markets it involves
a large amount of guesswork because their domestic reporting and statistical systems are so weak.
In the statistical framework, non-OPEC production and OECD stocks are generally the easiest to
track, while OPEC output, emerging market demand and non-OECD stocks are the source of most of the
errors.
The IEA carefully prepares forecasts for oil consumption and supply for the year ahead, and estimates
of actual outturn, which are revised for several years afterward.
Between 1994 and 2015, the forecasting error between the initial forecast and the final estimate
for non-OPEC supply was zero, with a standard deviation of just 90,000 barrels per day (
tmsnrt.rs/1S9kD8l ).
The implication is that the IEA has been able to predict non-OPEC supply with a high degree of
accuracy and with no systematic bias in its forecasts.
The forecasting error for global consumption was much larger, at an average of 400,000 barrels
per day, with a standard deviation of as much as 1.1 million barrels per day (
tmsnrt.rs/1S9kIZz ).
Oil demand has proved much trickier to forecast and measure accurately, mostly because its large
cyclical component and the problems posed by emerging markets, where demand has been growing rapidly
but is measured badly.
The IEA has already raised oil consumption in 2015 from a forecast 93.3 million barrels at the
time of the January 2015 Oil Market Report to an estimated 94.5 million barrels in the January 2016
report.
Two things follow from this analysis, one more bullish for the outlook for oil prices, and one
more bearish.
Based on past performance, it is possible the IEA underestimated oil consumption in 2015,
and is forecasting too little oil demand in 2016.
If that proves to be true, the degree of excess supply, and the build up in stocks, both in 2015
and 2016, might be somewhat smaller than the IEA has estimated and predicted, which would be mildly
bullish for prices.
But if the errors are mostly concentrated on the demand side, then anything which causes economic
growth and fuel demand to slow in 2016 would be even more bearish.
"... I keep reading paragraphs in various articles that point out how easy it will be for the drillers to turn it on if prices "spike" over $40. I know that most here would agree that is not going to happen. The money will be a killer. And, we have all seen this movie before, only in a different industry. ..."
"... If oil prices rise to $60 by year end, we all know that the drillers will be clamoring for money to let them gear back up. The drillers will throw out rosy price forecasts. However, human nature will put an end to that. The employees at the banks who are in charge of establishing "price decks" for their bank will probably raise their deck to something like $40. ..."
"... They are not going to have their job threatened by another plunge in prices. ..."
"... In my opinion, absent some sort of energy emergency (e.g., a real war), it will be 3 or 4 years before the banks will have relatively the same price expectations that the drillers will have. ..."
I keep reading paragraphs in various articles that point out how easy it will be for the drillers
to turn it on if prices "spike" over $40. I know that most here would agree that is not going
to happen. The money will be a killer. And, we have all seen this movie before, only in a different
industry.
When the housing bubble burst, for at least the next 4 years, I read dozens of stories
about how people could not buy a house because it would not appraise for the price that both the
seller and buyer had agreed to. Appraisers were petrified of sticking their necks out. No way
were they going to go along with a "V" shaped housing price recovery.
If oil prices rise to $60 by year end, we all know that the drillers will be clamoring for
money to let them gear back up. The drillers will throw out rosy price forecasts. However, human
nature will put an end to that. The employees at the banks who are in charge of establishing "price
decks" for their bank will probably raise their deck to something like $40.
They are not going to have their job threatened by another plunge in prices. And, there will
not be one single bank that will want to become known as the "go to bank" because they have a
higher price deck than the other banks. In my opinion, absent some sort of energy emergency (e.g.,
a real war), it will be 3 or 4 years before the banks will have relatively the same price expectations
that the drillers will have.
RIYADH, Saudi Arabia - Until about four months ago, Prince Mohammed bin Salman, 29, was just
another Saudi royal who dabbled in stocks and real estate.
... ... ...
The sweeping changes have thrust the young prince into power at a time when Saudi Arabia is
locked in a series of escalating conflicts aimed at defending its vision of the regional order
and holding back its chief rival, Iran. The kingdom is financially sustaining the rulers of Egypt
and Jordan and propping up the Sunni monarchy in neighboring Bahrain against a revolt by its
Shiite majority. It is also arming rebels in Syria against the Iranian-backed president, fighting
in the United States-led air campaign over Iraq and leading its own air assault on an
Iranian-backed faction in Yemen. And it is ramping up its military spending even as plunging oil
prices and growing domestic expenditures have reduced its financial reserves by $50 billion over
the last six months, to less than $700 billion.
... ... ...
... some Western diplomats, speaking on the condition of anonymity for fear of alienating the
prince and the king, say they are worried about the growing influence of the prince, with one
even calling him "rash" and "impulsive." And in interviews, at least two other princes in the
main line of the royal family made it clear that some older members of the clan have doubts as
well. Both questioned the costs and benefits of the Yemen campaign that Prince Mohammed has
spearheaded.
... ... ...
... scholars say the accumulation of so much responsibility in the hands of one branch of the
family - to say nothing of one young prince - breaks with a system of intrafamily power sharing
put in place at the founding of the modern Saudi state by King Abdul Aziz al Saud eight decades
ago. It ended decades of sometimes violent infighting and has helped preserve family unity ever
since.
... .... ....
He removed the state oil company from the oil ministry and put it under Prince Mohammed, who
was also handed control of a newly created economic policy council and the Defense Ministry.
(King Salman had been defense minister.) Prince Mohammed is also expected to take over the
National Guard from his cousin Prince Mutaib bin Abdullah, according to an aide to Prince Mutaib
and Western diplomats. The change would consolidate both forces under the Defense Ministry
but fundamentally alter the balance of power in the family.
Prince Mohammed's three older half brothers - sons of their father's first wife, Sultana Bint
Turki Al Sudairi, who died in 2011 - all have distinguished résumés and were once considered
contenders for top government roles.
Prince Sultan bin Salman al Saud, 58, a former colonel in the Saudi Air Force, is a former
astronaut who flew on the Space Shuttle Discovery in 1985 and now heads a tourism and antiquities
commission. Prince Abdulaziz bin Salman, believed to be about 55, is a deputy minister of oil who
has championed efforts to modernize the industry. Prince Faisal bin Salman, 44, holds a Ph.D. in
political science from Oxford, was a research fellow at Georgetown, founded one of Saudi Arabia's
largest investment firms, Jadwa, and serves as the governor of Medina.
Prince Mohammed, in contrast, holds a bachelor's degree in law from King Saud University in
Riyadh and has never studied outside the kingdom.
Prince Mohammed, however, is the firstborn son of the King Salman's third and most recent
wife, Fahda bint Falah bin Sultan, who worked hard to promote him as his father's successor,
according to Western diplomats who know the family, several family members and associates who
have worked for the family.
... ... ...
An official biography says vaguely that he was "self-employed" and "earned commercial
experience founding several businesses and investments." Businessmen in Riyadh say he was known
for his active trading in stocks and real estate.
"... There are well shut-ins and there will be more, but these are mostly wells with very low daily output, especially stripper wells in the U.S. ..."
"... Also note that shutting current oil production may prove more costly than producing at a loss due to high decommissioning costs and potential damage to the reservoirs. ..."
"... Investments also will not drop to zero levels even at $25-30, as there are a lot of projects at final stages of development, which will be completed with relatively modest additional investments and will be generating cash. ..."
"... http://www.cnbc.com/2015/01/12/ The article above suggests about 1.5 Mb/d of output becomes unprofitable at $40/b or less. http://www.reuters.com/article/us-oil-prices-kemp-idUSKCN0QI29320150814 The article above suggests also that under $40/b will be problematic for sustaining output. ..."
"... World liquids output will be lower than the EIA forecast for World liquids output. ..."
"... Today about 5 Mb/d of World output is from very flexible LTO projects which are pretty near the breaking point at under $30/b. If there is turmoil in the LTO plays due to lack of funding we could see a 20% drop in LTO output (1 Mb/d). ..."
"... possibly a 2 Mb/d reduction in output. ..."
"... This might be offset by a 600 kb/d increase in Iranian output, but we would be left with a 1.4 Mb/d decrease in World output. Possibly increases in the Gulf of Mexico and North Sea offset these declines partially and we are left with only a 500 kb/d decline in World output. ..."
"... In many cases the decision is made to keep producing at a loss because shutting in causes even bigger losses. What we do is avoid work overs, pump changes, or any expenses we can cut. In shoddy operations maintenance goes to hell. Some contractors are called in and told to share the pain or else. And all of this is dictated by price forecasts. Evidently producing at a loss cant go on forever. ..."
"... Thus say you think prices will stay at $25 for a year, but will increase to $50 in 2017, then you produce even if this generates a $5 loss. You do need to have the $5 to stay alive. I look at it as an investment in the future. And I bet thats the way most operators are looking at this current debacle. ..."
Euan, when we use empirical evidence from previous crashes we do need to factor in the real increase
in the cost to produce the marginal barrels. Since 1998 those marginal barrels are much more expensive.
I've also learned that oil prices don't necessarily drive all producers, they seem to be driven
by oil price forecasts. Thus the key is to see producers think that oil prices next month will
be below production cost enough to make shut in worthwhile (operators have fixed costs which don't
disappear simply because the wells were shut in).
But prices have dropped enough that shutting in for a couple of months may be worthwhile. Plus
we have Venezuela's looming problem. As long as Iran doesn't start tossing barrels into the market
we may see enough supply reductions over the next four weeks for the oil price to bottom out.
Maybe.
WTI down 7% today to $26.76. Dennis tried to make the cost of marginal barrel to me which in the
circumstances I just don't get. Its relevant when prices are rising and companies are evaluating
prospects and investments. I just don't see the relevance on the way down. Companies will sell
all they can for whatever they can get because xbbls*$20 is better than 0bbls*$20.
Oil is caught in an over-supply broad market crash vortex.
Eventually companies realize that when you are in a hole, the first rule is to stop digging.
In other words, cost matters because at a higher cost of production (say $50/b) you are losing
$25/b on every barrel you sell at $25/b. If the cost of production is $30/b, you are only losing
$5/b on each barrel produced.
The more money you lose, the less likely you are to invest more, this eventually reduces supply
due to depletion.
So yes, the cost of the marginal barrel matters. If it did not, oil would have a price of zero.
The cost of the marginal barrel is relevant only to the cost of new production. Operating costs
are the only limitation to production from existing wells. As Euan notes, oil produced at prices
above operating costs produces revenue. Shut in wells do not. This means that existing wells can
produce oil at prices far lower than those needed to justify drilling new wells. When the world
needs new oil wells, the price will rise enough to allow them to be drilled at a profit. That
price may be very high indeed.
Yes you are correct that producing wells might not get shut in, although some older wells may
not be profitable to maintain at low prices and will be shut in and producing oil fields decline
in output at an average rate of 6.5% per year if no new wells are drilled .
My point is this, very few new wells will be completed at very low oil prices and oil supply
will decrease. That is why cost matters, it affects investment in new wells.
As I said before, if the cost to produce oil is zero, then the price will be zero, otherwise
it will be a positive number which will approach the marginal cost in the long run.
The higher the cost of producing the marginal barrel, the more money one loses producing it
at any given price below the cost of production. The bigger the monetary loss the less likely
it is that more wells will be drilled.
You have a rather simplistic view on the interaction of prices, costs, investments and production.
At $35-40/bbl, the vast majority of the current global oil production remains profitable.
At $25-30/bbl, there are indeed fields in various parts of the world, where operating costs are
above those levels. But companies do not take decisions based on daily or weekly fluctuations
in oil prices.
Only after several months of oil price staying below $30/bbl operators may decide
to shut in non-economic wells. Despite headlines in the MSM with projection of $25, $20, $15 and
even $10 per barrel, none of institutions such as IEA, EIA and OPEC, investment banks, energy
consultancies and individual experts is projecting annual oil price below $30. The lowest existing
forecast is from J.P. Morgan at $31.5/bbl. The majority is in the range between $37 and $50.
Goldman
Sachs which was mentioned as forecasting $20 oil, is actually projecting $40 by mid-year as the
base case scenario. They say that under certain conditions prices may drop to $20, but only for
a short term. Ed Morse from Citigroup and Daniel Yergin from IHS have also recently said that
current prices are unsustainable and that there will be an upward correction in the second half
of the year. Not to $75, as you are or were projecting, but to $40-50, which would support all
of the current production.
There are well shut-ins and there will be more, but these are mostly wells with very low daily
output, especially stripper wells in the U.S. And that will not have significant impact on global
oil production. Also note that shutting current oil production may prove more costly than producing
at a loss due to high decommissioning costs and potential damage to the reservoirs.
Investments also will not drop to zero levels even at $25-30, as there are a lot of projects
at final stages of development, which will be completed with relatively modest additional investments
and will be generating cash.
As I have said earlier, it is important to take into account a significant cost deflation,
which lowers breakeven prices for new projects.
We have already seen this in the 80-s. In 1980 it was estimated that the most costly new projects,
such as the North Sea and Alaska, had breakeven costs at $25-30 ($70-85 in today's money). But
as prices started to decline from 1981 and dropped to $10-12 lows in summer of 1986 ($23-27 in
today's dollars), all of the new projects in the North Sea, Alaska, Canada, Mexico (Cantarel)
continued to increase output for at least 2-3 year more. This was largely due to declining costs.
Non-OPEC production started to decline only by the end of the 80-s, after several years of low
oil prices.
Non-OPEC production (mb/d) vs. oil price ($/bbl), 1970-1990
I believe that you may think that my argument is that no new wells will be drilled. It is not,
my point is that if Euan Mearns forecast for oil price is correct, oil investment is likely to
be lower.
Mearns oil price forecast is that Brent remains under $37/b until Dec 2016 with a bottom of
around $15/b and oil prices remaining under $20/b at mid year, he does not give an estimate for
an average oil price for the year, but it would be somewhere between $20/b and $37/b [maybe $29/b
(2014$) for 2016.]
Under the scenario above I would expect some wells might be temporarily abandoned because the
oil price might not cover OPEX, I would also expect that investment in new wells would be lower
than at higher oil prices, rather than zero .
Thank you for pointing out how simple minded I am.
:-)
(Although in fact I knew all that, and I agree that it is quite unlikely to be the case that
all investment in new wells will be discontinued.)
I think it equally unlikely that there will be no change in oil investment if oil prices
remain under $40/b for the first 6 months of 2016 (average oil price over those 6 months), but
I would never accuse you of such simplistic thinking.
;-)
On falling costs. Do you think the cost of the marginal barrel has fallen from about $70/b
in 2012 to $40/b in 2016 (nominal dollars)?
At one point I was estimating $75/b by years end, but I have been convinced that may be too
high. I think $50/b for an average 2016 oil price with a December level of about $65/b or higher
is reasonable, I think at average prices matching the EIA's short term outlook. World liquids output
will be lower than the EIA forecast for World liquids output.
Your powerful mind brilliantly covers a broad range of issues, many of which are too complicated
for me given my limited intellectual capabilities. But in some cases we have to consider so many
industry-specific details that a broader top down approach doesn't work properly.
You are the brilliant one, and I appreciate what you have taught me about the oil industry
which you understand far better than I.
The top down approach I use is intended to be a rough approximation, I do not have access to
enough data or the time to put together a detailed bottom up analysis of the oil industry.
Not sure how well it would work, because the EIA, IEA, and OPEC already do this and somehow
they seem to create oil supply out of nowhere to fill the oil demand they expect to see. So I
rely on a combination of Hubbert linearization and USGS estimates along with guidance from people
in the know like Fernando, Doug, Ron, Shallow sand, and AlexS to create scenarios using Webhubbletelescope's
oil shock model.
I agree 100% with your analysis, except I am a little more pessimistic about oil supply at
$40-50 per barrel than you are and believe oil prices may be a little higher than you do.
In the end you will probably be correct, I have consistently underestimated how resilient the
LTO output would be and oil supply keeps surprising me on the upside.
Perhaps the EIA's AEO 2015 with C+C output of 99 Mb/d, will even be correct, but my guess is
that will be about 25 Mb/d higher than actual C+C output in 2040, the peak will be 85 Mb/d at
most between 2020 and 2030 (probably closer to 2021 if it is that high and closer to 2030 if the
peak is only 81 Mb/d.)
Do you have an estimate of URR for C+C, I assume you believe 3400 Gb(including 600 Gb of extra
heavy oil) is too low?
Another difference between today and in the 1985 to 1990 period is that the non-OPEC output
increases were primarily coming from various mega projects which were ramping up at the time.
Today about 5 Mb/d of World output is from very flexible LTO projects which are pretty near the
breaking point at under $30/b. If there is turmoil in the LTO plays due to lack of funding we
could see a 20% drop in LTO output (1 Mb/d).
Along with decreased output elsewhere in the World
as higher cost output is reduced (maybe 500 kb/d from US stripper wells and 500 kb/d from other
high cost areas throughout the World) for possibly a 2 Mb/d reduction in output.
This might be offset by a 600 kb/d increase in Iranian output, but we would be left with a 1.4
Mb/d decrease in World output. Possibly increases in the Gulf of Mexico and North Sea offset these
declines partially and we are left with only a 500 kb/d decline in World output.
My guess is that this could happen at $50/b for an average 2016 oil price, but at $40/b it
does not happen and decline is 1 Mb/d.
"Operating costs are the only limitation to production from existing wells."
This is true when the need for current cash income is overwhelming and most oil companies are
in that position these days.
But suppose you are making only five bucks on a barrel, in net cash, at say thirty five bucks
a barrel.
If the price goes to forty, you DOUBLE your net cash income.
Anybody who can AFFORD to shut in production ought to be doing so, unless I am a complete dunce.
No industry can run in the hole forever, not even the oil industry.
Oil will go up again.
So, the question is, who has money enough in the bank to cut back now, so as to make a substantially
larger profit, later on?
The Saudi's, and maybe a couple of their good tight buddies come to mind. Is there anybody
else big enough to matter?
The Russians have an authoritarian government that will remain in power if the Putin regime
were to decide to cut production.
Euan, I went through this in the 1985-86 crash. We had dozens of field operations, each of them
was studied carefully, and I learned a lot seeing what we did, as well as the results.
As I wrote, behavior is dictated by what we see and forecast. An operator who knows opex breakdown
can segregate it into "fixed" and variable. Even fixed isn't that fixed as we expand the time
horizon. So the analysis should look at options such as contract term changes, salary cuts, dividends
suspensions, and tax cuts (that's fairly common in some countries, where the government will cut
taxes to help people stayed employed).
Thus when we look at say, the $22 opex in a faja field in Venezuela, we have to factor in what's
the actual cost reduction from shutting in, how fast can further cuts be made by cancelling contracts,
laying off people, etc.
In many cases the decision is made to keep producing at a loss because shutting in causes even
bigger losses. What we do is avoid work overs, pump changes, or any expenses we can cut. In shoddy
operations maintenance goes to hell. Some contractors are called in and told to share the pain
or else. And all of this is dictated by price forecasts. Evidently producing at a loss can't go
on forever.
Thus say you think prices will stay at $25 for a year, but will increase to $50 in 2017, then
you produce even if this generates a $5 loss. You do need to have the $5 to stay alive. I look
at it as an investment in the future. And I bet that's the way most operators are looking at this
current debacle.
"Companies will sell all they can for whatever they can get because xbbls*$20 is better than 0bbls*$20."
When you are broke, this makes sense. You eat the seed corn, and burn the furniture, last thing
before you freeze and starve to death in a mid winter famine.
But my neighbors keep hay in the barn, and beans in the silo, and beef cows in the pasture,
for sale next year, to the extent they can, when prices crash this year.
The ones who make it long term are the ones with a barn full of hay, beans in the silo, and
a pasture full of cows when prices go back up.
I have never sold a single load of logs in a down market, except a couple of times the trees
were in the way, preventing me from using that particular spot of ground as a building site.
Unfortunately, apples don't store well, which is a primary reason I have recently been switching
to cows, although mostly retired.
"... My premise is that US (and perhaps global) refiners hit, late in 2014, the upper limit of the
volume of condensate that they could process, if they wanted to maintain their distillate and heavier
output–resulting in a build in condensate inventories, reflected as a year over year build of 100 million
barrels in US C+C (Crude + Condensate) inventories. ..."
"... in my opinion the US and (and perhaps globally) C+C inventory data are fundamentally flawed,
when it comes to actual crude oil inventory data. ..."
"... Note that (in 2015) 22% of US Lower 48 C+C production consists of condensate (45+ API gravity)
and note that about 40% of US Lower 48 C+C production exceeds the maximum API gravity for WTI crude
oil (42 API). ..."
"... Crude plus Condensate Inventory build have been higher because mainly of Condensate as EIA
is no longer properly distinguishing the difference? ..."
"... If that 100 Million number is true, we might see $100 oil this year I think. ..."
"... BTW the last two weeks saw some massive builds in "Blending components for gasoline" while
the market went wild because it looked like actual products were building. ..."
My premise is that US (and perhaps global) refiners hit, late in 2014, the upper limit
of the volume of condensate that they could process, if they wanted to maintain their distillate
and heavier output–resulting in a build in condensate inventories, reflected as a year over
year build of 100 million barrels in US C+C (Crude + Condensate) inventories.
Therefore, in my opinion the US and (and perhaps globally) C+C inventory data are fundamentally
flawed, when it comes to actual crude oil inventory data. The most common dividing line
between actual crude oil and condensate is 45 API gravity, although the distillate yield drops
off considerably just going from 39 API to 42 API gravity crude, and the upper limit for WTI
crude oil is 42 API. . . .
Note that (in 2015) 22% of US Lower 48 C+C production consists of condensate (45+ API
gravity) and note that about 40% of US Lower 48 C+C production exceeds the maximum API gravity
for WTI crude oil (42 API).
Just so I understand what you are saying: Crude plus Condensate Inventory build
have been higher because mainly of Condensate as EIA is no longer properly distinguishing the
difference?
If that 100 Million number is true, we might see $100 oil this year I think.
BTW the last two weeks saw some massive builds in "Blending components for gasoline" while
the market went wild because it looked like actual products were building.
"... I think KSA knew they were going to peak soon so they maxed out the infill drilling and dropped the price for a year or so. Its s psychological game. In the future they might threaten to raise production to psyche the market, and maybe they will briefly, but I think this is KSAs last kick at the can and they know it. Theyll decline fast IMHO as the infill drilling has resulted in a longer plateau with a little burst up at the end but the decline rates will be steep. ..."
"... FYI the ruling clan does not think in terms of national interest. They think of their own personal/clan interest. Once theyve squeezed the land dry theyll retire to southern France and leave the mess behind. ..."
"... Interesting seasonal patterns in Saudi Arabias oil consumption. Demand usually surges during the summer as large quantities of crude and petroleum products are burnt to meet the increases in electricity consumption for air conditioning. ..."
"... Lower seasonal demand in the later part of the year allowed Saudi Arabia to increase exports of crude and refined products. It reached record-high volume of 8.9 mb/d in November. ..."
Saudi is pumping as much as it can, trying to drive the rest of em out of business. So they can
have their one last hay day, before the wells start drying up. They want to make the most of next
decade. BUT they didn't expect prices to fall THIS much. So it's a big game of chicken now.
I tend to agree. I think KSA knew they were going to peak soon so they maxed out the infill
drilling and dropped the price for a year or so. It's s psychological game. In the future they
might threaten to raise production to psyche the market, and maybe they will briefly, but I think
this is KSA's last kick at the can and they know it. They'll decline fast IMHO as the infill drilling
has resulted in a longer plateau with a little burst up at the end but the decline rates will
be steep.
FYI the ruling clan does not think in terms of 'national interest'. They think of their
own personal/clan interest. Once they've squeezed the land dry they'll retire to southern France
and leave the mess behind.
There was a study published last year predicting the OPEC peak in 2028. I haven't read the paper
but perhaps some one with academic access to petroleum engineering journals could have a glance
at it and critique it.
Interesting seasonal patterns in Saudi Arabia's oil consumption. Demand usually surges during
the summer as large quantities of crude and petroleum products are burnt to meet the increases
in electricity consumption for air conditioning.
Lower seasonal demand in the later part of the year allowed Saudi Arabia to increase exports
of crude and refined products. It reached record-high volume of 8.9 mb/d in November.
from Bloomberg:
Saudi Oil Exports at Seven-Month High as Refineries Return
Saudi Arabia, the world's largest crude exporter, shipped the most oil in seven months in
November in a sign that overseas refineries were getting prepared to put plants back on line
after seasonal maintenance.
Saudi shipments rose to 7.72 million barrels a day, the highest since April, from 7.364
million in October, according to data on the website of the Joint Organisations Data Initiative
based in Riyadh.
"This is exactly what they've been doing for the last year and a bit, whenever there is
demand for their crude they will export," Amrita Sen, chief oil market analyst at Energy Aspects
Ltd. in London, said by phone.
Refineries are usually taken off line for repairs in September and October. Refined products
exports from Saudi Arabia rose in November, to 1.18 million barrels a day from 1.09 million,
according to JODI.
Saudi Arabia crude oil and refined product exports (mb/d)
source: JODI
"... Makes investors in oil question why they chose the agony. Makes smart, educated people stay away from upstream industry employment. ..."
"... All the people in industry I know are unanimous, my kid IS NOT going to do this for a living. Of course, you cannot make choices for them, but my teenagers are paying attention, dont say much, but recently have both commented without prompting that they think the price of gas, and thus oil, is made up. They both drive, cant understand how price goes from $3.75 to $1.50, especially given the tax component. ..."
"... Older one showed some interest, but not now. His comment, Not going to work in a job where I might get fired due to a bunch of Wall Street crooks. ..."
One strong up day, and another looking that way doesn't mean much, but what if we do get a
strong rally in 2016, after all these unfortunate people have been fired?
Amazing the price volatility we see if one looks at a chart from WW2 to present. Price barely
moved for years, now ridiculous volatility.
Makes investors in oil question why they chose the agony. Makes smart, educated people
stay away from upstream industry employment.
All the people in industry I know are unanimous, my kid IS NOT going to do this for a living.
Of course, you cannot make choices for them, but my teenagers are paying attention, don't say
much, but recently have both commented without prompting that they think the price of gas, and
thus oil, is made up. They both drive, can't understand how price goes from $3.75 to $1.50, especially
given the tax component.
Older one showed some interest, but not now. His comment, "Not going to work in a job where
I might get fired due to a bunch of Wall Street crooks."
Haven't told him many other industries likely to face the same problems ahead.
I also find the price volatility astonishing, in comparison with the estimated oversupply.
As I have mentioned before, I also have the impression that a large part of this action is caused
by market participants who are neither producers nor consumers of oil.
If I would be in the oil producing business, I would base my plans solely on hedged production,
several years out. You might miss out on the spikes, but a sure gain is better than the risk of
losing all. You don't want to find yourself at the mercy of traders who just sold a lot of virtual
oil, and are trying to buy it back on the cheap.
"... Besides having 2.5 times the population of Saudi, I am of the impression
that they have a much more western style economy. That is, they probably have a
decent manufacturing base in order to construct nuclear reactors, guided missiles,
ships, most of their own military weapons, roads, cars, etc. and to support a decent
sized army of their own. Are they heavy into wind, solar and battery power?? ..."
"... Clueless, if by the end of the year Iran is producing an extra nickel,
it wont offset the decline in fields being erased off the map at $65 per barrel.
..."
"... Today we have this oil price conflict that is shaping the future of OPEC
in 3-5 years. It is conflict for majority control of the cheapest exporting oil
within the OPEC. ..."
"... Iran with its young and fast growing population faces internal consumption
problem similar to what Malaysia have and might well stop to be the major oil exporter
in a couple of decades. ..."
"... OPEC to a certain extent is gone after Saudis decision to lift quote regime.
It remains some kind of umbrella organization, but it is no longer a cartel - they
are unable to act as a single unit in their own economic interests. ..."
"... My impression is Saudis are dumping their oil on the market due to some
non-economic considerations. Financially they are committing a suicide depleting
their foreign reserves and winning very little (if at all) in terms of market share
while their fields are aging fast. Essentially what they are doing is stealing oil
from future generations making the mere existence of the country problematic in
50 years or so. The diversification of their economy is very difficult to implement.
Politically they also alienated a lot of countries who might be able to help them.
Especially during the rule of a 30 years old deputy crown prince Mohammad bin Salman
..."
If by the end of this year Iran is producing 500,000 bbl/day more oil, I
am curious how much of that will be available for "net export?" By net,
I mean using Jeffrey's methods. That is, I believe that a lot of Iran's
current oil production is exported and then returned to them as refined
product.
I would note that Iran's population is currently over 80 million people,
about 10 million more than in 2005. I think that the least amount that anyone
has for use internally by Saudi Arabia is 3 million bbls/day, and that is
with a population of only 32 million. So, if Iran is going to invest the
$100+ billion, which was just released to them, on infrastructure projects,
I kind of have a gut feel that they might themselves use most of their own
production. But, I am puzzled even by current figures. I do not understand
how Iran can net export oil with current production of around 2.8 million
bbl/day.
Besides having 2.5 times the population of Saudi, I am of the impression
that they have a much more western style economy. That is, they probably
have a decent manufacturing base in order to construct nuclear reactors,
guided missiles, ships, most of their own military weapons, roads, cars,
etc. and to support a decent sized army of their own. Are they heavy into
wind, solar and battery power??
Clueless, if by the end of the year Iran is producing an extra nickel,
it won't offset the decline in fields being erased off the map at $65 per
barrel.
It is not about how much Iran can export now, but 3-5-7 years from now.
Today we have this oil price conflict that is shaping the future of
OPEC in 3-5 years. It is conflict for majority control of the cheapest exporting
oil within the OPEC.
Which group of countries have the majority control of that oil will have
a controlling oil policy within the OPEC and outside of OPEC.
Iran with its young and fast growing population faces internal consumption
problem similar to what Malaysia have and might well stop to be the major
oil exporter in a couple of decades.
So your statement "It is not about how much Iran can export now, but
3-5-7 years from now" should by slightly amended by the fact of growing
Iran internal consumption. Also it is unclear how much of their fields are
depleted and how effective will be investment into their oil infrastructure.
They will remain major gas producer, but whether they are capable to became
again a major oil producer is much less clear.
Why do you think that this is "conflict for majority control of the cheapest
exporting oil within the OPEC." OPEC to a certain extent is gone after
Saudis decision to lift quote regime. It remains some kind of umbrella organization,
but it is no longer a cartel - they are unable to act as a single unit in
their own economic interests.
I think that this conflict is exaggerated by Western MSM, who literally
push one country against the other trying to find and amplify any statements
to this effect. The main claim of Iran to Saudis was "we want our OPEC quota
back" to which Saudis responded by lifting the quota system effectively
disbanding the OPEC. Now Iran leadership is making statements which essentially
play into Saudis hands promising to flood the market with their oil (selling
it for peanuts; not a very wise policy). In other words they act as allies
(in self destruction).
My impression is Saudis are dumping their oil on the market due to
some non-economic considerations. Financially they are committing a suicide
depleting their foreign reserves and winning very little (if at all) in
terms of market share while their fields are aging fast. Essentially what
they are doing is stealing oil from future generations making the mere existence
of the country problematic in 50 years or so. The diversification of their
economy is very difficult to implement. Politically they also alienated
a lot of countries who might be able to help them. Especially during the
rule of a 30 years old deputy crown prince Mohammad bin Salman
Iran is quite a different story. They probably will continue to exist
even if they stop to be an oil exporter and became an oil importer. So for
them becoming a major oil exporter again is not a survival issue. It would
be nice, yes, and will increase standard of living in the country.
In the discussion thread following the original 2006 Oil Drum post, Sam Foucher ("Khebab")
and I had a number of discussions about Russian production, and after talking to Sam, I suggested
that some point after 2007 we should see a very sharp decline in production. Clearly I was wrong,
but on the other hand the post-2007 rate of increase in production slowed, versus 2002 to 2007,
and Russian net exports have been on an "Undulating plateau" since 2007.
Based on EIA data (total petroleum liquids + other liquids for production), Russian net exports
increased from 5.1 million bpd in 2002 to 7.0 million bpd in 2007. At this rate of increase, they
would have been at about 10 million bpd in 2013 (EIA 2014 consumption data not yet available,
but the EIA shows that Russian production increased by 0.1 million bpd from 2013 to 2014).
From 2007 to 2013 inclusive, Russian net exports have been within a range of 6.9 to 7.2 million
bpd with an average value of 7.1 million bpd, versus 7.0 million bpd in 2014, based on the most
recent EIA data.
And virtually flat Russian net exports, combined with the post-2005 decline in Norway's and
Saudi Arabia's net exports, contributed to the observed overall decline in (2005) Top Three net
exports from 2005 to 2013. As I discussed, at the time of my Oil Drum essay, the (then) Top Three
net exporters were showing a very strong combined increase in net exports.
Or let me put it this way. If either Saudi Arabia or Russia had maintained their previous rates
of increase in net exports, the combined (2005) Top Three net exports would have been up, not
down in 2013, relative to 2005.
"... In retrospect, I think that virtually everyone's oil price guesses have been wrong, including mine for a series of price doublings, with uncertain time periods in between. ..."
"... Having said that, we actually did see three approximate annual price doublings–from 1998 to 2000, from 2000 to 2005 and from 2005 to 2011/2013 (with some year over year declines along the way). ..."
"... Given an ongoing, and inevitable, decline in production in a net oil exporting country, unless they cut their internal consumption at the same rate as, or at a faster rate than, the rate of decline in production, it's a mathematical certainty that the net export decline rate will exceed the production decline rate and that the rate of decline in net exports will accelerate with time. ..."
Yeah, I guess I continue to have problems with an average oil price of $110 for 2011 to 2013 being
indicative of weak demand for exports. Funny how the (2005) Top 33 increased their net exports from
2002 to 2005 at about 6%/year, as annual Brent crude oil prices doubled, but then decided to cut
their exports from 2005 to 2013 as oil prices doubled again.
As I mentioned, your basic Fantasy Island belief seems to be that all production and net export
declines are voluntary.
Regarding my oil price prognostications, I believe that I what I generally said was that I thought
that we would see a series of oil price doublings, but because of demand fluctuations, the time periods
between doublings were very uncertain. In retrospect, I think that virtually everyone's oil price
guesses have been wrong, including mine for a series of price doublings, with uncertain time periods
in between.
Having said that, we actually did see three approximate annual price doublings–from 1998 to 2000,
from 2000 to 2005 and from 2005 to 2011/2013 (with some year over year declines along the way).
But I suspect that we are just boring everyone at this point. I know I'm getting bored with yet
another argument with a CC (Crazy Cornucopian).
In any case, to repeat my question: Are you arguing that the following is wrong?
Given an ongoing, and inevitable, decline in production in a net oil exporting country, unless
they cut their internal consumption at the same rate as, or at a faster rate than, the rate of
decline in production, it's a mathematical certainty that the net export decline rate will exceed
the production decline rate and that the rate of decline in net exports will accelerate with time.
Furthermore, if the rate of increase in consumption exceeds the rate of increase in production
in a net oil exporting country, net exports can decline, even as production increases.
I am not sure what they mean, but I suppose they include total Saudi C+C+NGL output, which
was 11.5 mb/d in 2014.
If they mean only crude oil, that's too much, in my view.
I agree the Saudis will not increase output by 2 Mb/d over the next 6 years, possibly 500
kb/d as you suggest seems more likely, which would bring crude output to about 10.6 Mb/d, if
your guess is correct.
"... However, at the start of the 2000s production from the North Sea began to decline and some of the fields in Saudi Arabia had also passed their production peaks. Oil production in the USA had begun to decline in the 1970s and continued to do so until the fracking boom. The supply of oil decreased and the price rose. The price passed $50 per barrel in 2004 and finally reached $147 per barrel in 2008. ..."
"... At the same time, the USA raised oil production dramatically by 4 Mb/d by 2014 through fracking. Fracking now played the same role that North Sea production had played during the 1990s ..."
"... Crude oil production that peaked at 70 Mb/d in 2007 was down at 66.6 Mb/d by 2014 and preliminary data suggests it was 65 Mb/d in 2015. This year it should decrease by 4%, i.e. 2.6 Mb/d. Production from fracking will decrease by up to 1 Mb/d. ..."
"... Production of natural gas liquids, currently in oversupply in the USA, is dependent on natural gas production and at the moment they believe that it will increase greatly. If that does not happen then that fraction of oil supply will also fall. ..."
"... To those who believe that we can forget Peak Oil I just want to repeat again that the bulk of the worlds oil production – conventional crude oil – has already passed its peak. Unconventional oil may also have reached its peak when fracking peaked in 2015. The next few years will reveal the truth. ..."
"... From 1999 it took 4 years to go from drowning in oil to the end of the Oil Age. ..."
But there is still another factor that caused the oil flood in 1999. That is the dramatic increase
in production from the North Sea. However, at the start of the 2000s production from the North
Sea began to decline and some of the fields in Saudi Arabia had also passed their production peaks.
Oil production in the USA had begun to decline in the 1970s and continued to do so until the fracking
boom. The supply of oil decreased and the price rose. The price passed $50 per barrel in 2004 and
finally reached $147 per barrel in 2008.
In the Autumn of 2014 global oil production was in a situation reminiscent of 1999. Saudi Arabia
had finished its massive investments to raise pressure in the Manifa oil field and some other fields,
and at the start of 2013 could now raise production by 1 Mb/d.
At the same time, the USA raised oil production dramatically by 4 Mb/d by 2014 through fracking.
Fracking now played the same role that North Sea production had played during the 1990s. In
its recently released report, the IEA now says that the world is once again drowning in oil. By lifting
the sanctions against Iran we will first see that they sell all the oil they have stored at sea on
old oil tankers. Then they will increase production. Thus Iran will increase the world's oil supply
further.
The question is, when will we see a decline in production like that we had at the beginning of
the 2000s? In the figure above you can see the scenario that the IEA presented in November 2015.
Crude oil production that peaked at 70 Mb/d in 2007 was down at 66.6 Mb/d by 2014 and preliminary
data suggests it was 65 Mb/d in 2015. This year it should decrease by 4%, i.e. 2.6 Mb/d. Production
from fracking will decrease by up to 1 Mb/d. What will compensate for this decline in production
from existing fields is that previously discovered fields will be put into production. However, we
know that the willingness to invest in oil production is currently decreasing along with the willingness
to fund exploration for new oil fields. The latter means that fewer fields will be put into production
in the longer term.
My conclusion is that the world will not be drowning in oil but that, like the oversupply in 1999,
it will take a few years before the market sees shortage. The question is what will happen to oil
demand. One consequence of the current oversupply can be that the shortage in the future will be
more severe since there is less investment in new supply. We have already seen that crude oil has
passed its production peak and the price of oil will be decisive for the moment in time when unconventional
oil peaks. Production of natural gas liquids, currently in oversupply in the USA, is dependent
on natural gas production and at the moment they believe that it will increase greatly. If that does
not happen then that fraction of oil supply will also fall.
To those who believe that we can forget Peak Oil I just want to repeat again that the bulk
of the worlds oil production – conventional crude oil – has already passed its peak. Unconventional
oil may also have reached its peak when fracking peaked in 2015. The next few years will reveal the
truth.
From 1999 it took 4 years to go from drowning in oil to the end of the Oil Age. The Norwegian
oil field Johan Sverdrup will be profitable if the price of oil is $40 per barrel. Oil that is planned
to come into full production in 2020 will presumably be very profitable if we see a similar development
to what we saw after 1999.
"... For many of our customers, available cash and annual budgets were exhausted well before the halfway point for the fourth quarter ... as pricing levels for frackers has dropped into unsustainable territory . ..."
"For
many of our customers, available cash and annual budgets were exhausted well before the halfway point
for the fourth quarter... as pricing levels for frackers has dropped into unsustainable
territory."
"... With the current volatility, trying to catch a bottom in crude oil on prompt futures has more than a $3 a barrel risk and a contango roll depreciation, but with Brent December 2016 falling below $35, the cost of buying a Brent December 16 $40.00 call has fallen down to $3.60 a barrel, Olivier Jakob, an analyst a Swiss-based consultant Petromatrix said. ..."
"... Still, traders say its not entirely surprising to see demand for longer-dated calls that are for strikes well above the current market level when futures prices are sliding. ..."
"... (Reporting by Amanda Cooper; Editing by David Evans) ..."
The seemingly relentless slide in the oil price has savaged global financial markets and raised the
spectre of widespread recession, but the derivatives market is showing traders are not necessarily
buying into the "lower for longer" scenario.
Volatility, a gauge of options prices, has rocketed to its highest since the depths of the financial
crisis in late 2008 as traders have scrambled to snap up protection against an even more aggressive
sell-off.
This week has seen a flurry of buying of derivatives that give their holder the right to sell at
$30 a barrel as far out as December, suggesting that traders and investors are growing increasingly
gloomy about the prospects of price recovery.
But outstripping the increase in holdings of $30 so-called "put" options, is the rise in buy,
or "call" options at $40 a barrel, which would suggest that traders believe that by December this
year, oil at $40 will look like a bargain.
Data from the InterContinental Exchange (ICE) shows holdings of $40 call options for December this
year leapt overnight to the equivalent of 27.92 million barrels of oil, making it the second-largest
strike for options maturing that month.
The rout that has stripped 30 percent off the price of oil in the last 13 trading days alone has
sent equity markets into a tailspin and gave rise to the now-famous "sell (mostly) everything" note
by UK investment bank RBS last week.
"With the current volatility, trying to catch a bottom in crude oil on prompt futures has more than
a $3 a barrel risk and a contango roll depreciation, but with Brent December 2016 falling below $35,
the cost of buying a Brent December 16 $40.00 call has fallen down to $3.60 a barrel," Olivier Jakob,
an analyst a Swiss-based consultant Petromatrix said.
"The Brent December 2017 $50.00 call is at $4.00 a barrel. Given the apparent signs of production
stress at the current price levels we see the value in holding the longer-dated call options in crude
oil at relatively low strike levels," he added.
Reflecting Petromatrix's point, open interest in December calls at $40 now outstrips that of March
puts at $30 by a ratio of nearly three to one, based on the ICE data.
Over the last week, open interest in $30 puts in fact fallen by about 20 percent, while in those
December $40 calls, it has grown sixfold.
There's also the matter of cost. Call options at $40 for contracts maturing between now and the end
of the year cost little more than $1.50 each, compared with a cost of around $10.60 for put options
at that same strike.
Still, traders say it's not entirely surprising to see demand for longer-dated calls that are
for strikes well above the current market level when futures prices are sliding.
"It's been the trend of every melt down to buy upside calls before they get too expensive to get
some delta when the market turns," one said.
(Reporting by Amanda Cooper; Editing by David Evans)
"... Im a big investor in solar and I was advocating that we have 20 countries where we could make solar profitable. It is not true today. At $30 a barrel, there is not a single one, Pouyanne said. ..."
Crude oil at below $30 per barrel has a negative impact on the profitability and investments in renewable
energies, Total's Chief Executive Officer Patrick Pouyanne, told a forum in Davos in Thursday.
Oil prices have fallen to multi-years lows in due to a persistent global supply surplus.
"Today at $30 a barrel, I'm sorry," Pouyanne said.
"I'm a big investor in solar and I was advocating that we have 20 countries where we could make
solar profitable. It is not true today. At $30 a barrel, there is not a single one," Pouyanne said.
"... On an individual well basis, ultimate recovery from North Dakota wells ranges from 500,000 to 900,000 bbl per well, compared to 100,000 to 400,000 bbl per well in the Elm Coulee Field of Montana. ..."
"... If the predictions prove to be accurate and are repeatable over a wide area, the Bakken would likely be the most prolific onshore oil play in the United States. ..."
On an individual well basis, ultimate recovery from North Dakota wells ranges from 500,000
to 900,000 bbl per well, compared to 100,000 to 400,000 bbl per well in the Elm Coulee Field of
Montana.
Improved hydraulic fracturing technology including more fracturing stages has become a
significant contributor to improved production.
In addition, the productive reservoir section on the North Dakota side of the Williston Basin
is thicker and more widely distributed, typical of an unconventional resource play. If the
predictions prove to be accurate and are repeatable over a wide area, the Bakken would likely be
the most prolific onshore oil play in the United States.
"... First of all, the GCC countries, take their orders from the USA. ..."
"... The GCC countries themselves, do not wish to produce and sell the bulk of their oil reserves cheaply. ..."
"... The oil rich countries that are on bad terms with the US/NATO, meaning Russia, Iran, Iraq, Kazakhstan, Venezuela and formerly Libya, have been/are/will be under pressure from the financial power centers of the West so as to minimize their own production. ..."
"... As a county importer of oil the USA generally is interested in lower oil prices. And it looks like the current administration does not mind sacrificing its own shale industry. Note the Obama administration did little to nothing to help shale players (may be some nod-wink to banks as for loans/bonds, but thats about it). ..."
"... Low oil prices also undercut two countries that does not want to march to the tune of Washington drummer: Iran and Russia. The latter is the real obsession of Obama administration as in Carthago delenda est (Carthage must be destroyed) . The level of hate of Russia in Obama administration is probably unprecedented for the post Cold War period, including strong personal antipathy of Obama toward Putin. ..."
"... d) This would have meant not only a great financial hole for the wealthy/dominant US/EU axis, but also extreme strategic weakness vis-a-vis their privileged allies at the GCC and even more crucially in relation to Iran, Iraq, Kazakhstan, Venezuela and worst of all, Russia. ..."
"... If the price of oil remains prohibitive for Western countries and oil majors in the coming years and no regime-change is inflicted upon Russia/Iran, the scenario I am describing above may very well play out to a considerable degree. ..."
"... The reason why the US/NATO is being so hostile against Russia, has nothing to do with emotions or antipathy towards Putin's personality. It's about geostrategy and leverage. While Russia is an economic lightweight, geostrategically is a potential lethal threat against the US superpower or even NATO in general. This is not so much about economic size, it's about leverage. If Russia is treated half-fairly in its interaction with the global economy, her economy will rapidly shift to rapid growth. Even so, a growing Russian economy will never approach the absolute size of the EU, US or Chinese economies. But as I said earlier, this is not about sheer economic size, but about leverage. A reasonably prosperous Russia would be impossible for any power, or even any combination of powers to pressurize. There would simply be no leverage. Russia has all the resources it needs, has all the nukes to deter all enemies, actual or potential and its smallish population (especially in relation to its colossal resource base) is actually an advantage in the 21st century. The revenue from resource sales could then be partially diverted to the military-industrial complex and maintain a state-of-the-art military branch. ..."
"... In a way, Russia (due to her unique geography) is the antithesis of countries such as Germany, Japan and Korea. The latter 3 were given all kinds of trade privileges and aid from the US in the post-war period, because due to the global presence of the US military and influence, they are all powerless strategically. They are all resource poor and geographically constrained, hence have little choice but to generally accept US imperatives, especially since they were given a good economic deal after 1945. The US (or other powers for that matter) cannot treat Russia in the same way, because Russia is neither geographically constrained, nor resource poor, in fact Russia is the exact opposite of that and therefore we have the current global situation. ..."
"... Feigning weakness and loss of control is the strategy du jour for US "informational warfare" It simply suits US interests best to pretend that they have lost their tight grip on some key Middle Eastern allies. This is so for several reasons: ..."
"... a) It puts an "imaginary" distance between the good Western democracies and the savage, head-chopping dictatorships of the GCC. The US gets to maintain control, the considerable financial perks (via weapons sales, Treasury sales, GCC investments in Western stock markets etc) while pretending to have little, if anything to do with it. ..."
"... b) It obscures US motives, tactics and strategy in the Middle East and beyond. If the world (especially the naive public North America and Europe) falls for the lie that the GCC states act on their own volition, then NATO's dirty work in the Middle East gets to keep plausible deniability. "Don't look at us, we are not the superpower of yesteryear, those Sheikhs are their own men now". ..."
"... The way to tell where the GCC owes its allegiance to, is (as always) to follow the money. Where do they buy weapons from? Where do they recycle their petrodollars in? To whom do they provide bases? Who are they fighting against? ..."
While I am not petroleum geologist or oil engineer, in my opinion, several OPEC countries have
been deliberately under-producing for many decades now. This may be so due to several different
reasons:
a) First of all, the GCC countries, take their orders from the USA. The USA does not
want its allies/subordinates of the GCC (KSA, UAE, Kuwait and Qatar) to be producing at maximum
capacity. First of all, that would have kept prices relatively lower during the period after 2000,
which will have meant that no shale or tar sands boom would have ever taken place in North America.
b) The GCC countries themselves, do not wish to produce and sell the bulk of their oil
reserves cheaply. They both have to defer to what Western powers demand, and also save oil
for the future. They rationally wish to spread their production over as many decades as possible.
c) The oil rich countries that are on bad terms with the US/NATO, meaning Russia, Iran,
Iraq, Kazakhstan, Venezuela and formerly Libya, have been/are/will be under pressure from the
financial power centers of the West so as to minimize their own production. The pressure
from the West against these countries ebbs and flows according to the tactical and strategic imperatives
at any given moment in time. For example, for many years, it was Iraq that was the main target
of the US & allies. Then it was Iran and now it's Russia.
If what I say above is correct, then it seems plausible to argue that both GCC and Russia/Iran/Iraq
etc have much more oil potential than Ron Patterson seems to believe.
The high oil price is one of the key factors in "secular stagnation" of Western (G7) economies.
So it's unclear to me why would the USA encourage high oil prices via limiting oil production
in any country, even in view of "shale boom" of 2010-2014.
As a county importer of oil the USA generally is interested in lower oil prices. And it
looks like the current administration does not mind sacrificing its own shale industry. Note the
Obama administration did little to nothing to help shale players (may be some nod-wink to banks
as for loans/bonds, but that's about it).
Low oil prices also undercut two countries that does not want to march to the tune of Washington
drummer: Iran and Russia. The latter is the real obsession of Obama administration as in Carthago
delenda est (Carthage must be destroyed) . The level of hate of Russia in Obama administration
is probably unprecedented for the post Cold War period, including strong personal antipathy of
Obama toward Putin.
The only negative is that the same policy helps China, which is probably the most important
threat to the USA world dominance and also decrease flow of "oil money" into US treasuries. But
China can be dealt with later, if Russia and Iran fall in line.
Stavros H, 01/21/2016 at 10:29 am
@likbez
Let us imagine that there is a roughly efficient global market for oil extraction. I claim, that
under such a scenario, the price of oil would have never risen to $100/bbl. This would have meant
several things:
a) Production in wealthy western countries would have been much lower during the entire post-2000
period, and especially the past 10 years or so, even more so, during the past 5 years. US shale,
Gulf of Mexico UDPW, Canadian tar sands, the North Sea would have either never produced a single
barrel of oil, or would have been producing at massively lower rates than they have/are currently
producing at.
b) Production in other relatively expensive areas, West Africa offshore, Latin America offshore,
where production is done by Western oil majors, would also have developed more modestly.
c) This deficit from currently producing marginal areas outlined above would have been covered
partly by the GCC (KSA, Kuwait, UAE) and partly by countries outside the US/NATO alliance system,
such as Russia, Iran, Iraq, Kazakhstan and Venezuela.
d) This would have meant not only a great financial hole for the wealthy/dominant US/EU axis,
but also extreme strategic weakness vis-a-vis their privileged allies at the GCC and even more
crucially in relation to Iran, Iraq, Kazakhstan, Venezuela and worst of all, Russia.
If the price of oil remains prohibitive for Western countries and oil majors in the coming
years and no regime-change is inflicted upon Russia/Iran, the scenario I am describing above may
very well play out to a considerable degree.
The reason why the US/NATO is being so hostile against Russia, has nothing to do with
emotions or antipathy towards Putin's personality. It's about geostrategy and leverage. While
Russia is an economic lightweight, geostrategically is a potential lethal threat against the US
superpower or even NATO in general. This is not so much about economic size, it's about leverage.
If Russia is treated half-fairly in its interaction with the global economy, her economy will
rapidly shift to rapid growth. Even so, a growing Russian economy will never approach the
absolute size of the EU, US or Chinese economies. But as I said earlier, this is not about sheer
economic size, but about leverage. A reasonably prosperous Russia would be impossible for any
power, or even any combination of powers to pressurize. There would simply be no leverage. Russia
has all the resources it needs, has all the nukes to deter all enemies, actual or potential and
its smallish population (especially in relation to its colossal resource base) is actually an
advantage in the 21st century. The revenue from resource sales could then be partially diverted
to the military-industrial complex and maintain a state-of-the-art military branch.
In a way, Russia (due to her unique geography) is the antithesis of countries such as
Germany, Japan and Korea. The latter 3 were given all kinds of trade privileges and aid from the
US in the post-war period, because due to the global presence of the US military and influence,
they are all powerless strategically. They are all resource poor and geographically constrained,
hence have little choice but to generally accept US imperatives, especially since they were given
a good economic deal after 1945. The US (or other powers for that matter) cannot treat Russia in
the same way, because Russia is neither geographically constrained, nor resource poor, in fact
Russia is the exact opposite of that and therefore we have the current global situation.
Ron Patterson, 01/20/2016 at 9:02 pm
a) First of all, the GCC countries, take their orders from the USA.
Is it possible that there still exist such ignorance among people who can actually read and
write.
Stavros H, 01/21/2016 at 9:42 am
That's amusing!
You seem to completely fall for MSM propaganda and the nonsensical narrative that they have been
pushing for several years now.
Feigning weakness and loss of control is the strategy du jour for US "informational warfare"
It simply suits US interests best to pretend that they have lost their tight grip on some key
Middle Eastern allies. This is so for several reasons:
a) It puts an "imaginary" distance between the good Western democracies and the savage,
head-chopping dictatorships of the GCC. The US gets to maintain control, the considerable
financial perks (via weapons sales, Treasury sales, GCC investments in Western stock markets etc)
while pretending to have little, if anything to do with it.
b) It obscures US motives, tactics and strategy in the Middle East and beyond. If the world
(especially the naive public North America and Europe) falls for the lie that the GCC states act
on their own volition, then NATO's dirty work in the Middle East gets to keep plausible
deniability. "Don't look at us, we are not the superpower of yesteryear, those Sheikhs are their
own men now".
The way to tell where the GCC owes its allegiance to, is (as always) to follow the money.
Where do they buy weapons from? Where do they recycle their petrodollars in? To whom do they
provide bases? Who are they fighting against?
Now, I am not saying that the US/NATO have 100% control over the GCC. No, imperial power does not
work that way. But, at the end of the day, it's clear who the boss is. GCC are simply some of the
US Empire's most privileged vassals.
Clueless, 01/21/2016 at 10:17 am
Ron, I think that we have a President and a former Secretary of State that believe that.
The two price rallies from March-to-June and from August-to-October were based largely on hope and
the price decline from June-to-August represented a return to the reality of supply and demand fundamentals.
The most recent price decline that began in October is a bit different. Here, confirmation bias
has replaced critical thinking about the oil market. The ruling paradigm is that prices are likely
to stay low for years or even for decades and evidence is easily found that favors and confirms this
bias. I believe that this paradigm is incorrect.
Despite troubling signals of structural weakness in the global economy, data suggests that the
oil market is stumbling toward balance. Although I have said that
prices must go lower in order to flush out the zombie producers, IEA's statement in the
January Oil Market Report
that the world could drown in over-supply is based more on sentiment and pessimism than on data.
Let's put this in context. 1.2 mmbpd is disappointing only compared with 1.7 mmpbd in 2015 but
that was the highest demand growth in 5 years. 2016 demand growth is more than the average for 2011
through 2013 when oil prices were more than $100 per barrel, and is one-third higher than in 2014
when the oil-price collapse began.
... ... ...
What conclusions might we reach from this? If we assume that supply remains flat and IEA's forecast
of a 1.2 mmbpd increase in demand is reasonable, the supply surplus should fall to approximately
350,000 bpd. That does not include the wild card of Iranian production.
"... Maybe that's the 50:50 ratio of production and imports. The US is now at 57:43. That is not "almost energy independent" ..."
"... Note that in Obama's 2016 SOUA the term "energy independence" is no longer used but the objective to develop "clean energy sources" is mentioned. The statement that imports of foreign oil were cut by "almost 60%" (from its peak) is correct. ..."
"... Contrary to general belief, and mis-information by the media the US is far away from being "energy independent" in terms of crude oil imports. ..."
"... It is not clear why the media are spreading confusing, incorrect or even wrong facts on oil supplies. ..."
"... And where is the responsibility of the media? Oil is not about entertainment but the lifeblood of our economy. And last not least, biased or ignorant reporting leads to wrong decisions to build new oil-dependent infrastructure. ..."
Aljazeera's Inside Story mentions a tipping point but doesn't specify of what. Maybe that's
the 50:50 ratio of production and imports. The US is now at 57:43. That is not "almost energy
independent"
ABC TV's claim that the US is "virtually self-sufficient in oil" is also incorrect. And the
reference to Saudi Arabia's role forgets that exports matter.
On the other hand, Obama's speech writers are closer to the facts. Note that in Obama's 2016
SOUA the term "energy independence" is no longer used but the objective to develop "clean energy
sources" is mentioned. The statement that imports of foreign oil were cut by "almost 60%" (from
its peak) is correct.
Conclusion
Contrary to general belief, and mis-information by the media the US is far away from being
"energy independent" in terms of crude oil imports. Maybe some may find the above analysis
statistical hair-splitting but the narrative of US energy independence has shaped public opinion
to such an extent that prudence has given way to complacency. There is a danger that wrong
geo-strategic views are formed, especially in the context of evolving and worsening conflicts in
the Middle East.
It is not clear why the media are spreading confusing, incorrect or even wrong facts on oil
supplies. Is it lack of time to check statistics, is it parroting of what others have
repeated many times, or is there a deliberate attempt to embellish things. Perhaps just wishful
thinking? And where is the responsibility of the media? Oil is not about entertainment but
the lifeblood of our economy. And last not least, biased or ignorant reporting leads to wrong
decisions to build new oil-dependent infrastructure.
"... Saudi Arabia says $30 oil is 'irrational'. Comments from Khalid al-Falih, chairman of state oil company Saudi Aramco: The market has overshot on the low side and it is inevitable that it will start turning up" ..."
"... Saudi is pumping as much as it can, trying to drive the rest of em out of business. So they can have their one last hay day, before the wells start drying up. They want to make the most of next decade. BUT they didn't expect prices to fall THIS much. So it's a big game of chicken now. ..."
"... I think KSA knew they were going to peak soon so they maxed out the infill drilling and dropped the price for a year or so. It's s psychological game. ..."
"... FYI the ruling clan does not think in terms of 'national interest'. They think of their own personal/clan interest. Once they've squeezed the land dry they'll retire to southern France and leave the mess behind. ..."
ICYMI – Saudi Arabia says $30 oil is 'irrational'. Comments from Khalid al-Falih, chairman of
state oil company Saudi Aramco: "The market has overshot on the low side and it is inevitable that
it will start turning up"
He predicts higher prices by the end of the year, Also reiterated
that Saudi Arabia would not cut supply unilaterally, nor would they make way for rival producers
Saudi Arabia has said it would consider production cuts if other Opec members participated and if
the cartel was joined by the largest producers outside the group, such as Russia.
Saudi is pumping as much as it can, trying to drive the rest of em out of business. So they can
have their one last hay day, before the wells start drying up. They want to make the most of next
decade. BUT they didn't expect prices to fall THIS much. So it's a big game of chicken now.
I tend to agree. I think KSA knew they were going to peak soon so they maxed out the infill drilling
and dropped the price for a year or so. It's s psychological game.
In the future they might threaten
to raise production to psyche the market, and maybe they will briefly, but I think this is KSA's
last kick at the can and they know it. They'll decline fast IMHO as the infill drilling has resulted
in a longer plateau with a little burst up at the end but the decline rates will be steep.
FYI
the ruling clan does not think in terms of 'national interest'. They think of their own personal/clan
interest. Once they've squeezed the land dry they'll retire to southern France and leave the mess
behind.
"... I saw that you were on Bloomberg in December, and you said that you thought oil would go to the low $30s per barrel, which was a good call at the time, before OPEC would sort of relent. Do you see any chance that OPEC can actually coordinate any production cuts? ..."
"... it seems now is that they are really fracturing OPEC, and in some ways almost undermining their own members. ..."
"... So countries like Venezuela or Nigeria...do you actually see them shutting in production? ..."
"... And finally, the answer to the question that everyone wants to know: where do you see oil prices going this year? ..."
"... Now I think it is about a range. It's about where are oil prices going to stay in the next year and probably the next couple of years, at least with this pace of economic growth and oil production. ..."
"... I'd say between $35 and $55 right now. And I think to narrow that down I'd probably say that $45 to $48 is going to be an average price for the year. And I do think that there is definitely more risk to the upside than there is to the downside at this point. ..."
Oilprice.com:I saw that you were on Bloomberg in December, and you said that
you thought oil would go to the low $30s per barrel, which was a good call at the time, before OPEC
would sort of relent. Do you see any chance that OPEC can actually coordinate any production cuts?
Carl Larry: No, you know, at this point I think that there is something to consider...that
OPEC up until now most people had thought that the Saudis and the rest of OPEC were really pushing
hard to slowdown or stop altogether shale production in the U.S. But what it seems now is that they
are really fracturing OPEC, and in some ways almost undermining their own members.
So with oil prices down here and with production staying so high, it becomes a point where it's
unsustainable for countries like a Nigeria or a Venezuela to continue on. I mean, other countries
within OPEC are still struggling with these oil prices, including Saudi Arabia. But you can see that
going forward that the more that the pressure stays on those countries that are outside of the Middle
East, it's possible that they are the ones that are going to have to blink first. They are the ones
that are going to have to cut back production.
OP:So countries like Venezuela or Nigeria...do you actually see them shutting
in production?
CL: Yeah, I think so. I think that it's possible. It's a theory, but it's possible
that when Shell pulled out of the U.S. Arctic a few months ago, they said that they wanted to cut
costs. But I think that they were just shifting some of the budget that was there to uphold and maintain
production in areas like West Africa, like Nigeria.
... ... ...
OP:And finally, the answer to the question
that everyone wants to know: where do you see oil prices going this
year?
CL: Well, I think the funny thing is
that in past years we have all had a price target, where we all
forecasted. Now I think it is about a range. It's about where are
oil prices going to stay in the next year and probably the next
couple of years, at least with this pace of economic growth and oil
production.
So, I'd say between $35 and $55 right now. And I think to narrow
that down I'd probably say that $45 to $48 is going to be an
average price for the year. And I do think that there is definitely
more risk to the upside than there is to the downside at this
point.
There's something I don't understand about SA protecting its market share at the expense of price.
According to an IEA item written a few days ago (https://www.iea.org/oilmarketreport/omrpublic/),
global supply will exceed production by 1 million barrels in 2016.
So, all SA needs to do is reduce production by 1 million bpd to send prices shooting back up and
stop the rapid depletion of their financial reserves. What do they care about protecting a mere
1 million bpd in market share?
As stated above, OPEC has gone well past its peak and it would
only be a matter of a 2 or 3 short years before SA would again regain that market share. Let's
not forget also that there has been massive underinvestment from the big exploration companies
for the last few years which is guaranteed to have a knock-on impact in the near future – again
guaranteeing that SA will regain its market share in the medium to short term.
Something is afoot, particularly when now they also want to get western interests investing in
their oil refining industry.
If this was a poker game I'd say there's a major bluff being played here.
Protection of the market share is just a smoke screen for dumping or "undercutting". They essentially
give a discount for their oil for each region from Brent price effectively putting price tag on
each barrel. This way they drive price down even without exporting any more barrels. You can get
much farther with a kind word and a gun than you can with a kind word alone.
Actually their
exports are close to flat y-o-y ( 2013 7.36; 2014 7.11; 2015 7.4).
The price plunge represents a huge fiscal headache for the Saudi royal family (they can balance
the budget only at $90 or higher) so why they are doing this is an open question. They are depleting
their foreign currency reserves really fast to the tune of $100 billions a year.
In light of the jobs report, Edward sat down to talk with Warren Mosler, president of Valance
Inc. Warren gives us his take on what's going on with wages in the US and if policymakers believe
a robust economic recovery is possible without real wage growth. Warren also weighs in on the important
subject of oil; he sees the Saudis acting as the swing producer of oil, using spread pricing to engineer
a market crash that hurts producers of crude with high costs and too much debt.
He also tells us why he thinks the Saudis have moved to spread pricing that effectively turns them
into price takers and whether geopolitics is a big factor in this. Warren weighs in on what is happening
with credit expansion and demand in the US economy.
The ever-declining U.S. oil rig count should really start to take a bite out of the oversupply
problem this year, KLR Group's John Gerdes said Thursday, predicting depressed crude prices could
soon begin to move sharply higher.
Gerdes sees West Texas Intermediate crude hitting $47 per barrel in 2016, basically a 50 percent
increase from current levels of about $31. Looking out to 2018, he sees prices at $80 to $85 per
barrel.
"What this industry will need is more of an $80 to $80-plus environment to drive some modest
degree of return. And the mechanisms for that are being set in motion with these lower levels of
activity to suggest the supply adjustments should progress," Gerdes told CNBC's "Squawk Box."
... ... ...
"What this industry will need is more of an $80 to $80-plus environment to drive some modest
degree of return. And the mechanisms for that are being set in motion with these lower levels of
activity to suggest the supply adjustments should progress," Gerdes told CNBC's "Squawk
Box."
... ... ...
"The U.S. industry is effectively uneconomic at sub-$60 [per barrel] and we're sitting at
$30," he said.
Yup. But we already knew where this is heading 8-9 months ago. You can see how broad market reacted
with sudden enlightenment of very low prices for longer than it was hoped.
I picked this up out of a Seeking Alpha article by Traveling Investor.
2003, ConocoPhillips average oil price was $27.47 and gas price $4.07. Production costs
were $4.98 per BOE.
2014, production costs for ConocoPhillips were $15.52, per BOE.
Excepting international gas, which I am not sure of re pricing, COP is likely grossing less
than $20 per BOE today. I am sure production costs are down from 2014, however, triple from 2003
is in line with our experience.
As crude oil prices collapse below $30 per barrel and metals trade near record lows, Goldman
Sachs (GS) forecasts that 2016 will nonetheless bring a "new bull market" for commodities.
"... We think oil is going to go higher in the second half of the year because, even with Iran gradually increasing output, we expect the first signs of the rebalancing in the oil market, ..."
"... Following two, two and a half years of pretty much nonstop stock build, we think that well be balanced in the second half which will provide a change of tone in the market and provide some uplift, ..."
"... I think the key driver is a steady and significant decline in U.S. production and thats really going to be the key to the market outlook. ..."
"... Even with his long-term bullish outlook, however, he said that the pressure could continue in the coming days. With sanctions lifted, I would characterize it as a wait-and-see game as Iran strives to regain market share. ..."
The International Energy Agency renewed concerns about a global
oil glut after it said crude oversupply should continue through the end of 2016. The announcement
follows the lifting of U.S. sanctions on Iran over the weekend, which experts project will add more
crude to the market. Oil prices fell more than 3 percent Tuesday, settling at their lowest level
since September 2003.
Despite the overwhelmingly bearish picture for the
energy space, one expert maintains his
view that we will see oil back above $40 by the end of the year.
"We think oil is going to go higher in the second half of the year because, even with Iran gradually
increasing output, we expect the first signs of the rebalancing in the oil market," Mike Wittner
said Tuesday on CNBC's "Futures Now."
Crude oil has been in a precipitous decline for the last two years as supply and demand continue
to drag the market lower. WTI crude is down 70 percent since January 2013.
"Following two, two and a half years of pretty much nonstop stock build, we think that we'll be balanced
in the second half which will provide a change of tone in the market and provide some uplift," said Wittner, managing director and global head of oil research at Societe Generale.
"I think the key
driver is a steady and significant decline in U.S. production and that's really going to be the key
to the market outlook."
Even with his long-term bullish outlook, however, he said that the pressure could continue in
the coming days. "With sanctions lifted, I would characterize it as a wait-and-see game as Iran strives
to regain market share."
Wittner expects oil to steadily trade above $40 by the second half of this year, more than 35
percent higher than its current price of under $29 a barrel.
"... I think most predictors are assuming that if oil hits 40 by mid year, then the producers will be drilling madly. Get a grip. Where is the money going to come from? ..."
"... US production is going over the cliff, that has, at least a year, before they can get a response out of the accelerator pedal. ..."
"... How can OPEC say in the report that Inventories declined in November and then imply that demand is two million barrels per day less than supply? ..."
Good info, Ron. Like you, I think the 380k drop in the US is not only too optimistic, as the EIA
is predicting 500k. I actually think that both are way too optimistic. The sharp drop now, is
hitting producers at a time when they are counting pennies towards new wells. I think most
predictors are assuming that if oil hits 40 by mid year, then the producers will be drilling madly.
Get a grip. Where is the money going to come from?
US production is going over the cliff, that has, at least a year, before they can get a
response out of the accelerator pedal.
Sweeping the old eyeball across the columns of Ron's Table 5.7 above from the 2014 column at $110/b
to now, y'all do realize this should not be happening? Those numbers are pretty flat, with a few
mild declines and a few mild rises.
That's 73ish% cut in price and no signif impact on production.
"... The national currency declined by 2 percent to 79.1 rubles to the dollar in Moscow, its lowest trading level since December 2014. ..."
"... Russia is running a budget deficit of 3 percent of GDP this year, and the government is looking to cut 10 percent from the federal budget, which was drafted with oil prices of $50 a barrel in mind. ..."
"... The government has recently downgraded its economy forecast for this year, from 0.7 percent growth to a 0.8 percent decline. ..."
MOSCOW - The Russian ruble, battered by weak oil prices, on Monday fell to an all-time low against
the euro and dropped to its lowest level in more than a year against the dollar.
The Central Bank set the official exchange rate at over 85 rubles to the euro on Monday. The
national currency declined by 2 percent to 79.1 rubles to the dollar in Moscow, its lowest trading
level since December 2014.
Oil, the mainstay of the Russian economy, recently plummeted to under $30 a barrel, a 13-year
low. The ruble is also under pressure from economic sanctions that the West imposed on Russia for
its involvement in the Ukraine crisis.
Russia is running a budget deficit of 3 percent of GDP this year, and the government is looking
to cut 10 percent from the federal budget, which was drafted with oil prices of $50 a barrel in mind.
All Russian ministries are expected to present their proposed cuts by the end of the month with
a view to cutting 500 billion rubles ($6.3 billion) in government expenses, Finance Minister Anton
Siluanov said.
Prime Minister Dmitry Medvedev, in televised comments on Monday, said that the government finds
the price of oil "difficult to predict" and that Russia should use this moment to diversify its economy
away from oil since it "has got a chance now to do it as quickly as possible."
The government has recently downgraded its economy forecast for this year, from 0.7 percent
growth to a 0.8 percent decline.
Deputy Prime Minister Arkady Dvorkovich told Russian news agencies in Hong Kong that the government
and monetary officials are discussing ways to spur growth and hoping GDP will be flat this year compared
with 2015.
"... As I understand it, Mosler says that Saudi Arabia, as the swing producer, can cause a price increase/decrease by offering to sell at a premium/discount to various benchmarks, like WTI or Brent. ..."
"... Interesting. I dont know anything about Warren Mosler but Saudi Aramco increases and decreases discounts and premiums to various markets monthly. ..."
"... That isnt to say that the Saudis couldnt cause ructions if they made BIG discounts or premiums, but in view of the difficulties theyve brought on themselves currently by shooting themselves and all other producers in the foot, Id hope theyd be more careful next time. I fear that it all depends on Deputy Crown Prince Muhammad bin Salman, the Power Behind the Throne at the moment. ..."
"... I think Moslers theory is that it is not supply vs. demand, but the price premium/discount which causes the price swings. The way he puts it is that oil is an essential commodity – i.e. you either buy what you need or the lights go out – and the Saudis can cause market moves by premia/discounts to the benchmarks because of their swing producer status, regardless of the amount of oil otherwise available. ..."
"... I confess not to understand the exact dynamic he is talking about, but think it is an interesting take which fits in more with the oligopolistic nature of the oil market (and many other markets) better than the standard supply-demand analysis. which I believe is more applicable to a market where there is close to perfect competition. ..."
"... With continued low prices, continued for longer than anticipated Id believe, and couple with Chinas unanticipated decrease in demand, the Saudis tempt their people to revolt. ..."
"... Your are correct about Refineries. They are optimized to a supply of crude oil, and it is expensive, and they incur downtime, to move to a different (different oilfield typically) supply of crude oil. ..."
"... If you are talking about US shale players then at the current price level (below $30) most of them have a negative cash flow and can be bankrupt in year or less, unless Wall Street extend financing or oil price recover to $60 or above level. ..."
"... Each well is around $6-$8 million and at this price level it is impossible to get those money back in probably 80-90% of cases. North Dakota is probably already not attractive for any company to drill at this price level. ..."
I would be very interested on any comments about Warren Mosler's theory of why oil prices dropped
and are continuing to drop.
As I understand it, Mosler says that Saudi Arabia, as the swing producer, can cause a price
increase/decrease by offering to sell at a premium/discount to various benchmarks, like WTI or
Brent.
While I have not been able to understand exactly how this would work, I respect Mosler and
his analytic ability.
If he is correct, then the Saudi's, who are currently offering to sell at a discounted price
relative to WTI, can reverse course and charge a premium over the same benchmarks when they feel
that they have caused enough damage to the American producers of shale oil.
Interesting. I don't know anything about Warren Mosler but Saudi Aramco increases and decreases
discounts and premiums to various markets monthly. Memory fades, but I think the last time I noticed
this kind of move a premium was applied to shipments to Asia for the following month (that's East
Asia; are the people who are so free with 'Asia' aware that Israelis are Asians? As are Saudis
and Pakistanis and Kazakhs and…) and a discount to crude being sent to the US.
That isn't to say that the Saudis couldn't cause ructions if they made BIG discounts or premiums,
but in view of the difficulties they've brought on themselves currently by shooting themselves
and all other producers in the foot, I'd hope they'd be more careful next time. I fear that it
all depends on Deputy Crown Prince Muhammad bin Salman, the Power Behind the Throne at the moment.
There is no real argument about this – the Saudi's have been quite clear that are deliberately
over producing in order to gain more market share – this isn't just about driving the price down,
its also making aggressive deals to the relatively small number of purchasers who have alternative
suppliers (because of refinery limitations oil isn't quite as fungible a commodity as people tend
to assume) in order to lock in new customers. The second aim for the Saudi's is to reassert their
political role as the world swing producer – the one producer which can set an oil price, just
by saying 'this is the price'. This king making role in OPEC is central to the power of the House
of Saud.
It was always assumed that the Saudi's would withdraw this pressure as soon as they have achieved
their tactical aims, which are (in unknown order), to punish investors for putting money into
unconventional oil, to hurt the Iranians, and make Putin angry. They've only really succeeded
with the first, although they probably aren't hurting enough yet for the Saudi's taste.
The problem for the Saudi's – and they almost certainly did not anticipate this – it will prove
far harder for them to push the price up than they expected. There is such an enormous glut now
that even if they cut back production by 10 or 20% or more, it will not have a significant effect
for many months at least. There is simply too much oil floating around, and too many struggling
operators are waiting for any sort of price rise to open up their plugged wells quickly to get
cash flow. Quite likely, many purchasers will simply prefer to run down stocks rather than accept
higher prices from the Saudi's (or anyone else). So while the Saudi's may succeed in retailing
their dominant market share when this is all over, they may well have done so at a huge and unintended
cost – they will find they can push the price down, but they can't push it back up again.
I think Mosler's theory is that it is not supply vs. demand, but the price premium/discount
which causes the price swings. The way he puts it is that oil is an essential commodity – i.e.
you either buy what you need or the lights go out – and the Saudi's can cause market moves by
premia/discounts to the benchmarks because of their swing producer status, regardless of the amount
of oil otherwise available.
I confess not to understand the exact dynamic he is talking about, but think it is an interesting
take which fits in more with the oligopolistic nature of the oil market (and many other markets)
better than the standard supply-demand analysis. which I believe is more applicable to a market
where there is close to perfect competition.
The Saudi's have one thing to fear: The Peasants are Revolting. With continued low prices, continued for longer than anticipated I'd believe, and couple with
China's unanticipated decrease in demand, the Saudi's tempt their people to revolt.
Your are correct about Refineries. They are "optimized" to a supply of crude oil, and it is
expensive, and they incur downtime, to move to a different (different oilfield typically) supply
of crude oil.
Refineries which produce low sulphur diesel can accept gas oil from any other refinery.
"There is simply too much oil floating around, and too many struggling operators are waiting
for any sort of price rise to open up their plugged wells quickly to get cash flow."
If you are talking about US shale players then at the current price level (below $30) most
of them have a negative cash flow and can be bankrupt in year or less, unless Wall Street extend
financing or oil price recover to $60 or above level.
Only few stronger players will survive. Shale production was essentially conversion of junks
bonds into oil even in better times. This is a VERY expensive oil. Now it is difficult to sell
bonds and they no longer can drill enough wells even in "sweet spots" to stem the decline of production
so this is just a matter or time when they go down.
Each well is around $6-$8 million and at this price level it is impossible to get those money
back in probably 80-90% of cases. North Dakota is probably already not attractive for any company
to drill at this price level.
"... The key theme for 2016 will be real fundamental adjustments that can rebalance markets to create the birth of a new bull market, which we still see happening in late 2016, ..."
As crude oil prices collapse below $30 per barrel and metals trade near record lows, Goldman
Sachs (GS) forecasts that 2016 will nonetheless bring a "new bull market" for commodities.
The investment bank predicted that commodity producers this year would finally make the cuts
needed to bring supply and demand back into balance. This would be helped by the globalization
and increasing liquidity of commodity markets, which will mean surplus production will be
absorbed more easily than at present.
"The key theme for 2016 will be real fundamental adjustments that can rebalance markets to
create the birth of a new bull market, which we still see happening in late 2016," Goldman
Sachs analysts led by Jeffrey Currie, said in a report on Friday.
... ... ...
On Friday, Renaissance Capital, a specialist investment bank, cuts its Brent crude oil
forecast for 2016 by 33 percent to $40, in line with Goldman Sachs.
Multiple banks cut their oil forecasts on Monday, including Barclays, Macquarie, Bank of America
Merrill Lynch, Societe Generale and Standard Chartered. The latter was the most bearish, warning
that prices could fall as low as $10.
When Goldman Sachs first postulated that oil prices might fall to as little as
$20 per barrel, many market participants were incredulous. Fast forward a few months though, and
with oil below $30 a barrel, $20 does not look nearly so improbable. Yet despite the fact that
oil's downward trend has gained momentum of late, Goldman Sachs seems to be largely unconcerned.
The bank is sticking with its $40 per barrel forecast for the first half of 2016 and says that it
sees a new bull market in oil starting to evolve in late 2016 as market adjustments balance out
supply and demand.
... ... ...
The second notable point regarding Goldman's view is the call for the start of a
new bull market in late 2016. This should give some distant sense of hope to energy investors.
Almost no oil producer on Earth can make money at present prices. Saudi Arabia and Iran in
particular will likely keep pumping oil as a way of thumbing their nose at one another, but the
Russians and the Venezuelans may find in short order that draconian financial adjustments are
needed to keep their economies afloat without the traditional rich stream of oil revenues they
have enjoyed. Similarly, while most oil companies survived the fall banking evaluations, 2016
will bring new challenges on that front.
Gary Shilling
noted the dilemma here that producers find themselves in last year with what proved to be a
very prescient call. At this point companies are not making money oil at current prices. Instead
they are continuing to operate in the hope that tomorrow will be better. They can do this until
one of two things happen; they run out of cash for operating purpose, or they give up hope. It
will probably take a combination of both factors to rebalance the markets.
"... the smart money will be ignoring what the Davos crowd say and do as they do---going long oil now we know North American supply is about to start contracting in earnest. ..."
"... Regardless of what the MSM pundits tell you this oil crash has nothing to do with Saudi Arabia. If you remember correctly when oil was pushing $140 these same jerks said the Saudis didn't have the capacity to bring down the price of oil, and now we're supposed to believe they're the cause of the current price collapse? ..."
"... February oil contract closes today. Watch for a big bounce tomorrow as they shift to the March contract. If we get a bounce, the down markets may be done for now. If they go after the March contract, we could see another month of trouble. ..."
Congratulations to Riyadh for bringing North Dakota and Alberta to
their knees, and giving their pals on Wall Street the opportunity for
the heist of a lifetime.
Too bad for them that picking off Russia and Iran and letting Wall
Street walk off with Eurasia's oil won't be nearly as easy.
While we wait for Putin to win the oil war and rid the world of the
Saudis, the smart money will be ignoring what the Davos crowd say and
do as they do---going long oil now we know North American supply is
about to start contracting in earnest.
Regardless of what the MSM pundits tell you this oil crash has
nothing to do with Saudi Arabia. If you remember correctly when oil
was pushing $140 these same jerks said the Saudis didn't have the
capacity to bring down the price of oil, and now we're supposed to
believe they're the cause of the current price collapse? No, this
is all about China and their collapse. You can only build so many
empty cities.
February oil contract closes today. Watch for a big bounce tomorrow
as they shift to the March contract. If we get a bounce, the down
markets may be done for now. If they go after the March contract, we
could see another month of trouble.
YORKTOWN, Texas (Reuters) - Across oil fields from Texas to North Dakota fears are growing that crude's
plunge below $30 a barrel is more than just another market milestone and marks a countdown to an endgame
for many shale producers that so far have braved the 18-month downturn.
Oil prices tumbled by more than a fifth this month to 12-year lows 70 percent below mid-2014 levels
and traders brace for more declines as world production keeps outpacing demand.
Yet many of around 50 listed U.S. independent oil producers and scores of smaller ones need $40-$60
a barrel to break even, according to several analyst. A longer spell of $30 oil will confront them with
stark choices: bankruptcy, debt writedowns in return for deep concessions to creditors or fire sales
of assets at a time when potential buyers are skittish.
"There's no place to make cuts anymore. There's not much else you can do now. Companies are losing
money on a monthly basis. It's bad everywhere," said Raymond Lasseigne, president of privately-held
TMR Exploration in Bossier City, Louisiana. "I went through the bust in the 1980s and it's beginning
to feel like that again."
The deepest downturn of the pre-shale era lasted five years and it took two decades for prices to
fully recover.
In the heart of the Eagle Ford formation in south Texas, where the fracking boom unlocked vast supplies,
contributing to the global abundance that is now sinking prices, some say the latest plunge may be just
too much.
"We're going to reach a breaking point here," said Jill Potts, an owner of Summit Oilfield Supply
in Cuero, Texas. Her business sells valves, fittings, hoses and other equipment to shale companies and
so is exposed to the industry's ups and downs. "If anybody says they are making money in the oilfield
they are lying," Potts said.
The once crowded trailer parks housing workers are nearly deserted, stacks of drill pipes rust and
idled rigs spread over acres lay down on their sides.
NO LEVERS
Since the downturn started, agile independents have slashed spending 50-70 percent, steered drilling
rigs to sweet spots and fracked wells more intensely to lift output.
Barclays estimates cuts will reach $73 billion by the end of 2016 and most producers by now have
run out of levers to pull while hopes for a near-term recovery are all but vanishing.
"Folks who never thought about bankruptcy or a Plan B, are starting to," said Charles Beckham, a
restructuring law partner at Haynes & Boone in Houston, noting a recent uptick in business.
For many the crunch time may come in April during the semi-annual reviews of banks' lending to the
energy sector. Last October, many lenders mostly maintained their credit lines because oil futures at
the time signaled prices would recover this year.
In the last few weeks, however, U.S. benchmark futures have tumbled to average around $33 a barrel
for this year, nearly a third below the $47 a barrel 2016 forecast banks had several months ago, suggesting
a credit pullback.
Major U.S. banks are already boosting provisions for troubled energy loans.
"There will be more moves to tell borrowers to bring assets to the marketplace," one energy lender
at a regional bank said.
Falling prices force producers to write down the value of their main assets - oil and gas reserves
- that serve as a basis for lending and company valuations.
For example, Devon Energy Corp has over the past year taken $15.5 billion in non-cash charges.
Investment bankers say the equity and bond markets have already shut for all but few issuers, such
as Pioneer Natural Resources , which sold $1.4 billion worth of shares this month.
Hedges, which shielded producers from the worst of the slump last year, are expiring and a depressed
outlook means companies have a harder time locking in higher prices for future production. Estimates
from Reuters and Bank of America Merrill Lynch show U.S. producers hedged a third or less of projected
2016 output.
WORSENING SQUEEZE
Investors are also balking at companies' efforts to swap short-dated debt for longer maturities.
Citi estimates exploration and production firms have $109 billion in outstanding high-yield debt maturing
through 2025.
Only $500 million of bonds mature this year before payments start piling up to peak at $10
billion in 2019.
The bad news is that borrowers struggle just making interest payments. Energy Information Administration
data shows that U.S. companies with onshore oil operations used 80 percent of operating cash flow for
debt service in the second quarter.
With prices nearly $25 lower now, the squeeze has only gotten worse. High-yield energy bond spreads
hit record highs last week and analysts at Bernstein Research warn a third of listed U.S. oil exploration
and production companies were now at risk of bankruptcy.
Wells Fargo argues that oil below $40 is "not sustainable for virtually any producer," predicting
a wave of deals with creditors and bankruptcies in the next 12 to 18 months.
"(The) further prices fall from breakevens, the better the argument for just going ahead and restructuring,"
said James Spicer of the bank's high yield research group.
In the Eagle Ford's DeWitt county, some pumpjacks, the so-called nodding donkeys, sit idle, a possible
sign that for some producers prices no longer even cover operating costs.
"A lot of them are just burning cash at these prices," said Christian Ledoux, senior portfolio manager
at South Texas Money Management. "Either they shut-in the wells and they don't produce at all or they
close down the business entirely."
With no bottom for crude in sight, most potential company or asset sales are on hold, dealmakers
in Houston say. But even if there were buyers, debt-laden producers might be better off filing for bankruptcy
and starting with a clean slate, they say, instead of selling off reserves to settle with creditors
and ending up with nothing to drill.
(Reporting By Terry Wade and Anna Driver; Additional reporting by Swetha Gopinath in Bangalore and
Mike Stone and Jessica Resnick-Ault in New York; Editing by Tomasz Janowski)
So this is "glut" not Saudis discounting their oil ;-). "Trust but verify" ;-) if you see
such MSM coverage. .
Notable quotes:
"... U.S. oil futures crashed below $27 dollars a barrel on Wednesday for the first time since 2003, caught in a broad slump across world financial markets as traders worried that a huge oversupply in oil was coinciding with an economic slowdown, especially in China. ..."
"... In early Thursday trading, oil prices stabilized, with front-month West Texas Intermediate (WTI) crude futures (CLc1) trading at $28.70 per barrel at 0021 GMT (1921 EDT). ..."
SINGAPORE (Reuters) - U.S. crude oil prices stabilized in early Asian trade on Thursday after
hitting fresh 2003 lows the session before, but analysts said a persistent global glut would keep
pressuring markets.
U.S. oil futures crashed below $27 dollars a barrel on Wednesday for the first time since
2003, caught in a broad slump across world financial markets as traders worried that a huge
oversupply in oil was coinciding with an economic slowdown, especially in China.
In early Thursday trading, oil prices stabilized, with front-month West Texas Intermediate (WTI)
crude futures (CLc1) trading at $28.70 per barrel at 0021 GMT (1921 EDT).
That was over $2 above its last close, although traders said that the jump was misleading due to
the roll-over of front-month contracts overnight.
Yet broader market sentiment remained bearish as producers around the world pump 1-2 million
barrels of crude every day in excess of demand, creating a huge storage overhang.
"We believe prices are likely to come under more pressure after the release of EIA inventory
data," ANZ bank said on Thursday.
The U.S. Energy Information Administration is due to publish official storage data later in the
day.
Nexen's Long Lake oil sands facility had an explosion at a compressor last Friday. One man was
killed others injured. This 50,000 bopd project has been shut down for an indefinite time.
"... The current situation with oil prices only indirectly connected with oversupply of oil on world markets that is discussed to such length by AlexS, who is kind of obsessed with finding the balance of supply and demand in some future point by analyzing supply and demand data from available sources (which are probably pretty fuzzy). That's an important part of the story but this not the whole story. ..."
"... The third factor are economic pressures of "secular stagnation" in which all G7 economies found themselves with high oil prices (but not only because of high oil prices; other factors are involved too). This is perfect (albeit temporary) solution for this problem. That's why MSM are supporting glut theory like crazy. They know who butter their bread. ..."
"... Destabilization of financial system with "naked" commodity trading, derivatives and HFT also plays a role. It well can be the Saudis started this mess hoping to bring prices to say $60-$70 level and then it went out of control due to those mechanisms. ..."
My guess is that the data charted will be different than the reality as it unfolds. However, who
among us will have a clue about those differences. The relevant point that Carl makes though is
that it may take YEARS before these spending cuts will be seen in the production numbers.
"Of course, these spending cuts will reduce production. The next question is when"
Market
behavior is about future, not present. So this news increases the possibility of the short squeeze
of reckless speculators (and HFT computers) in futures. I sometimes wonder who is shorting oil
at below $50 level.
The current situation with oil prices only indirectly connected with oversupply of oil on world
markets that is discussed to such length by AlexS, who is kind of obsessed with finding the balance
of supply and demand in some future point by analyzing supply and demand data from available sources
(which are probably pretty fuzzy). That's an important part of the story but this not the whole
story.
There are other important factors and first of all Saudis dumping of oil. Such behavior would
move market quickly down even with zero oversupply. That's important to understand.
The second important factor is incorrect accounting for oil reserves (absence of separation
of oil and condensate) which might be deliberate. Which create wrong signal to traders, who in
turn are subject to crowd psychology. In other words this facilitates artificial panic (with significant role played by MSM, remember all those crazy stories that we can run out of storage). My impression
is that the "glut" and excessive volumes in storage are mainly about condensate, not so much for
"real" oil.
The third factor are economic pressures of "secular stagnation" in which all G7 economies found
themselves with high oil prices (but not only because of high oil prices; other factors are involved
too). This is perfect (albeit temporary) solution for this problem. That's why MSM are supporting
glut theory like crazy. They know who butter their bread.
Destabilization of financial system with "naked" commodity trading, derivatives and HFT also
plays a role. It well can be the Saudis started this mess hoping to bring prices to say $60-$70
level and then it went out of control due to those mechanisms.
And of cause geopolitical factors can't be discounted as well. Especially plausible are "Economic
war with Russia" theories as this is an official policy of Obama administration. In any case,
explanation of Saudis behavior by pure desire to preserve market share is very unconvincing.
So oversupply might well be not even the most important factor in all this mess.
"... Poor article, not too much logic. I recall whilst working in Saudi Arabia in the mid 1980's when oil dropped to around $25. We sacked about 15% of staff overnight and curtailed capital projects. At the time Saudi Aramco's zero based budget level was $15 and a reported cost of about $1 to get it out of the ground. We had been experimenting with solar panels from about 1983 so none of this new. ..."
"... What happened in two years to make an alternative energy source that was then not competitive with oil of gas powered plants - when the cots of both oil and gas was so much higher - so competitive now? ..."
"... The Saudis could use their enormous and uninhabitable deserts for the world's best, and possibly safest way, to store nuclear waste. ..."
"... @mattwookey - the internet is something of a smorgasbord of competing claims, almost none of which can be held to task by the viewer. All news now is chacun a son gout and I hope I spelled that correctly. ..."
Since 2000, energy demand among the Middle Eastern oil producers
has grown at 5% a year, outstripping China and India. Saudi Arabia, the world's biggest oil
exporter, is now the seventh largest consumer of fossil fuels, according to
a report from Irena published on Wednesday.
Mod Mark -> newschats4 20 Jan 2016 13:40
The Saudis could use their enormous and uninhabitable deserts for the world's best,
and possibly safest way, to store nuclear waste.
Lets skip that one. When Gen 4 nukes arrive, that "nuclear waste" can be sold as fuel.
In the US, storing the partial used fuel using the dry cask system is working quite well.
Rinkaiso 20 Jan 2016 13:00
Poor article, not too much logic. I recall whilst working in Saudi Arabia in the mid
1980's when oil dropped to around $25. We sacked about 15% of staff overnight and curtailed
capital projects. At the time Saudi Aramco's zero based budget level was $15 and a reported
cost of about $1 to get it out of the ground. We had been experimenting with solar panels from
about 1983 so none of this new.
newschats4 20 Jan 2016 12:56
Not two years ago I visited the site of about 15 wind turbines in Washington, NH that was
also holding a fundraising event for the station. I was not permitted to attend the event
because I wasn't invited. What happened in two years to make an alternative energy source
that was then not competitive with oil of gas powered plants - when the cots of both oil and
gas was so much higher - so competitive now?
BTW - The Saudis could use their enormous and uninhabitable deserts for the world's best,
and possibly safest way, to store nuclear waste. Those deserts were considered, and still
are, inhospitable to human life in Lawrence of Arabia's day and a quick look at Google earth
doesn't contradict that statement. But nuclear was a power source that, in it's infancy no one
considered had any problems. I recall Scientific American books my father had in the late
1950s that discussed it and all they saw was nuclear power's enormous advantage over the use
of coal. They loved figures like one pound of enriched uranium was the equivalent of a mile
long coal train (I'm can't quite recall the number of cars). They didn't once discuss the
problem of waste disposal.
@mattwookey - the internet is something of a smorgasbord of competing claims, almost none
of which can be held to task by the viewer. All news now is "chacun a son gout" and I hope I
spelled that correctly.
But perhaps you don't like living in a customized digital hallucination any more than I do?
What's the point of having a human memory anymore?
"... With oil falling below $30 a barrel and domestic drillers expected to face a $100 billion cash shortfall this year, its almost certain that capital market investors wont engineer a second bailout of the U.S. shale industry, especially after last years ill-fated multibillion-dollar bet that crude prices would recover and bolster the oil companies offering cheap new shares. ..."
"... You have a massive amount of fear in the market, said Sean Wheeler, a partner at the law firm Latham Watkins in Houston. Investors, he said, arent willing to park their cash in oil companies while crude prices are volatile. No one wants to catch the falling knife. ..."
"... But, if capital markets are open to the healthiest drillers even now, falling U.S. shale production may have a backstop that many havent anticipated. Goldman Sachs has warned that crude prices will have to drop to $20 a barrel to curb production from large, relatively healthy independent oil producers that pump about 85 percent of the nations crude. ..."
"... So far, the petroleum industry has scrapped about $380 billion in new projects around the world and has delayed 2.9 million barrels of new crude production, according to Wood Mackenzie. But, the Permian is still pumping greater volumes of crude despite a 19-month oil-price downturn, while oil fields in South Texas and North Dakota have forfeited hundreds of thousands of oil barrels a day. ..."
"... IHS estimates that for the most prolific Permian wells, production has climbed 40 percent in the past year. ..."
"... The region needs $45 to $55 oil to spur normal drilling activity. Production in the Permian, Gallagher said, is likely to begin sinking within the next three months - punctuating the end of the U.S. oil boom. ..."
For the troubled U.S. oil industry, Wall Street is closed.
Nearly.
Yet, three domestic drillers - Pioneer Natural Resources, Diamondback Energy and Parsley Energy
- raised $1.8 billion selling shares to investors in recent weeks.
In a business based on gambling millions of dollars on holes in the ground, the trio had a lucky
streak with the rocks in the Permian Basin, a region in West Texas that oil companies and investors
believe will be the most prolific in coming years.
"There's decades' worth of drilling," said Joey Hall, executive vice president of Permian operations
at Irving-based Pioneer. "The wells continue to get cheaper. You're able to get more bang for your
buck."
The three successful stock offerings represented a rare break in a lull of activity between public
capital markets and the industry that once amassed hundreds of billions from investors to spur a
nationwide energy surge.
With oil falling below $30 a barrel and domestic drillers expected to face a $100 billion
cash shortfall this year, it's almost certain that capital market investors won't engineer a second
bailout of the U.S. shale industry, especially after last year's ill-fated multibillion-dollar bet
that crude prices would recover and bolster the oil companies offering cheap new shares.
"You have a massive amount of fear in the market," said Sean Wheeler, a partner at the law
firm Latham & Watkins in Houston. Investors, he said, aren't willing to park their cash in oil companies
while crude prices are volatile. "No one wants to catch the falling knife."
Investors are still attracted to the Permian, however, because it has been active for decades.
It has a concentration of oil field services companies and pipeline operators that have much more
energy infrastructure in place than in the typical remote shale play, keeping costs lower there,
said Matt Metts, a partner at law firm Sidley Austin in Houston.
Eagerly watching
But, if capital markets are open to the healthiest drillers even now, falling U.S. shale production
may have a backstop that many haven't anticipated. Goldman Sachs has warned that crude prices will
have to drop to $20 a barrel to curb production from large, relatively healthy independent oil producers
that pump about 85 percent of the nation's crude.
Traders around the world are watching the U.S. crude inventory and its oil production for signs
that the global oil glut could ease, which would lift oil prices and fortunes for many in Houston's
oil hub. More oil would only delay a recovery expected later this year.
So far, the petroleum industry has scrapped about $380 billion in new projects around the
world and has delayed 2.9 million barrels of new crude production, according to Wood Mackenzie. But,
the Permian is still pumping greater volumes of crude despite a 19-month oil-price downturn, while
oil fields in South Texas and North Dakota have forfeited hundreds of thousands of oil barrels a
day.
Put together, the Permian's oil formations are 4,000 feet thick and hold more crude than any other
region in the nation. Drillers say they're still finding better rocks and new areas where it's easier
to pump crude. The region's best-performing wells - about 20 percent of the total - are profitable
even with crude prices in the low $30-a-barrel range, according to research firm IHS.
"The Eagle Ford and the Bakken are a little more stagnant and stable, but we're still seeing improvements
with all the plays in the Permian," said Jerry Eumont, managing director of upstream research at
IHS. "The economics continue to improve."
New life for an old field
... ... ...
Gallagher said if the industry hadn't made the shift to more advanced drilling technologies, the
Permian wouldn't be able to operate with crude prices under $50 a barrel. Even now, the lofty 50
percent returns that came with $100 oil have vanished.
But in the past year, engineers have been able to vastly improve the economics of their new horizontal
wells, figuring out where to drill to get the most oil possible and shortening the time it takes
to get many oil-drilling processes finished. IHS estimates that for the most prolific Permian
wells, production has climbed 40 percent in the past year.
The Permian has more than 185,000 wells, but only about 10 percent of them were drilled horizontally,
and with hundreds of thousands of potential drilling locations, that could grow and dramatically
increase the region's output capacity. Still, crude production in the Permian can't grow forever
with oil prices languishing around $30 a barrel.
U.S. benchmark West Texas Intermediate crude - the grade typically drawn from Permian wells -
ended Friday trading at $29.42, down $1.78.
The region needs $45 to $55 oil to spur normal drilling activity. Production in the Permian,
Gallagher said, is likely to begin sinking within the next three months - punctuating the end of
the U.S. oil boom.
Parsley's Gallagher tapped capital markets three times last year, but the executive said even
now it's difficult to raise cash. Investors are picking "winners and losers" based on their health
and position, and there are few winners.
"... My guess is that the surplus of condensate and blended dumbell crudes has been stacking up in storage tanks, especially in the US, cutting the amount of working storage available to purchasers. Lack of storage increases the sensitivity of the market price to supply/demand imbalance magnitude. If a purchaser of oil has plenty of cheap storage, they might purchase oil they cant use today at a slight discount and save it for future use. If they have no storage they wont buy it at all, no matter how low the price. ..."
"... I never could understand why NGLs are included in oil production in the EIA stats ..."
"... only 13% of NGLs can be blended with gasoline (the pentane). ..."
"... the available data strongly suggest that we have been on an Undulating Plateau in actual global crude oil production since 2005, while global natural gas production and associated liquids, condensate natural gas liquids, have so far continued to increase. ..."
"... Again, what the EIA calls Crude oil is actually Crude + Condensate (C+C), and based on EIA data 22% of Lower 48 C+C production in 2015 exceeded 45 API gravity and about 40% of US Lower 48 C+C production exceeded the maximum API limit for WTI crude (42 API Gravity). ..."
My guess is that the surplus of condensate and blended "dumbell crudes" has been stacking
up in storage tanks, especially in the US, cutting the amount of working storage available to
purchasers. Lack of storage increases the sensitivity of the market price to supply/demand imbalance
magnitude. If a purchaser of oil has plenty of cheap storage, they might purchase oil they can't
use today at a slight discount and save it for future use. If they have no storage they won't
buy it at all, no matter how low the price.
Kurt, are you saying that the apparent oil glut is mostly NGL's and not oil? Also, are NGL's
what make it appear that oil storage is full? I never could understand why NGL's are included
in oil production in the EIA stats, since only 13% of NGL's can be blended with gasoline
(the pentane).
The rest is ethane, butane, propane, and isobutane -- mainly useful for petrochemicals, plastics,
and heating (propane).
I think all the endless electric car nonsense is effective at distracting people from the heavy-duty
transportation that really matters. Virtually everything in our homes, everything in our stores,
got there on a truck. Prior to that, 90 percent of those items were transported on a ship and/or
a train, which all run on finite oil. If trucks, trains, and ships stopped running, our global
economy and way of life would stop too.
First, I find myself hitting your site regularly since so many people refer to your work. So,
thanks for the great work you are doing.
As for condensates and NGLs, terminology in this case is the enemy of clarity. For a good treatment
of this problem
How the changing definition of oil has deceived both policymakers and the public . NGLs generally
refer to both natural gas plant liquids and lease condensate which originate from two different
sources, i.e. gas wells vs. oil wells. And, yes, part of the storage issue is the storage of lease
condensate since it is often, as indicated, mixed with crude oil. Natural gas plant liquids come
from natural gas processing plants and so are not typically stored in combination with crude oil
(though in gasoline refining, butane is usually mixed in with gasoline).
Yes, propane and butane, are used for transportation fuels. But their supply is limited by
the amount of natural gas demand. No one withdraws natural gas from wells solely for the propane
or butane it contains. There are practical limits to how many propane-powered vehicles we can
have.
Now, if we didn't make certain chemicals from natural gas plant liquids, we would be making
them from oil, and so in an indirect way this keeps more oil in the liquid fuels market rather
than the petrochemical market. But I think the substitution effect here is exaggerated by those
saying we should consider all liquids as part of the oil supply. As I said in the piece, the marketplace
certainly makes distinctions between these products.
I think you are right about truck freight being crucial to our current way of living. I remember
an exchange with an Italian reader who explained that while European passenger rail is far superior
to that of the United States, one reason for this is often not understood. Much of the freight
in the United States moves by rail at some point and so our tracks are filled with freight trains
that delay passenger travel. In Europe 80 percent of the freight moves by truck. The rails are
not so burdened with freight and so passenger trains move with fewer delays and at higher speeds.
But in both places truck freight remains crucial. Best of luck with your new book.
Condensate is basically natural gasoline, and it is a byproduct of natural gas production.
However, the issue of relative quality, between crude and condensate, is a little bit of a red
herring.
The CC's (Cornucopian Crowd) argue that there is no sign of any kind of peak in sight. I would
argue that this assertion is manifestly false when it comes to actual crude oil production (45
API and lower crude oil). In my opinion, the available data strongly suggest that we have
been on an "Undulating Plateau" in actual global crude oil production since 2005, while global
natural gas production and associated liquids, condensate & natural gas liquids, have so far continued
to increase.
Again, what the EIA calls "Crude oil" is actually Crude + Condensate (C+C), and based on
EIA data 22% of Lower 48 C+C production in 2015 exceeded 45 API gravity and about 40% of US Lower
48 C+C production exceeded the maximum API limit for WTI crude (42 API Gravity).
"... The EIA (U.S. Energy Information Administration) reported that the US gasoline inventory rose by 8.4 MMbbls to 240.4 MMbbls for the week ending January 8, 2016. This rise was less than the rise of 10.6 MMbbls during the week ending January 1, 2016. Similarly, the US distillate inventory rose by 6.1 MMbbls to 165.6 MMbbls for the week ending January 8, 2016. ..."
The EIA (U.S. Energy Information Administration) reported that the US gasoline inventory rose
by 8.4 MMbbls to 240.4 MMbbls for the week ending January 8, 2016. This rise was less than the rise
of 10.6 MMbbls during the week ending January 1, 2016. Similarly, the US distillate inventory rose
by 6.1 MMbbls to 165.6 MMbbls for the week ending January 8, 2016.
EIA's gasoline and distillate inventories by region
The EIA added that of the five major US storage hubs, the Gulf Coast, the Midwest, and the East
Coast recorded the highest gasoline inventories for the week ending January 8, 2016. To learn more
about the US storage hubs, read the previous part of this series. Gasoline inventories in these regions
came in at 82.6 MMbbls, 57.6 MMbbls, and 62.9 MMbbls, respectively.
Similarly, distillate inventories were highest in the Gulf Coast, the Midwest, and the East Coast
regions. The US distillate inventories were 48.1 MMbbls, 33.3 MMbbls, and 64.9 MMbbls, respectively,
in these three regions.
EIA's gasoline and distillate inventory estimates and impact
Reuters' surveys estimated that the US gasoline inventory would rise by 2.7 MMbbls and the US
distillate inventory would rise by 2 MMbbls for the week ending January 8, 2016. The greater-than-expected
rise in refined products inventories weighed on crude oil prices. Lower crude oil prices benefit
US refiners like Phillips 66 (PSX), Western Refining (WNR), Alon USA Partners (ALDW), and Northern
Tier Energy (NTI). On the other hand, higher refined products inventories put pressure on refiners.
The refined products inventories rose due to the fall in retail demand this winter season. Read about
refinery demand in the fifth part of this series.
The fall in retail and refinery demand also affects crude oil prices and oil producers like Chevron
(CVX), Whiting Petroleum (WLL), and Continental Resources (CLR). ETFs like the ProShares UltraShort
Bloomberg Crude Oil ETF (SCO), the Vanguard Energy ETF (VDE), and the First Trust Energy AlphaDEX
Fund (FXN) are also affected by the ups and down in the oil market.
Read why US crude oil production is crucial for the global crude oil market in the next part of
this series.
[Jan 20, 2016] The US dollar survived the collapse of Bretton Woods because its use in crude oil transactions made it the king of reserve currencies
Notable quotes:
"... In 1973, the U.S. made a pact with the Saudi King to conduct all crude oil trades in U.S. dollars-in return for U.S. protection of its oil fields. Because of the global hunger for crude, the demand for U.S. dollars experienced a similar, sustained hunger. ..."
"... If the dollar obstructs your path to victory, then you must find another path. It is not in the nature of mankind to acquiesce to perpetual subordination. ..."
"The US dollar survived the collapse of Bretton Woods in the '70s because its use in crude
oil transactions made it the king of reserve currencies, but can it survive a collapse of petro
dollars? Can the world survive the catastrophic geopolitical consequences that would follow?"
"In 1973, the U.S. made a pact with the Saudi King to conduct all crude oil trades in U.S.
dollars-in return for U.S. protection of its oil fields. Because of the global hunger for crude,
the demand for U.S. dollars experienced a similar, sustained hunger."
These things will not occur for economically favorable reasons. They occur because someone seeks
non economic dominance/victory.
If the US dollar is a source of US dominance, then US enemies have no reason to participate
in such a thing. They can insist on some other method of payment while explicitly removing their
currency (or that method) specifically from currency or goods exchange markets that would attempt
to link them to the dollar.
It's common sense. If the dollar obstructs your path to victory, then you must find another
path. It is not in the nature of mankind to acquiesce to perpetual subordination.
"... Rystad energy had a press release on Dec. 1,2015 where they estimated 3500 remaining at year-end.
..."
"... If the cost of completion really IS in the neighborhood of four or five million bucks, including
the frack job, and all the other smaller items, it does not seem likely- unless the completion money
is borrowed from idiots at a couple of percent, and the idiots lose their asses, unless Uncle Sam bails
them out. ..."
"... With the industry in such a bad slump, the cost of completion is no doubt down substantially,
but it is hard to imagine it falling by more than maybe a quarter or a third, max. ..."
Rystad energy had a press release
on Dec. 1,2015 where they estimated 3500 remaining at year-end. They have some tracking system
but its normally behind their pay wall. Go to their website, press release, Dec. 1, 2015. That
the best info I've seen.
This is the first time I have visited Rystad. I am impressed with the quality of the interviews
and press releases.
Now I am wondering if the owners of these wells can generate any cash, short term, by putting
them into production. If the cost of completion really IS in the neighborhood of four or five
million bucks, including the frack job, and all the other smaller items, it does not seem likely-
unless the completion money is borrowed from idiots at a couple of percent, and the idiots lose
their asses, unless Uncle Sam bails them out.
With the industry in such a bad slump, the cost of completion is no doubt down substantially,
but it is hard to imagine it falling by more than maybe a quarter or a third, max.
Does anybody have a current figure for completion costs?
"... According to Bukar, extracting a barrel of oil in Nigeria costs between $24 and $25 on average but sometimes will cost more. "For some fields, the production cost is well above $25, maybe $28," he said. "For some fields it is well below $20 and $25. Many of the older fields … have got high production costs." ..."
"... The low oil price also threatens to delay several deep-water projects planned off Nigeria's coast, long a mainstay of Nigerian production. Adeola Elliott, the CEO of Petrosystem Nigeria Ltd, said, "What [international oil companies] have done now is to just keep maintaining the facility they have now and producing what they [are] producing now. There is no more new investment." ..."
"The unit technical cost of many of our producers is not far from $30 per barrel," said Bukar,
the project director for the Uquo gas field development, a joint venture project by Frontier Oil
Limited and Seven Energy. "So many companies are in trouble."
According to Bukar, extracting a barrel of oil in Nigeria costs between $24 and $25 on average
but sometimes will cost more. "For some fields, the production cost is well above $25, maybe $28,"
he said. "For some fields it is well below $20 and $25. Many of the older fields … have got high
production costs."
The low oil price also threatens to delay several deep-water projects planned off Nigeria's coast,
long a mainstay of Nigerian production. Adeola Elliott, the CEO of Petrosystem Nigeria Ltd, said,
"What [international oil companies] have done now is to just keep maintaining the facility they have
now and producing what they [are] producing now. There is no more new investment."
Nigeria is the leading producer of oil in Africa, and relies on its oil for most of its revenues
from exports and its national budget. In the past several years its average production has ranged
between 1.9 million barrels of oil per day and 2.3 million barrels per day.
Consumption to increase 270,000 bpd in 2017, production to fall from 9,400,000 bpd to 8,500,000
bpd, appears as though imports will increase 1,170,000 bpd after 2017.
The US will be importing 10,000,000 plus bpd in 2017.
"... that would be a decrease in output of 1.3 Mb/d from North America alone, all of non-OPEC output is about 47 Mb/d for 2015, if that output fell by only 5% we would see a 2.35 Mb/d drop in C+C output, possibly Iran will increase by 500 kb/d, which would leave World output 1.85 Mb/d lower on the assumption that oil prices remain under $30/b. ..."
Although we do not formally forecast OPEC oil production, in a scenario whereby Iran adds
600 kb/d to the market by mid-year and other members maintain current output, global oil supply
could exceed demand by 1.5 mb/d in the first half of 2016. While the pace of stock building eases
in the second half of the year as supply from non-OPEC producers falls, unless something changes,
the oil market could drown in over-supply. So the answer to our question is an emphatic yes. It
could go lower.
I just don't see how oil supply remains as high as the IEA forecasts with oil prices between
$15 and $25/b, at these prices the OPEX of much of North American oil production is not covered
and a lot of production may be shut in where possible. North American C+C output was about 13
Mb/d in the 2nd quarter of 2015, let's assume the full year average for 2015 is close to this
level and that in 2016 output falls by 10% if oil prices remain under $30/b for the first 2 quarters
of 2016, that would be a decrease in output of 1.3 Mb/d from North America alone, all of non-OPEC
output is about 47 Mb/d for 2015, if that output fell by only 5% we would see a 2.35 Mb/d drop
in C+C output, possibly Iran will increase by 500 kb/d, which would leave World output 1.85 Mb/d
lower on the assumption that oil prices remain under $30/b.
Eventually the drop in output will draw down inventories by 675 Mb over 365 days and I imagine
oil prices would recover.
So prices may go lower, but they will not remain low for long.
The idea that Iran can add 600 kb/d midyear is also extremely optimistic, probably 50% overoptimistic.
In any case increase will be by-and-large in condensate, not oil.
Reality is catching up with the Iran-Oil-Export-Boom-Apocalypse.
January 14 Bloomberg released the results of a survey of twelve analysts and economists,
including from UBS and Saxo Bank A/S, on their estimates of the increase in Iranian crude output
over the next year. Their median estimate was 100,000 barrels/day in the first month, 400,000
barrels in six months, and 680,000 within a year.
One Norwegian analyst, Per Magnus from Nysveen, Rystad Energy AS, citing the need to add
production equipment, put the increase at just 150,000 within 6 months, and 250,000 in a year.
OPEC January report came out yesterday – based on secondary sources pretty well all the OPEC countries
production is down m-o-m. To me that looks like everybody has been producing flat out and there
is no spare capacity (and also, based on the recent decline rates, that none of them has as much
oil as they claim). For non-OPEC they expect 2 mmbpd new production this year based on projects
coming on-line which were sanctioned during the high price period, but overall expect production
to be down, mostly due to North America decline. I expect there will be a new post that shows
it more clearly with the historical charts.
Kazakhstan and China announce cut in production in 2016, not much but will cut 50-100 kb/d if
i see good. Non-opec supply drop will be greater than what IEA and EIA said, 800 kb/d-1 mb/d down.
Also, i think, demand will be greater. IEA badly miss projections for demand growth for 2015 in
December 2014. IEA said, 1.2 mb/d demand growth i will put that number in 1.4-1.5 mb/d.
"... One Norwegian analyst, Per Magnus from Nysveen, Rystad Energy AS, citing
the need to add production equipment, put the increase at just 150,000 within 6
months, and 250,000 in a year. ..."
"... Wall Street Journal ..."
"... Iranian officials are studying barter deals involving European goods, investment
in foreign refineries, and switching the benchmark to price Irans petroleum, hoping
it will lock customers into special relationships. ..."
"... it may take nine months before Iran signs its first new oil-export deals
(Iran has contracts in place with some countries, including China and India). ..."
"... Financing may prove difficult, as U.S. terrorism-related sanctions remain
in place and major international banks, some of which paid US$ billions in fines
for violating sanctions, ..."
Reality is catching up with the Iran-Oil-Export-Boom-Apocalypse.
January 14 Bloombergreleased the results of a survey of twelve analysts and economists,
including from UBS and Saxo Bank A/S, on their estimates of the increase in
Iranian crude output over the next year. Their median estimate was 100,000 barrels/day
in the first month, 400,000 barrels in six months, and 680,000 within a year.
One Norwegian analyst, Per Magnus from Nysveen, Rystad Energy AS, citing
the need to add production equipment, put the increase at just 150,000 within
6 months, and 250,000 in a year.
In addition, Iran is realizing the difficulty it will experience in attempting
to market its incremental output without negatively impacting pricing. The
Wall Street Journal
reported January 15 that Iranian officials are "studying barter deals
involving European goods, investment in foreign refineries, and switching the
benchmark to price Iran's petroleum," hoping it will "lock customers into special
relationships."
Another Wall Street Journal
article details additional hurdles. It quotes Rokneddin Javadi, chief of
the state-owned National Iranian Oil Co., as saying that it may take nine
months before Iran signs its first new oil-export deals (Iran has contracts
in place with some countries, including China and India).
Financing may prove difficult, as U.S. terrorism-related sanctions remain
in place and major international banks, some of which paid US$ billions in fines
for violating sanctions, may be reluctant to risk another round of fines.
Low crude prices are also a disincentive for foreign oil companies.
... ... ...
In Iraq, increasing output from 2015's ~4.3 mb/d peak-perhaps even maintaining
output at these levels-could prove difficult. Low crude prices and the cost
of fighting the Islamic State forced Iraq's oil ministry in September to warn
the foreign energy companies operating in its southern oil fields-including
Lukoil, BP, ENI, and Shell-that reimbursement funding for their work would be
cut.
Some companies' representative worried this would eliminate investment in
new production and limit spending to maintenance at best. In addition, completion
of the Common Seawater Supply Facility project, which is required to increase
production from the southern oil fields, has been pushed back to 2020. Without
it, according to Michael Cohen, Barclays head of energy commodities research,
production from these oilfields could decrease 10 percent annually.
... ... ...
In its December
Oil
Market Report, the IEA estimated that global demand will increase 1.2 mb/d
in 2016 to 95.8 mb/d, with China and Other Asia supplying two thirds of the
increase (0.8 mb/d).
The Supply-Demand Balance
Assuming demand at 95.8 mb/d, Russian exports falling 460,000 barrels/day,
U.S. output 500,000 barrels/day from 2015's peak, Iraq output 300,000 barrels/day
from its 2015 peak, and a wash for all other countries, crude demand would outpace
supply by ~160,000 barrels/day-before accounting for potential changes in Iranian
and Saudi production:
The problem here is that oil prices are different from stock prices. Nobody will produce any
additional oil at $20. Or $30 and just drop of capex can rebalance the market which actually is not
that unbalanced in any case. Just 1 Mb/dby most estimates. With drop of non-OPEC supply around 2
Mb/d and growth of consumption by 1.2-1.4 Mb/d this can happen in the second half of 2016. the only
country that plan to explain supply on the market is Iran, but their capability are limited by low
oil price too. Moreover most on new supply will be condensate as Iran is the major gas producing
country. Good chance that 2015 was the peak of oil production, as low price cripples
forward investment, reducing production in years ahead
Rowe Price New Era's Shawn Driscoll says the price for a barrel of oil could drop into
the teens. "Over the last few weeks, we've had several meetings [with producers] and there's just
no panic," he told me. "I would have said at $30 we ought to start seeing that."
"I can't get over how many people, CNBC, for example, ushers before the camera to say oil's
bottoming. This is not the psychology I would expect at $30 oil. There's an endless amount of
people who want to call the bottom," he continued. "There's not enough fatigue - investor
fatigue, management fatigue."
Is it denial? "With some people, it may be denial," he replied. "No one wants to look like a
fool where they do something drastic at the bottom. I think that's part of the psychology."
In fact, he said, "we've been thinking for a while that there's a perverse incentive to keep
drilling even while prices are falling … particularly when you're sitting on a lot of debt."
What could cause producers to throw in the towel? A major bankruptcy or series of bankruptcies
of deeply indebted energy companies, which becomes more and more likely as prices drop.
In its
Monthly Oil Market Report, issued Monday, OPEC said demand for
its crude averaged 29.9 million barrels per day in 2015, while the
group was producing an average of 31.85 million barrels per day
throughout the year.
This excessive production came despite
declines in output during the year by several leading OPEC members.
Saudi Arabia production dropped by 58,000 barrels per day to 10.1
million barrels per day by December 2015; Iraq's output was down
31,000 barrels per day to 4.3 million barrels per day; Kuwait's
drilling produced 23,000 fewer barrels per day, down to 2.7 million
barrels per day; and Nigerian production dropped by 77,000 barrels
per day to 1.8 million barrels per day.
Still, the oil glut persisted because such production decreases,
particularly in Saudi Arabia and Iraq, didn't balance with an even
lower demand from OPEC's customers. Saudi Arabia designed the
low-price strategy aimed at making oil production too costly
for competitors in North America and Russia, and has refused to
make more significant output cuts unless other producers agree to
do the same.
The 104-page OPEC report finds that there will be greater demand
for the group's oil in 2016, with customers consuming an average of
31.65 million barrels a day throughout the year because the market
will be "supply-driven" as competitors, beset by low prices,
continue to cut back severely on capital expenditures ranging from
exploration to new drilling.
"It will also be the year when the rebalancing process starts,"
the report said. "After seven straight years of phenomenal non-OPEC
supply growth, often greater than 2 [million barrels per day], 2016
is set to see output decline as the effects of deep capex cuts [by
non-OPEC producers] start to feed through."
Until a balance is restored between supply and demand, though,
Saudi Arabia is willing to endure the current low price of oil,
even as its own budget, heavily reliant on energy revenues, faces a
deficit of $98 billion, or 15 percent of gross domestic
product, for fiscal 2016.
Opec Monthly report.
One line from the report.
OECD commercial oil stocks fell in November to stand at 2,966 mb.
How are we oversupplied by 2-3 Million barrels per day when stocks fell in
November?
"... I think the EIA's AEO 2015 reference case oil prices seem reasonable, but their recent short
term forecast based on the oil futures market is likely to be incorrect. ..."
Do you think the EIA's forecast is correct? The EIA has not posted anything here,
but you have, I think the EIA's AEO 2015 reference case oil prices seem reasonable, but their
recent short term forecast based on the oil futures market is likely to be incorrect.
Just double checked AEO 2015 ref scenario, 2016 may be a little high, probably $50/b for an
average 2016 price is more reasonable.
"... Lease condensate consists of very light hydrocarbons which condense from gaseous into liquid
form when they leave the high pressure of oil reservoirs and exit through the top of an oil well. This
condensate is less dense than oil and can interfere with optimal refining if too much is mixed with
actual crude oil. ..."
"... Refiners are already complaining that so-called blended crudes contain too much lease condensate,
and they are seeking out better crudes straight from the wellhead. Brown has dubbed all of this the
great condensate con. ..."
"... what the EIA calls crude oil is actually crude plus lease condensate. ..."
"... the United States isnt producing quite as much actual crude oil as the raw numbers would lead
us to believe. This EIA chart breaking down the API gravity of U.S. crude production supports this view.
..."
"... Exactly how much of Americas and the worlds presumed crude oil production is actually condensate
remains a mystery. The data just arent sufficient to separate condensate production from crude oil in
most instances. ..."
"... Here it is worth mentioning that when oil companies talk about the price of oil, they are referring
to the price quoted on popular futures exchanges -- prices which reflect only the price of crude oil
itself. The exchanges do not allow other products such as condensates to be mixed with the oil that
is delivered to holders of exchange contracts. ..."
"... Which leads to a simple rule coined by Brown: If what youre selling cannot be sold on the world
market as crude oil, then its not crude oil. ..."
"... If Brown is right, we have all been victims of the great condensate con which has lulled the
world into a sense of complacency with regard to actual oil supplies--supplies he believes have been
barely growing or stagnant since 2005. ..."
"... Oil traders are acting on fundamentally flawed data, Brown told me by phone. ..."
"... it took trillions of dollars of investment from 2005 through today just to maintain what he
believes is almost flat production in oil. ..."
My favorite Texas oilman is at it again. In a recent email he's pointing out to everyone who will
listen that the supposed oversupply of crude oil isn't quite what it seems. Yes, there is a large
overhang of excess oil in the market. But how much of that oversupply is honest-to-god oil and how
much is so-called lease
condensate which gets carelessly lumped in with crude oil? And, why is this important to understanding
the true state of world oil supplies?
In order to answer these questions we need to get some preliminaries out of the way.
Lease condensate consists of very light hydrocarbons which condense from gaseous into liquid
form when they leave the high pressure of oil reservoirs and exit through the top of an oil well.
This condensate is less dense than oil and can interfere with optimal refining if too much is mixed
with actual crude oil. The oil industry's own engineers classify oil as hydrocarbons having
an API gravity of less than 45--the higher the number, the lower the density and the "lighter" the
substance. Lease condensate is
defined
as hydrocarbons having an API gravity between 45 and 70. (For a good discussion about condensates
and their place in the marketplace, read
"Neither Fish nor Fowl – Condensates Muscle in on NGL and Crude Markets.")
Refiners are already
complaining that so-called "blended crudes" contain too much lease condensate, and they are seeking
out better crudes straight from the wellhead. Brown has dubbed all of this the great condensate con.
Brown points out that U.S. net crude oil imports for December 2015 grew from the previous December,
according to the
U.S. Energy Information Administration (EIA), the statistical arm of the U.S. Department of Energy.
U.S. statistics for crude oil imports include condensate, but don't break out condensate separately.
Brown believes that with America already awash in condensate, almost all of those imports must have
been crude oil proper.
Brown asks, "Why would refiners continue to import large--and increasing--volumes of actual crude
oil, if they didn't have to--even as we saw a huge build in [U.S.] C+C [crude oil plus condensate]
inventories?"
Part of the answer is that U.S. production of crude oil
has been declining since mid-2015. But another part of the answer is that what the EIA calls
crude oil is actually crude plus lease condensate. With huge new amounts of lease condensate
coming from America's condensate-rich tight oil fields -- the ones tapped by hydraulic fracturing
or fracking -- the United States isn't producing quite as much actual crude oil as the raw numbers
would lead us to believe.
This EIA chart
breaking down the API gravity of U.S. crude production supports this view.
Exactly how much of America's and the world's presumed crude oil production is actually condensate
remains a mystery. The data just aren't sufficient to separate condensate production from crude oil
in most instances.
Brown explains: "My premise is that U.S. (and probably global) refiners hit in late 2014
the upper limit of the volume of condensate that they could process" and still maintain the product
mix they want to produce. That would imply that condensate inventories have been building faster
than crude inventories and that the condensate is looking for an outlet.
That outlet has been in blended crudes, that is heavier crude oil that is blended with condensates
to make it lighter and therefore something that fits the definition of light crude. Light crude is
generally easier to refine and thus more valuable.
The trouble is, the blends lack the characteristics of nonblended crudes of comparable density
(that is, the same API gravity), and refiners are discovering to their chagrin that the mix of products
they can get out of blended crudes isn't what they expect.
So, now we can try to answer our questions. Brown believes that worldwide production of condensate
"accounts for virtually all of the post-2005 increase in C+C [crude plus condensate] production."
What this implies is that
almost all of the 4 million-barrel-per-day increase in world "oil" production from 2005 through
2014 may actually be lease condensate. And that would mean crude oil production proper has been nearly
flat during this period -- a conjecture supported by record and near record
average
daily prices for crude oil from 2011 through 2014. Only when demand softened in late 2014 did
prices begin to drop.
Here it is worth mentioning that when oil companies talk about the price of oil, they are
referring to the price quoted on popular futures exchanges -- prices which reflect only the price
of crude oil itself. The exchanges do not allow other products such as condensates to be mixed with
the oil that is delivered to holders of exchange contracts.
But when oil companies (and governments) talk about oil supply, they include all sorts of things
that cannot be sold as oil on the world market including biofuels, refinery gains and natural gas
plant liquids as well as lease condensate. Which leads to a
simple rule coined by Brown: If what you're selling cannot be sold on the world market as crude
oil, then it's not crude oil.
The glut that developed in 2015 may ultimately be tied to some increases in actual, honest-to-god
crude oil production. The accepted story from 2005 through 2014 has been that crude oil production
has been growing, albeit at a significantly slower rate than the previous nine-year period--15.7
percent from 1996 through 2005 versus 5.4 percent from 2005 through 2014 according to the EIA.
If Brown is right, we have all been victims of the great condensate con which has lulled the
world into a sense of complacency with regard to actual oil supplies--supplies he believes have been
barely growing or stagnant since 2005.
"Oil traders are acting on fundamentally flawed data," Brown told me by phone. Often
a contrarian, Brown added: "The time to invest is when there's blood in the streets. And, there's
blood in the streets."
He explained: "Who of us in January of 2014 believed that prices would be below $30 in January
of 2016? If the conventional wisdom was wrong in 2014, maybe it's similarly wrong in 2016" that prices
will remain low for a long time.
Brown points out that it took trillions of dollars of investment from 2005 through today just
to maintain what he believes is almost flat production in oil. With oil companies slashing exploration
budgets in the face of low oil prices and production declining at an estimated
4.5 and 6.7 percent per year for existing wells worldwide, a recovery in oil demand might push
oil prices much higher very quickly.
That possibility is being obscured by the supposed rise in crude oil production in recent years
that may just turn out to be an artifact of the great condensate con.
"... Supreme Leader Ali Khameini has said Iran isn't ready to make big deals with U.S. oil companies. ..."
"... The current market turmoil has created a once in a generation opportunity for savvy energy investors. Whilst the mainstream media prints scare stories of oil prices falling through the floor smart investors are setting up their next winning oil plays. ..."
As the lifting of sanctions neared, it appeared that Iran, about to be re-integrated into the world
economy, was
tilting
toward closer relations with Russia, not with the United States. For example, until Saturday
Iran showed no inclination to release the American prisoners it was holding, and Supreme Leader Ali Khameini has said Iran isn't ready to make big deals with U.S. oil companies.
Meanwhile, Iran's
ties to Russia seemed to be warming. First, President Vladimir Putin was a special guest at the Nov.
23 Tehran summit of gas-exporting countries. Moscow has also been considering extending two loans
to the Iranian government worth a total of $7 billion, and Russia will equip Iran with modern air-defense
systems, according to country's financial daily, Kommersant.
Finally, Iran Shipbuilding & Offshore Industries Complex Co. (ISOICO) has reached a tentative
deal with the Russian shipyard Krasnye Barrikady, or Red Barricades, to cooperate in the construction
of oil rigs and share technology.
The current market turmoil has created a once in a generation opportunity for savvy energy investors.
Whilst the mainstream media prints scare stories of oil prices falling through the floor smart investors
are setting up their next winning oil plays.
If all these deals with Russia come to pass, Tehran and Moscow likely will fast become economic
and political allies, while the United States, and especially its large corporations, appear to be
left out of Iran's economic rebirth. Further, critics of the nuclear deal with Iran said that to
engage Tehran rather than fight it would merely make Iran twice the threat it already is to an unstable
Middle East.
Throughout the Vienna negotiations, the Obama administration argued exactly the opposite, that
to engage Iran was the best way to soften, if not eliminate, its hostility to the West, just as President
Richard Nixon's overtures to China in 1972 turned Beijing from a communist adversary into what President
George W. Bush once described as a "strategic competitor."
Saudi Oil Minister Ali al-Naimi said crude prices will rise and foresees that market forces
and cooperation among producing nations will lead in time to renewed stability.
... ... ...
OPEC forecast a steeper decline this year in supplies from outside the group as lower prices
affect producers in the U.S. and Canada. Non-OPEC output will drop by 660,000 barrels a day, the
group said Monday in its monthly market report...
OPEC is oversupplying markets by some 600,000 barrels a day, according to the report. This is
"the year when the re-balancing process starts," it said. The report made no reference to the
lifting of sanctions on Iran's oil exports.
JPMorgan Chase is setting aside an extra $124 million to cover potential losses in its oil and gas loans. It
warned that figure could rise to $750 million if oil prices unexpectedly stay at their current
$30 level for the next 18 months.
If oil stays around $30 a barrel, Citi is bracing for about $600 million of energy credit
losses in the first half of 2016. Citi said that figure could double to $1.2 billion if oil
dropped to $25 a barrel and stayed there.
"The missile precisely hit Aramco Oil Company on Monday night," Yemeni Army Spokesman
Brigadier General Sharaf Luqman said, reported Iran's semi-official Fars news agency citing
Arabic-language media outlets.
He added that the attack came in retaliation to the "Saudi-led aggressors' violation of
UN-sponsored ceasefire" but did not give any further details about damages that the plant
allegedly suffered.
Saudi Arabia confirmed the attack but said the missile had been intercepted by the kingdom's
air defense systems, state media report as cited by Reuters.
The Saudi Arabian Oil Company also denied a strike on its compound in Jazan Economic City
which is located 80 kilometers north of Jizan and about 150 kilometers from the border with
Yemen. All the facilities in the area managing "safe and normal operations", the company said.
"... Empirical evidence suggests that the oil burden (total amount of oil consumption X price of oil) becomes unaffordable for the global economy, when it reaches 5% of global GDP. At $65 it would be only between 2 and 2.5%. ..."
"... I agree $65/b average price seems too high, my guess would be $50/b for an average oil price, but $65/b by Dec 31 2015 seems possible, though I might guess $60/b for an average monthly price in Dec 2016. ..."
"... What is wrong with the global economy is that it is at the brink of global recession. The global economy was being sustained by strong debt-based growth in Chindia creating huge malinvestment there, manifested in ghost town projects. Whether China stabilizes or not, it is no longer capable of sustaining previous strong growth because of high indebtment and flow of capitals outside the country. OECD is in the midst of a deflationary situation with the economies temporarily stabilized by the collapse of oil prices, while all commodity exporting countries from the developing world are entering recession. ..."
"... Most people dont realize that most of the world is immersed in a deflationary crisis. ..."
"... Even I think and average price for 2016 of $65/b is too high (the eternal optimist). I can see maybe $65/b by August 2016 (for the monthly average), but an average for 2016 of 55 to 60/b seems more reasonable, in my opinion. Though even that seems a little high, probably $50/b for 2016 would be my guess for the average 2016 oil price (WTI). ..."
Everyday that it spends below $30 means a day that it has to spend significantly above $65 to
give that average. In my humble opinion on a matter on which I am far from expertise, you are
incorrect, Fernando. The economy cannot resist high oil prices right now, and I doubt the economy
will improve that much in the coming months. If the global economy avoids a recession and improves,
we might get an average between $40-$50. If not, it will be below $35. We will be swimming in
oil that nobody can sell at the same time as production craters. A nightmarish scenario.
I do not think that oil price can reach $65 this year, not to say to average $65. But not because
"The economy cannot resist high oil prices right now".
What is particularly wrong with the global economy, that it cannot afford $65? Do we have a
worldwide recession?
China's economy is slowing not because of high oil prices, but because of long-term structural
issues. Meanwhile, China's oil demand continues to grow.
Empirical evidence suggests that the "oil burden" (total amount of oil consumption X price
of oil) becomes unaffordable for the global economy, when it reaches 5% of global GDP. At $65
it would be only between 2 and 2.5%.
The key reason for the current glut in the oil market is excess supply, not the weakness of
the global economy.
I agree $65/b average price seems too high, my guess would be $50/b for an average oil price,
but $65/b by Dec 31 2015 seems possible, though I might guess $60/b for an average monthly price
in Dec 2016.
Both Fernando and you know more about the industry than me, so both your guesses would be better.
Could you give us your guess for the average in 2016, it seems to be more than $30/b and less
than $65/b based on previous comments, maybe $42.5/b ?
What is wrong with the global economy is that it is at the brink of global recession. The
global economy was being sustained by strong debt-based growth in Chindia creating huge malinvestment
there, manifested in ghost town projects. Whether China stabilizes or not, it is no longer capable
of sustaining previous strong growth because of high indebtment and flow of capitals outside the
country. OECD is in the midst of a deflationary situation with the economies temporarily stabilized
by the collapse of oil prices, while all commodity exporting countries from the developing world
are entering recession.
We were going directly towards a new global recession, when oil prices collapsed delaying it.
But low oil prices are not a cure, they alleviate some symptoms while creating other serious problems.
I agree with Petro below that if oil price goes above $65 in the current situation, that would
directly trigger a global recession. Since a global recession is the biggest fear to the economical
powers of the world, oil prices are not going to be allowed to recover unless the global economy
recovers.
I suppose it makes sense now why sanctions on Iran have been lifted at a time when the world
does not need more oil, and when such a decision, pushed by the US and EU, was clearly going to
worsen the situation of the US oil industry.
Oil prices have to remain depressed for the foreseeable future until a time when the economy
improves enough to withstand higher oil prices. That time might not come. Alternatively oil prices
could rise if the economic powers lose control of the situation. We definitely don't want that
to happen.
Most people don't realize that most of the world is immersed in a deflationary crisis.
A consumer crisis if you will. Due to long term unavoidable tendencies, population growth,
robotics, globalization, there has been an excess supply of labor in the world. As a consequence
labor has been cheated of their part of the increased wealth, and capital has retained the lion's
share of it, giving rise to growing inequality. To compensate for their stagnated purchasing power,
labor increased its debt load to saturation in many parts of the world. Japan was the first to
enter the deflationary hole. Despite being a remarkable country with a lot of things in their
favor, they have been unable to get out. Now most of OECD is joining and will drag the world's
economy to the hole. This crisis has no solution, and Peak Oil will make sure our civilization
never recovers.
Even I think and average price for 2016 of $65/b
is too high (the eternal optimist). I can see maybe $65/b by August 2016 (for the monthly average),
but an average for 2016 of 55 to 60/b seems more reasonable, in my opinion. Though even that seems
a little high, probably $50/b for 2016 would be my guess for the average 2016 oil price (WTI).
Looks like existing Iran stored liquids is mostly condensate and diesel fuel.
also increasing og production in current circumstances is difficult and counterproductive.
Looks like Iran choose the path of processing its oil and shipping processed products
instead.
Notable quotes:
"... Iran intends to increase oil exports by 500,000 b/d right away, in addition
to the 30 million barrels Iran has stored in oil tankers in the Persian Gulf. ..."
"... Iranian sources claim that their floating storage consists of fuel oil
and condensate, but I guess we will find out: http://www.reuters.com/article/iran-oil-idUSL3N1021Z120150723
..."
"Iran is able to increase its oil production by 500,000 barrels a day
after the lifting of sanctions, and the order to increase production was issued
today," said Deputy Oil Minister Rokneddin Javadi, who also heads the National
Iranian Oil Company.
Oil prices fell below $28 a barrel on Monday as the market braced for additional
Iranian exports. Prices recovered during the day with Brent crude trading at
over $29 by 2.00pm GMT.
Iran hopes to raise oil exports by around one million barrels per day within
a year.
"... Iran will continue the policy of maximum production from the joint oil
and gas fields and that it has plans to enhance recovery from the fields in the
post-sanctions era ..."
"... Our next priority is oil production from West Karoun fields so that in
the next eight months, production will touch 200,000 barrels a day and will increase
to 700,000 barrels by the end of the Sixth Five-Year Development Plan ..."
"... We also hope to increase production of condensates in South Pars field
to one million barrels a day by the end of current governments term ..."
"... in less than 20 years, the value of petrochem products multiplied from
one billion dollars to 18 billion dollars. ..."
"... In the field of refineries, it is decided that the capacity will be boosted
from the current 1.7 million barrels a day to 3 million barrels, Zangeneh added.
He anticipated that with continuation of support programs for the production chain,
petrochemical production can hit 70 billion dollars a year. (Source: Safana) ..."
TEHRAN, Jan. 18 (Shana) – Minister of Petroleum Bijan Zangeneh said that
Iran will continue the policy of maximum production from the joint oil and gas
fields and that it has plans to enhance recovery from the fields in the post-sanctions
era.
"Even during sanctions period (forced reduction in production), we had laid
the principle that the reduction shall not include the joint fields," he said
in a televised interview with the national Channel One news bulletin.
"During these years which we launched five South Pars phases, it meant an
increased production of 150 million cubic meters of gas and 200,000 barrels
of gas condensates from the joint field," Zangeneh added. "Our next priority
is oil production from West Karoun fields so that in the next eight months,
production will touch 200,000 barrels a day and will increase to 700,000 barrels
by the end of the Sixth Five-Year Development Plan."
"We also hope to increase production of condensates in South Pars field
to one million barrels a day by the end of current government's term,"
the minister said. Zangeneh stressed development of petrochemical industry among
the downstream projects and said that in less than 20 years, the value of
petrochem products multiplied from one billion dollars to 18 billion dollars.
"In few years, it will catch up to 26 billion dollars and by the end Fifth
Development Plan it will hit above 40 billion dollars," he said.
"In the field of refineries, it is decided that the capacity will be
boosted from the current 1.7 million barrels a day to 3 million barrels," Zangeneh
added. He anticipated that with continuation of support programs for the production
chain, petrochemical production can hit 70 billion dollars a year." (Source:
Safana)
"... I think much of conventional output requires investment in new wells to keep decline rates down. This investment may not occur at $40/b and decline rates may decrease more than you believe. There is a tipping point where even low cost wells cannot pay for their OPEX at too low an oil price, maintenance gets deferred, or wells get abandoned. This does not happen everywhere, but in North America, Canada, possibly the North Sea and Brazil we may see more decline than you believe especially at oil prices under $40/b. ..."
"... In the LTO plays output has been resilient so far, but eventually oil companies will be cut off from financing and will declare bankruptcy, once that snowball gets rolling there could be turmoil in the LTO industry and output could decline pretty sharply. ..."
"... The amount of oil used per unit of GDP has been falling. Some argue that this is due to a change in the structure of the economy to more services. ..."
I guess my argument kind of cherry picks. I believe the IEA is correct that oil demand may
increase by 1.2 Mb/d in 2016, but I expect that liquids output will fall by at least 500 kb/d
(and if the EIA's short term oil price forecast is correct, probably supply would fall by 1000
kb/d).
So we would have an average stock draw of between 1.7 and 2.2 Mb/d, let's call it 2 Mb/d. OECD
stocks are about 260 Mb above average levels, so in roughly 3 months we would be back to normal
levels. Under this scenario by June or July 2016 we should see oil prices start to recover. As
it will take some time to reverse course and start to increase oil supplies we could be at $75/b
by late 2016 or early 2017.
Again the forecast is based on low oil prices and an unrealistic expectation of the World Oil
supply at a low oil price. Again if there is a recession as some believe, consumption will decrease
and oil prices will remain low.
If World growth continues, oil supply will not be able to meet oil demand at low oil prices,
oil stocks will fall to normal levels (in 6 to 12 months), and oil prices will rise, this will
tend to reduce European oil consumption, also slow growth in Europe will tend to reduce consumption.
Also your chart tells an incomplete story, crude oil consumption declined from 2004 to 2013
in Europe see
"oil prices will rise, this will tend to reduce European oil consumption"
With taxes amounting to 60-70% of retail price for gasoline and diesel, oil consumption in
Europe is almost non-sensitive to crude oil prices.
On the supply side, you underestimate the resilience of producers to low oil prices. The excess
supply will be eliminated not earlier than mid-2017, and it will take at least two more years
for OECD inventories to return to normal levels.
In general, the decline in annual average (Brent) price from $99 in 2014 to $52 in 2015 obviously
had some positive effect on the demand, especially in the U.S. But the effect of decline from
$52 to $40 in 2016 will be negligeable.
And it will be largely offset by:
1) high fuel taxes (Europe, Japan)
2) the depreciation of local currencies vs. the dollar
3) cancellation or reduction of fuel subsidies in a number of emerging economies
I think much of conventional output requires investment in new wells to keep decline rates
down. This investment may not occur at $40/b and decline rates may decrease more than you believe.
There is a tipping point where even low cost wells cannot pay for their OPEX at too low an oil
price, maintenance gets deferred, or wells get abandoned. This does not happen everywhere, but
in North America, Canada, possibly the North Sea and Brazil we may see more decline than you believe
especially at oil prices under $40/b.
In the LTO plays output has been resilient so far, but eventually oil companies will be cut
off from financing and will declare bankruptcy, once that snowball gets rolling there could be
turmoil in the LTO industry and output could decline pretty sharply.
In some cases people think all the DUCs will save the day, but the fracking amounts to half
the cost of the well, you still need money to create a producing well from a DUC.
No money, no oil.
All of the cutbacks in CAPEX are eventually going to bite and bring down World C+C output by
1 to 2 Mb/d (2016 average output will be 77.5 to 78.5 Mb/d, assuming that 2015 average output
was about 79.5 Mb/d).
Based on IEA data OECD stocks are about 260 Mb above average levels, if oil supply falls by
1 Mb/d below demand, it would take 9 months to return to normal storage levels, oil prices will
begin to rise once this draw begins, so that by 4 or 5 months oil prices will gradually start
to rise.
You are also forgetting the time lag between changes in prices and changes in consumer behavior,
this lag tend to be 6 to 12 months and the demand increase in North America will be very apparent
in May through September when all the new SUVs hit the road for the summer driving season.
I imagine Europeans will have some response to lower fuel prices and they are subject to the
same lag in responding to price changes even if the relative percentage change is smaller.
Yes I agree Europe is much less sensitive to oil price changes than North America. Mostly it
will be GDP and population changes that will drive European oil consumption, with maybe a small
effect from hybrids, plugin hybrids, and EVs at some point (after they become more widely accepted).
Europe is not the problem, the US is where oil consumption needs to come down to European levels.
That decrease in euro area that you see from GFC in 2008 is just decrease on the back of periphery
countries with the message from the core "You got eat less" to the periphery. So that decrease
in oil consumption in euro area is all what you are going to get without triggering revolution
:-)
High gasoline taxes, developed public transportation, tiny diesel ICE… it is all already baked
in that oil consumption.
You may be right about Europe, there may not be a lot more reduction in oil consumption, though
high oil prices may still have some effect, they can move to hybrids, plug in hybrids and EVs.
There can be more electrification of rail and possibly more freight moving to rail or sea. Most
of the room for improvement is North America, Europe has cut most of the fat.
Ironically perhaps booming new car sales means more economical vehicles in the fleet sooner.
That looks to be true in China:
Auto sales in China have accelerated in recent months and are expected to increase 7% in
2016, buoyed by a 50% reduction in the sales tax to 5% from 10% for new vehicles with engine
capacity of less than 1.6 litres…
The amount of oil used per unit of GDP has been falling. Some argue that this is due to a change
in the structure of the economy to more services.
I believe this effect is real, but for the World it is difficult to measure the size of this
effect.
Your Asia/Pacific demand includes China and India, without those countries, demand growth is
not so great. Since 2012 oil consumption has been decreasing. Chart uses data from BP Statistical
Review of World Energy.
If you don't count 2.5 billion of people (China + India) in Asia for oil consumption then shale
guys are very profitable as well if they disregard principal payments on debt
:-)
The reason for leaving out rapidly growing economies is to show that for mature economies,
demand is either flat or down.
At some point growth in oil consumption will slow down in China and India as well especially
as oil supply will eventually decrease faster than the decrease in consumption in OECD nations,
at that point oil prices rise which speed the transition away from oil everywhere. Eventually
there will be a lack of demand for oil (40 or 50 years down the road) which may drive oil prices
lower so that much of the high cost oil is left in the ground. Possibly wishful thinking, but
in any case there is some limit to how high oil prices can go (probably about $200/b in 2015$
at most) in the next 20 years and there is some limit to how much oil can be produced at that
price, my guess is between 80 and 85 Mb/d.
So there will be a limit to how high the consumption of oil can go for the World. How the oil
is allocated will depend on preferences and prices, assuming war is not chosen as a rational solution
(this would tend to reduce oil available to everyone).
" The reason for leaving out rapidly growing economies is to show that for mature economies, demand
is either flat or down."
Hi Dennis,
I agree that is flat or down not counting growing economies. And little bit up counting growing
economies. But question is if that is the case then how come oil is down 70% in the same period
of time? Obviously there are some other forces than just supply and demand. So I am just wondering
how long these other forces can postpone supply/demand finding equilibrium?
"... the underlying trend shows an acceleration of the monthly decline rate towards -2.5% (from -2%) which is around 30 % annualized. ..."
"... a dramatic slump of the US high yield bond and equity market for oil and gas companies. In my estimate the US corporate default rate will rise from 2.5% to 3.5% in 2016, which is one of the worst within major economies. ..."
"... Where should new production come from when the complete corporate infrastructure extincts? The recent bond and equity crash is not baked into most production forecast models and in my view the decline rate will be much higher than in most estimates. ..."
"... I think that the Saudi oil guy underestimated the effects of his decision by an order of several magnitudes [as did most of us]. At some point, he is going to realize that the King, or somebody, will have his head. ..."
"... I am surprised at the balls of the investors that are still short this oil market. ..."
... The question is when will OPEC cut? That is really the only thing, other than major political
event, that will cause the price rebound necessary for most public producers to survive. 1986,
1998-99 and 2008-09 were all resolved with an OPEC cut.
Keep $20 oil here a couple years, and if banks follow lending guidelines, most will US public
E & P will be bankrupt by the end of 2017, many will fail in 2016.
We give the companies a hard time here for being reckless. However, we easily forget all the
good employees who are being thrown out of a job. It's a really bad deal, because these people
were making really good money.
I read a comment that they can go put up solar panels for $15-20 per hour. I guarantee most
in the oil patch were doing much better than that.
OFM, a lot of the reason we still have SOME production running is to try to keep the remaining
guys we have in a job. They average over 30 years each of field experience. They have insurance
with us. They work mostly unsupervised and do a hell of a good job.
When I think about that, I do think this crash really sucks.
Remember that PV10 is discounting at 10%. If the interest rate on a company's average debt is
below 10%, then they are better off than the PV10 would indicate.
Clueless, very true. Just using a standard valuation metric.
Due to low interest rates, banks started using PV9.
I still believe oil and gas is risky enough to warrant PV10 as a valid metric, especially with
the price volatility witnessed in the last 18 years.
Further, I would put LTO on at least the mid point of risk re oil production, due to high cost.
A 2% return is fantastic on an FDIC insured deposit. IMO, it is not on an LTO well, which could
be a dud, could quickly develop a casing hole, or have been drilled just crooked enough to cause
an average of four down hole failures per year.
The FED oil and gas production index (see below chart) for December came out yesterday along with
general US production data. This index is interesting as it covers total oil and gas production
and – although revised frequently – gives more actual data than monthly Bakken and RRC Texas data
which are still from November. Although at first sight the production decline looks minuscule
(around – 3% year over year) the underlying trend shows an acceleration of the monthly decline
rate towards -2.5% (from -2%) which is around 30 % annualized.
More important is the current development, which indicates a dramatic slump of the US high
yield bond and equity market for oil and gas companies. In my estimate the US corporate default
rate will rise from 2.5% to 3.5% in 2016, which is one of the worst within major economies.
This will make it very difficult for companies to raise fresh capital for new drilling in the
months ahead. Where should new production come from when the complete corporate infrastructure
extincts? The recent bond and equity crash is not baked into most production forecast models and
in my view the decline rate will be much higher than in most estimates.
If someone had asserted in early 2014 that oil prices in early 2016 would be below $30 and
that Donald J. Trump would be the most likely GOP candidate for President of the United States,
I wonder what we would have said?
Which makes one wonder what will be happening in early 2018.
Prediction: Sometime between now and 2018, OPEC figures out that they can produce all their
oil forever and make a profit at $30 bbl, but that is meaningless in the long term, maybe 3-5
years. Because by then their citizens will realize that their countries are rapidly running out
of the money that they depend on for their well being.
It is like if person says "I can work for $10/hour for the rest of my life and make it." But,
what if that person has house payments, car payments, a spouse and two kids that depend on them?
Then $10/hour will not cut it after they blow through any savings that they had.
I think that the Saudi oil guy underestimated the effects of his decision by an order of
several magnitudes [as did most of us]. At some point, he is going to realize that the King, or
somebody, will have his head.
I have read that many people in the mideast believe that their oil is a gift from Allah and
will never run out. If they get to see production declining and also being sold for less, I expect
that they will be pissed.
In 2008, after crossing the $100 mark on the way up, the first month below $100 was 9/08, when
Brent averaged $97. The monthly low was only three months later, in 12/08, when Brent averaged
$40. As prices recovered, subsequent months in 2009 were all higher than $40, and the 12/09 price
was $75. The monthly price exceeded $100 again in 2/11, when Brent averaged $104.
Arguably, if we measure the oil price decline as the number of months below $100 to the monthly
low, the price slump was only four months long in 2008. Prices were in a recovery phase from 1/09
forward.
In 2014, the first month below $100 was 9/14, when Brent averaged $97. The initial decline
was much slower than 2008, but the current decline has been much longer than the 2008 decline,
in terms of the number of months below $100, until we see a sustained price recovery (four months
for 2008 versus 17 months and counting for the current decline). When Dennis predicted that the
monthly low for the current decline was 1/15, when Brent averaged $48, I thought that he was right,
and for several months it looked like Dennis was right. Unfortunately, for folks in the Oil Patch
Depression, we have subsequently seen lower lows. Whereas monthly Brent prices rose from $40 in
12/08 to $75 in 12/09, monthly Brent prices fell from $62 in 12/14 to $38 in 12/15.
Following a "V" shaped oil price decline in 2008, it took about two years for the total US
rig count to again approach 2,000 rigs. I wonder when, or if, that the US rig count will again
approach the 2,000 mark. As I have frequently noted, a reasonable estimate in my opinion is that
at current levels of US production, we need about 1.5 million bpd of new C+C production and about
17 BCF/day of new gas production every year, just to offset declines from existing wells.
I am surprised at the balls of the investors that are still short this oil market. With
respect to what Jeffrey just pointed out, let me posit a hypothetical, and anyone can guess.
What would happen to the price of oil if the Saudis made this announcement?
"We have been closely following the oil market since our decision 16 months ago. Much of
the existing surplus and, more importantly, much of the projected future surplus from that
point has been eliminated. We believe that at this time a "shared" cut of 1.5 million barrels/day
will balance the oil market.
Therefore, if there is support for this position, we will be in favor of an emergency meeting
of OPEC."
I would expect an immediate increase to $45, and then to $60 if they actually held a meeting
and cut. But, this is just wishful thinking.
"... If so, you may want to call up oil producers in North Dakota and ask if theyd care to send
you some free oil, because the crude glut is now so acute that the Koch brothers are actually charging
$0.50/bbl to take low grade oil at their Flint Hills Resources refining arm. ..."
Do you have some extra space in your garage or attic? Or perhaps you own an oil tanker you aren't
currently using. Or maybe you have a storage unit that's got a little extra room next to an old mattress
and box springs.
If so, you may want to call up oil producers in North Dakota and ask if they'd care to send
you some free oil, because the crude glut is now so acute that the Koch brothers are actually charging
$0.50/bbl to take low grade oil at their Flint Hills Resources refining arm.
North Dakota Sour is a high-sulfur grade of crude and "is a small portion of the state's production,
with less than 15,000 barrels a day coming out of the ground,"
Bloomberg notes , citing John Auers, executive vice president at Turner Mason & Co. in Dallas.
"The output has been dwarfed by low-sulfur crude from the Bakken shale formation in the western part
of the state, which has grown to 1.1 million barrels a day in the past 10 years."
High-sulfur grades are more expensive to refine and thus fetch lower prices at market. As Bloomberg
goes on to note, "Enbridge stopped allowing high-sulfur crudes on its pipeline out of North Dakota
in 2011, forcing North Dakota Sour producers to rely on more expensive transport such as trucks and
trains [and] the price for Canadian bitumen -- the thick, sticky substance at the center of the heated
debate over TransCanada Corp.'s Keystone XL pipeline -- fell to $8.35 last week, down from as much
as $80 less than two years ago."
So there you have it. The global deflationary supply glut has now reached the point that the market
is effectively forcing producers to pay to give their oil away or else see it sit in bloated storage
facilities until Riyadh decides enough is enough and until the world comes to terms with the return
of Iranian supply. In other words, for some US producer s the business isn't just loss making, it's
an exercise in sadomasochistic futility.
Meanwhile, MLP Plains All American is quoting Colorado Southeastern, Nebraska Intermediate, Eastern
Kansas Common Special, and Oklahoma Sour at just $16.50/bbl, $16.00/bbl, $12.20/bbl, and $13.50/bbl,
respectively.
The message for the
Wells Fargos and
Citis
of the world: you're going to need a bigger loan loss reserve. It's no wonder the Dallas Fed
suspended mark-to-market on energy debts - there's no market to mark to.
He didn't want to destroy it exactly. Wall Street need a plan B once Saudi runs out of oil
in 15 years. They just want to make sure the right people (themselves) control the oil, from San
Antonio to Siberia. They don't want anyone to be sovereign, not Russia, not Texas, not anybody.
The plan is:
1. Saudi dumps oil.
2. Russia runs out of cash, Putin is overthrown.
3. Wall Street vultures snap up North American and post-Soviet oil for pennies on the dollar.
4. Saudi runs out of oil and prices return to realistic levels.
5. Vultures contribute a portion of their winnings to Barry's library and Malia's first congressional
campaign.
Stemming from my cynicism, I figured there probably is a gov dept. of ethanol and yup; there
sure is. EIA predicts increased ethanol production in 2015 and 2016
The U.S. Energy Information Administration has released the January issue of its Short-Term
Energy Outlook, which includes its first short-term prediction of 2016 ethanol production levels.
TEHRAN, Jan. 18 (Shana) – Minister of Petroleum Bijan Zangeneh said that Iran will continue the
policy of maximum production from the joint oil and gas fields and that it has plans to enhance
recovery from the fields in the post-sanctions era.
"Even during sanctions period (forced reduction in production), we had laid the principle that
the reduction shall not include the joint fields," he said in a televised interview with the national
Channel One news bulletin.
"During these years which we launched five South Pars phases, it meant an increased production
of 150 million cubic meters of gas and 200,000 barrels of gas condensates from the joint field,"
Zangeneh added. "Our next priority is oil production from West Karoun fields so that in the next
eight months, production will touch 200,000 barrels a day and will increase to 700,000 barrels
by the end of the Sixth Five-Year Development Plan."
"We also hope to increase production of condensates in South Pars field to one million barrels
a day by the end of current government's term," the minister said. Zangeneh stressed development
of petrochemical industry among the downstream projects and said that in less than 20 years, the
value of petchem products multiplied from one billion dollars to 18 billion dollars.
"In few years, it will catch up to 26 billion dollars and by the end Fifth Development Plan
it will hit above 40 billion dollars," he said. "In the field of refineries, it is decided
that the capacity will be boosted from the current 1.7 million barrels a day to 3 million barrels,"
Zangeneh added. He anticipated that with continuation of support programs for the production chain,
petrochemical production can hit 70 billion dollars a year." (Source: Safana)
"... Some outcomes of the removal of sanctions are immediate. For example, we
increased export of crude oil as of today and also some 1,000 LCs were opened just
today by the banks which used to be under sanctions, he told a press conference
after announcement of the sanctions withdrawal earlier in the day. ..."
"... Iran had announced that it is set to increase oil exports as soon as sanctions
are removed for 500,000 barrels a days and that it will further add it to another
500,000 barrels in a short span of time. ..."
TEHRAN, Jan. 17 (Shana) – President Hassan Rouhani said on Sunday that Iran
has started increasing its export of crude oil on the Implementation Day of
the nuclear Joint Comprehensive Plan of Action (JCPOA).
"Some outcomes of the removal of sanctions are immediate. For example,
we increased export of crude oil as of today and also some 1,000 LCs were
opened just today by the banks which used to be under sanctions," he told
a press conference after announcement of the sanctions withdrawal earlier
in the day.
Iran had announced that it is set to increase oil exports as soon as
sanctions are removed for 500,000 barrels a days and that it will further add
it to another 500,000 barrels in a short span of time.
President Rouhani also said Iran will continue following the policy of resistive
economy in the post-sanctions era.
The next year's draft budget bill which was submitted to the Parliament on
Sunday has the least dependency on crude oil revenues, he added.
During the question-answer session with domestic and foreign media, Rouhani
said Iran's private sector will be revitalized to employ the opportunities in
the wake of removal of sanctions.
To a query on Iran's reaction to a possible change in the US policy in future
by the hardliners regarding the nuclear deal with Iran, he underlined that Tehran
will proportionately react to such likely breaches of the agreement.
"There is no ground for resumption of the UNSC sanctions… And the US government's
commitments within JCPOA shall continue under UNSC Resolution 2231 regardless
of the party taking power in its hands."
He added that Iran is ready for the investment and technology transfer by
US companies in Iran noting that limitations in this regard lie on the other
side.
"If Americans want to invest in Iran, there is no limitation here. Recently,
they provided facilities for sale of commercial planes (to Iran) and removed
barriers on export of some Iranian goods," he said.
Asked on future relations with China and Italy, President Rouhani said Iran
will not forget the friendly countries that remained in trade contacts with
the Islamic Republic and will increase its ties with them after sanctions removal.
He also criticized Saudi Arabia and certain Islamic countries in the region
which negatively reacted to the withdrawal of sanctions in a fellow Islamic
country.
reported exclusively how the Dallas Fed is pulling strings behind the scenes to conceal the fallout
from the oil market crash.
As Dark-Bid.com's
Daniel Drew notes, by suspending mark-to-market on energy loans and distorting the accounting,
they are postponing the inevitable as long as possible. The current situation is eerily reminiscent
to the heyday of the mortgage market in 2007, when mortgage defaults started to pick up, and yet
the credit default swaps that tracked them continued to decline, bringing losses to those brave enough
to trade against the crowd.
Amidst the market chaos on Friday, a trader brought something strange to my attention. He asked
me exactly what the hell was going on with this ETN he was watching . I took a closer look and was
baffled. It took me awhile to put the pieces together. Then when I saw the story about mark-to-market
being suspended, it all made sense.
Here is the daily premium for the last 6 months on the
Barclays
iPath ETN that tracks oil :
Initially, Dark-Bid.com's
Daniel Drew thought this was merely a sign of retail desperation. As they faced devastating losses
on their oil stocks, small investors turned to products like oil ETNs as they tried to grasp the
elusive oil profits their financial adviser promised them a year ago. Oblivious to the cruel mechanics
of ETNs, they piled in head first, in spite of the soaring premium to fair value. After all, Larry
Fink is
making the rounds to convince the small investor that ETFs are indeed safer than mutual funds.
Because nothing says "safe" like buying an ETN that is 36% above its fair value.
Sure, there are differences between ETFs and ETNs, particularly regarding their solvency in the
event of an issuer default, but the premium/discount problem plagues ETFs and ETNs alike. Nonetheless,
widely trusted retail sources of investment information perpetuate the myth that ETNs do not
have tracking errors.
But was it just retail ignorance?
Something remarkable happened in the last hour of trading on Friday which sparked the massive
decoupling in OIL from its NAV...
Making us wonder, was an 'invisible hand' at play? Or was this just more evidence of OPEX-inspired
broken markets?
I hear that the OCC finally had some wells shut down due to Deep Waste Water Injection issues.
There seems to be studies now being looked at seriously by the OCC – Oklahoma Corporation Commission
on Deep Water Injection and its impact on Earthquake activity. If a precedent is shown to exist…
WATCH THE F*CK OUT.
From what I understand, there are huge lawsuits in the pipeline if (once) a precedent is found.
I also hear that the TRRC is watching closely the OCC hearings and meetings. If a precedent is
found to exist and is made official by the OCC, the TRRC will likely follow.
This could shut in a lot of Resource Oil & Gas Wells due to the liability and deep water injection
issues. I have been doing some reading on Earthquake damage to homes, buildings and infrastructure
and it is much worse than MSM has reported. There's one hell of a lot of very angry and pissed
off people in Oklahoma and Texas that have suffered damage from earthquakes.
You add this to the recent Dallas Fed decision to keep the Banks from MARK TO MARKET their
energy assets (LOL… Liabilities), and looks like we are going to see one hell of a BLOOD BATH
in the U.S. energy industry this year.
My brother is having a problem with that around Edmond, Okla. 50% of the wells in Texas, they
just use surface ponds to allow them to dry OU. The better alternative they are starting to use
is centralized wastewater treatment plants that they can reuse the water from. If it becomes a
huge issue, then I hope they gravitate that way.
Copy of a previous comment, that is relevant to this topic, follows. Note that what the EIA
calls "Crude oil" is actually Crude + Condensate (C+C). Also, note that US C+C production fell
from 9.6 million bpd in April, 2015 to 9.2 million bpd in December, 2015.
When we ask for the price of oil, we get the price of actual crude oil. In the case of Brent
and WTI, they both have average API gravities in the high 30's, and the upper limit for WTI crude
oil is 42 API Gravity.
But when we ask for the quantity of oil, we get some combination of crude oil + condensate
+ natural gas liquids (NGL) + biofuels + refinery gains.
The Great Condensate Con?
We have seen a large year over year increase in US and global Crude + Condensate (C+C) inventories.
For example, EIA data show that US C+C inventories increased by 100 million barrels from late
2014 to late 2015, and this inventory build has contributed significantly to the sharp decline
in oil prices.
The question is, what percentage of the increase in US and global C+C inventories consists
of condensate?
Four week running average data showed the US net crude oil imports for the last four weeks
of December increased from 6.9 million bpd in 2014 to 7.3 million bpd in 2015. Why would US refiners
continue to import large–and increasing–volumes of actual crude oil, if they didn't have to, even
as we saw a huge build in US C+C inventories? Note that what the EIA calls "Crude oil" is actually
C+C.
I frequently cite a Reuters article that discussed case histories of refiners increasingly
rejecting blends of heavy crude and condensate that technically meet the upper limit for WTI crude
(42 API gravity), but that are deficient in distillates. Of course, what the refiners are rejecting
is the condensate component, i.e., they are in effect saying that "We don't want any more stinkin'
condensate." Following is an excerpt from the article:
U.S. refiners turn to tanker trucks to avoid 'dumbbell' crudes (March, 2015)
In a pressing quest to secure the best possible crude, U.S. refiners are increasingly going
straight to the source.
Firms such as Marathon Petroleum Corp and Delek U.S. Holdings are buying up tanker trucks
and extending local pipeline networks in order to get more oil directly from the wellhead,
seeking to cut back on blended crude cocktails they say can leave a foul aftertaste. . . .
Many executives say that the crude oil blends being created in Cushing are often substandard
approximations of West Texas Intermediate (WTI), the longstanding U.S. benchmark familiar to,
and favored by, many refiners in the region.
Typical light-sweet WTI crude has an API gravity of about 38 to 40. Condensate, or super-light
crude that is abundant in most U.S. shale patches, ranges from 45 to 60 or higher. Western
Canadian Select, itself a blend, is about 20.
While the blends of these crudes may technically meet the API gravity ceiling of 42 at Cushing,
industry players say the mixes can be inconsistent in makeup and generate less income because
the most desirable stuff is often missing.
The blends tend to produce a higher proportion of fuel at two ends of the spectrum: light
ends like gasoline, demand for which has dimmed in recent years, and lower-value heavy products
like fuel oil and asphalt. What's missing are middle distillates like diesel, where growing
demand and profitability lies.
My premise is that US (and perhaps global) refiners hit, late in 2014, the upper limit of the
volume of condensate that they could process, if they wanted to maintain their distillate and
heavier output–resulting in a build in condensate inventories, reflected as a year over year build
of 100 million barrels in US C+C inventories.
Therefore, in my opinion the US and (and perhaps globally) C+C inventory data are fundamentally
flawed, when it comes to actual crude oil inventory data. The most common dividing line between
actual crude oil and condensate is 45 API gravity, although the distillate yield drops off considerably
just going from 39 API to 42 API gravity crude, and the upper limit for WTI crude oil is 42 API.
In 2015, the EIA issued a report on US C+C production (what they call "Crude oil"), classifying
the C+C by API gravity, and the data are very interesting:
Note that 22% of US Lower 48 C+C production consists of condensate (45+ API gravity) and note
that about 40% of US Lower 48 C+C production exceeds the maximum API gravity for WTI crude oil
(42 API). The above chart goes a long way toward explaining why US net crude oil imports increased
from late 2014 to 2015, even as US C+ C inventories increased by 100 million barrels, and I suspect
that what is true for the US may also be true for the world, in regard to the composition of global
C+C inventories.
Following is my analysis of global C+C production data versus estimated global crude oil production
data, through 2014, using the available data bases:
How Quickly Can US Tight/Shale Operators Cause US C+C Production to Increase?
Because of equipment, personnel and financial constraints, in my opinion it is going to take
much longer than most analysts expect for US operators to ramp up activity, even given a rising
price environment.
Except for the 2008 "V" shaped price decline (which bottomed out in December, 2008), and the
corresponding US rig count decline, the US (oil and gas) rig count has been around 1,800 to 2,000
in recent years. Note that it took about five years to go from around 1,000 rigs in 2003 to around
2,000 rigs in 2008, and it even took two years to go from around 1,000 rigs in 2009 to around
2,000 rigs in 2011.
And assuming a 15%/year rate of decline in existing US C+C production and assuming a 24%/year
rate of decline in existing US gas production, the US has to put on line around 1.5 million bpd
of new C+C production every year and around 17 BCF per day of new gas production every year, just
to offset declines from existing wells. Based on 2013 EIA data, the estimated annual volumetric
loss of production from existing US gas production exceeds the annual dry gas production of every
country in the world, except for the US and Russia.
... the U.S. situation will be very different in 2016. The number of active U.S. oil rigs today
is about a third of the levels reached in 2014.
JODI's separate
database estimates that U.S. oil production was already down year-over-year by October 2015.
And the EIA's drilling productivity
model estimates that production from the U.S. counties associated with the tight oil boom will
have fallen another 500,000 b/d from the September values by the end of next month.
Bob Barbera discussed the
role of slowing world GDP growth as one of those factors. His graph below shows that the observed
slowdown in world GDP since 2010 (shown in red in the graph below) could easily account for much
of the drop in commodity prices through 2014 (in green). Barbera speculates on the basis of the numbers
for Chinese rail shipments and electricity production that the true Chinese GDP growth for 2015 may
have been significantly below the country's official target of 7%. The dashed red line in the graph
below is Barbera's "what-if" calculation supposing we impute 2.5% real GDP growth to China instead
of the 6.8% number that IMF is estimating that we will see in China's official numbers for 2015,
an exercise that could explain much of the drop in general commodity prices through last year.
IMF estimates of annual growth rate of world real GDP (in red, right scale) and year-over-year
percent change in commodity prices as measured by the quarterly average CRB/BLS raw industrials price
index (in green, left scale). Dashed line is Barbera's estimate of world GDP growth for 2015 if IMF
6.8% Chinese growth rate is replaced with 2.5%. Source:
Center for Financial Economics
.
The 44% drop in Chinese stock prices since last summer suggests that this kind of what-if calculation
should be taken seriously.
"If Iranian production is about to surge, Iraqi production remains high, and the Chinese
economy is stumbling, that can only mean that even bigger drops in U.S. oil production are inevitable."
Sounds excellent. Why would the U.S. want to sell a dwindling resource if they didn't have
to?
The crazy thing is the recent budget deal. Instead of responsibly paying for spending with
taxes, the Republicans forced a gimmick in which they finance spending by selling off part of
the Strategic Oil Reserve. Buy high, sell low. That's the Republican way.
How do you know what the price of oil will be when the U.S. sells 58 million barrels of
oil from the Strategic Petroleum Reserve between 2018 and 2025?
Many U.S. oil companies may be bankrupt and there may be a real economic recovery by then.
And, trillions of dollars of additional federal debt in just a few years with hundreds of
billions of dollars more each year show we haven't been close "responsibly paying for spending
with taxes."
Nothing unusually Republican about that. Government incompetence knows no party.
However, one could criticize Republicans for raiding the SPR rather than raising road taxes.
The issue is more complicated than that, but that's the general criticism.
Copy of a previous comment, that is relevant to this topic, follows. Note that what the EIA
calls "Crude oil" is actually Crude + Condensate (C+C). Also, note that US C+C production fell
from 9.6 million bpd in April, 2015 to 9.2 million bpd in December, 2015.
When we ask for the price of oil, we get the price of actual crude oil. In the case of Brent
and WTI, they both have average API gravities in the high 30's, and the upper limit for WTI crude
oil is 42 API Gravity.
But when we ask for the quantity of oil, we get some combination of crude oil + condensate
+ natural gas liquids (NGL) + biofuels + refinery gains.
The Great Condensate Con?
We have seen a large year over year increase in US and global Crude + Condensate (C+C) inventories.
For example, EIA data show that US C+C inventories increased by 100 million barrels from late
2014 to late 2015, and this inventory build has contributed significantly to the sharp decline
in oil prices.
The question is, what percentage of the increase in US and global C+C inventories consists
of condensate?
Four week running average data showed the US net crude oil imports for the last four weeks
of December increased from 6.9 million bpd in 2014 to 7.3 million bpd in 2015. Why would US refiners
continue to import large–and increasing–volumes of actual crude oil, if they didn't have to, even
as we saw a huge build in US C+C inventories? Note that what the EIA calls "Crude oil" is actually
C+C.
I frequently cite a Reuters article that discussed case histories of refiners increasingly
rejecting blends of heavy crude and condensate that technically meet the upper limit for WTI crude
(42 API gravity), but that are deficient in distillates. Of course, what the refiners are rejecting
is the condensate component, i.e., they are in effect saying that "We don't want any more stinkin'
condensate." Following is an excerpt from the article:
U.S. refiners turn to tanker trucks to avoid 'dumbbell' crudes (March, 2015)
In a pressing quest to secure the best possible crude, U.S. refiners are increasingly going
straight to the source.
Firms such as Marathon Petroleum Corp and Delek U.S. Holdings are buying up tanker trucks
and extending local pipeline networks in order to get more oil directly from the wellhead,
seeking to cut back on blended crude cocktails they say can leave a foul aftertaste. . . .
Many executives say that the crude oil blends being created in Cushing are often substandard
approximations of West Texas Intermediate (WTI), the longstanding U.S. benchmark familiar to,
and favored by, many refiners in the region.
Typical light-sweet WTI crude has an API gravity of about 38 to 40. Condensate, or super-light
crude that is abundant in most U.S. shale patches, ranges from 45 to 60 or higher. Western
Canadian Select, itself a blend, is about 20.
While the blends of these crudes may technically meet the API gravity ceiling of 42 at Cushing,
industry players say the mixes can be inconsistent in makeup and generate less income because
the most desirable stuff is often missing.
The blends tend to produce a higher proportion of fuel at two ends of the spectrum: light
ends like gasoline, demand for which has dimmed in recent years, and lower-value heavy products
like fuel oil and asphalt. What's missing are middle distillates like diesel, where growing
demand and profitability lies.
My premise is that US (and perhaps global) refiners hit, late in 2014, the upper limit of the
volume of condensate that they could process, if they wanted to maintain their distillate and
heavier output–resulting in a build in condensate inventories, reflected as a year over year build
of 100 million barrels in US C+C inventories.
Therefore, in my opinion the US and (and perhaps globally) C+C inventory data are fundamentally
flawed, when it comes to actual crude oil inventory data. The most common dividing line between
actual crude oil and condensate is 45 API gravity, although the distillate yield drops off considerably
just going from 39 API to 42 API gravity crude, and the upper limit for WTI crude oil is 42 API.
In 2015, the EIA issued a report on US C+C production (what they call "Crude oil"), classifying
the C+C by API gravity, and the data are very interesting:
Note that 22% of US Lower 48 C+C production consists of condensate (45+ API gravity) and note
that about 40% of US Lower 48 C+C production exceeds the maximum API gravity for WTI crude oil
(42 API). The above chart goes a long way toward explaining why US net crude oil imports increased
from late 2014 to 2015, even as US C+ C inventories increased by 100 million barrels, and I suspect
that what is true for the US may also be true for the world, in regard to the composition of global
C+C inventories.
Following is my analysis of global C+C production data versus estimated global crude oil production
data, through 2014, using the available data bases:
How Quickly Can US Tight/Shale Operators Cause US C+C Production to Increase?
Because of equipment, personnel and financial constraints, in my opinion it is going to take
much longer than most analysts expect for US operators to ramp up activity, even given a rising
price environment.
Except for the 2008 "V" shaped price decline (which bottomed out in December, 2008), and the
corresponding US rig count decline, the US (oil and gas) rig count has been around 1,800 to 2,000
in recent years. Note that it took about five years to go from around 1,000 rigs in 2003 to around
2,000 rigs in 2008, and it even took two years to go from around 1,000 rigs in 2009 to around
2,000 rigs in 2011.
And assuming a 15%/year rate of decline in existing US C+C production and assuming a 24%/year
rate of decline in existing US gas production, the US has to put on line around 1.5 million bpd
of new C+C production every year and around 17 BCF per day of new gas production every year, just
to offset declines from existing wells. Based on 2013 EIA data, the estimated annual volumetric
loss of production from existing US gas production exceeds the annual dry gas production of every
country in the world, except for the US and Russia.
I really wish we could push for a change in attitude. Not, when oil prices drop, we just go
out and buy ginormous trucks, and stifle mileage standards. It's like when your team gets a lead
in a basketball game and you say, ok, now we can coast and stop trying. Why not be the team that
says when we get a lead we go for the win! Now we pour it on to seal it, and not let them back
in. Why not say, now we really raise mileage and efficiency standards so we crush oil prices once
and for all, so they don't come back, so we drive them to $10/barrel and keep it there!
Let's go for the win now, permanently, so that we don't have to keep sending all this money
to some of the worst terrorist sponsoring and authoritarian regimes in the world.
That's right, Jeffrey. So we can see the domestic v export split. The domestic market–auto
sales and crude imports–seems to be (or recently have been) doing fine. It's exports that have
suffered–again strongly suggesting a currency over-valuation. That's entirely consistent with
Jim's ICE model.
So China needs to devalue the yuan. But it's hard to overstate what a hash the PBoC has
made of it. Right now, the China brand is going straight to hell, and leadership seems entirely
baffled as to what to do about it.
"If Iranian production is about to surge, Iraqi production remains high, and the Chinese economy
is stumbling, that can only mean that even bigger drops in U.S. oil production are inevitable."
Why don't you formulate it that way : ""Iranian production will surge for sure, Iraqi production
may be still high, given promising results in the fight against the IS, and the Chinese bubble
is imploding, that can only mean that we will see 20 USD per barrel soon -- though I, James Hamilton,
thought I will never see oil below 100 USD per barrel in my life time again." And yes, fracking
is dead, just ask Steven K.
But you are right, the oil is out there in the tankers, just waiting, to rig the price at the
futures market.
For the US and world economy with the post-2007 (and post-Peak Oil) average for real GDP per
capita near 0% and the differential change rates for US oil consumption to final sales and final
sales, oil at $30 is still not "cheap", i.e., the US and world economy has been experiencing comparative
post-Peak Oil recessionary conditions since 2007-08.
Because of the permanent global structural constraints resulting from Peak Oil, we cannot afford
to extract profitable increasing marginal supply of costlier, lower-quality crude oil substitutes
AND maintain the existing fossil fuel infrastructure AND grow real GDP per capita at a post-Peak
Oil rate of faster than 0%. This implies that neither can we sustain growth of expansion of renewables
without the necessary growth of real GDP per capita AND growth of crude substitutes to sustain
current growth of real GDP per capita AND growth of renewables.
Something has to give, which will be growth of real GDP per capita and growth of renewables
in order to sustain the existing fossil fuel infrastructure at declining oil production AND overall
consumption.
Am I the only one who thought the release of the Iranian hostages was a huge coup for the Obama
administration?
The issue to me is not whether it was the best deal, but rather that the US and Iran demonstrated
an ability to reach some sort of agreement and more or less abide by it. The US sailors could
easily have ended up as pawns in yet another deal, but they didn't. And Obama got the detainees
back, even though it wasn't part of the nuclear deal.
To me, it's not that the pig dances poorly, but that it can dance at all.
The much-discussed increase from Saudi Arabia only puts the kingdom's oil production back to where
it had been in August 2013.
Monthly Saudi Arabian field production of crude oil, thousands of barrels per day, Jan 1973 to
Sept 2015. Data source:
EIA Monthly
Energy Review .
It's worth noting that also leaves Saudi exports of crude oil significantly below their recent
peak. One important factor in the increased Saudi crude production since last year was the need to
supply its
greatly expanded refinery capacity . As a result, Saudi Arabia is now exporting more refined
products in place of crude oil.
Saudi crude oil exports, thousand barrels per day, in 2015 (yellow), 2014 (red), and range over
2010-2014 (shaded). Source:
JODI
.
Saudi exports of refined petroleum products, thousand barrels per day, in 2015 (yellow), 2014
(red), and range over 2010-2014 (shaded). Source:
JODI
.
"... I would use $17 billion as outstandings for energy loans. And for securities, I would use, call it, $2.5 billion which is the sum of AFS securities and non-marketable securities. ..."
"... We're focused on the whole thing. Half of those customers - half of those balances represent E&P companies, upstream companies. A quarter of them represent oilfield services companies, and a quarter of them represent pipelines and storage and other midstream activity. And it excludes what I would describe as investment grade sort of diversified larger cap companies where we don't view the credit exposure as quite the same. ..."
"... <Q - Mike L. Mayo> ..."
"... To summarize: $17 billion in oil and energy exposure, which has a $1.2 billion, or 7%, loss reserve assigned to it already, and which is made up "mostly" of junk bonds. ..."
First: how big is Wells' loan loss allowance for energy:
We've considered the challenges within the energy sector and our allowance
process throughout 2015 and approximately $1.2 billion of the allowance
was allocated to our oil and gas portfolio. It's important to note that
the entire allowance is available to absorb credit losses inherent in the
total loan portfolio.
Then, from the Q&A, how much is Wells' total loan exposure, its fixed income
and equity exposure toward energy:
I would use $17 billion as outstandings for energy loans. And for
securities, I would use, call it, $2.5 billion which is the sum of AFS securities
and non-marketable securities.
In other words, a 7% loan loss reserve toward energy, perhaps the highest
on all of Wall Street.
Then, here is the breakdown by services:
We're focused on the whole thing. Half of those customers - half
of those balances represent E&P companies, upstream companies. A quarter
of them represent oilfield services companies, and a quarter of them represent
pipelines and storage and other midstream activity. And it excludes what
I would describe as investment grade sort of diversified larger cap companies
where we don't view the credit exposure as quite the same.
But the punchline in the problem category was the following exchange with
Mike Mayo:
<Q - Mike L. Mayo>: What percent of the $17 billion is not investment
grade?
<A - John R. Shrewsberry>: I would say most of it. Most of it.
<Q - Mike L. Mayo>: So most of the $17 billion is non-investment
grade.
<A - John R. Shrewsberry>: Correct.
To summarize: $17 billion in oil and energy exposure, which has a $1.2
billion, or 7%, loss reserve assigned to it already, and which is made up "mostly"
of junk bonds.
"... Tempted by big returns, shale companies have borrowed more than $200 billion in bonds and loans, from Wall Street and London, to cover development and projects that may not even come to fruition. Oil producers' debt since 2010 has increased more than 55 percent, and revenues have slowed, rising only 36 percent from September 2014, compared to 2010, according to the Wall Street Journal. ..."
"... On Sunday, the first shale company filed for bankruptcy. WBH Energy LP, a private Texas-based drilling group, filed for bankruptcy after saying that their lender was no longer willing to advance money. The company estimates their debt between $10-50 million. There are hundreds more in the US alone. ..."
"... Analysts believe North American shale needs to sell at $60-100 per barrel to break even on the billions of debt accrued by the energy companies. Indebted companies, fearing bankruptcy, may therefore be forced to keep selling oil, even at a loss. ..."
"... Energy companies that can afford it will cut production, but this will prove more difficult for smaller companies with larger debt hanging over their balance sheets. ..."
"... "It begins in one place like fracking in North Dakota or Texas, but it very quickly engulfs the rest of the world. In that way, its very similar to what happened in 2008… when billions of dollars were lent to people to buy homes they couldn't pay off," economist Richard Wolff told RT. ..."
"... The industry expanded rapidly, as the method proved capable of extracting oil and gas faster and easier than before, albeit with a certain environmental cost. Fracking can increase seismic activity, as well as penetrate water systems. Many states in the US have followed European nations in banning the oil extraction method. ..."
Plummeting Brent oil prices are putting pressure on North American shale,
which has sunk hundreds of billions of dollars into investment, and could soon
come crashing down.
Tempted by big returns, shale companies have borrowed more than $200
billion in bonds and loans, from Wall Street and London, to cover development
and projects that may not even come to fruition. Oil producers' debt since 2010
has increased more than 55 percent, and revenues have slowed, rising only 36
percent from September 2014, compared to 2010, according to the Wall Street
Journal.
Fracking, the process of hydraulic fracturing and horizontal drilling on
land is much more expensive than the average water-based oilrig. However, over
the past years, it has become relatively cheap and fast. Energy companies, eager
to get in on the riches of the American oil boom, have been borrowing money
faster than they have been earning it.
On Sunday, the first shale company filed for bankruptcy. WBH Energy LP,
a private Texas-based drilling group, filed for bankruptcy after saying that
their lender was no longer willing to advance money. The company estimates their
debt between $10-50 million. There are hundreds more in the US alone.
Analysts believe North American shale needs to sell at $60-100 per barrel
to break even on the billions of debt accrued by the energy companies. Indebted
companies, fearing bankruptcy, may therefore be forced to keep selling oil,
even at a loss.
One way to avoid going bust is to merge, which is what many companies already
have on the negotiation bloc.
"We've already seen Baker Hughes and Halliburton agree to merger, and
these were two titans that used to compete head to head," Ed Hirs, managing
director independent oil and gas company Hillhouse Resources, told RT. "They've
decided they can't survive separately, they need to combine," Hirs said.
The Texas-based driller believes that lower prices and major mergers will
hinder progress in the industry.
"We will see a loss of tech. innovation and a loss of competition in the
oil service business," Hirs said.
Energy companies that can afford it will cut production, but this will
prove more difficult for smaller companies with larger debt hanging over their
balance sheets.
Oil prices lost more than 50 percent in 2014, and have already dropped 10
percent in 2015. Futures dramatically dipped when the Organization of Petroleum
Exporting Countries decided not to curb production at their November meeting.
Some experts believe the decision not to cut production, which would have
alleviated oil prices, was a direct strategic move by the cartel to reduce the
profitability of North American oil fields, from Alberta to Oklahoma. In the
past five years, the US has moved from being one of the world's biggest oil
customers to the largest producer, even overtaking Saudi Arabia.
Bubble burst?
This 'bubble' of debt could come crashing down on oil companies, as the housing
bubble did on the sub-prime mortgage industry in 2008, which sparked a crisis
in global financial markets.
"It begins in one place like fracking in North Dakota or Texas, but it
very quickly engulfs the rest of the world. In that way, its very similar to
what happened in 2008… when billions of dollars were lent to people to buy homes
they couldn't pay off," economist Richard Wolff told RT.
The industry expanded rapidly, as the method proved capable of extracting
oil and gas faster and easier than before, albeit with a certain environmental
cost. Fracking can increase seismic activity, as well as penetrate water systems.
Many states in the US have
followed
European nations in banning the oil extraction method.
"... I said it before and I say it again: the Saudi's don't give a fricking damn about US fracking, it's Iran they're after. These "royals" are a nasty bunch, they won't stop at nothing and they couldn't care less about whatever consequences for whoever, them "royal" selves included. ..."
"... And don't forget that production in Ghawar Field is declining 13% a year, even with the most aggressive techniques in the world to bring oil to the surface (nitrogen/water combination). ..."
Its Aramco. They dont have to post any results, they are the blood in a
pool of sharks. Think about Syria, who is going to run that mess, theres
only one group capable, the house of Saud. Thats the deal with the Americans,
access to Aramco for most of Syria, the jihadi's will accept Saudi control
as long as Abu Bakr is gone, we or the yanks will see to that. Think about
it.
Saudis may be "playing a long game" - unfortunately they only have a short
time left! It remains to be seen how the new ISIS inheritors will move the
oil out.
I visited some Aramco facilities in the 1990s. The company retains much
of its American heritage - eg. pool tables in the staff lounges. I would
agree with the idea that it is well run. Its sheer size makes it something
of a state within a state. It has its own airline and does business all
over the world.
There is a phrase apparently along the lines of "God is great but not
as great as Aramco", indicating perhaps that when it comes to it, the geology/economy
trumps theology in the Kingdom.
Its revenues - which are massive, as it easily has the lowest cost of
production of any producer - largely shore up the Saudi state. But hence
the Saudi nervousness about attempts to tackle global warming by reducing
dependence on fossil fuels.
It will be interesting to see just how much of the stock is unloaded.
I am guessing no more than 25%. The prospectus will make interesting reading
and might put the Saudi's off. I mean is there enough money in the capital
markets to devote say $2.5tr to a company which is always, ALWAYS, going
to be controlled by a state. I'd say that's a figure based on today's oil
price. Put the price back to $100 and a 25% slice might be worth $10tr.
one to buy for the dividend though...
Saudi Aramco was previously named 'Aramco'. Aramco stands for Arabian American
Oil Company. U.S. interests (event the buts and bolts were U.S. standard
size), acceptance of decapitation, corrupt governance, and petrodollars.
What else do you need to know? How much the arms industry earns?
And how many refugees they have created through Western/Saudi greed?
arusenior
"a supply glut that Saudi Arabia and fellow Opec members have refused
to address in their determination to drive US fracking rivals out of business"
I said it before and I say it again: the Saudi's don't give a fricking
damn about US fracking, it's Iran they're after. These "royals" are a nasty
bunch, they won't stop at nothing and they couldn't care less about whatever
consequences for whoever, them "royal" selves included.
hashtagthat -> Markets_Observer
They might still be able to produce oil at a profit but that is not the
issue for the Saudis. They need circa $106 a bbl to balance the budget.
I can fill my tank up cheaply but if my wages don't cover my mortgage
I'm gonna burn through my savings ultimately.
Wow - when you put it like that, it's hard not to be persuaded by your well-informed
arguments and incisive analysis! And after all, what do I know - I just
read Wikipedia:
Volatile weather conditions in Europe's North Sea have made drilling
particularly hazardous, claiming many lives (see Oil platform). The
conditions also make extraction a costly process; by the 1980s, costs
for developing new methods and technologies to make the process both
efficient and safe, far exceeded NASA's budget to land a man on the
moon.
I mean, obviously you're right on one level, that if everyone was paid less,
then production costs would fall. But you don't have to buy an oil rig to
drill in Saudi; you don't have to haul it out into the middle of a very
rough sea; you don't have to fly every single ounce of kit out to the rig
by helicopter or on a supply boat, both vulnerable to the endless bad weather
out there; you don't have to use divers; and so on.
TettyBlaBla -> redwhine
Don't forget that Aramco was originally a Standard Oil (of California)
venture.
Look into the history of Standard Oil and how it was forced to break
into multiple separate corporations by the US government, one of these was
Standard Oil of California. It operated as Chevron in the US for a number
of years, acquired Union Oil of California (Union 76/Unocal) and is now
Exxon/Mobil, having acquired Mobil Oil (which used to use Pegasus as its
logo). It has learned well from its founder, Rockefeller and his minions.
Same can be said of AT&T and Verizon, spawn of the US government mandated
breakup of Ma Bell.
smed54235
and the rapid transformation of Saudi Arabia from desert kingdom
to modern nation state
Modern nation state. That's a laugh. They've barely left the Middle Ages.
semyorka
"My grandfather rode a camel, my father rode a camel, I drive
a Mercedes, my son drives a Land Rover, his son will drive a Land Rover,
but his son will ride a camel."
Custodian of the Two Holy Mosques is going to have to worry about some
more earthly blow back from all that Takfiri Jihadism when they cannot pay
the bills.
The price of oil will rebound, but in the medium term they are likely
to begin to see steadily lower production and the world will begin to decarbonise.
ARAMCO does not look like a safe bet.
Eugenios
The cost of fracked oil is too high for it to be the target of this Saudi-engineered
glut. Quite obviously the target is Russia, and the Saudis are in league
with Britain, the US, and so forth in the move.
It is also possible that some of the Finance Capitalist imbeciles think
that lowering the price of oil will lead to an economic recovery. As a matter
of fact the high price of oil was a decisive element in the crash of 2008.
Consider the following prices for Brent crude, so:
January 2002 $19 per barrel
August 2008 $147 per barrel
That does not mean, however, that as oil prices decline the economies
involved will pick up again.
The only sure bet to benefit from low oil prices is China.
Noiseformind
Saudi Aramco is actually only possible in KSA, since it has a wasteland
with no environmental control. Any international company (other than a Chinese
one) will have a lot of issues operating with Saudi Aramco and keep up with
keeping Jubail such a wasteland. Check Google Maps to see how that trillion
dollars valuation is produced.
And don't forget that production in Ghawar Field is declining 13%
a year, even with the most aggressive techniques in the world to bring oil
to the surface (nitrogen/water combination).
So any valuation is subjected to a 13% devaluation every year. And if
the Saud monarchs even show a little flinching in gripping that oil they
will see many other tribes (yes, KSA is just a mix of semi-nomadic tribes
with Bugatti Veyrons) coming to grasp the power.
There are over 1600 "princes" in KSA. That position means they have over
10 million dollars coming from the King directly, plus other rents from
foreign companies that lease their "wasta". If they loose that power in
Saudi Aramco they will rebel very easily.
d1st1ngu1shed -> objectinspace
So do I get this right? The Saudis don't like the Turks. The Turks don't
like the Iranians. The Iranians do like the Russians mainly because the
Russians don't get on with the Turks. The Germans do get on with the Turks.
The US interferes with everybody, (for their own good, and because the Brits
and the French aren't any good at anything any more, except holidays in
Dubai)
Everybody else takes care.
I haven't forgotten anything have I? Syria Ooooo! Them.
Usedhankerchief
The sale of Aramco doesn't mean that much. Rumours of over-stated reserves
are one thing, production problems at Gharwar another. The problem for the
buyers of the shares is that the Saudi state is becoming dysfunctional,
and the assets are in Shia areas, so there will be a huge write-down because
of those risks. Its the worst possible time to sell, so they must really
have problems.
PSmd -> SirWillis
Well, a lot of work done by foreign people there, unemployed youth, the
public sector employs 60% of the Saudi population, they're masking what
unemployment might really be. Indeed, running 22% deficit, trying to find
a way to get prices back up, quite a balancing trick.
MacCosham -> redwhine
1. Fracking companies weren't making a profit at $100 oil, let alone
$50.
2. Fracking technology has existed for the past 30 years.
Let's face it, the main innovation that created the fracking boom was
7 years of 0% interest rates.
I did hear on the radio last week that there appears an economic war is being played out between
Saudi Arabia and Iran. Truth of this I don't know.
But, what does concern the world at these prices are major trading companies may go bust.
On derivatives and oil futures somewhere someone is carrying huge losses.
And, concerning the world economy derivatives are a markets of 70 or more trillions dollars
, enormous markets, as Warren Buffet once said derivatives are financial weapons of mass destruction.
Somewhere in the world financial system huge losses on derivatives are sitting.
World Politicians shied away from the tough decisions under the guise of quantitative easing.
QE appears to have caused greater missallocation of resources.
2008 financial crisis is reemerging from its dormant position. 2008 was just push further down
the road.
Social Cohesion in Britain needs this time to really all be in this together.
" On derivatives and oil futures somewhere someone is carrying huge losses. "
The Big Lie - "zero sum game".
If that is true - play Monopoly in your own time with your own money.
That "zero sum game" pays billions in profits - so where does the money come from ?
Would love to know that myself.
This is a much too specific question for an economist - like asking for the winner of the 2-30
at Kempton.
Perspective is always a good thing -
This is what happens when central banks across the world inflate the biggest bubbles the world
has ever seen by keeping interest rates at near zero percent for 7 years. Let's make one thing
clear - China is not the only culprit for the latest fears over the global economy, to say that
many western economies such as the US or the UK have recovered or are on the road to recovery
would be disingenuous to say the least.
We have been scraping along at the lowest rate of so-called "recovery" (debt-fueled with ZIRP)
after a recession despite these interest rates - what would it have been like if rates were increased
a couple of years ago? One can only guess, but it would be fair to estimate that we would be back
in a recession.
So, here we are again, back at the latter stages of the next cycle in the boom-bust oscillations
of our global economy - and "is this time different"? Yes, but only by the measure that this time
there is little that central banks can do to mitigate or even slow the financial crisis. The 2008
crisis never really ended, this year we will undoubtedly see that the real part of that crisis
is about to unfold - capitalism should be allowed to take place this time, and if that means huge
corporations filing then so be it.
"if that means huge corporations filing then so be it."
I agree - but they are Ok, in fact loaded with cash.
"May 8, 2015 At the end of last year, U.S. non-financial companies held a staggering $1.73
trillion in cash, up 4% from the $1.67 trillion on hand at the end of 2013, found Moody's."
http://www.forbes.com/forbes/welcome
/
So much of the debt has been loaded on sovereigns - what will they do - file for bankruptcy
?
OPEC should not allow members to sell oil at a financial loss. Oil is trading below its intrinsic
value and there are serious imbalances in the market. Member countries that sell oil below market
value lose money in two ways. They add supply to a depressed market and they lose money on the
transaction itself. It would make much more sense for OPEC to target minimum profitability as
their primary goal for all members rather than trying to use their market position to eliminate
producers in the United States.
Since most of the large energy companies in the United States
are publicly traded, it would be better for OPEC members to use their profits to purchase equity
in these companies rather than trying to make them unprofitable. I propose that OPEC target a
specific and stable price long term and then to adjust that price for inflation. For instance,
if it is determined that all members can profit at 70 dollar oil, then they should lower production
when the price is below that and increase it when it is above that. Member countries then use
a percentage of their profits to increase their reserves with share purchases of other non-opec
producers, thus increasing reserves long term.
Saudi Arabia has again badly miscalculated.
By pumping vast amount of Oil, KSA thought it could sink America, Russia and Iran oil companies
and Economies
Well it seems KSA is going broke! I am celebrating...
Current Saudi finance minster is Ibrahim Abdulaziz Al-Assaf
"After leaving academia, Ibrahim moved to Washington, DC where he represented Saudi Arabia
at the International Monetary Fund (IMF) and the World Bank
...
In addition to being finance minister, Ibrahim is a member of the board of directors of Saudi
Aramco (since 1996), the state-owned national oil company,
... https://en.wikipedia.org/wiki/Ibrahim_Abdulaziz_Al-Assaf
Is this history repeating itself?...but in China.
1998 Russian financial crisis.....Their stock market collapsed followed by a run on the ruble
which was devalued.
Most Russians suffered as their pensions, wages etc were severely devalued.
Same could be happening today in both China and Russia...
Financial war....Dinosaurs versus dinosaurs.
How to wreck a country....Trash it's markets and currency.
It's the law of the jungle.....The strongest survive.
However Russia and China will not take it lying down....Scary times indeed.
It seems that the Chinese market is under the greatest pressure...only to be propped up by
the government pumping money into it. (printing money)...result will be their currency devalues
and everybody in China suffers.
It has happened many times to many countries before...e.g. Germany, Argentina, Brazil, Russia
etc....
Two quick points.
First, OPEC has increased flow to destabilise Russian & Iranian profits. However, this situation
demonstrates that the price of oil should never have been much higher.
Second, China has a better approach to wealth re-distribution than OPEC nations and all advanced
economies. If a genuine desire to increase economic activity were expressed then wealth sitting
in secret accounts and held by the top 10% would be taxed & spread to the true wheel of economy:
ordinary people with poor purchasing power.
When the debt merchants, the money alchemists and voracious volatility vultures start panicking
(Hey, it's all relative. Don't worry, THEY'LL be fine) and looking for 'safe havens' (anything
deemed to have an intrinsic value, but still not gold as, 'we're not bloody savages, y'know...yet'),
when prices, particularly the golden goose commodities that kept them in (debt fertilised) speculative
clover in their (hopefully fitful) sleep, start to reflect genuine economic reality, then you
know it's probably squeaky bum time for the hapless cannon fodder that didn't cause this train
wreck, reaped little of its rewards, but nevertheless will bear the brunt of its consequences
yet again.
High rate temporary debt junk bonds are already failing. Those issued on the small oil drillers.
But it is a relatively small part of the junk bond market itself nevertheless financial institutions
overall.
Small companies are due to fail and will. the larger ones will pick up the pieces at rock bottom
prices and things will go on.
The numbers anywhere in developed economies don't support recession. China by the worst guesses
is still par on GDP. By most takes between 4 and 7 increasing GDP. With the looming effects of
el nino on India I would not say it could enter a recession in the next 6 months but that would
be a isolated event. The US no where close. People are taking the low oil prices as a read on
the economy. It is not this time global consumption is going up not down. It is a supply glut.
I live near KSA, and I see first-hand how corrupt and morally bankrupt the whole thing is. I also
see how incredibly subsidised EVERYTHING is. The people of these countries are little more than
spoiled children, with no incentive to work properly or even understand the businesses they are
in. Russia has a much more diverse economy, in KSA it is almost entirely oil. The rest of it is
industries that rely on oil money - such as the construction sector.
Offering an IPO on KSA's oil will expose the total incompetence and corruption behind the company,
I don't know how they hope to hide it all. So, you're right, all is far from well. I will be packing
my bags at the first sign of revolution, which I predict will be in 3-5 years. I don't think people
yet realise how bad things are going to get once KSA implodes and Iran and ISIS seek to take advantage.
It's going to be ugly, and I must admit, I'm a little scared.
the reason you have a collapsing global economy is because the idiots created one through a battery
of Free Trade Agreements that were aimed at over -riding local sovereignty and democracy and accessing
scab labour on an international scale
It didn't work did it - by dismantling local industry and exporting manufacture to countries
like China the middle class in the West made itself redundant
Welcome to the great unwashed guys - you are one of us now and with less skills to survive
- I don't think your economic and managerial skills will impress anyone
You did it all to yourselves ...Get in the queue for the welfare you denied others - and reflect:
"So the last shall be first, and the first last: for many be called, but few chosen."
People are confusing the stock market with the economy. The economy is ho humming along. The market
is artificially inflated in value by above stated factors. Not by a whole bunch but enough to
make a sell off of minor sort a probable.
Earnings will once again be real and not a thing of less stock per earning share.,
Report
I wish I could upvote this twice. It's not like e.g the dot.com crash, where a bunch of hopeless
money-losing pipe dreams fell apart. Facebook, Apple et al actually make a profit and have a niche,
it's just that with so many other investments offering desultory returns, the stock market has
been pumped up by desperate speculators.
I am not sure why people think the Saudis are in trouble.
Most of the shale is becoming uneconomical to recover if you believe the forward curve. $50
oil for 5+ years, they will need closer to $100 to go back to the capped wells. The frackers are
just taking the first 30% of the cheapest oil to produce (1st 18 months), capping and moving on.
They are churning through oil reserves at 3 times the rate to do it.
They can still do it until they get to debt repayment. Anyone thinking the industry got ultra
efficient over night is optimistic feller.
The reality is shale gas is not the primary concern. They want rid of artic, deep water and
tar sands. My guess is the Saudis would be more than happy to let the US be the swing producer
as shale is far more flexible. Shale was the trigger not the problem.
I'd be quite happy to see the whole stock market free fall. The current inequity and greed deserves
it's reward. Money for nothing investors and free loader corporations that don't pay their share
of taxation will be the ones who go down. A new system is required to break away from the old
established power and energy companies that have led us to the brink of devastating our planet.
The capitalists are the victims of themselves. Fortunately for them, they own the wealthiest states
on the planet. And therefore, can always expect welfare, social assistance and
bail-outs whenever they burst another bubble. Socialism for the rich.
We are a stupid species to put up with this casino scam. If you disagree with the ponzy scheme,
start by supporting Sanders in the U.S. and Corbyn in the U.K. At least it's a modest beginning
to opposing these criminals.
China stock piling oil is a good idea, may help explain recent capital outflows , of which
the article does not explain the opaque /nebulous financial details of these movements. It maybe
China shuffling pieces on a board.
"The country's global trade surplus widened by 21% to $60bn in December. Over the whole
year it was $594bn. The country's trade surplus in December with the European Union, its biggest
trading partner, increased 36.8% to $15.6bn. The surplus with the US contracted 6% to $19.4bn."
No doubt the figures need to treated like all PRC figures.
That said it is undeniable that China had another huge trade surplus.
Yet despite this they manage to cheat on their exchange rate and devalue the Yuan.
The Currency/Trade Wars are in full swing..
By then then most of the oil residues, waste and plastic products will reside in the Worlds Seas
and Oceans. I've not seen much movement to remove the plastic gyres floating around the Southern
Pacific Ocean. Land waste management has serious flaws as well. The only 'waste management ' in
the UK that is booming is all the junk that motorists chuck out of their cars when mobile - they
must think that plastic bags hanging from tree branches 'adds' to natures wonders. In a resturant
car park the other day were 2 used babies nappies left in a parking bay - some people are scum
and these couldn't have been poor.
Incredible how low the West in cahoots with Saudi Arabia will stoop, and all in an attempt to
crush Russia economically and politically. And the media continues the deceptive narrative about
troubles everywhere, brought on by 'competition' among oil producers, except pointing to the true
and only reason behind the low oil price. The public in general swallows the 'explanations' forgetting
that the ball started rolling downhill immediately after the USA twisted Germany's and other western
European countries to impose sanctions on Russia in retaliation for it's welcoming Crimea back
to the Motherland. In the name of this geopolitical game, the good people of USA, Canada and other
countries whose significant part of income derives from natural resources and related products,
are loosing their jobs by the thousands. All is well and according to the plan, as long as Russia
suffers more than the West, and will be the first to bite the dust. The world economy will then
be turned around to everyone's relief.
Seems the FED's recent interest rate rise was premature. If another 2008 does happen calls to
abolish it will grow ever louder, especially since economic chaos will smooth Trump's path to
the White House, and Trump has made FED abolition one of his campaign pledges. After repeated
failures catastrophes under Greenspan, Bernanke and now Yellen it seems the FED is surplus to
requirements.,
Report
What will they do after abolishing the Fed? Will they have a single national currency or allow
each bank (or any other entity) to issue its own currency and let these different currencies compete
with each other?
If they continue to have a single national currency, who will issue it and set the monetary
policy? Another Central Bank or the government? If it is going to be another Central Bank what
exactly is the point of abolishing the Fed? Why not change the law to allow the government to
remove the Fed's board of governors and appoint those they think are more competent than Janet
Yellen and other governors, since abolishing the Fed will anyway require the repeal of the law
establishing it i.e. it too needs Congressional approval. If the government is going to be issuing
the currency and set the monetary policy, in what way would it be superior to the Fed doing the
same?
If they allow any entity to issue its own currency, what currency will the taxes be denominated
in?
Well the predictions were for four rate hikes in the year. Now perhaps we see two. The one already
and another. Things get better and it is up to four. The dow only dropped three hundred or so
and the S and P is above its support level, which is about 1857 to my dim recollection.
So till we exceed that support to the downside, really things are not bad. A wash out was probably
a necessary thing.
I think people are overdoing this thing. The media seems to be hyping the decline which may
account for all the sell side prognostications.
Earning are just beginning. If I see indications that earming are the mover behind the sell off
I would have concern. Alcoa all things considered was not that bad. Certainly not as bad as the
tape today. OIl by my guess is the real mover as the new lows have people spooked.
I am not to worried it can flip up or down but it really is only a small part of the market nowadays
not what it was in yesteryear.
So I repeat this is overdone, that is my opinion. Those calling gloom and doom on this action,
no offense but this little resembles any major sell off of a lasting duration spiral down. What
is the mover….low oil prices? The rest of the market benefits from low oil prices.
Sentiment can drive things lower but really only for so long. Chinas last numbers reported
were better than expected. Me being cynical and seeing the talking heads talking things down anticipate
it is the big money movers trying to create some action on the short side. How long they keep
this up is a guess. But it requires someone to keep pressure on to move it down. Without new bad
news on China, what is the precipitive factor….nothing new here.
Unfair market system, Complete waste of time, energy and resources. Destroy all the stock markets
along with corporations and Banks. It is time we stop playing this ridiculous economic game and
start concentrating on the real issues that we are facing. Poverty, Conflicts in the middle east,
environmental degradation, climate change, and many more. What is the root cause of all of these
problems? Yes it the socioeconomic system capitalism with its flawed monetary system owned by
the corporations and the Banks that does not care about the well being of planet or nature and
the well being of all human beings but only care about their own wealth, power, fame, egos. Such
idiots!!!!! stop playing their game and move to a new fair game called RBE and other similar systems.
It is very stupid of us to base our economy on something as unstable and selfish as the Stock
Market, as well as something as unstable as governments, democratic and otherwise. It is about
time we became as intelligent and clever as all these whizz kids who invent amazing technology
and make amazing discoveries. It is about time we became whizz kids at organising an intelligent
and reliable economy. For us.
Why do banks charge an interest on loans? If the function of money is to get the economy started
and running, then the work done and the profits made should be a sufficient reward. Banks could
actually give money away on a non-return basis, so long as the money goes to people who will spend
it, this spending lending to more spending.
Perhaps the private owners of the current private currencies want more than a sound economy,
perhaps they want power, and want to exercise this power just to know for real that they have
it? Perhaps they are not fully-fledged human being animals but suffer some form of genetic or
social affliction that makes them behave in dangerous anti-social ways? Perhaps they don´t give
a fig about other human being animals - other than those who serve their biological wants and
needs? Perhaps shareholders are afflicted in the same way?
Perhaps we could form our bank to issue our non-returnable money, and even decide what work
is worthwhile and is done and what work is not worthwhile and so will not be done?
Millions of years ago, so we are told, some fish came out of the sea and survived. What I am
suggesting is a work and economy evolution of a similar scale. Current economic theory has us
all drowning in the quagmire of self-interest-driven chaos, self-styled as a "social science".
Perhaps we could come out into fresh air and create a diversity of human activity on a par with
the diversity of living things on land and in the air that came from those first brave fish that
ventured beyond known limits?
Columbus did not go over the edge of the world but discovered a whole New World.
Perhaps we need to go beyond even the "thinking outside the box" box?
Who funds international terrorism try the oil rich countries in the Middle East so let's assume
the Yanks have got smart for once and are flooding oil market to bring down these economys .
The end game is destabilise them then pick up their oil industries for a song and influence just
who makes Middle Eastern policys by economic means .
Bit of a dream but hey nothing falls down in price to this extent without a hidden reason given
its a fossil fuel that should be rising to maintain supplies for the long term .
The economy is like a super tanker and these results are still the effect of the ripples of the
economic crash almost a decade ago. The result of lower oil prices will be that ordinary people
will start to realise they have more disposable income than they did a year ago and start spending
that money on more shit they don't need and the economy will swing back with a vengeance.
Well surely all those neoliberal economists can't be wrong....it must be the fault of that evil
Mr corbyn and his army of trotskyists.....HA HA we are on the slippery slide to another global
crash folks ...
Sigh....the stock market....virtual money and speculation...Worst thing ever created causing insane
chain effects in economies. Although....why were economies booming before when Oil price was low?
Cause sure oil companies profits go down, but every other business that uses the oil increases
their profit. Isn't this also a good reason to start doing something about being so oil dependant?
Once in a lifetime chance for the USA to escape from the strangle whole of the Saudi oil grip.
Fracking gives them a chance to break with the Saudi s or even break them for good.
Failure doesn't t bear thinking about, and we all know where Obama s sympathies lie - but in modern
America who cares.. the battle is between the giant bureaucracies, not the democratic froth on
top of the cake.
Always remember America in you hour of destiny there were Americans long before there was the
USA . And will be long after it is gone. And for the love of God .. COLUMBUS did not discover
America. Which ironically is named after a Welch sheep farmer.?
Americo FrontHoovesintheWellies was his full name. Knew a thing or two about sex and sheep.,
Report
Most US oil comes from Canada and Mexico, a very small percentage from Saudi Arabia. But they
have enormous financial influence through bonds, obviously, and buying media and politicians.
Also Israel and Saudi Arabia have been working together under the table for some time, as was
obvious during the Gulf War, and now in their efforts to begin a war against Iran. Fracking has
never been any threat to the Saudis--the cost is too high. Their present lowering of oil prices
is directed against Russia, surely in cahoots with the US.
Oil and US share prices tumble over fears for global economy.
The economists have been telling us that there is little danger for the US economy to be pushed
into recession by a slow-down in the Chinese economy - referred to here as "global economy". More
importantly, in election years the US Markets have never been good indicators of the US economy,
anyway.
The real reasons for the US market plunge are the trades conducted on behalf of the Wall Street
tycoons and the Saudi Royal Family. Both are doing their best to push the markets down, because
they are deeply worried of having another Democrat in the White House, come January 2017.
The Wall Street tycoons are apprehensive about getting dragged into courts for their financial
mischiefs during the last decade. The Saudis are concerned that the US leaning further toward
Iran, which will encourage their internal oppositions to demand reforms, which could include getting
rid of the Royal Family. So, both the Saudis and the Wall Street tycoons have a common cause.
They will "keep at it", until they can be sure that the next US president will be a Republican.
"National debts, i.e., the alienation of the state – whether despotic, constitutional or republican
– marked with its stamp the capitalistic era. The only part of the so-called national wealth that
actually enters into the collective possessions of modern peoples is their national debt. Hence,
as a necessary consequence, the modern doctrine that a nation becomes the richer the more deeply
it is in debt. Public credit becomes the credo of capital. And with the rise of national debt-making,
want of faith in the national debt takes the place of the blasphemy against the Holy Ghost, which
may not be forgiven.
The public debt becomes one of the most powerful levers of primitive accumulation. As with
the stroke of an enchanter's wand, it endows barren money with the power of breeding and thus
turns it into capital, without the necessity of its exposing itself to the troubles and risks
inseparable from its employment in industry or even in usury. The state creditors actually give
nothing away, for the sum lent is transformed into public bonds, easily negotiable, which go on
functioning in their hands just as so much hard cash would. But further, apart from the class
of lazy annuitants thus created, and from the improvised wealth of the financiers, middlemen between
the government and the nation – as also apart from the tax-farmers, merchants, private manufacturers,
to whom a good part of every national loan renders the service of a capital fallen from heaven
– the national debt has given rise to joint-stock companies, to dealings in negotiable effects
of all kinds, and to agiotage, in a word to stock-exchange gambling and the modern bankocracy."
"... Additional volumes from Iran are already priced in. And if the increase in Iranian supplies is not much bigger than anticipated, the market reaction will be muted. There could be even an upward correction next week. The oil market is oversold after two weeks of sharp declines. Short positions are at record levels. So traders may decide to take profits on short positions. ..."
"... That doesn't mean, however, that the market has reached the bottom. Prices will remain very volatile during the course of 2016, and will likely test new lows in the next few weeks and months. ..."
"... $40-50 range in second half of 2016 will not save most LTO. ..."
"... I think that AlexS agrees LTO output will decline at these prices, but that increases elsewhere will make the decline in world output modest (maybe 500kb/d), the excess oil in storage will take some time to draw down to average 5 year levels, about a year if this estimate is correct, so it will take some time for oil prices to rise. ..."
"... I expect World decline in 2016 to be about 1 Mb/d so stocks return to normal levels more quickly, and oil prices rise more sharply, maybe to $60 to $70/b by Dec 2016 (monthly average). ..."
"... Yes, I think the LTO industry will remain in a surviving mode, and many players will not survive. There will be more bankruptcies, distressed asset sales, and LTO production may decline by some 0.5-1.0 mb/d (depending on the ability and willingness of financial institutions and the government to help shale players). ..."
"... Thus, the EIA expects U.S. onshore C+C production to decline by 0.8 mb/d this year. And even "shale optimists" and oil price bears, like Goldman and Citigroup, are projecting a 500-600 kb/d drop. ..."
"... As regards conventional oil industry, it can survive at $40-50. While these price levels lead to sharply reduced investments and project delays, they cover operating costs and maintenance capex for most conventional players worldwide. For conventional oil, there is a big difference between $25-30 and $40-50. ..."
"... Yes, I still think the probability of an OPEC cut in 2016 is less than 10%. ..."
"... It simply doesn't make sense for the Saudis and their allies (UAE, Qatar, Kuwait) to change their strategy without having achieved their goals. If they cut production, shale companies will quickly increase drilling and output volumes, taking large part of OPEC market share. ..."
"... There will be more pain, more bankruptcies, even sharper cuts in investments and drilling activity and continued declines in output volumes. That would not kill the shale industry, but will make is much less arrogant, more cautious, more financially responsible, and less growth-oriented. ..."
"... The Saudis can afford 2 or 3 years of low oil prices thanks to their foreign reserves and access to foreign capital markets. And by that time the oil market will rebalance itself without any help from OPEC. ..."
"... I think maybe many LTO/gas companies are at the capitulation stage right now. ..."
"... Practically every US public oil producer is paying bills with borrowed funds. ..."
"... I think AlexS thinks (and I agree) that the low oil prices will be temporary and will rise to higher levels, OPEC may also think this is true and sees no need to cut. I think oil prices will rise to higher levels than AlexS, because I think oil supply will fall more quickly than he does. In the past I have been wrong on how quickly this would occur, this may continue in the future, time will tell. ..."
"... I just don't think a lot of oil investment will occur at an oil price of $45/b (where AlexS thinks oil prices will remain for a few years, maybe 2015 and 2016). I expect at that oil price we might see non-OPEC oil output decline by about 5% (roughly 2 Mb/d). That in turn will balance oil markets and cause oil prices to rise, possibly by mid 2016. ..."
"... I did not enjoy $40-$55 oil the first half of 2015, but could live with it. Could live with it in 2016 also. I think we are more like OPEC in that regard. I think that was what OPEC foresaw. But they didn't realize that LTO would keep getting money to drill. For example, CLR, with $7.1 billion of long term debt as of 9/30/15, and only $17 million in cash, still has many rigs drilling. They should have zero under normal circumstances. ..."
"... One thing I wonder about. Say prices stay here awhile, sub $30. If the LTO money from the banks does freeze up, and prices rebound to $50-60, do we see a big rig spike? Wont most LTO have been too damaged? ..."
"... the current oil price decline is more than four times longer (17 months and counting) [ then 2008 pirce decline] ..."
"... And another absolutely crucial difference between the 2008 price decline and the current price decline is that the volumetric loss of US Crude + Condensate (C+C) production in 2008 was probably only about 0.25 million bpd per year whereas it is plausibly around 1.5 million bpd per year now. ..."
There is an old saying:" Buy the rumor, sell the fact". In the particular case of Iranian supplies
I would say: "Sell the rumor, buy the fact".
Additional volumes from Iran are already priced in. And if the increase in Iranian supplies
is not much bigger than anticipated, the market reaction will be muted. There could be even an
upward correction next week. The oil market is oversold after two weeks of sharp declines. Short
positions are at record levels. So traders may decide to take profits on short positions.
That doesn't mean, however, that the market has reached the bottom. Prices will remain
very volatile during the course of 2016, and will likely test new lows in the next few weeks and
months.
But in the second half, in my view, the market will start to rebalance, and prices may reach
the $40-50 range.
I think that AlexS agrees LTO output will decline at
these prices, but that increases elsewhere will make the decline in world
output modest (maybe 500kb/d), the excess oil in storage will take some
time to draw down to average 5 year levels, about a year if this estimate
is correct, so it will take some time for oil prices to rise.
I mostly agree with AlexS's analysis (if I have it right), the only
difference is that I expect World decline in 2016 to be about 1 Mb/d so
stocks return to normal levels more quickly, and oil prices rise more
sharply, maybe to $60 to $70/b by Dec 2016 (monthly average).
– "$40-50 range in second half of 2016 will not save most
LTO"
Yes, I think the LTO industry will remain in a surviving mode, and
many players will not survive. There will be more bankruptcies,
distressed asset sales, and LTO production may decline by some 0.5-1.0 mb/d
(depending on the ability and willingness of financial institutions and
the government to help shale players). But this decline is already
anticipated in most forecasts. Thus, the EIA expects U.S. onshore C+C
production to decline by 0.8 mb/d this year. And even "shale optimists"
and oil price bears, like Goldman and Citigroup, are projecting a 500-600
kb/d drop.
As regards conventional oil industry, it can survive at $40-50. While
these price levels lead to sharply reduced investments and project
delays, they cover operating costs and maintenance capex for most
conventional players worldwide. For conventional oil, there is a big
difference between $25-30 and $40-50. Therefore, I believe prices can
remain at today's levels only for a few weeks, (no more than 2 or 3
months), but the period of $40-50 oil may me much longer (up to 2 years,
in my view).
Given that there are many projects at final stages of development, they
will largely offset declining production in the old fields, so this year
there will be only modest decline in non-OPEC production ex-US. But
projects delayed in 2015-16 will significantly impact production levels
by the end of this decade and especially beyond 2020.
– I assume your view excludes an OPEC cut in 2016
Yes, I still think the probability of an OPEC cut in 2016 is less than
10%.
It simply doesn't make sense for the Saudis and their allies (UAE,
Qatar, Kuwait) to change their strategy without having achieved their
goals. If they cut production, shale companies will quickly increase
drilling and output volumes, taking large part of OPEC market share. And
that would eventually again lead to lower oil prices.
By contrast, if
prices remain low for 2 or 3 years, the situation around LTO may change
drastically. There will be more pain, more bankruptcies, even sharper
cuts in investments and drilling activity and continued declines in
output volumes. That would not kill the shale industry, but will make is
much less arrogant, more cautious, more financially responsible, and less
growth-oriented.
An OPEC cut actually means Saudi cut, as the so called price hawks,
like Venezuela and Iran, usually tend to cheat and not to cut production.
Furthermore, Iran has stated very clearly, that they will not participate
in OPEC cuts, as during the period of sanctions Iran's market share was
taken by the Saudis and others.
Iraq also says that for many years they
have been producing well below their potential and now they are
implementing long-term plans to increase production capacity. Hence, an
OPEC cut would result in Saudi Arabia (and to a lesser extent Kuwait and UAE) taking the burden of balancing the market through lower production,
while their market share would be taken not only by LTO, but also by Iran
and Iraq.
The current tensions between Saudi Arabia and Iran make any accord
on output cuts within OPEC even less probable.
The Saudis can afford 2 or 3 years of low oil prices thanks to
their foreign reserves and access to foreign capital markets. And by that
time the oil market will rebalance itself without any help from OPEC.
You and OFM actually pointed out a factor that is
supporting oil production even if it is loss-making: high abandonment
costs and the need to retain workforce.
Also note that most conventional producers are in a much better
financial situation than LTO. Only a few of them (like Petrobras) have
large debt levels.
I think maybe many LTO/gas companies are at the capitulation
stage right now.
I follow several, but full disclosure only own XOM and COP, and not
a lot of either. COP is having trouble, with a recent closing price of
$39.36 and s dividend yield of 7.18%. They really need to cut the
dividend. However, the stock could really collapse if that happens. It
was in the 80s not long ago.
When the price started falling in 2014, I made a list of the LTO
and MLPs. I listed 55, which I am sure is not all of them.
29 of the 55 are trading under $10 per share.
Of those 29, 21 are under $2 per share.
5 have been delisted. 7 more are under $1, meaning delisting is
coming.
One I pick on frequently is CLR. As of 9/30/15 They had $17 million
of cash v $7.1 billion of debt. For perspective, it is the same ratio
as s family having $17,000 cash and owing $7.1 million dollars. Their
DD & A has been running $21-22 per BOE. Today they are realizing gross
revenues of about $15 per BOE. This is before deductions for severance
taxes, OPEX and G & A.
Practically every US public oil producer is paying bills with
borrowed funds.
Does OPEC really need to keep oil under $40 through 2018 to achieve
its goals with US shale?
I think AlexS thinks (and I agree) that the low
oil prices will be temporary and will rise to higher levels, OPEC
may also think this is true and sees no need to cut. I think oil prices will rise to higher levels than AlexS,
because I think oil supply will fall more quickly than he does. In
the past I have been wrong on how quickly this would occur, this
may continue in the future, time will tell.
I just don't think a lot of oil investment will occur at an oil
price of $45/b (where AlexS thinks oil prices will remain for a few
years, maybe 2015 and 2016). I expect at that oil price we might
see non-OPEC oil output decline by about 5% (roughly 2 Mb/d). That
in turn will balance oil markets and cause oil prices to rise,
possibly by mid 2016.
Shallow, my opinion on this is virtually worthless, but whereas I
previously predicted that they would not cut in December, I now
think they will cut (even without cooperation) within the next six
months. Things are starting spiral out of control and they have
already poisoned American LTO, just waiting for it to take effect.
Greenbub. My thesis from the beginning of the price drop was
that LTO needs a high, stable price. Unlike LTO, Gulf OPEC can
much more easily live with price volatility. When OPEC did not cut Thanksgiving, 2014, I was not
surprised. Nor was I surprised that US rig count fell off a
cliff in response.
What did surprise me was how US production did not drop. I
now realize some of that was due to GOM. However, much is due to
the continued completion of high IP, high decline LTO wells.
North Dakota Bakken is the best to see this, as we have the best
data. I think this surprised OPEC also. I looked for prices in the
$50s-$60s to stall LTO, then cause it to fall. I was wrong.
What I also did not see coming was OPEC boosting production
as they have. Same with Russia. The Iranian issue was not
expected either.
I did not enjoy $40-$55 oil the first half of 2015, but could
live with it. Could live with it in 2016 also. I think we are
more like OPEC in that regard. I think that was what OPEC
foresaw. But they didn't realize that LTO would keep getting
money to drill. For example, CLR, with $7.1 billion of long term
debt as of 9/30/15, and only $17 million in cash, still has many
rigs drilling. They should have zero under normal circumstances.
$30-40 oil hurts us, but again although losing money, it is
survivable.
We are now at $24.XX per barrel, which is devastating. I have
to think it is also devastating for both OPEC and Russia.
How much in reserves does KSA burn when they sell oil at $25?
One thing I wonder about. Say prices stay here awhile, sub
$30. If the LTO money from the banks does freeze up, and prices
rebound to $50-60, do we see a big rig spike? Wont most LTO have
been too damaged?
As I have previously noted, if we define the duration of the
2008 oil price decline as the number of sub-$100 months until
monthly prices exceeded the monthly low price (12/08 for
Brent), the duration was only four months–until we saw a
sustained price increase in excess of the monthly low, and
the monthly Brent price rose from $40 in 12/08 to $74 in
12/09 (Brent exceeded the $100 mark again in 2/11):
Using the same metric, the current oil price decline is more than four times longer (17
months and counting) [ then 2008 pirce decline]
However, it took about two years for the US rig count to
again hit the vicinity of the 2,000 mark, after falling below
1,000, in response to the 2008 "V" shaped price decline. I
wonder when, or even if, the US rig count will again approach
the 2,000 mark.
And another absolutely crucial difference between the 2008
price decline and the current price decline is that the
volumetric loss of US Crude + Condensate (C+C) production in
2008 was probably only about 0.25 million bpd per year
whereas it is plausibly around 1.5 million bpd per year now.
"... America threatened Russia some time ago about meddling in the affairs of
Syria ..."
"... The US is really going for broke on crashing the oil price ..."
"... All of this to try to contain Russias military rearmament made possible
by sky high oil prices ..."
"... Has the west finally gotten wise to the Saudi money that flows into extremist
groups? Would seem so. West seems to be doing everything it can to contain the Saudis.
eems to be doing everything it can to contain the Saudis. ..."
"... Yes because of millions of refuges that Arab countries caused by supporting
ISIS it is completely natural for west to go after Saudi Arabia and its allies sponsor
of ISIS. So they got what they deserved. Today I also read that the markets in Saudi
Arabia, Qatar and Emirates collapsed and I think this a beginning of an end for
them. ..."
"... The Iranians deciding that their revolution has matured sufficiently for
them to plainly state we dont wish death on anybody, our religion is about peace,
and to demonstrate our sincerity well urge our people to stop such rhetoric would
contribute to Irans rehabilitation as a more or less normal member of the global
community of nations. ..."
"... This has to be the beginning of the end for the Saudis and Qataris and
their utter crapulence, all at the expense of the rest of the World. OPEC has no
answer for this and is completely impotent to do anything about it. The cartel is
busted. ..."
"... And so it seems with oil. There has to be a base production cost which
doesnt vary and I doubt that the Saudis or Iranians are selling it at under that
cost - they both need a modest profit - so, one wonders, if they can make that modest
profit at $30 a barrel, think how much they were making at $100 ..."
"... The U.S and Iranians are using each other against their own allies. U.S
is using Iran to put pressure on Saudi so that they keep producing more oil to bankrupt
Russia, despite it destroying Saudi economy. Iran is using USA as a counterbalance
to Russia because as much as they want Russias help, they dont want Russia to become
too strong in the region. ..."
"... In my view Iran was never quite the bad guy that the western governments
portrayed it to be. We certainly have differences. But if you compare Iran and Saudi
Arabia there is no contest - Iran is far less a bogeyman. ..."
The funny thing is that the sanctions have probably helped Iran as it had
to survive with less. Iran now gets access to it's foreign banking about
50billion net and can start exporting again.
Saudi is burning through its reserve cash and it's populace are used
to getting things for free, will they survive low oil revenues like Iran
or is the House of Said on the brink of annihilation? Talk about shooting
yourself in the foot!
It's amazing how detrimental oil has been to the middle east. If only
they could have gone down a similar path to Norway....
Seeing Iran to go into economical slow down was a depressing sight. OPEC
definitely took a huge share of IRAN'S oil fortune and that time can not
come back. PART of it was Iran's fault agreed, but since Iran's sanctions
are lifted you cant blame it.
It's just taking a share of what it has lost in years. This will indeed
afftect gulf region and other oil exporting countries but HEY BACK TO REALITY!!!
Indeed its bad time since oil is already record low thanks to Fracking.
This time is like dubstep for environmentalists who are dancing on oil price
beats. No one is actually explaining the actual picture behind the scene
as hundred of thousands of jobs are being slashed. Its like a death sentence
for oil workers like me. 1 year since graduation as a petroleum engineer
still no job worried to pay debts and there are countles like me. In short
low oil prices won't make things better but worse.
"The French-listed aircraft maker Airbus also looks set for a significant
boost from the sanctions ending"
It is the first time, a British newspaper says "French aircraft maker Airbus".
Yes Airbus is principaly a French company and not a European one contrary
to what British newspaper often say.
Indeed...the magic answer is interesting to say the least. America threatened
Russia some time ago about meddling in the affairs of Syria and other
cooperative business tactics. This manipulation is more about the benefits
beneath mainstream media...plus, it is an election year...of course, oil
is welcome and plentiful...somehow...it always is election time...though
the added incentive does make Russia cringe a bit...these United States
knew the only way to allow Russia to feel pinched was this way...so her
and her cohorts have combined efforts to achieve their goals. Hmmm...
Hammond is such a prostitute with his comments. They have been sucking up
to Saudi/Qatar and UAE for decades, but now they are all on the slippery
slope, he says 'dump them all and start courting Iran'. The man has no shame
whatsoever.
The US is really going for broke on crashing the oil price:-
1 Deal with Iran (to increase supply)
2 Saudis pumping as much as they can (favour to US who turn a blind eye
or help their regional aspirations by financing ISIS and AQ)(note the price
was going nowhere until Ukraine/Crimea appeared then suddenly it started
going down whilst Saudi currency actually appreciated)
3 Letting the US export oil (more supply)
4 Letting Turkey take oil from ISIS (more supply)
All of this to try to contain Russia's military rearmament made possible
by sky high oil prices.
May the terrorist funding by Saudi and Qatar comes to halt by cheap oil
prices. They had made the decision to make it cheap but it is not Iran's
decision to make it expensive again. Which believe me Iran doesn't like
to do so especially that through the sanction years Saudis, Qatar, Emirates
played a nasty role in OPEC by getting rid of production sluts(it was to
do by limiting each member to a certain production level but as Iran was
sanctioned they thought it is the best way to hurt Iran's share of OPEC
by getting rid of it) now this is the only reason they cannot increase the
oil price as well as they cannot control Iran's production . Iran will produce
even more and has a fresh supply of Cash and its economy is more robust
to be only based on Oil so what I want to tell the Saudis, Qatari, Emirates
and their allies is to fuck off . Because through these years you were sponsors
of ISIS, Cause hundreds of thousands of death tolls and millions of refuges
in the world that you have not taken a single refugee and the whole EU and
North Americas must pay for it now. YOU GOT WHAT YOU DESERVED ARABS. Hope
Iran become friend with Israel too and teach Arabs another lesson.
Recent events with Saudi princes assaulting maids in the US (then claiming
'diplomatic immunity' and skipping the country before charges could be laid
against them) could also be a factor, as it has woken people up as to what
the Saudis are really like.
The highway between Bahrain and Saudi/UAE is like the M25 at weekends,
with Wahhabi hypocrites rushing to Bahrain to get pissed and laid. It's
been like that for decades. They claim to be pious and expect their subjects,
contractors and ex-pats working out there to do as they say, not as they
do.
Saudi Arabia is therefore finished as a regional power. Economy crippled
by low oil prices. Iran meanwhile has had to endure an embargo for a decade,
resulting in a tougher economy that is far more diverse.
Has the west finally gotten wise to the Saudi money that flows into
extremist groups? Would seem so. West seems to be doing everything it can
to contain the Saudi's. eems to be doing everything it can to contain the
Saudi's.
Yes because of millions of refuges that Arab countries caused by supporting
ISIS it is completely natural for west to go after Saudi Arabia and its
allies sponsor of ISIS. So they got what they deserved. Today I also read
that the markets in Saudi Arabia, Qatar and Emirates collapsed and I think
this a beginning of an end for them.
It really brings David Cameron and the Tories' sucking up to the Saudis
into clear perspective, doesn't it, as their credit rating for buying arms
will be taking a nosedive. Watch BAE Systems shares start to wobble this
coming week.
It also leaves the Royal family in somewhat of a quandry, as who is Price
Charles going to sword dance with now?
Iran adding to the current supply glut in oil was an inevitable consequence
of the deal. Still, the timing is particularly bad, with the crash in commodities
feeding a gloomy mood in stock markets around the world.
A deflationary spiral for the global economy is now a little more likely,
with excess capacity in a range of manufactured goods, from steel to I-Phones,
in addition to the glut in oil and other commodities.
But, that glut is not Iran's fault. The prisoner exchange was good to
see.
Next I'd like to see a symbolic move by Iran: move on from the "Death
to America" (and Britain, and Israel) rhetoric. Islam needs some public
relations help. The Iranians deciding that their revolution has "matured"
sufficiently for them to plainly state "we don't wish death on anybody,
our religion is about peace, and to demonstrate our sincerity we'll urge
our people to stop such rhetoric" would contribute to Iran's rehabilitation
as a more or less "normal" member of the global community of nations.
This has to be the beginning of the end for the Saudis and Qataris and
their utter crapulence, all at the expense of the rest of the World. OPEC
has no answer for this and is completely impotent to do anything about it.
The cartel is busted.
I guess that nobody likes the Wahhabi hypocrites any more.
I suppose it all depends on how much Iranian oil is pumped into the system
as a proportion of the total, but then what is the 'right' price for oil
anyway?
It reminds me of a supermarket conundrum - 'What's the price of a packet
of Pringles?'. This comes from the notion that in one supermarket they're
£1 each or two for £1.50, in another they're £1.25 but one a 'buy one get
one free' deal, in another they're £1 each but buy two and get one free...
and so on. But not only this - all of these deals change weekly.
So you begin to wonder, given that a packet of Pringles costs the same
to make whatever price they're sold at - and the manufacturer wants to make
a modest profit - why can you never determine the true price?
And so it seems with oil. There has to be a base production cost
which doesn't vary and I doubt that the Saudis or Iranians are selling it
at under that cost - they both need a modest profit - so, one wonders, if
they can make that modest profit at $30 a barrel, think how much they were
making at $100
Apparently, according to reuters, Saudi Arabia paid Somalia a $50 million
bribe to break diplomatic relations with Iran. Iranians, themselves, would
have paid the Somalian government more to beak off diplomatic relations.
But hey, why complain? It's free! Cheers 'Salman the Barbarian'!
Saudi Arabia, Israel, Bahrain, Sudan, Somalia, United States, The Comoros
and Djibouti all do not have diplomatic relations with Iran. UAE recalled
its embassador in sympathy with Sheikh Salman the Barbarian. Iran needed
UAE before as it was used as a port for importing into Iran(a sanction busting
avenue) but since sanctions are lifted, middlemen are no longer required
which means UAE will lose an annual income of $11 billion and Iran will
gain. Very sad!
I hope that The Comoros and Djibouti will soon reestablish relations
because it is hurting Iran's economy.
'The UK has played a central role, and I hope British businesses seize the
opportunities available to them through the phased lifting of sanctions
on Iran. ' said Philip Hammond.
His department was instrumental in sanctions against Iran while other
countries, particularly Germany and France, were lukewarm. Which countries
will now benefit? Answers on a postcode, marked 'Clue', to Philip Hammond.
Iran is closer to a development [nations] like Turkey than to Saudi Arabia.
Saudis have always been unable to do anything else than watch oil go out
of pipelines into tankers, they have no agriculture, no industry.
Iranians
want to industrialize like Turkey, but that doesn't mean democracy and personal
freedom. Development gives more means of control and repression to autocrats
too, like we have seen in Russia, Turkey, continental China. Not all countries
are able to move to democracy like Taiwan and South Korea
It is hard to understand why the Guardian labels low oil as an actual woe
for the World. It mainly hurts countries like Russia and Saudi Arabia, while
in the West we all benefit from cheap fuel.
Doubt it. The news was already in the market and has been for some time.
No surprize.
Even if does go further south, it would be temporary and besides the
wahhabi regimes of Arabia are the ones who will suffer the most. Either
way, good news for Iran.
The U.S and Iranians are using each other against their own allies.
U.S is using Iran to put pressure on Saudi so that they keep producing more
oil to bankrupt Russia, despite it destroying Saudi 'economy'. Iran is using
USA as a counterbalance to Russia because as much as they want Russia's
help, they don't want Russia to become too strong in the region.
The (seemingly) more likely scenario is to make the excuse for war against
Iran this year.... "We really tried with these guys but now we have to 'regime-change'
them". That will result in a MASSIVE war.
A less likely scenario is that USA (at a shot to nothing) thinking they
might actually replace saudi oil-fields propping up the $ with IRanian ones.
And Iran (at a shot to nothing) thinking they might take the U.S out of
Israel's pocket. As unlikely as either of these scenarios are, all bets
are off this year. Both those latter plays could push Israel and Russia
closer together, resulting in a MASSIVE war which the U.S would lose.
Either way, a MASSIVE war is coming and this development is more significant
than people think.
In my view Iran was never quite the bad guy that the western governments
portrayed it to be. We certainly have differences. But if you compare Iran
and Saudi Arabia there is no contest - Iran is far less a bogeyman.
It is always worth remembering that nearly all the September 11 hijackers
were Saudis, none were Iranian. ISIS was funded and armed by Saudi Arabia,
not by Iran. You can draw a direct line from Saudi Arabia through the carnage
in Iraq and Syria directly to the terrorist attacks in Paris.
Whenever the west talks about 'Iran being a state sponsor of terrorism'
they mean one thing and one thing only: Hezbollah.
Disclosure: I have a low opinion of Saudi Arabia so my comments are biased.
At the end of the day oil price is about fundamentals, not about HFT mashines that drives it down
Notable quotes:
"... The same things that always drive prices in the end it's always about fundamentals. The markets are peculiar and they change every day. But the fundamentals of supply and demand at some point markets come back to those and have to adjust accordingly. Not on a daily basis, maybe not even on a monthly basis. But eventually they get it right. So this oil price collapse is really straight forward as far as I can tell, and it has to do with cheap stupid money because of artificially low interest rates that resulted in over-investment in oil -- as well as lots of other commodities that are not in my area of specialty, but that's what I see. And over-investment led to over-production and eventually over-production swamped the market with too much supply and the price has to go down until we work our way through the excess supply. ..."
Geologist Arthur Berman explains why today's low oil prices are not here to stay,
something investors and consumers alike should be very aware of. The crazy-low prices
we're currently experiencing are due to an oversupply created by geopolitics and (historic)
easy credit, not by sustainable economics.
And when the worm turns, we are more
likely than not to experience a sudden supply shortfall, jolting prices viciously
higher. This will be a situation not soon resolved, as the lag time for new production
to come on-line will be much longer than the world wants:
The same things that always drive prices in the end it's always about fundamentals.
The markets are peculiar and they change every day. But the fundamentals of supply
and demand at some point markets come back to those and have to adjust accordingly.
Not on a daily basis, maybe not even on a monthly basis. But eventually they get
it right. So this oil price collapse is really straight forward as far as I can
tell, and it has to do with cheap stupid money because of artificially low interest
rates that resulted in over-investment in oil -- as well as lots of other commodities
that are not in my area of specialty, but that's what I see. And over-investment
led to over-production and eventually over-production swamped the market with too
much supply and the price has to go down until we work our way through the excess
supply.
Now the wrinkle in all of this is that because the supply excess/surplus was
generated by debt and a lot of correlative instruments, the problem is that the
companies and the countries that are doing all this over-production need to keep
generating cash flow so they can service the debt, which means they have to continue
producing pretty much at the highest levels they possibly can which doesn't really
allow very much room for reducing the surplus. So that's piece number one and then
there's the demand side. So the thing that drove all of this over investment and
over production were high prices. And after a while people get tired of high prices
and we see a phenomenon called demand destruction or you know as Jamie Galbraith
calls it the choke chain effect. You know your dog runs out on a leash, eventually
you know it stops and he chokes and so we're dealing with that. People have changed
their behavior because of high prices and then we add to the fact that people just
change their behavior. I mean young people aren't driving as much as they used
to, they spend their time in a – you know on a smart phone more than they do in
a car. We've got climate change issues. There's considerable momentum toward cutting
back on fossil fuels. Add it all together, demand is down, supply is up, it's a
bad situation...
We started this conversation with your important observation that we're only
talking about a million or million and a half barrels a day of oversupply. So we
could go from over-supply to deficit pretty quickly, because we're not investing
in finding that additional couple of million barrels a day that we need to be discovering.
So we're deferring major, major investments. We're not just deferring exploration;
we're deferring development of proven reserves. Capital cuts across the world represent
20 billion barrels of development of known proven reserves. And so we will get
to a point, and we will, we most certainly will, where suddenly everybody wakes
up and says "Oh my God we don't have enough oil! We're now half million barrels
a day low." And what will happen? The price will shoot up. That's the way commodity
markets work. And everybody will say "Whoopee! Let's get back to drilling big time."
Well there's a big lag. There's a huge time lag between when the price responds
and people actually get around to drilling and they actually start bringing the
oil onto the market and it becomes available as supply, because they've been asleep
at the wheel for you know for how many months or years. And so you know you can't
just turn a valve and all of a sudden everything is okay again
"... Yes it is, secret federal intervention. Clearly situation in LTO sector is very, very bad,
FED need do secret things to not make panic, like 2008. ..."
"... Doug, I think I know. The banks are not going to call the oil producers loans, nor take losses
on them on their books, despite the terms of the loans, and despite banking regulations. ..."
"... For example, as I have discussed previously, the value of almost all US LTO producers assets
are currently worth less than long term debt. If Bank A is owed $100 million on oil assets now worth
$50 million, they are normally required to make a provision for loan losses. This provision goes against
the banks earnings, which reduces earnings. The bank reports losses, share price goes down. If it is
a big bank, like Wells Fargo, all bank shares fall in sympathy, and maybe the stock indexes drop a great
deal as a result. ..."
"... The Fed apparently is hoping OPEC will cut soon to, and in a big way. Maybe they know something?
..."
"... The problem is that remaining CNC, Cumulative Net Cashflow (from producing properties), is
depleting an at accelerating rate of decline ..."
Doug, I think I know. The banks are not going to call the oil producers' loans, nor take losses
on them on their books, despite the terms of the loans, and despite banking regulations.
For example, as I have discussed previously, the value of almost all US LTO producers'
assets are currently worth less than long term debt. If Bank A is owed $100 million on oil assets
now worth $50 million, they are normally required to make a provision for loan losses. This provision
goes against the banks' earnings, which reduces earnings. The bank reports losses, share price
goes down. If it is a big bank, like Wells Fargo, all bank shares fall in sympathy, and maybe
the stock indexes drop a great deal as a result.
Likewise, most bank loan terms include a borrowing base. The base is the amount of principal
the oil producer may borrow. It is determined by the value of the oil producers reserves, with
proved developed producing being the primary component. Proved undeveloped are more speculative
in nature, and are discounted, or should be.
The borrowing bases are re-determined semi annually. All borrowing bases should have been cut
tremendously since 2014. But they haven't been. Now, producers owe much more on the borrowing
bases than what those bases should now be set at. This, of course, triggers default, foreclosure,
bankruptcy, etc. But, apparently, the banks are being told to pretend the assets values have not
dropped, and extend the bases to the fall of 2016.
So, for example, if Bank A has an oil producer borrower which owes $100 million on assets now
worth $50 million, the bank should be required to cut the borrower's base to $30-35 million. If
the producer cannot raise the money to pay off the overage, default is triggered.
The Fed apparently is hoping OPEC will cut soon to, and in a big way. Maybe they know something?
The problem is that remaining CNC, Cumulative Net Cashflow (from producing properties), is
depleting an at accelerating rate of decline , subject of course to what oil price assumptions
one uses (but the production decline from existing wells marches on):
"... This is what took place: the Dallas Fed met with the banks a week ago and effectively suspended
mark-to-market on energy debts and as a result no impairments are being written down. Furthermore, as
we reported earlier this week, the Fed indicated under the table that banks were to work with the energy
companies on delivering without a markdown on worry that a backstop, or bail-in, was needed after reviewing
loan losses which would exceed the current tier 1 capital tranches. ..."
"... Putting this all together, a source who wishes to remain anonymous, adds that equity has been
levitating only because energy funds are confident the syndicates will remain in size to meet net working
capital deficits. Which is a big gamble considering that as we firsst showed ten days ago , over the
past several weeks banks have already quietly reduced their credit facility exposure to at least 25
deeply distressed (and soon to be even deeper distressed) names. ..."
"... Keep in mind that according to Wolfe Research and many other prominent investors, as many as
one-third of American oil-and-gas producers face bankruptcy and restructuring by mid-2017 unless oil
rebounds dramatically from current levels. However, the reflexivity paradox of this problem was laid
out yesterday by Goldman who explained that oil could well soar from here but only if massive excess
supply was taken out of the market. So chicken or egg. ..."
"... Beyond just the immediate cash flow and stock price implications and fears that the situation
with US energy is much more serious if it merits such an intimate involvement by the Fed, a far bigger
question is why is the Fed once again in the a la carte ..."
Earlier this week, before first JPM and then Wells Fargo revealed that not all is well when it
comes to bank energy loan exposure, a small Tulsa-based lender, BOK Financial, said that its fourth-quarter
earnings
would miss analysts' expectations because its loan-loss provisions would be higher than expected
as a result of a single unidentified energy-industry borrower. This is what the
bank said:
"A single borrower reported steeper than expected production declines and higher lease operating
expenses, leading to an impairment on the loan. In addition, as we noted at the start of the commodities
downturn in late 2014, we expected credit migration in the energy portfolio throughout the cycle
and an increased risk of loss if commodity prices did not recover to a normalized level within
one year. As we are now into the second year of the downturn, during the fourth quarter we continued
to see credit grade migration and increased impairment in our energy portfolio. The combination
of factors necessitated a higher level of provision expense."
Another bank, this time the far larger Regions Financial, said its fourth-quarter charge-offs
jumped $18 million from the prior quarter to $78 million, largely because of problems with a single
unspecified energy borrower. More than one-quarter of Regions' energy loans were classified as "criticized"
at the end of the fourth quarter.
It didn't stop there and
and as the WSJ added, "It's starting to spread" according to William Demchak, chief executive
of PNC Financial Services Group Inc. on a conference call after the bank's earnings were announced.
Credit issues from low energy prices are affecting "anybody who was in the game as the oil boom started,"
he said. PNC said charge-offs rose in the fourth quarter from the prior quarter but didn't specify
whether that was due to issues in its relatively small $2.6 billion oil-and-gas portfolio.
Then, on Friday, U.S. Bancorp disclosed the specific level of reserves it holds against its $3.2
billion energy portfolio for the first time. "The reason we did that is that oil is under $30" said
Andrew Cecere, the bank's chief operating officer. What else will Bancorp disclose if oil drops below
$20... or $10?
It wasn't just the small or regional banks either: as we
first reported, on Thursday JPMorgan did something it hasn't done in 22 quarter: its net loan
loss reserve increased as a result of a jump in energy loss reserves. On the earnings call, Jamie
Dimon said that while he is not worried about big oil companies, his bank has started to increase
provisions against smaller energy firms.
Then yesterday it was the turn of the one bank everyone had been waiting for, the one which according
to many has the greatest exposure toward energy: Wells Fargo. To be sure, in order not to spook its
investors, among whom most famously one Warren Buffett can be found, for Wells it was mostly "roses",
although even Wells had no choice but to set aside $831 million for bad loans in the period, almost
double the amount a year ago and the largest since the first quarter of 2013.
What was laughable is that the losses included $118 million from the bank's oil and gas portfolio,
an increase of $90 million from the third quarter. Why laughable? Because that $90 million in higher
oil-and-gas loan losses was on a total of $17 billion in oil and gas loans, suggesting the bank has
seen a roughly 0.5% impairment across its loan book in the past quarter.
How could this be? Needless to say, this struck us as very suspicious because it clearly suggests
that something is going on for Wells (and all of its other peer banks), to rep and warrant a pristine
balance sheet, at least until a "digital" moment arrives when just like BOK Financial, banks can
no longer hide the accruing losses and has to charge them off, leading to a stock price collapse.
Which brings us to the focus of this post: earlier this week, before the start of bank earnings
season, before BOK's startling announcement,
we reported
we had heard of a rumor that Dallas Fed members had met with banks in Houston and explicitly "told
them not to force energy bankruptcies" and to demand asset sales instead.
Rumor Houston office of Dallas Fed met with banks, told them not to force
energy bankruptcies; demand asset sales instead
We can now make it official, because moments ago we got confirmation from a second source who
reports that according to an energy analyst who had recently met Houston funds to give his 1H16e
update, one of his clients indicated that his firm was invited to a lunch attended by the Dallas
Fed, which had previously instructed lenders to open up their entire loan books for Fed oversight;
the Fed was shocked by with it had found in the non-public facing records. The lunch was
also confirmed by employees at a reputable Swiss investment bank operating in Houston.
This is what took place: the Dallas Fed met with the banks a week ago and effectively suspended
mark-to-market on energy debts and as a result no impairments are being written down. Furthermore,
as we reported earlier this week, the Fed indicated "under the table" that banks were to work with
the energy companies on delivering without a markdown on worry that a backstop, or bail-in, was needed
after reviewing loan losses which would exceed the current tier 1 capital tranches.
In other words, the Fed has advised banks to cover up major energy-related losses.
Why the reason for such unprecedented measures by the Dallas Fed? Our source
notes that having run the numbers, it looks like at least 18% of some banks commercial loan book
are impaired, and that's based on just applying the 3Q marks for public debt to their syndicate sums.
In other words, the ridiculously low increase in loss provisions by the likes of Wells and JPM
suggest two things: i) the real losses are vastly higher, and ii) it is the Fed's involvement that
is pressuring banks to not disclose the true state of their energy "books."
Naturally, once this becomes public, the Fed risks a stampeded out of energy exposure because
for the Fed to intervene in such a dramatic fashion it suggests that the US energy industry is on
the verge of a subprime-like blow up.
Putting this all together, a source who wishes to remain anonymous, adds that equity has been
levitating only because energy funds are confident the syndicates will remain in size to meet net
working capital deficits. Which is a big gamble considering that as we firsst
showed ten days ago, over the past several weeks banks have already quietly reduced their credit
facility exposure to at least 25 deeply distressed (and soon to be even deeper distressed) names.
However, the big wildcard here is the Fed: what we do not know is whether as part of the Fed's
latest "intervention", it has also promised to backstop bank loan losses. Keep in mind that according
to Wolfe Research and many other prominent investors, as many as one-third of American oil-and-gas
producers face bankruptcy and restructuring by mid-2017 unless oil rebounds dramatically from current
levels. However, the reflexivity paradox of this problem was laid out yesterday by Goldman who explained
that oil could well soar from here but only if massive excess supply was taken out of the market.
So chicken or egg.
In other words, for oil prices to surge, there would have to be a default wave across the US shale
space, which would mean massive energy loan book losses, which may or may not mean another Fed-funded
bailout of US and international banks with exposure to shale.
What does it all mean? Here is the conclusion courtesy of our source:
If revolvers are not being marked anymore, then it's basically early days of subprime
when mbs payback schedules started to fall behind. My question for bank eps is if you
issued terms in 2013 (2012 reserves) at 110/bbl, and redetermined that revolver in 2014 at 86,
how can you be still in compliance with that same rating and estimate in 2016 (knowing 2015 ffo
and shutins have led to mechanically 40pc ffo decreases year over year and at least 20pc rebooting
of pud and pdnp to 2p via suspended or cancelled programs). At what point in next 12 months does
interest payments to that syndicate start to unmask the fact that tranch is never being recovered,
which I think is what pva and mhr was all about.
Beyond just the immediate cash flow and stock price implications and fears that the situation
with US energy is much more serious if it merits such an intimate involvement by the Fed, a far bigger
question is why is the Fed once again in the a la carte bank bailout game, and how does
it once again select which banks should mark their energy books to market (and suffer major losses),
and which ones are allowed to squeeze by with fabricated marks and no impairment at all? Wasn't the
purpose behind Yellen's rate hike to burst a bubble? Or is the Fed less than "macroprudential" when
it realizes that pulling away the curtain on of the biggest bubbles it has created would result in
another major financial crisis?
The Dallas Fed, whose new president
Robert Steven Kaplan previously worked at Goldman Sachs for 22 years rising to the rank of vice
chairman of investment banking, has not responded to our request for a comment as of this writing.
Single-family home sales took a nosedive in all price categories. Houston's townhome and condominium
market saw the greatest hit in sales, tumbling 17.3 percent in October.
One of the largest apartment owners in Houston admitted their vacancy rate now is a panicky
8% [normal less then 3% he said] and rising fast as the jobless energy-related people default
on their rent and vacant.</blockquote>z
Clint Liquor
"demand asset sales instead"? Since when do creditors dictate the terms of bankruptcy? Bankruptcy
is design to fuck creditors.
Boris Badenov
No wonder ExxonMobil was up this week.
thunderchief
This will be 2016s overall theme. Just like Obama's final hopium State Of the Union, cramming
hopium down everyones throat, regardless of the state of affairs.
Count on this when it comes to any crisis, big or small. Hope.. Thats what you were told in
Chicago 7 years ago. You now have one more year of swallowing.
FreedomGuy
This is serious shit, if accurate. It will spill over into everything. This is the movie, The
Big Short only it is energy companies instead of housing.
The question is when and how this reverberates into the overall economy.
In my state the unemployed oil field workers are moving into the construction jobs. The housing
market has gone insane here. Personally, suspect they have gone from frying pan to fire.
As a related note, the homes I have been looking at are all being built in the $500-750k range.
Statistically that means you need at least $100k to $130k incomes (with little or no other debt
and a $100k down payment) to tote the note. That means they are building home for about the top
ten percent of incomes, only. My instincts tell me that if 90% of your homes are for ten maybe
twenty percent of incomes, even excluding welfare families, you are in the wrong sector or your
model is unsustainable.
Also, about 20% of all office space in my city is leased by energy companies. That has to reverberate
rather quickly, as well.
Dr. Engali
Like I've always said, it was only a matter of time before the fed starts monetizing oil
debt. It doesn't matter what their mandate from CONgress is because they don't answer to CONgress.
Exaggerated forecasts are a contrarian signal. It will be oil glut all over until suddenly
there is an oil shortage.
Notable quotes:
"... the extended slump for oil is setting up the world for a situation in which a supply fails to meet demand in the not-so-distant future. The Wood Mackenzie report shines a spotlight on this phenomenon, which is becoming increasingly likely. ..."
"... the industry is shelving nearly 3 mb/d in future output because of conditions today. Lasting financial damage will lead to a shortfall in investment, a slowdown in spending that could outlast the oil bust. As the years pass and that production fails to come online, demand could start to outstrip supply, potentially leading to a price spike. ..."
All told, industry cuts will translate into at least 2.9 million barrels of oil production per
day (mb/d) that will not come online until at least sometime next decade.
... ... ...
Energy analysts are falling over each other with new estimates for where the price of oil will bottom
out. Goldman Sachs was one of the first to call for $20 oil last year, but now everyone is
jumping on the bandwagon. Morgan Stanley says $20 oil is possible, with much of the blame put
on the strength of the dollar. Standard Chartered, not to be outdone, says oil could
fall to
$10 per barrel.
RBS issued perhaps the most
panic-inducing warning
of them all, mostly because it applied to the broader state of the global economy: "sell everything
except high quality bonds," because the world is facing a "fairly cataclysmic year ahead."
The
consensus suddenly seems to be that oil will remain in the $30s, or even lower, for much of the
year, despite the incessant optimism from some oil executives.
But the extended slump for oil is setting up the world for a situation in which a supply
fails to meet demand in the not-so-distant future. The Wood Mackenzie report shines a spotlight
on this phenomenon, which is becoming increasingly likely.
The world is oversupplied right
now, by some 1 mb/d. But the industry is shelving nearly 3 mb/d in future output because of
conditions today. Lasting financial damage will lead to a shortfall in investment, a slowdown in
spending that could outlast the oil bust. As the years pass and that production fails to come
online, demand could start to outstrip supply, potentially leading to a price spike.
"... Its great news for the people of Iran, business in Europe, not so great
for Israel and my country, Canada. Oil is going to be $30 a barrel forever now.
Our previous very stupid government put all our eggs in one basket, oil at $100
a barrel. ..."
"... Dear Moshe, You are not giving billions to Iran, It is Iranians money that
was for frozen by US banks . ..."
"... Most of the middle eastern countries such as Iraq, Syria, Jordan, Saudi
Arabia, UAE, Libya and lebanon are tribes with flags. The exception is Iran which
has a long and establised sense of nationhood. It will never be a failed state.
..."
"... Iran is about to get their frozen assets back as part of the deal... lets
hope they put that $100 billion to some good use... Welfare, housing, hospitals
and education should all benefit... Unfortunately with so much trouble on their
doorstep, theyll probably but new fighter planes and lots of guns from the new American
buddies... ..."
"... Why do you think that US, UK, Israel, Saudi wants stability in Mid East
region ? All evidence suggests otherwise from regime change in Syria to Libya .from
emergence of Isis to Saudi demanding that US bombs Iran to state of oblivion. I
am very happy about the agreement, however, i am very cynical about tricky Americans
to uphold their part of bargain. ..."
"... If you dislike Iran maybe you must hate Saudi Arabia, a dubious country
we gave been allies with for years. Personally, I find Iran to be far more reasonable
than Saudi Arabia.. Perhaps you should open your eyes. ..."
"... They cant delay this. What they will do, is introduce different kinds of
US only sanctions, for other reasons (to appease their AIPAC donors). ..."
"... In addition to that, i should say that there is a perception fueled by
conservatives that all the bad stuff has been done by Iranians, but if I were an
Iranian citizen, it would be pretty hard to forget that the US supported Saddam
Hussein financially and militarily (with aid) during an eight-year, very bloody
Iran-Iraq war that left hundreds of thousand Iranians dead or wounded (and, incidentally,
thats when the US downed an Iranian airliner). ..."
"... Very true. How many Saudi terrorists are there, and how many Iranian ones?
Islamic terror is exported is large quantities by our friends in Saudi-Arabia, just
second to oil. ..."
"... Already Iran is looking at using barter with Europe exchanging oil for
various goods. ..."
"... Anyway, not to engage in moral relativism but my country, the USA, has
some human rights blemishes we need to recognize as well. Having President Obama
say we tortured some folks doesnt help.. The dismissive tone is not conducive to
addressing the situation. ..."
"... Germany had a great military, a modern industrialized society, and a history
of invading other countries. Iran, not. ..."
"... Note to Republicans: Peacemaking is a good thing. Carpet bombing is a bad
thing. ..."
"... Sounds like the Iranians are gradually emerging from xenophobic theocracy.
..."
"... Hopefully Iranians can build on this and continue to demand better relations
with the west. Surly, they have had their differences with the west but they shouldnt
let religious fundamentalists use Irans past history to create hate and pessimistic
attitude towards west ..."
"... And would you also observe that most of these people would likely still
be alive today if it werent for civilized Western nations bombing thier country,
disbanding their army and institutions and throwing their country into chaos? ..."
"... But a country that goes to war for nothing more than greed sending hundreds
of thousands to their deaths including their own sons and daughters ... would you
visit there ... oops you live in the UK? ..."
"... There were no sanctions against Israel, which has nuclear weapons. Saudi
Arabia is an Islamic fundamentalist state which sponsors terrorism. It is all hypocrisy.
..."
"... Vinculture: A disaster in the making thanks to 0bamas incompetence and
naivety. A disaster for Israels aggressive foreign policy, maybe. And a disaster
for the House of Saud. ..."
"... If the deal sticks on the US side, expect to see Iran make a number of
subtle shifts in a pro-US direction over the next few years. It will be a reflection
of the outcome of internal struggles within the Iranian clergy. The Supreme Leader
gave Rouhani the chance to prove that negotiations and concessions could get acceptable
results. The success of the negotiations will give Rouhanis faction greater clout
for similar actions until such time as either they stuff it up good and proper,
or somone crazy gets elected as US President. ..."
"... The USA has modified its attitude to Syria from Assad must go! to OK, he
can hang around for a while , simply because Syria, with Russian, Iranian and Hezbollah
assistance, is gaining the upper hand. Hence the willingness for the USA to negotiate.
We rarely hear the words regime change in Syria from our politicians any more. So
it is with Iran. Apart from Iranian involvement in Syria, Iran has managed to outlast
the sanctions regimes and has had to ratchet up its own development of medicines,
weaponry etc in anticipation of a possible Israeli or US attack. As a country of
some 80 million people, they wouldnt be a pushover in the military sense. And at
what cost? It doesnt bear thinking about. ..."
"... I dont believe for one second Iran will be able to bring that much oil
online so quickly. The issues which have come about through years of barely no maintenance,
cant just be reversed in a matter of months. Time will tell. But the mainstream
media has been pushing this for a long time to further suppress oil prices. ..."
"... Meanwhile the US and Britain are directing and supplying the bombs killing
innocent people in Yemen, none of which gets coverage in the press. It is a sad
bad world we live in these days. Iran is probably less of a threat than Saudi Arabia
which funds extremists who are so close to Isis and the likes yet do we care. It
seems not. ..."
"... If only we had strong leadership like W Bush neh? Hed have strongly Decidered
his way to victory just like the gleaming success next-door. Pass the bong. ..."
"... If we put aside sheer hypocrisy (always an important feature of foreign
policy!) then I think the usual argument is that, unlike we rational Westerners,
the Iranians are crazy religious maniacs who cant be trusted with a bomb. In reality,
though obviously the Iranian regime is a religiously-based one, they have shown
themselves to be quite pragmatic and cautious over the past 2 decades at least.
Which isnt to say the regime is benign, by any means, just that their foreign policy
is based on rational self-interest (or their perception thereof) - just like any
other country. ..."
"... Another reason given is Irans supposed support for terror organisaitons.
Putting aside the fact that defining what is a terror organisaiton is largely a
matter of ones political views, its hard to see what this has to do with the nuclear
issue specifically. Unless we buy the notion - straight from a 5th rate James Bond
knock-off - that Iran could give its (non-existent) nukes to a terrorist, as though
a nuclear bomb was equivalent to an AK-47. ..."
"... I dont back any country with Nukes, but I do back the balance off power,
if Iran is overthrown with Syria, it would be dangerous times for the rest off us.
It would be safer for Israel too disarm, followed by Pakistan, North Korea then
East + West Bilaterally, simutaniously. ..."
"... Iran isnt Nazi Germany, if you want to pursue that analogy then its closer
to Francos Spain and we got on well if occasionally frostily with them for 39 years
without having a war with them ..."
"... After a progressive Persian govt renationalized and booted British Petroleum
out of the country suffered a coup détat instigated with US aid in 1953. ..."
"... After the revolution we armed Saddam Hussein to start a war and killed
millions of Iranians. ..."
"... If I were Iranian Id be double wary now of USs intentions. It seems that
the working method of the West nowadays is to feign a warming of relations to draw
yourself closer before a fatal stab. Remember Libya? And I recall Syria having a
nice warm up period before the gates of hell opened. Take care, Iran. ..."
"... It looks to me that the west has to either start Armageddon to take Iran
out or start to build bridges. ..."
"... Iran has always denied seeking an atomic weapon, saying its activities
are only for peaceful purposes, such as power generation and medical research. The
annual reports of the CIA/Mossad/German BND and the IAEA supported this fact consistently
since 2004. It was only the despicable US/Israeli geopolitics enabled by their propaganda
arm the mainstream media that maintained the charade of a clandestine nuclear weapon
programme. ..."
"... there remains a lack of clarity with regards to the US. - as ever you never
know what the US is going to do, and I suspect the US itself does not know given
it dysfunctional political system. ..."
"... The far right in Israel, not for everyone. Saudi and far right wing Israel
have a symbiotic relationship. Saudi can push its agenda of Wahhabism that secures
its brutal regime and far right Israel profits from the bitter fruits of Saudi,
as it means that Israel is seen as the anti-muslim anchor of the West in the region.
Sadly, the political intervention of the US has been based around protecting and
supporting this symbiotic relationship with money, troops and bombs. ..."
"... Obama has already issued an order(today) lifting sanctions on the sale
of passenger airliners to Iran. Boeing Airbus are in intense competition as Iran
plans to purchase 500 airliners in the next 10 years worth billions of dollars.
..."
"... given that the Iranian government is still highly suspicious of the Brits
(for very good reason) I very much doubt theyll want to spend this much-needed cash
on overpriced pads in Blighty. ..."
"... George W Bush said he got his orders from God, and they were amazingly
similar to the ones he got from Big Oil. We know the results. ..."
"... It i amazing how western oriented news organization by default report the
talking point of the western regimes reflexively. Unlike the news bureaus in the
soviet era, they dont need minders and censors, those are just built in or plugged
in by interviews. ..."
"... He can do what he likes, the US have given Israel a free pass, human rights
abuses, extrajudicial killings, threats to Israeli Arabs, hidden nuclear weapons,
all have to be ignored while their neighbours are subjected to endless scrutiny.
While this continues the Middle East will never be at peace. Palestinians are humans
too. ..."
"... Lifting of Iran sanctions is a good day for the world Yet these gangsters
who control the finance industry(US/UK), and who can and do, impose sanctions at
will, are free, without sanction, to wage war against whoever they so choose with
impunity. Something is not quite right here, or are we too stupid, too compliant
to see it? ..."
"... Ok - so you're anti nuclear weapons. Fair enough, you're free view. For
me, much more importantly is the opportunity for trade. The Iranians are well educated
and still have a historical connection with our country. ..."
"... The sanctions are another kind of war. The tradesmen will win at the end
..."
"... When sanctions started, they were nowhere near as harsh. European countries
- as well as China and India - had long been growing tired of the extremely strict
sanctions imposed mostly by the Americans. ..."
"... All the nuclear nations should have banded together with Iran to help Iran
with their desire for peaceful nuclear power by helping Iran with expertise and
funding to develop Thorium reactors. ..."
"... British foreign policy is a selective and hypocrital joke. ..."
"... Yes, unfortunately neither the UK or the US think long-term, when selling
advanced weapons to the Saudis (or giving them to Israel). That may well come back
to bite them, when the House of Saud falls, as it must. ..."
"... Amazed this has gone through. The worlds biggest and most dangerous children,
Israel and Saudi Arabia, will NOT be pleased. These two are behind so much of the
worlds problems, far moreso than their parent the USA. ..."
"... where are Israels nukes pointing, out of interest? ..."
"... Welcome to the world community Iran. Not a perfect nation but which is.
No point demonizing people nations, it does more harm than good. ..."
"... Remind me, which country is currently levelling Yemen one building at a
time? Oh yes, a Sunni nation Saudi Arabia. ..."
"... Anything that stops the Saudis playing the big I am is fine by me. Theyve
already cut off their own nose over oil prices to stop US fracking and their economy
is suffering, lets hope Iran can keep it low when it doesnt suit Saudi Arabia. ..."
"... Good, let the US who started all this nonsense feel themselves for a while
what it is like to be outside trade with Iran. I bet it will not last long if companies
realize they are still not allowed to do business because of their own extortion
over the many years while the EU does commence trading. ..."
"... I really do hope you have an insurance policy Iran, I wouldnt trust these
liars as far as .. and Id advise using some of whats rightly coming your way to
insulate against future western blackmail. ..."
"... The US specializes in lack of clarity. Remember the two boats that Iran
detained the other day? The US initially said that they had a mechanical failure
and drifted into Iranian territorial waters. That version of events has become non-operative,
and now the US is saying that the boats were fully operational, but one of the sailors
accidentally punched the wrong GPS coordinates in. And then, of course, they failed
to notice that they were getting awfully close to that island where Iran maintained
a base. ..."
It's great news for the people of Iran, business in Europe, not so great
for Israel and my country, Canada. Oil is going to be $30 a barrel forever
now. Our previous very stupid government put all our eggs in one basket,
oil at $100 a barrel.
Israel was on the verge of nuking Iran. Ironically they stand to benefit
from this, doing business with Iran. Reports from Iran were mostly that
they were very western. They are Persian, not Arab, and if you look at historical
maps, that line in the sand has existed for thousands of years. It's a good
day. Iran is not North Korea, and it was the US supporting the Shah and
his solid gold toilet that caused this problem in the first place. Back
in 1978, it was obvious what was going to happen.
Dear Moshe, You are not giving billions to Iran, It is Iranians money
that was for frozen by US banks . Your religion says, Thy shall not
lie and I believe it is in ten commandment, so why are you doing it ?
Most of the middle eastern countries such as Iraq, Syria, Jordan, Saudi
Arabia, UAE, Libya and lebanon are tribes with flags. The exception is Iran
which has a long and establised sense of nationhood. It will never be a
failed state.
A fatwa cannot be 'lifted' because it is the personal opinion of a cleric,
and the cleric involved - Ayatollah Khomeini - has been dead for 25 years.
However, 17 years ago the Iranian government said it was no longer pursuing
the fatwa and would not reward anyone for killing Rushdie. Which kind of
amounts to the same thing.
"There is no doubt that if today's weak western leaders had been
the ones having to deal with Hitler, in place of Winston Churchill,
the Third Reich would be ruling the world today."
For heaven's sake.... If the UK had remained neutral - how would that
have prevented the Red Army from defeating the Nazis? It would have made
the process slightly slower - that's all
Stalin had started to turn the tide against the Nazis even before the
US was involved in WW2 (Battle for Moscow) - and the Brits did little up
to then to help
him. The US did in fact help Stalin before it entered the war - by helping
with war materiel (Lend Lease included the Russians).
The Brits helped too, with the Murmansk convoys - but these only began
in August 1941. British strategic bombing of Germany had also hardy started
by then.
No wonder Stalin pressed for "a second front now"...
With a neutral Britain, the Russians would have got to Cuxhaven and Bremen.
As it was, the Russians got to Wismar (and only stopped due to British artillery
being in position to oppose them - Rossokovski's orders were to advance
to Lübeck..).
Well when it comes to the Iran v Saudi battle of religious fascist dogma
then I'm leaning towards Iran as the lesser of the evils... Iran is
about to get their frozen assets back as part of the deal... let's hope
they put that $100 billion to some good use... Welfare, housing, hospitals
and education should all benefit... Unfortunately with so much trouble on
their doorstep, they'll probably but new fighter planes and lots of guns
from the new American buddies...
Why do you think that US, UK, Israel, Saudi wants stability in Mid East
region ? All evidence suggests otherwise from regime change in Syria to
Libya .from emergence of Isis to Saudi demanding that US bombs Iran to state
of oblivion. I am very happy about the agreement, however, i am very cynical
about tricky Americans to uphold their part of bargain.
Hope for the best but i see Saudi and Israeli are heavily engaged in
sabotaging the agreement.
If you dislike Iran maybe you must hate Saudi Arabia, a dubious country
we gave been allies with for years. Personally, I find Iran to be far more
reasonable than Saudi Arabia.. Perhaps you should open your eyes.
i saw female protestors get beaten at occupy. i see fleeing unarmed guys
shot by cops. maybe the west isn't too pure either? in any case, going to
war over faked wmds doesn't work out well.
They can't delay this. What they will do, is introduce different kinds
of US only sanctions, for other reasons (to appease their AIPAC donors).
The terms of the nuclear deal are such, that they can't punish other countries
for trading with Iran, when the UN and EU lift their sanctions, probably
later today.
Iran can simply refrain from doing any business with the US.
In addition to that, i should say that there is a perception fueled
by conservatives that all the bad stuff has been done by Iranians, but if
I were an Iranian citizen, it would be pretty hard to forget that the US
supported Saddam Hussein financially and militarily (with aid) during an
eight-year, very bloody Iran-Iraq war that left hundreds of thousand Iranians
dead or wounded (and, incidentally, that's when the US downed an Iranian
airliner).
And the years of useless sanctions that only alienated Iranians. Let's
not forget that the Soviet Union, for example, did not fall at the peak
of the Cold War. It fell when the contacts with the West increased. It won't
be that we open the contacts today and tomorrow Iran is a nice Western democracy,
but judging from the splendid success of the 50+ years of US embargo of
Cuba, I would rather engage Iran than isolate it.
"It proved that we can solve important problems through diplomacy,
not threats and pressure, and thus today is definitely an important
day," [Zarif] said.
Is this guy Zarif in receipt of a backhander from Seamus Milne?
Very true. How many Saudi terrorists are there, and how many Iranian
ones? Islamic terror is exported is large quantities by our "friends" in
Saudi-Arabia, just second to oil.
No it won't. When Iran comes in from the cold, even the conservatives won't
want to go back there. They also want a prosperous future for their people.
BBC reporting that there has been a delay in the announcement of the end
of the sanctions - apparently they were expecting a statement 4 hours ago.
However, it's just been announced that 4 American-Iranian prisoners held
in Iran are to be released. Hopefully, that has resolved the 'hitch' that
has been holding up the announcement.
Unfortunately for Iran she is getting her freedom to sell oil on the open
markets right at a time when the oil market is in complete free fall.
Already Iran is looking at using barter with Europe exchanging oil for
various goods.
There will never be true freedom and prosperity for Iran until
they rid themselves from the awful theocracy that has ruined their society
and lives for the past 40 years.
So you think isolation, crippling sanctions and threat of war is better
for achieving peace in the Middle East? Do you have anything constructive
to say at all?
They were already there months ago, together with French politicians and
other businessmen, including the owners of a large chain of hotels. This
is about their 3rd or 4th visit. All embassies, apart from those of the
US and Canada, have reopened (most never closed in spite of sanctions).
The only way we can improve human rights is to first increase our ties between
nations. Gone are the days when you can isolate a country and demand they
improve human rights and expect it to work.
Anyway, not to engage in moral relativism but my country, the USA,
has some human rights blemishes we need to recognize as well. Having President
Obama say "we tortured some folks" doesn't help.. The dismissive tone is
not conducive to addressing the situation.
Iran is a major player in the region, and an unstable Iran means an unstable
Middle East. The sanctions relief will stabilize Iran's economy. An Iran
that is no longer threatened by war and regime change can start to play
a positive role in solving the region's many conflicts. At least that's
the theory, I hope Iran and the West seize this unique moment.
Sure, stick with your close ally and Daesh/IS supporter Saudi Arabia, who
the IMF think will probably become insolvent within 5-years. When that happens,
they'll no longer be able to afford all those advanced weapons and other
toys you keep selling them, which they then use to kill civilians in Yemen.
"But this post is about Iran, which had no business in Iraq or Afghanistan
either" --- Which part about Iran trying to make things difficult in Iraq
for the illegal US occupation forces in those countries, because Iran may
have been a possible target for a future US invasion don't you understand...??
The idea was to make a US occupation fail in Iraq to save their own country...And
it worked.
Fantastic news for the good citizens of Iran. Perhaps the day will come
when Iranians, Europeans, and Americans are flying freely back and forth
visiting each others countries without the horrendous bureaucracy, no fly
lists and such.....
Even if there is one, why to go to Tehran while our MSM will not fail to
provide us with a " Best of ", especially if Charlie Hebdo enters the festival
But this post is about Iran, which had no business in Iraq or
Afghanistan either.
Actually, they weren't in either country. But in any case, surely you'll
agree that Iran, which share borders and has a lot of cultural links with
the above mentioned countries, had a hell of a lot mroe right to be there
than countries on the other side of the world?Particularly as they could
be seen as defensive actions by Iran.
And I agree - let the worthless dump of a region stew in its own
squalor.
That's some hatred for hundreds of millions of people. It was really
terrible of them to force the civilsed west to bomb and invade them, and
create untenable nation states.
whose problems you blame entirely on the west -
No I don't. But I also don't adopt the idiotic stance of wailing over
British occupation soldiers rather than asking what the hell Britain was
doing invading a coutnry on the other side of the world.
ether than Gulf states or indeed Iran.
I guess your hatred prevents you from becoming informed. If you had,
you'd be aware that Iran has taken in huge numbers of Iraqi and Afghani
refugees.
As for the borders, don't they do multiculturalism in the Middle
East then?
You really haven't got a clue, have you? Maybe Iran should re-arrange
Europe's borders to suit itself? You'd be happy with that, no?
The fact that the Israelis and Republicans are keeping quiet is pretty strong
evidence that they have a tiny spark of realization that Obama and Kerry
were in the right. Not that they will ever ever admit it. Note to Republicans:
Peacemaking is a good thing. Carpet bombing is a bad thing.
Sounds like the Iranians are gradually emerging from xenophobic theocracy.
Hopefully other countries can also seek the path of moderation and
wisdom. Israel is among those with plenty of room for improvement. The USA
has the task of avoiding a lurch in the wrong direction in the next election.
It is hard to find much good news around the world these days.
But this post is about Iran, which had no business in Iraq or Afghanistan
either. And I agree - let the worthless dump of a region stew in its own
squalor. Strange isn't it how people from that region - whose problems you
blame entirely on the west - still choose to come to the west en mass, rather
than Gulf states or indeed Iran.
As for the borders, don't they do multiculturalism in the Middle East
then?
A great day. hopefully Iran's influence will finally break out from under
the malign shadow of Saudi Arabia which has held the western world in thrall
for so long
Hopefully Iranians can build on this and continue to demand better relations
with the west. Surly, they have had their differences with the west but
they shouldn't let religious fundamentalists use Iran's past history to
create hate and pessimistic attitude towards west.
As Iranians say: "There is much hope in hopelessness; for at the end
of the dark night, there is light."
I didn't support the invasion of Iraq, for the simple reason that
that region is a failure and a dead loss and should be left to its own
devices.
Yeah, but it never is left to its own devices, is it? The 'troops' you
weep over were part of an illegal occupation force, and therefore their
deaths were legitimate. The west has been bombing, invading and propping
up despots in the Middle EAst (often in countries whose borders were drawn
in London or Paris) for decades. So maybe think for a minute what Western
'civilisation' looks like to people in the Middle East.
I would observe though that far more Iraqi Muslims were killed
by other Iraqi Muslims than by western troops, over the usual ridiculous
sectarian nonsense.
And would you also observe that most of these people would likely
still be alive today if it weren't for civilized Western nations bombing
thier country, disbanding their army and institutions and throwing their
country into chaos?
Good! And may I say finally. This can only be a good thing in the long run,
regardless of any bumps that await them because there will be bumps, considering
certain parties are not too happy about this. But this can only be beneficial
to the country, its people and the world. That there're so many educated
people there is going to be so helpful in the future. Slowly removing the
fear will slowly remove the most important tool in the arsenal used by the
theocracy to govern and changes will occur. It won't be quick, a year or
two but it will happen while the stability should remain.
But a country that goes to war for nothing more than greed sending hundreds
of thousands to their deaths including their own sons and daughters ...
would you visit there ... oops you live in the UK?
Between the PRC and Pakistan, NK has the bomb. It's not clear
exactly how to apportion credit.
Not clear, when you just invent 'facts'. China was against the NK bomb,
and I doubt Pakistan - which btw also borders Iran - had anything to do
with it. Really daft argument.
I can't think why anyone with full grasp of the facts
Says the person who hasn't produced a single fact.
other than those heavily invested in Obama and for his legacy
to not be seen as a lame duck president who's accomplished sfa.
Please. I couldn't give a toss about Obama. I'm not a fan of his at all
(though likely for very differnet reasons than you) but credit where it's
due. Why do Yanks think everyone cares about their infantile politics? In
any case, this deal goes well beyond Yankistan. Enjoy it.
There were no sanctions against Israel, which has nuclear weapons. Saudi
Arabia is an Islamic fundamentalist state which sponsors terrorism. It is
all hypocrisy.
Vinculture: "A disaster in the making thanks to 0bama's incompetence
and naivety." A disaster for Israel's aggressive foreign policy, maybe.
And a disaster for the House of Saud.
If the deal sticks on the US side, expect to see Iran make a number
of subtle shifts in a pro-US direction over the next few years. It will
be a reflection of the outcome of internal struggles within the Iranian
clergy. The Supreme Leader gave Rouhani the chance to prove that negotiations
and concessions could get acceptable results. The success of the negotiations
will give Rouhani's faction greater clout for similar actions until such
time as either they stuff it up good and proper, or somone crazy gets elected
as US President.
This is more of an example of realpolitik coming from the USA (for
a change), despite whatever the nutters in Congress or the military may
say about it.
The USA has modified its attitude to Syria from "Assad must go!"
to "OK, he can hang around for a while", simply because Syria, with Russian,
Iranian and Hezbollah assistance, is gaining the upper hand. Hence the willingness
for the USA to negotiate. We rarely hear the words "regime change in Syria"
from our politicians any more. So it is with Iran. Apart from Iranian involvement
in Syria, Iran has managed to outlast the sanctions regimes and has had
to ratchet up its own development of medicines, weaponry etc in anticipation
of a possible Israeli or US attack. As a country of some 80 million people,
they wouldn't be a pushover in the military sense. And at what cost? It
doesn't bear thinking about.
On the other side of the coin, the US and others are now seeing the Saudi
regime for what it is and given a choice between the KSA and Iran, they've
now decided to plump with the latter - at least for the time being.
I don't believe for one second Iran will be able to bring that much
oil online so quickly. The issues which have come about through years of
barely no maintenance, can't just be reversed in a matter of months. Time
will tell. But the mainstream media has been pushing this for a long time
to further suppress oil prices.
Meanwhile the US and Britain are directing and supplying the bombs killing
innocent people in Yemen, none of which gets coverage in the press. It is
a sad bad world we live in these days. Iran is probably less of a threat
than Saudi Arabia which funds extremists who are so close to Isis and the
likes yet do we care. It seems not.
If only we had strong leadership like W Bush neh? He'd have strongly
Decidered his way to victory just like the gleaming success next-door. Pass
the bong.
I may have the state wrong but please don't tell me you think the USA is
a bastion of tolerance! Gays are beaten up, blacks are shot, muslims are
attacked. America is home to some of the world's best fed bigots.
Go read the IAEA reports over the years, they are the worlds experts that
know exactly what is required for civilian nuclear energy and what is used
for nuclear weapons = they know. What has been agreed is for Iran to curtail
their weapon development and export certain products to Russia and possibly
USA as part of the deal. Of course if you do not want to dig into the technical
details of years of IEAE reports you can chack out what is said on Facebook
and blogsville!
Honestly, I'm starting to almost feel sorry for the failed sanctioneers,
so pathetic are their arguments.
If North Korea, the world's most isolated country - which struggles to
feed its own people - could build a bomb, do you seriously think Iran couldn't?
And if they were determined to do so, why did they join the NPT in the first
place? And why didn't they later leave, something they were free to do at
any time? Then there's the fact that the world's foremost experts have said
that Iran is not pursuing a bomb, and has not done so for many years (if
it ever did).
But... what am I doing trying to discuss facts with you? You're obviously
way more comfortable with some bizarre scenario straight from Bibi's cartoon.
Best we leave you to it, and the rest of the world can get on with business.
Please let's try and be positive about this. Iran has been a pariah state
for far too long and I applaud Obama for extending the arm of friendship
to them during his presidency.
Obviously there are many aspects of the current Iranian regime that we
in the West don't like, but I would rather be taking small steps with them
diplomatically to try and improve the situation than have a hostile stand
off.
Also Iran is not more moderate or understanding with respect to
some American dingys going near a beach in the middle of the Persian
Golf!
That sounds nasty. I hope Rory McIlroy wasn't hurt.
Joking aside, it's been established that the Americans did indeed enter
Iranian waters, probably intentionally. And what you cutely describe as
a 'beach' was actually home to an important Iranian military facility. And
the 'dinghys' were well-equipped military vessels (shame the GPS was faulty
though.....) How do you think the Yanks would have reacted had Iranian vessels
'drifted' just off the shore of a US military facility? By treating them
well and releasing them, complete with 'dingys', the next day? I doubt it,
but we'll never know, as unlike the US, Iran doesn't tend to send its 'dingys'
11,500km away from their own territory.
But you seem to have missed the wider point here. Which is that Iran
is not on trial. There are considerable grievances on both sides (objectively,
the Iranian case against the US and 'west' is much more substantial than
the reverse), but these matters were deliberately left off the table in
these negotiations, which were aimed at solving the (non) issue of Iran's
nuclear programme. The other grievances can hopefully be worked out at a
later stage.
For now, however, let's celebrate what is without doubt the greatest
triumph of diplomacy in recent years.
A red letter day for Mohammad Javad Zarif, Iran's Revolutionary Guard, and
their mission to achieve a nuclear weapons capacity, where what's holding
them back most is lack of access to Western technology, currently blocked
under sanctions. They have already demonstrated to their own satisfaction,
and everyone else's, they can withdraw from the NPT, and run down to a fissile
mass of U235 in a matter of months. What they're missing is a bomb design.
There is no doubt that if today's weak western leaders had been the ones
having to deal with Hitler, in place of Winston Churchill, the Third Reich
would be ruling the world today.
The day will come when people will look back and ask what on earth were
people like Obama and John kerry thinking when they did this terrible deal
with Iran.
If only people were "informed" on the inner workings off it all politically/economically.
I am 100% For the American constitution and see the political corruption,
the US is being used, like many other nations, against each other.
"Your" troops were an illegal occupation force, and therefore legitimate
targets.
Besides, given that the thinking at the time was along the lines of ''Real
men go to Tehran'' and that coupled with Shrub's idiotic 'axis' speech,
then who could blame the Iranians for wanting to slow down the 'progress'
of an invading army who might well have had them in their sights too?
Oh, and what do you have to say on the West's support for Iraq in a war
which killed hundreds of thoussands of Iranians, many of them civilians?
Or the shooting down of an Iranian civilian jet, killing all 280 passengers
on board?
Good news indeed. For along time western trust in Saudis oil and money cost
the Middle East a massive fortune. I hope the world see how peaceful Iranians
are an those extremist in Iran are literally the minority. Today I feel
proud because diplomacy solved a very complicated issue which I wouldn't
see it coming. Thank you mr Zarif...
Win-Win
I just wanted to explore this idea of why any argument against
Iran, or anyone for that matter, having such weapons, irrespective of
whether they plan to or not, isn't applied to the debate about whether
or not we should get rid of our (UK) own.
If we put aside sheer hypocrisy (always an important feature of foreign
policy!) then I think the usual argument is that, unlike we rational Westerners,
the Iranians are crazy religious maniacs who can't be trusted with a bomb.
In reality, though obviously the Iranian regime is a religiously-based one,
they have shown themselves to be quite pragmatic and cautious over the past
2 decades at least. Which isn't to say the regime is benign, by any means,
just that their foreign policy is based on rational self-interest (or their
perception thereof) - just like any other country.
Another reason given is Iran's supposed 'support for terror organisaitons'.
Putting aside the fact that defining what is a 'terror organisaiton' is
largely a matter of one's political views, it's hard to see what this has
to do with the nuclear issue specifically. Unless we buy the notion - straight
from a 5th rate James Bond knock-off - that Iran could 'give' its (non-existent)
nukes to a 'terrorist', as though a nuclear bomb was equivalent to an AK-47.
So, having disposed of those 'arguments', I think we're back to hypocrisy
as the motivator.
If these coups continue, there will be no-one left to overthrow politically/economically,
once the political safety-net is gone and there is no more political buffer
zones, potentially those on the outskirts left opposing this, would backed
into a war.
I don't back any country with Nukes, but I do back the balance off
power, if Iran is overthrown with Syria, it would be dangerous times for
the rest off us. It would be "safer" for Israel too disarm, followed by
Pakistan, North Korea then East + West Bilaterally, simutaniously.
All under the helm off a Strong-Moral UN. A Free, Regional agreement.
Iran isn't Nazi Germany, if you want to pursue that analogy then its
closer to Franco's Spain and we got on well if occasionally frostily with
them for 39 years without having a war with them
Can anyone take the risk of allowing Iran to even play around with this
stuff in anyway shape or form ? The west started this fight years ago and
has
1. Up to 1953 robbed Iran of its oil.
2. After a progressive Persian govt renationalized and booted British
Petroleum out of the country suffered a coup d'état instigated with US aid
in 1953.
3. 1953 to 1979 Suffered a tyrannical US/UK regime under the Shah of Iran
which led to the Islamic Revolution , ie we radicalized them.
4. After the revolution we armed Saddam Hussein to start a war and killed
millions of Iranians.
5. Sanctions for the last 10 years.
If I were Iranian I'd be double wary now of US's intentions. It seems
that the working method of the "West" nowadays is to feign a warming of
relations to draw yourself closer before a fatal stab. Remember Libya? And
I recall Syria having a nice "warm up period" before the gates of hell opened.
Take care, Iran.
4th or 5th largest proven/unproven reserves on the planet. I'm delighted
sanctions are freeing up in Iran, but I can't be alone in thinking that
the USA were going to find some devil in the detail for it not to go ahead,
to be delayed. Still highly suspicious of USA motives here, but for now
rejoice Iranian people. :-)
The annula reports of the CIA/Mossad/German BND and the IAEA supported
this fact consitently since 2004. It was only the despicable US/Israeli
geopolitics enabled by their propaganda arm the mainstream media
I have always wondered on the conflicts off interest in this, doesn't
the Security services support the political agenda for the most part? Have
seen it over the last 100 years, on reading about it, maybe not entirely
but compartmentalized they seemingly do.
I know in Syria, the Pentagon is apparently completely split, some feeding
information around to Assad, while another faction supports the overthrow.
Difficult to discern what is true/false but much of it does play-out/check-out
logically.
However, what is with the conflict of interest in this case? I guess
one is suppressing religion on 1 side, yet supporting the end of times theme
on the other. Perhaps that is where the Military end this support on a Nuclear
scale.
I agree but China and Russia are a thorn in its side. The Russians are doing
arms deals with Iran. Also a CIA led coup 1953 style is unlikely to work
against a non liberal progressive govt. Iraq is in no position to be used
to attack it.
Before the deal all the sabre rattling was hollow. No amount of bombing
was going to stop an underground nuclear programme. Sanctions weren't working,
Iran diversified its economy.
It looks to me that the west has to either start Armageddon to take
Iran out or start to build bridges.
I don't think it is capable of succeeding now with either policy. This
is very bad news for the future security of Israel. All thought it should
be safe for 50 or so more years.
Iran has always denied seeking an atomic weapon, saying its activities
are only for peaceful purposes, such as power generation and medical research.
The annual reports of the CIA/Mossad/German BND and the IAEA supported this
fact consistently since 2004. It was only the despicable US/Israeli geopolitics
enabled by their propaganda arm the mainstream media that maintained the
charade of a clandestine nuclear weapon programme.
Maybe it is that the US cold warriors are finally dying out. When the wall
came down USSR dismantled its cold war power structure because they were
the losers. US cold war professionals were the winners and saw no reason
to fade themselves out - hence the often baffling aggressive and enemy-seeking
US foreign policy in the post cold war period.
The problem is that times have changed now and the US has managed to
rile others far enough to start their own mini-cold wars against US, particularly
Russia which does have its valid reasons to feel it's been cheated and played
for patsy.
President Obama did irritate me in his State of the Union Address
when he started bragging about how big and powerful the U.S. military
was and how much tax payer money was spent on it. In fact it pissed
me off when he said those things. It was the last thing I expected to
hear coming out of his mouth.
So you weren't watching what he was actually doing over the past seven
years?
According to the Bureau of Investigative Journalism, the George W.
Bush administration ordered 50 drone attacks while the government of current
US President Barack Obama has already launched around 500 such strikes.
Obama primarily ordered assassination strikes in Pakistan, Yemen, Somalia
and Afghanistan.
The United States says the CIA-run drone strikes essentially kill
militants, although casualty figures show that civilians are often the victims
of the non-UN-sanctioned attacks.
I'm an American who just got back from a 10 day visit to Iran. Iranians
are among the nicest people on Earth. It is safe to visit. I had no issues
when I was there. The only thing you should be worried about is safely crossing
the busy streets, not terrorism or kidnapping. Don't believe the media fear
machine.
Israel are a clever country to arm, the entire middle east hates
them yet Israel clearly dominate their neighbours in any conflict. An
ally we Europeans need with how the middle east is going
And Iran, unlike the Gulf sheikhdoms, is a real country with educated
people. With sufficient investment and freedom to trade, Iran should easily
be able to develop an economy which is not entirely dependent on oil - or
gas, of which Iran has some of the largest deposits in the world. I'm not
sure the same could be said for the petrostates on the other side of the
Gulf.
" there remains a lack of clarity with regards to the US." - as ever
you never know what the US is going to do, and I suspect the US itself does
not know given it dysfunctional political system. Any system that could
even contemplate the likes of Donald Trump for the office of President cannot
be fit for purpose.
Except that Iran will secretly make a nuclear bomb anyway.
USA and the rest of the world have been duped.
In the end ordinary Iranians who just wanted peace will not get it . Will
not get it while they live under a mediaeval dictatorship that is
"Lifting of Iran sanctions is 'a good day for the world'"
Unless you are Venezuela, Russia, etc and dependent on oil prices.
In many ways, not much has improved for Iran either, they can sell oil but
at a very low price.
This is a good day as it allows freedom off the Market... Next moves shows
the world-stage who is motivated by Orwellian-double-speak (crying wolf)
or those who indeed are the aggressors....
It would be interesting if it wasn't morally evil and destructive. It
is a chess board.
Ho ho ho. This is a ceasefire. The whole project for the Middle East revolves
around it's Palestiniasation , ie leave it in tatters with no state or economic
infrastructure, eg Palestine, Lebanon, Iraq , Syria , Libya . All have suffered
through foreign intervention largely US sanctioned. For the last 40 years
since the west financed and armed Saddam Hussein to fight and destroy the
state of Iran after it deposed the Shah this has been policy. This ideal
I s like an unfinished course of anti-biotics , ultimately if you leave
Iran standing it will always be a power base which can fill the vacuum in
all these failed states.
There is no going back from the damage done...Iran has to be the West's
next horizon if there is never going to be a nuclear Islamic state this
century.
May a dead man say a few words to you, general, for your enlightenment?
You will never rule the world... because you are doomed. All of you who
demoralized and corrupted a nation are doomed. Tonight you will take the
first step along a dark road from which there is no turning back. You will
have to go on and on, from one madness to another, leaving behind you a
wilderness of misery and hatred. And still, you will have to go on... because
you will find no horizon... see no dawn... until at last you are lost and
destroyed. You are doomed, captain of murderers. And one day, sooner or
later, you will remember my words...
The far right in Israel, not for everyone. Saudi and far right wing
Israel have a symbiotic relationship. Saudi can push it's agenda of Wahhabism
that secures it's brutal regime and far right Israel profits from the bitter
fruits of Saudi, as it means that Israel is seen as the anti-muslim anchor
of the West in the region. Sadly, the political intervention of the US has
been based around protecting and supporting this symbiotic relationship
with money, troops and bombs.
Depends on the use off the word terrorist, if you mean fabricated terrorism
for aggression, to forward political goals/Land/Economic reasons, or if
you mean terrorism in defence of a Nation or a civilisation being oppressed....
It is based on perception, or rather delibrate ignorance. It is terrorism
if it is at the expense off another mans freedom.
It boils down to morality aswell, but since the various factions, possibly
even media are doing a good job too blur those lines, it makes it easier
for people who do not think for themselves, to be either delibrately obtuse/Ignorant.
One man's freedom fighter is another man's terrorist
Obama has already issued an order(today) lifting sanctions on the sale
of passenger airliners to Iran. Boeing & Airbus are in intense competition
as Iran plans to purchase 500 airliners in the next 10 years worth billions
of dollars.
I'll take it with a pinch of salt given the lack of corroboration.
There are many confirmed stories of injustice from inside Iran but I
can see why you picked this one. True or not, it certainly makes a sensational
headline.
I suspect they were hoping that once Iran had 'complied', sanctions would
be dropped and everyone could get back to business.
They then, rather belatedly realised that for the Yanks, Bibi and the
Gulf sheikhdoms, sanctions weren't a means to an end. They were the
end. Happily, only one of the above three players really counts, and they
finally saw sense.
Th key point is that it is not only about the US and the EU. India, China
and Russia will also see both great opportunities both to export and in
general to develop trade. India has already talked about building a pipeline
to Chah Bahar.
100billion of unfrozen assets - how much is going to find its
way into London property making prices even more ridiculous.
Almost none, I expect. Iran is a country of about 80 million people,
with an economy which has been severely held back through years - even decades
- of sanctions. In that context, 100 billion isn't actually that much, and
I expect the Iranians will find no shortage of ways to use it at home. And
given that the Iranian government is still highly suspicious of the
Brits (for very good reason) I very much doubt they'll want to spend this
much-needed cash on overpriced pads in Blighty.
Apologies, I thought you were talking about Iran's extra income financing
its armed forces, or its fuller influence now sanctions will be soon lifted.
The 'now' in your comment lead me to believe you were commenting on the
recent events discussed in the article, how mistaken I surely am to think
you were being relevant.
It i amazing how western oriented news organization by default report
the talking point of the western regimes reflexively. Unlike the news bureaus
in the soviet era, they don't need minders and censors, those are just built
in or plugged in by interviews.
100billion of unfrozen assets - how much is going to find its way into London
property making prices even more ridiculous.
Unless we look at channel islands type restrictions for property market
in se england our youth will only own property with inheritance and even
then when the IHT threshold is well over a million if you project forward
six years. (price doubles every six years).
Good point, EU countries UK aside, very never comfortable with the position
the west took with regard to Iran. How as the big boss in Washington decided
what the policy was they had little choice.
Ha, ha, ha! US allies are never sanctioned, no matter how many International
Laws they break, they ignore UN resolutions against them no matter how cruel
and inhuman their actions. Where are the sanctions against US? Oh, can't
be sanctioned can it...
He can do what he likes, the US have given Israel a free pass, human
rights abuses, extrajudicial killings, threats to Israeli Arabs, 'hidden'
nuclear weapons, all have to be ignored while their neighbours are subjected
to endless scrutiny. While this continues the Middle East will never be
at peace. Palestinians are humans too.
Or those that funded the creation of Israel? in 1917 - Balflour declaration,
and what is currently going on today in Israel, still by dictionary definition,
genocide.
The hardliners in Iran "Delvapassan", most of whom work for hostile foreign
intelligence services, are also in trouble. In fact the arch spy, Naghdi
of Basij whose members stormed the Saudi embassy in return for petrodollars,
now says it was the monarchists who stormed the Saudi embassy. A ridiculous
claim as most people in Iran know that monarchists could not even organize
a birthday party.
It's scary to say the least and one wonders if it can even be brought back
from the brink if someone like Bernie Sanders was to be elected. President
Obama did irritate me in his State of the Union Address when he started
bragging about how big and powerful the U.S. military was and how much tax
payer money was spent on it. In fact it pissed me off when he said those
things. It was the last thing I expected to hear coming out of his mouth.
He sounded like a republican braggart. It really annoyed me. I do believe,
to his discredit, that he was trying to appease the Repulicans.
"Whoever though it was a good idea to become closely allied to the barbaric
sheikhs of Arabia whose petrodollars are fueling wahhabi barbarism, is a
complete idiot."......President Roosevelt
Really interesting article. Thanks for linking - I love Glenn Greenwald's
site.
I also loved this quote:
"A sailor may have punched the wrong coordinates into the GPS
and they wound up off course."
So what could be interpreted as an act of war is down to some dunderhead
'punching the wrong coordinates'? 4realz? And of course the fact that the
Yanks basically lied and did indeed intentionally violate Iranian territory
will not be covered by the media. And like I said before, where are all
those posters who accused several of us of being 'bots' because GPS imagery
would of course show the Yanks were in international waters and the Iranians
were fibbing, as always?
Surely this is the end of Saudi Arabia if they continue to keep the oil
prices low, bringing the rest of the market down with it, at the expense
of their own economy (& Nation) & ours. With this Iran will likely be able
to sustain an economical war with less reliance on oil as the Saudis.
No sympathy for them or their terrorist support. Still waiting on economic/weapon
sanctions and condemnation off them (and anyone else involved) by the UN
etc
This is good news, and it has to be hoped that the Iranian economy can now
start to grow. No doubt, the Saudi and Israel won't like it, but that's
though, if either of these two countries had professional leaders, then
their childish, spiteful and lying screams against Iran, would never exist.
Forrest also said ongoing human rights and terrorism related sanctions
in the US would have an effect. "Whilst the EU piece of the puzzle is clear,
as it has already published relevant legislation amending existing sanctions
measures to pave the way for early EU termination, there remains a lack
of clarity with regards to the US."
Arr .... the reason possibly is that the US knows it has already pissed
off Saudi and Israel, so won't push the boat out to far, thereby exasperating
an unnecessary situation further.
Lifting of Iran sanctions is 'a good day for the world' Yet these gangsters
who control the finance industry(US/UK), and who can and do, impose sanctions
at will, are free, without sanction, to wage war against whoever they so
choose with impunity. Something is not quite right here, or are we too stupid,
too compliant to see it?
If the US, Russia, Germany, France, Britain, Japan, and the EU say this
agreement is watertight, you can safely believe that it is. Except of course,
if you are smarter and better informed than all their diplomats and technical
experts. Are you?
Ok - so you're anti nuclear weapons. Fair enough, you're free view.
For me, much more importantly is the opportunity for trade. The Iranians
are well educated and still have a historical connection with our country.
I am a manufacturer of made in UK retail product and will see this as
a great opportunity to help build relationships and support the growth of
our sustainable employment in the UK.
If this technology is so promising, why didn't any the other nuclear nations
offer themselves "a testing bed for the much safer Thorium reactor solution"?
Iran isn't the world's guinea pig.
When sanctions started, they were nowhere near as harsh. European countries
- as well as China and India - had long been growing tired of the extremely
strict sanctions imposed mostly by the Americans. Though Kerry gets
a lot of the credit for the deal going through, according to some reports,
his European allies told him that they were going to stop abiding by the
sanctions whether he and Bibi liked it or not. So he could either accept
that reality or keep fighting the cartoon fight. Thankfully, he and his
boss chose the sensible option.
All the nuclear nations should have banded together with Iran to help
Iran with their desire for peaceful nuclear power by helping Iran with expertise
and funding to develop Thorium reactors. That would put the kibosh
on Iran's nuclear weapons program and work as a testing bed for the much
safer Thorium reactor
solution .
Unfortunately, those cooler heads, will be leaving the administration at
the end of this year, when there are elections in the US. After that anything
can happen.
It's been a rare pleasure to have diplomatic adults, not warmongers,
in both the White House and the State Department, for the past 8 years.
Europeans already had business interests at the time the sanctions started,
ten years ago. And yet they supported the sanctions. I don't see why it
should be different now.
Actually, it's never been that difficult for most European tourists to visit
Iran. Getting the visa can be a bit of a pain, but most people who apply
succeed in getting it quickly enough. And once you're in the country, you
can travel pretty much whereever you like. There has been a requirement
for British travellers to travel with an official guide, but I expect that
will be dropped very quickly.
Yes, unfortunately neither the UK or the US think long-term, when selling
advanced weapons to the Saudis (or giving them to Israel). That may well
come back to bite them, when the House of Saud falls, as it must.
Amazed this has gone through. The world's biggest and most dangerous
children, Israel and Saudi Arabia, will NOT be pleased. These two are behind
so much of the world's problems, far moreso than their parent the USA.
Yes I get that Laguerre, I don't think that's what they are doing either,
but that's not really the point I was trying to make. Considering that,
there are plenty of people around the world that think Iran does want nuclear
weapons, in spite of Iran's protestations to the contrary, I'm guessing
that there must be a ready argument for them not having such weapons. I'd
be interested to know what that argument is and why it doesn't apply to
us.
Welcome to the world community Iran. Not a perfect nation but which
is. No point demonizing people & nations, it does more harm than good.
They have said their Nuclear use for Civilian purposes and so it has
proved. Now how about those nations with Nuclear weapons and armed to the
teeth with getting rid some of them. Hypocrisy of nuclear issue like most
things around the world is stunning.
The Saudis are having to use Columbian mercenaries to supplement their usual
Pakistani rank and file "soldiers" in Yemen. No Saudis are ready to sacrifice
their lives to further their own royal families ambitions. This is an incredible
weakness but typical of a petrodollar state where all loyalties are based
on money. If Saudi Arabia were attacked by even a small but determined force
(such as ISIS) it would collapse like a house of cards.
The US has the largest prison population in the world. It also practices
torture at home and abroad. It carries out executions at home and extra
judicial (terror) killings abroad often using drones to do so. Compared
to any of this, Iran is just a beginner.
America is the best defended slum in the western world. A few facts: Huge
disparities of wealth and poverty, a rigid class system, massive unsustainable
military spending around the world, a weak education system that depends
on educated migrants to take skilled jobs, a declining manufacturing sector
due to dumb free trade deals that built up Chinese economic power. I could
go on indefinitely......but if America falls it will collapse from within
through its own internal contradictions - probably in typical American style
involving hubris, narcissism, blame shifting and of course lots of violence.
Real change must come from below and not from the Americans or Europeans
or Israeli lobby or sheikhdoms, or MEK or any other Iranian exile group,
but the Iranian masses themselves. History has shown this to be true time
and time again. Reforms were introduced in Germany, England, France, the
United States, etc. only because of pressure from below, from the organized
sections of the working classes and their trade union representatives and
not from 'enlightened governments' or 'generous employers'. The road to
reform is paved with struggle and defeats and victories.
German Chancellor Bismarck, the first statesman to introduce reforms
as a way to put down socialist agitation and mass disgruntlement, wrote
in 1889: "we must vigorously intervene for the betterment of the low
of the workmen. "
German Emperor William II cautioned in 1890: "For the maintenance
of peace between employers and workers…Such an institution will facilitate
the free and peaceful expression of their wishes and their grievances,
and furnish officials a regular means for keeping informed of the labor
situation and of continuing in contact with the workers"
In 1906, a French cabinet member cautioned: "we believe that it
is time to study seriously the means of preventing the return of conflicts
between capital and labor"
If you want to support the Iranians in their struggle, support the labour
movement there. Everything that is good about North America and Europe,
or rather, the things that make life tolerable there including a decent
standard of living, paid holidays, adequate working conditions, unemployment
insurance, pensions, etc. was struggled for and won by workers and trade
unions.
It's all true. The U.S. Military program is over bloated and needs a severe
diet. Billions of dollars wasted. Criticize the U.S. military all you like.
I do all the time. ;)
Did you know that the U.S. military is second in federal expenditures
only to social security? It is the second most expensive program in the
United States! This is wrong.
So when some apologist says "well the military only makes up 17 percent
of the budget," (which has been said to me on many occasions) tell them
they are full of it.
When will the civilized world see sanctions on US, UK and Saudi Arabia
for dropping bombs on the Yemenis?
After the UK(Cameron) gifted a seat on the Human rights council to the
Saudis?..
Anyone would think it was a thoroughly corrupt rigged game .. wouldn't they.
The west makes it up as they go along .. and you argue the toss at your
peril.
Ha, ha, ha. Priceless. Yes, no one has ever(as far as I'm aware) put forward
a reason why anyone would want to invade the UK. Why would they ..
it certainly wouldn't be for the benefits many here would have us believe.
Iran however?. yes, what a tasty treat, they have significantly more
to nick in terms of raw materials and other good stuff than we do .. Iran
would make a far better(and now easier) target. Oh.. Bibi, despite his protestations
to the contrary, must be rubbing his hands with glee, and now with the revelation
that US and UK personnel are ensconced(secretly) with the Saudi's .. If
I were an Iranian, I'd see myself surrounded by enemies. Would I give up
the potential to make a bomb?..
Hmm. Whatever the inducements were, they're certainly not enough to see
off a willful new US president with a finger on the trigger, especially
as almost all have voiced the desire to bomb.
But he said while all nuclear-related sanctions on Iran will be
lifted, other sanctions such as those related to human rights and terrorism
will remain in place
Sanctions on Iran were illegal and the people of Iran were punished for
the nukes they never wanted to build. When will the civilized world see
sanctions on US, UK and Saudi Arabia for dropping bombs on the Yemenis?
I hear you on this. I heard that the American cost of the new F35 fighter
jet program is enough to buy every homeless American a $600,000 house. I'm
not criticizing the USA military program or anything just highlighting the
simple cost for America to help it's own poor. Especially in today world
were money created out of thin air. Even now that i have wrote this how
much QE did the Fed do but couldn't house the homeless.
But he said while all nuclear-related sanctions on Iran will be lifted,
other sanctions such as those related to human rights and terrorism
will remain in place, most notably in the US, meaning that companies
would still have to comply with those restrictions.
Meanwhile the Telegraph is calling for an alliance with al Qaeda in Syria,
saying:
The reality that comes with the prolonging war might now mean that
it is time to think of widening who we support – and by working with
groups who would fight IS first over Assad, or indeed al-Qaida's Syrian
branch Al Nusra, but who might not necessarily have the moderate qualities
we would ideally like to support militarily in Syria, lest they too
enact the depravity of beheadings, torture and rape which the conflict
has seen too much of already.
That's before we get to Yemen, where the areas the UK has helped 'liberate'
from AQ's fiercest foe, has been taken over by ISIS.
What's that Netanyahu? I can't hear you. I still can't hear you. Yeah, maybe
you should set your dumb ass down and take a break for the rest of your
miserable life from your anti-Obama/anti-Iran rhetoric. You are already
soaking the American taxpayer for 3 billion a year, and now you are asking
for 4.2 to 4.5 billion a year for the next ten years. It disgusts me how
American tax payer money gets thrown around the world while people here
at home are in the streets starving. How does that work, Netanyahu? You
tell me, how does that work, you miserable fool.
Yes, but as we've seen previously under Bush Jnr, how long does it take
to start an illegal war and who will stop the US in an illegal war? .. it
certainly won't be us in the UK .. inexplicably we seem to love whatever
the US does be it legal or absolutely illegal.
I'm pleased sanctions are being lifted, but until we discuss as adults
the Palestinian/Israeli issue plus Israels nuclear arsenal - which quite
ludicrously seems immune even from being acknowledged, then tensions will
remain. We can't keep ignoring this issue and the injustices in Palestine
in the blaise fashion with which we apply sanctions to others. The west's
current hypocrisy stinks.
This is what I heard on the news earlier in the night. I heard that the
two navy boats did indeed purposely take a short cut through Iranian waters.
Then the Iranian guard took pursuit. Then, the Harry Truman aircraft carrier
group launched search helicopters into the area which did not help things
at all and only escalated things. Finally, the Iranians took the crew.
The U.S. lies all the time. They constantly lie and then the U.S. politicians
come calling for nothing short of a nuclear strike! They are insane. I can
say this much. Any country has the right to board and take a vessel if it
enters their waters, and that includes the stupid, arrogant U.S. This country
really needs to back their shit down and take a look at what they are doing
in the world. They have become very full of themselves and it stinks to
high heaven. It smells like shit.
A great privilege to witness such a rare occasion when common sense and
rationality prevail! Well done all the parties involved! Thanks for "giving
peace a chance"
PS. Wondering how Republicans (especially Tom Cotton), Bibi, king Salman,
n the rest of premium members of warmonger club are feeling now!
.
Anything that stops the Saudi's playing the big I am is fine by me.
They've already cut off their own nose over oil prices to stop US fracking
and their economy is suffering, lets hope Iran can keep it low when it doesn't
suit Saudi Arabia.
The one worry is ISIS getting a foothold if the Saudi government goes
tits up and getting their hands on some real shiny weapons.
"Whilst the EU piece of the puzzle is clear, as it has already published
relevant legislation amending existing sanctions measures to pave the way
for early EU termination, there remains a lack of clarity with regards to
the US."
Good, let the US who started all this nonsense feel themselves for
a while what it is like to be outside trade with Iran. I bet it will not
last long if companies realize they are still not allowed to do business
because of their own extortion over the many years while the EU does commence
trading.
That British troops are involved in Saudi's dirty war - and it seems very
dirty indeed, is nothing short of scandalous. Questions should be being
asked surely?..
But it's somewhat academic isn't it?.. Whichever sweetheart with the exception
of Bernie Sanders, who happens to con their way into the US hot seat, they've
all taken against Tehran in a big way haven't they. Almost all of them have
promised at some stage in their self-serving careers to bomb Iran back to
the stone age, even the occasionally economical with the truth Hilary Clinton
who tries so very hard to convince she's actually a human being has an issue
in that regard.
I really do hope you have an insurance policy Iran, I wouldn't trust
these liars as far as .. and I'd advise using some of what's rightly coming
your way to insulate against future western blackmail.
I'd buy a bloody big bomb .. but keep it quiet, you never know who's
listening .. Ha, yes we do!
Sanctions should never have been imposed. They are a form of collective
punishment that has stopped medicines coming into Iran and punished small
businesses. I know from experience. I had salmonella in Iran when I was
two, and medicines that would have been free under the NHS were so expensive
in Iran due to sanctions that my father had to sell his Mercedes Benz (not
sure he's ever quite forgiven me for that). Meanwhile, Israel's nuclear
arsenal goes unmentioned and unpunished, and we have British troops sitting
in the Saudi war rooms. British foreign policy is a selective and hypocrital
joke.
Well played to all those on both sides responsible for the recent progress,
though I am more than slightly concerned that the next US president will
see things rather differently. Let me also say that Louise Mensch's recent
tweets have been nothing short of disgusting and wholly inflammatory, exactly
the kind of rhetoric that the world community should be shunning.
I'm pleased that whoever it was in the US military command who tried to
use the sailors to provoke a clash with Iran and scupper the end of sanctions
did not succeed. There should be a full enquiry and the traitor exposed
and charged. Let's hope Seymour Hersh gets on the case as soon as possible!
The US specializes in lack of clarity. Remember the two boats that Iran
detained the other day? The US initially said that they had a mechanical
failure and drifted into Iranian territorial waters. That version of events
has become non-operative, and now the US is saying that the boats were fully
operational, but one of the sailors accidentally punched the wrong GPS coordinates
in. And then, of course, they failed to notice that they were getting awfully
close to that island where Iran maintained a base.
Fortunately, we didn't have Cruz in the White House, threatening to nuke
Iran for detaining American sailors for trespassing, even though it's clear
they were question, fed, fueled up and sent on their way. The Iranians,
at least, were civilized, albeit involuntary hosts.
"... There's too much politics in sanctions - it's almost an Obama doctrine
- sanctions rather than anything else kind of thing, so there was always a political
impetus to show they were successful - which was particularly easy to do if successful
had no definition. ..."
Never been a believer that Iran was all that constricted by it all.
There's too much politics in sanctions - it's almost an Obama doctrine -
sanctions rather than anything else kind of thing, so there was always a
political impetus to show they were successful - which was particularly
easy to do if successful had no definition.
Lotsa talk about Iran
exporting condensate in big quantities all during the sanction period. That
was income and condensate then may have brought in more money than crude
would now.
Article yesterday saying Iran was going to reprice whatever they export
- something other than currency. Ominous precedent.
Obama not only uses sanctions for anybody who does not agree with his administration
policies, his administration and he personally also is complicit with this
bonanza of unlimited financing for shale patch:
=== quote ===
Senator Barack Obama: "I mean we send a billion dollars every day to foreign
nations because of our addiction to foreign oil, and in the bargain we drive
up our gas prices because of high demand, so it's hitting you in the pocket
book. " (Senator Barack Obama, Remarks At A Campaign Event At The University
Of Alabama, Birmingham, AL, 1/26/08)
This is Guardian article written just before imposition
of sanctions in 2012.
Notable quotes:
"... Pure colonial greed - Neo Cons get back in your boxes and stop lusting
after Iranian oil. Morally and financially bankrupt Western countries need to keep
out of other peoples affairs. ..."
The top destination for Iran's crude oil exports in the six months between
January and June 2011 was China, totaling 22% of Iran's crude oil exports. Japan
and India also make up a big proportion, taking 14% and 13% respectively of
the total exports of Iran. The European Union imports 18% of Iran's total exports
with Italy and Spain taking the largest amounts.
Sri Lanka and Turkey are the most dependent on Iran's crude exports with
it accounting for 100% and 51% of total crude imported, respectively. South
Africa also takes 25% of its total crude from Iran.
'The top destination for Iran's crude oil exports in the six months
between January and June 2011 was China, totalling 22% of Iran's crude
oil exports. Japan and India also make up a big proportion, taking 14%
and 13% respectively'
- I think even any common or garden moron can see the game plan here..
Time to plant the seeds of democracy...again
firstnamejames - The world should give thanks that you aren't in a position
of power!
Diplomacy and sanctions are time consuming? Not half as time consuming
as 'kicking ass' George Bush style. The Wikipedia entry for the War in Afghanistan
is dated (2001-Present)….. that's what you call quick, decisive action!
What was required post-911 was for the US to have a long, hard think
about its foreign policy, but instead they lived gloriously to stereotype
and played right into Bin Laden's hands.
Bali 02... Madrid 04... London 05... that's the price you pay for 'quick,
resolute' action.
We nuke Iran and the consequences will be life altering - not just for
the Iranian people either.
This report is wrong, like most of the scaremongering on this issue, Iran
did not threaten to close the strait of Hormuz in retaliation for the oil
embargo, they threatened it in retaliation for a strike on their entirely
legal nuclear facilities, the Western medias attempt to gin up a war with
Iran are both foolish and pathetic...
Pure colonial greed - Neo Cons get back in your boxes and stop lusting
after Iranian oil. Morally and financially bankrupt Western countries need
to keep out of other people's affairs.
The hypocrisy of the West is breath taking - attack Iraq over war crimes
vs the Iranians, non-existent WMD in Iraq just as in Iran now, swap sides
in Libya by funding militias led by so-called Al Qaeda men and the bleat
on about UN resolutions when the elephant in the room (Israel) continues
to abuse Palestine people and then continue to sell arms to other dictators
around the world.
Well I suppose anyday now there will be a nuclear test in Iran and that
will be that. Iran will be welcomed to the nuclear club with India and Pakistan
and North Korea.
I guess Russia or China would probably lend Iran a small nuke for the
undergrond test.....
That will be adios to the Israeli aggression in the region.
I might note that proven reserves are NOT the same as recoverable reserves,
the distinction is a quite huge difference. Also Saudi Arabian numbers are
only guesses as the true numbers are a closely guarded state secret. It
should also be noted that the north of Iran is on the Caspian Sea and any
regional conflict would impact those nations and their gas and oil development
too. Of course the Kurdish oil in Northern Iraq would also be at risk and
I doubt the Iraq government would care one jot if it came under fire. The
Strait of Hormuz isn't the only oil that would be effected should this all
blow up.
American oil producers are in retreat; companies have decommissioned more than 60 percent of
their rigs in the last year or so. Since peaking at 9.7 million barrels a day early last year,
domestic oil production has fallen by more than half a million barrels. Rosneft, Lukoil and
Western companies are also dropping big projects in Russia.
Some analysts also say that the concerns about slowing demand in emerging markets, a byproduct of
the economic weakness, are overblown. China and India, for example, are working hard to build up
enormous strategic reserves, which adds to the demand.
RBC Capital Markets, a division of Royal Bank of Canada, estimates that China's needs will
continue to grow as it places an additional 65 million to 70 million barrels in its reserves this
year. India began amassing a strategic reserve only last year, and it has a goal of storing
roughly 330 million barrels over the next several years.
"... Without ongoing oil investment decline rates everywhere will increase, so the 1.2 Mb/d decline
estimate at the World level for 2016 compared to 2015 ..."
"... Note 2015 was about 9.4 Mb/d average, so this would be an average 2016 level of about 8.2 Mb,
with output falling from 9.2 Mb/d in Dec 2015 to 7.2 Mb/d in Dec 2016 (we will assume a linear decline).
..."
"... Any guesses out there for the average oil price for 2016? Mine is more than $50/b average for
the year for WTI. The EIA guess is $39/b for WTI in 2016 (average price). Note that they also have very
wide error bars around this estimate (from $22/b to $82/b for the 95% confidence interval in Dec 2016.)
..."
"... If we take the average of the high and low estimates for the 95% confidence intervals for March
to Dec 2016 and than average these with futures prices for Jan and Feb 2016 we get an average price
of $45/b. ..."
"... I think the futures market will be wrong on the low side by at least $5/b. ..."
"... Even if we assume $40 for 2016 as the average, at $29 oil is more then 25% below the expected
(low) annual average pushed by IEA. Which is almost 4 times of annual return on junk bonds. ..."
"... My impression is that this show with sliding oil prices went a little bit too long. The price
of oil is now like compressed spring. So with the appropriate trigger event there will be a strong bounce
if only because of short squeeze ..."
Others have probably pointed this out, but a couple of articles I have just read suggest
the strengthening of the US dollar may drive oil prices lower, to possibly $20/b. I still am skeptical,
but let's consider what this might do to US output. I expect we would see turmoil from the LTO
sector and a lot of conventional stripper wells might get temporarily abandoned. Let's assume
the worst and assume a 30% annual decrease in all US onshore output from the lower 48. I believe
this is about 7 Mb/d in 2015 (roughly), so this would mean the average output in 2016 would drop
by 2 Mb/d from 2015 average output levels (this is C+C output.)
If that estimate is correct for an oil price at $20/b, I believe this would bring the oil market
back into balance pretty quickly and this does not consider the effect on other oil producers,
prices this low might make OPEC take action or at least reduce investment throughout the World.
Without ongoing oil investment decline rates everywhere will increase, so the 1.2 Mb/d decline
estimate at the World level for 2016 compared to 2015 (yearly average CC output levels) may
be conservative at an oil price of $20/b. Note 2015 was about 9.4 Mb/d average, so this would be an average 2016 level of about 8.2
Mb, with output falling from 9.2 Mb/d in Dec 2015 to 7.2 Mb/d in Dec 2016 (we will assume a linear
decline).
Any guesses out there for the average oil price for 2016? Mine is more than $50/b average
for the year for WTI. The EIA guess is $39/b for WTI in 2016 (average price). Note that they also
have very wide error bars around this estimate (from $22/b to $82/b for the 95% confidence interval
in Dec 2016.)
If we take the average of the high and low estimates for the 95% confidence intervals for
March to Dec 2016 and than average these with futures prices for Jan and Feb 2016 we get an average
price of $45/b.
I think the futures market will be wrong on the low side by at least $5/b.
After that it depends on how resilient the US producers are and what OPEC does.
I think oil could go as low as high teens this quarter and then recover to about $40 by year end
as US production falls below Iran and Iraq increases.
We just know them oil cos keep ripping us consumers off again … ;-)
"most barrels of oil sold
around the world garner even less than the benchmark price, Nicole Friedman reports. A basket
of crude oils sold by members of the Organization of the Petroleum Exporting Countries has fallen
to $25.69 a barrel. In Canada, some of the cheapest crude oil in the world costs less than $15."
Much depends on how Wall street will play Iranian card and whether OPEC can agree on cuts in
June (or at the emergency meeting in March, if any), or Saudis will block this move. Those are
trigger events for 2016. The key issue is that the system is destabilized, so I would expect wild
oscillations. We might be observing one right now.
Even if we assume $40 for 2016 as the average, at $29 oil is more then 25% below the expected
(low) annual average pushed by IEA. Which is almost 4 times of annual return on junk bonds.
That does not mean that you need to put your money (oil speculation is only for big sharks
like Vitol and Mercuria able to buy real oil and store it in tanks while selling futures ), but
still this is quite a big deviation from expected for 2016 or multiyear average. Almost like in
2008.
My impression is that this show with sliding oil prices went a little bit too long. The
price of oil is now like compressed spring. So with the appropriate trigger event there will be
a strong bounce if only because of short squeeze.
We now also can say that all those shale/tight oil propagandists (including EIA) and financiers
did a very bad service for the country. The bet was that the price will go above $100 and stay
above it forever. Now they are losing tons of "other people money" along with the destruction
of the US oil infrastructure including conventional wells, as well as oil industry employment.
Which is especially sad.
When I am thinking how many people lost jobs because of this crazy and generally unnecessary
and harmful for energy conservation efforts price slide I became really angry at Obama administration.
They have had money to save banks in 2008, but no money to help the US oil industry in 2015-2016.
They definitely could buy oil for the US strategic reserve on a monthly basis. At this price level
around half of it is essentially free, as you can sell the other half at high prices later. So,
in essence, it is like short to medium term loan which will be repaid with interest.
I still wonder who benefits from such low prices ( say, below $50 ) other then Wall Street
honchos. It's not the consumers as difference in gas prices is minimal and gas expenditures are
not that big part of a family budget in the USA. It's not even trucking companies and retailers
transporting Chinese goods from ports. Both are still shrinking. WalMart just announced that it
is closing 154 stores (http://www.foxnews.com/us/2016/01/15/walmart-to-close-154-stores-in-us-10000-workers-affected.html).
Even chemical companies are cutting personnel like crazy.
One interesting thing the emerged from this episode is that the laws of supply and demand does
not work in heavily indebted environment. Producers can't cut production despite the price dropping
below profitability because they need to pay interest on debt. Such a Catch 22.
BTW according to Reiter in the USA "onshore tanks are barely a third full, with less than 150
million barrels of the nation's total 439 million barrels of shell storage capacity occupied as
recently as October, according to a Reuters analysis of U.S. data." (http://www.reuters.com/article/us-oil-tanks-analysis-idUSKBN0KL0AZ20150112)
"Almost 40 percent of total tank farm capacity was leased to third parties as of last September,
up from a low of just 28 percent in 2012"
Heavy oil producers are now losing money on every single barrel that they sell,
Notable quotes:
"... Forget the fixed costs of development; just the operating costs of keeping a project online are significantly higher than the revenue that an oil sands producer would earn from selling their bitumen. ..."
"... Leaving aside the massive cutbacks in spending and the future oil production that will not be realized, Canada could start posting some serious production declines from existing sources. Simply shutting down an operation probably makes more sense than selling oil at a loss. ..."
"... Shutting down can actually damage a reservoir, leaving a site with permanently lower output. As a result, production shut ins could actually be "extremely limited," ..."
"... Oil, like any other good, is subjected to supply and demand. The only problem, like any other traded good, it's also subject to (and exacerbated by) the forces of speculation. With oil being so low right now, the speculators are less interested until there's a clear sign that oil is going up again. ..."
WTI has declined to $30 per barrel, the lowest level in more than 12 years. But heavy oil
producers in Canada would love to have $30 oil
Single-digit oil prices for oil sands is not just a problem, it is an existential crisis. That
is because heavy oil is some of the costliest stuff around. Bitumen production is way more
expensive than oil from shale.
Heavy oil producers are now losing money on every single barrel that they sell, even from
facilities that are already up and running. Forget the fixed costs of development; just the
operating costs of keeping a project online are significantly higher than the revenue that an oil
sands producer would earn from selling their bitumen.
Consequently, it is shut-in time for some producers. Leaving aside the massive cutbacks in
spending and the future oil production that will not be realized, Canada could start posting some
serious production declines from existing sources. Simply shutting down an operation probably
makes more sense than selling oil at a loss.
But some companies might stay online and lose money because shutting down carries its own
trouble and costs. Shutting down can actually damage a reservoir, leaving a site with permanently
lower output. As a result, production shut ins could actually be "extremely limited," Martin King
of Calgary-based First Energy Capital recently told an industry conference.
A
Oil, like any other good, is subjected to supply and demand. The only problem, like any
other traded good, it's also subject to (and exacerbated by) the forces of speculation. With
oil being so low right now, the speculators are less interested until there's a clear sign
that oil is going up again.
The market will reset itself as both supply goes down since it's no longer sustainable, and
when it does, speculators will come back.
As for the fact that bitumen is so cheap, it's no surprise. WTI and Brent are what's known as
benchmarks, and represent some of the best quality oil in the world, easier to refine and
create end products from. Essentially, they're some of the most expensive oil in the world at
any given moment.
We will see incremental supply destruction along with pickup in demand, but this is an
instantaneous process. We see bankruptcies and liquidation in 2016.
Mohamed El-Erian, Pimco's former chief executive officer and a Bloomberg View
columnist, comments on oil prices and Fed policy. He speaks with Bloomberg's Betty Liu on
"Bloomberg Markets."
They can't really allow us to slip into another recession. Robust employment number that
you say is mainly holiday hiring. If they cut to zero they might resort to QE. They can't
change interest rate, so they will try it again. Whether it work or don't is another thing.
Markets are in deep concern mode. Market players are worried that oil might go to
something like 25 and that will explode the whole high yield bond area. That's a huge concern.
Notable quotes:
"... Cashin stoically explains to a dumbstruck CNBC anchor, that it doesn't matter that it hasn't worked in the past, The Fed will unleash moar QE to save the world. ..."
"The Fed will try anything," warns Art Cashin, calmly explaining that markets "are in 'deep
concern' mode," currently and if the S&P hits 1857, "there might be another whole new round of
selling."
The Fed's solution, Cashin stoically explains to a dumbstruck CNBC anchor, that "it
doesn't matter that it hasn't worked in the past," The Fed will unleash moar QE to save the
world.
The venerable Art Cashin unleashes some rather uncomfortable truths and no one dares disagree
with him...
"Initially when oil was down, the convenient line was 'Well, it's good for the
other nine sectors'," said Jake Dollarhide, chief executive officer of Longbow Asset Management
in Tulsa, Oklahoma. "That tune has changed. Now, it's a contagion to the other nine sectors. It's
a contagion to Main Street and Wall Street."
That triple-digit figure might seem outrageous, as much for its size as for its specificity.
But that's the call that Ecstrat oil strategist Emad Mostaque made on Bloomberg News in October.
In fact, it's one he's been making for over a year. The call was on both Brent crude and WTI, and
was backed by Ecstrat's analysis of the rapid declines in U.S. shale production and the lasting
turmoil in the Middle East.
Citigroup, the fourth biggest by assets, said on Friday morning that it had recorded a 32 per
cent rise in non-performing corporate loans in the fourth quarter from the previous year, mainly
related to its North American energy book. Wells Fargo, the number three by assets, said net
charges came to $831m in the period, up from $731m in the third, mainly due to oil and gas.
A day earlier JPMorgan Chase, the number one, said it was "watching closely" for spillover
effects. If oil stayed around present levels of $30 a barrel, it said it would be forced to add
up to $750m to reserves this year - which is roughly one-third of the benefit it expects from
higher net interest income.
... ... ...
Analysts note that the longer the oil price stays low, the fewer options the E&P companies
have. For much of last year, they could negotiate extensions and amendments with lenders, on the
assumption that prices would recover. Or they could sell non-core assets, seek capital from
public or private markets, or rely on hedging contracts to secure sales above market prices.
But each of those escape routes now seems to be closing. Many cash-strapped producers have sold
what assets they can, while bond and equity markets - both rattled by China - are offering much
flimsier support. Hedges, too, are falling away, and becoming much more expensive to renew, said
Kristen Campana, a partner at Houston-based law firm, Bracewell & Giuliani.
... ... ...
Some analysts still scoff at the idea that the collapse of the energy sector could really hurt
the big banks, noting that direct energy exposures are in the range of 2 to 4 per cent - versus
about one-third for residential real estate. They note that lower oil has positive effects too,
as consumers feel more flush from a fall in petrol costs.
"People hate banks and they want to see them suffer," said Dick Bove, analyst at Rafferty
Capital Markets. "But it [the energy sector pressure] is not going to have the impact that people
are hoping for. This is not 2008."
But Fred Cannon, global director of research at Keefe, Bruyette & Woods, said bigger banks had
better brace themselves. "If it spills into the broader economy, and it starts looking like Texas
in the 1980s, it could be a different story," he said.
"... As U.S. production slumps by 575,000 barrels a day, global oil markets will tip from surplus to deficit, Goldman predicts. ..."
"... "The key theme for 2016 will be real fundamental adjustments that can re-balance markets to create the birth of a new bull market, which we still see happening in late 2016," analysts Jeff Currie and Damien Courvalin wrote. ..."
Oil will turn into a new bull market before the year is out as the price rout shuts down sufficient
production to erode the global glut, according to Goldman Sachs Group Inc.
The crash in U.S. oil
futures -- which sank back below $30 a barrel on Friday to a new 12-year low -- will send the nation's
shale-oil boom spinning into reverse in the second half of the year, the bank said in a report.
As
U.S. production slumps by 575,000 barrels a day, global oil markets will tip from surplus to deficit,
Goldman predicts.
"The key theme for 2016 will be real fundamental adjustments that can re-balance markets to create
the birth of a new bull market, which we still see happening in late 2016," analysts Jeff Currie
and Damien Courvalin wrote.
The market will signal it's ready to rally when the forward price curve, which currently shows
a steep discount on immediate commodity supplies, starts to flatten out, the analysts said. The
end of that discount would demonstrate that there's enough demand to whittle down oil that's
piled up in storage tanks, they said.
"A flat curve near cash costs is historically the buy signal for passive investors and we believe
the current bear market will end the same way," Currie and Courvalin said. "Such a signal is what
will shift us to being bullish commodities."
Goldman, which has warned that the oil market might not re-balance unless prices fall to $20 a
barrel, forcing production cuts among shale operators, said this remains a possibility. Still,
the $20 scenario remains an outlier rather than their most-likely case, and would only be
realized if oil storage space runs out. As that's unlikely, the bank said it's sticking with its
forecast of $40 a barrel for the first half.
This is a bearish news. Somehow shale drillers managed to preserve the total amount of oil produced
despite negative cash flow.
Notable quotes:
"... There were 77 new wells producing (72 in Sep), while 93 new wells were spud (122 in Oct). These
newly producing wells do seem to have had a good first month on average. ..."
"... Still, the biggest surprise is that the decline in older wells ( 2 months) was not more – they
should typically decline by about 50 kbo/d per month (for the front month), but in November they just
declined by 25 kbo/d. ..."
Total oil production is up in ND from 1171 kbo/d (Oct) to
1176 kbo/d (Nov). There were 77 new wells producing (72 in Sep), while 93 new wells were spud
(122 in Oct). These newly producing wells do seem to have had a good first month on average.
Still, the biggest surprise is that the decline in older wells (> 2 months) was not more
– they should typically decline by about 50 kbo/d per month (for the front month), but in November
they just declined by 25 kbo/d.
I suspect that the reason is, as Lynn Helms mentioned during the webcast last month, that operators
tried to produce as much as possible before the feared OPEC meeting early December. There was
a similar low decline in older wells the month before (Oct), while the decline was above 50 kbo/d
in every earlier month this year, except in May (30 kbo/d).
Below a graph that shows this. The difference between the green and red line represents the
total growth/decline of oil production in ND.
If this interpretation is correct, we may see bigger declines in the following months.
As the author admits that at least six state (add PA to the list) in the USA now are
pushed into recession due to shale bubble bust.
Notable quotes:
"... An estimated 250,000 oil workers have lost their jobs , and manufacturing of drilling and production equipment has fallen sharply. ..."
"... In the United States, Alaska, North Dakota, Texas, Oklahoma and Louisiana are facing economic challenges. ..."
"... Even some oil executives are quietly noting that the Saudis want to hurt Russia and Iran, and so does the United States - motivation enough for the two oil-producing nations to force down prices. ..."
"... Oil production is not declining fast enough in the United States and other countries, though that could begin to change this year. ..."
"... The consulting firm IHS recently studied 66 companies and found that in the first quarter of the year alone they had to write down nearly $29 billion in the value of their assets, easily exceeding the total for the full year of 2014. The sale of cheapened assets from one company to another has already begun here in the Eagle Ford, and more consolidation is expected. ..."
"... Swift Worldwide Resources, an oil industry recruiter based in Houston, estimates that worldwide oil field layoffs have reached more than 176,000. ..."
"... There are huge benefits to the country as a whole in keeping that oil in the ground. The most immediate and obvious benefit is that in an energy crisis, oil in domestic ground is better than money in a domestic bank -- oil supply and jobs when someone elsewhere tries to squeeze the U.S. by cutting off supplies. ..."
"... Fracking has too many unpredictable environmental downsides. Supporting world markets that transfer billions of dollars for oil to Wahhabist Saudi Arabia ( perhaps Iran later, etc..) is not the solution either. ..."
"... When you gamble you can lose. No sympathy for the oil companies who have been making record profits. Our government needs to figure out how to get us back to a country that makes things. ..."
"... My home town of Williamsport, PA experienced the same boom and bust. Energy related jobs provided better than decent living wages foreseen to exist into future lifetimes. ..."
"... Companies leave town when price isn't right, but the communities will be dealing with the environmental consequences for decades to come. ..."
"... As you can see, I live in Dallas. And looking around its downtown/uptown area, what you see is an incredible boom built in big part on business tangentially tied to oil, and tangentially may be an overstatement. ..."
In the United States, Alaska, North Dakota, Texas, Oklahoma and Louisiana are facing
economic challenges.
Chevron,
Royal Dutch Shell and
BP have all announced cuts to their payrolls to save cash, and they are in far better shape
than many smaller independent oil and gas producers that are slashing dividends and selling
assets as they report net losses. Other companies have slashed their dividends.
About
40 companies in North America have gone into bankruptcy protection.
... ... ...
There are a number of conspiracy theories floating around. Even some oil executives are
quietly noting that the Saudis want to hurt Russia and Iran, and so does the United States -
motivation enough for the two oil-producing nations to force down prices. Dropping oil
prices in the 1980s did help bring down the Soviet Union, after all.
But there is no evidence to support the conspiracy theories, and Saudi Arabia and the United
States rarely coordinate smoothly.
... ... ...
Oil production is not declining fast enough in the United States and other countries, though
that could begin to change this year.
Demand for fuels is recovering in some countries, and that could help crude prices recover in
the next year or two. There is now little or no spare production capacity to give the market a
cushion in case of another crisis in a crucial oil-producing country.
... ... ....
The consulting firm IHS recently studied 66 companies and found that in the first quarter
of the year alone they had to write down nearly $29 billion in the value of their assets, easily
exceeding the total for the full year of 2014. The sale of cheapened assets from one company to
another has already begun here in the Eagle Ford, and more consolidation is expected.
Swift Worldwide Resources, an oil industry recruiter based in Houston, estimates that
worldwide oil field layoffs have reached more than 176,000.
Linda is a trusted commenter Oklahoma August 14, 2015
In the forty years I've lived in Oklahoma, I've seen the oil boom and bust over and over.
And they never learn. When the boom happened in the 80s, small county hospitals had to build
new wings because the oil fields are dangerous. Workers went out and bought Harleys and
expensive pickup trucks. And then it all crashed.
Hospitals closed wings after spending millions to build them, trucks and motorcycles were
repossessed. I guess we needed the hospitals--you can't let oil field workers die from lack of
care--but really, it was like nobody planned ahead.
So few saved their money for hard times ahead. And I saw it happen again with fracking.
There must be 20 RV parks between were I live and the town where I shop. Everybody rushed to
put in the plumbing and electricity for RV parks.
And now they sit totally empty. There's no tourism here so summer campers won't fill them.
Just another case of people thinking the boom would last forever. The fracking crews are long
gone (they didn't hire locals, just brought in crews) but the damage to the earth stays
behind.
OldGuyWhoKnowsStuff Hogwarts August 14, 2015
The only real threat, which the news story accurately depicts, is to the easy money.
There are huge benefits to the country as a whole in keeping that oil in the ground. The most
immediate and obvious benefit is that in an energy crisis, oil in domestic ground is better
than money in a domestic bank -- oil supply and jobs when someone elsewhere tries to squeeze
the U.S. by cutting off supplies.
The longer-term and bigger benefit is that maybe we'll get around to not needing it, or at
least that Texas oil will displace some of the more environmentally unsound Canadian tar sands
oil.
Also, the U.S., and especially the Texas plains, have a far greater abundance of affordable
energy right now in all that sunlight.
Collin DC August 14, 2015
My home town of Williamsport, PA experienced the same boom and bust. Energy related jobs
provided better than decent living wages foreseen to exist into future lifetimes. These
careers were available to able bodied workers with less than a high school or college
education.
Companies leave town when price isn't right, but the communities will be dealing with the
environmental consequences for decades to come.
TheUnsaid The Internet August 14, 2015
A major national government effort to wean ourselves off of fossil fuel (at least for
transportation) is long past due.
Fracking has too many unpredictable environmental downsides. Supporting world markets that
transfer billions of dollars for oil to Wahhabist Saudi Arabia (& perhaps Iran later, etc..)
is not the solution either.
The "Market" will not and cannot auto-magically solve long term strategic/environmental
problems.
The "Market" did not win WW2; it did not win the Space Race; it did not build the Panama
Canal.
bb berkeley August 14, 2015
When you gamble you can lose. No sympathy for the oil companies who have been making
record profits. Our government needs to figure out how to get us back to a country that makes
things. NAFTA and the new Pacific Pack has sent our jobs out of the country. Any
politician, regardless of party, who supported these so called treaties should not be re
elected.
Collin DC August 14, 2015
My home town of Williamsport, PA experienced the same boom and bust. Energy related
jobs provided better than decent living wages foreseen to exist into future lifetimes.
These careers were available to able bodied workers with less than a high school or college
education.
Companies leave town when price isn't right, but the communities will be dealing with the
environmental consequences for decades to come.
schbrg dallas, texas August 14, 2015
As you can see, I live in Dallas. And looking around its downtown/uptown area, what you
see is an incredible boom built in big part on business tangentially tied to oil, and
"tangentially" may be an overstatement.
Commerce and industry mix in Texas has changed significantly in the last few decades, with
significant numbers of its population not tied to the oil industry. Houston will be hurting
more than Dallas.
But the ones hurt the most are the individual workers, many of whom would have minimum wage
jobs, if even that.
... Norway has declared that its oil industry has entered a "crisis."
"[The] industry is in a crisis now, we can't deny that," Bente Nyland,
director general of the Norwegian Petroleum Directorate,
told Bloomberg who reminds us that "Norway depends on oil and gas for about one-fifth of its
economic output and nationwide, the petroleum industry has cut almost 30,000 jobs."
"... Looking at these numbers it becomes obvious that the EIA is just making a wild guess at future
oil production for everyone in the world except the USA. And their guess for the USA is only a slightly
better educated guess than elsewhere. ..."
"... If your job is to project that demand is going to continue growing and supply is going to continue
meeting demand, then the call on OPEC is the reasonable way to proceed. After all OPEC are the ones
doing their best to increase their production, growing or keeping their number of rigs and with Iran
ready to start selling this month all the oil it has in tankers and increasing production. ..."
"... Compared to OPEC all the rest look bleak. Nobody seems to be able to increase production significantly.
..."
"... The real issue is that EIA is probably being too optimistic in judging OPEC increase and underestimating
some of the rest of producers decline. ..."
"... In short I agree, wild guesses outside the US, but made so the overall World total fits their
demand and price forecasts. ..."
Shale Oil has become a complete farces as the price moves into below $30 range. EIA is complicit
in creating this boom and bust cycle.
And last but not least we have Russia. The EIA has Russian total liquids dropping by 100,000 bpd
in 2016 and another 110,000 bpd in 2017.
Looking at these numbers it becomes obvious that the EIA is just making a wild guess at future
oil production for everyone in the world except the USA. And their guess for the USA is only a slightly
better educated guess than elsewhere.
"Looking at these numbers it becomes obvious that the EIA is just making a wild guess at
future oil production for everyone in the world except the USA. And their guess for the USA
is only a slightly better educated guess than elsewhere."
If your job is to project that demand is going to continue growing and supply is going to
continue meeting demand, then the "call on OPEC" is the reasonable way to proceed. After all OPEC
are the ones doing their best to increase their production, growing or keeping their number of
rigs and with Iran ready to start selling this month all the oil it has in tankers and increasing
production.
Compared to OPEC all the rest look bleak. Nobody seems to be able to increase production
significantly.
The real issue is that EIA is probably being too optimistic in judging OPEC increase and
underestimating some of the rest of producers decline.
The decisive factor on oil price is the economy, whether it starts recovering from current
weakness as some factors indicate or it goes down in recession as others suggest.
"If your job is to project that demand is going to continue growing and supply is going
to continue meeting demand, then the "call on OPEC" is the reasonable way to proceed."
For once, I think this is fair enough. Iran is being allowed back into the market and has the
capacity to increase production. It is conceivable that Iraq will succeed in reconstructing enough
of its oil industry to increase production as well. These will be sufficient to overcome depletion
from existing fields – and then some.
What we need to realize is that "above ground issues" have been putting limits on production
in several countries. The potential resolution of these issues does not invalidate the Peak Oil
thesis.
What I'm hanging out for is to see Ghawar fail. When that happens, everyone in the market will
start treating Peak Oil as a fact.
Ron , "Looking at these numbers it becomes obvious that the EIA is just making a wild guess at
future oil production for everyone in the world except the USA."
I wonder if the EIA has a database of global oil and gas fields and new projects, and if their
forecasts are based on a bottom up analysis of all those fields and projects.
Something tells me that no. So probably their forecasts for most countries outside the U.S.
are indeed just wild guesses.
Yes wild guesses with a nice measure of wishful thinking ;-)
I think they forecast demand and then make up supply numbers that make their price forecasts
look reasonable. They have an economic model which cranks out a GDP estimate and a model that
correlates energy demand with GDP to give them energy demand. The price forecast is based on the
futures market. If the futures market says prices are low, then there must be too much supply
relative to demand so they just make up supply numbers for every country except the US that creates
too much supply.
I agree with Ron that their US estimates are somewhat better (though still on the optimistic
side in my opinion.)
In short I agree, wild guesses outside the US, but made so the overall World total fits
their demand and price forecasts.
"... At a packed town hall meeting yesterday, it was VERY clear. The public wants all of the disposal
wells shut down immediately. Lawsuits are being filed as fast as the attorneys are able to file them.
If an oil executive had been there, it would have been like the old western movies with the mob scene:
"let's hang-em!" ..."
I believe that Shallow Sand referred to this a few weeks ago. Maybe everyone does not know, but
Oklahoma has gone from one of the least earthquake prone areas in the country, to the MOST earthquake
prone area in the entire world in the last 5 years. Earthquakes are now significantly impacting
populated, wealthy, heavily Republican suburbs just north of OKC. Since the first barrel of oil
came out of Oklahoma over 100 years ago, salt water has also come up that has to be disposed of.
It is now coming up at more than 10 bbl of salt water for every bbl of water. This is being reinjected
back into the ground in disposal wells. Fracking has brought more production and more salt water.
Billions of gallons are being reinjected each year. The salt water disposal wells [but, not fracking]
have been linked to the earthquakes by the USGS.
At a packed town hall meeting yesterday,
it was VERY clear. The public wants all of the disposal wells shut down immediately. Lawsuits
are being filed as fast as the attorneys are able to file them. If an oil executive had been there,
it would have been like the old western movies with the mob scene: "let's hang-em!"
Of course, the problem is that our salt water is like brine – 10 times as much salt as sea
water. Not easy to figure out what else to do with it. The largest element of Oklahoma's economy
is the oil and gas industry.
Oklahoma is the only state in the nation where in both 2008 and 2012, not a single county voted
for Obama. But, they are ready to change if the the earthquakes do not stop. The legislative representatives
promised early action to pass a law, in the first week of the session that starts February 1,
if possible, to give the state Corporation Commission the power to shut them all down, at least
for a short period of time to monitor for changes in the earthquakes.
So, back to Shallow Sand and operating expenses. It would be reasonable at this point to
expect an immediate adverse effect on oil production in most of the state. At a minimum, even
with just tinkering, it is going to become MUCH more expensive to dispose of the salt water. This
is going to push a lot of people over the edge – possibly including Sandridge which has been delisted
and is trading pink sheets at $.06/share.
"... This is three or four months ahead of what the market was thinking last
year, so it just adds fuel to the fire, ..."
"... "Lower oil prices have been a sentiment leader for the recent market selloff
and will again be in focus with Iranian sanctions expected to be lifted next week,"
..."
"... "How fast Iran can put oil back on the market will now be a key issue for
oil markets, with many skeptical that it will be able to do this nearly as fast
as it has forecast," ..."
"... It is the wrong time for Iran to be returning to the oil market, both for
the market and (probably) also for Iran. It would have been so much more ideal for
Iran to return to the oil scene if prices were soaring at $100, ..."
The Brent and WTI crude benchmarks slid below $30 per barrel on Friday, as investors
worry about Iran's earlier than expected return to the oil market. International
sanctions on Tehran may be lifted Monday, allowing the fifth-biggest member
of OPEC to boost oil exports. "This is three or four months ahead of what
the market was thinking last year, so it just adds fuel to the fire," Mitsubishi
Corp oil risk manager Tony Nunan
told Reuters.
"Lower oil prices have been a sentiment leader for the
recent market selloff and will again be in focus with Iranian sanctions expected
to be lifted next week," Ric Spooner, a chief analyst at CMC Markets, said
in a note on Friday, quoted by
Bloomberg.
"How fast Iran can put oil back on the market will now be a key issue
for oil markets, with many skeptical that it will be able to do this nearly
as fast as it has forecast," he added.
Iranian and US officials have confirmed that the central vessel of Iran's
Arak heavy water reactor has been filled with concrete following the removal
of its core, bringing Iran closer to meeting the requirements for having international
sanctions lifted.
Iranian oil would add to the glut that has made prices collapse since the
middle of 2014.
"It is the wrong time for Iran to be returning to the oil market, both
for the market and (probably) also for Iran. It would have been so much more
ideal for Iran to return to the oil scene if prices were soaring at $100,"
Phillip Futures said in a note, quoted by
Reuters.
"... Iran has resisted calls from rival Saudi Arabia to hold back on production
in the face of faltering global energy demand. The rift between the two Middle East
powers has paralysed Opec - the world's oil cartel - which has abandoned formal
production targets for the first time in its history. ..."
"... Falling oil prices are expected to push down global inflation by 1pc in
2016 according to estimates from J.P. Morgan. ..."
Iran has resisted calls from rival Saudi Arabia to hold back on production
in the face of faltering global energy demand. The rift between the two Middle
East powers has paralysed Opec - the world's oil cartel - which has abandoned
formal production targets for the first time in its history.
European Union and US authorities are expected to formally lift a decade
of sanctions - which include embargoes on Iranian oil in Europe - this weekend.
... ... ...
Falling oil prices are expected to push down global inflation by 1pc
in 2016 according to estimates from J.P. Morgan.
"... This oil decline is a genius move by the US foreign policy. ..."
"... That being said, this part of the strategy engineered to hurt Russia can only last another six months or so. Stripper wells shutting down in mass would be a permanent loss of production and cannot be be allowed. Its better to keep the Fracking oil in the ground now where it can act as a second "strategic petroleum reserve" to keep OPEC from getting too greedy. ..."
"... The Saudis really screwed up. Had they let oil stay over 100 the Emperor would have been truly naked in a few years. This way the threat of a renewed fracking push keeps things tame for a while. ..."
This oil decline is a genius move by the US foreign policy. Had oil stayed over 100 the Fracking
fools would have pumped the things dry and the Baaken and Eagle Ford would be looking like the
Barnett in a few years.
That being said, this part of the strategy engineered to hurt Russia can
only last another six months or so. Stripper wells shutting down in mass would be a permanent
loss of production and cannot be be allowed. Its better to keep the Fracking oil in the ground
now where it can act as a second "strategic petroleum reserve" to keep OPEC from getting too greedy.
The Saudis really screwed up. Had they let oil stay over 100 the Emperor would have been truly
naked in a few years. This way the threat of a renewed fracking push keeps things tame for a while.
"... RBC on Wednesday joined the herd of Wall Street analysts to cut their price targets, trimming the 2015 view to $40 from $52: ..."
"... "There is no change in our view that global oil market conditions will demonstrate fundamental improvement over the course of 2016 amid respectable demand growth and non-OPEC production declines. In fact, the latest oil price convulsion will place even greater pressure on producers to hunker down from a capital-spending standpoint, which should serve to rein in shorter cycle-time oil production. ..."
"... Simply put, despite the oil market's latest pullback, we continue to expect that the global oil market will regain an improved balance during the second-half of 2016, which should fuel a price recovery." ..."
Greg Pardy, co-head of global energy research at RBC Dominion, says on Wednesday
that the fundamental picture will improve. He sees oil prices trading in an "extremely wide band"
through 2016, with a cap of about $50-$55 a barrel. RBC on Wednesday
joined the
herd of Wall Street analysts to cut their price targets, trimming the 2015 view to $40 from $52:
"There is no change in our view that global oil market conditions will demonstrate fundamental
improvement over the course of 2016 amid respectable demand growth and non-OPEC production declines.
In fact, the latest oil price convulsion will place even greater pressure on producers to hunker
down from a capital-spending standpoint, which should serve to rein in shorter cycle-time oil
production.
Simply put, despite the oil market's latest pullback, we continue to expect that the global
oil market will regain an improved balance during the second-half of 2016, which should fuel a
price recovery."
"... The futures curve is sharply upward-sloping, which is atypical, in a pattern called contango. But the difference between March 2015 and 2016 futures is only about $8.20. ..."
"... While onshore storage allows traders to lock in much of the difference, giving them an incentive to stockpile crude, only rare instances called supercontango signal a situation when there is nowhere to put another drop of oil. That coincides with price collapses. ..."
"... Not only was that a very profitable time to own oil outright-prices would bounce by 150% within a year-but it was a golden opportunity to store physical crude. Even the most expensive forms of storage would have produced an instant profit for a trader who immediately sold the March 2010 future. ..."
The futures curve is sharply upward-sloping, which is atypical, in a pattern called
contango. But the difference between March 2015 and 2016 futures is only about $8.20.
That is far too little to cover the cost of leasing a modern VLCC (very large crude carrier.)
While onshore storage allows traders to lock in much of the difference, giving them an incentive
to stockpile crude, only rare instances called supercontango signal a situation when there is
nowhere to put another drop of oil. That coincides with price collapses.
CME Group points out, for example, that the price of the March 2009 crude contract for West
Texas Intermediate crude, the U.S. benchmark, hit $33.98 a barrel in early February of that year.
Meanwhile, the March 2010 contract fetched $55.95.
Cash prices had collapsed by almost 80% in eight months. Not only was that a very profitable
time to own oil outright-prices would bounce by 150% within a year-but it was a golden
opportunity to store physical crude. Even the most expensive forms of storage would have produced
an instant profit for a trader who immediately sold the March 2010 future.
There is a big difference between oil prices at a 13-year low and pricing in the end of the
world.
"... In the wake of the collapse in oil prices over the past year, BHP has sharply cut its operating costs and capital spending at its U.S. onshore operations, reducing the number of rigs from 26 to five. ..."
"... previous management significantly overpaid for these assets ..."
In the wake of the collapse in oil prices over the past year, BHP has sharply cut its
operating costs and capital spending at its U.S. onshore operations, reducing the number of rigs
from 26 to five.
... ... ...
BHP previously booked impairments on its U.S. onshore assets of $2.8 billion in 2012 and a
further $2.8 billion in 2015, due to sliding gas prices and the lower-than-expected quality of
one of the fields it acquired.
"For some time, the market has been of the view that previous management significantly
overpaid for these assets," Lyons said.
BHP's shares, which sank to a 10-1/2 year low this week, jumped 5 percent on Friday, in line
with other miners in what is seen as an oversold market.
"... Iran is on track to ship 1.10 million barrels a day in January, a 20 per-cent
rise on December, according to Reuters reports. ..."
"... When completion of the deal is announced, the oil markets could see an
immediate knee-jerk reaction to the downside said Societe Generale in a note on
Wednesday. ..."
"... However Jason Gammel, equities analyst at Jefferies told CNBC that a meaningful
further drop is unlikely, even allowing for the added Iranian supply. ..."
"... We are starting to reach the stage where we start to cause interruptions
to the physical supply of oil, so I do think the price needs to come up from where
it is, said Gammel on Thursday. ..."
Iran is on track to ship 1.10 million barrels a day in January, a 20
per-cent rise on December, according to Reuters reports.
"When completion of the deal is announced, the oil markets could see
an immediate knee-jerk reaction to the downside" said Societe Generale in a
note on Wednesday.
The Tehran government said Wednesday that the International Atomic Energy Agency
(IAEA) was set to confirm the country has met its obligations to ensure a lifting
of sanctions by Friday.
"The IAEA will issue its final report on Friday to confirm Iran has met its
commitments under the JCPOA (Joint Comprehensive Plan of Action)," Deputy Foreign
Minister Abbas Araqchi said Wednesday according to a number of media reports.
... ... ...
Iran has the fourth-largest oil reserves in the world and the International
Energy Agency believes it could add as much as half a million barrels per day
to exports as soon as sanctions are lifted.
In an already oversupplied market this could help push down an already plummeting
oil price.
... ... ...
However Jason Gammel, equities analyst at Jefferies told CNBC that a meaningful
further drop is unlikely, even allowing for the added Iranian supply.
"We are starting to reach the stage where we start to cause interruptions
to the physical supply of oil, so I do think the price needs to come up from
where it is," said Gammel on Thursday.
[Jan 15, 2016] MSM drum the Iran oil flood but maybe Iran has no spare capacity
at the momen
International sanctions on Iran may be lifted Monday, allowing
for a boost in oil shipments from the fifth-biggest member of the Organization
of Petroleum Exporting Countries. Iran is trying to regain lost market
share and doesn't intend to pressure prices with an export increase
once sanctions are removed, officials from its petroleum ministry and
national oil company said this month.
Or maybe Iran has no spare capacity at the moment.
"... Russian companies plan to pump for export via the Transneft system 6.4%f (of 215.8
million tones total) tons less oil than the last year. ..."
"... According to the Director of the Small Letters research company Vitaly Kryukov, the possible reduction of oil exports indicates that companies will reduce production. Senior analyst of Aton Alexander Kornilov agreed that at current low oil prices, record oil production achieved in 2015 will not happen again in the near future . ..."
"... A strong decline is observed in West Siberia (the main oil producing region of Russia), said Vitaly Kryukov. The main oil producing asset of Rosneft, Yuganskneftegaz, has reduced production by 3.3% to 62.4 million tons, LUKOIL - Western Siberia - by 6,1 % to 41 million tones. ..."
Russian companies plan to pump for export via the Transneft system 6.4%f (of 215.8
million tones total) tons less oil than the last year.
The companies plans to reduce exports in 2016 surprised experts. Director, Moscow oil
& gas center EY Denis Borisov said that there are no obvious prerequisites for a drop in production
of black gold in Russia yet. "It's hard to say what caused such a drop in export", - quote "Vedomosti"
the words of Borisov.
Deputy energy Minister Kirill Molodtsov noted that these figures are based on preliminary applications,
which are compiled according to conservative projections and may change during thef the year.
The low
preliminary requests by companies might be explained by the principle "pump or pay": if the declared
volume of oil is not pumped, they will have to pay a fine.
According to the Director of the "Small Letters" research company Vitaly Kryukov, the possible reduction of oil
exports indicates that companies will reduce production. Senior analyst of "Aton" Alexander Kornilov
agreed that at current low oil prices, record oil production achieved in 2015 will not
happen again in the near future .
A strong decline is observed in West Siberia (the main oil producing region of Russia), said Vitaly Kryukov.
The
main oil producing asset of Rosneft, Yuganskneftegaz, has reduced production by 3.3% to 62.4 million
tons, "LUKOIL - Western Siberia" - by 6,1 % to 41 million tones.
"... Experts say the fall in Russian exports could nonetheless indicate a fall in production. "With current low oil prices, 2015's record high oil production will not be continued in the near future," said analyst Aleksandr Kornilov. ..."
"... Russia's willingness to cut oil production could also be a signal to Saudi Arabia. Moscow could be testing to see if OPEC can agree to do the same in order to stabilize sliding crude prices. At this point, Riyadh has been unwilling to cut output despite pleas from other OPEC members. ..."
"... Any thoughts on how long Gulf OPEC members will hold out? ..."
"... Our companies say now that production volume in 2016 will be kept at last-year level, ..."
"... I think we're in a situation where at some point we're going to see prices rising and production continuing to fall, which will push prices even higher as talk of a future shortage starts up. ..."
"... China was up 10% yr over yr for December and India fuel consumption rose 8.3% yr over yr. ..."
"... when oil again spikes due to low investment, OPEC and Russian economies will rebound greatly. ..."
"... Too bad there is so much volatility in all markets. ..."
State-owned oil transportation monopoly Transneft says Russian oil companies have applied
for 215 million tons of crude exports in 2016. This is 6.4 percent less than last year, business
daily Vedomosti reports.
In 2015, the situation was the opposite for Transneft, which accounts for almost 90 percent of
Russian oil shipments. The company transported seven percent more oil than in 2014.
"It's hard to say what caused the drop in export applications. There is no evident reason for
oil production to fall in Russia," EY's (Ernst & Young) Moscow oil and gas director Denis Borisov
told Vedomosti….
Experts say the fall in Russian exports could nonetheless indicate a fall in production.
"With current low oil prices, 2015's record high oil production will not be continued in the near
future," said analyst Aleksandr Kornilov.
The fight for Europe could intensify even more, once sanctions against Iran are lifted and
the country resumes oil exports. Europe is a key market for Tehran, and if it cuts prices Russian
companies could lose more market share.
Russia's willingness to cut oil production could also be a signal to Saudi Arabia. Moscow
could be testing to see if OPEC can agree to do the same in order to stabilize sliding crude prices.
At this point, Riyadh has been unwilling to cut output despite pleas from other OPEC members.
I am not predicting anything. But I when Russian officials say something to the effect:
No we will not increase production in 2016 but intend to keep product at the same level as 2105….,
I believe that says enough right there.
Russia plans to repeat last year's oil production record in 2016
- minister
MOSCOW, January 14. /TASS/. Russian oil producers plan to repeat the last-year production
record in 2016, Energy Minister Alexander Novak said on Thursday on the sidelines of 2016
Gaidar Forum. "Our companies say now that production volume in 2016 will be kept at
last-year level," the minister said. Russian oil companies produced record-breaking
534 mln tonnes of oil in 2015, up 1.4% year-on-year, according to data of the Central Dispatching
Department of Fuel and Energy Complex.
Based on daily production numbers for the first half of January from CDU TEK, it seems
that this month will see another post-Soviet record oil production in Russia.
The article is misleading. Given the current tensions between Iran and Saudi Arabia the
likelyhood of any OPEC agreement on output cuts is very low. How can Russia discuss output
cuts with OPEC, if there is no accord within this organization.
I have no idea really but my theory is Saudi wanted to see U.S. production and investment
come down enough, which it certainly has, and cuts were put on hold the last meeting to
get Russia onboard. I remembered you saying a few months back that every time in the past
OPEC had always cut xx amount of time into a crash. I think it makes sense, Brents currently
at 28.58; the OPEC basket is at $25. A 1 mmbpd cut would probably get us to 45, maybe 50.
At $50 I don't see shale ramping up enough to increase production.
I think we're in a situation where at some point we're going to see prices rising and production
continuing to fall, which will push prices even higher as talk of a future shortage starts
up. That's assuming demand doesn't fall, but thus far China and India consumption have been
increasing significantly. China was up 10% yr over yr for December and India fuel consumption
rose 8.3% yr over yr.
shallow sand, 01/14/2016 at 11:10 pm
AlexS,
I have been surprised by the lack of US demand growth, given I have seen gasoline for sale
as low as $1.49 US. Maybe that will change when spring hits.
As I have said many times, we are part of a very small minority in the US that want higher
oil prices. My view is the oil war between OPEC, Russia and shale hurts all and helps
none. But, of those three I suppose OPEC is damaged most, followed by Russia and then US. US
economy is going to take a hit, but likely least of the three.
However, when oil again spikes due to low investment, OPEC and Russian economies will
rebound greatly.
Too bad there is so much volatility in all markets. But also too bad there is so
much hostility between governments.
"... "In permitting low oil prices, the Saudis seek to bring the market back into equilibrium. At present, our calculation of break-even system-wide is in the $85–$100 a barrel range on a Brent basis." ..."
"... "But perhaps not by the Saudis. Russia's position is comparable to Saudi Arabia's. Either could cut production by meaningful quantity, but the Russians need the incremental revenue more. Saudi Arabia would be right to argue that any calls for production cuts should be directed to Moscow. OPEC could cut production to prop up prices and increase revenues. But for now, a better strategy (for Saudi Arabia) would be to hang back, deflect criticism, and let events play out. If the Russians are thinking clearly, Moscow will cut first." ..."
Blast form the past. Please note that this is article
for December 2014 not December 2015
30 December 2014 19:20 |
http://oilprice.com/Energy/Crude-Oil/Energy-Crisis-As-Early-As-2016.html
Low oil prices today may be setting the world up for an oil shortage
as early as 2016. Today we have just 2% more crude oil supply than
demand and the price of gasoline is under $2.00/gallon in Texas. If
oil supply falls too far, we could see gasoline prices doubling within
18 months. For a commodity as critical to our standard of living as
oil is, it only takes a small shortage to drive up the price.
On
Thanksgiving Day, 2014 Saudi Arabia decided to maintain their crude
oil output of approximately 9.5 million barrels per day. They've taken
this action despite the fact that they know the world's oil markets
are currently over-supplied by an estimated 1.5 million barrels per
day and the severe financial pain it is causing many of the other OPEC
nations. By now you are all aware this has caused a sharp drop in
global crude oil prices and has a dark cloud hanging over the energy
sector. I believe this will be a short-lived dip in the long history
of crude oil price cycles. Oil prices have always bounced back and
this is not going to be an exception.
To put this in prospective, the world currently consumes about 93.5
million barrels per day of liquid fuels, not all of which are made
from crude oil. About 17% of the world's total fuel supply comes from
natural gas liquids ("NGLs") and biofuels.
One thing that drives the Bears opinion that oil prices will go
lower during the first half of 2015 is that demand does decline during
the first half of each year. Since most humans live in the northern
hemisphere, weather does have an impact on demand. I agree that this
fact will play a part in keeping oil prices depressed for the next few
months. However, low gasoline prices in the U.S. are certain to play a
part in the fuel demand outlook for this year's vacation driving
season.
Brent oil prices are now hovering around $60 a barrel. In my
opinion, this is quite a bit lower than Saudi Arabia thought the price
would go and may lead to an "Emergency" OPEC meeting during the first
quarter. But for now, I am assuming that Saudi Arabia is willing to
let the other OPEC members suffer until the next scheduled OPEC
meeting in June.
The commonly held belief is that Saudi Arabia is doing this to put
a stop to the rapid growth of production from the U.S. shale oil
plays. Others believe it is their goal to crush the Russian and
Iranian economies. If the oil price remains at the current level for a
few months longer it will do all of the above.
My forecast models for 2015 assume that crude oil prices will
remain depressed during the first quarter, then slowly ramp up and
accelerate as next winter approaches. I believe that by December we
will see a much tighter oil market and significantly higher prices. In
a December 24, 2014 article in The National, Steven Kopits managing
director of Princeton Energy Advisors states that, "In permitting
low oil prices, the Saudis seek to bring the market back into
equilibrium. At present, our calculation of break-even system-wide is
in the $85–$100 a barrel range on a Brent basis."
Mark Mobius, an economist and regular guest on Bloomberg TV
recently said he sees Brent rebounding to $90/bbl by the end of 2015.
Since 2005, only North America has been able to add meaningful
crude oil supply. Outside of Canada and the United States (including
the Gulf of Mexico), the rest of the world's crude oil production
netted to a decline of a million barrels per day from December, 2010
to December, 2013. More than half of the OPEC nations are now in
decline. We've been able to supplement our fuel supply during the last
ten years with biofuels, but that is limited since we need the
farmland for food supply.
I believe the current low crude oil price could be overkill and
result in the next "Energy Crisis" by early 2016. Enjoy these low
gasoline prices while they last.
The upstream U.S. oil companies we follow closely are all
announcing 20% to 50% cuts in capital spending for 2015. We will start
seeing the impact on supply at the same time the annual increase in
demand kicks in. Our model portfolio companies are all expected to
report year-over-year increases in production, but at a much slower
pace than the last few years.
A study released by Credit Suisse two weeks ago shows that U.S.
independents expect capital-expenditure (Capex) cuts of one-third
against production gains of 10 per cent next year. This would imply
production growth of 600,000 bpd of shale liquids, and perhaps another
200,000 bpd from Gulf of Mexico deepwater projects. At the same time,
U.S. conventional onshore production continues to fall. I have seen
estimates of 500,000 to 700,000 bpd declines within twelve months. If
these forecasts are accurate, U.S. oil production growth would be
barely positive next year and headed for a material downturn in 2016.
North American unconventionals (oil sands, shale and other tight
formations) have been almost all of net global supply growth since
2005. If unconventional growth grinds to zero and conventional growth
is falling outright, the supply side heading into 2016 looks highly
compromised. At today's oil price, only the "Sweet Spots" in the North
American Shale Plays and the Canadian Oil Sands generate decent
financial returns to justify the massive capital requirements needed
to continue development. Global deepwater exploration is rapidly
coming to a halt.
Were demand growth muted, this might not matter. Demand for liquid
fuels goes up year-after-year. It even increased in 2008 during the
"Great Recession" and ramped up sharply during 2009 and 2010 despite a
sluggish global economy. Low fuel prices are increasing demand today
and my guess is that, with U.S. GDP growth now forecast at 5% in 2015,
we could see demand for fuels increase by close to 1.5 million barrels
per day this year. The current IEA forecast is for oil demand to
increase by 900,000 bpd in 2015.
If this plays out, the oil markets will be heading into a
significant squeeze in the first half of 2016.
The last extended period of low oil prices was 1985 to 1990. In
1985, when oil prices collapsed similar to what's happening now, the
world had 13 million bpd of spare capacity, with 7 million bpd in
Saudi Arabia alone. OPEC was well-positioned to comfortably meet any
increase in demand.
Today, just about all of the world's discretionary spare capacity
resides in Saudi Arabia and amounts to an estimate 2 million bpd. Lou
Powers, an EPG member and author of "The
World Energy Dilemma," has said that Saudi Arabia will have
difficulty maintaining production at over 10 million bpd for an
extended period. If we do swing to a supply shortage, Saudi Arabia may
find itself in the position of needing to run the taps full out for
much of 2016. In such an event, the world will be headed right back
into an oil shock and we will see much higher oil prices than
$100/bbl.
Low oil prices will hurt the unhedged upstream companies, but they
will hurt the oilfield services sector the most. I'm expecting the
onshore active rig count to drop by 30% by mid-2015. Oil price will
need to firm up for several months before the upstream companies
commit to higher spending levels. That said, the high quality drillers
like Helmerich & Payne (HP), Patterson-UTI Energy (PTEN) and
Precision Drilling Corp. (PDS) will be fine since a lot of
their high end rigs will keep working on long-term contracts. By 2016,
they will have gained market share.
Remember, North America and deepwater are the only places with
meaningful production upside. If crude oil prices move below $60/bbl
and stay there for even six months it could prove catastrophic to
non-OPEC supply. At some point, OPEC action may become necessary.
"But perhaps not by the Saudis. Russia's position is comparable
to Saudi Arabia's. Either could cut production by meaningful quantity,
but the Russians need the incremental revenue more. Saudi Arabia would
be right to argue that any calls for production cuts should be
directed to Moscow. OPEC could cut production to prop up prices and
increase revenues. But for now, a better strategy (for Saudi Arabia)
would be to hang back, deflect criticism, and let events play out. If
the Russians are thinking clearly, Moscow will cut first." -
Steven Kopits the managing director of Princeton Energy Advisors.
On Wednesday,
we documented the astonishing prices beleaguered Canadians are now forced to pay for groceries
thanks to the plunging loonie.
Oil's inexorable decline has the Canadian dollar in a veritable tailspin and because
Canada imports the vast majority of its fresh food, prices on everything from cucumbers to cauliflower
are on the rise, tightening the screws an already weary shoppers.
... ... ...
"This low price environment continues to discourage new investment and spending and
has weighed down employment - not only in the oilpatch, but throughout most sectors of the province,"
Hirsch continues. "This downturn is longer in duration certainly than 2009 was which was a very quick
downturn but very short-lived. This one is going to linger on longer."
Indeed. Here are some charts from the report which underscore the magnitude of the sharp reversal
in fortunes.
"... You see a big destruction in the income of the oil and commodity producers, Turner said. Saudi prices would be less than $17 a barrel when converted into dollar levels for 1998, the year oil sank to its lowest since the 1980s. ..."
"... When the price of crude is less than the price of a new clean barrel, U R FKD. ..."
"... Peak was still about 2005... This is gonna be quite a ride! Course, who doesnt love like, 1965 valuations for gas....tho I guess I still better keep Sallys flat feet on the ground.... ..."
West Texas Intermediate futures, the U.S. benchmark, sank below $30 a barrel on Tuesday for
the first time since 2003. Actual barrels of Saudi Arabian crude shipped to Asia are even cheaper,
at $26 -- the lowest since early 2002 once inflation is factored in and near levels seen before
the turn of the millennium.
"You see a big destruction in the income of the oil and commodity producers," Turner said.
Saudi prices would be less than $17 a barrel when converted into dollar levels for 1998, the
year oil sank to its lowest since the 1980s.
The answer to your question is addressed within the first 4 minutes of the excellent interview
below via SGTReport.com
They state that they used John Williams (
shadowstats.com ) properly adjusted
(non-gov-scum manipulated) calculations. Listen to this interview w/ Steve St. Angelo (
SRSRoccoReport.com ):
Peak was still about 2005... This is gonna be quite a ride! 'Course, who doesn't love like,
1965 valuations for gas....tho I guess I still better keep Sally's flat feet on the ground....
"... Our mission now questions how much the Saudis can now substantively influence the crude markets over the long term. Clearly they can drive prices up, but we question whether they any longer have the power to drive prices down for a prolonged period. ..."
"... The following year, Mining Weekly ran a story which suggested the overestimation of The Kingdoms reserves might go as high as 70% . They meant all of OPEC, but Saudi reserves would have to be overstated by more than 40% to make that true. Business Insider suggests that it is elementary the Saudis are fibbing about their reserves – but it also says oil may have peaked in 2005 and production might start to fall in the next year or two . That was in 2011. ..."
"... For how long are they going to allow their OPEC allies to continue pumping at maximum capacity into a glutted market? It is an obvious radical departure from the former careful balance of supply and demand, which was supposed to be a clever plan to make Russia collapse. What if it makes America collapse instead? ..."
"... Hundreds of billions of dollars were invested in the oil fracking effort. alternative energy projects and other technologies that banked on high energy costs. The incurred debt would take many years or decades to pay off. However, a relatively short term drop in oil prices can drive the debt holders out of business. Massive loan defaults and hundreds of thousands of good-paying jobs will be lost. The ensuing drag on the economy can exceed the benefits of lower oil prices, at least in the short term. ..."
"... Up and down energy prices are likely more harmful than steady high prices on long term economic development. If oil prices were to remain low for, say, 5 years, then the net economic gain can become significant. Dont bank on that being the case. ..."
"... The American tight oil boom was almost entirely financed by junk bonds and only made financial sense at oil prices a lot higher than they are now. There is going to be a lot of pain as those bonds get defaulted on and the companies that issued them go bankrupt. However, the big question is what kinds and amounts of derivatives were leveraged on those bonds, and who is going to blow up when those bonds blow. ..."
"... Unless the USA withdraws its sponsorship of The Kingdom, and lets Saudi Arabia collapse from its internal problems. God knows America has learned a lot about the regime-change game considering all the practice its gotten. ..."
I can't promise anything like a simple explanation but the most thought provoking take I've seen
is from hedge-fund manager and father of MMT, Warren Mosler. It's summarized quite well here (though
FFS don't surmise from that that Agora is a fount of wisdom. It's not: a pump and dump stock kiting
scheme with kick ass copywriters.) Regardless, I have a lot of time for Mosler. He has very rewarding
unconventional views:
That is a very interesting explanation. But there is a great big hole in it, reasoning-wise,
and that is, why does the USA continue to put up with this? Two of its oil companies are among
the ten most profitable entities in the world, and they can't be happy with the Saudis' largess.
You could see the USA letting it go on for as long as it possibly can, considering it makes the
U.S. dollar stronger for consumers, if and only if the core of very rich and very powerful people
who run the United States were happy with a situation in which corporate profits were halved,
but the people were giddy because their dollar buys more pots and pans and vacations and gasoline
and picnic baskets. Are they happy with that situation, do you think? Are the two biggest energy
companies in the USA – Exxon-Mobil and Chevron – happy with an economy in which the big boys take
home a lot less, but the rubes are in clover? And not even that the rubes make more, because they
don't – it just buys more.
Call me a cynic, but I can't see them being happy with that. In fact, I can't see America's
corporate hurt, after they went to all the trouble of declaring that a corporation is legally
a person and can therefore contribute an unlimited amount to political campaigns, being happy
with a situation in which oil costs around what it did in the 1960's. Especially when that situation
could end at any time, and they do not have any control over when that time is. They were probably
okay with it while they thought it was going to destroy Russia, but it's not – not before the
United States is itself destroyed. And long before either of those countries cries "Uncle!!" there
is going to be a wave of poverty and bankruptcies such as the world has never seen.
We'll see. But back in 2011 there was fear – you'll love this – that Saudi Arabia was not going
to be able to keep a lid on prices at $100.00 a barrel,
according to Wikileaks . They based this on an alleged overestimation of Saudi reserves by
about 40%, that overstating having been introduced deliberately to spur foreign investment. Here's
my favourite quote, I love this one;
"Our mission now questions how much the Saudis can now substantively influence the crude
markets over the long term. Clearly they can drive prices up, but we question whether they
any longer have the power to drive prices down for a prolonged period."
Well, I guess that one was answered, wasn't it?
The following year, Mining Weekly ran a story which suggested the overestimation of The Kingdom's
reserves
might go as high as 70% . They meant all of OPEC, but Saudi reserves would have to be overstated
by more than 40% to make that true. Business Insider
suggests
that it is elementary the Saudis are fibbing about their reserves – but it also says oil may
have peaked in 2005 and 'production might start to fall in the next year or two". That was in
2011.
What's that going to mean to the American economy? Three of the
ten most profitable companies in the world are oil companies, and of them two – Exxon-Mobil
and Chevron – are American. Chevron's profits in 2014 were $33.6 Billion, and even that was a
drop of 40% over fiscal year 2012/13. For how long can the American economy sustain that kind
of hit?
For how long are they going to allow their OPEC allies to continue pumping at maximum
capacity into a glutted market? It is an obvious radical departure from the former careful balance
of supply and demand, which was supposed to be a clever plan to make Russia collapse. What if
it makes America collapse instead? Of the vaunted most profitable companies,
the remaining American star is Appple . Are people going to want an Apple watch or a new Smartphone
if the economy starts to falter?
I would say the low oil price benefits the American economy since it is a net oil importer. Their
economy eats a lot of oil. In fact the USA is still the biggest net importer of oil in the world
even with their "shale revolution".
Yes, that's true on the consumption side, so low prices are a boon to homeowners and consumers
in general. But what is it doing to corporate profits? Exxon and Chevron are used to turning a
profit on oil sales in America, too.
Gasoline is finally starting to fall at the pump, down more than 12 cents over the past couple
of weeks here.
Karl, its not that simple. Hundreds of billions of dollars were invested in the oil fracking effort.
alternative energy projects and other technologies that banked on high energy costs. The incurred
debt would take many years or decades to pay off. However, a relatively short term drop in oil
prices can drive the debt holders out of business. Massive loan defaults and hundreds of thousands
of good-paying jobs will be lost. The ensuing drag on the economy can exceed the benefits of lower
oil prices, at least in the short term.
Up and down energy prices are likely more harmful than
steady high prices on long term economic development. If oil prices were to remain low for, say, 5 years, then the net economic gain can become significant.
Don't bank on that being the case.
The American tight oil boom was almost entirely financed by junk bonds and only made financial
sense at oil prices a lot higher than they are now. There is going to be a lot of pain as those
bonds get defaulted on and the companies that issued them go bankrupt. However, the big question
is what kinds and amounts of derivatives were leveraged on those bonds, and who is going to blow
up when those bonds blow.
My personal take is this is going to be a very, very bad year. There are no bright spots that
I can see anywhere in the world. It is going to get very ugly out there, and the US is no exception.
Unless the USA withdraws its sponsorship of The Kingdom, and lets Saudi Arabia collapse from its
internal problems. God knows America has learned a lot about the regime-change game considering
all the practice it's gotten.
... The argument that the U.S. dollar is a flawed currency is
gaining ground. According to
commodity guru Jim Rogers, this is illustrated by a string of
Quantitative Easings by the U.S. Fed, an ultra-low interest rate
policy and ever-increasing U.S. debt. Demand for the U.S. dollar
has remained high despite this because of the world's reliance on
it to fund crude oil purchases.
But this paints a false picture.
Over the past few years, countries such as China, Russia, Iran,
and Brazile, Russia, India, and China, and South Africa (the BRICS
nations) have begun to pose
a challenge to the current system, forming pacts to transact
oil in local currencies, bypassing the petro-dollar.
So are we witnessing the beginning of the end of the
petro-dollar? Not quite yet.
The U.S. has dealt with all earlier challenges to its
petro-dollar system with a strong hand. A key reason for the wars
in Iraq, Syria, and Libya, was in response to an attempt to find an
alternative to the petrol-dollar. With China and Russia leading the
most recent attack on the U.S. dollar throne, the battlefield is
moving to a new and much broader front.
The U.S. and Russia are already engaged in proxy wars in the
Gulf region, but any escalation or a direct altercation could sow
the seeds of a dreaded WWIII.
... shale regions in the U.S. will drop by 116,000 bopd in February, contributing to a drop of
about 640,000 bopd since the end of last March, according to the U.S. Energy Information Administration.
That's more oil than either Ecuador or Libya produced last year on average.
"We're really starting to hit the steepest part of the decline curve," said Christopher Kopczynski,
a senior analyst for Wood Mackenzie Ltd. in Houston. "There's a lot more that the U.S. will contribute
to bringing barrels off the market."
Shale production has dropped as crude prices collapsed amid a global supply glut, causing drilling
companies to idle 64% of the oil rigs that were in service a year ago. West Texas Intermediate crude,
the U.S. benchmark, fell $1.75 to $31.41 Monday on the New York Mercantile Exchange, the lowest settlement
since Dec. 5, 2003.
The biggest projected decline is in the Eagle Ford in south Texas, where output is expected to
drop 72,000 bopd to 1.15 MMbopd, according to the EIA. The Bakken in North Dakota will lose 24,000
bopd to 1.1 MMbopd. The Permian basin in west Texas will boost production to 2.04 MMbopd.
Kopczynski said U.S. production will fall by another 500,000 bopd as output from existing wells
declines and fewer new wells come online to replace it. The biggest declines happen soon after a
well is tapped, though, so by the end of this summer the production curve should flatten out, and
the U.S. could begin to increase production in 2017 even with a low rig count, he said.
"... No I am thinking 2016, a price of $30/b will both increase demand and reduce supply, excess inventories will start to decrease which will start a gradual rise in prices perhaps reaching $60/b by July, it will take some time to start the increase in supply in response to higher prices so that we may see $80/b by Oct or Nov 2016. I think in 2018 we will be over $90/b. ..."
"... Both operating and capital costs per barrel were much lower in late 1980-s and 1990-s than today. Therefore, low oil prices still covered full-cycle costs. Now large part of future projects and some of the current production is uneconomic at $30-35. ..."
There are lots of dreary soliloquies such as this in Shakespeare's tragedies.
My favorite is in Hamlet Act III, Scene 1:
To be, or not to be- that is the question:
Whether 'tis nobler in the mind to suffer
The slings and arrows of outrageous fortune
Or to take arms against a sea of troubles,
And by opposing end them. To die- to sleep-
No more; and by a sleep to say we end
The heartache, and the thousand natural shocks
That flesh is heir to. 'Tis a consummation
Devoutly to be wish'd. To die- to sleep.
To sleep- perchance to dream: ay, there's the rub!
For in that sleep of death what dreams may come
When we have shuffled off this mortal coil,
Must give us pause. There's the respect
That makes calamity of so long life.
For who would bear the whips and scorns of time,
Th' oppressor's wrong, the proud man's contumely,
The pangs of despis'd love, the law's delay,
The insolence of office, and the spurns
That patient merit of th' unworthy takes,
When he himself might his quietus make
With a bare bodkin? Who would these fardels bear,
To grunt and sweat under a weary life,
But that the dread of something after death-
The undiscover'd country, from whose bourn
No traveller returns- puzzles the will,
And makes us rather bear those ills we have
Than fly to others that we know not of?
Thus conscience does make cowards of us all,
And thus the native hue of resolution
Is sicklied o'er with the pale cast of thought,
And enterprises of great pith and moment
With this regard their currents turn awry
And lose the name of action.
Higher oil prices will return, when I do not know.
Hang in there, hopefully summer will bring back $60/b and by Oct maybe $75/b.
No I am thinking 2016, a price of $30/b will both increase demand and reduce supply, excess
inventories will start to decrease which will start a gradual rise in prices perhaps reaching
$60/b by July, it will take some time to start the increase in supply in response to higher prices
so that we may see $80/b by Oct or Nov 2016. I think in 2018 we will be over $90/b.
I assume this seems too optimistic to you, it will be incorrect if there is another Global
financial crisis between now and 2018. Do you expect oil prices to remain below $60/b until June
of 2018? Or was that a joke.
I doubt we will see oil prices stay at these levels for 16 years like they did from 1986 to
2002. I never get oil prices right, so maybe oil prices stay at $30/b (2015$) until 2031, seems
unlikely to me.
1) Unlike the 1980s-1990s, OPEC spare capacity currently stands at low levels:
3.2mb/d, or 2.3mb/d ex. Iran, Iraq, Libya and Nigeria, according to the IEA, and 2mb/d, according
to the EIA. This equals to only 2.5-3.5% of global demand.
Meanwhile, in 1985, OPEC spare capacity amounted to 11-12mb/d, or ~20% of global demand. This
excess capacity has been gradually declining until late 1990s, but still remained at elevated
levels for most of this period.
2) Both operating and capital costs per barrel were much lower in late 1980-s and 1990-s
than today. Therefore, low oil prices still covered full-cycle costs. Now large part of future
projects and some of the current production is uneconomic at $30-35.
3) The average field decline rates are currently much higher than 25-30 years ago, when production
was dominated by giant fields with long output plateau.
Now large part of global output comes from old fields with declining production, relatively small
new onshore conventional fields (with higher decline rates), deepwater fields (with even higher
decline rates of up to 15% p.a.), and LTO (with very high decline rates). That means that increasing
share of current output should be replaced with new (generally, higher cost) production.
I apologize for an insensitive question and you can simply ignore it if you wish so: but why
are you still producing? Isn't your breakeven much higher than what you're currently able to fetch
for produced oil? If you are producing with a view that oil prices will be higher in the future,
wouldn't all your competitors be it conventional or LTO have the same view and produce until everyone
is bankrupt?
We just shut in 14 more leases. That is in addition to five previous. The remainder are difficult
to shut in water floods or have extremely low costs.
The other reason is we have extremely good, loyal employees with plenty of experience. We dont
want to lay them off.
We have no debt, had plenty of cash as of 6/2014, took almost zero money out of the company
since and built up even more cash once we saw the price was really heading down.
Yet we are now in a pickle, despite the above preparations.
90+ percent of the industry is being kept alive by borrowing money (debt).
I have been thinking that if the credit markets lock up like 2008, the result could freeze
up the North American industry.
See my note below about the 12%/year rate of increase in long term debt for 134 publicly held
oil companies in the US and Canada.
I suspect that more and more oil & gas companies will be looking at salary cuts. Would you
rather take a 10% to 20% salary cut, or have a 10% to 20% chance of being laid off? I suspect
that most employees would choose door #1 in the current environment.
In regard to Alex's chart above showing oil prices in current dollars, note that the low point
on the chart was 1999, when the Economist Magazine published their $5 Oil cover story, where they
asserted, because of improved technology, that we were looking at an extended period with oil
prices in the $5 to $10 range:
Thanks to new technology and productivity gains, you might expect the price of oil, like
that of most other commodities, to fall slowly over the years. Judging by the oil market in
the pre-OPEC era, a "normal" market price might now be in the $5-10 range. Factor in the current
slow growth of the world economy and the normal price drops to the bottom of that range.
At the time of the story, annual Brent crude oil prices were then in the early stages of three
approximate price doublings (nominal dollars):
From $13 in 1998 to $25 in 2002;
From $25 in 2002 to $55 in 2005;
From $55 in 2005 to $110 range for 2011 to 2013 inclusive (about $99 for 2014).
I assume at $30/b in 1998 you were making money, what was your breakeven price in 1998 when
OPEX was lower? It seems with costs 4 times lower in 1998 you would have been better off then
(with oil prices at about $30/b) than in 2013 (with oil prices around $100/b). A simpleton like
me would think you would need $120/b in 2013 to be in as good shape as in 1998 (with oil price
at $30/b and costs 4 times lower).
Anyway, here's to $120/b oil in the near future (maybe 2017).
Dennis, the problem was in 1998 we were getting $8-13 per barrel for oil, depending on the month.
But total expenses were around $10 also, so not much in the way of losses.
As the price went up, expenses went up. Now the price is down over 2/3, but not expenses. Down
maybe 10-15% overall, electricity has not dropped as it is not industry based, but a regulated
monopoly. However, deregulation of that industry has maybe kept down rate increases?
Also, part of the decrease is not service providers lowering costs, but foregoing work overs,
etc, which is really CAPEX.
But we tend to focus on what is going out and coming in, regardless of category.
Interesting. So if OPEX was $40/b and royalties and taxes were 30%, when oil was $80 at the
wellhead, you had a net of about $16/b, not sure what your capex was, but if we assume the wells
had been paid off, you would be in good shape. When WTI averaged $98/b for the year in 2013, were
you getting around $70/b after royalties and taxes, then with OPEX of around $40/b your net (not
sure if I am using this term correctly) was about $30/b on average that year? You may also pay
a transport fee so your price at the wellhead may be about $10/b less than WTI.
I don't need to know if I have the exact dollars correct, but it would be helpful if you fill
in what I am missing conceptually (though if it requires a book, you can say no, totally wrong
or nothing at all.:)
Dennis. OPEX is based on net oil sold, at least the way I calculate it.
So if we sell 100 barrels from a tank, and assume for this example the royalty is 20%, 80 barrels
are the operators. If OPEX is $40 per barrel on the oil produced in that tank, it was $3,200.00,
80 x $40.
In May, 2014, we sell the tank for $100 per barrel, we net $8,000 – $3,200 = $4,800, not including
severance taxes.
Today we sell the tank for $25 per barrel, we lose $2,000 – $3,200 = -$1,200, not including
severance.
I must admit I am adding OPEX, G & A and all taxes, except income, when I make the statement
that costs of $10 per barrel in 1999 were $40 in 2014.
Also, keep in mind, leases in all areas are not uniform concerning costs, and therefore cost
increases were not uniform either.
I assume OPEX/LOE per BOE is reported on company BOE, net of royalties.
I always do the OPEX on all oil produced so for your example above at OPEX of $10/b (or $800
for 80 barrels), I would have calculated OPEX of $8/b (because you actually produced 100 barrels).
I thought the royalties were paid in cash, so I figure this as 20% of revenue at the wellhead
so if you sell your barrels at $25/b and there are 100 barrels in the tank, you pay 20% of $2500
or $500 to the lessor. It amounts to the same thing, but the OPEX is different the way I think
of these things (20% less than the correct way of doing it.)
This may explain why my OPEX numbers may always look low to you (probably 20% too low).
Nice summary. I think we will need at least $80/b by mid 2017 unless GFC 2 that many here predict
occurs in the interim, anything is possible, but I think a severe recession (like 2009 or worse)
is not that likely, less than a 33% chance in my view over the next 3 years.
When we look at oil demand on a yearly basis (there is a seasonal cycle) it correlates quite
well with real GDP. No main stream institutions tend to forecast a recession (as BC has pointed
out) there are pundits who forecast 5 out of every 2 recessions. There will be a recession in
the future, my guess is 2030 to 2035 for the next big one, as the World struggles to deal with
peak fossil fuels and the high energy prices that will accompany that peak.
Note that my guesses about the future are just like all the rest, they are very likely to be
incorrect.
"... "While companies can go a long time without profits, they can survive only a short time without cash, the lifeblood needed by any type of company to pay its bills," the report noted. ..."
"... Moreover, the report recommends multiple survival strategies focused on cash generation, including reductions in capital spending of up 50 percent, and aggressive efforts to further reduce labour costs, including layoffs. ..."
"... The report predicts an increase in global oil and gas demand of just 1 percent to 1.5 percent for the year, with oil prices in the $45 to $65 range over the next several years. ..."
According to a report by the British consulting firm AlixPartners, North American Oil and Gas
producers face a cash-flow deficit of $100 billion in 2016, with layoffs and deep cuts in capital
spending needed for many of the continent's exploration and production companies to survive.
WASHINGTON (SPUTNIK) - North American Oil and Gas producers face a cash-flow deficit of $100
billion in 2016, with layoffs and deep cuts in capital spending needed for many of the continent's
exploration and production companies to survive, according to a report by the British consulting
firm AlixPartners released on Tuesday.
"Largely because of the success of unconventional drilling in North America and the economic
slowdown in China, this downturn could be one of the most severe and prolonged ever," AlixPartners
Managing Director Dennis Cassiday said in a press release accompanying the report.
The major challenge will be to generate cash, said the seven-page report, which covers 130 publicly
traded exploration and production companies operating in North America.
"While companies can go a long time without profits, they can survive only a short time
without cash, the lifeblood needed by any type of company to pay its bills," the report noted.
Moreover, the report recommends multiple survival strategies focused on cash generation,
including reductions in capital spending of up 50 percent, and aggressive efforts to further reduce
labour costs, including layoffs.
The report predicts an increase in global oil and gas demand of just 1 percent to 1.5 percent
for the year, with oil prices in the $45 to $65 range over the next several years.
"... • 2.9 MMbpd of liquids production deferred to early next decade, up from 2 MMbpd ..."
"... Average breakeven of delayed greenfield projects is $62/boe. ..."
"... 2.9mmbpd for $380 billion seems low to me – should be more like 5 mmbpd – so maybe the $170 billion "delayed spend" is the more relevant figure. ..."
...New Wood Mackenzie study indicates 68 major oil and gas projects deferred, highlights are
as below (note the numbers probably don't include impacts from recent announcements of further
cuts from PetroBras).
• $380 billion of total project capex deferred (real terms), from the 68 projects
• Of the $380 billion capex, delayed spend from the 68 projects from 2016 to 2020 totals $170
billion
• Deepwater hit the hardest: more than half of new project deferrals up from 17 to 29; 62% of
total reserves; and 56% of total capex • 2.9 MMbpd of liquids production deferred to early next decade, up from 2 MMbpd
• Oil most impacted: deferred liquid volumes up 44%, versus 24% for gas
• Average breakeven of delayed greenfield projects is $62/boe.
2.9mmbpd for $380 billion seems low to me – should be more like 5 mmbpd – so maybe the $170
billion "delayed spend" is the more relevant figure.
You have mentioned sanctions. In my view, this was a foolish decision and a harmful one. I have
said that our turnover with Germany amounted to $83–85 billion, and thousands of jobs were created
in Germany as a result of this cooperation. And what are the restrictions that we are facing? This
is not the worst thing we are going through, but it is harmful for our economy anyway, since it affects
our access to international financial markets.
As to the worst harm inflicted by today's situation, first of all on our economy, it is the harm
caused by the falling prices on our traditional export goods. However, both the former and the latter
have their positive aspects. When oil prices are high, it is very difficult for us to resist spending
oil revenues to cover current expenses. I believe that our non-oil and gas deficit had risen to a
very dangerous level. So now we are forced to lower it. And this is healthy…
Question: For the budget deficit?
Vladimir Putin: We divide it. There is the total deficit and then there are non-oil and
gas revenues. There are revenues from oil and gas, and we divide all the rest as well.
The total deficit is quite small. But when you subtract the non-oil and gas deficit, then you
see that the oil and gas deficit is too large. In order to reduce it, such countries as Norway, for
example, put a significant proportion of non-oil and gas revenues into the reserve. It is very difficult,
I repeat, to resist spending oil and gas revenues to cover current expenses. It is the reduction
of these expenses that improves the economy. That is the first point.
Second point. You can buy anything with petrodollars. High oil revenues discourage development,
especially in the high technology sectors. We are witnessing a decrease in GDP by 3.8 percent, in
industrial production by 3.3 percent and an increase in inflation, which has reached 12.7 percent.
This is a lot, but we still have a surplus in foreign trade, and the total exports of goods with
high added value have grown significantly for the first time in years. That is an expressly positive
trend in the economy.
The reserves are still at a high level, and the Central Bank has about 340 billion in gold and
foreign currency reserves. If I am not mistaken, they amount to over 300. There are also two reserve
funds of the Government of the Russian Federation, each of which amounts to $70 to $80 billion. One
of them holds $70 billion, the other – $80 billion. We believe that we will be steadily moving towards
stabilisation and economic growth. We have adopted a whole range of programmes, including those aimed
at import replacement, which means investing in high technologies.
Petroleo Brasileiro SA, as Brazil's state-controlled oil producer is formally known, slashed
its business plan for the five years through 2019 to $98.4 billion, the latest adjustment to the
original $130 billion announced last year, it said Tuesday in a filing. The Rio de
Janeiro-based company reduced its 2020 target for Brazilian oil production by 3.6 percent to 2.7
million barrels a day.
... ... ...
The world's most-indebted oil company said it plans to invest $20 billion in 2016, up slightly
from its most recent estimate of $19 billion. Petrobras still plans to divest $14.4 billion this
year to help fund its spending plan. The company expects Brent crude prices to average $45 a
barrel this year, down from its previous estimate of $55 a barrel.
"... "I can't think of too many investors who predicted that oil would be trading at current levels, so a continuing slump in crude adds to investor nervousness, leading to a spike in volatility," ..."
"... crude at $35 a barrel would cause Russia's gross domestic product to decline by as much as 3 percent in 2016, its central bank said in December. ..."
"I can't think of too many investors who predicted that oil would be trading at current
levels, so a continuing slump in crude adds to investor nervousness, leading to a spike in
volatility," Pavel Laberko, who helps manage $150 million in emerging-market assets at Union
Bancaire Privee in London, said by phone on Wednesday. "There is a lot of uncertainty as to where
oil is going to go from current levels, and this uncertainty is not doing much to decrease price
swings."
... ... ...
...crude at $35 a barrel would cause Russia's gross domestic product to decline by as much
as 3 percent in 2016, its central bank
said in December.
... ... ...
The ruble advanced 0.5 percent to 76.65 against the dollar at 3:18 p.m. in New York, narrowing
its retreat this year to 4 percent, among the biggest drops among emerging-market currencies. The
Market Vectors Russia ETF slid 0.7 percent to $13.10. The dollar-denominated RTS Index fell 0.2
percent in Moscow, while futures contracts on the index retreated 0.7 percent to 68,530 in U.S.
hours.
North America oil drillers will likely come up $102 billion short on the cash they need to
operate this year as crude prices fall to $30 a barrel, according to a study by the consultancy
AlixPartners.
The $102-billion cash shortfall could force more domestic crude producers to take more drastic
measures in 2016, including widespread pay cuts or wage freezes, cutting employees' hours and
pressuring suppliers for another 15 to 20 percent reduction in service and equipment prices.
"... "You see a big destruction in the income of the oil and commodity producers," Turner said. "That is having a major effect on their expenditure across the world." ..."
West Texas Intermediate futures, the U.S. benchmark, sank below $30 a barrel on Tuesday for
the first time since 2003. Actual barrels of Saudi Arabian crude shipped to Asia are even
cheaper, at $26 -- the lowest since early 2002 once inflation is factored in and near levels seen
before the turn of the millennium.
... ... ...
"You see a big destruction in the income of the oil and commodity producers," Turner said.
"That is having a major effect on their expenditure across the world."
"... "It's difficult to predict how the price will develop in the short term," Saetre said in a separate interview with Reuters on Thursday. "There will probably be volatility and big swings. We firmly believe prices will rise because there is little new production capacity entering the market." < ..."
"... He added, "I also believe that the longer it takes before the oil price rises, the more powerful that increase will become." ..."
Despite the impact on his company's revenue, Saetre, like some
other industry leaders, expresses some optimism that this very
dearth of income could in itself lead to a rebound – perhaps a
strong and lasting price recovery – because a lack of revenue leads
oil companies to reduce investments, and this leads to lower
production, restoring a measure of balance to the energy economy.
"It's difficult to predict how the price will develop in the short
term," Saetre said in a separate interview
with Reuters on Thursday. "There will probably be volatility
and big swings. We firmly believe prices will rise because there is
little new production capacity entering the market."
< The current market
turmoil has created a once in a generation opportunity for
savvy energy investors. Whilst the mainstream media prints
scare stories of oil prices falling through the floor
smart investors are setting up their next winning oil
plays.<
He added, "I also believe that the longer it takes before the
oil price rises, the more powerful that increase will become."
"... . This is about return of capital, not return on capital. ..."
"... Tensions between Iran and Saudi Arabia make it less likely that Opec can agree to cut production to halt the slide in prices. Brent crude is down another 1% at $31.18, its lowest level since April 2004. ..."
"... All these people who are long [buyers of] oil and mining companies thinking that the dividends are safe are going to discover that they're not at all safe. ..."
Investors face a "cataclysmic year" where stock markets could fall by up to 20% and oil could slump to $16 a barrel, economists at the Royal Bank of Scotland have warned.
In a note to its
clients the bank said: "Sell everything except high quality bonds. This is about return of capital, not return on capital. In a crowded hall, exit doors are small." It said the current situation was reminiscent of 2008, when the collapse of the Lehman Brothers investment bank led to the global financial crisis. This time China could be the crisis point.
... ... ...
Oil prices have also fallen sharply on fears of lower demand and a supply glut, especially
with Iran due to start exporting once more when sanctions are lifted. Tensions between Iran
and Saudi Arabia make it less likely that Opec can agree to cut production to halt the slide in
prices. Brent crude is down another 1% at $31.18, its lowest level since April 2004.
... ... ...
Roberts said European and US markets could fall by 10% to 20%, with the FTSE 100 particularly
at risk due to the predominance of commodity companies in the UK index. "London is vulnerable to
a negative shock. All these people who are long [buyers of] oil and mining companies thinking
that the dividends are safe are going to discover that they're not at all safe.
Art Glick 13 Jan 2016 09:40
How things have changed since the Reagen era! I'm old enough to recall when the CIA would
have done anything to undermine the economy of Red China. Now our fate is tied to theirs!
Money talks, nobody walks!
Roland33 -> Penrod 13 Jan 2016 06:43
Oh I agree I meant as a prediction/indicator of a stock market crash (like a slowdown in
China for example). The assumption is that economic fundamentals are driving the stock price.
It is cheap money that is driving the stock price. QE 1-3 but that money is running out but
the FED will not allow corrections they will come into the market even larger than before with
QE4 which is also called QE4ever. because that is what it really represents. It will never
allow markets to operate but it will inflate bubbles forever and give people the illusion that
everything is going great and that their standards of living are rising instead of declining
that productivity is going up instead of down.
AlexLeo -> soundsofOregon 13 Jan 2016 00:38
This is irrelevant. They fired 14,000 out of their 18,000 or so employees in investment
banking last year alone. Or are you going to take investment advice from someone only because
they have many ATM machines and branch offices?
Breeeze -> murtibing 13 Jan 2016 00:12
Saudi cost of extraction is estimated at between $4 to $9
Duc de Richleau -> katedj 13 Jan 2016 00:12
No I don't think it was. However if you are stupid enough to let other people tell you what
to do with your stocks then you shouldn't be trading. I have no liking for banking groups like
RBS or Hedge-fund managers for that matter.
Tony Falla 12 Jan 2016 23:25
RBS is hardly a stalwart in investment banking and is not in the position to issue radical
"advice" such as this.
Goldman Sachs is the leading IB who quite often predicts the future of financial assets
correctly. Now if they'd announced it, I'd listen carefully. And their are dozens of other
banks with far better track records that make more accurate predictions than RBS.
This is the bank that allowed Freddy Goodwin to bring the British economy to its knees, by
sucking in every global subprime asset looking for a home.
Okay Freddy''s gone but the bank still remains a third tier financial institution, technically
bankrupt and still writing down billions of toxic assets on its own balance sheet year in,
year out.
It's funny how a faceless article from RBS can advise investors to sell everything. My
advice would be not to listen because like Freddy''s RBS, it could make you considerably
poorer.
"... As to US onshore conventional, that production has been tanking since 12/14. Down about 200K bopd 12/14-6/15. That is a big drop considering it went from 2.6 million to 2.4 million. (This is ex-Alaska). ..."
"... I suspect if these prices continue, US onshore conventional falls below 2 million bopd in 2016. ..."
I wonder how many are going to stack after finishing the current well?
The Director's cut should be coming out any day. Wonder what Mr. Helms will have to say?
As to US onshore conventional, that production has been tanking since 12/14. Down about 200K
bopd 12/14-6/15. That is a big drop considering it went from 2.6 million to 2.4 million. (This
is ex-Alaska).
I suspect if these prices continue, US onshore conventional falls below 2 million bopd in 2016.
... If anything, the Saudis have
actually
increased
their output.
Many reasons have been given for the Saudis' resistance to production
cutbacks, including a desire to
punish
Iran and Russia for their support of the Assad regime in Syria.
In the view of many industry analysts, the Saudis see themselves as better
positioned than their rivals for weathering a long-term price decline
because of their lower costs of production and their large cushion of
foreign reserves. The most likely explanation, though, and the one advanced
by the Saudis themselves is that they are seeking to maintain a price
environment in which U.S. shale producers and other tough-oil operators will
be driven out of the market. "There is no doubt about it, the price fall of
the last several months has deterred investors away from expensive oil
including U.S. shale, deep offshore, and heavy oils," a top Saudi official
told
the
Financial Times
last spring.
Despite the Saudis' best efforts, the larger U.S. producers have, for the
most part, adjusted to the low-price environment, cutting costs and shedding
unprofitable operations, even as many smaller firms have filed for
bankruptcy. As a result, U.S. crude production, at about
9.2 million barrels
per day, is actually slightly higher than it was a
year ago.
In other words, even at $33 a barrel, production continues to outpace
global demand and there seems little likelihood of prices rising soon,
especially since, among other things, both Iraq and Iran continue to
increase their output. With the Islamic State slowly losing ground in Iraq
and most major oil fields still in government hands, that country's
production is expected to continue its stellar growth. In fact, some
analysts
project
that its output could triple during the coming decade from the
present three million barrels per day level to as much as nine million
barrels.
For years, Iranian production has been
hobbled
by sanctions imposed by Washington and the European Union
(E.U.), impeding both export transactions and the acquisition of advanced
Western drilling technology. Now, thanks to its nuclear deal with
Washington, those sanctions are being lifted, allowing it both to reenter
the oil market and import needed technology. According to the U.S. Energy
Information Administration, Iranian output
could rise
by as much as 600,000 barrels per day in 2016 and by more in
the years to follow.
Only three developments could conceivably alter the present low-price
environment for oil: a Middle Eastern war that took out one or more of the
major energy suppliers; a Saudi decision to constrain production in order to
boost prices; or an unexpected global surge in demand.
The prospect of a new war between, say, Iran and Saudi Arabia -- two
powers at each other's throats at this very moment -- can never be ruled
out, though neither side is believed to have the capacity or inclination to
undertake such a risky move. A Saudi decision to constrain production is
somewhat more likely sooner or later, given the precipitous decline in
government revenues. However, the Saudis have
repeatedly affirmed
their determination to avoid such a move, as it
would largely benefit the very producers -- namely shale operators in the
U.S. -- they seek to eliminate.
The likelihood of a sudden spike in demand appears
unlikely indeed. Not only is economic activity still slowing in China and
many other parts of the world, but there's an extra wrinkle that should
worry the Saudis at least as much as all that shale oil coming out of North
America: oil itself is beginning to lose some of its appeal.
While newly affluent consumers in China and India continue to buy
oil-powered automobiles -- albeit not at the breakneck pace once predicted
-- a growing number of consumers in the older industrial nations are
exhibiting a preference for hybrid and all-electric cars, or for alternative
means of transportation. Moreover, with concern over climate change growing
globally, increasing numbers of young urban dwellers are choosing to subsist
without cars altogether, relying instead on bikes and public transit. In
addition, the use of renewable energy sources -- sun, wind, and water power
-- is
on the rise
and will only grow more rapidly in this century.
These trends have prompted some analysts to predict that global oil
demand will soon peak and then be followed by a period of declining
consumption. Amy Myers Jaffe, director of the energy and sustainability
program at the University of California, Davis, suggests that growing
urbanization combined with technological breakthroughs in renewables will
dramatically reduce future demand for oil. "Increasingly, cities around the
world are seeking smarter designs for transport systems as well as penalties
and restrictions on car ownership. Already in the West, trendsetting
millennials are urbanizing, eliminating the need for commuting and interest
in individual car ownership," she
wrote
in the
Wall Street Journal
last year.
The Changing World Power Equation
Many countries that get a significant share of their funds from oil and
natural gas exports and that gained enormous influence as petroleum
exporters are already experiencing a
significant erosion
in prominence. Their leaders, once bolstered by
high oil revenues, which meant money to spread around and buy popularity
domestically, are falling into disfavor.
Nigeria's government, for example, traditionally
obtains
75% of its revenues from such sales; Russia's,
50%
; and Venezuela's,
40%
. With oil now at a third of the price of 18 months ago, state
revenues in all three have plummeted, putting a crimp in their ability
to undertake ambitious domestic and foreign initiatives.
In Nigeria, diminished government spending combined with rampant
corruption discredited the government of President Goodluck Jonathan and
helped fuel a vicious insurgency by Boko Haram, prompting Nigerian voters to
abandon him in the most recent election and
install
a former military ruler, Muhammadu Buhari, in his place. Since
taking office, Buhari has pledged to crack down on corruption, crush Boko
Haram, and -- in a telling sign of the times --
diversify
the economy, lessening its reliance on oil.
Venezuela has experienced a similar political shock thanks to depressed
oil prices. When prices were high, President Hugo Chávez took revenues from
the state-owned oil company,
Petróleos de Venezuela S.A.
, and used them to build housing and provide
other benefits for the country's poor and working classes, winning vast
popular support for his United Socialist Party. He also sought regional
support by offering
oil subsidies
to friendly countries like Cuba, Nicaragua, and Bolivia.
After he died in March 2013, his chosen successor, Nicolas Maduro, sought to
perpetuate this strategy, but oil
didn't cooperate
and, not surprisingly, public support for him and for
Chávez's party began to collapse. On December 6th, the center-right
opposition swept to electoral victory, taking a
majority
of the seats in the National Assembly. It now seeks to
dismantle Chávez's "Bolivarian Revolution," though Maduro's supporters have
pledged
firm resistance to any such moves.
The situation in Russia remains somewhat more fluid. President Vladimir
Putin continues to enjoy widespread popular support and, from Ukraine to
Syria, he has indeed been moving ambitiously on the international front.
Still, falling oil prices combined with economic sanctions imposed by the
E.U. and the U.S. have begun to cause some expressions of dissatisfaction,
including a recent
protest
by long-distance truckers over increased highway tolls. Russia's
economy is expected to
contract
in a significant way in 2016, undermining the living standards
of ordinary Russians and possibly sparking further anti-government
protests. In fact, some analysts believe that Putin took the risky step of
intervening in the Syrian conflict partly to deflect public attention from
deteriorating economic conditions at home. He may also have done so to
create a situation in which Russian help in achieving a negotiated
resolution to the bitter, increasingly internationalized Syrian civil war
could be
traded
for the lifting of sanctions over Ukraine. If so, this is a very
dangerous game
, and no one -- least of all Putin -- can be certain of
the outcome.
Saudi Arabia, the world's leading oil exporter, has been similarly
buffeted, but appears -- for the time being, anyway -- to be in a somewhat
better
position
to weather the shock. When oil prices were high, the Saudis
socked away a massive trove of foreign reserves, estimated at three-quarters
of a trillion dollars. Now that prices have fallen, they are drawing on
those reserves to sustain generous social spending meant to stave off unrest
in the kingdom and to finance their ambitious intervention in Yemen's civil
war, which is already beginning to look like a Saudi Vietnam. Still, those
reserves have fallen by some $90 billion since last year and the government
is already announcing cutbacks in public spending, leading some observers to
question
how long the royal family can continue to buy off the
discontent of the country's growing populace. Even if the Saudis were to
reverse course and limit the kingdom's oil production to drive the price of
oil back up, it's unlikely that their oil income would rise high enough to
sustain all of their present lavish spending priorities.
Other major oil-producing countries also face the prospect of political
turmoil, including
Algeria
and
Angola
. The leaders of both countries had achieved the usual deceptive
degree of stability in energy producing countries through the usual
oil-financed government largesse. That is now coming to an end, which means
that both countries could face internal challenges.
And keep in mind that the tremors from the oil pricequake have
undoubtedly yet to reach their full magnitude. Prices will, of course, rise
someday. That's inevitable, given the way investors are pulling the plug on
energy projects globally. Still, on a planet heading for a green energy
revolution, there's no assurance that they will ever reach the $100-plus
levels that were once taken for granted. Whatever happens to oil and the
countries that produce it, the global political order that once rested on
oil's soaring price is doomed. While this may mean hardship for some,
especially the citizens of export-dependent states like Russia and
Venezuela, it could help smooth the transition to a world powered by
renewable forms of energy.
Michael T. Klare, a
TomDispatch
regular
, is a professor of peace and world
security studies at Hampshire College and the author, most recently, of
The Race for What's Left
. A documentary movie version of his book
Blood and Oil
is available from the Media Education Foundation
.
Follow him on Twitter at @mklare1.
"... EIA expects U.S. crude oil production to decline steadily from 9.2 million b/d in December 2015, reaching about 8.5 million b/d in November 2016 ..."
EIA expects U.S. crude oil production to decline steadily from 9.2 million b/d in December
2015, reaching about 8.5 million b/d in November 2016. Production is expected to stay near 8.5
million b/d for most of 2017. This level of production would be 1.2 million b/d below the April 2015
level, which was the highest monthly production since April 1971.
Late in the forecast period EIA expects small sales from the U.S. Strategic Petroleum Reserve
(SPR). Recent legislation
authorized sales of SPR oil between Fiscal Years (FY) 2018-25 for deficit reduction, SPR modernization,
and highway funding purposes. EIA assumes 5 million barrels of SPR sales for deficit reduction purposes
in FY 2018 (which starts in October 2017), equivalent to 14,000 b/d of SPR draws during the fourth
quarter of 2017. EIA further assumes no SPR sales occur for SPR modernization during the forecast
period.
The Short-Term Energy Outlook released on January 12, which is the first STEO to include projections
for 2017, forecasts Brent crude oil prices will average $40 per barrel (b) in 2016 and $50/b in
2017. West Texas Intermediate (WTI) crude oil prices are expected to be $2/b lower than Brent
in 2016 and $3/b lower than Brent in 2017.
Crude oil prices are expected to remain low as supply continues to outpace demand in 2016 and
more crude oil is placed into storage. EIA estimates that global oil inventories increased by
1.9 million b/d in 2015, marking the second consecutive year of inventory builds. Inventories
are forecast to rise by an additional 0.7 million b/d in 2016, before the global oil market becomes
relatively balanced in 2017. The first forecasted draw on global oil inventories is expected in
the third quarter of 2017, marking the end of 15 consecutive quarters of inventory builds.
EIA expects non-OPEC production to decline by 0.6 million b/d in 2016, which would be the first
decline in non-OPEC production since 2008. About two-thirds of this forecasted decline in 2016
comes from the United States.
OPEC crude oil production is forecast to increase by 0.5 million b/d in 2016, with Iran accounting
for most of that increase. Iran is expected to increase its production once international sanctions
targeting its oil sector are suspended. Although uncertainty remains as to the timing of sanctions
relief, EIA assumes this occurs in the first quarter of 2016.
EIA expects global consumption of petroleum and other liquid fuels to grow by 1.4 million b/d
in both 2016 and 2017. Forecast real gross domestic product (GDP) for the world, weighted by oil
consumption, which increased by an estimated 2.4% in 2015, rises by 2.7% in 2016 and by 3.2% in
2017.
Note that the EIA data (similarly to the IEA and OPEC) shows that the imbalance between global
supply and demand has peaked in the second quarter of 2015 and has been declining since then.
The problem is that supply still outpaces demand until the second half of 2017, meaning that global
inventory levels will continue to increase, putting additional pressure on prices.
Several months ago the EIA was forecasting that the balance between global demand and supply
would be reached by 3Q16, a year earlier. As demand projections have not changed, the longer than
previously expected period of oversupply reflects the resilience on the supply-side.
In any case, I do agree with the EIA that we are facing two more years of low oil prices, but
prices should start to improve by the end of 2017.<
"... As demand projections have not changed, the longer than previously expected period of oversupply reflects the resilience on the supply-side. In any case, I do agree with the EIA that we are facing two more years of low oil prices, but prices should start to improve by the end of 2017 ..."
"... Upward revision for 2015-1H16 mainly reflect higher estimates for Lower 48 excl GoM. The biggest revisions in monthly numbers are for February 2016: + 174 kb/d; January 2016: 170 kb/d; and November 2015: 153 kb/d ..."
"... The new full-year estimate for 2015 is 9.43 mb/d ..."
"... Productivity improvements, lower breakeven costs, and anticipated oil price increases in the second half of 2017 are expected to end over two years of falling Lower 48 onshore production. ..."
"... Estimates of C+C production in the Gulf of Mexico have also been revised upward. The EIA now expects output there to increase from 1.3 mb/d in January 2014 to 1.93mb/d in December 2017. The numbers for Alaska are unchanged. ..."
"... Interesting, they claim same fall in USA production, average, for 2016 even if they cut price forecast much more and that previous forecasts price spike in second half of 2016 was reason for jump in production in second half 2016 in previous reports. ..."
"... This is just another government agency. Mixture of Bureau of Economic Analysis and a propaganda outlet. Some of their data are based on sampling. The fact that they provide more then three meaningful digits in their forecasts suggests that they are not very good in mathematics as accuracy of their data might well be less then +-1%. Like the Department of State they do not need to be consistent in their figures or opinions :-) ..."
"... The key issue in the current situation (as shallow sand pointed out) is that now there are major producers which at this price level are underwater. So this cant last forever. ..."
"... On the other hand as Keynes noted The market can stay irrational longer than you can stay solvent. and There is nothing so disastrous as a rational investment policy in an irrational world. ..."
Note that the EIA data (similarly to the IEA and OPEC) shows that the imbalance between global
supply and demand has peaked in the second quarter of 2015 and has been declining since then.
The problem is that supply still outpaces demand until the second half of 2017, meaning that global
inventory levels will continue to increase, putting additional pressure on prices.
Several months ago the EIA was forecasting that the balance between global demand and supply would
be reached by 3Q16, a year earlier. As demand projections have not changed, the longer than
previously expected period of oversupply reflects the resilience on the supply-side. In any case,
I do agree with the EIA that we are facing two more years of low oil prices, but prices should
start to improve by the end of 2017
The EIA has significantly revised upwards its estimate of U.S. C+C output in 2015 and the first
half of 2016, but has made downward revisions for 2H16.
The January STEO also for the first time includes U.S. C+C output projections for 2017.
Upward revision for 2015-1H16 mainly reflect higher estimates for Lower 48 excl GoM. The
biggest revisions in monthly numbers are for February 2016: + 174 kb/d; January 2016: 170 kb/d;
and November 2015: 153 kb/d
From the report:
"According to the latest survey-based reporting of monthly crude oil production data, U.S.
production averaged 9.5 million b/d through the first 10 months of 2015, about 0.2 million
b/d higher than in the fourth quarter of 2014. The estimates include EIA survey-based monthly
crude oil production data for Oklahoma for the first time. These new estimates are roughly
0.1 million b/d per month higher than those generated by the previous methodology for Oklahoma,
which was based on state-reported data that was later adjusted by EIA. The recently expanded
EIA-914 survey now collects oil production from the largest oil producers in 15 states (including
Oklahoma) and the federal Gulf of Mexico."
The new full-year estimate for 2015 is 9.43 mb/d vs. 9.33mb/d in December 2015 STEO.
The EIA has been increasing its estimate for the U.S. C+C output in 2015 since September 2015
STEO, when the forecast was 9.22 mb/d. In other words, the estimate was increased by 210 kb/d,
despite much lower than previously expected oil prices.
According to the EIA,
"U.S. production began falling in May 2015, led by Lower 48 onshore production that has fallen
nearly 0.5 million b/d [by October]. These declines have been tempered by production growth of
0.1 million b/d in the Gulf of Mexico since April."
"With WTI prices falling below $40/b in December 2015 and projected to remain below that
level through mid-2016, EIA expects oil production to decline in most Lower 48 onshore oil
production regions. The expectation of reduced cash flows in 2016 and 2017 has prompted many
companies to scale back investment programs, deferring major new undertakings until a sustained
price recovery occurs. The prospect of higher interest rates and tougher lending conditions
will likely limit the availability of capital for many smaller producers, giving rise to distressed
asset sales and consolidation of acreage holdings by more financially sound firms. The retrenchment
in onshore investment is anticipated to push the count of oil-directed rigs and well completions
in 2016 and 2017 below current levels.
The focus of drilling and production activities will be on the core areas of major tight
oil plays. Despite the significant decline in total rig counts in 2015, rig counts have largely
stabilized in the core counties of the Bakken, Eagle Ford, Niobrara, and Permian. In these
areas, falling costs and ongoing technological and process improvements in rig, labor, and
well productivity are anticipated to lead to faster rates of well completions and less-rapid
production declines relative to other Lower 48 onshore areas. The ongoing gains in learning-by-doing,
cost reductions, and rig and well productivity are expected to enhance the economic viability
of these areas as well as to be disseminated to other regions, incrementally reducing the breakeven
costs of production in more marginal areas.
EIA expects U.S. crude oil production to decline steadily from 9.2 million b/d in December
2015, reaching about 8.5 million b/d in November 2016. Production is expected to stay near
8.5 million b/d for most of 2017. This level of production would be 1.2 million b/d below the
April 2015 level, which was the highest monthly production since April 1971."
U.S. C+C output (mb/d): STEO January 2016 vs. December 2015
"Productivity improvements, lower breakeven costs, and anticipated oil price increases
in the second half of 2017 are expected to end over two years of falling Lower 48 onshore production.
Onshore production averaged 7.6 million b/d in the second quarter of 2015, and it is forecast
to fall below 6.2 million b/d in September 2017 before increasing modestly in the fourth quarter
of 2017. The forecast remains sensitive to actual wellhead prices and rapidly changing drilling
economics that vary across regions and operators."
Lower 48 ex GoM C+C output (mb/d): STEO January 2016 vs. December 2015
Estimates of C+C production in the Gulf of Mexico have also been revised upward. The EIA now
expects output there to increase from 1.3 mb/d in January 2014 to 1.93mb/d in December 2017. The
numbers for Alaska are unchanged.
From the report:
"Projected crude oil production in the Gulf of Mexico rises during the forecast period,
and oil production in Alaska falls. Production in these areas is less sensitive than onshore
production in the Lower 48 states to short-term price movements and reflects anticipated growth
from new projects in the Gulf of Mexico and declines from legacy fields in Alaska. Several
projects in the Gulf that came or will come online in 2014-16 will push up production from
an average of 1.6 million b/d in 2015 to 1.9 million b/d in the fourth quarter of 2017. It
is possible some projects will start production later than expected, potentially shifting some
of the anticipated production gains from late 2017 into early 2018."
C+C production in the GoM: STEO January 2016 vs. December 2015
Interesting, they claim same fall in USA production, average, for 2016 even if they cut price
forecast much more and that previous forecasts price spike in second half of 2016 was reason for
jump in production in second half 2016 in previous reports.
The reason might be export of processed by refineries products. So some oil enters the USA
purely for processing and the products are shipped back.
From the other point of view it looks like you are a perfectionist, aren't you ?
This is just another government agency. Mixture of Bureau of Economic Analysis and a propaganda
outlet. Some of their data are based on sampling. The fact that they provide more then three meaningful
digits in their forecasts suggests that they are not very good in mathematics as accuracy of their
data might well be less then +-1%. Like the Department of State they do not need to be consistent
in their figures or opinions :-)
For example their short term price forecast is based on futures (which means it is based on
opinions of gamblers).
The key issue in the current situation (as shallow sand pointed out) is that now there
are major producers which at this price level are underwater. So this can't last forever.
On the other hand as Keynes noted "The market can stay irrational longer than you can stay
solvent." and "There is nothing so disastrous as a rational investment policy in an irrational
world."
Note that the EIA data (similarly to the IEA and OPEC) shows that the imbalance between global
supply and demand has peaked in the second quarter of 2015 and has been declining since then.
The problem is that supply still outpaces demand until the second half of 2017, meaning that global
inventory levels will continue to increase, putting additional pressure on prices.
Several months ago the EIA was forecasting that the balance between global demand and supply would
be reached by 3Q16, a year earlier. As demand projections have not changed, the longer than previously
expected period of oversupply reflects the resilience on the supply-side.
In any case, I do agree with the EIA that we are facing two more years of low oil prices, but
prices should start to improve by the end of 2017.<
I disagree that we will see low prices for two years, although we may disagree what
"low" oil price means. Do you expect that the EIA oil price forecast through 2017 will be correct?
I doubt oil prices that low will keep demand low and supply high, so that low prices will continue.
I expect the higher cost producers everywhere to either cut back production or go bankrupt if
they continue to produce at such low oil prices. There just is not enough oil in the World that
can be produced at a profit at $50/b or less to keep oil supplies up. Oil companies cannot keep
producing oil at a loss for another 2 years, I believe they are close to their limit and oil supply
will decrease noticeably by summer. Then oil prices will gradually rise as inventories fall back
to normal levels. It will be interesting to see how this plays out, I certainly have been wrong
on prices before. You agree it seems with the EIA forecast. You think 2018 will be when oil prices
rise, I think 2016, maybe it will be 2017. When I say rise I mean above $60/b and remain above
that level, gradually rising to $80 (over 6 to 24 months).<
You nailed it: "This time is different"… It looks to me that the current situation is unsustainable
beyond the first half of 2016 unless we see tanking of world economy.
Let me repeat key points so more people pay attention to what you said.
>I expect the higher cost producers everywhere to either cut back production or go bankrupt
if they continue to produce at such low oil prices.
It's worse that that. Due to debt load they can't cut and they can't continue. This is a Catch
22 so they will walk directly into bankruptcy court or short gun wedding with a stronger player.
North America oil drillers will likely come up $102 billion short on the cash they need to operate
this year
http://fuelfix.com/blog/2016/01/13/oil-drillers-face-102-billion-cash-shortfall-in-2016/
> There just is not enough oil in the World that can be produced at a profit at $50/b or less
to keep oil supplies up. Oil companies cannot keep producing oil at a loss for another 2 years,
I believe they are close to their limit and oil supply will decrease noticeably by summer.
The main source of financing tight oil and tar sands boom dried out and those two were major
drivers of world production. Arthur Berman in his "Why The Price Of Oil Must Rise" interview noted
that most US oil producers can't break even below $65 a barrel. And that some shale/tight oil
producers used to have negative cash flow at prices close to a 100. They survived only due to
unlimited access to cheap financing via junk bonds. This junk bond bonanza is over so they need
to cut drilling and to sell assets to survive.
> You think 2018 will be when oil prices rise, I think 2016, maybe it will be 2017. When I
say rise I mean above $60/b and remain above that level, gradually rising to $80 (over 6 to 24
months).
It's unclear and unpredictable when prices will bounce but what is clear that the longer low
prices stay law the more violent bounce we might get. Probably coupled with a short squeeze. And
the earliest we can get is March 2016 if OPEC calls emergency meeting and decide of cuts. Then
we have June 2 OPEC meeting which also can serve as a trigger.
Growth of consumption in 2016 probably will be higher then expected as people splurge on cheap
gas like in 2015. US and Canada were two major sources of new supply. They are now shrinking.
Other then Iran everybody else will be either flat or shrinking due to cuts in capex. Iraq is
talking about cutting production by 0.2 Mb/d in 2016.
LONDON - The persistent plunge in oil prices has translated into a new round of industry job cuts.
The British oil giant BP said on Tuesday it would eliminate 4,000 of the approximately 24,000
positions in its exploration and production units this year. That would be in addition to about 4,000
jobs that the company cut last year, when it trimmed its work force to about 80,000.
"... Everything is possible in the world where the price of oil is determined by Wall Street (despite some people having illusions about supply and demand equilibrium; this is just a factor and probably not the decisive factor). ..."
"... That means that, at that price, not only upstream investments would be severely cut, but also a large number of the currently producing wells will be iddled. $20 is almost twice as low as the current price, and supply-side response will be much stronger than what we are seeing now. ..."
"... $20 per barrel is such an absurd in the current circumstances price, but it is not that outlandish estimate of a short time minimum possible in the destabilized system, especially in Q1. ..."
Everything is possible in the world where the price of oil is determined by Wall Street (despite
some people having illusions about supply and demand equilibrium; this is just a factor and probably
not the decisive factor).
But I think even at $40 per barrel the US shale production will be decimated in a year or two.
They managed to get financing for 2016, but that's about it. And that's over 3 Mb/d. Additional
cars that were bought in the US, India and China in 2015 will be on the road for another 10 years
or so.
In this sense EIA prediction of $50 average in 2016 does not look completely outlandish. But
to achieve such average from low start of $38 per barrel and typically low prices in the Q1 you
need at least half of the months to be above $50 by $10. That's looks less probable now.
Unlike $35-40, $20/barrel is below cash operating costs for many conventional producers worldwide.
That means that, at that price, not only upstream investments would be severely cut, but also
a large number of the currently producing wells will be iddled.
$20 is almost twice as low as the current price, and supply-side response will be much stronger
than what we are seeing now.
Oil price may temporarily touch $20, as Goldman predicts (although this is not their base scenario),
but it will not stay at these levels for long term.
"Oil price may temporarily touch $20, as Goldman predicts (although this is not their base scenario),
but it will not stay at these levels for long term."
Thank you. That's exactly my point.
The key consideration here is that the Wall Street instruments create a strong positive feedback
loop that destabilized the system and amplifies any price movements. So oscillations became more
and more powerful creating more and more moments with absurd prices. Right now on the down side.
$20 per barrel is such an absurd in the current circumstances price, but it is not that outlandish
estimate of a short time minimum possible in the destabilized system, especially in Q1.
"... A half a million barrels WOULD be enough to influence prices. An individual company does not
expect its OWN production to influence the market price- unless maybe the company is a REALLY big one
maybe. If any given company drills say fifty such wells, that would be only twenty thousand barrels
a day, maybe less- most definitely not enough to move the market price needle. ..."
"... What you say may make sense of you are using cash and have little to no debt. It may make sense
for ExxonMobil. Most LTO companies dont have cash. Most have a gob of debt. I dont think sinking cash
into wells that will generate $0 revenue for a year or two is a good idea, especially given the financial
shape LTO is in already. ..."
"... There is no sense in drilling but not completing wells, especially as they are spending borrowed
money. ..."
"... When any company in any industry runs cash flow negative, one of two things inevitably occurs
… they get better or they get gone. ..."
"... In the US unconventional field, the get gones are lining up at the exit doors with their list
of assets to sell to the get better, who are in the process of emerging from this downturn with a ferocious
degree of resilience that will shock many, especially the far off be-robed sheiks who will be fortunate
to not have their own heads lopped off as well as worldwide ideologues pining for an emergence of their
inner peasants (h/t to Fernando for that apt phrase). ..."
Their well, one of hundreds drilled by Anadarko Petroleum in eastern Colorado's Wattenberg
field this year, could someday gush as many as 800 barrels of crude oil a day. But Anadarko is
not planning to produce a drop of crude from the well for at least another year because the price
of oil is now so pitifully low.
The well here is just one of more than 4,000 drilled oil and natural gas wells across the country
producing nothing, but ready to be tapped quickly……….
But the incomplete wells are also another reason many analysts say a recovery in the oil price
is nowhere in sight. Together the well backlog could produce as many as 500,000 barrels of oil
a day, about the same amount of oil that Iran is expected to add to the glutted global market
after it complies with the recent nuclear deal by the end of next year.
Some analysts say oil companies like Anadarko, EOG Resources and Continental Resources may
collectively risk suffocating the very price revival they anticipate by releasing abundant new
supplies once prices inch up. Others say the eventual impact would be small and short-lived, but
since the industry has never used this strategy before, no one can be sure……….
On the completion side, fracking crews are easier to come by and their contracts tend to
be more fluid. Now those completion costs have also come down - meaning that the uncompleted wells
will eventually be brought on line at a lower cost, executives say.
If you have or can raise the cash, it makes sense to drill now and produce a year or two down
the road-IF you believe prices will be up. According to what I read here, the costs of drilling
a well may be down by a third, due to so many men and machines and so much steel and sand etc
, "looking for a home".
I don't know if this is "one third off" drilling sales event is totally for real, it might
be only a quarter or a fifth off. Hopefully somebody who crunches tight oil numbers will have
something to say about it.
Tight oil production brought on by drilling now and producing later is not going to noticeably
affect the price later.
Tight oil production brought on by drilling now and producing later is not going to noticeably
affect the price later.
By what logic did you arrive at that conclusion?
The article states: But the incomplete wells are also another reason many analysts say a
recovery in the oil price is nowhere in sight. Together the well backlog could produce as many
as 500,000 barrels of oil a day, …
Now I think an extra half a million barrels per day would noticeably affect the price.
A half a million barrels WOULD be enough to influence prices. An individual company does not
expect it's OWN production to influence the market price- unless maybe the company is a REALLY
big one maybe. If any given company drills say fifty such wells, that would be only twenty thousand
barrels a day, maybe less- most definitely not enough to move the market price needle.
It's not the industry as whole, but individual companies that make the decision.
What you say may make sense of you are using cash and have little to no debt. It may make
sense for ExxonMobil. Most LTO companies don't have cash. Most have a gob of debt. I don't think
sinking cash into wells that will generate $0 revenue for a year or two is a good idea, especially
given the financial shape LTO is in already.
Also, the entire premise is that there will soon be a steep rise in the price of oil. That
is a total crap shoot.
So they are strictly gambling that oil prices will rise steeply in the next couple years? Is
that a good business strategy for multi-billion dollar corporations to undertake, especially when
the futures market says otherwise?
Ask Harold Hamm how easy it is to predict the future price of oil.
Assuming 4,800 operated wells, by my math the average well is producing 23 barrels of oil and
112 mcf of gas per day, gross.
Assuming 25% royalty burden, and remembering the basis spread in CO for both oil and gas is
horrible, it looks like GROSS revenue per well at current price would be in the neighborhood of
$200K per year.
I keep begging, and will again. Someone come on here and explain how drilling, but not completing
13,000′ horizontal wells that won't cum. 100,000 BO in 40 years makes one lick of sense?
When any company in any industry runs cash flow negative, one of two things inevitably
occurs … they get better or they get gone.
In the US unconventional field, the 'get gones' are lining up at the exit doors with their
list of assets to sell to the 'get better', who are in the process of emerging from this downturn
with a ferocious degree of resilience that will shock many, especially the far off be-robed sheiks
who will be fortunate to not have their own heads lopped off as well as worldwide ideologues pining
for an emergence of their 'inner peasants' (h/t to Fernando for that apt phrase).
As for future reserves, see my response below to shallow re the Riverview well, and apply the
principal to hydrocarbon bearing shales and 'tight rocks' on a global scale.
"... EIA expects U.S. crude oil production to decline steadily from 9.2 million b/d in December 2015, reaching about 8.5 million b/d in November 2016. ..."
"... The new full-year estimate for 2015 is 9.43 mb/d ..."
"... Productivity improvements, lower breakeven costs, and anticipated oil price increases in the second half of 2017 are expected to end over two years of falling Lower 48 onshore production. ..."
"... Estimates of C+C production in the Gulf of Mexico have also been revised upward. The EIA now expects output there to increase from 1.3 mb/d in January 2014 to 1.93mb/d in December 2017. The numbers for Alaska are unchanged. ..."
EIA expects U.S. crude oil production to decline steadily from 9.2 million b/d in December
2015, reaching about 8.5 million b/d in November 2016. Production is expected to stay near 8.5
million b/d for most of 2017. This level of production would be 1.2 million b/d below the April 2015
level, which was the highest monthly production since April 1971.
Late in the forecast period EIA expects small sales from the U.S. Strategic Petroleum Reserve
(SPR). Recent legislation
authorized sales of SPR oil between Fiscal Years (FY) 2018-25 for deficit reduction, SPR modernization,
and highway funding purposes. EIA assumes 5 million barrels of SPR sales for deficit reduction purposes
in FY 2018 (which starts in October 2017), equivalent to 14,000 b/d of SPR draws during the fourth
quarter of 2017. EIA further assumes no SPR sales occur for SPR modernization during the forecast
period.
The Short-Term Energy Outlook released on January 12, which is the first STEO to include projections
for 2017, forecasts Brent crude oil prices will average $40 per barrel (b) in 2016 and $50/b in
2017. West Texas Intermediate (WTI) crude oil prices are expected to be $2/b lower than Brent
in 2016 and $3/b lower than Brent in 2017.
Crude oil prices are expected to remain low as supply continues to outpace demand in 2016 and
more crude oil is placed into storage. EIA estimates that global oil inventories increased by
1.9 million b/d in 2015, marking the second consecutive year of inventory builds. Inventories
are forecast to rise by an additional 0.7 million b/d in 2016, before the global oil market becomes
relatively balanced in 2017. The first forecasted draw on global oil inventories is expected in
the third quarter of 2017, marking the end of 15 consecutive quarters of inventory builds.
EIA expects non-OPEC production to decline by 0.6 million b/d in 2016, which would be the first
decline in non-OPEC production since 2008. About two-thirds of this forecasted decline in 2016
comes from the United States.
OPEC crude oil production is forecast to increase by 0.5 million b/d in 2016, with Iran accounting
for most of that increase. Iran is expected to increase its production once international sanctions
targeting its oil sector are suspended. Although uncertainty remains as to the timing of sanctions
relief, EIA assumes this occurs in the first quarter of 2016.
EIA expects global consumption of petroleum and other liquid fuels to grow by 1.4 million b/d
in both 2016 and 2017. Forecast real gross domestic product (GDP) for the world, weighted by oil
consumption, which increased by an estimated 2.4% in 2015, rises by 2.7% in 2016 and by 3.2% in
2017.
Note that the EIA data (similarly to the IEA and OPEC) shows that the imbalance between global
supply and demand has peaked in the second quarter of 2015 and has been declining since then.
The problem is that supply still outpaces demand until the second half of 2017, meaning that global
inventory levels will continue to increase, putting additional pressure on prices.
Several months ago the EIA was forecasting that the balance between global demand and supply would
be reached by 3Q16, a year earlier. As demand projections have not changed, the longer than previously
expected period of oversupply reflects the resilience on the supply-side.
In any case, I do agree with the EIA that we are facing two more years of low oil prices, but
prices should start to improve by the end of 2017
The EIA has significantly revised upwards its estimate of U.S. C+C output in 2015 and the first
half of 2016, but has made downward revisions for 2H16.
The January STEO also for the first time includes U.S. C+C output projections for 2017.
Upward revision for 2015-1H16 mainly reflect higher estimates for Lower 48 excl GoM. The biggest
revisions in monthly numbers are for February 2016: + 174 kb/d; January 2016: 170 kb/d; and November
2015: 153 kb/d
From the report:
"According to the latest survey-based reporting of monthly crude oil production data, U.S.
production averaged 9.5 million b/d through the first 10 months of 2015, about 0.2 million
b/d higher than in the fourth quarter of 2014. The estimates include EIA survey-based monthly
crude oil production data for Oklahoma for the first time. These new estimates are roughly
0.1 million b/d per month higher than those generated by the previous methodology for Oklahoma,
which was based on state-reported data that was later adjusted by EIA. The recently expanded
EIA-914 survey now collects oil production from the largest oil producers in 15 states (including
Oklahoma) and the federal Gulf of Mexico."
The new full-year estimate for 2015 is 9.43 mb/d vs. 9.33mb/d in December 2015 STEO.
The EIA has been increasing its estimate for the U.S. C+C output in 2015 since September 2015
STEO, when the forecast was 9.22 mb/d. In other words, the estimate was increased by 210 kb/d,
despite much lower than previously expected oil prices.
According to the EIA,
"U.S. production began falling in May 2015, led by Lower 48 onshore production that has fallen
nearly 0.5 million b/d [by October]. These declines have been tempered by production growth of
0.1 million b/d in the Gulf of Mexico since April."
"With WTI prices falling below $40/b in December 2015 and projected to remain below that
level through mid-2016, EIA expects oil production to decline in most Lower 48 onshore oil
production regions. The expectation of reduced cash flows in 2016 and 2017 has prompted many
companies to scale back investment programs, deferring major new undertakings until a sustained
price recovery occurs. The prospect of higher interest rates and tougher lending conditions
will likely limit the availability of capital for many smaller producers, giving rise to distressed
asset sales and consolidation of acreage holdings by more financially sound firms. The retrenchment
in onshore investment is anticipated to push the count of oil-directed rigs and well completions
in 2016 and 2017 below current levels.
The focus of drilling and production activities will be on the core areas of major tight
oil plays. Despite the significant decline in total rig counts in 2015, rig counts have largely
stabilized in the core counties of the Bakken, Eagle Ford, Niobrara, and Permian. In these
areas, falling costs and ongoing technological and process improvements in rig, labor, and
well productivity are anticipated to lead to faster rates of well completions and less-rapid
production declines relative to other Lower 48 onshore areas. The ongoing gains in learning-by-doing,
cost reductions, and rig and well productivity are expected to enhance the economic viability
of these areas as well as to be disseminated to other regions, incrementally reducing the breakeven
costs of production in more marginal areas.
EIA expects U.S. crude oil production to decline steadily from 9.2 million b/d in December
2015, reaching about 8.5 million b/d in November 2016. Production is expected to stay near
8.5 million b/d for most of 2017. This level of production would be 1.2 million b/d below the
April 2015 level, which was the highest monthly production since April 1971."
U.S. C+C output (mb/d): STEO January 2016 vs. December 2015
"Productivity improvements, lower breakeven costs, and anticipated oil price increases
in the second half of 2017 are expected to end over two years of falling Lower 48 onshore production.
Onshore production averaged 7.6 million b/d in the second quarter of 2015, and it is forecast
to fall below 6.2 million b/d in September 2017 before increasing modestly in the fourth quarter
of 2017. The forecast remains sensitive to actual wellhead prices and rapidly changing drilling
economics that vary across regions and operators."
Lower 48 ex GoM C+C output (mb/d): STEO January 2016 vs. December 2015
Estimates of C+C production in the Gulf of Mexico have also been revised upward. The EIA now
expects output there to increase from 1.3 mb/d in January 2014 to 1.93mb/d in December 2017. The
numbers for Alaska are unchanged.
From the report:
"Projected crude oil production in the Gulf of Mexico rises during the forecast period,
and oil production in Alaska falls. Production in these areas is less sensitive than onshore
production in the Lower 48 states to short-term price movements and reflects anticipated growth
from new projects in the Gulf of Mexico and declines from legacy fields in Alaska. Several
projects in the Gulf that came or will come online in 2014-16 will push up production from
an average of 1.6 million b/d in 2015 to 1.9 million b/d in the fourth quarter of 2017. It
is possible some projects will start production later than expected, potentially shifting some
of the anticipated production gains from late 2017 into early 2018."
C+C production in the GoM: STEO January 2016 vs. December 2015
Interesting, they claim same fall in USA production, average, for 2016 even if they cut price
forecast much more and that previous forecasts price spike in second half of 2016 was reason for
jump in production in second half 2016 in previous reports.
The reason might be export of processed by refineries products. So some oil enters the USA
purely for processing and the products are shipped back.
From the other point of view it looks like you are a perfectionist, aren't you ?
This is just another government agency. Mixture of Bureau of Economic Analysis and a propaganda
outlet. Some of their data are based on sampling. The fact that they provide more then three meaningful
digits in their forecasts suggests that they are not very good in mathematics as accuracy of their
data might well be less then +-1%. Like the Department of State they do not need to be consistent
in their figures or opinions
For example their short term price forecast is based on futures (which means it is based on
opinions of gamblers).
The key issue in the current situation (as shallow sand pointed out) is that now there are
major producers which at this price level are underwater. So this can't last forever.
On the other hand as Keynes noted "The market can stay irrational longer than you can stay
solvent." and "There is nothing so disastrous as a rational investment policy in an irrational
world."
"... Gheit also sees equilibrium at around $60 per barrel, but said it could take more than two years to get there. ..."
"... Hamm said the bankruptcy narrative has been vastly overstated. It's a different situation than it was in the 1980s. Most of the companies out there [now] have long term money that's not coming due tomorrow, he said. They're able to ride this out. ..."
"We're in a predatory pricing environment. That's what's happened. ....
... ... ...
Over the next 12 months, Hamm expects oil prices to nearly double to around the $50 to $60 per
barrel range as output, at least in the U.S., abates. "The tipping point is getting back to
equilibrium with supply and demand. We see that happening in the back part of the year."
... ... ...
Oppenheimer analyst Fadel Gheit told CNBC on Monday that half of the American shale producers
could go bankrupt before crude eventually turns.
Gheit also sees equilibrium at around $60
per barrel, but said it could take more than two years to get there.
Hamm said the bankruptcy narrative has been vastly overstated. "It's a different situation
than it was in the 1980s. Most of the companies out there [now] have long term money that's not
coming due tomorrow," he said. "They're able to ride this out."
"A lot of bankruptcies were predicted early. They're just not happening. We have some of them
that have. The weaker companies are folding, maybe, but very few of them," he said.
"... Not sure about Russia, but the Middle East knows if they go all out and produce as much as they can they will just drive the oil price lower and reduce their profits. ..."
"... Lately OPEC seems to have forgotten this, but they must have other motives besides profits. If they were concerned about profits they would cut production as they have almost always done in the past (except when Saudi Arabia decides to punish other OPEC members (or the Soviet Union) by flooding the market and driving down the oil price. ..."
"... If the Saudi aim was to drive the high cost producers out of business, I think it has taken longer than they expected, now that they have chosen this road they may stubbornly stick to it until high cost producers go belly up and supply from non-OPEC decreases to the point that oil prices rise. ..."
"... This will be a valuable lesson to the rest of the World, that always assumed they could produce as much as they wanted and OPEC would cut back to keep oil prices high. ..."
"... The chart AlexS posted is a snapshot of current costs, it could be that these costs have increased as expensive projects have been started, but the chart is median cost rather than marginal cost. There may be some expensive fields in Russia and several OPEC countries that have come on line recently, but there are also older less expensive fields producing which brings the median cost lower for many countries. ..."
"... As regards Russia, most of the current upstream capex is also in lower-cost brownfield developments in Western Siberia and Volga-Urals regions. This includes infill drilling, development of satellite fields, previously undeveloped zones or deeper horizons of the old producing fields (such as Samotlor). There are also a number of new fields in these old regions. They are much smaller, but unit costs are not too high, as the necessary infrastructure, including roads and pipeline, is already in place. ..."
"... Costs in newly developed regions, such as Eastern Siberia, Timan Pechora, far north of Western Siberia (Yamal peninsula), Northern Caspian (shallow water fields), Far East (Sakhalin), are higher, sometimes much higher. But not prohibitively high even at current prices, as the key infrastructure, such as large pipelines (Eastern Siberia–Pacific Ocean oil pipeline), terminals ( Varandey on the Barents Sea), roads, etc. was already built during the years of high oil prices. ..."
"... Important to note that average unit costs in Russia were much lower than global average even before 2014, but they have significantly declined in dollar terms due to the depreciation of the ruble (see the chart below). ..."
"... Low oil prices have however significantly delayed high cost offshore Arctic and tight oil projects. ..."
"... The only producing offshore Arctic project is Prirazlomnoye oil field on the Pechora Sea shelf (developed by Gazpromneft). Rosneft has postponed further drilling in the Kara Sea and is now only exploring new blocks using 2D seismic. ..."
Rystad Energy recently released estimates for the total, all-in production cost for one barrel
of oil across major oil-producing countries.
According to Rystad, "this chart was compiled using data from more than 15,000 oil fields across
20 nations. The production costs were calculated by including a mix of capital expenditures and
operational expenditures. Capital expenditures included the costs involved with building oil facilities,
pipelines and new wells. Operational expenditures included the costs of lifting oil out of the
ground, paying employee salaries and general administrative duties."
Note that these numbers apparently do not include interest payments and taxes.
Furthermore, these are full-cycle costs rather than breakeven price, as Internal rate of return
(IRR) is not included.
Also note that these are median costs, which does not represent the whole picture, as there
are significant differences in production costs within each country.
In any case, the chart shows that at today's price of $31/barrel (Brent and WTI), most of oil
from the already producing fields can still be extracted profitably. There are, however, notable
exceptions, including U.S. stripper wells, several deepwater projects (incl. Brazil), some fields
in the North Sea, etc.
As regards new projects, they are already unprofitable in a number of countries, including the
U.S., Canada, U.K., Norway, Brazil, and West Africa.
Median Total Cost of Oil Production per Barrel
Source: Rystad Energy
I was wondering about these low full cycle costs in the Middle East & Russia.
During several years of high oil prices, why weren't more high-cost projects started in these
area's, like what happened in the US & Canada? If the costs are really as low as indicated in
your above chart, couldn't they have earned much more by starting slightly higher cost projects?
Is it that except these low-cost fields, there are not that many, even higher-cost, projects available?
Or is there less of a capitalistic spirit/access to financial markets?
To me it would make sense if everywhere around the world costs have increased to a much higher
level, given several years of high oil prices, reflecting the incentives to try to bring us much
oil to the market as long as costs are (significantly) lower than the price.
Effective oil price for Russian oil companies was always the same, around $30 per barrel. Everything
above was taxed. Some fields, especially in Eastern Siberia, were exempted from the tax, but there
aren't that many of them.
Enno: " reflecting the incentives to try to bring us much oil to the market as long as costs are
(significantly) lower than the price."
There are no incentives to bring as much oil to the market in the environment of high prices,
same as there are no incentives to bring less oil to the market in the low price environment like
today.
Not sure about Russia, but the Middle East knows if they go all out and produce as much as
they can they will just drive the oil price lower and reduce their profits.
Lately OPEC seems to have forgotten this, but they must have other motives besides profits.
If they were concerned about profits they would cut production as they have almost always done
in the past (except when Saudi Arabia decides to punish other OPEC members (or the Soviet Union)
by flooding the market and driving down the oil price.
If the Saudi aim was to drive the high cost producers out of business, I think it has taken
longer than they expected, now that they have chosen this road they may stubbornly stick to it
until high cost producers go belly up and supply from non-OPEC decreases to the point that oil
prices rise.
This will be a valuable lesson to the rest of the World, that always assumed they could produce
as much as they wanted and OPEC would cut back to keep oil prices high.
In the future non-OPEC producers will not be so sure that this is the case and may be a little
more careful about expanding output too quickly.
On re-reading you comment above, I think I see better what you are asking.
The chart AlexS posted is a snapshot of current costs, it could be that these costs have increased
as expensive projects have been started, but the chart is median cost rather than marginal cost.
There may be some expensive fields in Russia and several OPEC countries that have come on line
recently, but there are also older less expensive fields producing which brings the median cost
lower for many countries.
I guess average unit costs in the Middle East have risen at least twice over the past 10-15
years, reflecting input cost inflation in the global oil industry. But costs are still very low
as:
1) Most of the capex is in brownfields (infill drilling, water floods, etc.)
2) Most of the fields that start production now were actually discovered several decades ago,
so exploration costs are close to zero. These fields are located onshore and a few of them in
shallow waters. Geology is generally favorable. There is no ice, no winter cold, and high temperatures
are not a problem. The necessary infrastructure is already in place. The fields are huge, with
very high production per well and low decline rates. Therefore, average development costs are
also very low.
As regards Russia, most of the current upstream capex is also in lower-cost brownfield developments
in Western Siberia and Volga-Urals regions. This includes infill drilling, development of satellite
fields, previously undeveloped zones or deeper horizons of the old producing fields (such as Samotlor).
There are also a number of new fields in these old regions. They are much smaller, but unit costs
are not too high, as the necessary infrastructure, including roads and pipeline, is already in
place.
Costs in newly developed regions, such as Eastern Siberia, Timan Pechora, far north of Western
Siberia (Yamal peninsula), Northern Caspian (shallow water fields), Far East (Sakhalin), are higher,
sometimes much higher. But not prohibitively high even at current prices, as the key infrastructure,
such as large pipelines (Eastern Siberia–Pacific Ocean oil pipeline), terminals ( Varandey on
the Barents Sea), roads, etc. was already built during the years of high oil prices.
There are
a number of new projects at later stages of development, which will not be postponed or delayed
and are scheduled to begin production in 2016-18.
Important to note that average unit costs in Russia were much lower than global average even
before 2014, but they have significantly declined in dollar terms due to the depreciation of the
ruble (see the chart below).
The tax component of the costs was also significantly lowered thanks
to the Russia oil tax system.
Low oil prices have however significantly delayed high cost offshore Arctic and tight oil projects.
There is a significant dollar-denominated component in capex (imported equipment, services and
technologies), which is exacerbated by the effect of the sanctions.
The only producing offshore
Arctic project is Prirazlomnoye oil field on the Pechora Sea shelf (developed by Gazpromneft).
Rosneft has postponed further drilling in the Kara Sea and is now only exploring new blocks using
2D seismic.
Gazpromneft, Lukoil and others are still working on pilot projects in the Bazhenov
shale, but commercial development will not start before next decade.
Comparative lifting costs: Russian oils vs. global majors
2) Most of the fields that start production now were actually discovered several decades ago,
so exploration costs are close to zero.
Well that was true a few years ago, especially for Saudi Arabia. But I just don't believe that
is the case anymore. Perhaps there are some very small fields that didn't seem worth developing
back then. But I don't think there are any large, long ago discovered fields, that are still undeveloped.
"... The rig count continues to fall sharply in these plays and that will keep undermining the levels of shale production in months to come. ..."
"... The experts say that there are a million barrels per day of stripper well production that just isnt economic at todays prices but folks are reluctant to shut in the oil well in their back yard ..."
"... But for sure U.S. shale is declining, it is already down by 640,000 barrels per day from its peak in March 2015. It seems likely that these four regions will be producing about 4.1 to 4.2 million barrels per day by the end of year... ..."
...
The rig count continues to fall sharply in these plays and that will keep undermining
the levels of shale production in months to come.
...
The experts say that there
are a million barrels per day of stripper well production that just isn't economic at today's prices
but folks are reluctant to shut in the oil well in their back yard
and I suspect that will remain
sticky for a few months to come, and of course there should be some natural decline in these conventional
plays. Counterbalancing that trend there are a number of big offshore projects scheduled to start
up in the third and fourth quarters of 2016 so the "Other" line might actually rise.
But for
sure U.S. shale is declining, it is already down by 640,000 barrels per day from its peak in March
2015. It seems likely that these four regions will be producing about 4.1 to 4.2 million barrels
per day by the end of year...
Almost $400 billion dollars in oil-related debt. That's a lot --
Notable quotes:
"... The WSJ article has a chart showing the total long term debt for 134 publicly held oil companies in the US and Canada, as of late 2015: $353 billion, up from about $190 billion in 2010 (a 12%/year rate of increase). ..."
The WSJ article has a chart showing the total long term debt for 134 publicly held oil companies
in the US and Canada, as of late 2015: $353 billion, up from about $190 billion in 2010 (a 12%/year
rate of increase).
In December, the EIA predicted a decline of 116,000 barrels per day for shale
oil
production
at the key US oilfields.
The projected decline will not affect two regions out of seven, namely Permian and
Utica. The largest decline is expected in the Eagle Ford field in Texas, where oil
production is likely to decrease by 72,000 barrels per day.
Projected decline at Bakken and Niobrara oil fields are due to stand at 24,000 and
23,000 barrels per day, respectively.
"... Stubborn efforts by some countries to keep oil production at high levels are harming all oil producers. It is necessary to reach an agreement between countries-producers, withing the OPEC and other players outside the organization, ..."
"... Iraq was planning to cut oil production from 3.8 million barrels per day to 3.6 million in an attempt to prevent further price downfall as the country's oil revenues have diminished by 70 percent from $8 billion monthly to less than $3 billion due to the continuing global price drop. ..."
Assem Jihad, a spokesman for the Iraqi Oil Ministry, told Sputnik on Monday.
"
Stubborn efforts by some countries to keep oil production at high levels are harming all oil
producers. It is necessary to reach an agreement between countries-producers, withing the OPEC
and other players outside the organization,
" Jihad said.
The official added that
Iraq was planning to cut oil production from 3.8 million barrels
per day to 3.6 million in an attempt to prevent further price downfall as the country's oil
revenues have diminished by 70 percent from $8 billion monthly to less than $3 billion due to the
continuing global price drop.
The downward trend in global oil prices reflects severe financial problems in the global
economy that began nearly 10 years ago with the financial crisis in the US, American investor and
author Jim Rogers said.
... ... ...
"We're going to pay for the prices of the excesses of the past 8 or 10 years and everything is
going to go down more than it should. Whenever you have something go down, it usually overshoots
to the down side; just like when things go up they go up too much," Rogers told RT.
Cadawa Waller
I wouldn't buy a used car from Jimmy. The oil price 'crisis' is artificial. It's part of
the economic war against independent oil producing states at the behest of the US
corporatocracy with the help of their "off with his head' Saudi pals. It can be stopped in the
same way it was started. By market manipulation.
"... Eagle Ford crude oil production declines 30% year over year and will fall below 1 mill bbl/d by spring 2016 and by late summer 2016, production will be likely around 0.5 mill bbl/d. ..."
January EIA Drilling Report came out and confirms the steep decline of US shale production (see
below chart).
Eagle Ford crude oil production declines 30% year over year and will fall below
1 mill bbl/d by spring 2016 and by late summer 2016, production will be likely around 0.5 mill
bbl/d.
As legacy declines are still very steep in Eagle Ford and Bakken, shale oil production
is on track to be around 2 mill bbl/d lower by fall 2016.
This will finally pave the way
for a price recovery during the end of 2016.
"... In 2016, we expect Chinese oil demand to grow at a slower pace, of 300,000 barrels per day (3 percent) versus the estimated 510,000 barrels per day in 2015, reflecting the countrys economic slowdown, he concludes. ..."
"... From 2011 through 2014, implied year-over-year oil demand growth averaged 361,000 barrels per day, according to Mahesh. ..."
The moderation in China's economic expansion entails a decrease in the rate of-and sheer size
of-demand growth this year, according to Barclays.
"In 2016, we expect Chinese oil demand to grow at a slower pace, of 300,000 barrels per day (3
percent) versus the estimated 510,000 barrels per day in 2015, reflecting the country's economic
slowdown," he concludes.
From 2011 through 2014, implied year-over-year oil demand growth averaged 361,000 barrels per
day, according to Mahesh.
As Morgan Stanley sees crude falling to $20 per barrel on U.S. dollar appreciation, it's troubling
to imagine how bad things could get in the event that the magnitude of the slowdown in Chinese demand
growth is larger than Barclays anticipates.
"... I dont think there are a million additional barrels out of OPEC, Croft said. I think the Iranians
can maybe do 375,000 to 500,000, but I dont think OPEC is going to produce the type of gains we saw
last year. ..."
"... I think we could certainly in a bad macro headline crash through 30 into the 20s, Croft said,
referring to Goldmans prediction. But given that U.S. production is coming down, and demand has not
gone over the cliff yet, Croft said, I dont think so. ..."
With ever-increasing sectarian tensions in oil-producing countries, it may be hard to believe
that crude prices are continuing to fall. But look no further than the worldwide crude glut for the
reason, said Helima Croft, global head of commodity strategy at RBC Capital.
... ... ...
OPEC shows no sign of a slowdown in production overseas. But Croft said dialogue surrounding the
issue might be overblown.
"I don't think there are a million additional barrels out of OPEC," Croft said. "I think the
Iranians can maybe do 375,000 to 500,000, but I don't think OPEC is going to produce the type of
gains we saw last year."
... ... ...
"I think we could certainly in a bad macro headline crash through 30 into the 20s," Croft
said, referring to Goldman's prediction. But given that U.S. production is coming down, and demand
has not gone over the cliff yet, Croft said, "I don't think so."
"... Since the oil price plunge began in July 2014, every rally, every opportunity of a lifetime
to buy oil for cents on the dollar has turned out to be a falling knife. This is what the three trading-day,
15% crash of WTI looks like: ( See graph in Link ) ..."
"... What if Jeffrey is right, and the huge inventories are merely condensate. Wouldnt that be a
head fake? ..."
"... My opinion is that Jeffry is right. If so federal proration wont do anything but keep the shadow
bankers and the shale executive management in business. ..."
Where it ends is the 64 trillion dollar question. Indeed.. Down several % so far Today. We find
out if new WTI floor is 30… Last weeks old news:
"Since the oil price plunge began in July 2014, every rally, every "opportunity of a
lifetime" to buy oil "for cents on the dollar" has turned out to be a falling knife. This is
what the three trading-day, 15% crash of WTI looks like: ( See graph in Link ) "
My opinion is that Jeffry is right. If so federal proration won't do anything but keep
the shadow bankers and the shale executive management in business.
Kilduff is another trader and all the other Wall Street guys needs to take their lumps like
the rest of us. Where will this intervention start or stop? Remember "To Big To Fail"? Producers?
Drillers? Service Providers? Workers? Benefits will be doled out to those closest to influence.
Painful as this for all of us. Intervention will prevent the financial cleansing that I think
is necessary to clean this mess up. There will be all sorts of unintended consequences.
Let the chips fall where they may. The recovery will come sooner and cleaner.
"... demand was up by at least 1.8 million bpd in 2015 compared to a year earlier – supply has come in at more than 1 million bpd higher than forecast. This means the market will now only achieve a balance later than originally anticipated. ..."
"... An updated and detailed country by country analysis suggests nonOPEC oil production should fall by around 1 million bpd in 2016. ..."
"... Russian government officials have intimated that production there will at best flat line in 2016. With production in Azerbaijan and Kazakhstan expected to continue to decline, total FSU production should fall by at least 100,000 bpd. ..."
"... This ought to leave overall OPEC crude oil production higher by about 500,000 bpd. With OPEC NGL and condensate production expected to grow by 200,000 bpd, total global liquids supply should decline by about 300,000 bpd. ..."
"... However, our assumption of 1.3 million bpd growth for 2016 is already quite conservative – other forecasters are assuming higher growth rates. PIRA for example is currently forecasting growth at 1.9 million bpd for 2016. ..."
Last year wasn't much fun for anyone investing in commodities. Commodity indices fell to levels
last seen 15 years ago and that were initially breached over 25 years ago. An uncertain macro-economic
climate and a strengthening dollar provided strong headwinds which, combined with moderately oversupplied
markets, drove prices to multi-decade lows. We opined last month that it wasn't time to exit the
oil market even though there was a risk that in the short term prices could move lower. And move
lower they have.
... ... ...
No one knows exactly how much Iran will be able to increase its exports but if it is 500,000 bpd,
as the Iranians claim, then the earlier lifting of sanctions will add on average 125,000 bpd of additional
supply in 2016. There again, the latest reports from official Iranian news sources say Iran will
only add to supplies at a rate that the market can absorb without unduly impacting prices. In previous
letters we have argued that to correct a short term imbalance in the market, oil prices are being
pushed to a level that is unsustainable in the longer term.
... ... ...
While current prices are not sustainable, it is also apparent that the supply response to low
prices is taking longer than expected. Production in places like the U.S. GOM, the North Sea and
China has been boosted from projects coming to fruition that were initiated when oil was $100+. Production
gains were registered in all three of these regions during 2015. In Russia, oil producers have benefitted
from a depreciating ruble which has allowed them to meaningfully step up their drilling activity
and as a consequence grow production by about 1 percent.
In the U.S., producers were able to offset collapsing rig counts – down two thirds from their
October 2014 peak - by concentrating their activities in the most productive locations (the socalled
sweet spots). The brief price rally last spring also allowed some of the weaker U.S. producers to
raise fresh capital. So U.S. production, while no longer growing and down significantly from its
peak, is still at the level of a year ago. It wasn't only non-OPEC production that surprised to the
upside in 2015: OPEC production registered an unexpected and sizeable increase due largely to a surge
in exports from Iraq as infrastructure bottlenecks there were eliminated. Saudi Arabia also pushed
its production to record levels. So while the demand response to lower prices was in line with expectations
–
demand was up by at least 1.8 million bpd in 2015 compared to a year earlier – supply has come
in at more than 1 million bpd higher than forecast. This means the market will now only achieve a
balance later than originally anticipated.
That said, things are clearly moving in the right direction. At the beginning of 2015, non-OPEC
oil production was growing at over 2.5 million bpd year-over-year. By the end of 2015, that rate
had most likely fallen to zero based on current estimates. Production from OPEC is very unlikely
to show the growth it achieved in 2015. Saudi Arabian production is close to its practical limit.
Iraq will have difficulty maintaining its current record production levels: the cash-strapped Iraqi
government has given instructions to its IOC partners to cut back drilling as it cannot afford to
see revenues diminished by cash flows being diverted to investment.
An updated and detailed country by country analysis suggests nonOPEC oil production should
fall by around 1 million bpd in 2016.
Crude oil production in the U.S. is expected to lead the
decline as rig counts continue to fall and further gains in rig efficiency become harder to achieve.
Growth in Canadian production is expected to be offset by continuing declines in Mexico.
Overall, liquid hydrocarbon supply in North America should fall by 500-600,000 bpd in 2016. In
Latin America, (lower) growth in Brazil is expected to be largely offset by declines in Colombia.
Europe should see production decline by a little over 100,000 bpd as the pipeline of legacy projects
there runs off and maintenance deferred from 2015 impacts production in 2016.
Russian government officials have intimated that production there will at best flat line in
2016. With production in Azerbaijan and Kazakhstan expected to continue to decline, total FSU production
should fall by at least 100,000 bpd.
China, which also benefitted from the startup of legacy
offshore projects in 2015, is expected to see its production drop by 100,000 bpd in 2016. The state
oil production companies are expected to slash investment in high- cost, mature onshore oilfields
that have very high decline rates which will result in accelerating production declines. Production
is also expected to decline in India, Malaysia and Vietnam. As mentioned earlier, while OPEC production
will rise somewhat, it is unlikely to show the sort of growth seen this year. The biggest element
will come from Iran, with smaller increments from core- GCC members generally offsetting declines
elsewhere.
This ought to leave overall OPEC crude oil production higher by about 500,000 bpd.
With OPEC NGL and condensate production expected to grow by 200,000 bpd, total global liquids supply
should decline by about 300,000 bpd.
... ... ...
Finally, there is the risk that a slowing global economy would also slow the rebalancing process
by reducing growth in demand for oil.
However, our assumption of 1.3 million bpd growth for 2016
is already quite conservative – other forecasters are assuming higher growth rates. PIRA for example
is currently forecasting growth at 1.9 million bpd for 2016.
The moderation in China's economic expansion entails a decrease in the rate of-and sheer size
of-demand growth this year, according to Barclays.
"In 2016, we expect Chinese oil demand to grow at a slower pace, of 300,000 barrels per day (3
percent) versus the estimated 510,000 barrels per day in 2015, reflecting the country's economic
slowdown," he concludes.
From 2011 through 2014, implied year-over-year oil demand growth averaged 361,000 barrels per
day, according to Mahesh.
As Morgan Stanley sees crude falling to $20 per barrel on U.S. dollar appreciation, it's troubling
to imagine how bad things could get in the event that the magnitude of the slowdown in Chinese demand
growth is larger than Barclays anticipates.
"... Oil prices continue to be volatile - buffeted by opposing forces, he wrote. On the one hand there is a growing realization that current prices are not sustainable. But on the other there is the reality of high and - for now at least - still growing inventories. ..."
"... Todays oil price, however, carries no risk premium, Hall wrote. The oil industry is positioning itself for a world of lower for longer oil prices. Barely more than a year ago these same companies were, implicitly or explicitly, basing their investment decisions on $100 oil being the new normal. ..."
Astenbeck is now down 18 percent through October, after losses in six out of 10 months, the data
showed. Assets under management were at $2.6 billion, versus nearly $3 billion in January.
In a
letter accompanying the performance data, Hall alluded to market concerns about the oversupply in
oil.
"Oil prices continue to be volatile - buffeted by opposing forces," he wrote. "On the one hand
there is a growing realization that current prices are not sustainable. But on the other there is
the reality of high and - for now at least - still growing inventories."
U.S. crude inventories rose last week for the sixth consecutive week, the government said on Wednesday,
despite imports dropping to 1991 lows.
Hall argued that the stockpile situation would not last.
He called oil bears "Cassandras" whose pessimistic outlook suggests that stocks of distillates
including diesel would outgrow storage capacity, causing refineries to reduce processing and prices
to collapse.
"We think such a scenario is highly unlikely," Hall wrote. "Whilst localized dislocations are
certainly possible, there is no general shortage of storage capacity globally for either crude oil
or oil products."
He said stockpiles will drop as U.S. refineries ramp up production of gasoline, diesel and other
products after the autumn maintenance season, and added that U.S. crude production was also declining.
U.S. oil drillers have cut rigs for nine weeks in a row, with the rig count at 578 from 1,582
a year ago, data showed.
"Today's oil price, however, carries no risk premium," Hall wrote. "The oil industry is positioning
itself for a world of 'lower for longer' oil prices. Barely more than a year ago these same companies
were, implicitly or explicitly, basing their investment decisions on $100 oil being the new normal."
U.S. crude settled on $46.32 a barrel, versus $77.19 from a year ago and the July 2014 high of
$107. (Writing by Josephine Mason; Editing by Chizu Nomiyama and David Gregorio)
"... Year to date demand in the U.S. is up over 600 thousand bpd or 3.4 percent. ..."
"... Iran will not be able to increase its production by much more than 500 thousand bpd without substantial investment and the involvement of the international oil companies. That will not happen quickly. Also, the risk that the oil Iran currently has in floating storage will flood the market is being overstated. In all there are about 30 million barrels but the majority of this is highly corrosive condensate produced in association with natural gas from the South Pars field. This condensate was not covered by the current sanctions regime. The reason this oil is in floating storage is because Iran has been unable to sell it since its principal customer – Dragon Aromatics in China – suffered a plant failure in April. Moreover construction of a new refinery in Iran designed specifically to run this condensate has been delayed just as additional production from a new stage of South Pars came on stream. ..."
"... As to Iraq, it is true that its production has reached record levels in recent months. But given the fall in capex there and the dramatic drop in rig counts in Iraq – down 45 percent since last summer – it is difficult to see how further growth in production can be sustained. ..."
That perception is colored by the IEA's most recent Oil Market Report (OMR) which estimates that
global oil supply in (12 2015 exceeded demand by a staggering 3.3 million bpd. For 2015 the IEA is
effectively predicting a surplus of supply over demand averaging more than 2 million bpd that continues
through 2015 and 2016. The nearby chart shows the IEA's implicit forecast of the cumulative supply
excess since the end of 2014. Its supply and demand balance is much more negative than the others
we look at.
However, the IEA forecast is the one used by most oil analysts on Wall Street as the basis for
their own forecasts. For that reason the consensus view is now extremely bearish.
The latest data from the IEA is difficult to reconcile with what has actually been happening in
the oil market however. If there had been a 3.3 million bpd surplus in OZ the contango would have
exploded as oil would need to price itself to make it economic to carry in ever scarcer and therefore
costlier storage. That did not happen. In fact the contrary was the case – contango narrowed for
Brent and WTI and the Dubai market moved from contango into backwardation by the end of 02. This
is not suggestive of a growing crude oil surplus.
Even more striking is the absence of an increase in observable inventories anywhere close to that
suggested by the IEA's supply/demand balance for OZ. Preliminary estimates show that OECD onshore
inventories of oil built by a little over 700 thousand bpd last quarter. Inventories (government
plus commercial) in China are estimated to have risen by about 400 thousand bpd. Oil in floating
storage rose by about 600 thousand bpd. That all adds up to about 1.7 million bpd leaving 1.6 million
bpd of oil unaccounted for. Where could it be? Oil in floating storage is monitored ship by ship
in real time and data are available for most commercial entrepot facilities. It is hard to believe
that over 140 million barrels of oil could go unobserved.
Explanation of the missing barrels
The more likely explanation for these missing barrels is that the current surplus is not nearly
as big as the IEA is estimating. In the July OMR the IEA was still showing a balancing item for unaccounted
oil of 1.4 million bpd for Q4 of 2014 and 900 thousand bpd for the first quarter of this year (they
have yet to analyze the Q2 balance).
Historically, large balancing items are revised away by changes to initial estimates of demand.
Since 2009, on average the IEA has revised its initial estimate of actual quarterly demand upwards
by over 500 thousand bpd over the ensuing two to three years. On four occasions the cumulative revision
to estimated – not forecast demand has been 1 million bpd or more.
It would hardly be surprising therefore if the IEA were to revise higher its initial estimate
of Q2 2015 oil demand (and make further revisions to C11 2015 and Q4 2014). This would of course
reduce the apparent ongoing surplus. High frequency data certainly supports the notion of above trend
demand growth this year following the dramatic drop in prices in the latter part of 2014.
Year
to date demand in the U.S. is up over 600 thousand bpd or 3.4 percent.
The latest four week
average is up 1 million bpd or 5.7 percent. Lower prices together with more people working translates
into more demand for oil. Europe will see growth in demand for oil in 2015 for the first time in
years. Demand growth in China during H1 was higher year over year by almost 500 thousand bpd, or
nearly 5 percent. Demand was particularly strong in June which should assuage concerns regarding
the impact of the recent swoon of the stock market there.
It is not only on the demand side of the equation that we can question the scale of the apparent
oil surplus predicted by the IEA. Compared to other credible forecasts, the IEA supply forecast for
2015 for NGLs produced by OPEC is higher by about 500 thousand bpd. OPEC NGL production is a notoriously
difficult number to gauge accurately. Moreover it should be largely irrelevant to a discussion of
crude oil prices as NGLs cannot be processed in oil refineries.
Falling crude oil inventories
Crude oil inventories have already started to fall. Unsold West African oil that was floating
on tankers until June has now been sold to refiners. Crude oil inventories in the Atlantic Basin
– the epicenter of the global oil excess – have fallen 55 million barrels from their peak at the
end of April. Based on the balances we look at, crude oil inventories should on average fall over
the rest of the year – albeit with a hiatus during the fall turnaround season in October.*
But these green shoots have been trampled down by concern that Iran will now add to the glut of
oil and that it will take much longer for the market to balance. These fears have been compounded
by reports that Iraq and Saudi Arabia are setting new production records.
There is no question that the core OPEC producers in the Middle East are producing oil at historically
high rates. But let's examine this more closely.
First Iran: virtually all serious analyses suggest that sanctions on oil exports will not be lifted
until sometime in 2016. Moreover these analyses indicate that
Iran will not be able to increase
its production by much more than 500 thousand bpd without substantial investment and the involvement
of the international oil companies. That will not happen quickly. Also, the risk that the oil Iran
currently has in floating storage will flood the market is being overstated. In all there are about
30 million barrels but the majority of this is highly corrosive condensate produced in association
with natural gas from the South Pars field. This condensate was not covered by the current sanctions
regime. The reason this oil is in floating storage is because Iran has been unable to sell it since
its principal customer – Dragon Aromatics in China – suffered a plant failure in April. Moreover
construction of a new refinery in Iran designed specifically to run this condensate has been delayed
just as additional production from a new stage of South Pars came on stream.
As to Iraq, it is true that its production has reached record levels in recent months. But
given the fall in capex there and the dramatic drop in rig counts in Iraq – down 45 percent since
last summer – it is difficult to see how further growth in production can be sustained.
Rather,
there is a significant downside risk to Iraqi production given the persistent threat from ISIS and
disaffection among the population over chronic electricity shortages. Renewed antagonism between
Baghdad and the KRG threatens exports from the north as does sabotage of the Kirkuk-Ceyhan pipeline.
"... non-fundamental factors, such as the USD, are arguably more important price drivers. ..."
"... We continue to believe that the shorter term headwinds are ultimately trumped by the longer
term outlook for prices which remains firmly to the upside: an industry that couldnt function at $50
certainly cant function with prices below $40. ..."
"... Andy Halls reasoning is absolutely spot on. But the market is irrational and it will stay irrational
no matter how much Andy reasons with it. It looks like the crude pendulum is not going to swing back
until it has utterly exhausted every last drop of the surplus. ..."
"... The supply build that gets discussed a lot is a supply-demand imbalance. And all the big boys
(Russia, SA, and soon Iran) are dumping as much oil on the market as they can for revenues. Even if
supply does taper off, if demand continues to fall faster than supply, it is going to get worse regardless.
..."
"... Oil seems to be the only thing they have. Why would they stir up trouble knowing it will further
deplete their money, or are they taking it from all sides and just being reactionary? Are they fighting
because the opponents are trying to rid themselves of the petrodollar, and by extension U.S. hegemony?
..."
Another algo-induced stop-run has tried and failed to maintain its gains this morning as Morgan
Stanley becomes the latest (after Goldman) to join the "oil in the $20s is possible" bandwagon. Despite
hopeful bullishness from Andy Hall who sees production destruction leading (an industry that couldn't
function at $50 certainly can't function with prices below $40) inevitably leading to higher prices,
Morgan Stanley warns, "in an oversupplied market, there is no intrinsic value for crude oil. The
only guide posts are that the ceiling is set by producer hedging while the floor is set by investor
and consumer appetite to buy. As a result, non-fundamental factors, such as the USD, are arguably
more important price drivers."
... ... ...
Finally we leave it to perennial crude bull Andy Hall (whose fund lost 35% in 2015) to explain
where it all went wrong:
We continue to believe that the shorter term headwinds are ultimately trumped by the longer
term outlook for prices which remains firmly to the upside: an industry that couldn't function
at $50 certainly can't function with prices below $40.
LawsofPhysics
price manipulation in the war against Russia and other energy-dependent economies. there will
be consequences.
Occident Mortal
Andy Hall's reasoning is absolutely spot on. But the market is irrational and it will stay
irrational no matter how much Andy reasons with it. It looks like the crude pendulum is not going
to swing back until it has utterly exhausted every last drop of the surplus. When the crude
oil market eventually tightens thanks to the capex hiatus, it will take the entire global economy
with it.
CrazyCooter
How much of the price action over the last year is manipulation versus demand destruction?
The most recent BP Stats study (2015 with 2014 data) has a very high level global demand and
production chart that shows really significant demand growth in China over the past years, where
aggregates like Europe are actually demanding LESS oil than they did in 89.
I think the rampant investment in gross amounts of overcapacity in China is evident to all
- and global supply raced to keep up (e.g. US Fracking) - and now that deflation is being exported
from China and impacting oil demand in China as well as her trading partners.
The supply build that gets discussed a lot is a supply-demand imbalance. And all the big
boys (Russia, SA, and soon Iran) are dumping as much oil on the market as they can for revenues.
Even if supply does taper off, if demand continues to fall faster than supply, it is going to
get worse regardless.
This is what I was thinking was driving prices.
Do appreciate your comments and insignt.
Regards,
Cooter
Jack Buster
Mr McCormick. ..good thoughts. I have a couple questions, yes from a newbe. Btw, for all you
newbe haters, the more you educate us, the more we'll be prepared. Therefore, the less unprepared
assholes to riot and cause mayhem.
I thought Saud was was cash strapped. Therefore they will sell anything they can, for any amount
they can get. Oil seems to be the only thing they have. Why would they stir up trouble knowing
it will further deplete their money, or are they taking it from all sides and just being reactionary?
Are they fighting because the opponents are trying to rid themselves of the petrodollar, and by
extension U.S. hegemony?
Why hasn't Russia tightened supply to countries backing saud?
gizmotron
All good questions, Jack Buster. There is no consensus answer, just a lot of speculation. I'm
still convinced that Saudi is over supplying to hurt shale/sand/polar/deep-water/LNG/electro-vehicles,
and will continue over supplying until a significant number of alternative plays are shuttered.
When that happens, look for supply to decrease, and oil to spike well over trend, perhaps into
the $100-150 range, for a good long period. Huge profits for Saudi, until they stablize supply
again. That's the only way I can figure the Saudi's will recoup all their ongoing losses during
their over-supply period.
Step-by-step Russia, China and other emerging economies are taking measures to reduce their
dependence on the US dollar, F. William Engdahl notes, referring to Russia's crude oil benchmark
initiative; the move could deal a dramatic blow to the "petrodollar's" dominance.
The payment agreement needs amendment as tax exemption is contingent on the pact notified by
the Centre in January 2012 which allows only 45% of oil payments in rupees. Ditching the dollar,
Iran and India have agreed to settle all outstanding crude oil dues in rupees in preparation to
future trade in their national currencies. The dollar dues - $6.5 billion equaling 55% of oil
payment - would be deposited in National Iranian Oil Co account with Indian banks.
"... Oilprice.com looked beyond the headlines for the reason behind the oil price drop, and found that the explanation, while difficult to prove, may revolve around control of oil and gas in the Middle East and the weakening of Russia, Iran and Syria by flooding the market with cheap oil. ..."
"... in 1990, when the Saudis sent prices plummeting as a way of taking out Russia, which was seen as a threat to their oil supremacy. In 1998, they succeeded. When the oil price was halved from $25 to $12, Russia defaulted on its debt. ..."
"... Adding credence to this theory, Iranian President Hassan Rouhani told a Cabinet meeting earlier this month that the fall in oil prices was "politically motivated" and a "conspiracy against the interests of the region, the Muslim people and the Muslim world." ..."
The oil price drop that has dominated the headlines in recent weeks has been framed almost exclusively
in terms of oil market economics, with most media outlets blaming Saudi Arabia, through its OPEC
Trojan horse, for driving down the price, thus causing serious damage to the world's major oil exporters
– most notably Russia.
While the market explanation is partially true, it is simplistic, and fails
to address key geopolitical pressure points in the Middle East.
Oilprice.com
looked beyond the headlines for
the reason behind the oil price drop, and found that the explanation, while difficult to prove, may
revolve around control of oil and gas in the Middle East and the weakening of Russia, Iran and Syria
by flooding the market with cheap oil.
The oil weapon
We don't have to look too far back in history to see Saudi Arabia, the world's largest oil exporter
and producer, using the oil price to achieve its foreign policy objectives. In 1973, Egyptian President
Anwar Sadat convinced Saudi King Faisal to cut production and raise prices, then to go as far as
embargoing oil exports, all with the goal of punishing the United States for supporting Israel against
the Arab states. It worked. The "oil price shock" quadrupled prices.
It happened again in 1986, when Saudi Arabia-led OPEC allowed prices to drop precipitously, and
then
in 1990, when the Saudis sent prices plummeting as a way of taking out Russia, which was seen
as a threat to their oil supremacy. In 1998, they succeeded. When the oil price was halved from $25
to $12, Russia defaulted on its debt.
The Saudis and other OPEC members have, of course, used the oil price for the obverse effect,
that is, suppressing production to keep prices artificially high and member states swimming in "petrodollars".
In 2008, oil peaked at $147 a barrel.
Turning to the current price drop, the Saudis and OPEC have a vested interest in taking out higher-cost
competitors, such as US shale oil producers, who will certainly be hurt by the lower price. Even
before the price drop, the Saudis were selling their oil to China at a discount. OPEC's refusal on
Nov. 27 to cut production seemed like the baldest evidence yet that the oil price drop was really
an oil price war between Saudi Arabia and the US.
However, analysis shows the reasoning is complex, and may go beyond simply taking down the price
to gain back lost marketshare.
"What is the reason for the United States and some U.S. allies wanting to drive down the price
of oil?" Venezuelan President Nicolas Maduro asked rhetorically in October. "To harm Russia."
Many believe the oil price plunge is the result of deliberate and well-planned collusion on the
part of the United States and Saudi Arabia to punish Russia and Iran for supporting the murderous
Assad regime in Syria.
Punishing Assad and friends
Proponents of this theory point to a Sept. 11 meeting between US Secretary of State John Kerry
and Saudi King Abdullah at his palace on the Red Sea. According to
an article
in the Wall Street Journal, it was during that meeting that a deal was hammered out
between Kerry and Abdullah. In it, the Saudis would support Syrian airstrikes against Islamic State
(ISIS), in exchange for Washington backing the Saudis in toppling Assad.
If in fact a deal was struck, it would make sense, considering the long-simmering rivalry between
Saudi Arabia and its chief rival in the region: Iran. By opposing Syria, Abdullah grabs the opportunity
to strike a blow against Iran, which he sees as a powerful regional rival due to its nuclear ambitions,
its support for militant groups Hamas and Hezbollah, and its alliance with Syria, which it provides
with weapons and funding. The two nations are also divided by religion, with the majority of Saudis
following the Sunni version of Islam, and most Iranians considering themselves Shi'ites.
"The conflict is now a full-blown proxy war between Iran and Saudi Arabia, which is playing out
across the region," Reuters
reported
on Dec. 15. "Both sides increasingly see their rivalry as a winner-take-all conflict:
if the Shi'ite Hezbollah gains an upper hand in Lebanon, then the Sunnis of Lebanon-and by extension,
their Saudi patrons-lose a round to Iran. If a Shi'ite-led government solidifies its control of Iraq,
then Iran will have won another round."
The Saudis know the Iranians are vulnerable on the oil price. Experts say the country needs $140
a barrel oil to balance its budget; at sub-$60 prices, the Saudis succeed in pressuring Iran's supreme
leader, Ayatollah Ali Khamanei, possibly containing its nuclear ambitions and making the country
more pliable to the West, which has the power to reduce or lift sanctions if Iran cooperates.
Adding credence to this theory, Iranian President Hassan Rouhani told a Cabinet meeting earlier
this month that the fall in oil prices was "politically motivated" and a "conspiracy against the
interests of the region, the Muslim people and the Muslim world."
As oil prices fall, and refinery capacity stays strong, the price of gas could reach $1 a gallon
in some areas, a level last reached in 1999. As a matter of fact, the entire states of Alabama, Arkansas,
Missouri, Oklahoma and South Caroline have gas prices that average at or below $1.75.
"... I think energy has gotten oversold, Lasry says. Theres going to be a huge turnaround on energy, so whether oil stays where it is or starts moving up, the real question is: is it in the next 3 monthts, 6 months or a year? ..."
"... And with regard to the pressure weve seen in the energy markets? Its a huge opportunity in the energy sector, Lasry says. Chinas not as big a factor as everyone likes to make it out to be. ..."
But Marc Lasry, co-founder and CEO of Avenue Capital Group, a hedge fund with just under $13 billion
assets under management, sees opportunity.
"I think energy has gotten oversold," Lasry says. "There's going to be a huge turnaround on energy,
so whether oil stays where it is or starts moving up, the real question is: is it in the next 3 monthts,
6 months or a year?"
Lasry is putting this thesis to work as a participant in an annual stock selection competition,
Portfolios with Purpose, where participants compete on behalf on their favorite charities. This year's
competition kicks off on Jan. 18. Three groups compete in this fantasy-football-style stock contest
with 5 stock choices -- a Novice Class, a Professional Class and an invite-only Master Class, that
includes Lasry along with Appaloosa Management's David Tepper, Greenlight Capital's David Einhorn,
and Pershing Square Capital's Bill Ackman.
And with regard to the pressure we've seen in the energy markets? "It's a huge opportunity
in the energy sector," Lasry says. "China's not as big a factor as everyone likes to make it out
to be."
His picks for the contest are centered around independent power producers he believes have already
gotten hit pretty hard -- Chesapeake Energy (CHK), Dynegy (DYN), and Calpine (CPN). Lasry also sees
upside for Macy's (M) and American Airlines (AAL) this year.
"... I personally think it would be fair nowadays, between $60 and $80 per barrel. ..."
"... I think we are in the middle of a price problem, whether you call it a war or any other way. Theres a huge problem for the future, for the safe supply of the globe. ..."
"... we have to see the growing population of the world. In total, there is a growth in the oil demand. Of course, there are regions where the oil demand is even stagnating or a little bit decreasing because of the efficiency increase in using of oil. So, globally seen, the oil requirement will increase, basically because of the population growth. ..."
"... My opinion is it will be continued growth in renewables in the energy mix. ..."
SS: So, I guess the experts weren't too far off, predicting some $170 and others $20…
JT:
Yes, but this predictions may be based on different elements, which may be
speculative, may be other reasons...Definitely, to answer your question,
I personally think it
would be fair nowadays, between $60 and $80 per barrel.
SS: And then you have China, which has been buying record amounts of oil lately and, you know,
briefly becoming the world's top importer. Why isn't this type of demand pushing the price up? And,
will it drop further, if the slowdown in the Chinese economy prevents further mass-importing?
JT: Demand in China has increased significantly in the past few years, basically due to the motorisation
and this is now reaching close to peak levels. It cannot be expected that in the future the same
growth rate in the car population can be reached - so I think China's importance in the quantity
of oil required will remain, but will not significantly increase in the future. This could have been
foreseen, this was evident that if reaches the top, then it will not continue to grow in the same
speed.
... ... ...
SS: Gulf states, like Iran, Iraq, Saudi Arabia - they are all competing to offer the lowest
price of oil to China. Who do you think will win this price war? Can there be a winner?
JT:
I think we are in the middle of a price problem, whether you call it a "war" or any other
way. There's a huge problem for the future, for the safe supply of the globe.
So, I don't think that
we can say that this is a very "special price war" between the Gulf states and China; or, in this
frame, as a Gulf states and China: this is a market mechanism.
SS: The IMF says Saudi Arabia and the Gulf monarchies will lose up to $300 bn in revenue this
year alone. How long can they keep this up? I mean, I understand they are very rich, but it is still
a lot of money.
JT: I don't know, I cannot reflect to this, because I don't know in details the individual budgets
and so on… but, in general, of course it will be difficult to overcome, this missing amount of money,
this will lack in the budget, definitely.
... ... ...
SS: Demand for oil is diminishing in Europe as well as in other developed economies, and, for
instance, vehicles are becoming more energy-efficient. Does the world just simply need less oil today?
JT: No,
we have to see the growing population of the world. In total, there is a growth in
the oil demand. Of course, there are regions where the oil demand is even stagnating or a little
bit decreasing because of the efficiency increase in using of oil. So, globally seen, the oil requirement
will increase, basically because of the population growth.
SS: So, is this whole "peak oil" thing a myth? With all kinds of oil reserves being discovered
all the time, with all the new technology - we're never really going to run out of it,are we?
JT: I used to cite one saying from my, let's say, from my old friend, former Saudi Oil Minister,
mr. Yamani, who was asked sometimes "when the oil era will end?" - he said: "I don't know, but the
Stone Age did not end because we ran out of stone", - so, I think it will be the case here. A lot
of effort is done in order to make substitutes in the energy mix, especially in the fuel side…
SS: So you think we're not going to run out of oil, but eventually solar and wind energy will
bury the oil?
JT: No, I don't pick up one or other renewable energy form. There are various efforts in the industry,
even in the oil industry, to get positive research results on how to substitute with renewable energy,
the current fossil energy. In the fuel side, there was and still is going on a research to have some
biofuel components to be blended into the fuel; wind energy is one, solar is the other one - and
there is a lot of other research going on to use non-food materials for energy purposes. So, there's
huge research effort on the way, and when the results will be - it's difficult to forecast.
My
opinion is it will be continued growth in renewables in the energy mix.
"... In its November assessment, Fitch forecast oil prices will reach an average of $55 per barrel in 2016. According to the rating agency, the price will go up to $65 per barrel in 2017, $70 per barrel in 2018 and $75 per barrel thereafter. ..."
"... He expects volatility in oil prices in the first half of 2016. However, $50-55 per barrel in the next year seems realistic, Ulyukaev added. ..."
"... a lot of oil producers will be unable to sustain $40 oil and will be forced to cut production to stabilize the price. ..."
In its November assessment, Fitch forecast oil prices will reach an average of $55 per barrel
in 2016. According to the rating agency, the price will go up to $65 per barrel in 2017, $70 per
barrel in 2018 and $75 per barrel thereafter.
... ... ...
He expects volatility in oil prices in the first half of 2016. However, $50-55 per barrel
in the next year seems realistic, Ulyukaev added.
Russian Finance Minister Anton Siluanov said that 2016 will be decisive for oil. According to
him,
a lot of oil producers will be unable to sustain $40 oil and will be forced to cut production
to stabilize the price.
"Everyone is playing for himself. Saudi Arabia is cutting prices. Iran is returning to the oil
market. We have to live through this difficult year," said Siluanov.
"... Third, unless existing production drops to less than 85% of its 2015 level, which is the amount the author says is hedged, the barrels from new (2016) production will be unhedged, and sold at the market, which is currently around $30 for oil for PXD. ..."
"... Fourth, does PXD think $52 or below is the best they can do in the next several years? ..."
"... I agree PXD is better hedged than most. But there are some issues. ..."
"... The final problem is that all of these shale guys are forgetting how much perception is driving the crude market. The bankers are screaming to the shale guys, "do not grow supply until the market balances.". The shale guys are ignoring, thus the price of crude continues to sink like a stone thrown in the deep end of the pool. And the pool apparently is pretty freaking deep. ..."
"... Conventional is cutting production, they can't and/or won't do what shale is doing because they are playing with their own money. ..."
"... How many shale CEO's and upper management took a pay cut in 2015? How many Chapter 11's are resulting in the same management keeping their jobs? ..."
"... Drilling now is really a lot about ego and impressing a bunch of young, macho analysts. I can attest to the ego part. I have seen it first hand. ..."
"... I have never owned or even been in Gulfstream, nor have I done much of the other extreme stuff these shale guys have done. They are true gamblers, wouldn't be where they are if they weren't. So I am not surprised they will ride it to the bitter end, even keep drilling at $10 WTI. But it is tough not to be upset about it. ..."
"... On a further note, I read where PXD says the $2.5 billion of 2016 CAPEX will grow production 20-25,000 BOEPD. So, clearly not cheap. ..."
Except that aren't hedges and drilling programs separate profit and loss centers?
Or, to put it another way, the question is, how do they deploy the profits from hedges against
falling oil prices? Apparently, they decided to put the profits from hedges, plus additional new
capital and cash flow from operations, into drilling.
I ain't buying it, Greenbub. First off, the author transposed a number when he attempted to show
how much net income would be derived in year one, after figuring in the hedges.
Secondly, I believe he ignored royalties. Does PXD drill a fee acreage.
Third, unless existing production drops to less than 85% of its 2015 level, which is the
amount the author says is hedged, the barrels from new (2016) production will be unhedged, and
sold at the market, which is currently around $30 for oil for PXD.
Fourth, does PXD think $52 or below is the best they can do in the next several years?
Unless it is, shouldn't they just wait a little while, absent lease requirements of course? If
I am sitting on a 1000′ location that I am sure will cumulative net to me 30K bold in year one,
and it costs me $70K to D &C, yes, I will get a quick payout, but I could be foregoing $150K if
we get a spike in a year or two. That makes some assumptions that we really can't make, but you
get the drift.
I agree PXD is better hedged than most. But there are some issues.
The final problem is that all of these shale guys are forgetting how much perception is
driving the crude market. The bankers are screaming to the shale guys, "do not grow supply until
the market balances.". The shale guys are ignoring, thus the price of crude continues to sink
like a stone thrown in the deep end of the pool. And the pool apparently is pretty freaking deep.
Conventional is cutting production, they can't and/or won't do what shale is doing because
they are playing with their own money.
How many shale CEO's and upper management took a pay cut in 2015? How many Chapter 11's
are resulting in the same management keeping their jobs?
Obviously, a mom and pop cannot file a Chapter 11 that would be confirmed, at least few could.
They will have to go the liquidation route. So, instead, mom and pops will shut in, and try to
wait it out like in 1986 and 1998-99. Lots of issues with that approach, but it is usually mom
and pops only choice. Get a job in town, pump the wells on the weekends.
Drilling now is really a lot about ego and impressing a bunch of young, macho analysts.
I can attest to the ego part. I have seen it first hand.
Its kind of like HH making fun of OPEC, the "toothless tiger" comment. OPEC saved HH bacon
when they cut in March, 1999. They saved it again with the cuts in 2008-2009.
I have never owned or even been in Gulfstream, nor have I done much of the other extreme
stuff these shale guys have done. They are true gamblers, wouldn't be where they are if they weren't.
So I am not surprised they will ride it to the bitter end, even keep drilling at $10 WTI. But
it is tough not to be upset about it.
Simple analogy. Me driving 5 year old paid for generic truck. Neighbors all around borrowing
$70K for the latest tricked out model, on 96 month loan.
Hey, what the shale boys are doing is the American way. OPEC doesn't understand the American
way, thus the $1 trillion they are/will be short in oil revenues in 2015-16.
On a further note, I read where PXD says the $2.5 billion of 2016 CAPEX will grow production
20-25,000 BOEPD. So, clearly not cheap.
Since we are at 2003 oil and even lower than 2003 natural gas and liquids levels, with higher
OPEX, tell me who in 2003 was spending that kind of money to increase production by that small
amount? I bet no one. Those extra 20-25K boepd will be sold at 2003 levels, should they persist.
And onto perception, should the fact that PXD is going to grow production by 20-25K boepd make
a shred of difference to the crude oil market? No, but by golly look at what Goldman is saying
about it, and the crude price dropped 10% in a week.
For that matter, no one expected an OPEC cut, inventories appear the same as 12/4/15, yet we
have lost around 25% since OPEC said no cut. Its all a perception trade.
Long ago I said shale should have came out the week after Thanksgiving and told the truth,
this business isn't a growth business below $75 WTI. We are going to defer until we rebound. It
would have put lots out of work immediately, more than were actually let go, but a drop below
8 million bopd by now would have done the trick, Saudi would have been impressed and maintained
at 9.6. We might be at $80 and might have companies in better shape.
I guess US onshore conventional needs to die. That seems to be the message.
Shallow, you are much wiser than me in these affairs, but if you are hedged well and expecting
a dramatic turnaround in prices, this is what to do. Also retains your workforce. Question is
the timing of the turnaround.
"On a further note, I read where PXD says the $2.5 billion of 2016 CAPEX will grow production
20-25,000 BOEPD. So, clearly not cheap."
Assuming 25,000 bbl/day and that this increase in production will last for five years after
capex "injection" you need $54.79 bbl "net" to break even without interest payments. Given the
rate of decline of fracked wells, five years is a pretty optimistic assumption. This makes sense
only if they expect return to $70-80 price range in late 2016 and $100 thereafter.
In a way Pioneer no longer should be viewed as an oil producing company but as a hedge fund
with a side oil production business and as such belongs more to Wall Street then to the shale
patch.
Also they need to be well connected with major financial players as to refinance notes for
a shale company now is not that easy. This is essentially a vote that the company will exists
in 5 years. Mutual funds like Vanguard probably will no longer participate despite their Baa3
(Placed on Review for Downgrade) Moody rating.
"... Hedging has been a crucial part of PXDs strategy all along. Looking at the Q3 EPS report, we can see the company earned net income of $4.27/share despite the very low average oil price of $42.46/bbl. This is due in large part to the strong hedging program in place throughout the quarter. ..."
"... Lots of debt looking at balance sheet and if Oil stays lower for 1 more year liquidity problems will arise, ..."
First off, let's take a closer look at the recent Senior Note offering, which
consisted of:
$500 million of 3.45% Senior Notes maturing in January 2021.
$500 million of 4.45% Senior Notes maturing in January 2026.
Considering the current market environment, those are some very attractive rates. Even better,
management said it will use the proceeds to repay or repurchase Pioneer's 5.875% Senior Notes due
2016 and/or its 6.65% Senior Notes due 2017.
... ... ...
Hedging has been a crucial part of PXD's strategy all along. Looking at the Q3 EPS report,
we can see the company earned net income of $4.27/share despite the very low average oil price of
$42.46/bbl. This is due in large part to the strong hedging program in place throughout the quarter.
21793061
I don't think speculating on price makes much sense. Companies should base their decisions off
of the strip. Of course with some time element (planning and the like) meaning that they can't
change plans every time it drops or goes up a dollar. But definitely planning off the strip as
of the time of their plan.
To the extent that their is a learning curve that stays in house or that there is critical mass
or key infrastructure (e.g. the water gathering) that lowers cost, than perhaps the PXD strategy
makes sense.
I really get the impression that have sweet rock and had a reasonable strategy when oil was at
$45 (and strip going up). That is a far cry when the prompt month is down $10 and the strip down
$5. There becomes a point where they have to back off the drilling plan or face a danger of exhausting
their cash to early (and of drilling negative NPV projects).
I don't care about the dilution as such. It's the use of the cash that is in question.
The hedges don't justify drilling negative NPV wells. that is silly talk and you should know better,
Mike. They can sell those hedges or if need be, buy crude on the market for physical delivery.
They are just a financial option and are in the money. But that doesn't justify drilling a well
or not.
shallow sand
In your article you may have made an error. You go from $52.41 to $54.21 with regard to the
1/8/16 hedged oil price.
Also does PXD obtain WTI price per barrel in the Permian, or is there a discount?
Also, you did not mention royalties. How does that factor in. I assume not all acreage is fee.
What is the royalty burden?
They still have four rigs running in EFS, how does this factor into your calculations?
Also, I wonder about NPV on these wells. So, assume we factor in the hedges and then use the
strips as quoted on the CME website for oil, natural gas and NGLs.
What is PV10 for the representative well?
Have you seen any lease operating statements for any of these wells? How much water do they
make, what kind of disposal system do they have?
Isn't the growth in produced oil sold at the market? The CAPEX program calls for same increasing
companywide BOEPD 20-25K. Since volumes currently are hedged less than 100%, why should we not
use the strip for any production in excess of that hedged?
I'm very curious about all of the above. Full disclosure, I am biased against LTO given it
has rained on my family's parade, which commenced in 2004 and ended on Thanksgiving 2014, a day
which will live in infamy to ever stripper well owner in the United States.
Sorry if this comes across as rude, I am not aiming at anyone really. Just frustrated to be
operating in the red at $28 in the field, with chemical 3x 2003 prices and electricity 70% higher
than in 2003 as well. Add in higher wages, worker's comp., health insurance premiums, all other
premiums of insurance, etc., its not pretty.
I do not recall anyone spending $2.5 billion to increase production 25K boepd in 2003, nor in
early 2005 when WTI was in the high 50s to low 60s. How is the financial aspect different now?
As I recall, low decline production was selling for $15-20,000 per barrel in 2003 with LOE of
$10-15 per barrel. Why is PXD's worth over $100K, given half is gas and NGLs, the hedges are only
through 2016 and the decline is steep. Must be oil is headed back to $90 soon, yes we have nothing
to worry about.
I will agree that among LTO, PXD is a standout. Just not much $$ to be made in LTO at $33 or
even $53 WTI, IMO, even if you are a standout.
Gayle Gregory Goodman
Lots of debt looking at balance sheet and if Oil stays lower for 1 more year liquidity
problems will arise,
JD TX
All very good points. My premise for a buy of an oil company would be the assumption (hence
where things could go wrong) that oil prices would not stay this low into 2017 and beyond. I know
these cycles can last years, however there is not seeming to be a massive global slowdown in demand.
Assuming demand stays steady (again, another assumption for my premise) and all countries with
their pumps wide open, it seems to me that as current wells decline (some rapidly) and absence
of sector exploration investment that oil should head much higher after the bottom is found. Add
in a geopolitical rift and this happens sooner.
I want to capitalize on the current decline and was looking at Exxon and Shell, but I
feel that their downstream success has kept the stock prices at too much of a premium. I think
(based on my possibly dangerous assumptions) that a company like pioneer who is growing their
barrels per day when everyone else is relying on declining wells could offer more upside to increasing
crude prices than a company with larger downstream operations. Thoughts?
cschwab
In your view, How does one important fact affect your conclusions? That the company sold short
puts at $46.08, which I believe means the company has to pay if oil is below that threshold. Therefore,
the $19.12 the company receives is reduced by the amount by which oil falls below $46.08. As an
example, if oil falls to $33, then the company's hedges result in the company earning on those
barrels that are hedged: $33+$19.12-13.08= $39.04. (If oil falls to $27, the company earns $33.04/barrel
that is hedged, the same as being unhedged)
Pablomike
That goes right to my question. In a perfect world for Pioneer wouldn't it be best if oil rebounded
to just under the short put; like $44-$45???
I thought the straight swaps were actually better. The difference between Avg. price for the Q
and $71.18 -$42.46 =$28.72. Better than the $19.22 gained on the 3-way.
Michael Fitzsimmons,
Author's reply " Hello cschwab: as pointed out in the article, with WTI at $33.19/bbl, and
supposing it stays there throughout 2016, we have the case where that NYMEX price ($33.19/bbl)
is less than the short put price ($46.08/bbl). In this case, Pioneer will receive the NYMEX price
($33.19/bbl) plus the difference between the put price ($65.30/bbl) and the short put price ($46.08/bbl),
or $33.19 + $19.22 = $52.41/bbl.
The way the 3-way collars work is explained in the fine print at the bottom of slide 23 and
further on slide 26 of the December presentation I referenced in the article. Thx for reading.
"... The United States' longtime ally is losing its iron-fisted grip over both its people and the region. This fact, coupled with Saudi Arabia's staggering arsenal and unprincipled ruling ideology, makes the kingdom incredibly dangerous–arguably more so than infamous Axis of Evil member Iran. . . . ..."
"... However, Mohammed bin Salman is widely regarded as impulsive and woefully inexperienced. The failure of Saudi policy against the Iranian-supported Houthi rebellion in Yemen lies at his feet. It is hardly a coincidence that on the same day Riyadh executed Sheik Al-Nimr, it unilaterally withdrew from a fragile ceasefire in Yemen. Western allies and regional acolytes alike nervously consider whether Saudi Arabia will be vulnerable to more campaigns of folly or even a palace coup, depending on who next ascends the leadership hierarchy. ..."
Saudi Arabia's decision to execute Shia cleric Sheikh Nimr Al-Nimr was designed to provoke
Iran into an expansion of military engagement. That's an unsettling strategy–but true nonetheless.
The initial reaction to the kingdom's decision was relatively minor-a few Molotov cocktails
were lobbed at its embassy in Tehran. But a chain reaction of diplomatic fallout has unfolded
over the past few days. Saudi Arabia severed all diplomatic relations with Iran; oil allies
Bahrain, Sudan and Djibouti quickly followed suit. Perhaps more surprisingly, other Gulf Cooperation
Council (GCC) allies like Kuwait, Qatar and the United Arab Emirates opted for the less drastic
measure of recalling their ambassadors.
Each act of incitement, however, including Saudi Arabia's allegedly deliberate targeting
of the Iranian embassy in Sana'a, Yemen, is further indication of Riyadh's desperation to demonize
Tehran in the court of world opinion. It is an exercise in futility, and one that casts doubt
over the kingdom's own stability and sensibility.
The United States' longtime ally is losing
its iron-fisted grip over both its people and the region. This fact, coupled with Saudi Arabia's
staggering arsenal and unprincipled ruling ideology, makes the kingdom incredibly dangerous–arguably
more so than infamous Axis of Evil member Iran. . . .
A paradigm shift of leadership beckons as King Salman, the son of the kingdom's founder,
Abdulaziz Al-Saud, looks to incorporate a next generation of Saudi royalty. The king's nephew,
Mohammed bin Nayef, is the crown prince and presumptive heir to the throne. But it is Salman's
own son, Mohammed, deputy crown prince and the world's youngest defense minister at age 30,
who is seen as the country's eminence grise and successor to his father's title.
However, Mohammed bin Salman is widely regarded as impulsive and woefully inexperienced.
The failure of Saudi policy against the Iranian-supported Houthi rebellion in Yemen lies at
his feet. It is hardly a coincidence that on the same day Riyadh executed Sheik Al-Nimr, it
unilaterally withdrew from a fragile ceasefire in Yemen. Western allies and regional acolytes
alike nervously consider whether Saudi Arabia will be vulnerable to more campaigns of folly
or even a palace coup, depending on who next ascends the leadership hierarchy.
"... After last week's moderate drop in rig count, the amount of horizontal oil rigs seems to implode this week. The U.S. land rig count was down 37 this week and the land horizontal rig count was down 30. Is this capitulation? Hard to say but it's the biggest drop since March 2015. ..."
"... The tight oil horizontal rig count was down by 20 and the key Bakken-Eagle Ford-Permian HRZ rig count was down by 14. ..."
After last week's
moderate drop in rig count, the amount of horizontal oil rigs seems
to implode this week. The U.S. land rig count was down 37
this week and the land horizontal rig count was down 30. Is this capitulation? Hard to say but it's the biggest drop
since March 2015.
And, the Fayetteville Shale play officially bit
the dust this week with zero rigs for the first time since the play
began in 2005.
The tight oil horizontal rig count was down by 20 and the key
Bakken-Eagle Ford-Permian HRZ rig count was down by 14.
The Bakken
lost 3 rigs, the Eagle Ford, 4, and the Permian, 7.
Shale gas lost 8 HRZ rigs. The Haynesville lost 2, the
Marcellus, 6, the Utica 1, the Fayetteville, 1. The Woodford and
Barnett each gained 1 rig.
"... I just see them re-arranging the deck chairs on the Titanic. Today Oil made a new 12 year low! Even now worse than the 2008-2009 crisis. World is now in full blown retraction. ..."
"There is oil in the oil sands, and it will flow."
I just see them re-arranging the deck chairs on the Titanic. Today Oil made a new 12 year
low! Even now worse than the 2008-2009 crisis. World is now in full blown retraction.
Canada's economy is primed for a major correction. its housing bubble is about to go pop!
Sept 11, 2015
"Credit-market debt such as mortgages rose to 164.6 per cent of after-tax income from 163 per
cent in the prior three months"
The US housing bubble popped in 2007, with US consumer debt to after tax income was only
about 127%. Canada was able avoid it on strong exports to China (Energy, lumber, etc) as well
as Chinese buyer propping up real estate prices. I find it hard to believe Canada will avoid
a crisis this time, now that the Chinese can no longer afford to prop up real estate prices
and Canada's exports have been declining for most of the year, despite a double digit loss
it Canada's currency value.
IEA is too political organization to produce good forecasts, but still...
Notable quotes:
"... Collectively, the United States, EU and Japan see their oil demand drop by around 10 mb/d by
2040. ..."
"... An annual $630 billion in worldwide upstream oil and gas investment – the total amount the
industry spent on average each year for the past five years – is required just to compensate for declining
production at existing fields and to keep future output flat at today's levels. ..."
"... the intensity with which the tight oil resource is developed in the United States eventually
pushes up costs. ..."
"... tight oil's rise is ultimately constrained by the rising costs of production, as operators
deplete the "sweet spots" and move to less productive acreage. US tight oil output reaches a plateau
in the early-2020s, just above 5 mb/d, before starting a gradual decline. ..."
The process of adjustment in the oil market is rarely a smooth one, but, in our central scenario,
the market rebalances at $80/bbl in 2020, with further increases in price thereafter. Demand picks
up to 2020, adding an average of 900 kb/d per year, but the subsequent rise to 103.5 mb/d in 2040
is moderated by higher prices, efforts to phase out subsidies (provided that momentum behind reform
is maintained, even as oil prices pick up), efficiency policies and switching to alternative fuels.
Collectively, the United States, EU and Japan see their oil demand drop by around 10 mb/d by
2040.
On the supply side, the decline in current upstream spending, estimated at more than 20% in 2015,
results in the combined production of non-OPEC producers peaking before 2020 at just above 55 mb/d.
Output growth among OPEC countries is led by Iraq and Iran, but both countries face major challenges:
the risk of instability in Iraq, alongside weaknesses in infrastructure and institutions; and the
need in Iran (assuming the path to sanctions relief is followed successfully) to secure the technology
and large-scale investment required.
An annual $630 billion in worldwide upstream oil and gas investment – the total amount the
industry spent on average each year for the past five years – is required just to compensate for
declining production at existing fields and to keep future output flat at today's levels.
The current overhang in supply should give no cause for complacency about oil market security.
The short investment cycle of tight oil and its ability to respond quickly to price signals is changing
the way that the oil market operates, but the intensity with which the tight oil resource is
developed in the United States eventually pushes up costs. US tight oil production stumbles
in the short term but resumes its upward march as prices recover, helped by continued improvements
in technology and efficiency improvements. But tight oil's rise is ultimately constrained by
the rising costs of production, as operators deplete the "sweet spots" and move to less productive
acreage. US tight oil output reaches a plateau in the early-2020s, just above 5 mb/d, before starting
a gradual decline.
What if prices stay lower for longer? A more prolonged period of lower oil prices cannot be ruled
out. We examine in a Low Oil Price Scenario what it would take for this to happen – and what it would
mean for the entire energy sector if it did. The oil price in this scenario remains close to $50/bbl
until the end of this decade, before rising gradually back to $85/bbl in 2040. This trajectory is
based on assumptions of lower near-term growth in the global economy; a more stable Middle East and
a lasting switch in OPEC production strategy in favor of securing a higher share of the oil market
(as well as a price that defends the position of oil in the global energy mix); and more resilient
non-OPEC supply, notably from US tight oil.
With higher demand, led by the transport sector, pushing oil use up to 107 mb/d in 2040, the durability
of this scenario depends on the ability and willingness of the large low-cost resource-holders to
produce at much higher levels than in our central scenario. In the Low Oil Price Scenario, the Middle
East's share in the oil market ends up higher than at any time in the last forty years. The likelihood
of the oil market evolving in this way over the long term is undercut by the effect on producer revenues:
OPEC oil export revenue falls by a quarter relative to our central scenario, despite the higher output.
Lower prices are not all good news for consumers. The economic benefits are counterbalanced by increasing
reliance on the Middle East for imported crude oil and the risk of a sharp rebound in price if investment
dries up. Concerns about gas supply security would also be heightened if prices stay too low to generate
the necessary investment in supply. Lower oil prices alone do not have a large impact on the deployment
of renewable energy technologies in the power sector, but only if policymakers remain steadfast in
providing the necessary market rules, policies and subsidies.
The outlook for biofuels is hit by cheaper conventional transport fuels, as is the uptake of vehicles
powered by electricity and natural gas and the incentive to invest in more efficient technologies.
In a Low Oil Price Scenario, longer payback periods mean that the world misses out on almost
15% of the energy savings seen in our central scenario, foregoing around $800 billion-worth of efficiency
improvements in cars, trucks, aircraft and other end-use equipment, holding back the much-needed
energy transition.
"... Nor is there much chance of prices rebounding. If they started to, Venezuela, which breaks
even at $7 a barrel, would expand production; at $10, the Gulf of Mexico would join in; at $11, the
North Sea, and so on (see map). This will limit any price increase in the unlikely event that OPEC rises
from the dead. Even in the North Sea, the bare-bottom operating costs have fallen to $4 a barrel. For
the lifetime of such fields firms will continue to crank out oil, even though they are not recouping
the sunk costs of exploration and financing. And basket-cases such as Russia and Nigeria are so hopelessly
dependent on oil that they may go on producing for some time whatever the price. ..."
"... the cost of extracting and processing commodities can rise as their market prices fall. This seems crazy at first blush, but given a vast array of credit being extended to the commodity producers, they can keep on chugging along at a loss for quite some time. ..."
"... This is what we see in the US fracking industry–totally unprofitable enterprises kept alive by massive infusions of new capital. But the minute the credit ceases, the firms all go bust. ..."
"... Just tell them that the financial break even point of extracting shale oil is around 60-80 bucks a barrel. While some oil companies arent profitable at a 100 bucks per barrel. The amount of oil being pumped is irrelevant due to the fact the debts need to be serviced like you mentioned. ..."
"... But the minute the credit ceases, the firms all go bust. The question is: when will the credit stop flowing? Or, can the capitalist class somehow keep the credit rolling in forever? ..."
"... I think this also applies to the of profitless wonders with billion dollar valuations in the tech industry. ..."
"... The cynic in me believes perhaps our banks got a wink nod from the Fed and or Treasury that oil loans will be backstopped and keep the financing flowing because patriotism and Evil Russia. ..."
"... Concentration of wealth and power, particularly malinvestment, has been banging up against that wall of diminishing returns for so long that the entire structure of society is crumbling away. Huge portions of both public and private activity at this juncture creates little or no actual wealth. ..."
"... Pepe Escobar at ICH and Russia Insider says oil surplus is shallow and can fad fast, that being bad for Saudi Arabia US plans to destabilize Russia. ..."
"... True or not, agree with the article posted by Yves few days back, that Russia must move to decouple from US dollar to save itself from US hegemonic plans. Hope Putin understands this and acts. ..."
"... Maybe the missing linkage is the ascent of neo-liberalism? The physics the article describes would still obtain in a Keynesian or socialist economy, but perhaps either would be better equipped to recognize and adapt to the supercycle? ..."
"... Evidently complex feedback systems sometimes respond perversely, especially to adverse inputs. Of course, we know this, if we think about it, from our own bodies. ..."
"... Im wondering if a lot of the apparent paradoxes mentioned would be more easily understood if prices were not left in units of dollars, but translated into units of (say) percent of the per capita average disposable income. ..."
"... This woman is hard core when it comes to oil. (I grew up in southeast Texas not far from where oil was discovered there). She strikes me as typical of the oil patch people which are of two kinds - oil has peaked or no it hasnt - but either way the world will be a catastrophic environment to have to live without it. No matter how much I tried to educate them on the promise of the thorium age, these people were just dense. I take what she says with a grain of salt. ..."
"... We have not really understood how the economy works, so we have tended to assume we could fix one or another part of the problem. ..."
"... Complexity creeps up on society over time in an ongoing effort to solve problems. Complexity requires energy and resources however, and more complexity requires more energy and resources. Inevitably a society becomes so complex that it simply cant sustain itself on the resource base available to it, whereupon it immediately collapses. There arent many exceptions to this model in history (there was one exception identified by Tainter), and the American empire is basically showing every symptom of a society thats about to undergo a catastrophic collapse. Gails analysis is very complementary to the work of Tainter. ..."
The interesting thing, which is hardest to explain to people, is that
the cost of extracting
and processing commodities can rise as their market prices fall. This seems crazy at first blush,
but given a vast array of credit being extended to the commodity producers, they can keep on chugging
along at a loss for quite some time.
This is what we see in the US fracking industry–totally unprofitable enterprises kept alive
by massive infusions of new capital. But the minute the credit ceases, the firms all go bust.
The question is: when will the credit stop flowing? Or, can the capitalist class somehow keep
the credit rolling in forever? I know that sounds crazier than the falling prices with rising
costs conundrum, but this rickety mess should have gone down in 2008 but was kept alive by unimaginable
infusions of money, credit, and promises of more to backstop literally the entire global financial
system. Can the elites pull this trick again? And again? I just don't know.
I'm starting to think it is the case that as long as everyone believes in the trick the trick
can continue to work. It's not surprising that such tricks work given the abstract nature of money
itself – the value of money is what everyone believes it is (And, as a result, we can re-arrange
value in many different ways). I think people will continue to have faith in this system as long
as the system doesn't change too suddenly and in too drastic of a direction. If we believe that
credit can stabilize the system we can produce credit that will stabilize the system but the moment
people lose faith it will all come crashing down.
The flip side of credit is debt. Exceeded debt carrying capacity can't be remedied with more
debt…pound of flesh, scorched earth etc., but no paper losses because markets.
Just tell them that the financial break even point of extracting shale oil is around 60-80
bucks a barrel. While some oil companies aren't profitable at a 100 bucks per barrel. The amount
of oil being pumped is irrelevant due to the fact the debts need to be serviced like you mentioned.
It begins to get complicated when you explain how the energy rate of return on a barrel of
conventional oil is much higher than oil from unconventional sources. This causes the net energy
that society benefits from to be reduced. Throw in some Joseph Tainter and watch their heads spin
like that possessed chick from the Exorcist. It is especially enjoyable if they are an economist.
Probably because they're possessed by evil spirits too!
But the minute the credit ceases, the firms all go bust. The question is: when will
the credit stop flowing? Or, can the capitalist class somehow keep the credit rolling in forever?
I think this also applies to the of profitless wonders with billion dollar valuations in
the "tech" industry.
The cynic in me believes perhaps "our" banks got a wink&nod from the Fed and or Treasury
that oil loans will be backstopped and keep the financing flowing because patriotism and Evil
Russia.
Personally, I think we are seeing the current "Final Unwounding" right now. I think by the
3rd quarter of 2016, the global economy begins its recovery.
We have not really understood how the economy works…Ultimately, diminishing returns with
respect to human labor – what some of us would call falling inflation-adjusted wages of non-elite
workers – tends to bring economies down.
Those two thoughts are not congruous. We do understand how the economy works pretty well. We
understand that extreme and growing inequality tends to bring economies down. It creates all kinds
of wasteful frictions as people jocky for position rather than produce valuable work.
That's why the US has been stuck in a depression that shall not be named going on two decades
now.
Concentration of wealth and power, particularly malinvestment, has been banging up against
that wall of diminishing returns for so long that the entire structure of society is crumbling
away. Huge portions of both public and private activity at this juncture creates little or no
actual wealth.
Pepe Escobar at ICH and Russia Insider says oil surplus is shallow and can fad fast, that
being bad for Saudi Arabia & US plans to destabilize Russia.
True or not, agree with the article posted by Yves few days back, that Russia must move
to decouple from US dollar to save itself from US hegemonic plans. Hope Putin understands this
and acts.
Ambitious and thought-provoking piece. However, some of the linkages ascribed to the end of
cheap-to-extract oil and other commodities remain unclear to me.
For example, "slowing wage growth of non-elite workers" is not a recent phenomena and can also
be ascribed to other factors. We have seen flat real wages in the U.S. since 1971, even while
U.S. worker productivity has more than doubled since that time. Over that same time period, the
prices of oil and other commodities have been highly variable.
Maybe the missing linkage is the ascent of neo-liberalism? The physics the article describes
would still obtain in a Keynesian or socialist economy, but perhaps either would be better equipped
to recognize and adapt to the supercycle?
Don't let the Archdruid read this. His head will swell unbearably.
It's especially interesting because it draws some of the linkages between natural limits and
economic and financial responses.
Evidently complex feedback systems sometimes respond perversely,
especially to adverse inputs. Of course, we know this, if we think about it, from our own bodies.
I think I'll take copies of this to the Green Party talk on Ecological Economics in a couple
of weeks.
I'm wondering if a lot of the apparent paradoxes mentioned would be more easily understood
if prices were not left in units of dollars, but translated into units of (say) percent of the
per capita average disposable income.
Such a measure would mathematically incorporate into the graphs and equations some of the feedback-loop
causes that Tverberg discusses verbally. It would to some extent remove the arbitrariness and
false impressions introduced into the managed money/debt/credit supply and pricing structure for
political purposes.
Speculating optimistically, it might make the need to improve the general public's economic
condition clearer to all.
'As long as the cost of commodity production is rising only slowly, its increasing cost
is benevolent. This increase in cost adds to inflation in the price of goods and helps inflate
away prior debt, so that debt is easier to pay.'
This is a fallacy. When the monetary unit was stable (i.e., gold-backed), secular inflation
in the US and UK from 1790-1930 was almost nonexistent, despite vast increases in population and
commodity production.
By contrast, both countries saw their price level rise by a factor of 20 to 30 times in the
last two-thirds of the 20th century. This inflation was associated with fiat currency, not commodity
production costs.
Tverberg's final chart showing energy production crashing to Cro-Magnon levels definitely qualifies
as "psycho bearish." She and Dr Hussman ought to throw an Apocalypse of Doom party.
You are using too big a sample. Britain had significant inflation from 1793-1816 or so, then
things flattened out, then she had significant deflation from 1873-1896 ("The Great Depression")
then a return to modest inflation before WWI changed the dynamic forever. You are pulling the
old Economist's trick of one foot in boiling water and one foot in an ice bath and declaring the
situation "overall, temperate."
About a year ago, I spent several weeks on her website arguing with people about how thorium
nuclear reactors would change the global energy picture beginning about 2025. They would not hear
of such a thing.
This woman is hard core when it comes to oil. (I grew up in southeast Texas not far from
where oil was discovered there). She strikes me as typical of the oil patch people which are of
two kinds - oil has peaked or no it hasn't - but either way the world will be a catastrophic environment
to have to live without it. No matter how much I tried to educate them on the promise of the thorium
age, these people were just dense. I take what she says with a grain of salt.
We have not really understood how the economy works, so we have tended to assume we
could fix one or another part of the problem.
This statement is reminiscent of Joseph Tainter's analysis.
Complexity creeps up on society
over time in an ongoing effort to solve problems. Complexity requires energy and resources however,
and more complexity requires more energy and resources. Inevitably a society becomes so complex
that it simply can't sustain itself on the resource base available to it, whereupon it immediately
collapses. There aren't many exceptions to this model in history (there was one exception identified
by Tainter), and the American empire is basically showing every symptom of a society that's about
to undergo a catastrophic collapse. Gail's analysis is very complementary to the work of Tainter.
Yes, we are now seeing the all-too-familiar kind of complexity that causes collapse, which
might better be called 'complication' rather than complexity.
Competition for dollars encourages aggressive intermediation by middlemen and rent-seekers
in system flows that are already functioning reasonably well. This impedes important flows and
rewards unproductive competitors while draining away the resources of productive cooperators.
Perhaps worse, our socioeconomic system encourages the artificial construction of complications
that provide these parasites their best opportunities.
Complication is the negative synergy that results from the arbitrary control of the flow of
dollars by those with a conflict of interest. The production of dollars, the interest paid on
dollar debts, and the ways that dollar flows are labeled and channeled by accounting and tax laws
distort what could be a far more productive and efficient flow of resources.
Well designed complexity could serve the same constructive ends in the economy as it does in
nature and in our own bodies, enhancing efficiency and resilience, if our economic system could
rid itself of the parasites who create complications for their profit rather than the constructive
complexity of efficient regulatory feedback loops.
Sadly, this is probably not something that voters will understand, so the parasites are winning
and will continue to prosper until their prey is sucked dry.
I wonder if any economist (I'm a physical scientist) has ever calculated the total dollar flow
that goes to institutions like the IRS, tax lawyers, accountants, lobbyists, bribes to influence
tax legislation, and the inefficiency cost of the kind of trickery currently being used to avoid
taxes by corporate maneuvering? That would only be a fraction of the losses that could be avoided
in a system that allocated rewards to productive activity rather than financial manipulations,
and included the complexity required for self-regulation as opposed to the kind of imposed-by-corruptible-officialdom
regulation that we now suffer under.
sometimes museums show art work produced by people who live on the very margins of psychological
normality. There was one dude who spent years making a full room sized city out of tin foil
There were turrets and towers and buildings of various types and shapes with the tin foil pinched
and sculpted. you know how they light scultptures in museums. They make it so you can look at
things in a way that isolates them in your mind. It was quite striking to see what this mind had
produced. I can still remember the whole room behind the velvet rope was lit with a low yellowish
glow of soft ceiling lights reflecting off the foil.
You had to be impressed. There was something about it. It wasn't beautiful but it was strange
and potent. You thought to yourself '"Jesus Christ. This dude was a wacko." But still you looked
and it made you wonder.
GOP presidential front-runner Donald Trump said late Monday that the Iran nuclear deal made Tehran
a global power that now threatens Saudi Arabia's existence.
"We made a power out of Iran," the
outspoken billionaire told host Bill O'Reilly on Fox News's "The O'Reilly Factor."
"They are looking to go into Saudi Arabia," Trump continued. "They want the oil, they want the money,
[and] they want a lot of other things.
"That's phase one - to go into Saudi Arabia and, frankly,
the Saudis don't survive without us. And the question is, at what point do we get involved and how
much will Saudi Arabia pay us to save them? That's ultimately what's going to happen."
Trump argued that his presidency would back Saudi Arabia in any regional conflict that emerges
in the Middle East.
"Well, I would want to help Saudi Arabia," he said. "I would want to protect Saudi Arabia. But
Saudi Arabia is going to have to help us economically. They were making, before the oil went down
... they were making $1 billion a day."
Trump additionally charged that aiding Saudi interests is essential, given the possibility Iran
eventually acquires nuclear weapons.
"You know that Iran is going to have a nuclear weapon very soon," he told O'Reilly. "The ink isn't
even dry, and they have already violated the deal and a lot of people are calling for sanctions."
"... The collapse of oil prices has forced drillers to become more efficient, adding more wells per well pad, drilling longer laterals, adding more sand per frac job, etc. That allowed companies to continue to post gains in output despite using fewer and fewer rigs. ..."
"... However, the efficiency gains may have been illusory, or at best, incremental progress instead of revolutionary change. Rather than huge innovations in drilling performance, companies were likely just trimming down on staff, squeezing suppliers, and drilling in the best spots – perhaps all sensible stuff for companies dealing with shrinking revenues, but nothing to suggest that drilling has leaped to a new level of efficiency. Reuters outlined this phenomenon in detail in a great October 21 article. ..."
"... drilling productivity flat lining in the Bakken, the Eagle Ford, and the Permian. ..."
Much has been made about the impressive gains in efficiency and productivity in the shale patch,
as new drilling techniques squeeze ever more oil and gas out of new wells. But the limits to such
an approach are becoming increasingly visible. The U.S. shale revolution is running out of steam.
The collapse of oil prices has forced drillers to become more efficient, adding more wells
per well pad, drilling longer laterals, adding more sand per frac job, etc. That allowed companies
to continue to post gains in output despite using fewer and fewer rigs.
However, the efficiency gains may have been illusory, or at best, incremental progress instead
of revolutionary change. Rather than huge innovations in drilling performance, companies were likely
just trimming down on staff, squeezing suppliers, and drilling in the best spots – perhaps all sensible
stuff for companies dealing with shrinking revenues, but nothing to suggest that drilling has leaped
to a new level of efficiency. Reuters outlined this phenomenon in detail in a great
October 21 article.
For evidence that the productivity gains have run their course, take a look at the latest
Drilling Productivity
Report
from the EIA. Production gains from new rigs – which have increased steadily over the
past three years – have run into a wall in the major U.S. shale basins. Drillers are starting to
run out of ways to squeeze more oil out of wells from their rigs. Take a look at the below charts,
which show
drilling productivity flat lining in the Bakken, the Eagle Ford, and the Permian.
"... As oil has crashed back to 2003 levels, I am hearing a lot of MSM talk that the current price is really the long term historical average price, that 2005-2014 was a gross anomaly, and that we should be in the $20-40 range for years to come. ..."
"... I highly doubt much oil outside the Middle East, some in Russia, and maybe a few other places, can be developed at that price. ..."
"... Chinas economy is apparently tanking, yet oil demand is not declining. India is rising. Africa is rising. The Middle East is rising. World wide demand growth for 2015 and 2016 combined looks to be about 3 million bopd. Yet, the reason Saudi is doing what they are doing is to avoid stranded oil, better to sell it for $30 than leave it in the ground. ..."
"... I guess I am not going to buy either of the above premises. I may be wrong, and will suffer financially, but man I am just not seeing the evidence. ..."
"... population was still growing by quite a bit worldwide, and the infrastructure and subsidies needed for alternatives to replace fossil fuels is enormous. ..."
"... As soon as the stand off between shale and conventional oil is over, oil will be soaring again, which I think could be at the end of 2016. ..."
"... there is no arguing that China has slowed its economic growth during the period 2013-2015, as a ton of evidence from economy, starting with GDP increase, and energy consumption attest. ..."
"... Mist likely China oil consumption will continue to grow in 2016 but at slower pace. Most oil is burned in transport, so the slowdown of economy and slowdown of growth of electrical consumption does not automatically mean that the oil consumption decline as long as sales of new cars are rising. ..."
As oil has crashed back to 2003 levels, I am hearing a lot of MSM talk that the current price
is really the long term historical average price, that 2005-2014 was a gross anomaly, and that
we should be in the $20-40 range for years to come.
That would be fine, except
I highly doubt much oil outside the Middle East, some in Russia,
and maybe a few other places, can be developed at that price.
Almost nothing in North or South
America is profitable at those prices, given the risks involved. Likewise, I can't imagine much
offshore anywhere in the world at this point will work at a $20-40 price band.
Second, I am also hearing the "end of oil talk" quite often on the MSM, and I find that pretty
incredible.
China's economy is apparently tanking, yet oil demand is not declining. India is rising.
Africa is rising. The Middle East is rising. World wide demand growth for 2015 and 2016 combined
looks to be about 3 million bopd. Yet, the reason Saudi is doing what they are doing is to avoid
stranded oil, better to sell it for $30 than leave it in the ground.
I guess I am not going to buy either of the above premises. I may be wrong, and will suffer
financially, but man I am just not seeing the evidence.
Yes, alternatives are the rage, but last I knew,
population was still growing by quite a bit
worldwide, and the infrastructure and subsidies needed for alternatives to replace fossil fuels
is enormous.
I probably need to throw my tv, computer, tablet, satellite radio and I phone in the lake out
back. Maybe I will.
This is not the end of oil, it is now over the next half year an excellent entry point for
investments. China is actually not slowing. Chinese oil imports increase 50% every five years.
So, Chinese oil consumption will be close to 500 mill t per year, which is enormous (see below
chart).
As soon as the stand off between shale and conventional oil is over, oil will be soaring
again, which I think could be at the end of 2016.
We can certainly argue what China is doing right now or what China is going to do in the future,
but
there is no arguing that China has slowed its economic growth during the period 2013-2015,
as a ton of evidence from economy, starting with GDP increase, and energy consumption attest.
Mist likely China oil consumption will continue to grow in 2016 but at slower pace. Most oil
is burned in transport, so the slowdown of economy and slowdown of growth of electrical consumption
does not automatically mean that the oil consumption decline as long as sales of new cars are
rising.
2016 world oil demand growth is still expected to be around 1.3 Mb/d.
The same situation exists in other countries notably in the USA – slowing of the economy can
for a while coexist with the growth of oil consumption as long as sales of SUVs are booming.
Shale drillers run out of places to cut. Now shale companies played all their best cards. there
is almost no scope for further production price reduction but the current price is so low that each
barrel is produced at a loss. Essentially debt keeps then by the throat and force to produce barrels
at a loss: as of December 2015, the US oil production remained within 4% of a 43 years high. But the
decline of oil prices below $50 is devastating for shale drillers financially and it is unclear how
long they can survive in such a mode. "Sweet spots" are running out.
Notable quotes:
"... While technological and efficiency improvements may continue gradually, oil company renegotiations with contractors are essentially done, and so is the rapid shift to focus only on core areas. ..."
"... ... Most companies have gone into shrinkage mode, saying their goal is to stay flat and make it through this market, Raoul LeBlanc, an analyst with IHS Inc. in Houston, said. The current price is unsustainable. ..."
About $99 billion in face value of high-yield energy bonds are trading at distressed prices, according
to Bloomberg Intelligence analyst Spencer Cutter. The BofA Merrill Lynch U.S. High Yield Energy Index
has given up almost all of its outperformance since 2001, with the yield reaching its highest level
relative to the broader market in at least 10 years.
... ... ...
"There is limited scope for further production cost reductions," Mike Wittner, head of oil-market
research for Societe Generale, said in a note to clients.
"While technological and efficiency improvements
may continue gradually, oil company renegotiations with contractors are essentially done, and so
is the rapid shift to focus only on core areas."
... ... ...
... "Most companies have gone into shrinkage mode, saying their goal is to stay flat and make it through
this market," Raoul LeBlanc, an analyst with IHS Inc. in Houston, said. "The current price
is unsustainable.
Unfortunately, we have to sustain it for a while longer."
"... So, a massive loss, and still CAPEX is 150% of total revenue. Their wells are worse than the average Niobrara well, I think they will do on average probably less than 120 kbo (stated EURs are 350kboe – 750 kboe) , and have an average life of about 5 years. ..."
"... So this thoroughly loss-making operation is completely funded by investors . It really makes you wonder who is buying into this. Oh, and the CEO just left. ..."
Synergy Resources just released their Q1 for FY 2016. I think you will find it interesting
(in $m for the quarter):
– revenue : 26
– total expenses (excl impairment) : 36.4 (incl GA of 14 )
– impairment : 125
– total loss : -135
– well costs & other capex : 39 (excl acquisition capex of 35)
So, a massive loss, and still CAPEX is 150% of total revenue. Their wells are worse than
the average Niobrara well, I think they will do on average probably less than 120 kbo (stated
EURs are 350kboe – 750 kboe) , and have an average life of about 5 years.
They don't have much debt, but doubled the outstanding share count over the last 3 years, and
just increased the authorized # of shares by another 50%. In 2015 they already increased the share
count by 35% (stock issued at 10.75, which is now just above 7).
So this thoroughly loss-making operation is completely funded by "investors". It really
makes you wonder who is buying into this. Oh, and the CEO just left.
At least five massive oil storage tanks have caught fire in two oil terminals in Libya after
attacks by Takfiri Daesh terrorists.
The attacks originally ignited fires at the key terminals
in Sidra and Ras Lanouf, located between the city of Sirte – which is controlled by Daesh – and the
eastern city of Benghazi.
Ali al-Hassi, a spokesman for the Petroleum Facilities Guards, said on Wednesday that the fires
have now spread to the storage tanks.
Officials said each of the oil tanks is estimated to be storing 420,000 to 460,000 barrels of
oil.
"... From October 2010 through 2015, the U.S. has approved sales of $111.3 billion of arms to Saudi Arabia, including $29 billion for 84 F-15 warplanes-more than three times the arms sales approved to the U.S.'s second-biggest customer, South Korea. ..."
"... Iran can balance its budget with crude at $70 a barrel, while the Saudis need $95. Ominously, the IMF predicts that if the Saudis don't lower spending, and if oil stays at $50 a barrel, they'll burn through their foreign currency reserves by 2020. ..."
For all the talk of abandonment, Saudi Arabia remains by far the U.S.'s top weapons customer.
Sales have ramped up significantly under Obama, says William Hartung, director of the Arms &
Security Project at the Center for International Policy.
From October 2010 through 2015, the
U.S. has approved sales of $111.3 billion of arms to Saudi Arabia, including $29 billion for 84
F-15 warplanes-more than three times the arms sales approved to the U.S.'s second-biggest
customer, South Korea.
A lot of that firepower is being used in Yemen. The 10-month bombing campaign against the
Iran-backed Shia rebels, the Houthis, has been sloppy. The UN estimates that 2,600 Yemen
civilians were killed from March to October, including 1,600 in Saudi-led airstrikes. To pay for
the war, the Saudis have been dipping into shrinking foreign currency reserves. "The only thing
it accomplished is to create a major humanitarian crisis," Hartung says. The air campaign has
been led by the king's 30-year-old son, Mohammad bin Salman, the youngest defense minister in the
world. "They should be worried about ISIS, but instead they're spending all their blood and
treasure in Yemen as some kind of anti-Iranian measure," Hartung says. "And it's a disaster."
... ... ...
According to International Monetary Fund estimates,
Iran can balance its budget with crude
at $70 a barrel, while the Saudis need $95. Ominously, the IMF predicts that if the Saudis don't
lower spending, and if oil stays at $50 a barrel, they'll burn through their foreign currency
reserves by 2020.
Being a wartime king is expensive.
It's getting worse... faster!
These two stunning overnight developments
in crude oil prices should shock investors...
First, OPEC - after its crude basket price dropped below $30 for the first time in 12 years -
slashed its price overnight by $2 to $27.85 - the biggest single-day drop in history and
lowest level since November 2003
...
Is it any wonder the Saudis are trying to sell every national asset to subsidize this US Shale-crushing
energy price?
Second, even closer to home, Canadian heavy crude oil collapse below $20 - a record low!!
The low prices may push more of the highest-cost output offline.
Producers
including Baytex Energy Corp. and Canadian Natural Resources Ltd. have shut in more than 35,000
barrels a day of heavy oil and bitumen production capacity, according to company presentations
and a report on the Alberta government website.
Current prices are "below shut-in levels,"
said , founder and
chief investment officer of Auspice Capital Advisors Ltd. in Calgary. There's no incentive to
ship Canadian crude to the U.S. Gulf Coast and producers may start annual maintenance sooner than
planned, he said. "We're the last barrel produced and we're the first barrel shut in."
So record inventory surge in gasoline, global storage at its limits, price-war in Europe, Saudis
in panic cash-flow "whatever it takes" mode, borrowing bases being slashed, credit risk at record
highs, and Canada now facing widespread shut-ins... but apart from that, the bottom must be close
right?
* * *
Bonus Chart: Venezuela lowers its crude below crucial $30 level - Feb 2004 lows...
"... It knows that low oil prices also squeeze Iran's ally Russia, and yes, they whack North American high-cost producers too. That's three birds with one barrel. ..."
...The world looked to OPEC (read Saudi
Arabia, as OPEC stopped functioning as an effective cartel long ago) to prop
them up. But the kingdom's busy. The Sunni monarchy is busy fighting proxy wars
with its rival, the Shia theocracy of Iran, to be the regional power. To the
south, it's shooting down incoming missiles aimed at its oil plants fired by
Iranian-backed militants in Yemen, whom the Saudi air force is also bombing. To
the north, Sunni insurgents are battling Iranian-supported governments in Syria
and Iraq. To the east, Saudi tanks have crushed a still-simmering Shia uprising
Bahrain. And wars require oil money – lots of it.
The kingdom believes it can
dive deeper and for longer into the turbulent seas of oil markets than rival
producers.
It knows that low oil prices also squeeze Iran's ally Russia, and
yes, they whack North American high-cost producers too. That's three birds with
one barrel.
...But it's also hurting. Riyadh is slashing spending,
cutting price subsidies on fuel, water and power, and hiking taxes – and
risking social unrest. Saudi Arabia's estimated $640-billion foreign reserves
look like a comfortable cushion, until compared against the kingdom's social
spending hand-outs of more than a whopping $100 billion, pledged dramatically
in 2011 when the Arab Spring revolutions spread across the region.
...But Iran is hurting more. Tehran's foreign reserves dropped long
ago, triggering rationing, riots and price hikes on food and fuel.
Saudi security forces keep a nervous eye on their own dissident Shias who
are the majority in the kingdom's main oil-producing province, which lies on
the shore of the Persian Gulf.
... ... ...
The execution triggered outrage in the seething "Shia crescent" that runs
round the Gulf coast from Iran to Bahrain, taking in major oil fields and
export infrastructure.
... ... ...
... "Former cartel" would be
a better description. The definition of a cartel is not an organization of
competing producers that control prices by a few reducing production together
while others secretly increase it, and that rarely agree on anything. Today,
survival and ending the flow of oil dollars to your enemies' armories are at
the top of Middle Eastern agendas.
"... There certainly have been some false alarms. Going back as far as late 2014, there were numerous
media interviews with analysts and traders about energy stocks citing capitulation, forming a low or,
in the case of a sharp but fleeting rebound last spring, being past the lows. ..."
"... Analysts at Deutsche Bank estimate that North American exploration-and-production stocks now
factor in a long-term oil price of under $65 a barrel. That is low relative to the $110 hit 18 months
ago, but that was in a world of seemingly insatiable emerging-market demand. Today, that is in doubt,
particularly when it comes to China. ..."
"... Energy stocks probably present an attractive buying opportunity since the average Brent crude
price of the past decade was a little above $80 a barrel. But those with the willingness, and ability,
to hang on to realize a profit must be aware that we are a long way from there-and perhaps even a good
distance from the bottom. ..."
The oil market is teaching investors a lesson that they always seem to relearn the hard way: Don't
try to catch a falling barrel.
Global crude prices started Wednesday at an 11-year low and then took another sharp leg down after
a surprise jump in U.S. gasoline inventories. Pessimism has gripped the market. Perhaps the best
indicator of that: A flare-up in tension between megaproducers Saudi Arabia and Iran was only good
for a price spike lasting a few hours on Monday.
But an even more profound insight, espoused by successful investors from N.M. Rothschild to John
Templeton to Warren Buffett, is to be greedy when others are fearful. Are investors terrified enough
to invoke that maxim?
There certainly have been some false alarms. Going back as far as late 2014, there were numerous
media interviews with analysts and traders about energy stocks citing "capitulation," "forming a
low" or, in the case of a sharp but fleeting rebound last spring, being "past the lows."
Peter Atwater, president of Financial Insights, which specializes in tracking investor sentiment,
points to last June's announcement of a 100-year bond by Brazil's Petrobras , the most-indebted large
energy company in the world, as a classic sign of a false dawn. Now, though, he thinks commodity
prices themselves really are very close to a bottom.
But equities, the vehicle most investors use to bet on energy prices, may not be as close. Consider,
for example, the widely held Energy Select SPDR exchange-traded fund. Down 43% from its June 2014
peak, it fetched a similar price as recently as October 2011 and is some 50% above its recession
low. In other words, a steep loss, but hardly panic territory.
Analysts at Deutsche Bank estimate that North American exploration-and-production stocks now
factor in a long-term oil price of under $65 a barrel. That is low relative to the $110 hit 18 months
ago, but that was in a world of seemingly insatiable emerging-market demand. Today, that is in doubt,
particularly when it comes to China.
Energy stocks probably present an attractive buying opportunity since the average Brent crude
price of the past decade was a little above $80 a barrel. But those with the willingness, and ability,
to hang on to realize a profit must be aware that we are a long way from there-and perhaps even a
good distance from the bottom.
The Iranians fell into the Saudi trap. Geopolitically this is classic "divide and conquer"
strategy in action. Somehow remins me shooting Russian jet, after which Russi self-impose on
itself additional sactions by braking economic cooperation with Turkey. Of couse Endogan
played duplicipus game and betrayed Russins, but still this is another episode of 'devide and
conquer" starategy.
Notable quotes:
"... The rentier kingdom relies heavily on the government's welfare policies, besides its religious appeal, to drum up public support. The late King Abdullah's response to Arab Spring protests is an example of this. When people elsewhere rose up against dictatorships, he announced a special economic package of $70 billion (much of this money was allocated to build 5,00,000 houses to address housing shortage) to quell discontent at home. Additionally, the state injected $4 billion into healthcare. King Salman does not enjoy the luxury of using oil revenues to save his crown due to the economic crisis. Another option the royals have to buttress their position is to resort to extreme majoritarianism. ..."
"... Even when pre-revolutionary Iran and Saudi Arabia were the two pillars of the U.S.'s West Asia policy, Riyadh and Tehran were regional rivals. The latest phase of this cold war begins with the U.S.-led Iraq invasion. When Saddam Hussein was toppled and a Shia-dominated government emerged in Baghdad, Iran was the happiest regional power. Hussein had been a staunch enemy of Tehran. Saudi Arabia was alarmed by the changing political equations in Iraq, and had supported Sunni militancy to prevent the Shias consolidating power in the post-Saddam set-up. This was one reason that Iraq broke apart later. But the Americans had assured full support to the Gulf monarchies and kept pressure on Iran over the nuclear sanctions. When the Barack Obama administration changed its approach towards Iran, engaging with the Islamic Republic through serious negotiations, the Saudis were upset. Though Riyadh publicly accepted the nuclear deal, it was expectedly concerned about Iran's reintegration with the global economy. That would not only flood the market with cheap oil from Iran, sending oil prices down further, but also help Tehran rise as a legitimate regional power. ..."
"... This Saudi frustration was evident in its Yemen war. Riyadh started bombing Yemen in March, when the nuclear talks were in the final stages. ..."
"... Iran should have exercised restraint in the wake of Sheikh Nimr's execution. It could have used the global anger against mass beheadings in Saudi Arabia to its benefit, particularly at a time it's rebuilding its position in the region. But lack of a cohesive vision, and maybe the high-handedness of the hardliners, led Iran to overreact to the executions. ..."
"... Iran has gained nothing but international condemnation from attacking foreign missions in its land. ..."
"... US/Obama/Republican/Democrat (any name we call them) are no fool. They just would like to maintain a balance of power between the two major sects for their own benefits - control over oil trade. It is not about the numbers here. Whenever one side dominates, they intervene to create a balance. ..."
"... One natural victim of these rising tensions will be the Syria peace plan ..."
"... Unless Saudi-Iran tensions are contained , there won't be an effective strategy to fight the Islamic State, which is a Sunni-Wahhabi extremist group; the war in Yemen will go on, endangering many more lives; and Iraq's efforts to stabilise itself could be challenged. The Saudis look determined to play a long-term game of sectarian geopolitics to maximise its interests. If the Iranians continue to respond in the same token, West Asia would remain turbulent for many more ..."
"... The rise of ISIL and the back-door support to ISIL from the GCC because they are anti-Shia, is clear to everyone. In short, the Saudis have lost favor with the west and their petrodollars are shrinking due to low oil price. ..."
"... Equally the Saudis cannot behave like they are some kind of 'Demi-Gods' with a license to flout normal rules and regulations. Their Human Rights record is terrible, they allow no other religions except Islam in their country, have harsh Sharia laws, Women's rights are non-existent, they support many terror networks around the World. Unfortunately the West turns a blind eye to all these misdemeanors from Saudi Arabia as the Saudis buy billions of dollars worth of military equipment from them. ..."
"... Until Oil price was high US supported Saudi now they are indirectly supporting Iran ? US always benefit by creating instability. ..."
"... US can be rightly accused of creating instability but Western Asian countries are equally gullible to fall into this trap and sensitize everything with respect to Islam. ..."
"... Iranian hardliners held their breath for a long time during nuke-talks. It might not be possible to micro-manage this influential group every time. Besides this step might save the Al Saud dynasty another day, but how it serves KSA's strategic interests is yet to be seen. No countries except those directly controlled by KSA supported the execution, although they criticised Iran. KSA have no exit from this tip of events. ..."
"... the hints that the Riyadh-plan to ratchet up tensions in the region go beyond vintage tiff or screwing up economics of faraway shale. It is by extension, to my mind, a classic scheme-of-the-art of the eternal Empire over the MENA region, that feeds itself with petrodollars and the military industrial complex. ..."
"... Saudis fought the ottomans by terror and guerilla war, which they preached world over, be it against Soviet occupation of Afganistan, post Saddam Hussaien Iraq government, Wahhabi doctrine education in Madrassas world wide. Their Wahhabi doctrine is the bible for Talibans, ISIL, destruction of Sufi Islam. They are the fountain head for hardline ISLAM ..."
"... there is a strong clannish bonding among the various tribes, a delicate balance that has been assiduously built over two centuries which no ruler would like to disturb. ..."
"... The Saudi government executed the Shia cleric calling him a 'takfir', a usual Islamist practice to justify elimination. There could be several reasons for the execution, but, there are four prominent ones that have not got enough attention. Firstly, the Sunni wahhabi ruling family of al Saud is able to cling on to power only through coercion, bribery and loyalty of clerics going back to the treaty between ibn Wahhab and the Diriyah King bin Saud in the 18th century. ..."
"... The AQ terrorists executed now were caught then, a decade back. The executions, after ten long years, is strange in a country where they are always swift. With its strong backing of the IS, KSA is sending as much a message to the US Iran as it is to its own citizens and the IS. ..."
"... The Iranians fell into the Saudi trap. Sectarianism will remain the bench mark of Mid East politics as desired by the Saudis but this time thanks to hardline Iranian reaction. ..."
Why did Riyadh do this if they knew the consequences would be deadly? A logical
explanation is that it's part of a well-thought-out strategy to whip up
tensions so that the Al-Saud ruling family could tighten its grip on power at
home and embolden its position in the region by amassing the support of the
Sunni regimes. Whether the royals agree or not, Saudi Arabia is facing a major
crisis.
Oil prices are plummeting, endangering the kingdom's economy
. In 2015, it
ran a deficit of $97.9 billion, and has announced plans to shrink its budget
for the current year by $86 billion. This is likely to impact the government's
public spending, and could trigger resentment.
The rentier kingdom relies
heavily on the government's welfare policies, besides its religious appeal, to
drum up public support. The late King Abdullah's response to Arab Spring
protests is an example of this. When people elsewhere rose up against
dictatorships, he announced a special economic package of $70 billion (much of
this money was allocated to build 5,00,000 houses to address housing shortage)
to quell discontent at home. Additionally, the state injected $4 billion into
healthcare. King Salman does not enjoy the luxury of using oil revenues to save
his crown due to the economic crisis. Another option the royals have to
buttress their position is to resort to extreme majoritarianism.
At least four, including Sheikh Nimr, among the 47 executed on
January 2 were political prisoners. By putting them to death, the royal family
has sent a clear message to political dissidents at home. At the same time, the
execution of the country's most prominent Shia cleric would bolster the
regime's Wahhabi credentials among the hardliners. This is a tactic dictators
have often used in history. They go back to extremism or sectarianism to
bolster their hard-line constituency to tide over the economic and social
difficulties. The real aim of the monarchy is to close down every window of
dissidence; if that can't be done through economic development and welfarism,
do it by other means.
Tensions between Iran and Saudi Arabia go back decades
.
Even when
pre-revolutionary Iran and Saudi Arabia were the two pillars of the U.S.'s West
Asia policy, Riyadh and Tehran were regional rivals. The latest phase of this
cold war begins with the U.S.-led Iraq invasion. When Saddam Hussein was
toppled and a Shia-dominated government emerged in Baghdad, Iran was the
happiest regional power. Hussein had been a staunch enemy of Tehran. Saudi
Arabia was alarmed by the changing political equations in Iraq, and had
supported Sunni militancy to prevent the Shias consolidating power in the
post-Saddam set-up. This was one reason that Iraq broke apart later. But the
Americans had assured full support to the Gulf monarchies and kept pressure on
Iran over the nuclear sanctions. When the Barack Obama administration changed
its approach towards Iran, engaging with the Islamic Republic through serious
negotiations, the Saudis were upset. Though Riyadh publicly accepted the
nuclear deal, it was expectedly concerned about Iran's reintegration with the
global economy. That would not only flood the market with cheap oil from Iran,
sending oil prices down further, but also help Tehran rise as a legitimate
regional power.
This Saudi frustration was evident in its Yemen war. Riyadh
started bombing Yemen in March, when the nuclear talks were in the final
stages.
But after nine months, the Saudis are far from meeting their goals -
defeating the Shia Houthi rebels Riyadh calls lackeys of Tehran. On the other
side, despite rhetoric from both sides, the U.S. and Iran have expanded
cooperation from the nuclear deal to Iraq and Iran. In Iraq, American warplanes
provided air cover when the Iraq army and Iran-trained Shia militias fought
Islamic State fighters. As regards Syria, the U.S. agreed to let Iran join the
peace talks, ending years of opposition. Against this background, the Saudis
wanted to escalate tensions with Iran, and further complicate Iran's
re-accommodation in West Asian geopolitical and economic mainstream.
The royals know that the best way is to whip up sectarian tensions.
Iran should have exercised restraint in the wake of Sheikh
Nimr's execution. It could have used the global anger against mass beheadings
in Saudi Arabia to its benefit, particularly at a time it's rebuilding its
position in the region. But lack of a cohesive vision, and maybe the
high-handedness of the hardliners, led Iran to overreact to the executions.
The
attacks on the Saudi embassy in Tehran and the consulate in Mashhad shifted the
world's attention from the executions to Iran's hooliganism, providing Riyadh
an opportunity to extend the bilateral tensions into a diplomatic crisis. This
is exactly what the Saudis wanted. After Saudi Arabia, Bahrain, a Shia-majority
nation ruled by a Sunni monarchy, and Sudan, a Sunni-majority country ruled by
an alleged war criminal who's moving increasingly closer to the Gulf monarchs,
have cut diplomatic ties with Iran. The United Arab Emirates, another Saudi
ally, has withdrawn its envoy from Tehran.
Iran has gained nothing but international condemnation from
attacking foreign missions in its land.
It's yet to recover completely from the
siege of the U.S. embassy in 1979 by hard-line students. In 2011, students
attacked the British embassy in Tehran, forcing London to withdraw its mission.
Full diplomatic ties between the two nations were restored only recently, after
the nuclear agreement. The latest attack may have far-reaching consequences.
It's also possible that hard-line sections within the Iranian establishment,
who are already upset with the moderates over the nuclear deal, might have used
the opportunity to embarrass President Hassan Rouhani. It's also worth noting
that the President has condemned the attack, but not the Supreme Leader Ali
Khamenei, who warned the Saudis of "divine revenge". Whatever led to the attack
has compromised Iran's position in the region.
boopathy
Not really in almost all these points.
US/Obama/Republican/Democrat (any name we call
them) are no fool. They just would like to maintain a balance of power between the two major
sects for their own benefits - control over oil trade. It is not about the numbers here. Whenever
one side dominates, they intervene to create a balance.
We have seen that in sanctions on
Iran (when Iran tried to rise above religious divide), Iraq invasion (suppress sunni domination),
lifting sanctions on Iran (to keep Saudi in check, when Saudi didn't agree to US demand to limit
oil supply to create demand and sustain newly started/quickly depleting US oil production
facilities) and so on to continue in future. We might think that Saudi dominates the region but
ultimate control is with US. They 'll try to maintain this as long as there is oil. Once the oil
is done (may be in another 40 years) they'll leave everything to rot.
What next
One natural victim of these rising tensions will be the Syria peace plan
.
President Bashar al-Assad's regime and a coalition of rebels are supposed to
begin peace talks this month, according to a road map agreed in the UN Security
Council a few weeks ago. Iranian and Saudi cooperation is a must for peace in
Syria, where the ongoing civil war has killed more than 2,50,000 people. The
Saudis back anti-regime rebels and extremists in Syria, while the Iranians
support the Assad government.
Worse, it's not just Syria.
Unless Saudi-Iran tensions are contained
, there won't be an effective
strategy to fight the Islamic State, which is a Sunni-Wahhabi extremist group;
the war in Yemen will go on, endangering many more lives; and Iraq's efforts to
stabilise itself could be challenged. The Saudis look determined to play a
long-term game of sectarian geopolitics to maximise its interests. If the
Iranians continue to respond in the same token, West Asia would remain
turbulent for many more
Sridhar
This brinkmanship from the Saudis cannot be explained easily. In my view, this is a
culmination of several months of anger and desperation because nothing has gone their way!
Loud and clear voices in the US and around the world are blaming extremist Sunni Wahabism for
what ails the Muslim world and this has been funded entirely by the Saudis.
The rise of ISIL and the back-door support to ISIL from the GCC because they are anti-Shia,
is clear to everyone. In short, the Saudis have lost favor with the west and their
petrodollars are shrinking due to low oil price.
Add to this, the fact that the flavor of the month is Rouhani and Iran. The Saudis expected
the attack on Yemen to mobilize support and this did not happen even from friendly Sunni
regimes. Now, Syria is likely to deal from a position of strength because of Russian support
and again the Saudis will be marginalized. Hence, like all bad losers, the Saudis want to make
maximum noise by dumb acts
Vipul
Equally the Saudis cannot behave like they are some kind of
'Demi-Gods' with a license to flout normal rules and regulations. Their
Human Rights record is terrible, they allow no other religions except Islam
in their country, have harsh Sharia laws, Women's rights are non-existent,
they support many terror networks around the World. Unfortunately the West
turns a blind eye to all these misdemeanors from Saudi Arabia as the Saudis
buy billions of dollars worth of military equipment from them.
Ziavudeen
Noting strange about the author. He just showed his
incapability by vomiting the western media statements. Who is benefiting by
causing instability in Middle east region , Middle east or western world?
Until Oil price was high US supported Saudi now they are indirectly
supporting Iran ? US always benefit by creating instability.
Now on top of it they are having fear of fast spreading Islam...
... ... ...
RaviKiran
You cant shift the blame squarely on western media. Saudi
Arabia and Iran have done nothing to improve the image of Islam worldwide.
US can be rightly accused of creating instability but Western Asian
countries are equally gullible to fall into this trap and sensitize
everything with respect to Islam.
Secondly you have no idea about hinduism or
the Varna class. So please refrain from commenting on other religions. Get
your own house in order first.
Subhranil Roy
Iranian hardliners held their breath for a long time during
nuke-talks. It might not be possible to micro-manage this influential group
every time. Besides this step might save the Al Saud dynasty another day,
but how it serves KSA's strategic interests is yet to be seen. No countries
except those directly controlled by KSA supported the execution, although
they criticised Iran. KSA have no exit from this tip of events.
Rajan Mahadevan
Under the last caption of "What next" of above article, lie
the hints that the Riyadh-plan to ratchet up tensions in the region go beyond
vintage tiff or screwing up economics of faraway shale. It is by extension,
to my mind, a classic scheme-of-the-art of the eternal "Empire" over the
MENA region, that feeds itself with petrodollars and the military industrial
complex.
Little wonder then, if the victim remains the Syrian peace plan as
war machines drag on, and worse, if the make-believe 'Islamic State'
continues its nasty business as usual. To be sure, the 'IS' might even gain
grounds for its much-publicised and feared caliphate in Af-Pak territories (
horrors ) and even abroad in Africa or Europe. Meanwhile, a determined Iran
is still playing upon its logical strategies of realpolitik for economic
survival, keeping fingers crossed on the Western sanctions. These are
expected to clear sometime soon, hopefully by month's end. Desperate waiting
games .......
Balasubramanian
Saudis fought the ottomans by terror and guerilla war, which
they preached world over, be it against Soviet occupation of Afganistan,
post Saddam Hussaien Iraq government, Wahhabi doctrine education in
Madrassas world wide. Their Wahhabi doctrine is the bible for Talibans, ISIL,
destruction of Sufi Islam. They are the fountain head for hardline ISLAM
K SHESHU
Iran might have fluttered the advantage of mobilising world
public opinion against Saudi royal family and the repression unleashed by
that country by reacting too much too soon. Still, if Iran does not take
hasty steps, there is a chance of anti-Saudi camp developing as a formidable
force with Russian support.
Subramanyam
(Part 2 of 2) Secondly,
there is a strong clannish bonding
among the various tribes, a delicate balance that has been assiduously built
over two centuries which no ruler would like to disturb.
That was the reason
why the dead were probably carefully chosen from among a large group of AQ
terrorists languishing in jail, to represent the 12 regions of the Kingdom.
In order to further soften the blow, they also decided to execute some Shi'a
so that a semblance of impartiality can be restored. Thirdly, of course, the
salafi Kingdom has always tried to find ways and means to treat its Shi'a
minority as third class citizens and the decision to execute the AQ
terrorists offered an opportunity to eliminate an influential cleric who has
been calling for 'wilayat-al-fiqh' in the Kingdom, the Iranian model of rule
by clerics. Fourthly, the Interior minister Crown Prince bin Nayef may be
trying to assert himself against the impetuous Defence Minister and King
Salman's son Prince Muhammad.
Subramanyam
(Part 1 of 2)
The Saudi government executed the Shia cleric
calling him a 'takfir', a usual Islamist practice to justify elimination.
There could be several reasons for the execution, but, there are four
prominent ones that have not got enough attention. Firstly, the Sunni
wahhabi ruling family of al Saud is able to cling on to power only through
coercion, bribery and loyalty of clerics going back to the treaty between
ibn Wahhab and the Diriyah King bin Saud in the 18th century.
This was
shaken up by Osama bin Laden after Iraq occupied Kuwait and Al Qaeda became
stronger. There was a period between 2002 and 2005 when the Kingdom was
wracked by AQ terror as it became the sworn enemy of the Royalty.
The AQ
terrorists executed now were caught then, a decade back. The executions,
after ten long years, is strange in a country where they are always swift.
With its strong backing of the IS, KSA is sending as much a message to the
US & Iran as it is to its own citizens and the IS.
SHOUKATH ALI
As usual Stanly has hit the nail!
The Iranians fell into the Saudi trap.
Sectarianism will remain the bench mark of Mid East politics as desired by the
Saudis but this time thanks to hardline Iranian reaction.
Ditching the dollar, Iran and India have agreed to settle all outstanding
crude oil dues in rupees in preparation to future trade in their national
currencies. The dollar dues - $6.5 billion equaling 55 per cent of oil payment
- would be deposited in National Iranian Oil Co account with Indian banks.
"... The EIA reported weekly figures that continue to show a stubborn refusal by the U.S. oil industry
to cut back on production. The EIA estimates that the U.S. produced 9.2 million barrels per day (mb/d)
for the last week of 2015, meaning that output levels have remained relatively flat in recent months
despite expectations of a swifter decline. ..."
"... oil demand over the past month, at 19.7 mb/d, is about 2.5 percent lower than a year ago. ..."
"... There was a surprisingly strong drawdown in oil storage levels, with crude inventories falling
by 5.1 million barrels for the week ending on January 1, exceeding analysts estimates. One week does
not make a trend, but storage levels are down from a peak of 490 million barrels reached in December.
..."
...A sense of despair continues to loom over oil markets, a mood that geopolitical unrest probably
cannot undo. The EIA reported
weekly figures that continue to show a stubborn refusal by the U.S. oil industry to cut back
on production. The EIA estimates that the U.S. produced 9.2 million barrels per day (mb/d) for the
last week of 2015, meaning that output levels have remained relatively flat in recent months despite
expectations of a swifter decline.
Gasoline inventories actually increased by 10 million barrels last week as well, and oil demand
over the past month, at 19.7 mb/d, is about 2.5 percent lower than a year ago.
But all is not lost. There was a surprisingly strong drawdown in oil storage levels, with
crude inventories falling by 5.1 million barrels for the week ending on January 1, exceeding analysts'
estimates. One week does not make a trend, but storage levels are down from a peak of 490 million
barrels reached in December.
Important info: r
ig efficiency has more than doubled compared with a couple of years ago, and
is about 50% higher than just a year ago. It's not enough to keep production up, but it helps.
Notable quotes:
"... Net Cash Flow math is actually quite similar to Net Oil Export math, to-wit, given an ongoing decline in gross cash flow from production sales, unless total costs (lease operating expenses plus G A overhead) fall at the same rate as, or at a faster rate than, the rate of decline in gross cash flow, the resulting rate of decline in net cash flow will exceed the rate of decline in gross cash flow and the rate of decline in net cash flow will accelerate with time. ..."
"... This implies a tremendous mismatch between remaining cumulative net cash flow and debt levels (especially for tight/shale players). ..."
"... rig efficiency has more than doubled compared with a couple of years ago, and is about 50% higher than just a year ago. Its not enough to keep production up, but it helps. ..."
"... a further rig count drop may be more noticeable, as we then may see also the high-powered rigs leaving. During the last webcast in December, Helms mentioned that there were 65 rigs drilling, but that in the first half of 2016 it could drop to 55. Currently with 57 rigs drilling, and 3 up for stacking, that may come sooner than he expected. ..."
"... As we can see from yours and Ciaran Nolans charts, there was only a very modest increase in average well productivity in the Bakken. So the key factor supporting output levels was more efficient drilling: more wells per rig ..."
...a reasonable estimate is that the US oil industry had to put on line about 0.25 million
bpd of new C+C production in 2008, just to offset declines from exiting wells, whereas they probably
now have to put on line somewhere around 1.4 million bpd of new C+C production per year, just
to offset declines from existing wells.
"It is these companies which find themselves inside this toxic feedback loop of declining liquidity,
which forces them to utilize assets even faster, thus even further shrinking the borrowing base
against which their banks have lent them money, that will be at the forefront of the epic bankruptcy
wave that is waiting to be unleashed across the US.
Net Cash Flow math is actually quite similar to Net Oil Export math, to-wit, given an ongoing
decline in gross cash flow from production sales, unless total costs (lease operating expenses
plus G&A overhead) fall at the same rate as, or at a faster rate than, the rate of decline
in gross cash flow, the resulting rate of decline in net cash flow will exceed the rate of
decline in gross cash flow and the rate of decline in net cash flow will accelerate with time.
This has "Interesting" implications for the remaining cumulative net cash flow from developed
producing properties. Of course, the gross cash flow from producing properties can decline
when (not if) that production declines and/or if the price declines.
This implies a tremendous
mismatch between remaining cumulative net cash flow and debt levels (especially for tight/shale
players).
Enno Peters,
01/06/2016 at 2:11 pm
Alex,
Exactly. This is why the # wells drilled has fallen off much slower than the rig count. See
the graph from ND, which shows the rapid increase in efficiency over the last months, as less
efficient rigs/crews/methods were dropped:
rig efficiency has more than doubled compared with
a couple of years ago, and is about 50% higher than just a year ago. It's not enough to keep production
up, but it helps.
I think it also means that
a further rig count drop may be more noticeable, as we then may see
also the high-powered rigs leaving. During the last webcast in December, Helms mentioned that
there were 65 rigs drilling, but that in the first half of 2016 it could drop to 55. Currently
with 57 rigs drilling, and 3 up for stacking, that may come sooner than he expected.
AlexS,
01/06/2016 at 2:25 pm
Thank you, Enno.
As we can see from yours and Ciaran Nolan's charts, there was only a very modest increase in
average well productivity in the Bakken. So the key factor supporting output levels was more efficient
drilling: more wells per rig
BTW, many thanks for your excellent post on refracking in ND!
"... Price per barrel should reach $100 shortly after most of the shale players are out of money or bankrupt. ..."
"... The vulture capital money is waiting in the wings to buy up the better assets for pennies on the dollar. Brand new, debt-free companies will be formed and they will be ready to go public just as the price of oil starts to rise. Rinse and repeat. ..."
"... Most of those folks who invested in shale drillers when oil was around $100 a barrel lost most of their investment. ..."
"... Public or private, the pricing must be absolutely crushing. ..."
"... I wish the bankruptcies would hurry up because the paranoid corner of my brain tells me that when the almighty money almagamations like the Carlyle Group swoop in and buy up all the distressed assets, we just might see oil prices rebound. The vultures wont have the motive to short the heck out of oil, like they are now. ..."
"debt fueled financing boom in the shale space will most likely never return."
As a result, the industry will likely move to self-funding capital expenditures through free
cash flow generation in an attempt to significantly reduce its reliance on leverage. Debt levels
will initially have to be reduced, significantly fueling a cycle of dramatically lower capital
expenditures and consolidation. This process is already underway, but still has a long way to
go."
Price per barrel should reach $100 shortly after most of the shale players are out of money
or bankrupt.
Arceus
, 01/05/2016 at 4:32 pm
OFM said: "There will be plenty of money available to put the tight oil industry back on its
feet when prices get high enough."
Yes, that is true.
The "vulture capital" money is waiting in the wings to buy up the better
assets for pennies on the dollar. Brand new, debt-free companies will be formed and they will
be ready to go public just as the price of oil starts to rise. Rinse and repeat.
There will be plenty of money available to put the tight oil industry back on its feet when
prices get high enough to generate profits. If the banks won't loan to the industry, people
with money will finance it personally.
Don't be too sure about that.
Most of those folks who invested in shale drillers when oil
was around $100 a barrel lost most of their investment.
If oil gets high again, what guarantee
will investors have that oil prices will not collapse again? Once bitten, twice shy.
The difference this time is that private equity will be buying prime assets at the bottom of a
commodity cycle that is essentially a turn-key operation with experienced management in place
and with hundreds of drilled but uncompleted wells. They'll make a killing, I imagine, then go
public.
Just a few days ago, Hilcorp – one of the more successful, privately owned E&P companies – just
entered into a partnership of sorts with the Carlyle Group in order to acquire assets.
Carlyle is putting up one and a quarter billion bucks and Hilcorp will be providing the operational
expertise.
In addition to just dispensing $100,000 bonuses to each of its several thousand employees,
Hilcorp is somehow managing to operate profitably in the northwest corner of the Pennsylvania
… something pretty much unheard of.
Arceus,
01/05/2016 at 5:07 pm
I have heard, and perhaps you can verify, that the typical privately owned e&p companies have
far superior assets to the typical small-cap, publicly traded e&p company.
coffeeguyzz,
01/05/2016 at 5:32 pm
Arceus
Sorry, don't know too much about that end of this business.
Public or private, the pricing
must be absolutely crushing.
shallow sand,
01/05/2016 at 7:47 pm
I wish the bankruptcies would hurry up because the paranoid corner of my brain tells me
that when the almighty money almagamations like the Carlyle Group swoop in and buy up all the
distressed assets, we just might see oil prices rebound. The vultures won't have the motive to
short the heck out of oil, like they are now.
Keep in mind, just the paranoid part of me talking here, don't know to what extent I believe
this to be true.
Arceus,
01/05/2016 at 6:45 pm
Here is the money quote from Pioneer in explaining why they are doing a secondary offering
despite outperforming expectations: "Capital spending will range from $2.4 billion to $2.6 billion
this year, up from about $2.2 billion in 2015, in part because oil wells in the Permian Basin
in West Texas have outperformed expectations, Pioneer said in a separate statement Tuesday. In
other words, better production results means the company needs more money.
shallow sand,
01/06/2016 at 12:23 am
Need to eat a little humble pie re PXD. They are better hedged than most in 2016. They do have
some monster Sprayberry leases. Just can't tell how many wells are on those.
However, the additional barrels/mcf aren't hedged, so seems odd to dilute shareholders to grow
production past the volumes hedged.
See http://ir.eia.gov/wpsr/wpsrsummary.pdf
There was a surprisingly strong drawdown in oil storage levels, with crude
inventories falling by 5.1 million barrels for the week ending on January 1, exceeding analysts'
estimates. One week does not make a trend, but storage levels are down from a peak of 490 million
barrels reached in December.
The EIA estimates that the U.S. produced 9.2 million barrels per day (mb/d)
for the last week of 2015. Gasoline inventories increased by 10 million barrels last week. Oil
demand over the past month is about 2.5%t lower than a year ago (current is 19.7 mb/d)
Summary of Weekly Petroleum Data for the Week Ending January 1, 2016
U.S. crude oil refinery inputs averaged over 16.6 million barrels per day
during the week ending January 1, 2016, 65,000 barrels per day less than the previous week's
average. Refineries operated at 92.5% of their operable capacity last week. Gasoline
production decreased last week, averaging about 8.8 million barrels per day. Distillate
fuel production increased last week, averaging 5.0 million barrels per day.
U.S. crude oil imports averaged over 7.5 million barrels per day last week,
down by 382,000 barrels per day from the previous week. Over the last four weeks, crude
oil imports averaged about 7.8 million barrels per day, 5.9% above the same
four-week period last year. Total motor gasoline imports (including both finished
gasoline and gasoline blending components) last week averaged 602,000 barrels per day.
Distillate fuel imports averaged 164,000 barrels per day last week.
U.S. commercial crude oil inventories (excluding those in the Strategic
Petroleum Reserve) decreased by 5.1 million barrels from the previous week. At 482.3
million barrels, U.S. crude oil inventories remain near levels not seen for this time
of year in at least the last 80 years.
Total motor gasoline inventories increased by 10.6
million barrels
last week, and are in the upper half of the average range. Both finished
gasoline inventories and blending components inventories increased last week.
Distillate fuel inventories increased by 6.3 million barrels last week
and are near the
upper limit of the average range for this time of year. Propane/propylene inventories fell 1.4
million barrels last week but are well above the upper limit of the average range. Total
commercial petroleum inventories increased by 7.3 million barrels last week.
Total products supplied over the last four-week period averaged 19.7 million
barrels per day, down by 2.5% from the same period last year. Over the last four weeks,
motor gasoline product supplied averaged 9.0 million barrels per day, down by 3.6%
from the same period last year. Distillate fuel product supplied averaged over 3.5
million barrels per day over the last four weeks, down by 9.3% from the same period last year.
Jet fuel product supplied is down 0.9% compared to the same four-week period last year.
Refinery inputs down 65,000 bopd, usage at 19.7 mmbopd, yet gasoline plus
diesel rose 2+ million barrels per day??
It appears to be more of an anomaly to me, but the market has bought the story,
hook line and sinker.
Expectations of oil price rise in the second half of 2016 to above $50 level now look less
realistic.
Notable quotes:
"... Submitted by Nick Cunningham via OilPrice.com, ..."
"... Oil output in the U.S. has declined by about 300,000 barrels per day to 9.3 million barrels per day (mb/d). Most energy prognosticators, including the EIA and the IEA, see U.S. production falling by around 0.5 mb/d in 2016. The decline could be steeper than that, however, given the plunging rig count, high depletion rates, and extraordinary capex cuts. Time will tell. ..."
"... Within a few months, Iran says it could bring another 500,000 barrels per day back. ..."
"... Through mid-November, 36 oil and gas companies filed for Chapter 11 bankruptcy , encompassing $13 billion worth of debt. That figure will rise in 2016. Reuters reported on a rising incidence of forced bankruptcies, in which creditors take delinquent oil and gas companies to court over failed payments. ..."
"... IEA says that crude oil demand increased by 1.8 mb/d in 2015. The world will add another 1.2 mb/d next year, helping to erase most of the supply overhang. ..."
What can we expect in 2016? Here is a rundown of some key trends to watch for:
1. U.S. oil production contracts.
Oil output in the U.S. has declined by about
300,000 barrels per day to 9.3 million barrels per day (mb/d). Most energy prognosticators, including
the EIA and the IEA, see U.S. production falling by around 0.5 mb/d in 2016. The decline could be
steeper than that, however, given the plunging rig count, high depletion rates, and extraordinary
capex cuts. Time will tell.
... ... ...
3. Dividends on the rocks.
For oil and gas companies, dividends are sacrosanct.
Companies have drastically reduced spending on new projects and severely culled payrolls in order
to stop the bleeding. But how long can they hold out before cutting dividends? Are dividends worth
protecting if it means sacrificing future production growth? Eni already slashed its dividend in
2015, the largest company to do so. Marathon Oil recently
cut
its dividend as well. Could the oil supermajors be next?
... ... ...
5. Iran returns.
The historic nuclear agreement in 2015 will allow Iran to come
back to the oil markets after over four years of isolation. Iran plans on bringing back 500,000 barrels
per day almost immediately after sanctions are lifted, which could come as soon as January.
Within
a few months, Iran says it could bring another 500,000 barrels per day back.
The extra supply will
bring OPEC's output above 32 mb/d, and will add to the giant global pool of oil.
... ... ...
8. Defaults and bankruptcies.
Through mid-November, 36 oil and gas companies
filed for Chapter 11 bankruptcy
, encompassing $13 billion worth of debt. That figure will rise
in 2016. Reuters
reported
on a rising incidence of forced bankruptcies, in which creditors take delinquent oil
and gas companies to court over failed payments.
With the additional negative effects from the recent
downturn into the mid-$30s per barrel still to be sorted out, the default rate should accelerate
in the next few months.
... ... ...
10. Prices rise.
While everyone was wrong about the price rebound in 2015, all
eyes are on late 2016 for the correction.
IEA says that crude oil demand increased by 1.8 mb/d in
2015. The world will add another 1.2 mb/d next year, helping to erase most of the supply overhang.
Rising demand will come as supplies fall. That could allow prices to
rise
to $60 per barrel by late 2016.
Before the sharp drop in oil prices, most LTO and shale gas producers were profitable, but only
a few of them were cash-positive is a sense that they had profits in the profit & loss account, but
their capex exceeded cashflow from operating activities. Now prices are $25 for oil and $1.75 for
gas. So even though well costs are way down, the wells wont payout. Mass extinction of
shale/tight oil players is expected if low prices stay for 2016. Huge damage to US oil
exploration and production infrastructure is also in cards. I don't think cash flow negative
oil companies are drilling to hold a lease. They are drilling because they would be
officially bankrupt if they stop. As long they are drilling extend and pretend game can continue for
a little longer. If banks are realistic, almost all LTO is insolvent and should not qualify for any
more debt. Given that none have significant cash, this should spell trouble.
When we see an oil and gas price recovery, and presumably an attempt to increase drilling and
completion efforts, one wonders how many service companies will still be in business, when E&P
companies start calling about drilling and completing new wells.
It seems to be an article of faith among most analysts that US oil & gas companies can increase
production on a very short notice, but I think that a point that almost all analysts are missing
is that the US rig count number in 2014 was the result of about a 10 year plus increase in US
Lower 48 service company infrastructure and personnel.
That service company infrastructure and personnel base, which took 10 years or more year to
build up, is fading away now, literally on a daily basis. And of course, as many people have pointed
out, it's going to be much, much more difficult for tight/shale players to get debt financing
going forward.
Also, the annual volumetric loss of production from existing wells, due to depletion, increases
as total production increases and we have also seen an increase in the annual volumetric loss
of production due to the huge increase in the underlying decline rate from existing wells. Let's
assume existing US wells lost 0.25 million bpd of C+C production in 2008 (5% of 5 million bpd).
At a 15% annual loss from a production base of 9.1 million bpd, the industry would have to put
on line about 1.4 million bpd of new C+C production every year, just to offset declines from existing
wells.
US drilling rig fleet is sufficient to support a significant increase in drilling activity. While
a number of older rigs were scrapped, most of the rigs are idled and ready to restart the work.
And, in general, drilling rig fleet is now much more efficient than 5-7 years ago.
Getting debt
financing should indeed be a big problem for shale players.
While debt levels are generally manageable, debt ratios are not too high, and most of the debt
is maturing beyond 2020, shale players need large amounts of new financing just to keep flat production.
Although banks have refinanced most of US E&Ps' credit facilities in 2015, they did not provide
new loans.
There was a lot of new bonds and equity issues in 1Q-2Q15, but this source of funding started
to dry up in the second half of the year as investors understood that low oil prices are likely
to stay for longer.
My guess is that even when oil prices start to recover, both shale players and their lenders will
be much more cautious than in the years of the shale boom.
LTO output is likely to recover, but its growth rates will be relatively modest (a few hundred
kb/d per year, rather than 1 mb/d on average in 2012-14).
And by the end of this decade we will likely see the effects of declining productivity in the
sweet spots.
We shall see. But a lot of equipment is rusting away and literally degrading on a daily basis,
inclusive of everything from drilling rigs to frac units to workover rigs. On the personnel side,
many people that have been laid off won't come back, and many older workers have retired, or are
retiring or passing away, or have become unable to work. In regard to field work, many of those
that do come back will have to be retrained and pass drug tests.
"US drilling rig fleet is sufficient to support a significant increase in drilling activity. While
a number of older rigs were scrapped, most of the rigs are idled and ready to restart the work.
And, in general, drilling rig fleet is now much more efficient than 5-7 years ago."
Totally
agree. Having gone through several "cycles" the mechanical part of any business is never a significant
constraint on a rebound. Any "restraint" is related almost entirely to financing with a small
component attributable to availability of skilled labor - which never lasts long. Even state of
the art offshore rigs can be assembled fairly quickly.
US Rotary Rig Count (oil & gas) Versus WTI Crude Oil Price Chart
Note that it took about five
years to go from around 1,000 rigs to around 2,000 rigs, circa 2003 to 2008, and it looks like
the rotary rig count, except for the 2009 "V" shaped oil and rig count crash, has been around
1,800 to 2,000, until the recent oil price decline, which is much more extended than the 2008
oil price decline (which bottomed out in December, 2008).
In any case, note that even during the "V" shaped decline in 2009 it looks like it took about
two years to get back to around 2,000 rigs, from a low of less than 1,000 rigs.
As noted above, a lot of rigs that were in dry gas plays, like the Barnett, moved to oil and
liquids rich plays, starting in 2008. As also noted above, a reasonable estimate is that the US
oil industry had to put on line about 0.25 million bpd of new C+C production in 2008, just to
offset declines from exiting wells, whereas they probably now have to put on line somewhere around
1.4 million bpd of new C+C production per year, just to offset declines from existing wells.
In any case, my guess is that, for all the reasons discussed above, even given a rising oil
price environment, the increase in the rig count will look more like the 2003 to 2008 rig count
increase, rather than the 2009 to 2011 rig count increase.
The total comes in at 17.5 million topping the sales record from 2000, when 17.4 million vehicles
was sold. That might increases the demand for oil althouth it is not clear how many of them are replacement
for junked cars and how many are new buys.
carmakers posted record sales for 2015 and profitability has been strong. All told, automakers
sold about 17.5 million cars in the United States in 2015, eclipsing the prior record of 17.4 million
all the way back in 2000. GM and Ford, the main U.S. automakers, haven't posted 2015 earnings yet,
but both seem poised for double-digit gains compared with 2014.
GARY
The big news is that the good auto sales were only possible through the use of subprime car
loans. Millions of Americans with lousy credit were given subprime car loans, and their ability
to pay them back is dubious.
And the duration of the loans is longer than ever, which means the sales are borrowed from
the future. This is analogous to the housing bubble that burst in 2008/2009.
With the oldest fleet on the road in history, there was incredible pent up demand for cars.
So few cars were sold between 2009 and 2014, no wonder sales finally increased in 2015.
Grabaroot
They are cyclical. Worse yet, they are now propped up by seven-year loans and subprime loans.
And, the government has decided that U.S. automakers belong to them and the unions. The real owners
will get left out in the cold, again and again. Oh, and they build P'sOS. There's that.
Charlie
Dow Futures off 129... Freightliner trucks lays off 936, Volvo trucks 700+ Mack 400+
but unemployment is steady at 5.0% the economy is great.... Huh???
Regarding US light vehicle sales, 2015 was an all time record high.
WSJ article:
Big SUVs Fuel U.S. Production Boom
The tables have turned for the U.S. auto industry and Arlington, Texas, is among the biggest
winners, straining to meet demand for its hulking sport-utility vehicles despite running three
production shifts a day.
In October 2015, the World Bank lowered its 2016 forecast for crude oil prices
from $57 a barrel to $52 a barrel, due in part to expectations that Iranian oil
exports would rise once international sanctions were lifted.
"Crude oil oversupply is still in play; however the deficit between demand
and supply is getting smaller," said Daniel Ang, an investment analyst at Phillip
Futures, in a note on Wednesday. "Possible changes to global supply should come
from the U.S. and Iran."
Iranian oil exports are widely expected to increase in 2016 as Western sanctions
against the country for its alleged nuclear weapons program are likely to be
lifted.
Still, a senior Iranian oil official said the country could moderate oil
output and exports once the sanctions are lifted to avoid putting prices under
further pressure.
"We don't want to start a sort of a price war," Mohsen Qamsari, director
general for international affairs of the National Iranian Oil Company (NIOC),
told Reuters in an interview.
"We will be more subtle in our approach and may gradually increase output,"
Qamsari said. "I have to say that there is no room to push prices down any further,
given the level where they are."
Government supported dozens of alternative energy projects because they were to risky for the
private sector (who only evaluate profits) but had societal benefits justifying the risk. One
of these risky projects failed. Is that supposed to be a surprise or somehow prove the "failure"
of the original investment. For someone who pray at the alter of market forces this old McLaughlin
clown is remarkably clueless to the concept of risk.
Carol :
I would hardly say that the Solyndra failure was "spectacular" especially since it was due to
mismanagement. The Lehman Brothers' failure was spectacular. The Not A Depression was a conflation
of spectacular failures. The Solyndra failure was only spectacular because the Republicans kept
pointing to it, making it a spectacle, like a circus freak.
cawley :
"When I was at the Council of Economic Advisers under President George W. Bush, we believed
that an across-the-board energy policy was by far the best approach - and that included solar."
That was before Obama. Ben obviously has not read the conservative manual which is inexcusable
because it is pretty short: "If BHO is for it, we're against it."
On the topic of federal subsidies and climate, the Bureau of Land Management provides subsidized
grazing land to around 20,000 cattle operations. The difference between the BLM grazing fees and
the market value of the land amounts to about $100 million a year. Some "conservative" ranchers
feel it is a great injustice -- and "unconstitutional" -- that they have to pay any fees at all.
About a quarter of methane gas emissions in the U.S.A. comes from "enteric fermentation". Methane
gas is a greenhouse gas. Flatulence from federally subsidized cattle operations accounts for an
estimated half of one percent of annual methane emissions and a fiftieth of a percent of total
greenhouse gas emissions.
Solyndra would have never gone bankrupt if it had exercised its "second amendment right" to
bear arms in refusal to pay its operating expenses.
"The takeover of a federal wildlife refuge in Oregon appears to be more than just a protest
of the impending imprisonment of two ranchers who set fires that spread into public lands. The
armed demonstrators are led by Ammon Bundy, whose father, Cliven, has refused to acknowledge the
legitimacy of the federal Bureau of Land Management to own some public lands or to regulate their
use for grazing. But the government is giving the Bundy family a pretty good deal on the grazing
rights it refuses to pay for."
Chigliakus :
Solar and wind power continue to get cheaper, and in fact the cost per MWh of a solar install
has dropped below the cost of just the fuel to run a natural gas "peaker" plant mentioned in the
article. Wind power prices stopped dropping for a couple years due to materials shortages (lack
of sufficient carbon fiber was a big part of the problem from what I understand) but is now back
on a downward trend.
The big problem with these two technologies is variability, and until recently I thought this
would limit their deployment and total grid share of power production. As it turns out the cost
of batteries has been dropping substantially over the past couple decades and apparently benefits
from economies of scale thanks to the mass production of them for things like electric vehicles
and consumer electronic devices. This "learning curve" is seen in many industries, and if battery
prices continue to drop we could have economically viable grid scale energy storage in less than
10 years. Solar and wind already compliment each other in that the wind tends to blow when the
sun doesn't shine and vice versa, so with enough storage there's nothing to stop us from abandoning
fossil fuels for electricity production.
DeDude -> Chigliakus...
Solar thermal is actually a real neat alternative. It easily allows the short term storage (shift)
needed from peak mid afternoon production to peak early evening use. It also is able to collect
and convert a higher fraction of the solar energy to electricity.
"... Clearly oil and natural gas wells are causing the problems as the second to last paragraph points away from disposal wells. ..."
"... The only thing which has changed is the new process of hydraulic fracturing in shale which began in the state in 2008, the same time as earthquake numbers rapidly increased. Weird coincidence dont you think? ..."
A 4.2 magnitude earthquake struck north Oklahoma City early on New Year's Day, the latest in a
series of temblors in the area in recent days that has prompted state regulators to call for more
restrictions on oil and gas operators.
... ... ...
The temblor is the latest of at least a dozen since Tuesday, when a 4.3 magnitude earthquake was
recorded. Oklahoma has become one of the most earthquake-prone areas in the world, with the number
of quakes magnitude 3.0 or greater skyrocketing from a few dozen in 2012 to more than 800 in 2015.
Many of the earthquakes are occurring in swarms in areas where injection wells pump salty wastewater
– a byproduct of oil and gas production – deep into the earth. As a result, state regulators have
begun reducing the volume or shutting down disposal wells in response.
However, the Edmond area has not previously been associated with the activity.
The Oklahoma Corporation Commission issued a statement on Friday saying its Oil and Gas Division
staff were taking action in response to the earthquakes in Edmond and that details should be available
on Monday.
OnthePlains -> riveness
4 Jan 2016 06:31
Yes but what wells are causing the problems? The second last paragraph points away from
oil and gas wells.
Pay attention to the words and the answer is in front of you.
Clearly oil and natural gas wells are causing the problems as the second to last paragraph
points away from disposal wells.
Nowhere in the state of Oklahoma is more than 15 miles from oil or natural gas wells. My daily
newspaper tells me wells were completed in all the counties surrounding and close to the city
of Edmond in the last week.
As a result of the earthquakes and further study of the three dimensional seismic surveys produced
by the oil companies they discovered a previously unknown fault line running under the area where
the earthquakes occurred. It runs parallel to the Nemaha uplift and Interstate 35.
OnthePlains -> CETOo6
4 Jan 2016 06:18
Fracking explodes the rock under huge pressure to release oil. Old school they just drilled
in and let come what may. The fracking leaves voids and allows ground to move.
Not exactly.
What it does it create a micro-earthquake to fracture the shale layer spread over distances
of up to 12 square miles at a time underground. That fracture then releases hydrocarbons trapped
in the pores of the rock.
What then happens is previously unknown faults in the rock strata from the time of the dinosaurs
are reactivated creating bigger earth movements.
CETOo6 -> CETOo6
4 Jan 2016 05:14
Check out the Netherlands. 50,000 peoples homes affected. Cracking. Falling down. From years
of gas extraction. Oil company turn a blind eye lead them down the garden path for years. Government
steps in to order demolition of the home. This world we live in is fubar! Imagine its your home....
CETOo6 -> OnthePlains
4 Jan 2016 04:46
Old mate. Fracking explodes the rock under huge pressure to release oil. Old school they just
drilled in and let come what may. The fracking leaves voids and allows ground to move. Reinjecting
(SUPER TOXIC) water lubricates soils again.
Fracking is idiotic. Anyone who believes in it is an idiot. Anyone who supports oil is an idiot.
Google nigeria oil deltas. You look hard enough you will see the undercover messes the oil companys
have made.....
dphaynes -> iOpenerLo114Lat51
3 Jan 2016 19:11
Is there any denial too absurd for the anti-science global conspiracy nutcases to make?
Frank - this data shows the # of earthquakes in Oklahoma corresponds directly to the
waste water injection.
I have to take issue with the waste water injection theory.
The earthquakes began in rapidly increasing numbers in 2008, the same year as they started
fracking in shale.
Oklahoma has used deep injection wells for salt water disposal since 1907. Peak oil production
occurred in 1927 and more oil was produced right up to the 1980's price crash than today.
If more water was produced and disposed of in the past why did the earthquakes only begin in
such increasing numbers after the advent of a new extraction technique?
Yetypu -> OnthePlains
2 Jan 2016 10:25
Typically in Oklahoma 10 barrels of "fossil" water are produced with every barrel of
oil so that's a heck of a lot of waste produced by fracking and conventional well
That ten to one ratio is for old water-drive sandstone & limestone wells - you have previously
had it pointed out to you that it is one tenth to one half of a barrel of water to one of oil
in a fracced shale well.
the earthquake swarms only started in 2008 when ...
... the high oil price led to a surge in production from high water-cut sandstone & limestone
wells.
more oil was produced up to 1985 than it is today
But at a far lower water-cut, meaning that far more water is produced 'today'.
OnthePlains -> raggedbandman
2 Jan 2016 10:07
Yet here we are with one small earthquake that admittedly is probably from deep-well
injection but all the greenies are screaming FRACKING!
Probably not from deep well injection because there aren't any in that area, but there is fracking
around 300 million year old fault lines they didn't previously know were there.
Only a fraction of the waste generated by the oil and gas industries is from the well
fracking process.
Typically in Oklahoma 10 barrels of "fossil" water are produced with every barrel of oil so
that's a heck of a lot of waste produced by fracking and conventional wells.
The odd thing is the earthquake swarms only started in 2008 when they started fracking in shale.
There were always naturally occurring earthquakes, about 1 a decade over magnitude 4.0 and
an average of less than three a year over 3.0. A small cluster took place in the 1950's when Oklahoma
was in the process of damming rivers and constructing lakes after the dust bowl.
Last year Oklahoma had almost 900 earthquakes over magnitude 3.0 (about three to four times
as many as California) and 26 over 4.0.
The state has used disposal wells for salt water produced with oil since 1907, peak oil production
in the state was in 1927, more oil was produced up to 1985 than it is today, therefore much more
water was injected underground in disposal wells in the past without producing thousands of earthquakes.
The only thing which has changed is the new process of hydraulic fracturing in shale which
began in the state in 2008, the same time as earthquake numbers rapidly increased. Weird coincidence
don't you think?
Steven Pope -> franksw
2 Jan 2016 09:54
Frank - this data shows the # of earthquakes in Oklahoma corresponds directly to the waste
water injection. We went from 2 earthquakes a year to more than 800 last year, which was more
than any other state in the USA combined:
"... ...On Tuesday, Aramco said it was deepening the discount for its light crude by $0.60 a barrel to Northwest Europe and by $0.20 a barrel in the Mediterranean for February delivery. ..."
"The Saudis are preparing for Iran's return," said Mohamed Sadegh Memarian, who recently retired
as the head of petroleum market analysis at Iran's oil ministry, as they sharply cut the prices they
charge for crude oil in Europe (to the biggest discount since Feb 2009). The move that will likely
undercut Iran happens as sectarian tensions escalate between the rival Middle Eastern nations. As
WSJ reports, the Saudi move appears to pave the way for a competition over European oil markets later
this year when Iran is expected to increase its exports after the expected end of western sanctions
over its nuclear program.
... ... ...
...On Tuesday, Aramco said it was deepening the discount for its light crude by $0.60 a barrel
to Northwest Europe and by $0.20 a barrel in the Mediterranean for February delivery.
...The European Union is set to lift an embargo on Tehran as soon as next month.
"... it expected production for all of 2015 to be between 7% and 8% higher. ..."
"... the industry-wide focus on improving production efficiency coupled with investments of more
than £50bn over the last four years to bring new fields on stream across the last 12 months is paying
off and yielding a better result." ..."
"... Oil producers such as Shell, Centrica and BP have slashed investment and announced thousands
of job cuts to adapt to crude priced below $40 a barrel amid slowing demand and a glut of oil. Many
new fields in the North Sea were commissioned when oil was trading at more than $100 a barrel and, Michie
said, there would be more job losses this year. ..."
Government statistics for the first 10 months of 2015 show oil and gas produced on the UK continental
shelf up 8.6% from a year earlier, the industry body Oil & Gas UK said. It added that, based on that
number, it expected production for all of 2015 to be between 7% and 8% higher.
... ... ...
Deirdre Michie, Oil & Gas UK's chief executive, said: "In February 2015 we predicted a marginal
increase in production for 2015, but the industry-wide focus on improving production efficiency
coupled with investments of more than £50bn over the last four years to bring new fields on stream
across the last 12 months is paying off and yielding a better result."
Oil producers such as Shell, Centrica and BP have slashed investment and announced thousands
of job cuts to adapt to crude priced below $40 a barrel amid slowing demand and a glut of oil. Many
new fields in the North Sea were commissioned when oil was trading at more than $100 a barrel and,
Michie said, there would be more job losses this year.
"The fact is that the value of our product has more than halved," she said. "Times are really
tough for this industry and for the people working in it. We will continue to see job losses as we
move into 2016 and we must be thoughtful and supportive of our colleagues and their families who
are being made redundant or who are at risk of being made redundant."
"... The public got bamboozled by the Ponzi scheme of shale oil. It seemed like a fabulous techno-rescue: the "fracking miracle!" It operated by converting mountains of cheap leveraged capital into a very rapid bump-up in US oil production. It got full traction after a couple of years of $100 oil squashed economic activity - and then squashed demand for oil. Whoops. The problem was that shale oil was very expensive to produce even if reduced demand drove the market price very low. Back at $100-plus a barrel, hardly anyone made any profit on shale. At $40 a barrel shale was a laughable loser. So, in 2015, the shale oil companies laid off thousands of workers, idled the drilling rigs, and kicked back to pray that the price would go back up. ..."
"... The rapid ramp-up in shale oil production from 2010 to 2014 was intended as a demonstration project to convince Wall Street to stuff ever more investment capital into oil companies. It was also part of an enormous PR campaign to allow the people running things in business and government to pretend that America's oil problems were behind us. The "shale miracle" was going to make us "Saudi America," It was going to boost us into "energy independence." It played into the Master Wish beneath all the wishful thinking in America: Please, God, let us be able to drive to WalMart forever. It wasn't so much an evil conspiracy as a feckless collective effort in denial and self-delusion ..."
"... What lies ahead in 2016 is a debacle of bond defaults and corporate bankruptcies in the US oil patches. What's more, because of the peculiar geology of shale oil and the rapid depletion of the fracked wells, it is necessary to incessantly drill and frack new wells to keep production even level, let alone rising. That calls for evermore rounds of new financing. But since the current financial obligations can't be serviced, new financing will not be not forthcoming. And so neither will additional production. All of which means that shale oil production is going to crash in 2016 when the backlog of previously-drilled but untapped wells runs out. I'll predict that US oil production will go down a million barrels a day before 2017. That includes the roughly 5 percent annual decline of conventional oil. ..."
"... Another problem is that the oil price crash has done significant damage to the oil industry itself, including its credibility as a viable target for investment. Contrary to hopes and expectations, current low oil prices are doing nothing to re-stimulate economic activity. It all has the look of a self-reinforcing feedback loop, a downward spiral in a global complex networked system getting clobbered by the diminishing returns of its principal activities. ..."
"... I would predict that the price of oil will fall further in 2016, below the $30 mark, and that it will lead to more carnage in the oil industry, in banking and debt defaults, and to new manifestations of geopolitical trouble that could lead to profound oil scarcities and rationing. ..."
The oil picture has bamboozled both the broad public and the smaller cohort of supposedly sentient
observers. I maintain that the deflationary contraction underway worldwide is largely due to the
fact that the world has run out of a particular form of oil:
affordable
oil. Turns out the
peak oil story is still true, just playing out differently than a lot folks predicted. We're at the
mercy of a pretty basic equation: oil over $75-a-barrel destroys industrial economies; oil under
$75-a-barrel destroys oil companies. There is no "just right" Goldilocks place on the gradient.
The public got bamboozled by the Ponzi scheme of shale oil. It seemed like a fabulous techno-rescue:
the "fracking miracle!" It operated by converting mountains of cheap leveraged capital into a very
rapid bump-up in US oil production. It got full traction after a couple of years of $100 oil squashed
economic activity - and then squashed demand for oil. Whoops. The problem was that shale oil was
very expensive to produce even if reduced demand drove the market price very low. Back at $100-plus
a barrel, hardly anyone made any profit on shale. At $40 a barrel shale was a laughable loser. So,
in 2015, the shale oil companies laid off thousands of workers, idled the drilling rigs, and kicked
back to pray that the price would go back up.
Which it didn't. Incidentally, all kinds of associated
ventures went bust with that. The landscape of North Dakota is littered with unfinished garden apartment
complexes that may never be completed, and the discharged construction carpenters and roofers drove
back to Minnesota ahead of the re-po men coming for their Ford F-110s. Sad, I know….
The rapid ramp-up in shale oil production from 2010 to 2014 was intended as a demonstration
project to convince Wall Street to stuff ever more investment capital into oil companies. It was
also part of an enormous PR campaign to allow the people running things in business and government
to pretend that America's oil problems were behind us. The "shale miracle" was going to make us "Saudi
America," It was going to boost us into "energy independence." It played into the Master Wish beneath
all the wishful thinking in America: Please, God, let us be able to drive to WalMart forever. It
wasn't so much an evil conspiracy as a feckless collective effort in denial and self-delusion
It happened that a lot of that Wall Street finance came in the form of high-yield (junk) bonds
issued by the oil companies - with fat commissions for the big banks to cream off in creating the
bonds. So when the price of oil crashed below $50, a lot of oil companies - especially the smaller
ones with no cash flow - couldn't service the interest payments.
What lies ahead in 2016 is a
debacle of bond defaults and corporate bankruptcies in the US oil patches. What's more, because of
the peculiar geology of shale oil and the rapid depletion of the fracked wells, it is necessary to
incessantly drill and frack new wells to keep production even level, let alone rising. That calls
for evermore rounds of new financing. But since the current financial obligations can't be serviced,
new financing will not be not forthcoming. And so neither will additional production. All of which
means that shale oil production is going to crash in 2016 when the backlog of previously-drilled
but untapped wells runs out. I'll predict that US oil production will go down a million barrels a
day before 2017. That includes the roughly 5 percent annual decline of conventional oil.
Some might suppose that such a crash would drive prices back up again as the supply necks down.
There are a couple of problems with that supposition. One is that the previous round of $100-plus
oil did a lot of permanent damage to the economy, in particular to small businesses and households
(i.e. middle-class workers). That damage looks more and more permanent, meaning a smaller aggregate
economy and still-shrinking demand base as businesses and citizens go broke and stay broke. If oil
prices do return to a level that would justify exploration and production of expensive, hard-to-get
oil, (probably north of $110) it will only crash industrial economies again - and there are only
so many times this can happen before the system is so damaged recovery is no longer possible.
Another problem is that the oil price crash has done significant damage to the oil industry itself,
including its credibility as a viable target for investment. Contrary to hopes and expectations,
current low oil prices are doing nothing to re-stimulate economic activity. It all has the look of
a self-reinforcing feedback loop, a downward spiral in a global complex networked system getting
clobbered by the diminishing returns of its principal activities.
Hence
I would predict that the price of oil will fall further in 2016, below the $30 mark,
and that it will lead to more carnage in the oil industry, in banking and debt defaults, and to new
manifestations of geopolitical trouble that could lead to profound oil scarcities and rationing.
We can't seem to face the fact that our techno-industrial paradigm was designed to run on cheap
oil, which is just no longer available.
it appears the Auto-sales (and massive inventory build) party is over in America. December US
domestic auto sales SAAR printed 13.46 mm - the lowest in 6 months (missing expectations of
14.15mm by the most since November 2008). With non-revolving credit growth slowing in December,
and inventories at record highs, the wheels just fell off the credit-fueled auto 'recovery'.
Jtrillian
This can probably be tied to two things. 1) Auto loan bubble (esp. high risk loans) and 2)
Rising interest rates. A rise in interest rates combined with recent defaults puts pressure on
credit markets. Since the auto sales was largely driven by the same type of bad loans that
inflated the housing bubble, this one is showing signs that it too is about to pop. ...
"A low point could be in the first quarter [of 2016]," Dudley said in an
interview broadcast Saturday
by the BBC. "But 2016's third and fourth quarters could
witness a more natural balance between supply and demand, after which stock levels could start to
wear off."
But Dudley stressed that that doesn't mean a rebound by the end of this year. "Prices are going
to stay lower for longer, we have said it and I think we are in this for a couple of years,"
he said
..
"For sure, there is a boom-and-bust cycle here."
"... I also am astonished no bond holders are demanding that this activity stop, given it is their
(partial) bond principal that is being burned in this unprofitable activity, and further, if the funds
used are a prior lien to them, they are falling further behind in recovery in the event of BK. ..."
"... I see onshore conventional collapsing all around the US, one just has to do a little research
and see the lack of vertical wells being drilled and completed, plus the Baker Hughes rig count which
shows under 100 vertical rigs turning. This, of course, is due to conventional operators using their
own money, and/or borrowing from banks who follow the reserve lending rules I cite above. ..."
"... If EIA is correct, US onshore conventional is falling off a cliff. ..."
"... Anecdotally, we are experiencing our steepest percentage decline ever from 2014 to 2015, and
2016 is not looking so hot either. ..."
"... a simpler analysis by me results in about a $76/b breakeven using very similar assumptions
and an $8 million dollar well cost with a 10% annual real discount rate. ..."
I have been beating the PDP PV10 drum ad nauseam, drawing just a little interest. My point
being that banks (prior to the shale boom) would not loan money on reserves to a company in excess
of around 60-65% of said company's PDP PV10, using the bank's engineering and price deck. Furthermore,
banks paid attention to all other company debt, not just whether they had the first lien. Loaning
additional funds to a company whose bonds are trading at 10-30% of par seems worthy of OCC inquiry.
It appears to me that almost all public E & P in the LTO/tight gas business will have more
than 65% long term debt to PDP PV10 as of 12/31/15. I understand the SEC price deck is different
than a bank's, but given SEC WTI is $49 for 2015, it seems 2015 SEC may be too high compared to
what a bank should be using for its 2016-2017 price deck.
Would like to read any comments you have on this. I continue to be astonished at how many rigs
are still running given almost none of the E & P are currently creditworthy.
I also am astonished no bond holders are demanding that this activity stop, given it is
their (partial) bond principal that is being burned in this unprofitable activity, and further,
if the funds used are a prior lien to them, they are falling further behind in recovery in the
event of BK.
As I have stated, we are conventional stripper operators, and have not seen things this bleak,
even in 1998-99 and 2008-09. 1986 was before my time, however, I have spoken to older operators
and read enough to satisfy myself this bust is comparable, and will be worse if sub $40 WTI persists.
I see onshore conventional collapsing all around the US, one just has to do a little research
and see the lack of vertical wells being drilled and completed, plus the Baker Hughes rig count
which shows under 100 vertical rigs turning. This, of course, is due to conventional operators
using their own money, and/or borrowing from banks who follow the reserve lending rules I cite
above.
Take a look at where the EIA has the following states in October: CA, IL, KS, UT, LA and MS.
These states have limited LTO. If EIA is correct, US onshore conventional is falling off a
cliff.
Anecdotally, we are experiencing our steepest percentage decline ever from 2014 to 2015,
and 2016 is not looking so hot either.
Glad to see another conventional onshore person post here.
Hi Gwalke,
The post looks very solid to me, most of the analysis uses the data from all wells from 2007
to 2015 that have at least 12 months of output data, a simpler analysis by me results in about
a $76/b breakeven using very similar assumptions and an $8 million dollar well cost with a 10%
annual real discount rate.
It is a good observation that we do not know if 2014 wells will have a similar well profile to
the older wells from 2007 to 2013, we also have no data beyond 7 years with the highly fracked
Bakken/Three Forks wells, the decline beyond that point is likely to be exponential rather than
hyperbolic at about a 9 to 12% annual decline rate, we can only guess at the future well profile
(beyond 7 to 8 years.) Rune Likvern has often reminded me of this fact.
...In the immediate postwar years, the United States defined its policy in the Near and Middle
East in terms of assuring unimpeded access and control by U.S. oil companies of its great
material prize, petroleum. Congressional hearings on the role of petroleum and the national
defense envisioned petroleum as a weapon of war. It followed that ensuring the presence and
stability of compatible regimes was an essential dimension of policy, as was containing and
crushing those whose nationalist and reformist orientation rendered them suspect.
... ... ...
Within months of Israel's emergence, U.S. officials reassessed their views of the new state, in accord
with presidential recognition of Israel. What followed was not only recognition of Israeli sovereignty
but recognition of its strategic potential in Washington's postwar policy in the Middle East, which
was designed to exclude the USSR and to protect U.S. oil interests and allied defense arrangements.
This assessment undermined Washington's critical position on Israeli policy toward Palestinian refugee
repatriation and territorial expansion. These vital factors in the conflict between Israel-Palestine
and the Arab world thereby assumed a subordinate position in light of the priorities defined by the JCS and officials in the Department of State.
Here, then, is the logic of U.S. oil policy, which
was responsible for the increasing deference to Israeli policies whose purpose was to ensure that
Israel turned toward the United States and away from the USSR. This objective, in turn, was allied
to
Washington's principal goal in the Middle East-protection of its untrammeled access and control
of oil.
Irene L. Gendzier
is professor emerita in the Department of Political Science at Boston University.
She is also the author of Notes from the Minefield: United States Intervention in Lebanon and the
Middle East, 1945–1958 and Frantz Fanon: A Critical Study, and she is a coeditor, with Richard Falk
and Robert Lifton, of Crimes of War: Iraq.
"... The public got bamboozled by the Ponzi scheme of shale oil. It seemed like a fabulous techno-rescue: the "fracking miracle!" It operated by converting mountains of cheap leveraged capital into a very rapid bump-up in US oil production. It got full traction after a couple of years of $100 oil squashed economic activity - and then squashed demand for oil. Whoops. The problem was that shale oil was very expensive to produce even if reduced demand drove the market price very low. Back at $100-plus a barrel, hardly anyone made any profit on shale. At $40 a barrel shale was a laughable loser. So, in 2015, the shale oil companies laid off thousands of workers, idled the drilling rigs, and kicked back to pray that the price would go back up. ..."
"... The rapid ramp-up in shale oil production from 2010 to 2014 was intended as a demonstration project to convince Wall Street to stuff ever more investment capital into oil companies. It was also part of an enormous PR campaign to allow the people running things in business and government to pretend that America's oil problems were behind us. The "shale miracle" was going to make us "Saudi America," It was going to boost us into "energy independence." It played into the Master Wish beneath all the wishful thinking in America: Please, God, let us be able to drive to WalMart forever. It wasn't so much an evil conspiracy as a feckless collective effort in denial and self-delusion ..."
"... What lies ahead in 2016 is a debacle of bond defaults and corporate bankruptcies in the US oil patches. What's more, because of the peculiar geology of shale oil and the rapid depletion of the fracked wells, it is necessary to incessantly drill and frack new wells to keep production even level, let alone rising. That calls for evermore rounds of new financing. But since the current financial obligations can't be serviced, new financing will not be not forthcoming. And so neither will additional production. All of which means that shale oil production is going to crash in 2016 when the backlog of previously-drilled but untapped wells runs out. I'll predict that US oil production will go down a million barrels a day before 2017. That includes the roughly 5 percent annual decline of conventional oil. ..."
"... Another problem is that the oil price crash has done significant damage to the oil industry itself, including its credibility as a viable target for investment. Contrary to hopes and expectations, current low oil prices are doing nothing to re-stimulate economic activity. It all has the look of a self-reinforcing feedback loop, a downward spiral in a global complex networked system getting clobbered by the diminishing returns of its principal activities. ..."
"... I would predict that the price of oil will fall further in 2016, below the $30 mark, and that it will lead to more carnage in the oil industry, in banking and debt defaults, and to new manifestations of geopolitical trouble that could lead to profound oil scarcities and rationing. ..."
The oil picture has bamboozled both the broad public and the
smaller cohort of supposedly sentient observers. I maintain that the deflationary contraction underway
worldwide is largely due to the fact that the world has run out of a particular form of oil:
affordable
oil. Turns out the peak oil story is still true, just playing out differently than
a lot folks predicted. We're at the mercy of a pretty basic equation: oil over $75-a-barrel destroys
industrial economies; oil under $75-a-barrel destroys oil companies. There is no "just right" Goldilocks
place on the gradient.
The public got bamboozled by the Ponzi scheme of shale oil. It seemed like a fabulous techno-rescue:
the "fracking miracle!" It operated by converting mountains of cheap leveraged capital into a very
rapid bump-up in US oil production. It got full traction after a couple of years of $100 oil squashed
economic activity - and then squashed demand for oil. Whoops. The problem was that shale oil was
very expensive to produce even if reduced demand drove the market price very low. Back at $100-plus
a barrel, hardly anyone made any profit on shale. At $40 a barrel shale was a laughable loser. So,
in 2015, the shale oil companies laid off thousands of workers, idled the drilling rigs, and kicked
back to pray that the price would go back up.
Which it didn't. Incidentally, all kinds of associated
ventures went bust with that. The landscape of North Dakota is littered with unfinished garden apartment
complexes that may never be completed, and the discharged construction carpenters and roofers drove
back to Minnesota ahead of the re-po men coming for their Ford F-110s. Sad, I know….
The rapid ramp-up in shale oil production from 2010 to 2014 was intended as a demonstration project
to convince Wall Street to stuff ever more investment capital into oil companies. It was also part
of an enormous PR campaign to allow the people running things in business and government to pretend
that America's oil problems were behind us. The "shale miracle" was going to make us "Saudi America,"
It was going to boost us into "energy independence." It played into the Master Wish beneath all the
wishful thinking in America: Please, God, let us be able to drive to WalMart forever. It
wasn't so much an evil conspiracy as a feckless collective effort in denial and self-delusion
It happened that a lot of that Wall Street finance came in the form of high-yield (junk) bonds
issued by the oil companies - with fat commissions for the big banks to cream off in creating the
bonds. So when the price of oil crashed below $50, a lot of oil companies - especially the smaller
ones with no cash flow - couldn't service the interest payments.
What lies ahead in 2016 is a debacle
of bond defaults and corporate bankruptcies in the US oil patches. What's more, because of the peculiar
geology of shale oil and the rapid depletion of the fracked wells, it is necessary to incessantly
drill and frack new wells to keep production even level, let alone rising. That calls for evermore
rounds of new financing. But since the current financial obligations can't be serviced, new financing
will not be not forthcoming. And so neither will additional production. All of which means that shale
oil production is going to crash in 2016 when the backlog of previously-drilled but untapped wells
runs out. I'll predict that US oil production will go down a million barrels a day before 2017. That
includes the roughly 5 percent annual decline of conventional oil.
Some might suppose that such a crash would drive prices back up again as the supply necks down.
There are a couple of problems with that supposition. One is that the previous round of $100-plus
oil did a lot of permanent damage to the economy, in particular to small businesses and households
(i.e. middle-class workers). That damage looks more and more permanent, meaning a smaller aggregate
economy and still-shrinking demand base as businesses and citizens go broke and stay broke. If oil
prices do return to a level that would justify exploration and production of expensive, hard-to-get
oil, (probably north of $110) it will only crash industrial economies again - and there are only
so many times this can happen before the system is so damaged recovery is no longer possible.
Another
problem is that the oil price crash has done significant damage to the oil industry itself, including
its credibility as a viable target for investment. Contrary to hopes and expectations, current low
oil prices are doing nothing to re-stimulate economic activity. It all has the look of a self-reinforcing
feedback loop, a downward spiral in a global complex networked system getting clobbered by the diminishing
returns of its principal activities.
Hence
I would predict that the price of oil will fall further in 2016, below the $30 mark, and
that it will lead to more carnage in the oil industry, in banking and debt defaults, and to new manifestations
of geopolitical trouble that could lead to profound oil scarcities and rationing.
We can't seem to
face the fact that our techno-industrial paradigm was designed to run on cheap oil, which is just
no longer available.
"... The shia cleric was calling for a rebellion to attain equality for all citizens, freedom for all citizens, and democracy for all citizens. Iran has that but we all agree that the religious Mullahs have been harsh but have steered greatly to the side of the secular movement since the 80s. ..."
"... The state of women in Iran is way better than the moving cloths of Saudi Arabia. ..."
"... This is obviously a provocation. What we arent sure about is if this was a deliberate provocation or if the Saudis just didnt give a damn. ..."
"... Rubbish! The Saudis only manage to control the country through a combination of brutal suppression, free spending and making sure that only those tribes loyal to the Saud family are recruited for the National Guard which is more powerful than the army. ..."
"... Typical Grauniads false equivalence aimed at watering down Saudi Arabias barbarism and, in the process, justifying our allegiance to this aberration. ..."
"... Its interesting that, together with that other sacred cow in ME of a different religion persuasion, there are hardly any threads where one can comment on the subject - except for vapid, disingenuous articles like this one; the massacres in Bahrain are as if they never existed; Raif Badawis plight has been swept under the rug. Iran , on the other hand, is forever portrayed as the villain even though has been the object of Western-sponsored coup, sabotages and invasions for the last 60+ years. ..."
"... The strange thing here is that Saudi is the driving force behind the current low oil prices. Most of OPEC wants to reduce production, whereas Saudi insists on trying to squeeze out higher cost producers (most notably in the US and Canada). ..."
"... I say strange but this is more than likely a function of why western governments consider Saudi Arabia to be an ally. ..."
"... This is like a Daily Mirror article except with slightly more developed language. ..."
"... Hopefully 2016 will see the thousands of drug addicted princes that make up the house of frauds (saud) hanging from lampposts. At the very least therell be a lot less money being spent on British bombs. Makes me cringe to think that this country is the UKs most important ally in the Middle East. ..."
"... Its 2016 and Saudi Arabia executes people for witchcraft! ..."
"... The real Guardian view... support the Saudis, lick the arses of the US warmongers, blame the Russians for everything, ignore the Islamist terrorists. No wonder 80% of British people believe that all UK journalists are liars and no surprise that their lying media is in terminal decline. WE now have the web to make our own minds up. ..."
"... As far as I am aware Iran has not been gifting the world with madrassahs, hate-preachers and Wahabbism/Salafism. The only people who seem to suffer from their religious delusions and extremism are the Iranian people themselves. ..."
"... But the KSA has spread misery and hatred worldwide. And far too many Muslims have stood by and watched it happen. ..."
"... Careful with condemnations, after all Saudi is a friendly murderous regime unlike other murderous regimes and besides they are happy to fill the american arms manufacturers coffers. ..."
"... So was there any evidence presented that Sheikh Nimr al-Nimr was anot active terrorist or not? At the end of the day if there was conclusive evidence that he was involved in planning acts if violence, then although I disagree with capital punishment, by the laws of the land, he was treated the same way as other insurgents. ..."
"... Weasel words from the Graun. Fuck those barbaric Saudi autocrats and their elitist supporters over here. As for Iran they are part of the coalition actually FIGHTING the Islamic terrorists in Syria. Wake up Graun with your NATO lies. ..."
"... Watching the Guardian, always so loyal in its support of Saudi objectives, squirming as it is forced into some kind of comment on this execution has been a delightful pleasure. Indeed, how careful you have been. Could you have found a less critical word than unjust to describe this? ..."
"... The comparison between Iran and KSA here is rather superficial and dwells on some similarities but does not highlight the vast differences. Whereas there are elections for a parliament and a president and some form of democracy in Iran there is only very tyrannical autocratic monarchy in KSA, Whereas Iran has been the subject of demonisation by the west, the KSA has had lavish support in all ways by the west. ..."
"... Why crippling sanctions were imposed on Iran, not Saudi Arabia? Stop the slaughter in Yemen. ..."
Did the author of this piece of selective unbalanced diatribe deliberately avoid regularly
mentioning the Sunni arm of the religion which dominates life politically and socially and demographically
in Saudi Arabia ?
Only mentioning the Sunnis twice and on both occasions in relation to the Iranian state whilst
at the the same time peppering the article with references to the Shia faction is hardly balanced
or objective and appears to deliberately skew the article in such a way as to leave the reader
with the impression that Shia Islam is the main protagonist here.
I suppose I used to expect better from the Guardian, sadly no more.
DrKropotkin
, 3 Jan 2016 18:06
An article filled with many statements like this:
"Both Iran and Saudi Arabia are wasting their resources on aggressive foreign policies
which have little chance of ultimate success"
I don't know how anyone can compare what Iran is doing in Syria (at the invitation of the government
and fighting ISIS) with the barbaric assault currently being waged on Yemen (not to mention the
Saudi role in funding Jihadi's everywhere). On a day when Saudi Arabia kills 47 people the Guardian
reminds us not to forget about Iran.
Why are they coming in the cross-hairs here, because they condemned the execution? Iran has
only spoken of retaliation, they haven't actually done anything yet (it's going to come from God
apparently). The embassy attack in Tehran was done by an outraged people and condemned by the
Prime Minister.
Saif Eje
, 3 Jan 2016 18:01
That's one funny article! Is this an attempt to whitewash what's black on the outside and the
inside? Comparing Iran and Saudi and come out with a conclusion of how closely similar they are?
I guess pocketing some Riyals is much more worthy than integrity for some.
The shi'a cleric was calling for a rebellion to attain equality for all citizens, freedom
for all citizens, and democracy for all citizens. Iran has that but we all agree that the religious
Mullahs have been harsh but have steered greatly to the side of the secular movement since the
80s.
The state of women in Iran is way better than the moving cloths of Saudi Arabia.
I'm
greatly disappointed, or so I'd like to pretend in the hope that our frustrations do something
to your online paper. We all know the drill though I'm afraid... ignore and move on as money has
longer lasting echos.
Shankman Samir Afz.
, 3 Jan 2016 18:01
They know public support for the KSA is in freefall, so they're trying to stay on the sidelines
as much as possible (other than the requisite calls for both sides to keep calm).
Support for the KSA is becoming politically 'toxic'. Politicians perceived as too cozy with
or supportive of the KSA are increasingly being perceived a sellouts or hypocrites at best.
CanadaChuck
, 3 Jan 2016 18:00
This is obviously a provocation. What we aren't sure about is if this was a deliberate
provocation or if the Saudis just didn't give a damn.
Perhaps they tire of the proxy war in Syria and would prefer to go head to head with Iran.
Perhaps they think the US and UK will help them out. Where this 'Guardian view' falls down is
using words like 'unjust' towards sovereign countries that have different values.
The Guardian has their view of justice which would be the view of progressive 'Western' nations
and various UN bodies. It may be surprising to some that other countries have different values
and will not be thinking like Europeans anytime soon.
For instance, countries with over 1/2 of the global population do not accept the authority
of the UN Human Rights group in Geneva. There are no human rights investigations in these countries
even though 'Western' standards are not lived up to. Three of these countries can and regularly
do veto any action by this group. There is much talk in Geneva about Syria, N. Korea and Israel.
Any action is automatically vetoed.
Similarly with the misnamed ICC in The Hague. Countries with over 1/2 of the global population
do not accept the jurisdiction of this court and didn't ratify it. Much the same with European
projects like the Landmines Treaty or the proposal for a Right to Protect Protocol.
Possibly there are many in Europe who do not know that their concepts of justice and values
are not universally accepted, as of yet.
PhilPharLap
, 3 Jan 2016 17:59
I'm having a bit of trouble with this sentence too:
"The parallels between the Saudi kingdom and the Islamic republic are in some ways very
close. Both are influenced by a sense of Islamic mission,"
It is the all too common use of the word "mission" to mean imperialist aggression, terrorism,
and religious violence - a connotation it acquired during the invasions that accompanied the building
of empires. The concept of mission was originally to "send" people offering a new faith - not
inquisitors to torture and kill
It is the ugliness of imperialist intent that distorted the meaning of what was originally
seen as a peaceful action, and that hid its violence behind peaceful missions
London2012 -> BabylonianSheDevil03
, 3 Jan 2016 17:58
Rubbish! The Saudis only manage to control the country through a combination of brutal
suppression, free spending and making sure that only those tribes loyal to the Saud family are
recruited for the National Guard which is more powerful than the army.
DrKropotkin -> thrmaruf
, 3 Jan 2016 17:57
"ISIS is a Natural Results of these two Islamists barbaric systems." not a very informed comment.
Iran is fighting ISIS, while the Saudis give them money and weapons.
There is a lot to criticise Iran for, but please try to get it right.
Hanwell123 -> duqu_2
, 3 Jan 2016 17:51
It's the story they're all running because they - WE - are Allies and Members of the Coalition
dedicated to the War against Assad. We HAVE to back them! It's v much like that in all wars apparently
- the First Casualty?
It is cringing seeing them go overboard though, like implying Iran is some sort of equal combatant
in the Yemen when even the casual reader knows that's 100% bullshit (a WW2 expression I think?).
PhilPharLap -> trueblueozzy
, 3 Jan 2016 17:41
question for "inthelightoffacts"
isn't forcing women into a ridiculous dress code a form of violence?
isn't forcing children into marriage - violence?
isn't the implementation of honour codes that include murder as a punishment - violence?
isn't it terrorism to murder a person who as a matter of religious conscience chooses to leave
a faith imposed on them by their family and their culture?
isn't it violence to deny girls and adult women the right to education - the right to move around
without a male companion - the right to drive a car?
Start there and work your way on from there
truly - just asking
majamer
, 3 Jan 2016 17:36
Have you ever wondered why we've never heard of Sunni Iranian clerics doing the same thing
as Sheikh Al-Nimr? Because they are already melting in acid tubs in the Iranian intelligence agencies'
basements. If you don't believe that, try to criticize Khamenei in Tehran's streets and see what
happens to you. The really biased is parotting for the larger Western agenda: hiring Iran as the
regional stick holder. Khamenei reminds the Saudis of the divine vengeance while he's been killing
Syrian and Iraqi Sunnis from kids to elderly for years.
curiouswes -> Foracivilizedworld
, 3 Jan 2016 17:33
Saudi Arabia is not a country... it is a Family controlled business... and the business
is oil...
So the people there, have no say. They don't hold phony elections and try to fool people into
believing that they actually have a choice when a de facto government actually runs things from
behind the scenes. Is that what you mean?
Oboy1963
, 3 Jan 2016 17:26
I think this article missed out or glossed over some important differences between Iran and
Saudi Arabia.
Iran is actually a country, in the sense that we understand it. A government elected by
the people. Saudi Arabia, is NOT a country it is a big chunk of desert with a big load of oil,
and therefor e money and influence, ruled by a murderous clan that claim to be "Kings"
Iran has had a large dose of US interference in its internal affairs going back to the
Shah. this along with the threats, sanctions and vilification by " the west" has demonized
Iran via the "free press"
Saudi Arabia has had nothing but ass kissing , arms and technical sales along with the necessary
served up as "Our ally" by "the west "
No matter what Iran does "the west" criticizes, second guesses and condemns it, based mainly
on an ingrown deep hate from the US for not being allowed to subjugate them, and the loss of
face they suffered in the Embassy affair. No matter what Saudi Arabia does "the west" does
nothing, says nothing or fully supports it.
Iran, after decades of "the west" and its "free press" demonizing it just can not win a
trick, no matter what it does due to this long term bias build up.
Saudi Arabia on the other hand is according to our leaders the Kingdom of light and INCOME.
"the west" = The US and its vassal states.
"free press" = What we laughingly refer to as our open, honest source of factual information.
Metreemewall
, 3 Jan 2016 17:22
"The parallels between the Saudi kingdom and the Islamic republic are in some ways very
close. Both are influenced by a sense of Islamic mission, a sense which has encouraged them
in ambitions well beyond their means. Both are quick to violence, abroad and at home, where
there is little to choose between them, for instance, in the high rate of public executions."
Typical Grauniad's false equivalence aimed at watering down Saudi Arabia's barbarism and,
in the process, justifying our "allegiance" to this aberration.
It's interesting that, together with that other "sacred cow" in ME of a different religion
persuasion, there are hardly any threads where one can comment on the subject - except for vapid,
disingenuous articles like this one; the massacres in Bahrain are as if they never existed; Raif
Badawi's plight has been swept under the rug. Iran , on the other hand, is forever portrayed as
the villain even though has been the object of Western-sponsored coup, sabotages and invasions
for the last 60+ years.
So, my suggestion is simple, before wanting us to "Become a supporter for just £5 per month",
how about ensuring that we REALLY get quality, independent journalism?
spybaz -> Dicko23
, 3 Jan 2016 17:22
Yeah, but there's no insta-cash with your proposal. Oil and arms money is obtainable way more
quickly. The world now exists under a Corporatocracy. This requires that a profit to be shown
every 3 months. If you (a company or a govt) cannot do that, the shareholders are sad and you
are deemed to be failing. Killing people for oil, with arms sourced from the UK, USA (& Russia
too), is the most lucrative business to be in.
The UK, USA (& Russia) are guilty of this murderous money making scheme to the extreme. Yet,
the citizens of these countries keep on voting for them (well, I'm not sure about govts are truly
elected in Russia).
Fuego999
, 3 Jan 2016 17:15
The only good thing to come out of Trump's candidacy may be to scare the living day lights
out of the House of Saud. Once the mood turns against them in the West, which it hasn't so far
(ignorance and lack of interest being two reasons), there's no telling what will happen on the
Peninsula.
MrHumbug
, 3 Jan 2016 17:07
Realpolitik analysis of the situation.
Nations who are not US are making money. US isn't. Therefore "Iran must go." We can't have
exceptional nation loose control of who gets to eat and who doesn't.
I read this article before the news broke on KSA severing diplomatic ties with Iran. However,
my first reaction was "Surely, US will find some reason to "bomb the country back to the stone
age." How prescient of me. Just as with Syria, someone in the world must be the "or else" example
or US's global racket will loose its teeth. If only they stuck to the "bad guy" and "hellhole"
role alloted to them by the New World Order...
NotFobbedOff -> tickleme
, 3 Jan 2016 17:03
The strange thing here is that Saudi is the driving force behind the current low oil prices.
Most of OPEC wants to reduce production, whereas Saudi insists on trying to squeeze out higher
cost producers (most notably in the US and Canada).
I say strange but this is more than likely a function of why western governments consider
Saudi Arabia to be an ally.
PubGeezer
, 3 Jan 2016 16:38
"The execution of Sheikh Nimr al-Nimr could deepen the confrontation between Iran and Saudi
Arabia "
No shit. Thanks for the advice, Guardian.
This is like a Daily Mirror article except with slightly more developed language.
tickleme
, 3 Jan 2016 16:32
The Saudis are having to increase taxes to deal with the $100billion deficit the collapse in
the oil price has caused.
Let's see how much the citizens of Saudi Arabia like being squeezed before they revolt. The
oil price is going nowhere for the foreseeable future and those Saudi reserves will be spent within
a couple of years. The country is totally dependent on oil with zero economic diversification.
Hopefully 2016 will see the thousands of drug addicted princes that make up the house of
frauds (saud) hanging from lampposts. At the very least there'll be a lot less money being spent
on British bombs. Makes me cringe to think that this country is the UK's most important ally in
the Middle East.
It's 2016 and Saudi Arabia executes people for witchcraft!
danubemonster -> Spillage93
, 3 Jan 2016 16:25
There is a major differences between Iran and Saudi Arabia. Iran is a sophisticated country,
where the hold of religion is slowly cracking. Once the theocracy goes, Iran will be an embryo
Poland or Czech Republic. Saudi Arabia, by contrast, is going nowhere fast, and once the oil goes,
it'll probably revert to a primitive, Medieval state - unless it can have a secular revolution,
which strikes me as being unlikely.
ProfJonathanRawlings
, 3 Jan 2016 16:21
The real Guardian view... support the Saudis, lick the arses of the US warmongers, blame
the Russians for everything, ignore the Islamist terrorists. No wonder 80% of British people believe
that all UK journalists are liars and no surprise that their lying media is in terminal decline.
WE now have the web to make our own minds up.
Hairan Road -> Pareshan Gali
, 3 Jan 2016 16:20
Its the hypocrisy of western media who is siding with Iran because Sunni Muslim are more enemy
to west than shia. Irani muslim are considered most non practicing. It was in 1980 that 67 irani
siege the grand mosque of Makkah. It was an act of aggression from Iran no one condemn that. Now,
ita saudi right to execute anyone going against its govt.
Like U. S wants custody of Edward snowden. Europe or Iran has no right to interfere in other
countries internal matters. They are trying to perpetuate as this execution was linked to shia
sunni difference. The cleric was inciting violent comments against the govt. he cursed openly
the ex crown prince who died that he may be eaten by worms.
So if he was non violent cleric who gave voice to shia then why did he passed these comments.
He was receiving aid from Iran to fuel protest against saudi govt. There is o barbarism I think
pog boy David Cameron needs to be dispatched to cameroon in africa
moretsu
, 3 Jan 2016 16:17
The parallels between the Saudi kingdom and the Islamic republic are in some ways very
close. Both are influenced by a sense of Islamic mission,
As far as I am aware Iran has not been gifting the world with madrassahs, hate-preachers
and Wahabbism/Salafism. The only people who seem to suffer from their religious delusions and
extremism are the Iranian people themselves.
But the KSA has spread misery and hatred worldwide. And far too many Muslims have stood
by and watched it happen.
TRIALNERROR
, 3 Jan 2016 16:16
Khamenei added: "This oppressed cleric did not encourage people to join an armed movement,
nor did he engage in secret plotting, and he only voiced public criticism ... based on religious
fervour." !!!
So it was OK for Sheikh Namr to criticize government but it wasn't OK for someone like Mir
Hossein to do so! Practically nauseating in its hypocrisy
Ted Pawlowski
, 3 Jan 2016 16:08
Careful with condemnations, after all Saudi is a friendly murderous regime unlike other
murderous regimes and besides they are happy to fill the american arms manufacturers coffers.
John Smith 3 Jan 2016 16:06
So was there any evidence presented that Sheikh Nimr al-Nimr was anot active terrorist
or not? At the end of the day if there was conclusive evidence that he was involved in planning
acts if violence, then although I disagree with capital punishment, by the laws of the land, he
was treated the same way as other insurgents.
However if he was just expressing exasperation, or disagreement with the regime, and saying
that things needed to change for the greater good of Saudi Arabia, then sod diplomacy, there needs
to be a case drawn up in the International Criminal Court, and just for once the message sent
out that just because someone disagrees with a point of view, doesn't give you the excuse to kill
them, it's unacceptable in the 21st century and not the behaviour expected of a modern state where
the leaders have benefited from the best in Western education, and have seen first hand how opposed
political parties can work together to create advanced, generally prosperous nation states.
ProfJonathanRawlings
, 3 Jan 2016 16:04
Weasel words from the Graun. Fuck those barbaric Saudi autocrats and their elitist supporters
over here. As for Iran they are part of the coalition actually FIGHTING the Islamic terrorists
in Syria. Wake up Graun with your NATO lies.
Prometheon
, 3 Jan 2016 16:03
Watching the Guardian, always so loyal in its support of Saudi objectives, squirming as
it is forced into some kind of comment on this execution has been a delightful pleasure. Indeed,
how careful you have been. Could you have found a less critical word than "unjust" to describe
this?
Nobody reading this editorial would get the slightest hint that we are talking about Saudi
Arabia, a brutal medieval theocracy and the world's main sponsor of terrorism worldwide.
SHA2014
, 3 Jan 2016 15:09
The comparison between Iran and KSA here is rather superficial and dwells on some similarities
but does not highlight the vast differences. Whereas there are elections for a parliament and
a president and some form of democracy in Iran there is only very tyrannical autocratic monarchy
in KSA, Whereas Iran has been the subject of demonisation by the west, the KSA has had lavish
support in all ways by the west.
Whereas Iran is more liberal with regards to women and minorities, KSA isn't. Iran is also
more diverse economically than the desert kingdom which depends mainly on oil. It is therefore
strange that this assessment does not address this or even mention any democratic aspirations
for KSA. It is in these situations that objective critical journalism, holding our politicians
to account on their lack of concern about the behaviour of a close ally that one yearns for in
the so-called free press in the West.
Foracivilizedworld
, 3 Jan 2016 14:59
Why crippling sanctions were imposed on Iran, not Saudi Arabia? Stop the slaughter in Yemen.
"... The US empire is one of Multi-National corporations and International Trade Deals. ..."
"... Im intrigued by that assertion, especially if this comes from a more libertarian perspective and an author who actually mentions NATO. Of course corporate welfare in various forms is a key part of what is happening, but the core issue is a literal military empire, not some vague commercial facsimile of one. ..."
"... The direct imperial threats include economic warfare, as displayed by the IMF and ECB. As demonstrated in Greece, Ukraine, and before Greece Ireland. ..."
"... By 1978, US inflation had risen to 9% while inflation in the rest of the world slowed dramatically by comparison. Both the Carter administration and the Fed did everything in their power to control dollar devaluation, but it was clear by this time that without the assistance from foreign governments the dollar would not be able to survive . … Over the course of the next six years the dollar experienced a meteoric rise in value. ..."
The US empire is one of Multi-National corporations and International Trade Deals.
I'm intrigued by that assertion, especially if this comes from a more libertarian perspective
and an author who actually mentions NATO. Of course corporate welfare in various forms is a key
part of what is happening, but the core issue is a literal military empire, not some vague commercial
facsimile of one.
One of the most successful Big Lies in our domestic political discourse
is to blame convenient corporate villains instead of the public officials who are responsible
for decision-making and implementation.
This isn't the 1980s anymore. The global financial system (post Bretton Woods) collapsed somewhere
there in the 1990s. Today, things are held together by direct imperial threats, not corporate
board rooms.
It is not dollar hegemony that rules the world, but the global financial system which
gives the dollar its place of privilege.
Syllogism? What came first the chicken or the egg?
Where to begin – one could suggest the author read Chapter 1 of Wray's MMT and rewrite considering
sector balances and fiat currencies, and present the different line of argument which would arise.
"By 1978, US inflation had risen to 9% while inflation in the rest of the world slowed
dramatically by comparison. Both the Carter administration and the Fed did everything in their
power to control dollar devaluation, but it was clear by this time that without the assistance
from foreign governments
the dollar would not be able to survive
." … "Over the
course of the next six years the dollar experienced a meteoric rise in value."
Maybe not central to the main argument but I found this claim (in bold) implausible.
In a wide-ranging conversation, Bass looked into oil production in the U.S. "We were the marginal
swing producer for the world," he commented. "And now we're going to go down a million barrels a
day, I think, in the next 12 months. So, we're going to go from a glut to all of a sudden a deficit.
And the world's not ready for a deficit."
Long-Term Investing
So, what should long-term investors do about this, co-host Gary Kaminsky asked.
"If you are going to allocate capital [into the energy space] for the next three to five years,
you should do it now [within the next six months]," Bass advised. Now, which industry sector you
should invest in, that depends on "where you have expertise," he added.
"Those businesses are dominated by those who have expertise in each of those verticals; and, you
better get with those people to decide where in the cap structure to invest."
For instance, upstream MLPs' equities trade for pennies, their subordinated debt trades around
the 20s and 30s, and their senior debt, in the eighties, he explained. No one knows when upstream
MLPs file bankruptcy, "which many of them will," Bass stated. Bottom line, the answer is not univocal,
but rather, quite difficult.
So, for the long-term investor crowd, the best way to go might be buying a crude oil ETF, which
allows them not to "bet on a specific management company" nor worry about cap structures, Bass concluded.
"If you can hang on to that for 18 months or two years, I think you are going to do very well."
"... "I think there's a massive opportunity in energy," Bass responded, adding that his views on
the supply and demand situation in energy are "dogmatic" – and that has cost him big this year. ..."
"... "There are very few marginal producers who have come off the market," the analyst added. In
fact, U.S. production is only slightly lower, while OPEC production continues to move higher – Bass
believes, in an attempt to put marginal producers in the U.S. out of business. ..."
"... "Global GDP will still be positive," Bass said, anticipating around a 2 percent upside.
"Incrementally, there is new demand for crude every year, depending upon what global GDP is and demand
response… point being: Right now I think we have a glut of maybe 6,000 or 7,000 barrels a day.
..."
"... "You have to realize that the U.S. added a million barrels a day five years in a row, but
it took $100 crude for us to do that. We were the marginal swing producer for the world. And now we're
going to go down a million barrels a day, I think, in the next 12 months. So, we're going to go from
a glut to all of a sudden a deficit. And the world's not ready for a deficit." ..."
Benzinga received a sneak peek of this Sunday's Wall Street Week.
The upcoming episode will feature Kyle Bass, founder and principal of Hayman Capital Management,
who manages $1.7 billion in assets.
The expert went into several topics including his ongoing pharmaceutical patent battles and
the state of the energy market.
Among several other subjects, Bass discussed energy. Is there an opportunity in the energy segment,
co-host Gary Kaminsky asked.
"I think there's a massive opportunity in energy," Bass responded, adding that his views on
the supply and demand situation in energy are "dogmatic" – and that has cost him big this year.
The global margin of safety in energy is the lowest ever, he continued to explicate. Global demand
stands at its highest level ever, at 96 million barrels a day, while incremental supply capacity
(swing capacity) is at its lowest point, as a percentage of demand, at about 1.5 million barrels
a day.
"There are very few marginal producers who have come off the market," the analyst added. In
fact, U.S. production is only slightly lower, while OPEC production continues to move higher – Bass
believes, in an attempt to put marginal producers in the U.S. out of business.
Energy And An Economic Slowdown
But, what would happen with energy assets in an environment where economy slows down a little
bit?
"Global GDP will still be positive," Bass said, anticipating around a 2 percent upside. "Incrementally,
there is new demand for crude every year, depending upon what global GDP is and demand response…
point being: Right now I think we have a glut of maybe 6,000 or 7,000 barrels a day.
"You have to realize that the U.S. added a million barrels a day five years in a row, but
it took $100 crude for us to do that. We were the marginal swing producer for the world. And now
we're going to go down a million barrels a day, I think, in the next 12 months. So, we're going to
go from a
The statements at the weekend by (Iranian oil officials) that Iran would
only increase production at the level of the market can absorb seems to be a
shift in rhetoric."
Iran plans to raise output by half a million to 1 million barrels per day
(bpd) post lifting of sanctions, although Iranian officials said they did not
plan to flood the market with its crude if there was no demand for it.
Iran's oil exports have fallen to around 1 million bpd, down from a peak
pre-sanctions peak of almost 3 million bpd in 2011.
"Can we wait and not produce after lifting the sanctions? Who can accept
it in Iran," oil minister Bijan Zanganeh told CNN in an exclusive interview
on Tuesday. "Do you believe that ... our country will accept not to produce,
to secure the market for others? It's not fair."
Iran has the fourth biggest oil reserves in the world and is pumping about
2.8 million barrels a day, according to experts.
Analysts expect the OPEC producer to add between 600,000 and one million
barrels to output once sanctions are lifted, but Zanganeh is much more bullish.
"... According to the minister, Iran is not for selling oil at low prices. However,
even if prices drop below $30 per barrel the country will increase oil output and
export volumes until sanctions are lifted. ..."
According to the minister, Iran is not for selling oil at low prices. However,
even if prices drop below $30 per barrel the country will increase oil output
and export volumes until sanctions are lifted.
He underscored that Iran has the right to increase production and sell oil
abroad.
This should be a warning sign for the countries which have taken Iran's market
share in the global oil market since sanctions were imposed, he added.
He pointed out that after sanctions are fully lifted Iran will be ready to
increase oil output up to 500,000 barrels a day in the short perspective, in
addition to the current oil reserves. In 2016, production will be increased
twofold, to one million barrels a day.
...The expert said that OPEC countries compete with each other and other
nations. "The decline in oil prices was caused by OPEC countries' decision not
to cut production last year. A year after, OPEC countries said they were not
ready to cut output to keep the prices at $110-120. The point is that OPEC countries
compete with each other over the oil prices," Takin said.
Iran is trying to regain its lost share of global crude sales and has no
intention of harming the oil market with its planned increase in production
once sanctions are lifted from its economy, Oil Minister Bijan Namdar Zanganeh
said.
... ... ...
United Nations nuclear monitors in December
ended their 12-year probe of Iran's research into atomic-weapon technologies,
moving the country a major step closer to relief from sanctions. Iranian oil
companies and banks may be able to return to international markets by mid-January,
based on the pace at which the nation is disabling nuclear infrastructure.
As part of its efforts to increase production, the country will probably
award Chinese companies development rights for the second phase of the North
Azadegan oil field in southwestern Iran, Zanganeh said. Under an accord, the
Chinese will have to submit a proposal to the Iranian oil ministry for examination
and approval, he said, without identifying any companies. Iran pumped 2.7 million
barrels a day of oil in December, data compiled by Bloomberg show.
The amount of additional Iranian crude reaching foreign buyers will depend
on conditions in an oil market oversupplied by 2.5 million to 3 million barrels
a day, the Iranian Oil Ministry's Shana news agency reported on Saturday, citing
Mohsen Ghamsari, the head of international affairs at state-run National Iranian
Oil Co.
Oil output in Russia, one of the world's largest producers, hit a post-Soviet high last month
and in 2015 as small- and medium-sized energy companies cranked up the pumps despite falling crude
prices, Energy Ministry data showed on Saturday.
The rise shows producers are taking advantage of lower costs due to rouble devaluation and
signals Moscow's resolve not to give in to producer group OPEC's request to curb oil output to
support prices.
But the rise will contribute to a global oil supply glut and exert continued downward pressure
on oil prices which hit an 11-year low near $36 per barrel last month, having fallen almost 70
percent in the past 18 months.
For the whole of 2015, Russian oil and gas condensate output rose to more than 534 million
tonnes, or 10.73 million barrels per day (bpd) from 10.58 million bpd in 2014.
In December, Russian oil output rose to 10.83 million bpd from 10.78 million bpd in November.
In tonnes, oil output was 45.782 million last month versus 44.115 million in November.
The increase in production defied many expectations of a fall in Russian oil output which has
been on a steady rise since 1998 apart from a small decline in 2008.
The Energy Ministry had expected output to fall to 525 million tonnes in 2015 due to the exhaustion
of mature oilfields in Western Siberia, which account for over a half of the country's total oil
production.
But medium-sized producers, such as Bashneft, cranked up production. And Gazprom, the world's
top natural gas producer, increased production of oil, mainly gas condensate, by 5.3 percent for
the year.
However, oil output at Russia's leading producers declined. Production at Rosneft edged down
by 0.9 percent, while output at Lukoil's Russian assets fell by 1.1 percent last year.
According to a Reuters poll, Russian oil production in 2016 is expected to rise to a new post-Soviet
yearly average high of 10.78 million bpd despite price falls as new fields come online and producers
enjoy lower costs due to rouble devaluation.
-----------------
Note: using 7.3 (rather than 7.33) barrels/ton ratio, C+C output in December was 10.78 mb/d
AlexS. Interesting that Russian production was falling in the first half of 2014, when oil prices
were very high, and then began rising once the price began to fall.
The highest output yet came last month, with oil prices the lowest since early 2004.
Is all Russian oil profitable on an operating basis at current prices? I suspect many conventional
water floods and CO2 floods in the US are not. Doesnt Russia have quite a bit of similar mature
production? Is the ruble devaluation keeping this production above water? I suspect the cost of
labor in the US is much higher than in Russia, I do think we have discussed this aspect before.
As I have stated before, I believe that US conventional onshore oil production is falling fast,
the number of vertical production wells being drilled is likely the lowest in modern times (post
1970).
It is interesting to me that Russian conventional onshore oil production is so much more resilient
than US, given the similarities. Or maybe the production is not so similar?
I appreciate all of the oil information you provide. Any detail you are able to give on Russian
production is very much appreciated by me, and I suspect many other persons here.
"... Nevertheless, Saturdays execution has only resulted in the further deterioration of relations
which were already less than cordial. In several of the regions ongoing conflicts, Tehran and Riyadh
are on opposite sides of the barricades. ..."
"... In Syria, Iran has offered the secular government of Bashar al-Assad, embattled by over five
years of war, political, economic and military assistance against a coalition of Saudi, Turkish and
Qatari-funded jihadist groups, including the Muslim Brotherhood, the al-Nusra Front and Daesh (ISIL/ISIS).
..."
"... in Yemen, Saudi Arabia has formed a military coalition to try to crush the Shia tribesmen known
as the Houthis, who overthrew the government of Saudi-backed president Abd Rabbuh Mansur Hadi last year.
..."
"... the Saudi dynasty has also grown fearful of Shiites living in Saudi Arabia itself. ..."
"... Vladimir Ahmedov, a senior researcher at the Institute of Asian Studies of the Russian Academy
of Sciences, called the emerging situation somewhat frightening. According to the academic, the conflict
in the Middle East threatens to gain a new, religious dimension, openly becoming a war between Sunnis
and Shiites. ..."
"... Living in the 21st century, we have been thrown back into the Middle Ages, when the main factor
of wars was religion, rather than geopolitical considerations and the capture of territory. This, Ahmedov
warned, reduces the possibility of coming to an agreement in the most acute conflicts in the region.
..."
"... the clerics killing portends positive negative consequences, with the regional sectarian conflict
threatening to to Russias borders, to the neighboring states of Russias underbelly in Central Asia.
..."
On Sunday, Iranian Supreme Leader Ayatollah Ali Khamenei warned that "divine vengeance will befall
Saudi politicians" for "the unjustly spilled blood" of prominent Shia cleric Nimr al-Nimr, executed
by the Saudis on Saturday.
Considered a terrorist by Saudi authorities for his criticism of the government, calls for free
elections and demands that authorities respect Saudi Shias' rights, al-Nimr's execution sparked outrage
and an escalation of diplomatic tensions across the Middle East, but
only a cautious criticism from Riyadh's allies in Washington and Brussels.
The cleric was killed along with 46 others in the country's largest mass execution in decades,
sparking anger and violent protests in Shia areas of Saudi Arabia, as well as Bahrain, Indian-controlled
Kashmir, Pakistan, and Iran, where protesters
stormed the Saudi Embassy in the Iranian capital and
attempted to set the building on fire.
Trying to prevent the explosive situation from escalating out of control, Iranian President Hassan
Rouhani vowed to bring to justice those responsible for Saturday's attack. "The Iranian people should
not allow [al-Nimr's death] to become an excuse for rogue individuals and groups to commit illegal
acts and damage Iran's image," Rouhani said.
Speaking to his EU counterpart on Sunday, Iranian Foreign Minister Javad Zarif said that Iranian
authorities had
taken steps "to defuse the tensions and protect the Saudi diplomats."
Nevertheless, Saturday's execution has only resulted in the further deterioration of relations
which were already less than cordial. In several of the region's ongoing conflicts, Tehran and Riyadh
are on opposite sides of the barricades.
In Syria, Iran has offered the secular government of Bashar al-Assad, embattled by over five
years of war, political, economic and military assistance against a coalition of Saudi, Turkish and
Qatari-funded jihadist groups, including the Muslim Brotherhood, the al-Nusra Front and Daesh (ISIL/ISIS).
Furthermore, in Yemen, Saudi Arabia has formed a military coalition to try to crush the Shia
tribesmen known as the Houthis, who overthrew the government of Saudi-backed president Abd Rabbuh
Mansur Hadi last year. Accusing the coreligionists of being a proxy for Iran (claims which both
the Houthis and Tehran have denied), Riyadh launched a military campaign, including a naval blockade,
prompting criticism that the intervention has caused a '
humanitarian
catastrophe '.
At the same time that it has struggled with real and imaginary Iranian threats abroad, the
Saudi dynasty has also grown fearful of Shiites living in Saudi Arabia itself.
Commenting on the escalating conflict for Russia's
Gazeta.ru
, Vladimir Ahmedov, a senior researcher at the Institute of Asian Studies of the Russian Academy
of Sciences, called the emerging situation "somewhat frightening." According to the academic, the
conflict in the Middle East threatens to gain a new, religious dimension, openly becoming a war between
Sunnis and Shiites.
"Living in the 21st century, we have been thrown back into the Middle Ages, when the main
factor of wars was religion," rather than geopolitical considerations and the capture of territory.
"This," Ahmedov warned, "reduces the possibility of coming to an agreement in the most acute conflicts
in the region."
"In Yemen, Saudi Arabia has announced that it has decided to resume hostilities. It will be just
as difficult to come to an agreement on Syria, where that Saudis will begin coordinating with Turkey,
in my view."
As far as Russia is concerned, the analyst warned that the cleric's killing portends positive
negative consequences, with the regional sectarian conflict threatening to to Russia's borders, "to
the neighboring states of Russia's underbelly in Central Asia." Ultimately, the analyst suggests,
"I have no optimistic forecasts on this situation being resolved in the near future. Still, we can
only place our hopes in the true authorities of the Muslim world."
"In the first phase, Iran will raise exports by 500,000 barrels a day
within a week after the removal of international sanctions, he said Sunday.
The country will add another 500,000 barrels a day in a second phase within
six months after the curbs end, Zanganeh said. "
Bloomberg (like most other US MSM) consistently use fear mongering about
Iran oil that soon will flood the market. And provide only selective quotes
from Iran officials and no facts about their industry and fields. Which
reminds me Baghdad "We will push those crooks, those mercenaries back into
the swamp" Bob. If this is so easy then why they gave up their share on
china oil market to Saudis?
Bloomberg (like most other US MSM) consistently use fear mongering about
Iran oil that soon will flood the market.
Oh get real here. Bloomberg, (like most US MSM), just wants to report
the fucking news. The idea that Bloomberg is part of a giant conspiracy
theory, in cahoots with the government, or whomever, is just goddamn stupid.
Comparing even with the British coverage the statement "Bloomberg, (like
most US MSM), just wants to report the f**king news." is very weak.
In foreign events coverage they want to propagate a certain agenda and
are very disciplined in pursuing this goal. That does not exclude that sometimes
they report important news with minor distortions. But to assume that they
"just wants to report the f**king news" is extremely naïve if we are taking
about foreign events.
Remember all those fancy dances pretending to be news about Iran sanctions.
Truth is the first victim of war. Unfortunately this war for world dominance
now became a permanent business for the USA. And Iran is considered by US
establishment as an enemy.
I would recommend to read AMERICAN EMPIRE by Andrew J. BACEVICH
Harvard University Press, 2002 – 302 pages
In a challenging, provocative book, Andrew Bacevich reconsiders the
assumptions and purposes governing the exercise of American global power.
Examining the presidencies of George H. W. Bush and Bill Clinton–as
well as George W. Bush's first year in office–he demolishes the view
that the United States has failed to devise a replacement for containment
as a basis for foreign policy. He finds instead that successive post-Cold
War administrations have adhered to a well-defined "strategy of openness."
Motivated by the imperative of economic expansionism, that strategy
aims to foster an open and integrated international order, thereby perpetuating
the undisputed primacy of the world's sole remaining superpower. Moreover,
openness is not a new strategy, but has been an abiding preoccupation
of policymakers as far back as Woodrow Wilson.
Although based on expectations that eliminating barriers to the movement
of trade, capital, and ideas nurtures not only affluence but also democracy,
the aggressive pursuit of openness has met considerable resistance.
To overcome that resistance, U.S. policymakers have with increasing
frequency resorted to force, and military power has emerged as never
before as the preferred instrument of American statecraft, resulting
in the progressive militarization of U.S. foreign policy.
Neither indictment nor celebration, American Empire sees the drive
for openness for what it is–a breathtakingly ambitious project aimed
at erecting a global imperium. Large questions remain about that project's
feasibility and about the human, financial, and moral costs that it
will entail. By penetrating the illusions obscuring the reality of U.S.
policy, this book marks an essential first step toward finding the answers.
From FT article it looks like the same minister is saying quite opposite
things. It looks like Iran does not want to play the role of trump card
that will allow to keep oil prices low for another year or two - the implied
message of Bloomberg article, which implicitly supports those who want to
drive the oil market lower (which, of course, includes GS)
== start of the quote ===
"Some of the Opec members believe it is better to go along with this
level of production," Iran's oil minister Bijan Zanganeh said after
the meeting of ministers in Vienna on Friday, in a thinly-veiled dig
at Saudi Arabia. "I didn't have any other expectation."
Mr Zanganeh has been among ministers calling for action to stem the
drop in oil prices that have this week collapsed to near seven-year
lows. His requests, like those from Venezuela and others, have been
rebuffed by the group's de facto leader and largest producer.
The kingdom's veteran oil minister Ali Al Naimi and his inner circle
have made clear that Saudi Arabia will not cut its output without participation
from Opec rivals Iran and Iraq, as well as non-Opec countries such as
Russia. Until this time, it would continue to defend its market share
and sell as much of its oil as it can.
Pressure to limit production as Iran rebuilds its oil industry after
years under sanctions has not gone down well in the country, which is
targeting output growth of 1m barrels a day after restrictions are lifted.
In a countermove, Mr Zanganeh has said countries that have accelerated
output over the past year - Saudi Arabia has increased its production
to above 10m barrels a day in 2015 - should pull back to make room for
Iran's production.
== end of the quote ===
So I stand by my point that there is a bias in Bloomberg coverage, who
very selectively quotes Mr Zanganeh to push the agenda they favor, while
in reality Iran is pushing for cutting production by OPEC to raise the price
to $80 level, which they consider fair, not selling its oil at the cost
futures markets now dictate like Saudis do. That's a big difference.
CNBC suckers should not be trusted ;-). It is a very interesting idea of the US oil glut that
somehow happily coexists with rising imports of oil. Doublethink as it is called in
1984.
Notable quotes:
"... U.S. oil production, meanwhile has remained fairly steady. It climbed to 9.2 million barrels a day last week from 9.179 million barrels a day the week earlier. That is above the 9.13 million level at this time last year, but below the peak of 9.6 million barrels per day. ..."
"... The U.S. inventory report also showed an increase of 1.8 million barrels in distillates, including diesel fuel, and 900,000 barrels of gasoline. Building supplies of refined products suggests less demand for oil by refineries. ..."
"... The U.S. also imported more oil last week - 7.9 million barrels a day, up from 7.3 million barrels the week earlier. ..."
U.S. oil production, meanwhile has remained fairly steady. It climbed to 9.2 million barrels
a day last week from 9.179 million barrels a day the week earlier. That is above the 9.13 million
level at this time last year, but below the peak of 9.6 million barrels per day.
"You are seeing another round of capex cuts that should entail more drilling cutbacks. We still
haven't reached the threshold where production is going to drop. The longer we stay at these levels,
the more convinced I am that this low-price environment is going to be around for a long time,"
said Gene McGillian, an analyst at Tradition Energy. McGillian said he does not expect a real
turn toward higher prices until the end of next year.
... ... ...
While he's not willing to match the $20 per barrel forecasts of some, McGillian said the WTI price
could easily retreat to the $32.40 per barrel, reached in the thick of the financial crisis in late
2008.
The U.S. inventory report also showed an increase of 1.8 million barrels in distillates, including
diesel fuel, and 900,000 barrels of gasoline. Building supplies of refined products suggests less
demand for oil by refineries.
The U.S. also imported more oil last week - 7.9 million barrels a day, up from 7.3 million barrels
the week earlier.
Are remaining shale companies crazy enough to execute extension of drilling into 2016 when they
are cash flow negative
Notable quotes:
"... It seems that the majority of the potential production lies within the U.S., but it does seem unbelievable that we would expect (as OPEC does) that shale oil would render over 4mbd production clear through 2040! Perhaps it might be imagined with a return to high prices, but my impression is that, even then, the Red Queen scenario has been playing out, with well productivity declining over time. ..."
"... So, it seems that shale oil will continue adding very little relative to total world production, and not able to offset declines in existing conventional fields. ..."
Bloomingdave, OPEC has already made that assessment. Check it out at the link below. I agree with
them as to resources but not as to production. Shale oil production will be down in 2016 by a
significant amount. Not slightly up as this chart indicates.
Thank you, Ron. It seems that the majority of the potential production lies within the U.S., but
it does seem unbelievable that we would expect (as OPEC does) that shale oil would render over
4mbd production clear through 2040! Perhaps it might be imagined with a return to high prices,
but my impression is that, even then, the Red Queen scenario has been playing out, with well productivity
declining over time.
So, it seems that shale oil will continue adding very little relative to
total world production, and not able to offset declines in existing conventional fields.
As
Bloomberg adds, so far the biggest oil shutdown involves Enbridge Inc.'s Ozark pipeline, which
was booked to carry about 200,000 barrels a day this month to Wood River, Illinois, from Cushing,
Oklahoma. The outage of the section under the Mississippi River may further add to stockpiles
at Cushing that reached a record high last week.
"The closure of
the Ozark pipeline will just add to the stocks at Cushing," said Amrita Sen, chief oil economist
at Energy Aspects Ltd. in London.
Also shuttered is Spectra Energy Corp.'s 145,000 barrel-a-day Platte oil pipeline between Guernsey,
Wyoming, and Wood River which remains closed as a precaution because of the river's condition.
Aside from closed pipelines, energy companies have also shut down various terminals in the affected
region. Kinder Morgan shut its Cahokia terminal in Sauget, Illinois, and its Cora terminal in Rockwood,
Illinois. Cahokia handles chemicals, coal, cement and metals while Cora handles coal and petcoke,
according to the company's website. Kinder Morgan declared a force majeure, which protects it from
liability for contracts that go unfulfilled for reasons beyond its control.
"We plan to return to service as soon as possible after the water recedes," Wheatley said Friday
in an e-mailed statement.
Exxon Mobil Corp. shut its fuel terminal on the Mississippi at Memphis and is taking precautions
to secure the facility, spokesman Todd Spitler said Friday in an e-mail. Impacts to customers "will
be minimized as alternative supply will be provided," he said.
Iran is dismissing a report that it plans to offer steep discounts on oil to
many customers, particularly in Asia, when it returns to the global energy market
sometime in 2016.
In an interview with Iran's Islamic Republic News Agency (IRNA) on Sunday,
Oil Minister
Bijan Namdar Zangeneh said Iran plans to offer only what the agency described
as "regular and customary" discounts that often are available to any potential
customer.
Iran's standard offer for customers in India, the world's second-largest
consumer of Iranian oil, is 90 days' credit, free shipping and modest discounts
on the oil itself.
Contin uation of tight/shale oil boom requires exploiting shale is also dependent on
factors such as cheap credit, high returns expected on junk bonds, and high oil prices. None of
those conditions are currently present.
Notable quotes:
"... ...Cheaper prices have already encouraged American (as well as Chinese) drivers to indulge in road trips and increase their gasoline consumption. ..."
...The International Monetary Fund also called attention to the $20-a-barrel level by warning
the return of Iranian crude oil to world markets - a consequence of the end of economic sanctions
- could push prices down by $5 to $15 from current levels.
... Unless global energy demand
accelerates even faster than it already is, the extra supply will push energy inventories to the
brim.
...Cheaper prices have already encouraged American (as well as Chinese) drivers to indulge in
road trips and increase their gasoline consumption.
"... My guess is that onshore US conventional dropped from 2.6 million 1/15 to around 2.1-2.2 million
12/15, and it will go below 2 million before the middle of 2016. ..."
SS, separating the onshore production from the G of M provide a better understanding of what is
happening in the US. Using the latest October PSM data, one can see the steady decline in onshore
production from May to October, 303 kb/d. However, from June to September, Gulf production increased
by 251 kb/d. October saw a drop of 80 kb/d from September. Would this be the result of a platform
shutting down for maintenance?
I think that many, myself included, thought that the LTO was not dropping off as fast as expected.
However, I also suspect that onshore conventional has dropped more in percentage terms than
onshore horizontal.
My guess is that onshore US conventional dropped from 2.6 million 1/15 to around 2.1-2.2
million 12/15, and it will go below 2 million before the middle of 2016.
As they moved in to arrest Sheikh Nimr, the Saudis were well aware that this was a case that would
cause ructions.
Here was a prominent, outspoken cleric who articulated the feelings of those in the country's
Shia minority who feel marginalised and discriminated against. This was a figure active on the sensitive
Sunni-Shia sectarian fault line that creates tension in the Kingdom and far beyond.
As the Shia power in the region, Iran takes huge interest in the affairs of Shia minorities in
the Middle East. And it was inevitable that Tehran and Riyadh would clash over the treatment of Sheikh
Nimr.
The Iranians had warned that the death sentence handed to him should not be carried out. But one
of the principal concerns of the Saudis is what they see as the growing influence of Iran in places
like Syria, Iraq and elsewhere. So perhaps it is not so surprising that they were not going to be
swayed by Iranian pressure in this most sensitive case in their own backyard.
The international rights group Reprieve called the executions "appalling", saying at least four
of those killed, including Sheikh Nimr, were put to death for offences related to political protest.
Protests broke out in early 2011 in the oil-rich Eastern Province in the wake of the Arab Spring.
Sheikh Nimr's arrest in the following year, during which he was shot, triggered days of protests
in which three people were killed.
... ... ...
Prominent Iraqi Shia cleric Moqtada al-Sadr called for "angry demonstrations in front of Saudi
sites and interests", but said protests should be peaceful.
Lebanon's Shia council called the execution a "grave mistake" while the Hezbollah militant group
said it was an "assassination".
Police in Bahrain, which has seen tensions between the majority Shia population and its Sunni
rulers, fired tear gas on protesters angry at the execution.
Saudi authorities deny discriminating against Shia Muslims and blame Iran for stirring up discontent.
Saudi Arabia carried out more than 150 executions last year, the highest figure recorded by human
rights groups for 20 years.
"... According to the Westminster-controlled BBC, a Russian pilot "died when his SU-24 aircraft was shot down". If that is a time appreciation, it is a fairly accurate one, but he actually died after his aircraft hit the ground, and that fact was not the cause of his death. He died because he was shot full of holes from the ground while he was hanging helpless in his parachute straps and was not armed. As has been demonstrated to what should be the complete satisfaction of all, this is a war crime, illegal under international law regardless who does it. ..."
"... But the Washington-and-Westminster-controlled western media skates adroitly around that fact, and consistently normalizes his death as just one of those unfortunate things that happens in war. ..."
"... I can promise you that the murder of a western pilot under the same circumstances would not be soft-pedaled in the same manner, and the fact that criminal circumstances were attached to his dying would have been shouted to the skies. ..."
According to the Westminster-controlled BBC, a Russian pilot "died when his SU-24 aircraft was
shot down". If that is a time appreciation, it is a fairly accurate one, but he actually died
after his aircraft hit the ground, and that fact was not the cause of his death. He died because
he was shot full of holes from the ground while he was hanging helpless in his parachute straps
and was not armed. As has been demonstrated to what should be the complete satisfaction of all,
this is a war crime, illegal under international law regardless who does it.
But the Washington-and-Westminster-controlled
western media skates adroitly around that fact, and consistently normalizes his death as just
one of those unfortunate things that happens in war.
I can promise you that the murder of a western
pilot under the same circumstances would not be soft-pedaled in the same manner, and the fact
that criminal circumstances were attached to his dying would have been shouted to the skies.
This is "blast from the past (2012) well inside period when shale/tight oil prices were close or
above $100. Even at those time shale/tight oil companies have difficulties of creating sizable cash
flow and were forced to borrow heavily on junk bond market. Occidental Petroleum was driven out
of Bakken in 2012 because of costs.
average well costs vary from $6 million in the sweet spots of the Sanish field in central Bakken
to $7 million elsewhere in North Dakota. The company says its well costs in the south Texas play average
$5.5 million per well, giving it a $1.5 million edge over other operators there. ...
Houston-based
driller Marathon Oil said its first-quarter well costs in the Eagle Ford were unchanged at $8.5 million
a well because of such contracts, which the company's Chief Operating Officer, David Roberts, said are
keeping his firm from "as much price relief, potentially, as we would like.
Notable quotes:
"... The cost of bringing one Bakken well into production has grown from an average $6.5 million in 2010 to $8.5 million in the first quarter this year, data from company reports and the state regulator show. ..."
"... Bakken crude for June delivery at the Clearbrook, Minnesota hub was bid as low as $85.24 a barrel on Wednesday and offered at $93.69, down 6.5 percent from October levels, according to traders. For now, prices are comfortably above the $68 a barrel breakeven point for a 15 percent rate of return, according to Credit Suisse analysis. ..."
"... He says Whitings average well costs vary from $6 million in the sweet spots of the Sanish field in central Bakken to $7 million elsewhere in North Dakota. ..."
"... The company says its well costs in the south Texas play average $5.5 million per well, giving it a $1.5 million edge over other operators there. ..."
"... New state regulations in North Dakota, put in effect at the start of April, could add up to $400,000 to the cost of each well, since they proscribe the use of reserve pits to store discarded drilling fluids, according to the state Petroleum Council, which represents producers. ..."
"... Houston-based driller Marathon Oil said its first-quarter well costs in the Eagle Ford were unchanged at $8.5 million a well because of such contracts, which the companys Chief Operating Officer, David Roberts, said are keeping his firm from as much price relief, potentially, as we would like. ..."
Occidental Petroleum was among the first major U.S. oil drillers to make a big bet on the resurgence
of domestic production, spending billions to grab oil patches from Texas to North Dakota. Now, as
it bemoans steep costs and moves its rigs out of the Bakken shale oil fields, some analysts wonder
if the company has lost its clairvoyance. After two years of unyielding gains, costs are bound to
fall, they say.
The California-based energy giant is beset by escalating labor costs in North Dakota, which has
the lowest unemployment rate in the country. Other material costs have surged and new environmental
regulations could add to the burden.
The cost of bringing one Bakken well into production has
grown from an average $6.5 million in 2010 to $8.5 million in the first quarter this year, data from
company reports and the state regulator show.
"We got a lot better places to put money right now than the Bakken," Occidental CEO Stephen Chazen
said on a conference call with analysts late last month. "That's why I'm slowing it down."
But if some analysts are right, Occidental's pullout may prove ill-timed. The costs to complete
a well by injecting it with water, sand and other chemicals -- the hydraulic fracturing or "fracking"
process -- is falling as natural gas firms pare back on new drilling.
Pressure pumping prices, which cover a range of costs associated with fracking a well, have already
dipped by up to 25 percent in natural gas-rich basins, with signs of a knock-on effect emerging in
the Bakken, according to Barclays analysts. Within the next six months, these costs could fall by
as much as 10 percent in the Bakken shale, analysts at Bernstein Research estimate.
Efficient forms of fracking are also helping companies extract more oil from each well, lowering
the break-even cost of production, now estimated between $55 and $70 a barrel.
The push and pull of production costs in the world's fastest-growing oil frontier is adding uncertainty
to the outlook for U.S. oil prices. The issue is already in the limelight this election year, with
both political parties touting shale oil as a step toward energy independence, even as environmentalists
fret over the controversial fracking process, which has been blamed for the pollution of water supplies
and minor earthquakes.
If costs start to slip, the explosive output growth could keep a lid on U.S. oil prices, regardless
of tensions with Iran that have threatened global supply. If they continue to rise, breakneck output
growth may stall as more companies follow Occidental's lead and begin to pare back drilling and investment.
The two biggest plays -- the Williston basin in North Dakota and Eagle Ford in Texas -- produced
an estimated 1.2 million barrels per day (bpd) in April, close to the output from OPEC member Algeria,
according to data from analytics company Bentek Energy. A year ago, they were producing only a third
as much.
ON THE RISE
Over the past three years, drilling in U.S. shale patches has become an expensive affair, even
as producers got better acquainted with the shale rock they mined. Service firms could name their
price while the producers scrambled to drill.
Sand and ceramics, which companies pump into deep wells in a water and chemical mix to frack a
well, were in scant supply. The spot price of guar -- a gum processed from tiny seeds and used to
thicken fracking water -- has ballooned by 10-fold since January 2011 and doubled since the start
of this year, according to data from Agra Informa, an agricultural consultancy.
The nationwide cost of drilling and other well services for oil and gas wells has risen 22.5 percent
since October 2009, hitting a five-year high in March, according to the Bureau of Labor Statistics'
Producer Price Index (PPI).
Meanwhile, prices for shale oil, particularly from the Bakken, fell as the glut of new crude supplies
in the Midwest led to deep discounts for U.S. benchmark crude.
Bakken crude for June delivery at the Clearbrook, Minnesota hub was bid as low as $85.24 a
barrel on Wednesday and offered at $93.69, down 6.5 percent from October levels, according to traders.
For now, prices are comfortably above the $68 a barrel breakeven point for a 15 percent rate of return,
according to Credit Suisse analysis.
TABLES TURNED
But this year's slump in natural gas prices to a 10-year low is beginning to change the game.
Pricing power is shifting from service companies to drillers, possibly capping costs, as energy firms
slash gas-directed drilling rigs by 23 percent.
Houston-based oil services firm Baker Hughes projects the number of rigs drilling for both oil
and gas at the end of 2012 will be just under 2,000, only one percent higher than last year.
At the same time, total U.S. pressure-pumping capacity is expected to grow to 19 million horsepower
this year, two-and-a-half times the levels three years ago, according to research firm Tudor, Pickering,
Holt & Co.
Some of this new capacity is operated by small fracking firms that are mushrooming across North
America who are willing to take on projects for a fraction of what the big firms charge.
What is more, fracking crews, previously engaged in dry-gas outposts, are already moving out of
east Texas and Louisiana and into the hyperactive Eagle Ford shale in south Texas or the Bakken up
north.
Bad news for oil-services firms also highlights the trend. Halliburton, the market leader in pressure
pumping, lost 5 percent of its operating income in North America in the first quarter of 2012, compared
with the previous quarter, as the price it charged for pressure pumping slumped.
The company said its North American margins will fall into the low 20 percent range by the end
of 2012, down from about 25 percent at present.
SET TO SLIDE?
Efficiency is also improving. Whiting Petroleum, one of the largest producers in the Bakken, says
it has cut the days it spends drilling wells to 15, which shaves off about $1.5 million in costs.
The company also uses a fracking method called sliding sleeves that adds another $1.5 million in
savings, according to CEO Jim Volker.
He says Whiting's average well costs vary from $6 million in the sweet spots of the Sanish
field in central Bakken to $7 million elsewhere in North Dakota.
Other input costs may also be poised to decline.
EOG Resources says it is spending $500,000 less on each Eagle Ford well after it started using
sand from its own mines in north-central Texas and Wisconsin.
The company says its well costs
in the south Texas play average $5.5 million per well, giving it a $1.5 million edge over other operators
there.
EOG's Wisconsin mine, which started operating in January, is one of the 20 new sand mines that
popped up in the state since last year. Neighboring Minnesota has 13 pending applications for new
mines but most of these were stopped short by county-level moratoriums that will be in effect well
into next winter, according to Tony Runckel, the state's chief geologist.
While sand or "proppant" prices haven't fallen yet, input prices are likely to decline later this
year, according to Barclays analysts James West.
US Silica, one of the largest frack sand producers in the United States, is tying up more long-term
contracts, a sign that it is also anticipating a possible downturn in prices.
Guar supply is another issue. Indian farmers, who cater to 80 percent of worldwide guar demand,
are sowing record volumes of the seed this season but it is not entirely clear if this autumn's harvest
will meet growing U.S. demand.
UNEVEN BURDEN
Even though cost declines are on the horizon, they may be slow to arrive.
New state regulations in North Dakota, put in effect at the start of April, could add up to
$400,000 to the cost of each well, since they proscribe the use of reserve pits to store discarded
drilling fluids, according to the state Petroleum Council, which represents producers.
The long-term contracts that many developers have with the oil services firms will also stand
in the way. Those contracts, which ensured steady prices when costs were on the up, are a long way
from their end and, in most cases, are unlikely to be renegotiated soon.
Houston-based driller Marathon Oil said its first-quarter well costs in the Eagle Ford were
unchanged at $8.5 million a well because of such contracts, which the company's Chief Operating Officer,
David Roberts, said are keeping his firm from "as much price relief, potentially, as we would like."
Halliburton, in fact, says it is going back to producers, with steeper price schedules in tow,
so it can pass on some of the lofty raw material costs, its CEO David Lesar said in April.
"I suspect the pressure will come when they start to roll over" the contracts, Lesar told analysts
last month.
In the Bakken shale, that could be as far out as eighteen months into the future, according to
James Crandell, global head of oilfield services research at Dahlman Rose in New York. Even then,
Crandell says, contracts will be renewed at "modestly lower" prices in North Dakota.
"In other regions, particularly natural gas (fields), I expect larger reductions when the contracts
end," he added.
Still, even Occidental does not intend to fully move out of oil-rich shale plays like the Bakken.
"This is the Willie Sutton discussion," CEO Chazen said, comparing his strategy with that of the
slick bank robber from Brooklyn. "Why are we there? Because that's where the oil is."
(This version of the story has been corrected to fix the name of Occidental's CEO)
"... Its not matter is im optimistic or pessimistic, it is not mathematically possible. I dont speak about geology, steep decline of wells etc. I talk about reading chart which EIA presented. If there is 40 billion LTO recoverable reserves on $60-70 barrel(EIA in 2013 put 14 billion, on $100, so i put numbers nearly 3 times greater because of technology, costs squeeze etc.) it is not possible be on 4-4.5 mb/d on average 2015-2040. 4.5mb/d x 365 d x 25 years= 41 billion barrels. ..."
"... The EIA seems to base their TRR estimates on investor presentations, their LTO TRR estimates are very optimistic. Probably 20 Gb total from Bakken and Eagle Ford and about 20 Gb from the Permian LTO and other US LTO plays for a total of 40 Gb is reasonable. The 80 Gb TRR estimates are likely to be high by roughly a factor of 2 in my opinion. ..."
"... the EIAs EUR estimates for all tight oil plays are much more conservative than in companies presentations. It seems that the increase in TRR estimate was due to tighter assumed well spacing. But the actual well spacing in currently producing subplays is in many cases even tighter than the EIA assumptions. ..."
It's not matter is i'm optimistic or pessimistic, it is not mathematically possible. I don't
speak about geology, steep decline of wells etc. I talk about reading chart which EIA presented.
If there is 40 billion LTO recoverable reserves on $60-70 barrel(EIA in 2013 put 14 billion, on
$100, so i put numbers nearly 3 times greater because of technology, costs squeeze etc.) it is
not possible be on 4-4.5 mb/d on average 2015-2040.
4.5mb/d x 365 d x 25 years= 41 billion barrels.
According to the EIA Annual Energy Outlook 2015 (base case), technically recoverable
resources (TRR) of LTO in the U.S. are 78.2 billion barrels (+35.8 bbls of NGPLs).
In AEO 2014, these estimates were 59.2 billion barrels and 27.6 billion, respectively;
In AEO 2013: 47.1 billion barrels of LTO.
I do not know where your number of 14 billion comes from?
To note, estimates of technically recoverable resources do not depend on the price of oil,
and the EIA does not provide estimates of economically recoverable resources.
I am not saying that the EIA projections are correct, but at least their LTO production forecasts
correspond to their TRR estimates.
And yes they claim resources on 78.2Gb(until this year was 58 Gb, how is possible so much growth
on resources in this price environment is mystery for me), but that is potential resources no
proven reserves which for now stood on 13. 365 GB.
But in end it is not matter what they claim for potential resources, they can claim 1 trillion
barrels but what is matter reserves and for now they are 13.3 GB, i put 3 times greater number
and 4-4.5 mb/d average 2015-2040 is mathematically not possible in that case.
OK. Thank you for that clarification. Also, i use data which Dennis Coyne put on 30-40 Gb, which
is pretty optimistic for proven reserves, you must admitted that.
That is Hamm 24 Gb projections in Bakken, plus 100% growth proven reserves in Eagle Ford plus
4 times greater reserves in Niobara and other plays(outside of Bakken and EF) than now. Pretty
good.
Dennis' numbers are for TRR as well. He says that his "guess for LTO is based on USGS and David
Hughes work"
But, unlike the EIA, USGS updates estimates for shale plays resources relatively
seldom. And David Hughes' past forecasts of LTO production have proved too conservative.
"how is possible so much growth on resources in this price environment is mystery for me"
TRR estimate is not dependent on price. It is calculated based on the "Area with Potential"
(in sq. miles), average well spacing (wells/per sq mile) and average estimated ultimate recovery
(EUR) per well
The EIA seems to base their TRR estimates on investor presentations, their LTO
TRR estimates are
very
optimistic. Probably 20 Gb total from Bakken and Eagle Ford and
about 20 Gb from the Permian LTO and other US LTO plays for a total of 40 Gb is reasonable. The
80 Gb TRR estimates are likely to be high by roughly a factor of 2 in my opinion.
We will see a steep decline in US LTO output between 2020 and 2025.
the EIA's EUR estimates for all tight oil plays are much more conservative than
in companies' presentations. It seems that the increase in TRR estimate was due to tighter assumed
well spacing. But the actual well spacing in currently producing subplays is in many cases even
tighter than the EIA assumptions.
I don't want to guess what is the right number of TRR because of too many uncertainties (including
potential impact of technologies on LTO recovery rates).
What may have a negative impact on LTO production is not TRR, but low oil prices + poor economics
of shale companies.
"... The Saudis have been making use of tertiary recovery methods for decades. Lately they have been driving infill wells with laterals along the top of the Ghawar formation to capture the dregs that water flooding leaves behind (they treat seawater). ..."
"... Capitalism requires surplus value to extract from. Peak oil along with peak everything else has made it so there is no longer any surplus value anymore at least in the real economy where imo any real value resides. Capitalisms extraction now comes at the expense of someone else or as I call it Cannibalistic Capitalism. ..."
"... Its Hood Robin Economics. Rob from the Poor to Give to the Rich. ..."
Yeah. Busy man. In the winter Apollo also rode on the back of a swan to the land of the Hyperboreans
where he engaged in HFT and front running to shore up his account.
BTW: to read articles in WSJ or Financial Times, simply copy and paste the article headline
onto the search window and the complete article will come up.
"prolonged period of low prices is "also unsustainable, as it will induce large investment
cuts and reduce the resilience of the oil industry, undermining the future security of supply
and setting the scene for another sharp price rise," the prince said in the remarks"
Then pulls out the paint sprayer: "The size of the world's middle class will expand from 1.8
billion to 3.2 billion in 2020, and to 4.9 billion in 2030, with the bulk of this expansion occurring
in Asia, he said".
That's nice precision. Not 4.8 or 5.0 but 4.9. The very same middle class that is now disappearing.
And that 2020 target is just 5 (soon to be 4) years away. I guess setting the target of 2016 was
just a little too much to be trustworthy.
Keepin it hummin. The last car I'll ever need. And it's never been better. Long weekend rides
for the price of 3 beers. And of course it's morally wrong to drive to see my friends. But someone's
gotta keep the oil prices up, right?
At least this time they recognize that there are several factors that need to be overcome:
" The success of the drilling, the ability to find the water needed in the desert to make it
work, Saudi co-operation with the global energy companies who have the expertise, the Saudi cost
per barrel to produce shale energy and the global price of oil."
The Saudis have been making use of tertiary recovery methods for decades. Lately they
have been driving infill wells with laterals along the top of the Ghawar formation to capture
the dregs that water flooding leaves behind (they treat seawater).
PP – I have come to the conclusion that the fed can only follow on with what is happening at
the time. If things are not looking so cheery they grudgingly lower rates to encourage borrowing
and ramp things up. As soon as things are ramped up they happily crank up rates and rake in the
profits of exuberance. Both of these are lagging actions. Their claim that they make these rate
changes to balance out the economy is pure BS.
Capitalism requires "surplus value" to extract from. Peak oil along with peak everything
else has made it so there is no longer any surplus value anymore at least in the real economy
where imo any real value resides. Capitalisms extraction now comes at the expense of someone else
or as I call it Cannibalistic Capitalism.
"... Concerning Iran, where is the 500K+ barrels of oil per day coming from?
Drilled but uncompleted wells? Wells that have been completed, but are shut in?
New wells that need to be drilled and completed? Oil in storage? A combination?
..."
Concerning Iran, where is the 500K+ barrels of oil per day coming
from? Drilled but uncompleted wells? Wells that have been completed, but
are shut in? New wells that need to be drilled and completed? Oil in storage?
A combination?
Next, I just read an article which argues India is where China was in
2004 with regard to oil consumption. So, if India ramps up the way China
did, and all these long term projects are shelved, where does that put things?
African production and consumption gets little attention. For 1.2 billion
people and growing, will Africa be the next India, and then next China,
on in terms of oil consumption? Is there still a lot of oil to be discovered
in Africa that will offset this?
"Concerning Iran, where is the 500K+ barrels of oil per day coming from?"
…? ….?….?
I suspect it won't take much for Iran to ramp up production. We are talking
one of the lowest cost and simplest places in the world to produce. This
is not about fracking shale or deep sea. In addition and probably most important.
Iran once produced over 6 an a half barrels per day. About twice current
production. Which tells me the infrastructure from field to market is in
place. The Iranians are also getting lead time currently to prepare to go
to market. I expect the oil to be ready to flow when the sanctions come
off.
But what is the reason for them to hurry with the current oil prices ? They
do not have the problem that Russians or the USA have of multiple oil companies
doing stupid things to survive and please investors (Rosneft with Sechin
as a head is the primary example here; they were really caught without pants
by the current slump). They are more like Saudis with the state company
that is a monopoly. So they can wait.
And to whom they can sell oil? Saudis shut for them the opportunity to
return to the market without losing revenue by refusing to shrink their
share, the share they obtained due to sanctions. . To try to cut Russians
and Saudis in China? This is dangerous as it can antagonize Russia. Or try
to get into overcrowded European market to decimate Norway? I am not sure
EU will allow that.
The only way to sell more oil now is to engage in Saudi self-destructive
game of dumping oil at prices below the market to help to implement Goldman
$20 per barrel scenario. I doubt that this is a wise policy.
A better deal would be to get technology they need while they can ( for
example horizontal drilling) and wait a proper moment to put this oil on
the market. There is not much West can offer them now that they do not already
know or can't replicate themselves after surviving years of sanctions. Also
I think some Iranians leaders already suspect that they got into the trap
West set for them intentionally (whether this is true or not)
Even if oil prices rise early and fast next year, it may take a while for Canadian oilsands to
rebound due to cancelation of many long-term projects.
Notable quotes:
"... "I think 2016 will start off very low, below $40, and could be as low as $30 in the first quarter," vice-president economics and commodity markets specialist Patricia Mohr said in an interview. ..."
Scotiabank Economics said that while other commodities are set to rebound in 2016, West Texas
Intermediate oil prices would average "no more than US$40-45 per barrel for 2016 and US$45-50 for
2017."
"I think 2016 will start off very low, below $40, and could be as low as $30 in the first
quarter," vice-president economics and commodity markets specialist Patricia Mohr said in an
interview.
The real burden on the Saudi budget comes from the fact, that there is 13 million ex-pat workers
working in Saudi Arabia, which makes the subsidies number so huge, the government subsidies fuel,
electricity, water, medicine, food & gas for the total population (30 million). according to the
numbers issued by the ministry of labour last week, Saudi Arabia issued last year 1.5 million
work visa to the private sector & 800 thousand for domestic workers (maids & drivers) which represents
around 4.5% of total population Saudi Arabia, from 2010 to 2014 this the average rate of work
visa issuance in the country. This huge influx of labour to the kingdom means an increasing government
spending to expand and maintain the country's infra structure to accommodate the ever exploding
population, and it puts an inflationary pressure on the general prices because of the growing
demand on food and clothing and housing...etc, and it creates other social problems.
Factcheck4567
I think the reverse is true. The migrant labor force is exploited and do not have good living
conditions. The citizens gets a free ride by exploiting the labor class. It is the labor class
that is subsidising the Govt finances (they don't have pensions or even good healthcare) and the
citizens that is exploding it (they go to Germany for medical treatment with family in business
class when they have a chest pain- all paid by Govt). Please be humane and fact based.
MJDubuque
The potential of various neoliberal austerity measures, whose burden disproportionately falls
on the poor, to create social unrest in Saudi Arabia is hyperbolically discounted.
Douglas Jones
What is the price of bottled water in Saudi?
A 50-65% increase in gasoline prices just might invent Saudis not to leave their car engines
running to power the air conditioning while at shopping malls with outside temperatures over 110
Fahrenheit. Need more comparative gasoline and diesel prices in the Gulf region.
No way that oil price will be average $60 per barrel in 2016. Russian budget assume base scenario
$50 but they will lower on $40-45 average in 2016. Russians said they not expected that average
oil price be over $60 till 2018, they are very pessimistic on oil price.
I have one question: what is really number for LTO reserves in USA(USGS and EIA) on price around
$60-70(in 2015 $)? Because, if it is around 30-35 billion barrels this all charts(not only
OPEC but EIA) for US LTO production are mathematically impossible. They have average US LTO
production on 4-4.5 mb/b but when you calculate that on 25 years period reserves need are around
40 billion barrels.
4.25mb/d x 365 days=1.55 billion barrels per year
1.55 barrels/year x 25 years=38.7 billion barrels.
I'm something miss or badly calculate?
It is not government prediction but private funds and Lukoil, biggest private oil company in
Russia. This is official government prediction, unfortunately it is on russian.
Base: price for Ural(around $2 discount on Brent)
2016: $50
2017: $52
2018: $55
Pessimistic:
2016-2018 average price $40.
All budget plans, GDP, CPI are project on this oil price projections in Russia.
So Russian goverment don't see oil price on brent over $60 in 2018.
And if i'm correct, Russian Central Bank and finance/economic minister now make plans for $30-35
average price for 2016.
I just see official numbers of EIA for LTO reserves in USA and that is around 14 billion,
if that is true all predictions about US LTO production on 4mb/d in next 25 are imposible,
they even imposible if there is increased of 200% in LTO reserves from today level.
"... $15-20 for a long period of time? Guess we should give up here in the US. Almost no one survives that. One year of prices averaging $49 WTI, which followed 5 years of very strong prices, has caused several BK and put many more companies in distress. ..."
"... It seems obvious that many American stripper wells for instance are running deep in the red at less than twenty to OVER FORTY bucks, on a day to day basis. If prices will stay in this range, the owners of such wells are going to be FORCED to give it up. ..."
"... Now insofar as subsidies being used to maintain production, yes, paying producers extra money will get some extra production. But this is merely a BULLSHIT argument, because the producer is STILL getting the price HE must have to continue to produce. WHERE the money comes from is irrelevant, in terms of his staying open for business. ..."
Russian oil company, Gazpromneft, recently said that their current operations will remain profitable
at $15 per barrel, and at $20 they will drill new wells
oil companies may remain profitable, yes, but $15-20 oil for several years means severe budget
crisis, economy going strongly south and rising risks for social stability
it is unclear if oil companies could function well under such circumstances.
What they said – is that they can withstand a short period of very low oil prices by limiting
investments to maintenance capex. Nobody thinks that oil prices can remain at $15-20 levels for
a long time.
"they can withstand a short period of very low oil prices"
depending on how long that 'short period' is everyone can lol.
"Nobody thinks that oil prices can remain at $15-20 levels for a long time"
I think they actually can. That's not likely but if global economy is weak enough then higher
prices (in constant dollars) might not be affordable long enough.
$15-20 for a long period of time? Guess we should give up here in the US. Almost no one survives
that. One year of prices averaging $49 WTI, which followed 5 years of very strong prices, has
caused several BK and put many more companies in distress.
Unless, of course, you believe Mark Mills, who thinks US LTO will soon be profitable at $15-20
WTI through technological advances.
. I suppose there is quite a lot of legacy oil, meaning oil in fields that are already developed,
that can be gotten out of the ground for less than twenty dollars a barrel. Twenty ought to be
enough to cover day to day operating costs in a lot of oil fields.
But my wild ass guess is
that such oil probably represents only a rather minor fraction of daily world wide production.
It seems obvious that many American stripper wells for instance are running deep in the red
at less than twenty to OVER FORTY bucks, on a day to day basis. If prices will stay in this range,
the owners of such wells are going to be FORCED to give it up.
Hopefully somebody who crunches numbers can throw a little light on this question.
Now insofar as subsidies being used to maintain production, yes, paying producers extra money
will get some extra production. But this is merely a BULLSHIT argument, because the producer is STILL getting the price HE
must have to continue to produce. WHERE the money comes from is irrelevant, in terms of his staying
open for business.
"... In short, the call says while bargain hunters have poured money into energy stocks, its too soon for such bottom fishing ..."
"... It could be time if you listen to highly regarded forecaster Pira Energy Group, which sees oil climbing to $70 a barrel by the end of 2016 ..."
"... Another analyst told CNBC that $60 oil could come ..."
"... XLE has seen some of the best inflows all year of any of our sector products, says Mazza, the SPDR researcher, in that Q A. Hes referring to the Energy Select Sector SPDR ETF (XLE) -- a $12 billion fund (http://www.etf.com/XLE) tracking the S P 500s energy companies. But heres his warning: While the valuation opportunity is attractive with energy, were not necessarily looking to step in there yet. ..."
"... not confident that oil prices have necessarily found a bottom ..."
Crude's seemingly unending crash has captivated traders, and it's been a key talking point in
all those 2016 predictions.
Time to turn the page? Well, today's call gives a clear warning about oil and energy stocks, and
then you don't have to read about crude again until next year. In short, the call says while bargain
hunters have poured money into energy stocks, it's too soon for such bottom fishing (
http://www.investopedia.com/terms/b/bottom-fishing.asp ).
Energy stocks might seem like a good catch if you look at trailing price-to-earnings ratios, says
the research head for SPDR ETFs, Dave Mazza, in a Q&A with ETF.com. But it's New Year's Eve, so don't
look back. Gaze ahead.
"If you look at the forward price-to-earnings ratio, energy doesn't necessarily look very attractive,"
Mazza says. More from that SPDR man below.
On the other hand, MarketWatch's Deep Dive column has highlighted nine energy stocks (http://www.marketwatch.com/story/9-favorite-stocks-for-investors-playing-a-2016-oil-rebound-2015-12-30)
if you really are ready to wade in right now. It could be time if you listen to highly regarded forecaster Pira Energy Group, which sees oil climbing to $70 a barrel by the end of 2016 (http://www.etf.com/sections/features-and-news/2016-big-predictions?nopaging=1).
Another analyst told CNBC that $60 oil could come (
http://www.cnbc.com/2015/12/30/oil-to-fall-under-30-before-rebounding-analyst.html )
by 2016's end, but not before it drops into the 20s.
Beyond the battle-weary energy sector, today's chart features a stock that has roared back in
December, after its much-publicized crash as 2015 began.
The call
"XLE has seen some of the best inflows all year of any of our sector products," says Mazza,
the SPDR researcher, in that Q&A. He's referring to the Energy Select Sector SPDR ETF (XLE) -- a
$12 billion fund (http://www.etf.com/XLE) tracking the S&P 500's energy companies.
But here's his warning: "While the valuation opportunity is attractive with energy, we're not
necessarily looking to step in there yet."
And read: The dollar could take one of these 3 paths in 2016 (http://www.marketwatch.com/story/3-views-on-the-dollar-in-2016-2015-12-21)
The stat
31 -- That's how many liquid-alternative funds have been closed in 2015, up from 22 in 2015, says
a Wall Street Journal article about how the hedge-fund model has "stalled on Main Street." (
http://www.wsj.com/articles/the-year-the-hedge-fund-model-stalled-on-main-street-1451519965 )
It's a blow for money managers seeking fees and increasingly losing out to low-cost index funds.
When Syrians, Ukraines, Libyans, Iraqis, Yemenis, Afghans and others are unable to drive
because they are car-less, road-less, dead, penniless or refugees, Americans drive in their place.
"The American way of life is non-negotiable," proclaimed George HW Bush in 1992; the inch-by-inch
demolition of countries … including Greece, Spain, Portugal and France … is what 'non-negotiable'
looks like.
The amounts of fuel to be had by way of 'consumption switching' from the destitute countries of
the global south is trivial, no more than a few hundred-thousand barrels per day; unraveling these
countries is overture/practice for the larger game. The prizes are Europe, with its crude daily consumption
of 12.5 million barrels; also China and Russia, with their daily output of 15+ million barrels per
day. Should Europe be wrenched into consuming half of that current total, Americans will gain the
balance. As China and Russia's economies collapse oil prices will crash even lower than they are
now as more desperate barrels are dumped onto the world market.
Figure 1: Iraq no longer exists as a unified country but the fragments nevertheless extract
4 million barrels of light crude per day(Ron Patterson/Peak
Oil Barrel). The appearance of excess supply glut has occurred during a period when gross crude
production has been relatively flat. In the face of unlimited demand (not to be confused with consumption)
there must be triage: to accommodate some users, other users have to levered out of the market …
by hook or by crook.
Figure 2: Hook vs. crook: French petroleum consumption has been declining steadily for economic
reasons, chart by Mazama Science
(click for big). French drivers guzzle 1.5 million barrels of MENA (Middle East, North Africa) crude
per day. Paris has an interest in destabilizing these areas to absorb their consumption and make
them more dependent upon French euros; the US has an interest in ruining France so that it's millions
of barrels of daily consumption might flow into American gas tanks.
The foregoing leaves out the fact that customers in France and elsewhere around the world are
broke and becoming less able to afford fuel at any price.
Islamic State is the New Black.
ISIS and other, similar groups are the future revealing itself. Instead of science fiction-y high
technology and 'innovation', singularities and robot immortality, there is
17th century barbarism.
Along with Ukraine and Iraq, Syria is one more fiercely ugly place-of-the-moment where fantasy of
unlimited material 'progress' and the reality of resource constraints collide. The West and the United
States have caught themselves in a trap of their own making. The West requires resources from
the Middle East and elsewhere to produce GDP expansion. The West's (borrowed) fuel payments provide
funding for messianic non-state actors that threaten the West itself. If you drive a car you must
buy fuel, when you buy fuel you are funding ISIS and growing constellation of similar groups.
Militancy cannot be removed from its context of neo-colonial exploitation of global south's
resources. We need to actually change our lifestyles, to make sacrifices, to give somethings
up, our useless, costly toys. #ISIS is a consequence, an externality of our squandrous waste of irreplaceable
capital. Sending in the air force fails because doing so wastes more capital even as prior interventions
are what birthed and nurtured groups like #ISIS in the first place.
The International Energy Agency (IEA) expects shale oil production in the United States to
shrink by more than 600,000 barrels per day next year if current low oil prices persist. At that
rate, daily U.S. shale production would soon fall below 5 million barrels per day.
Lower prices will accelerate shutdowns in areas like the North Sea too. Energy consultancy Wood
Mackenzie reckons that over a third of the area's 330 fields could be threatened by early closure
if prices remain below $85 per barrel for an extended period.
Like shale, the North Sea was once seen as a serious rival to OPEC's cheap oil but now it looks
like its first victim. Wood Mackenzie reckons that at least 1.5 million barrels of daily global
production are uneconomic at $40. Those volumes make up no more than a couple of percent of
supply. But the global oil market is finely balanced. Small changes can lead to big shifts.
As more high-cost production is either shut down or slowed down, OPEC's pricing power will come
to the fore. The IEA says oil prices will swill around the bottom of the barrel until 2018. If
demand for oil rises with a global economic growth spurt – fuelled perhaps by the low cost of
energy – the oil prices will move up sooner than that.
The precise price to be seen at any moment in 2016 is unpredictable. But elemental oil market
forces suggest that a barrel of black stuff will revert back towards its 10-year mean above $80.
Conventional Oil: 80 million barrels – give or take. Depletion 5% = 4 million barrels p.a.
Unconventional: 17 million barrels. Depletion 10% (Tar sands close to 0% – NGL´s/Shale Oil at
least 20%) = 1.7 million barrels
Total: 5.7 million barrels.
Some have mentioned that only a few hundred thousand barrels extra oil are needed in order to
avoid the Peak. But don´t have these 5.7 million barrels have to be overcome first before any
additions can actually take place? I mean – 5.7 million barrels that is an enormous amount that
has to come online before any addition can be counted.
Somewhere upthread I read that approx. 4,000 shale wells have been drilled in the US but are
uncompleted. Taking Enno Peters´s excellent study: the best wells will yield 800 barrels per day.
So 4,000 x 800 = 3.2 million barrels at best. Still 2.5 million barrels remain to be covered just
to break even.
Where is this amount of oil supposed to come from?
Iran: 0.5 mbpd
Iraq: 0.37 mbpd
Libya: x?
???
Am I missing something?
Again, please feel free to correct me.
Greenbub , 12/31/2015 at 9:35 pm
Well, you didn't mention Russia. My question is where are the half-million Iranian barrels
coming from? Are there idle wells with unemployed technicians sitting around hoping for
sanctions to end?
Ron, you must include in equation 2 mb/d from Iran and Libya…
It
is estimated that Iran could possibly bring 500,000 bpd on line within
one year of sanctions being lifted. Their fields are in terrible shape
and depletion has continued without any new infill drilling to offset
that. How long will it take Iran to bring more than half a million bpd on
line? There is no way of knowing but it will take years… if ever.
As for Libya, there is no way of knowing when, if ever, they will get
their political problems fixed. It is likely that they will have problems
for many years. It is extremely unlikely that they will bring enough new
oil on line, within the next few years, to make any difference
whatsoever.
Iraqi Kurdistan produced about 636,000 barrels a day in November and
hopes to produce up to 1 million bpd by the end of 2016. That is doubtful
but even if they make it that will not be enough to offset the decline
from the rest of OPEC.
So, if we have 1.5mb/d oversupply and put more 2.5 mb/d in next 2
years, that is 4 mb/d that must be "clean" from market. If non-Opec drop
700kb/d in 2016, peak will not be this or next year. But around 2020. we
can see a lot smaller increase in production. But that is not 100%
certainly.
Okay, that 2.5 mb/d is just not going to happen. An extra half million
from Iran plus an extra 370,000 bpd from Kurdistan will still put the
number at less than one million bpd. And you completely ignore the
decline from the rest of OPEC and from Non-OPEC nations.
Why do so many people count only the increase in production from a
very few countries and completely ignore the decline from the rest of the
world?
From the Iraqi Kurdistan link I posted above:
Production growth in the northern Iraqi region is dependent on a
steady stream of payments flowing to the investors. Genel cut its 2015
output forecast in October citing payment delays, while DNO said Tuesday
its Kurdish volumes have fallen by 50,000 barrels a day since the spring.
Gulf Keystone says it won't invest to boost Kurdish output until arrears
are paid.
"We could have been at 1 million barrels a day by now had it not
been for the ISIS disruption for 2014, which slowed down all the
activities," Hawrami said at the conference. "We are one year behind, but
it will happen through 2016."
And that depends on a whole lot of things that are really not likely
to happen.
In my comments I explicitly considered the rest of the World
that is declining at about 500 kb/d each year since Jan 2009. The big
8 have been increasing at about 1.5 Mb/d each year from Jan 2009 to
June 2009 based on EIA data. In each case I looked at C+C data only.
In your post you talk about OPEC decline so I looked at the "Big 3"
(Saudi Arabia, Iran , and Iraq) that I think will be able to increase
output in the future compared to the "rest of OPEC".
From Jan 2009 to June 2015 I have plotted each of these two groups
(kb/d) using EIA data. The rest of OPEC has been relatively flat with
the big 3 rising over that period.
If the Big 8 (add US, Canada, Russia, China, and Brazil to the OPEC
3) can increase output by more than the decline in the rest of the
World, then the 2015 peak will be surpassed. If we assume the Rest of
the world declines linearly rather than exponentially (which is
slower) at the same rate as 2009 to 2015 (500 kb/d annual decline),
then the big 8 only need to increase output enough to offset the
decline from the rest of the World.
Lets assume the big 8 simply maintain 2015 output in 2016 and the
rest of the World declines by 500 kb/d, let us also assume that the
rest of the World continues to decline at the 500 kb/d annual rate
until 2019, so this would mean output falls by 2000 kb/d in total over
4 years. Let us also assume the big 8 increase output by half the
2009-2015 annual rate of increase of 1500 kb/d (so 750 kb/d) from 2017
to 2019. That is a total increase of 2250 kb/d over three years and a
new peak would be reached in 2019, 250 kb/d above the 2015 peak.
Lets assume the big 8 simply maintain 2015 output in 2016…
Good grief Dennis, we cannot possibly assume such a ridiculous
assumption. That will not happen. Let me repeat, that will not
happen. The big 8 will show a serious decline in 2016. End of
story.
The Last but not LeastTechnology is dominated by
two types of people: those who understand what they do not manage and those who manage what they do not understand ~Archibald Putt.
Ph.D
FAIR USE NOTICEThis site contains
copyrighted material the use of which has not always been specifically
authorized by the copyright owner. We are making such material available
to advance understanding of computer science, IT technology, economic, scientific, and social
issues. We believe this constitutes a 'fair use' of any such
copyrighted material as provided by section 107 of the US Copyright Law according to which
such material can be distributed without profit exclusively for research and educational purposes.
This is a Spartan WHYFF (We Help You For Free)
site written by people for whom English is not a native language. Grammar and spelling errors should
be expected. The site contain some broken links as it develops like a living tree...
You can use PayPal to to buy a cup of coffee for authors
of this site
Disclaimer:
The statements, views and opinions presented on this web page are those of the author (or
referenced source) and are
not endorsed by, nor do they necessarily reflect, the opinions of the Softpanorama society.We do not warrant the correctness
of the information provided or its fitness for any purpose. The site uses AdSense so you need to be aware of Google privacy policy. You you do not want to be
tracked by Google please disable Javascript for this site. This site is perfectly usable without
Javascript.
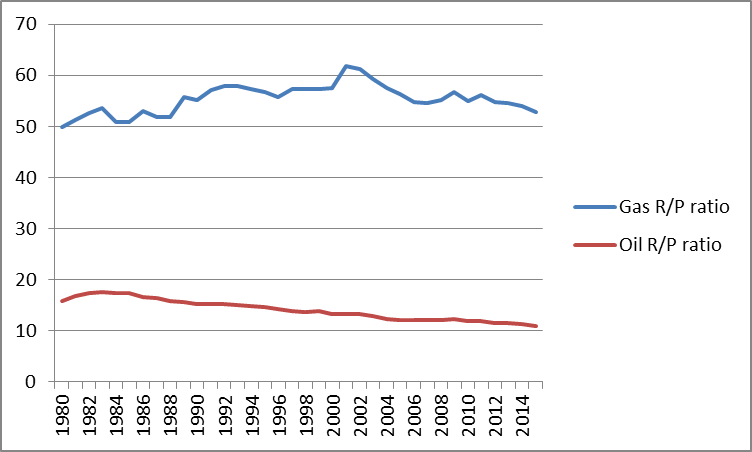

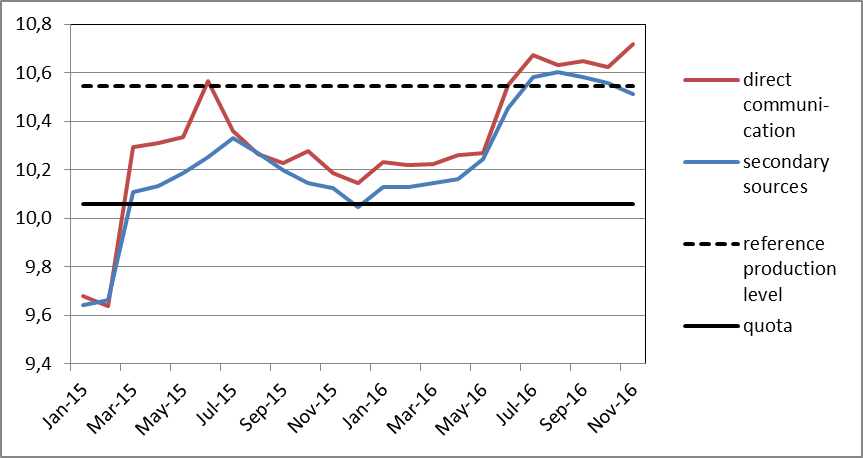
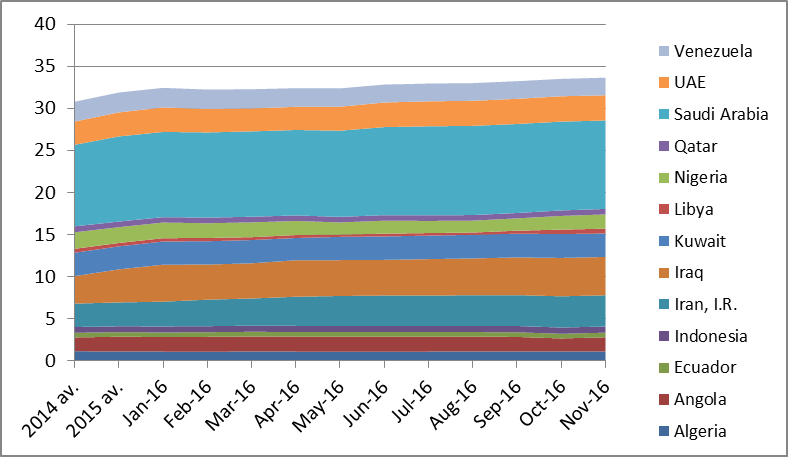


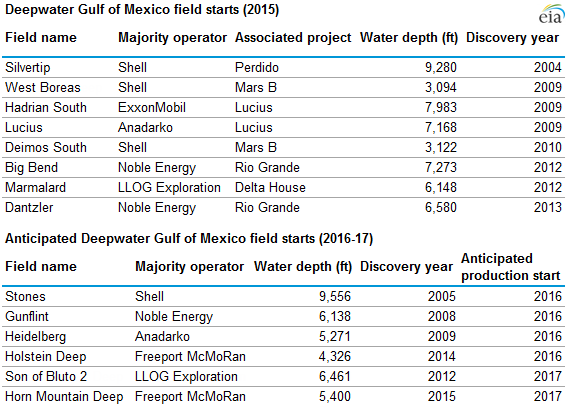
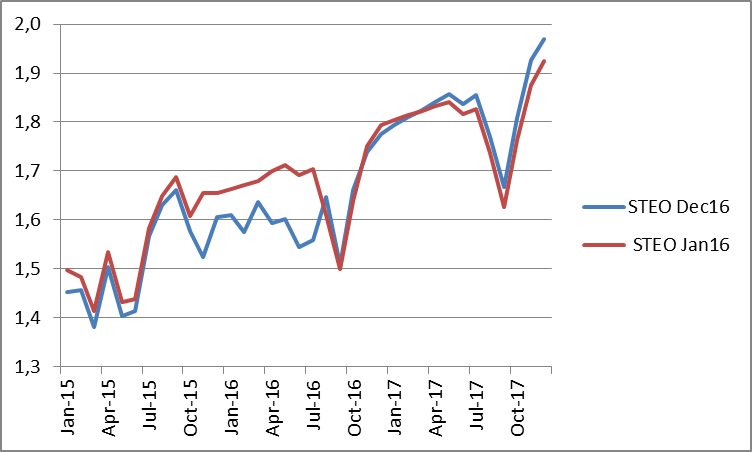

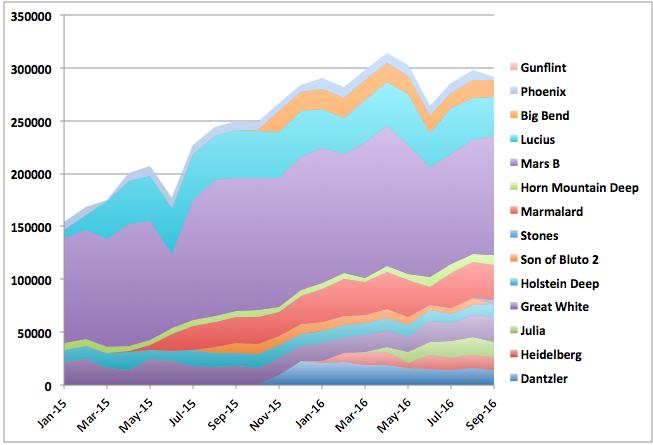

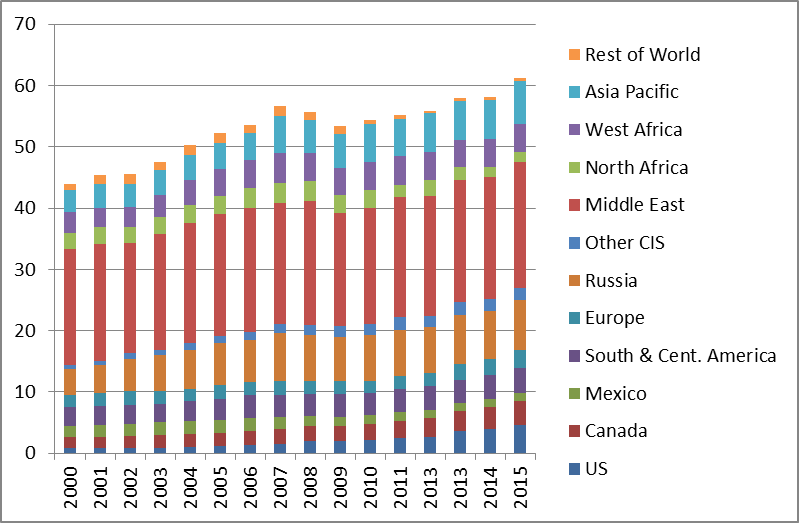
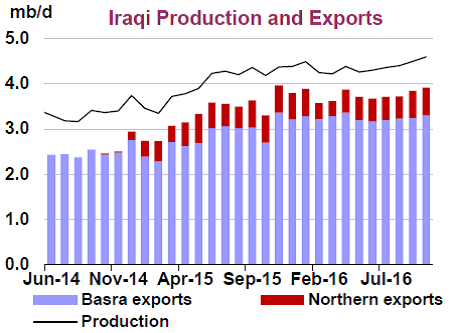


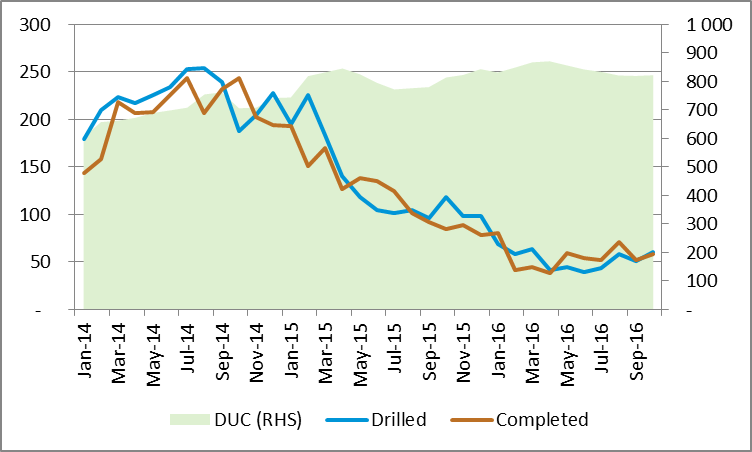
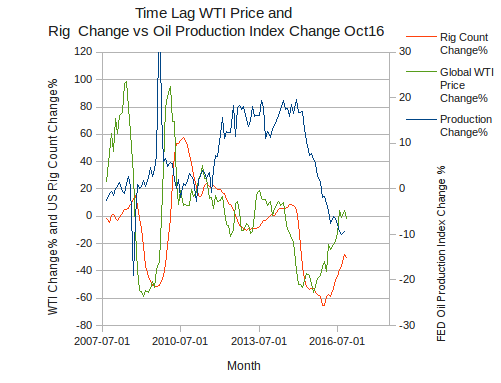
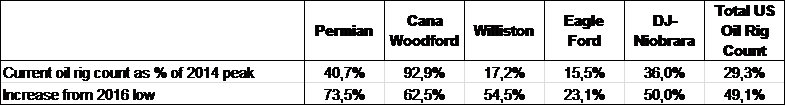
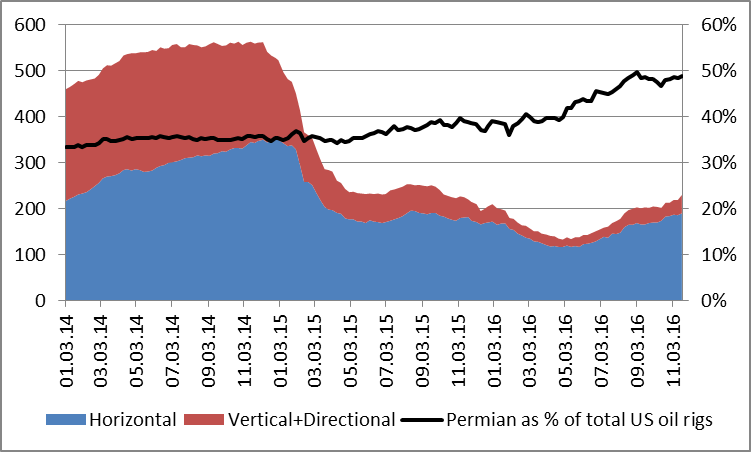

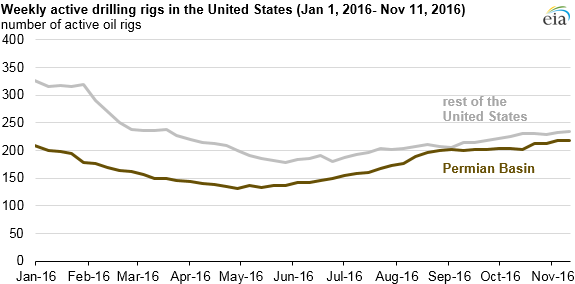
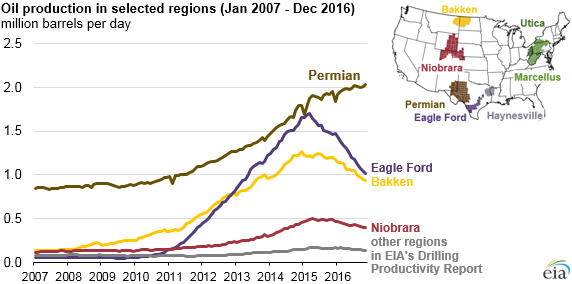
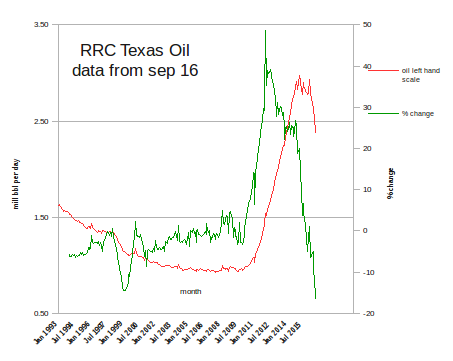
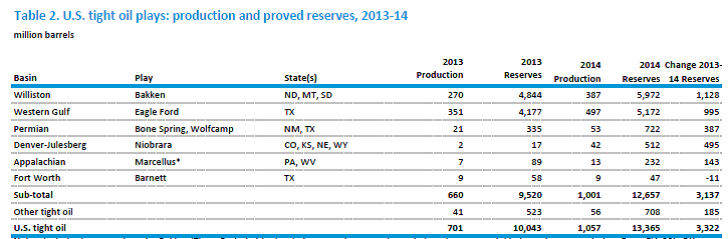


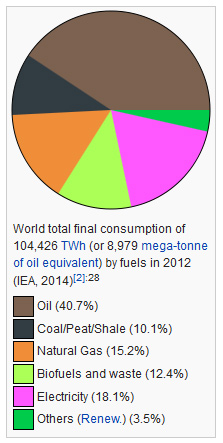


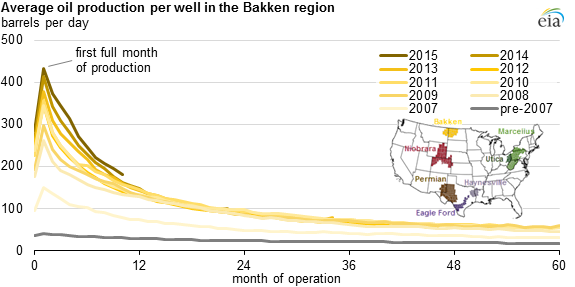


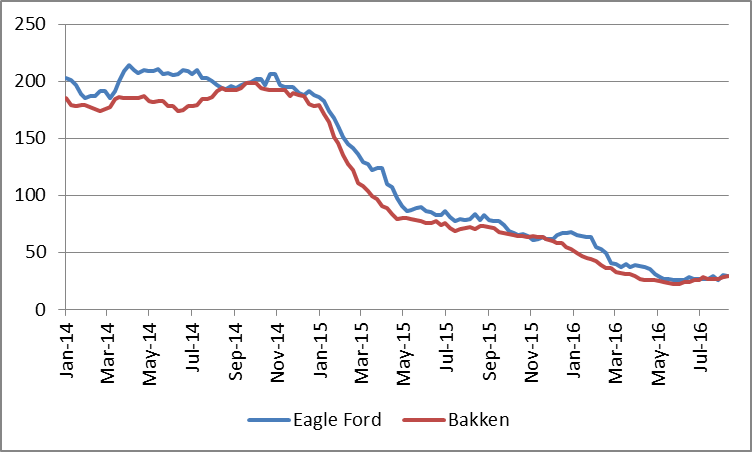
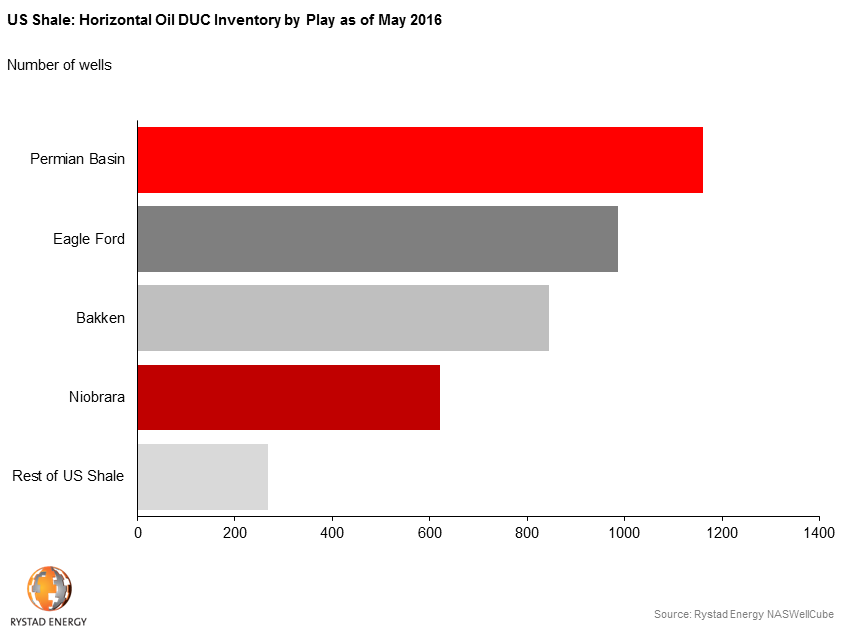
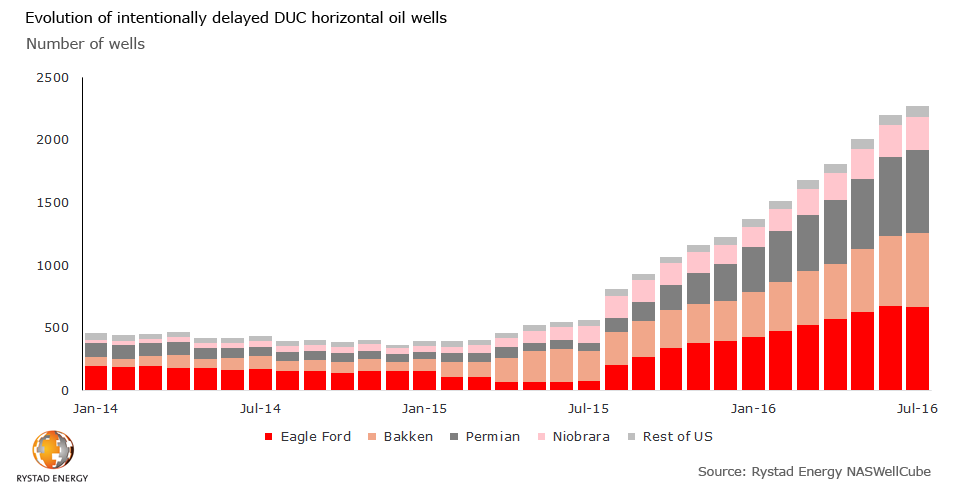

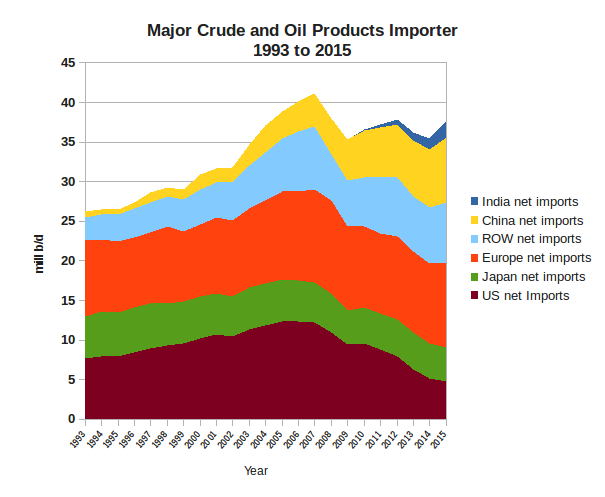

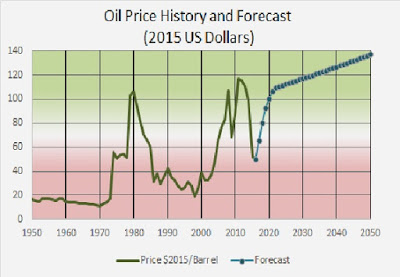
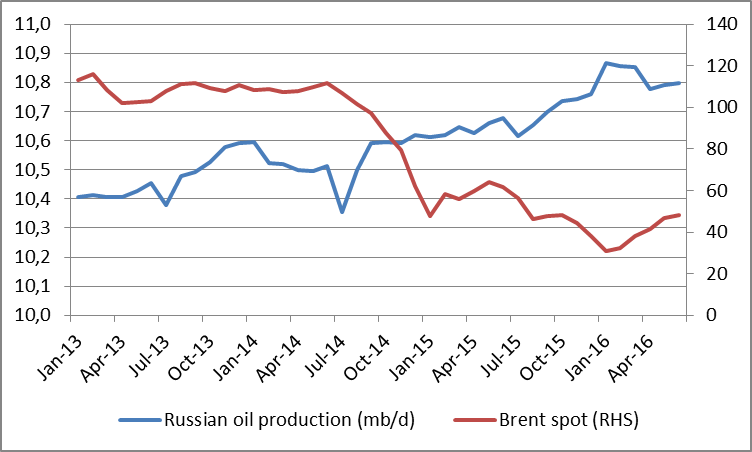


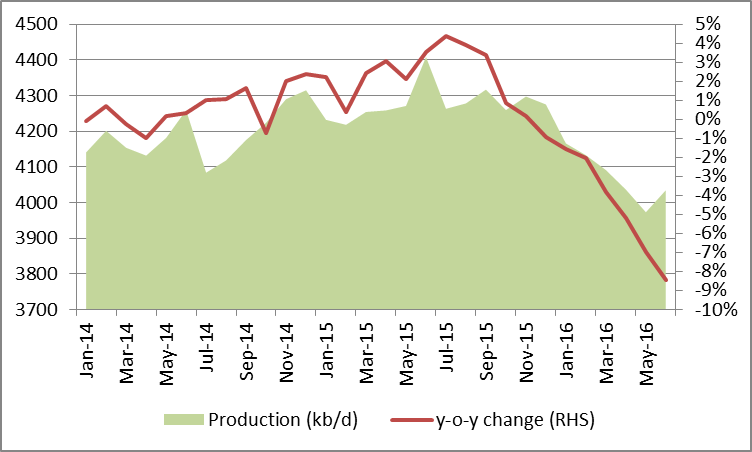
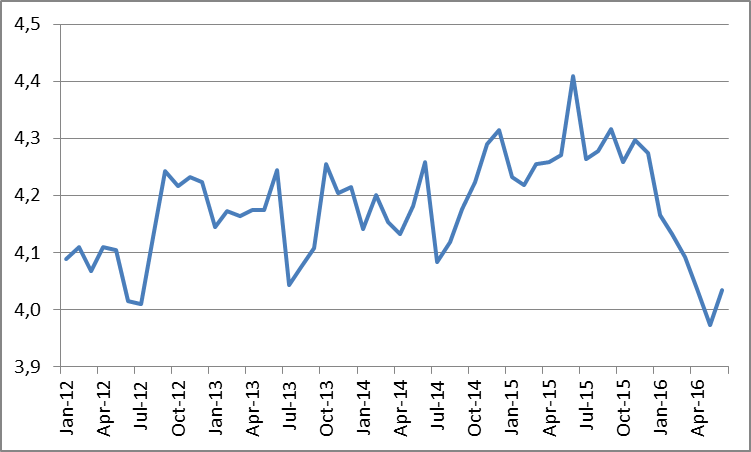


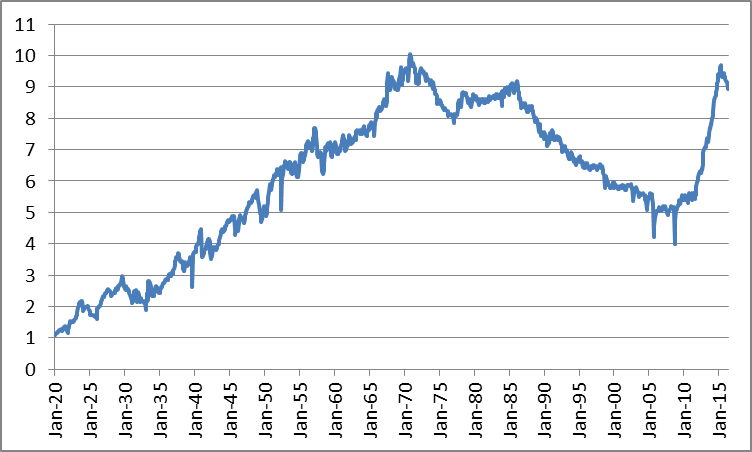
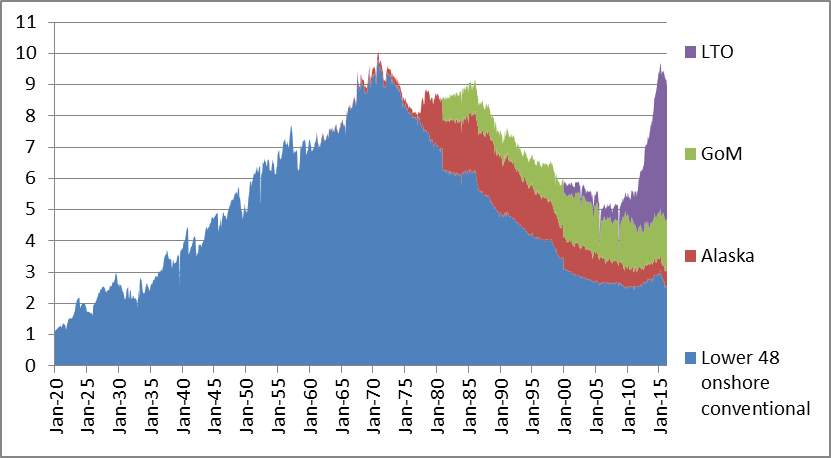


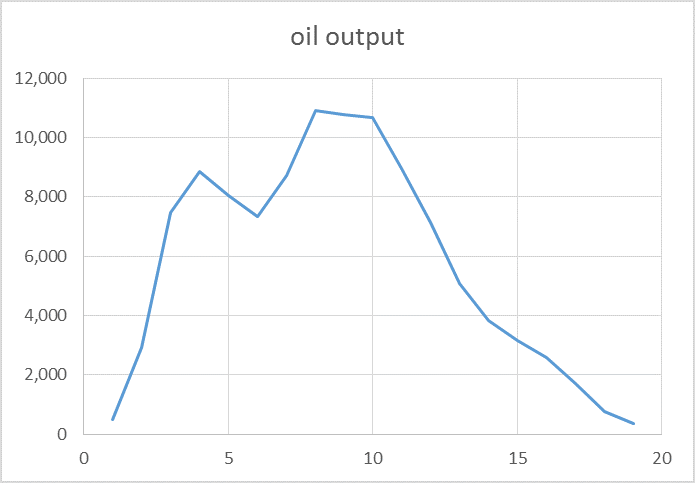
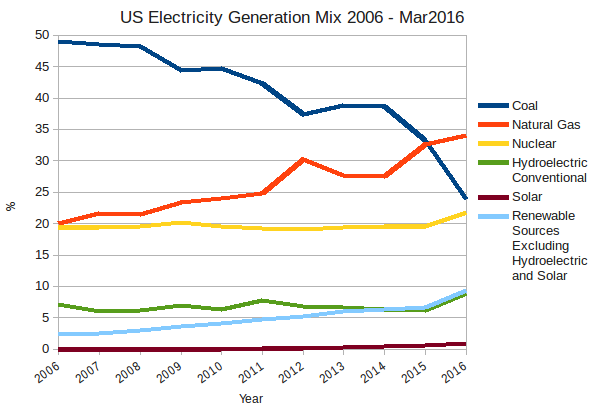


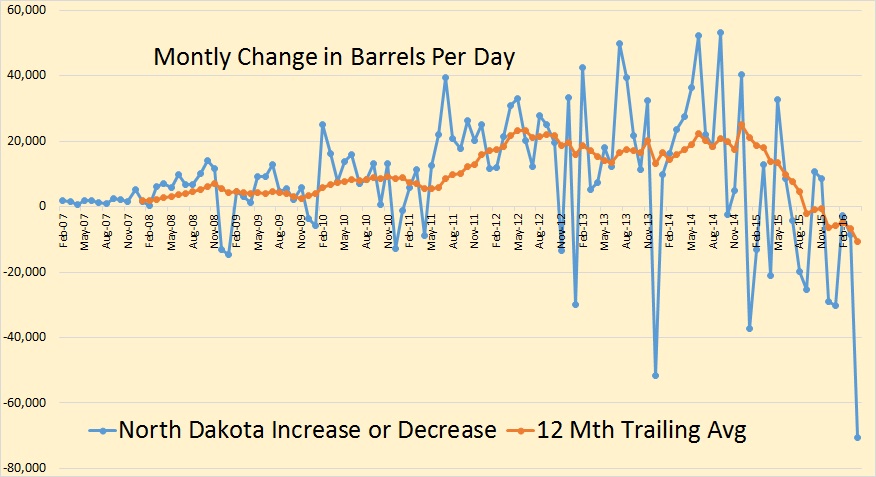


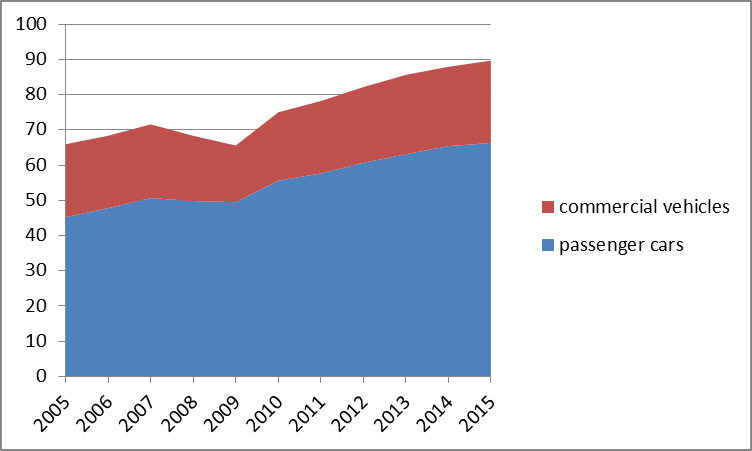
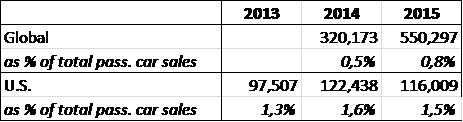
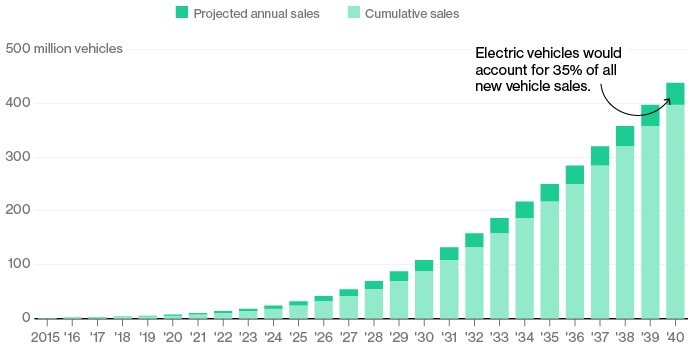
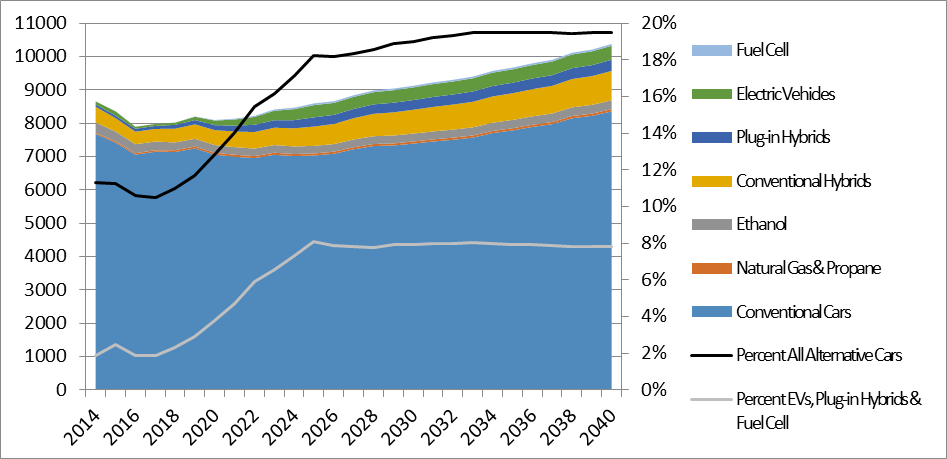
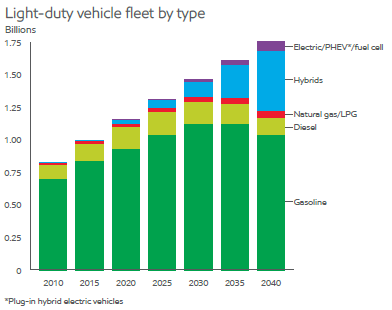
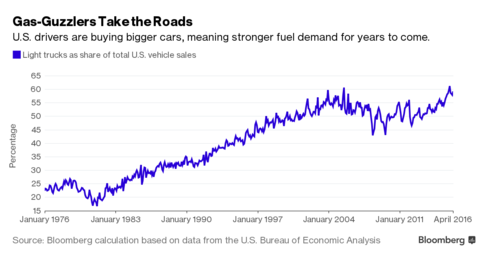


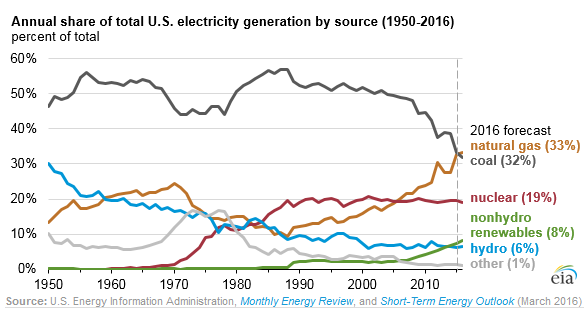


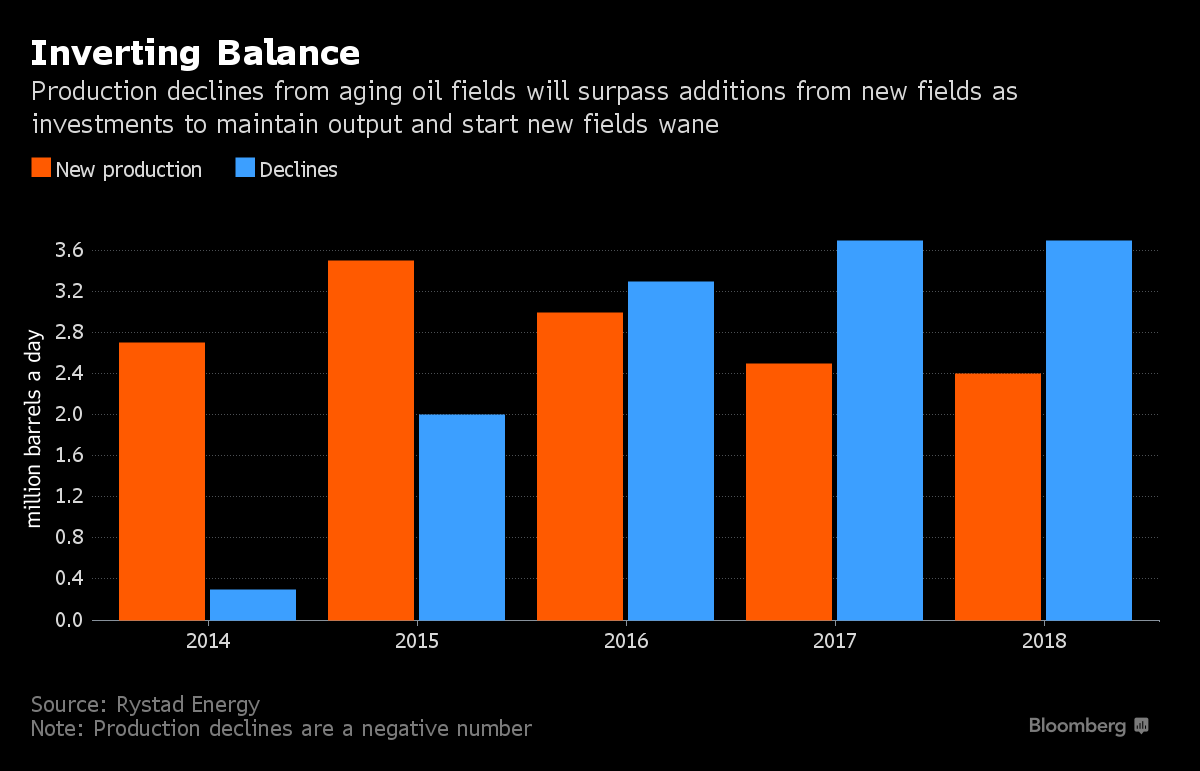


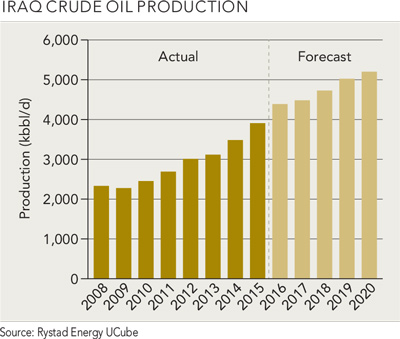
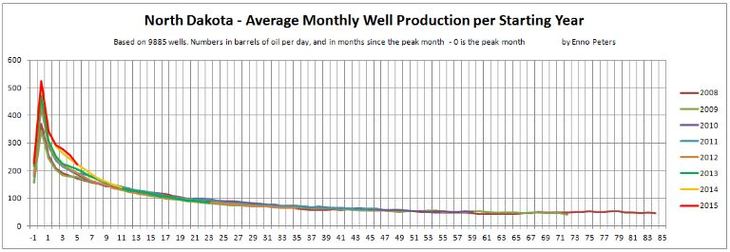


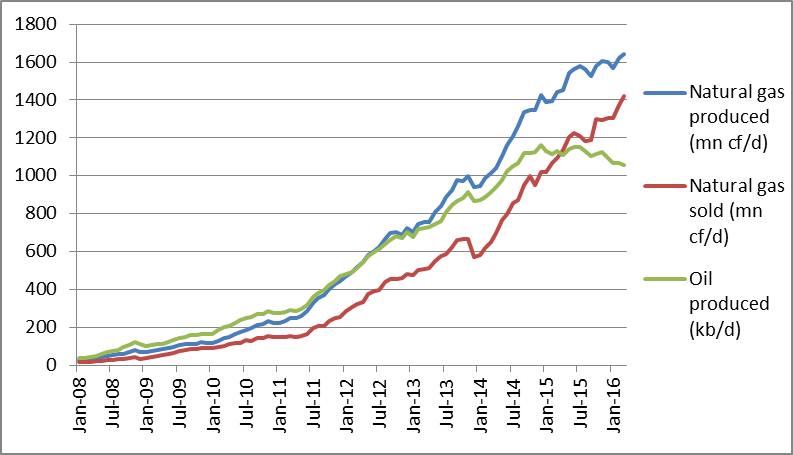
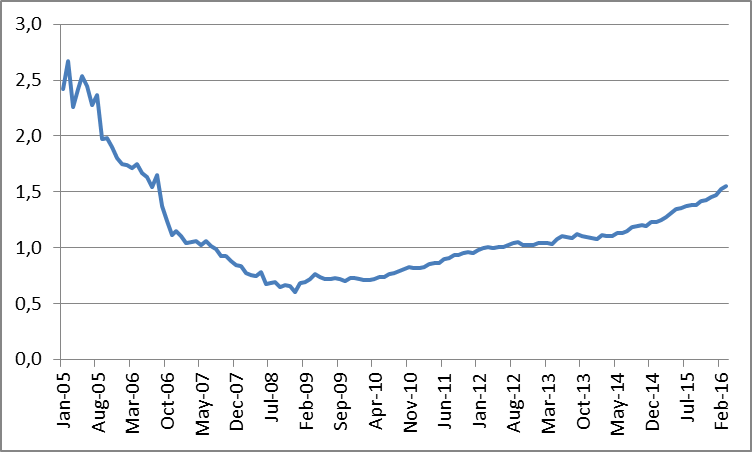


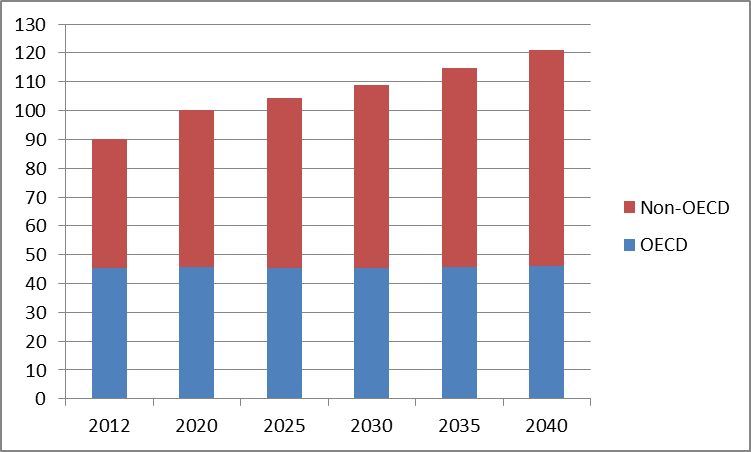

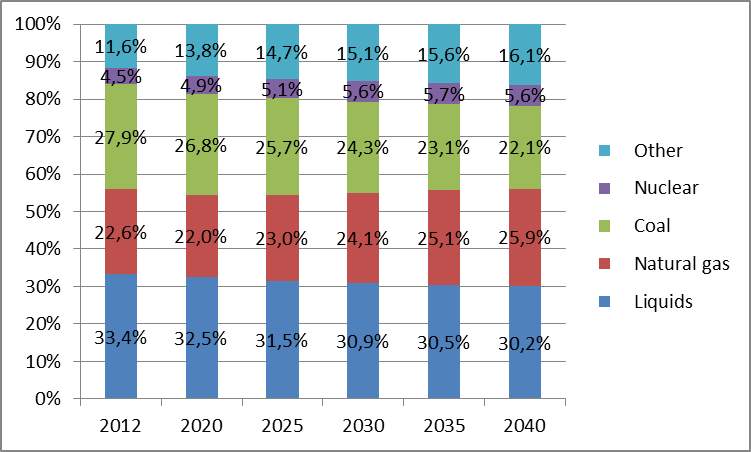
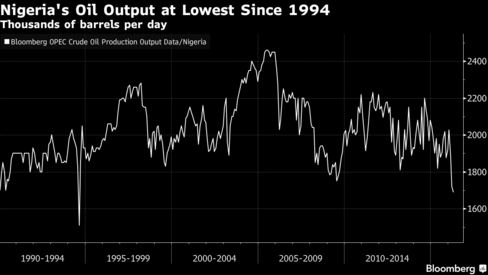
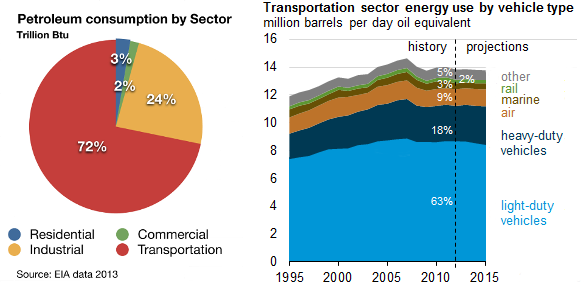


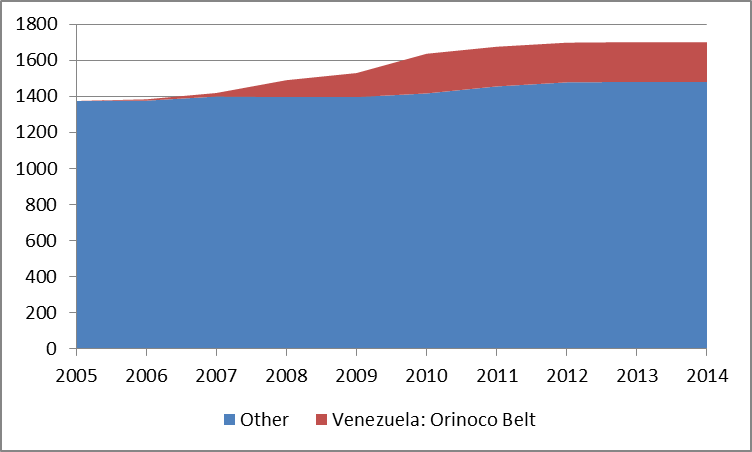


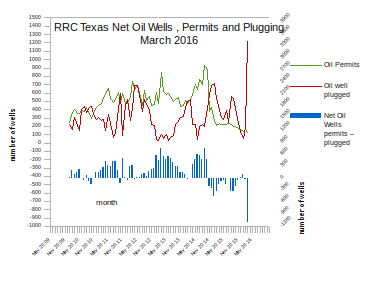
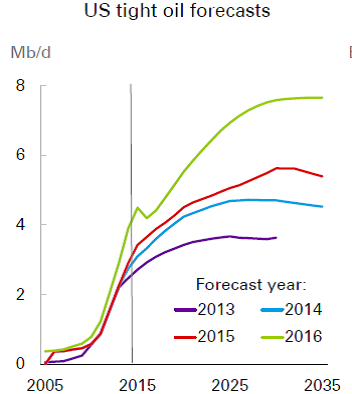

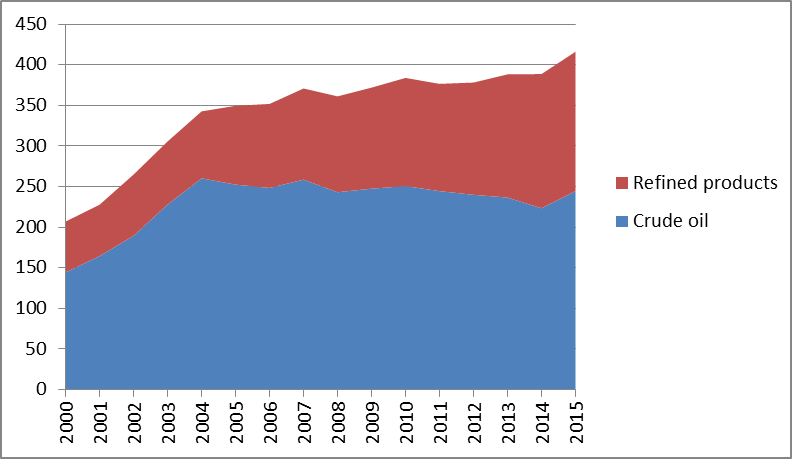
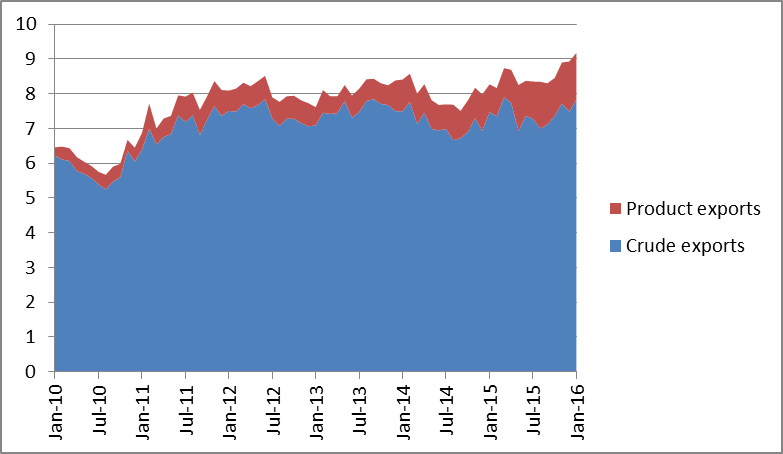
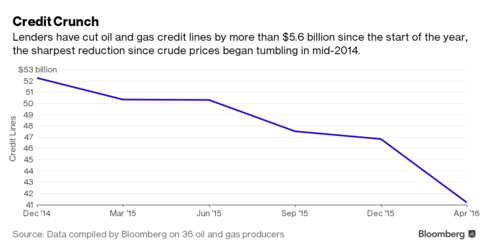


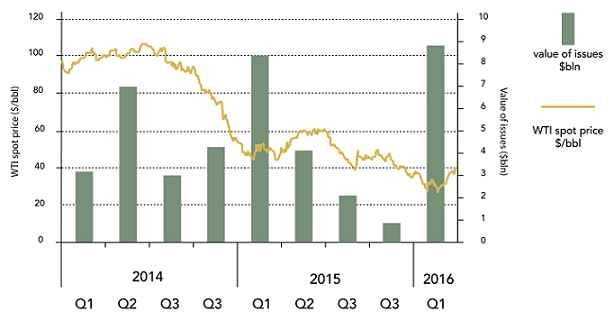

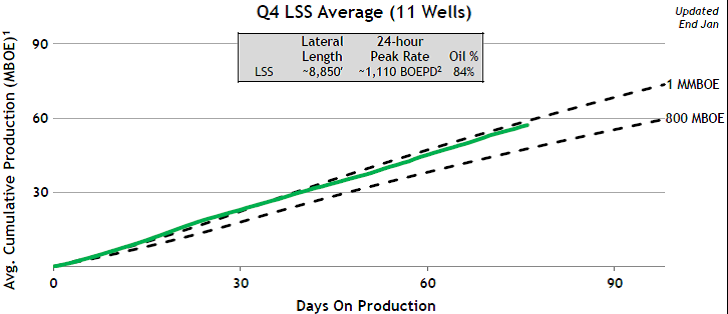

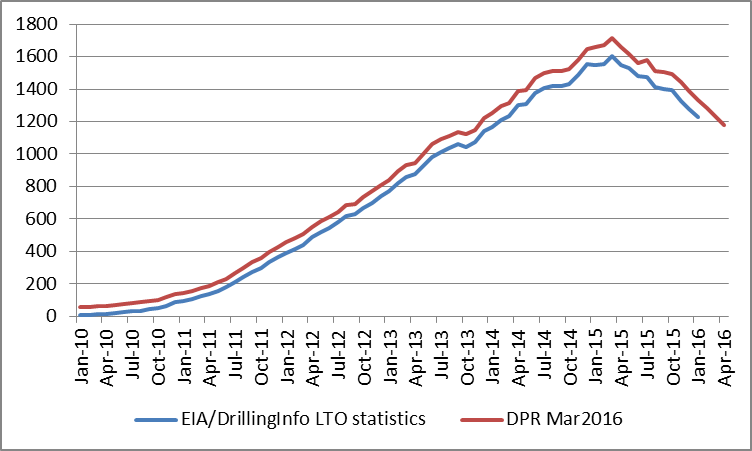

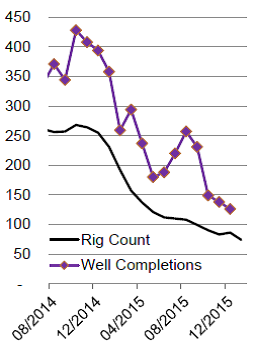

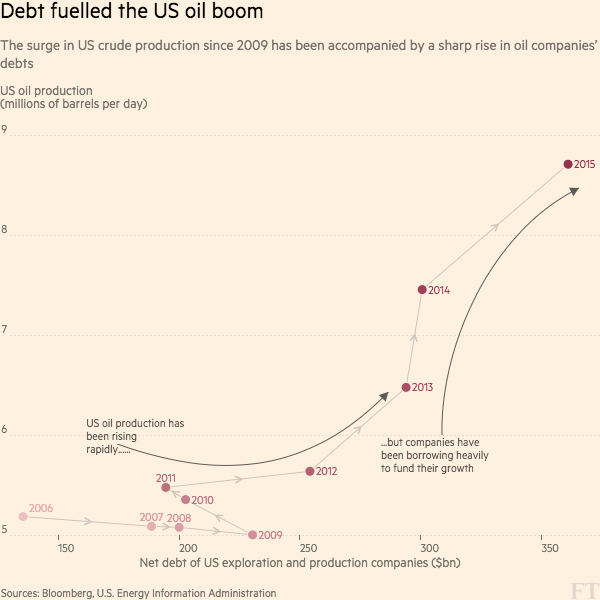

 Sara
Vakhshouri is founder and president of SVB Energy International, a strategic
energy consulting firm based in Washington, DC. She advises international
corporations, think tanks, investment banks, and law firms on global energy
markets, geopolitics of energy, and investment patterns. During 2000-08,
she worked in the public and private sectors of the Iranian energy industry.
From 2004 to 2005, she worked as an advisor to National Iranian Oil Co.
International, a division responsible for marketing and sale of Iranian
crude oil and products. Vakhshouri holds a PhD in energy security and Middle
Eastern studies and was a visiting fellow at Oxford Institute for Energy
Studies. She has MA degrees in business management (international marketing)
and international relations.
Sara
Vakhshouri is founder and president of SVB Energy International, a strategic
energy consulting firm based in Washington, DC. She advises international
corporations, think tanks, investment banks, and law firms on global energy
markets, geopolitics of energy, and investment patterns. During 2000-08,
she worked in the public and private sectors of the Iranian energy industry.
From 2004 to 2005, she worked as an advisor to National Iranian Oil Co.
International, a division responsible for marketing and sale of Iranian
crude oil and products. Vakhshouri holds a PhD in energy security and Middle
Eastern studies and was a visiting fellow at Oxford Institute for Energy
Studies. She has MA degrees in business management (international marketing)
and international relations. 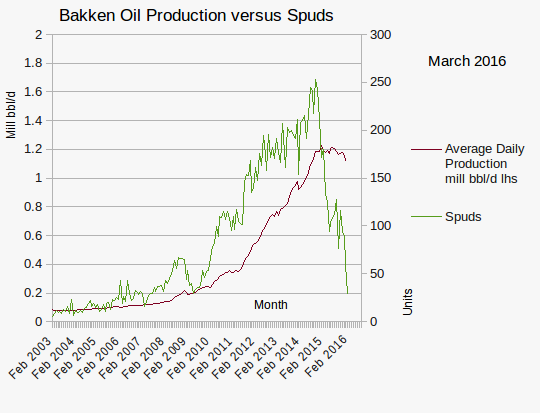

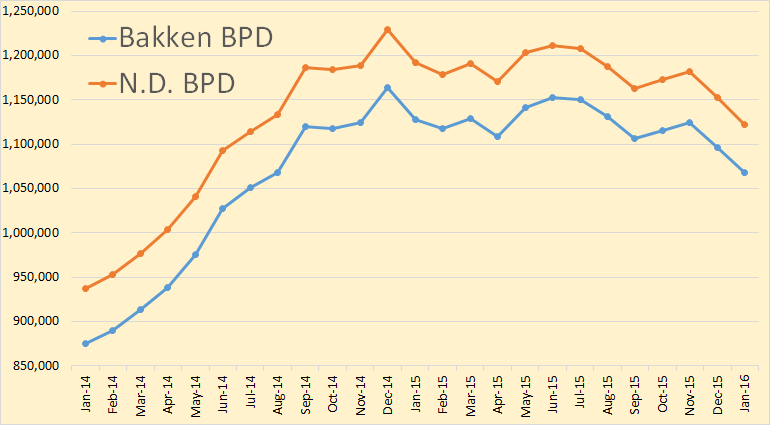


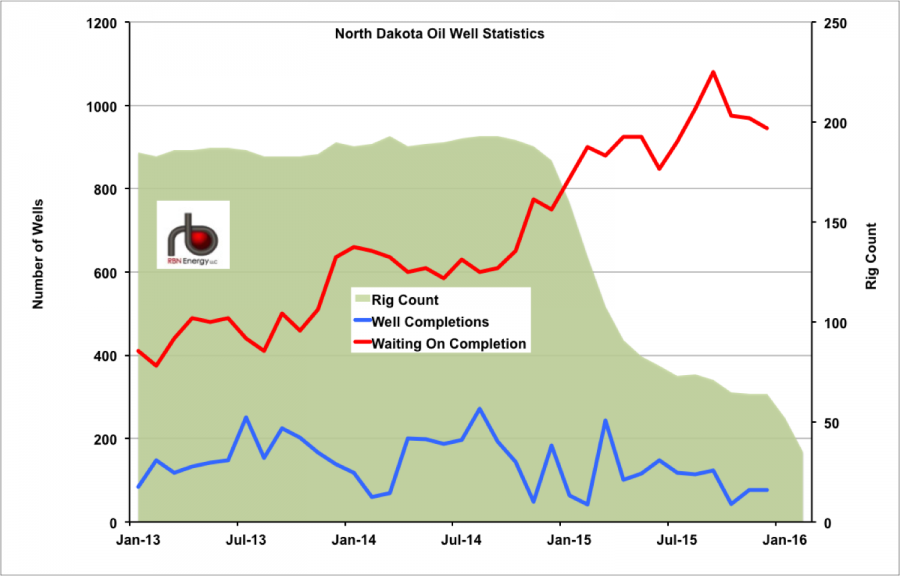
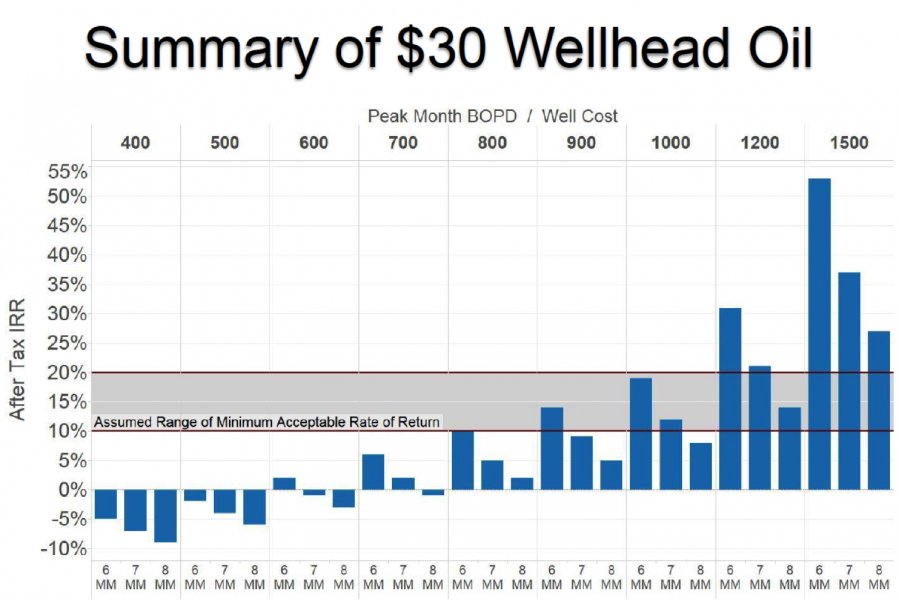
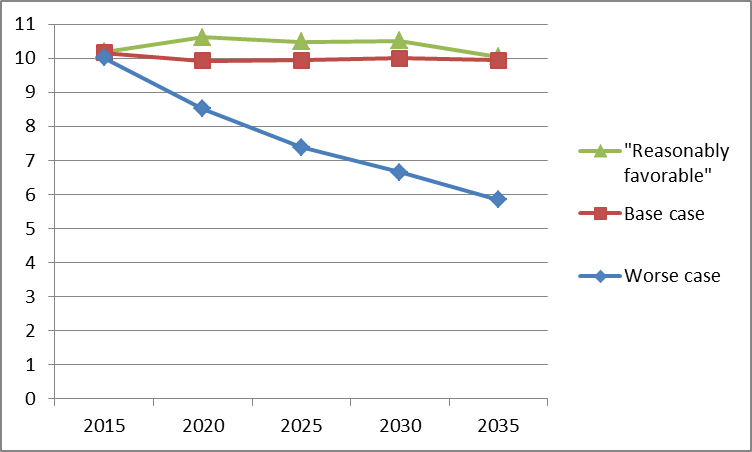
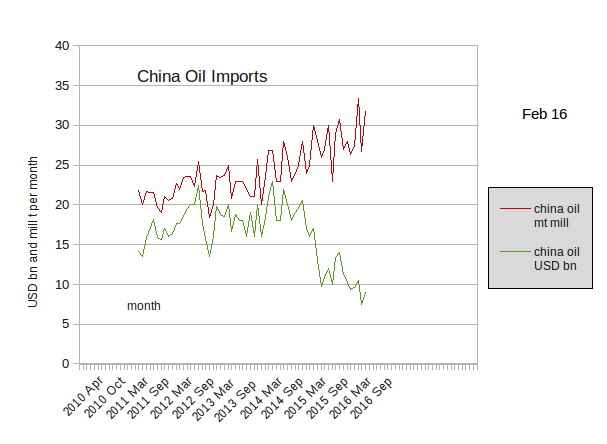
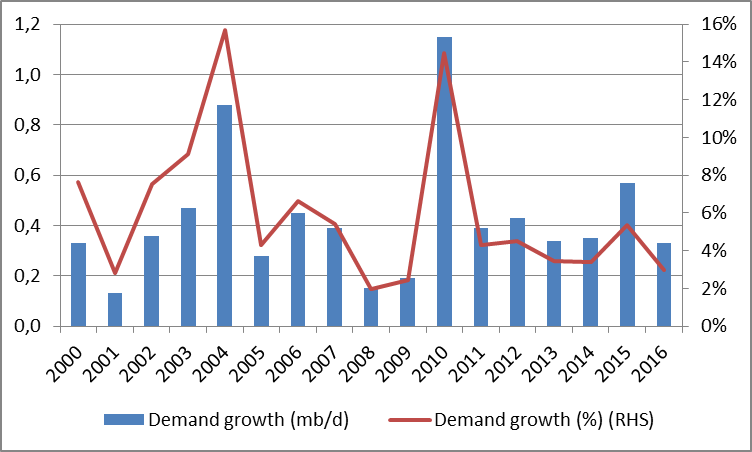
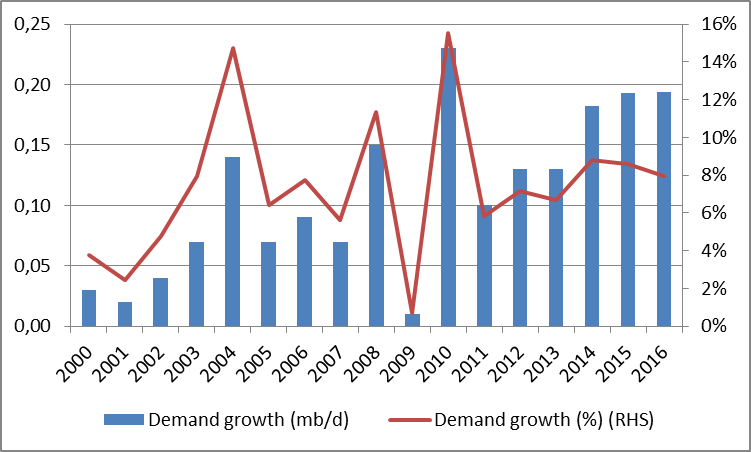
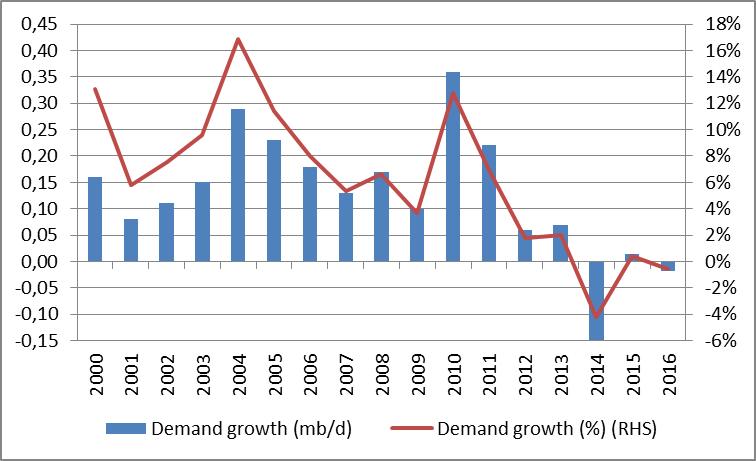

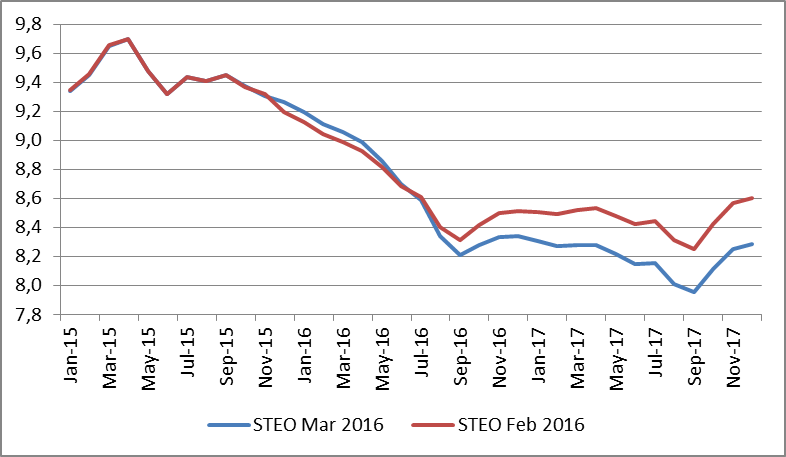
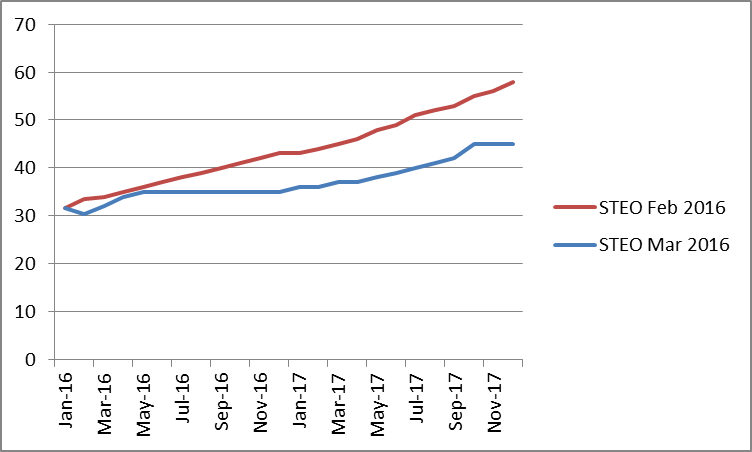
 15 ·
11 hrs
15 ·
11 hrs


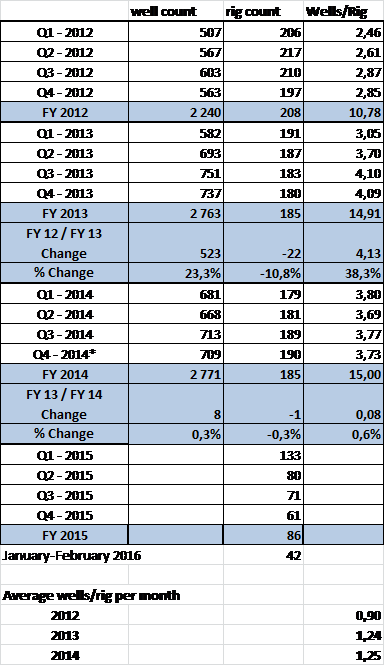
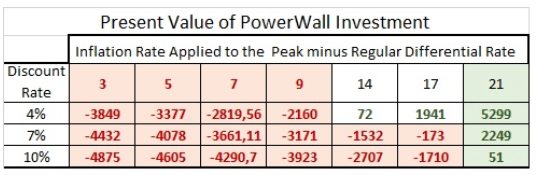
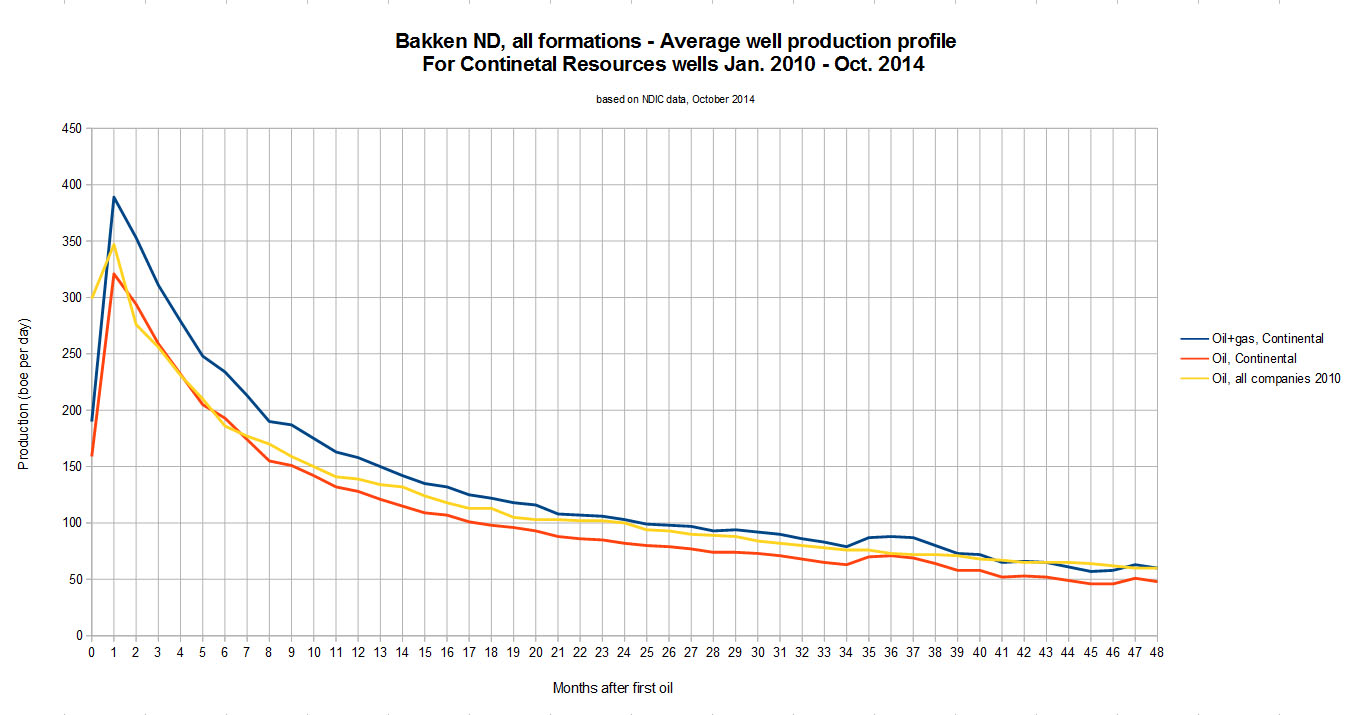

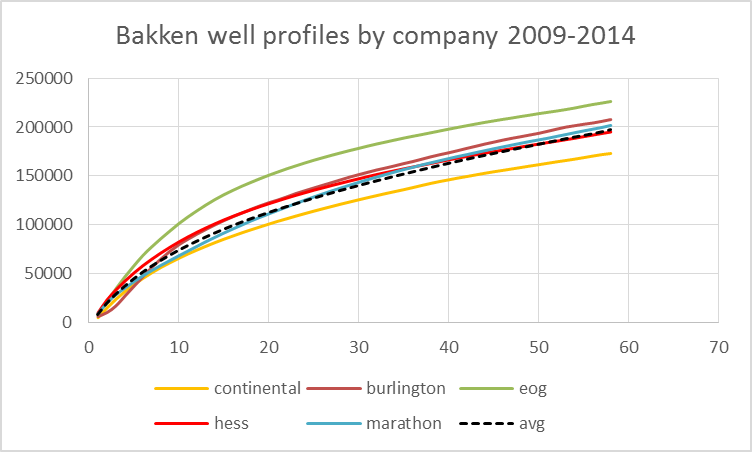
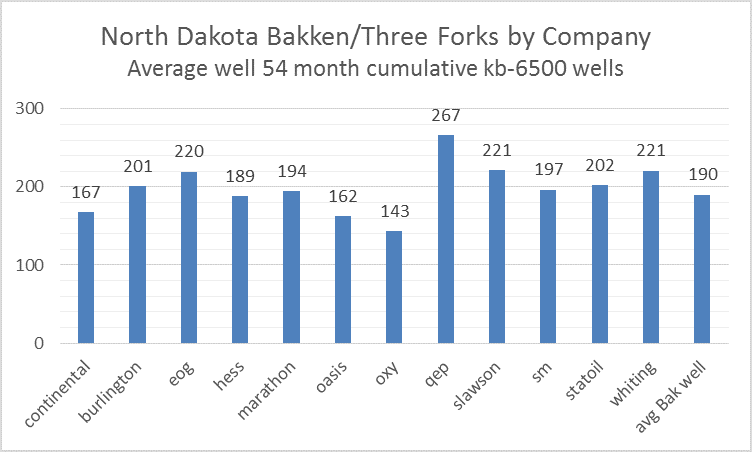
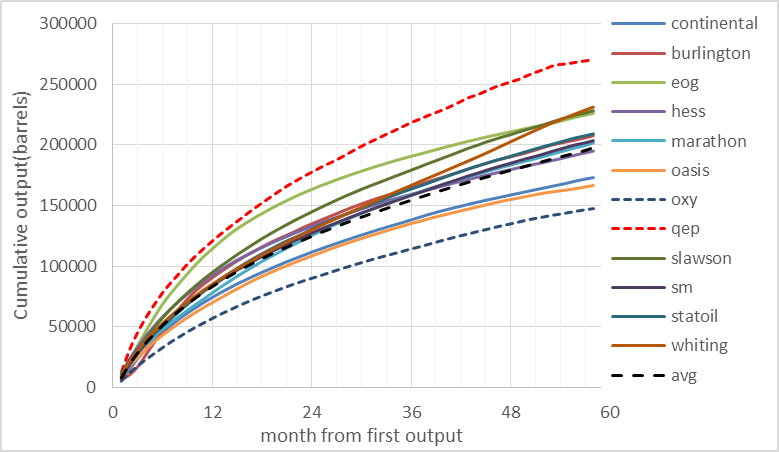
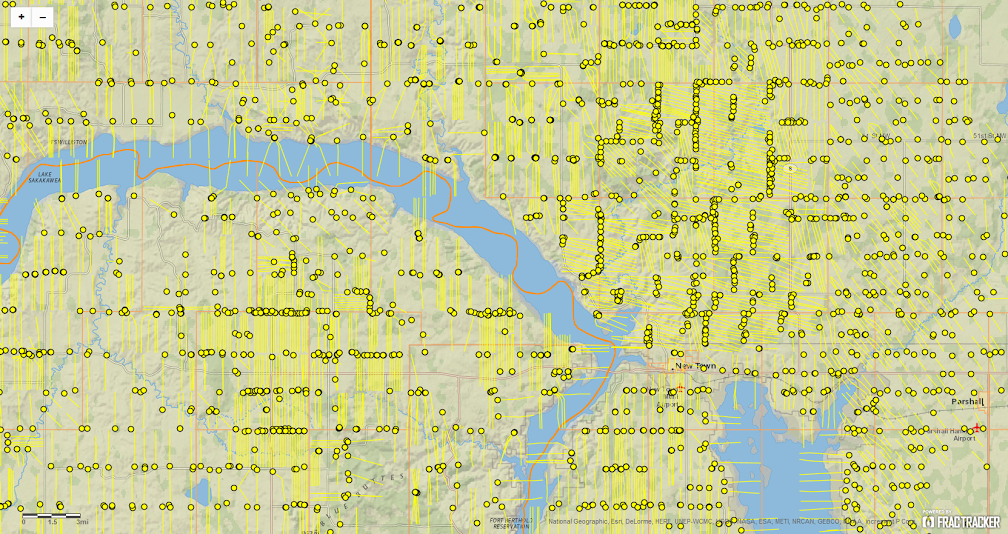
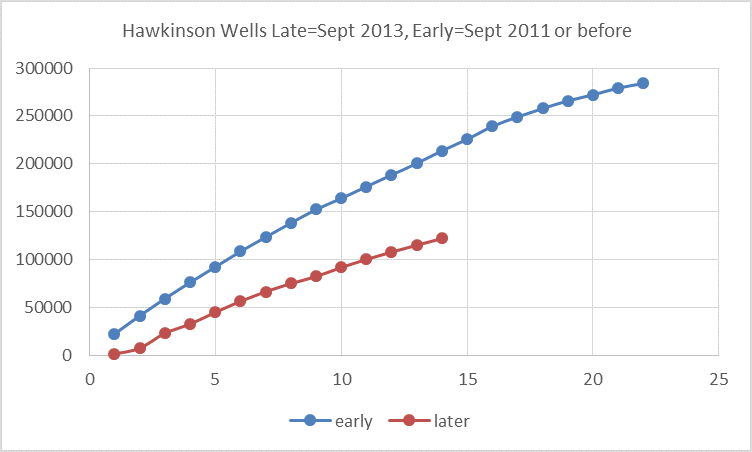

 ) –
perhaps there are lessons to be learned?
) –
perhaps there are lessons to be learned?
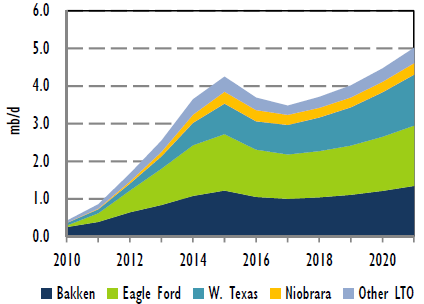
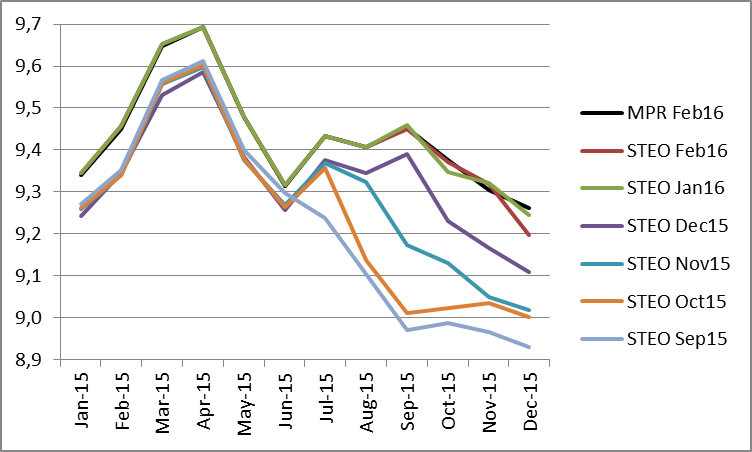
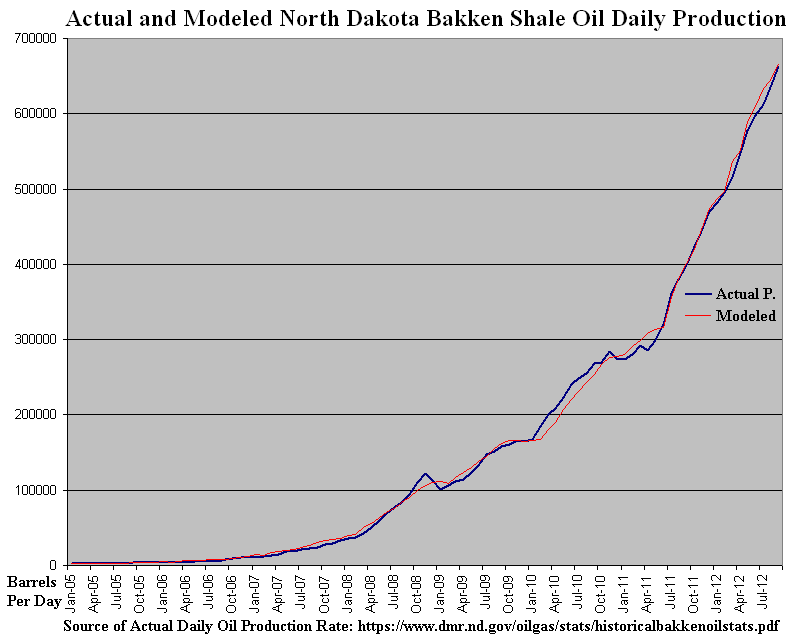


 shallow sand ,


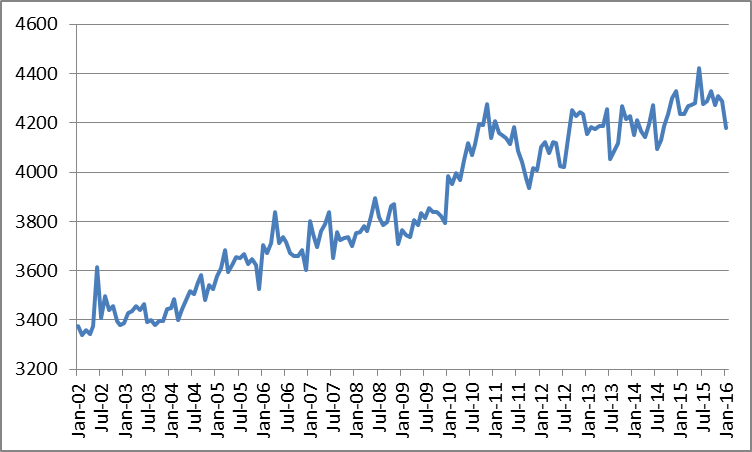
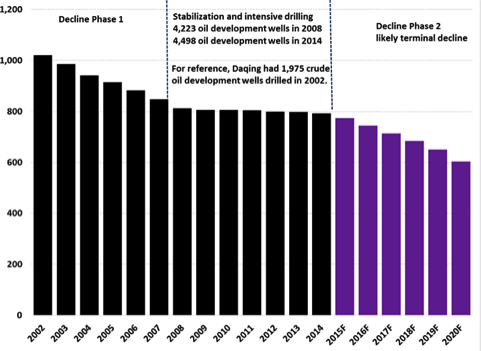

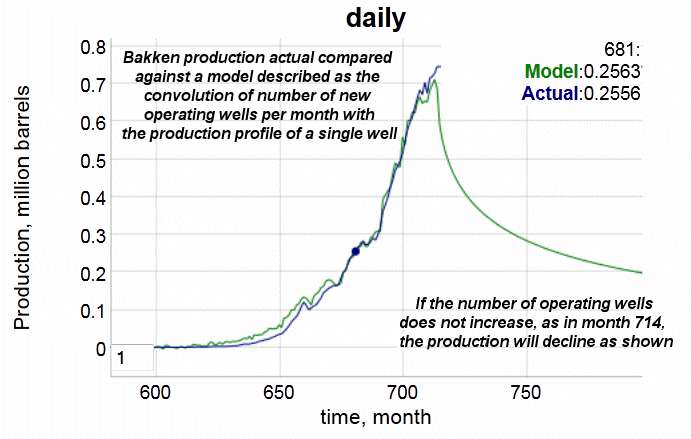
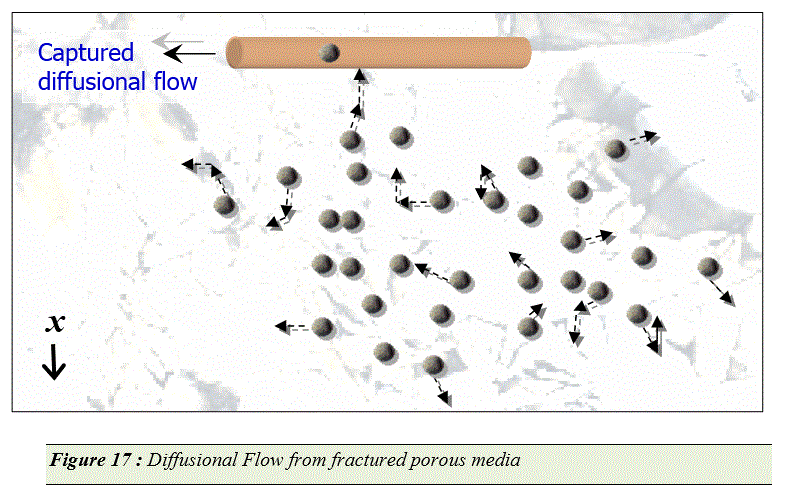
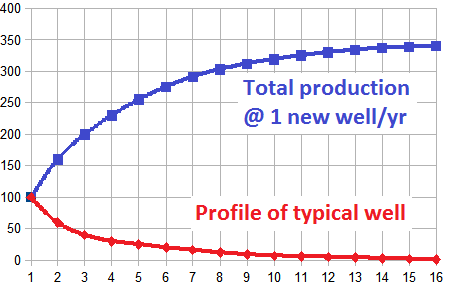


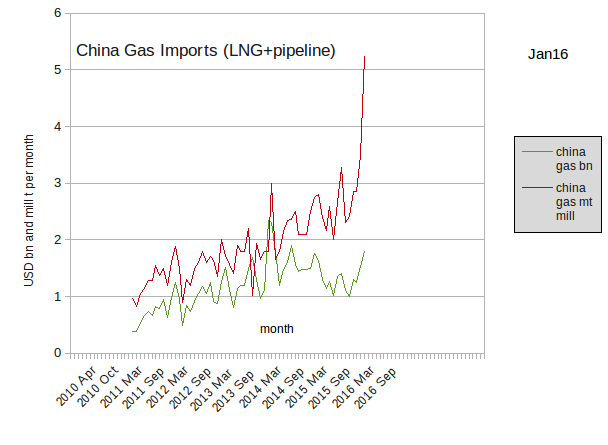


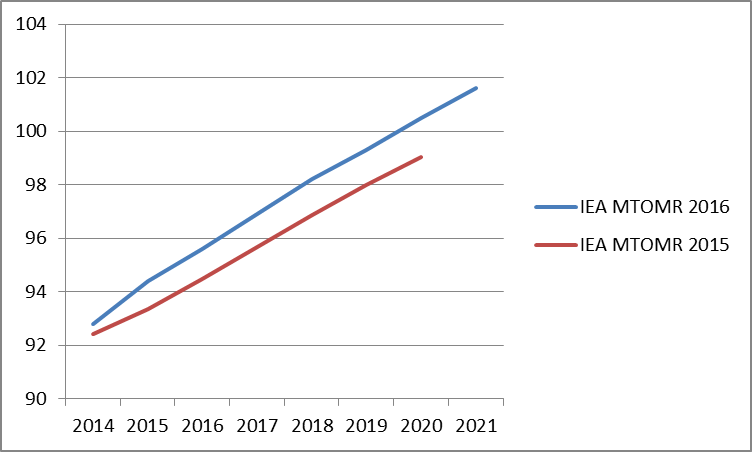
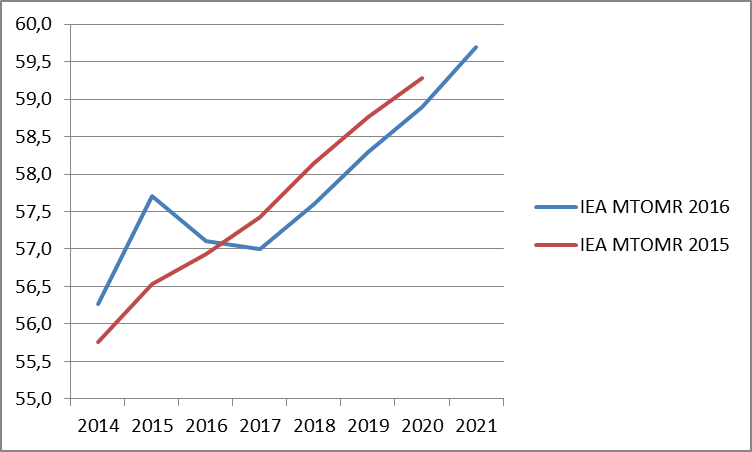
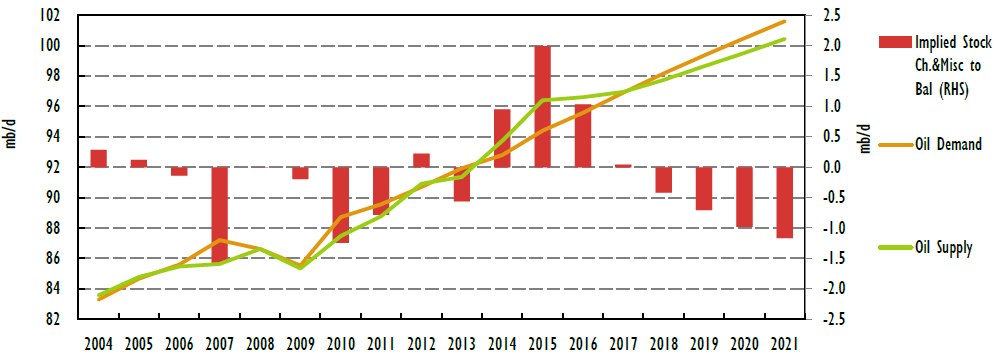
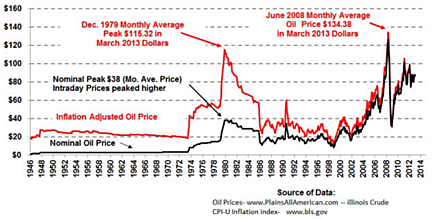
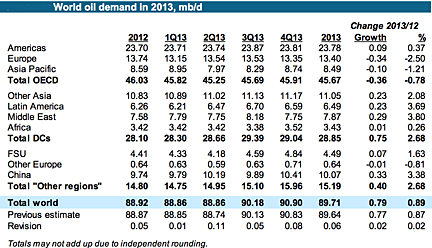
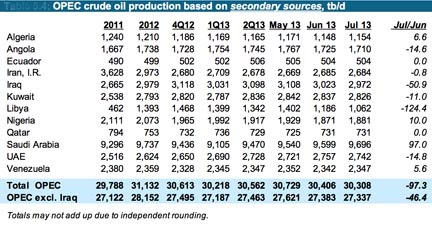
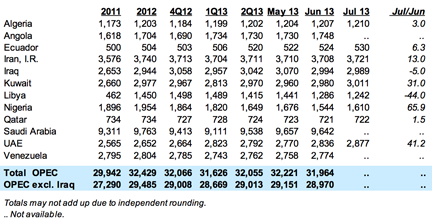

![[-]](http://www.theoildrum.com/images/thread_collapse.gif)


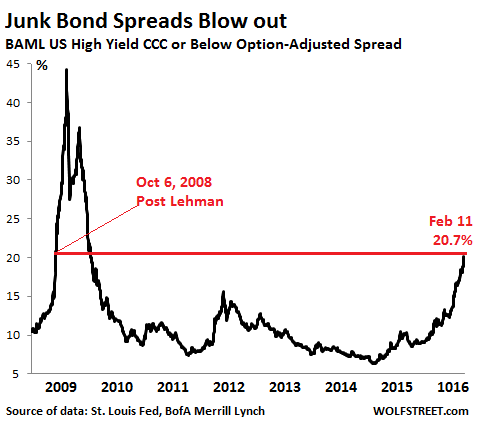
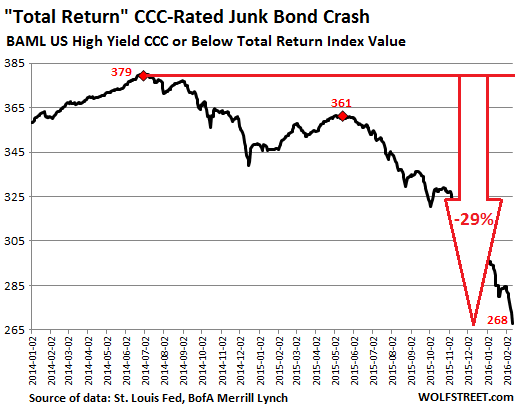
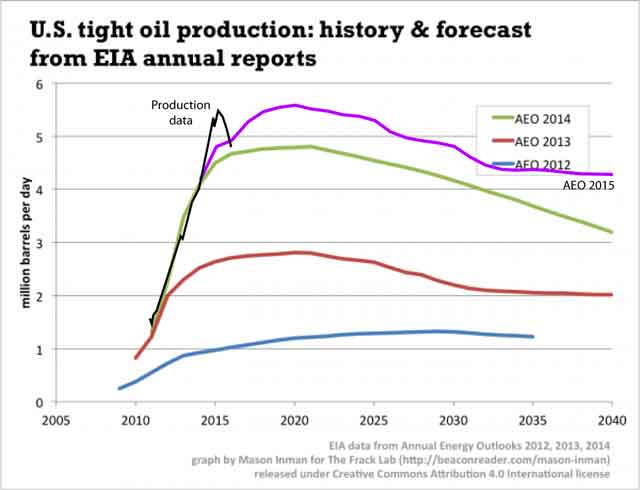
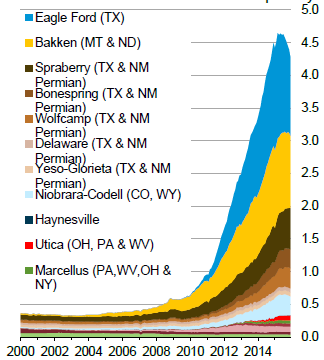
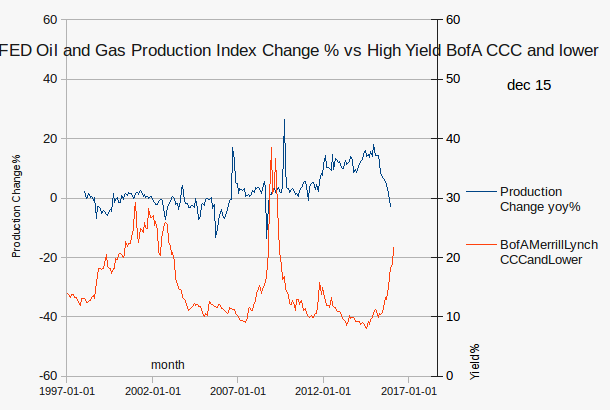

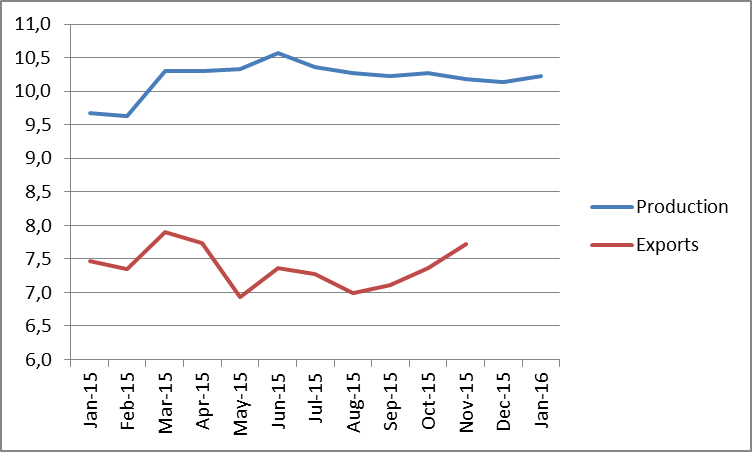
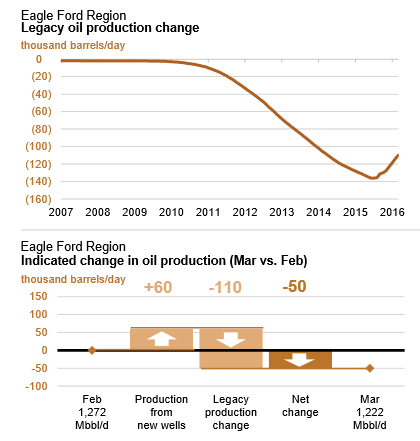

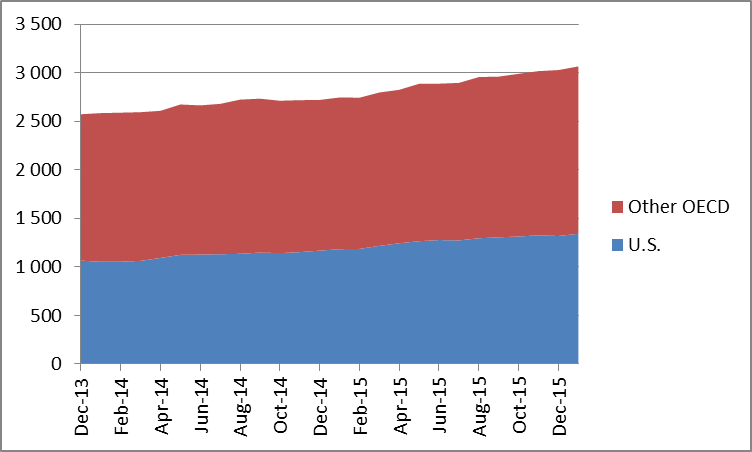


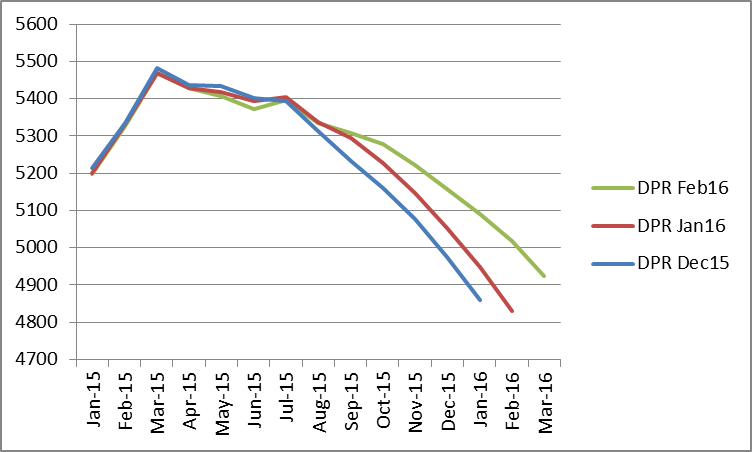
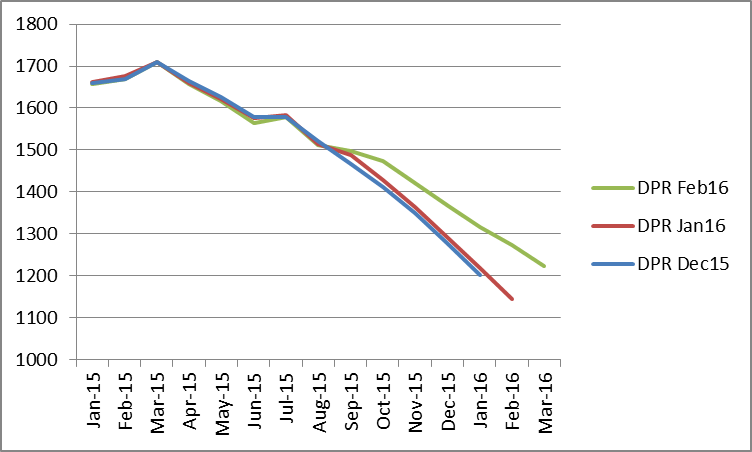
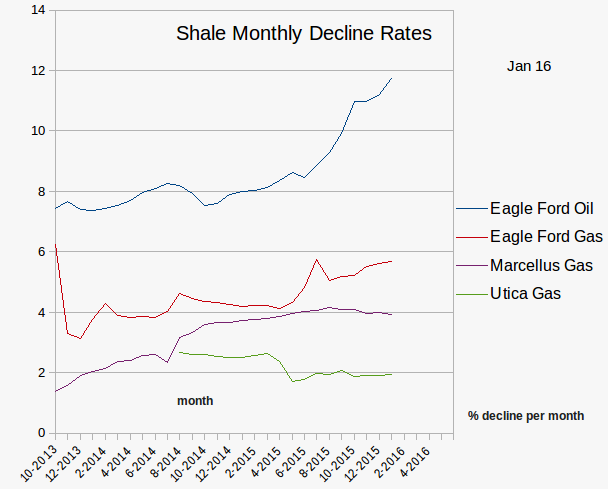


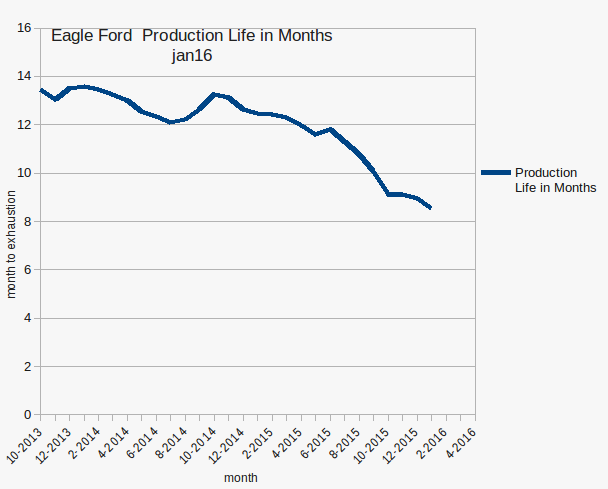


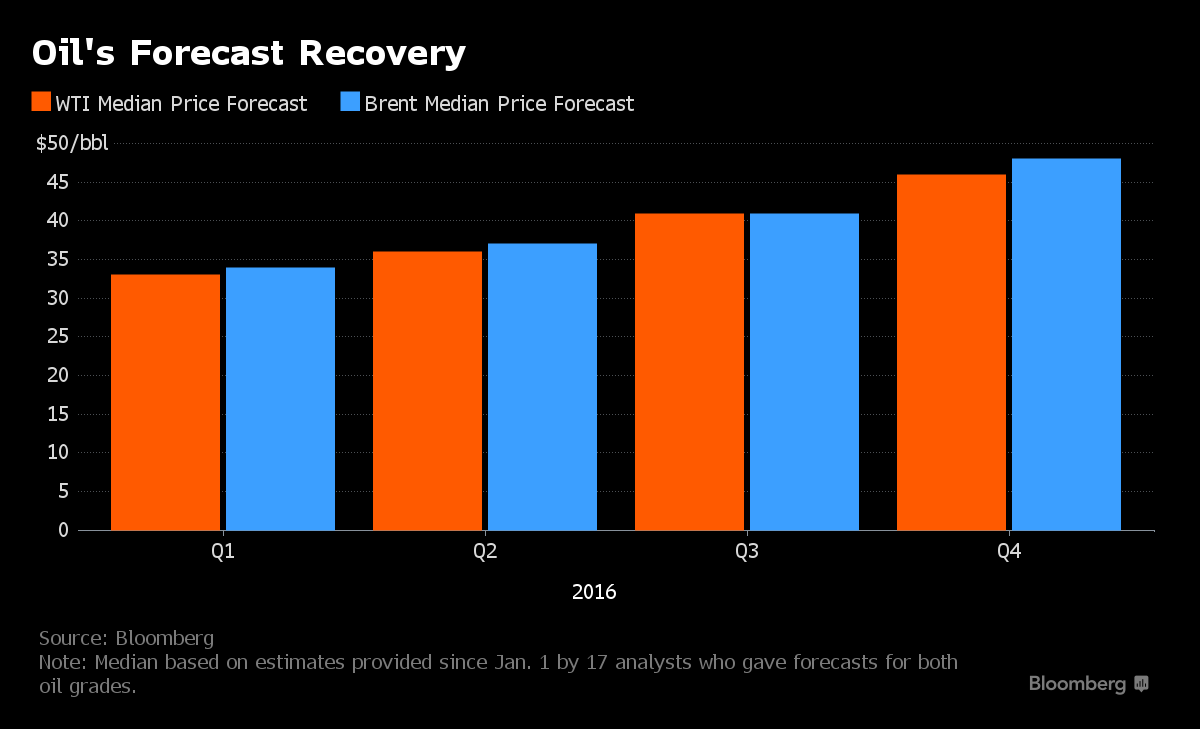
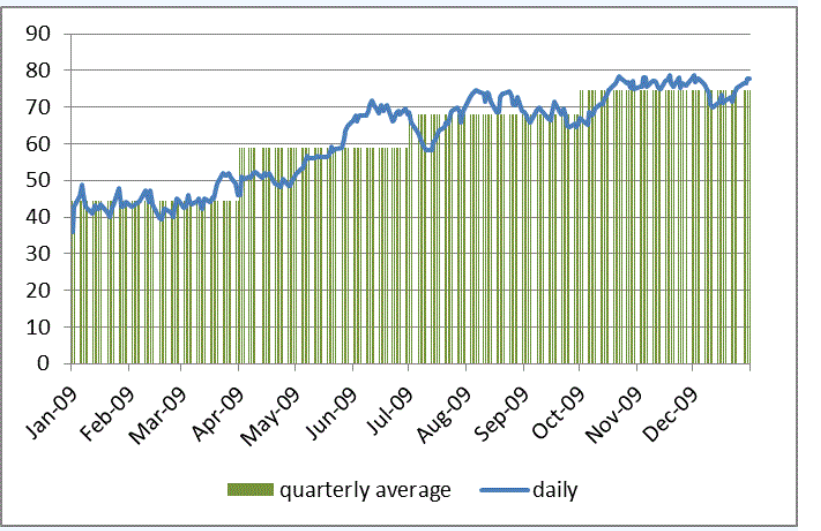


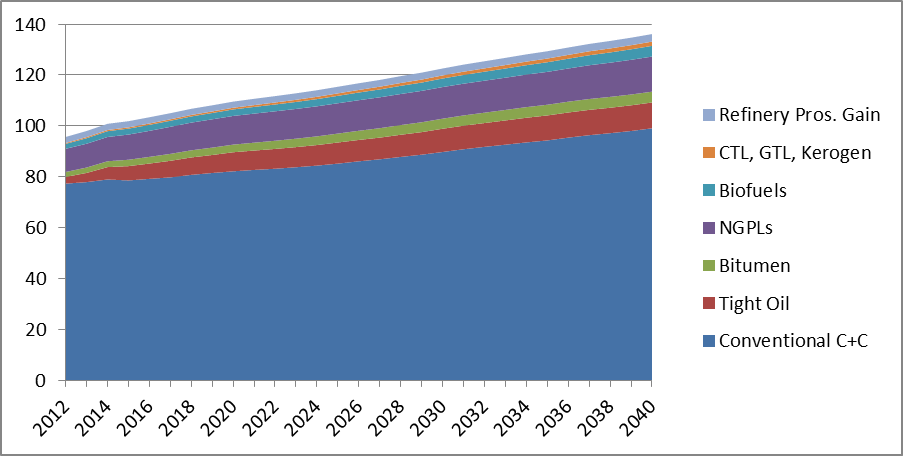
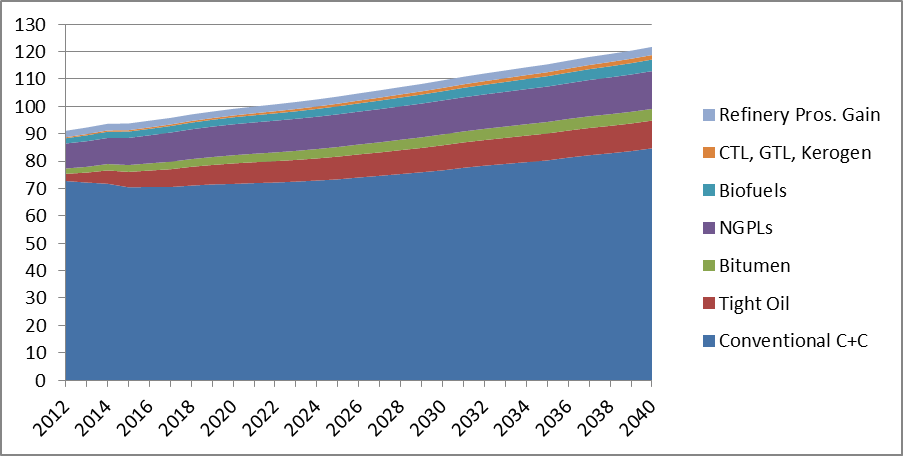


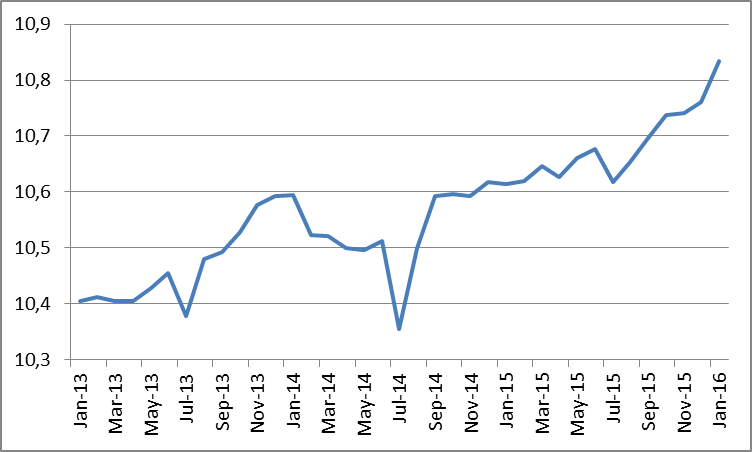


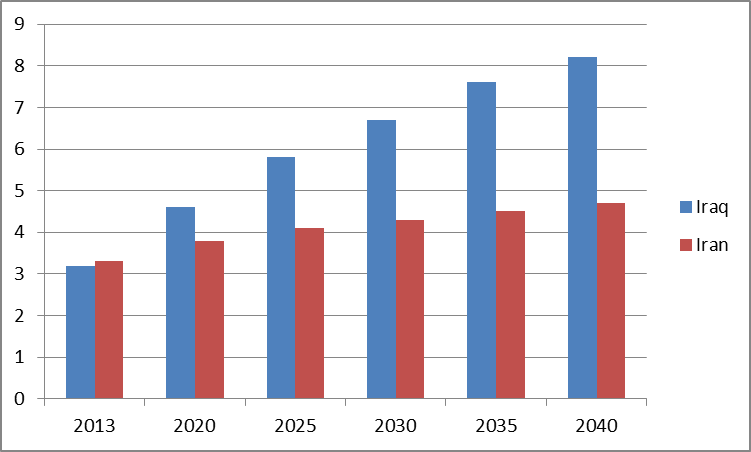
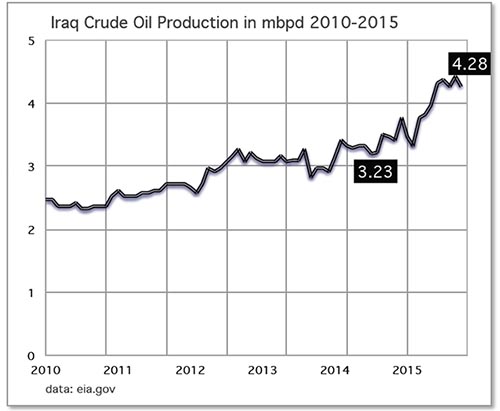


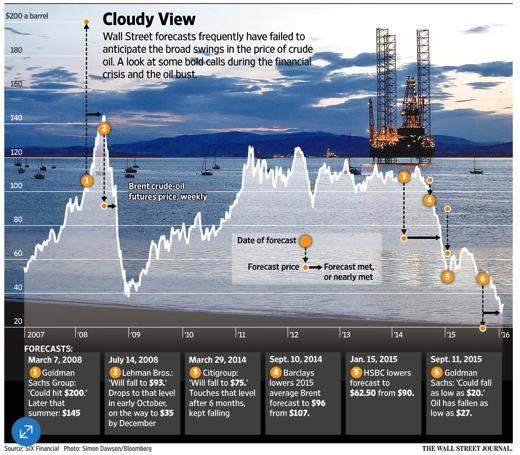


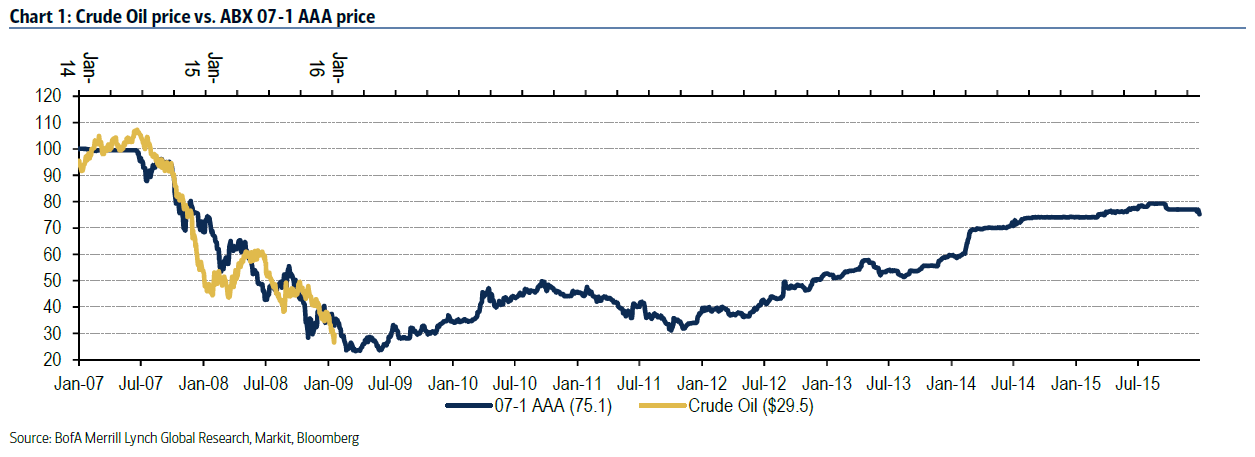 Source: BofAML
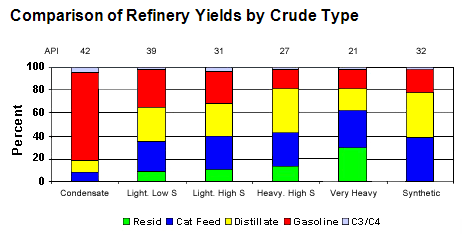
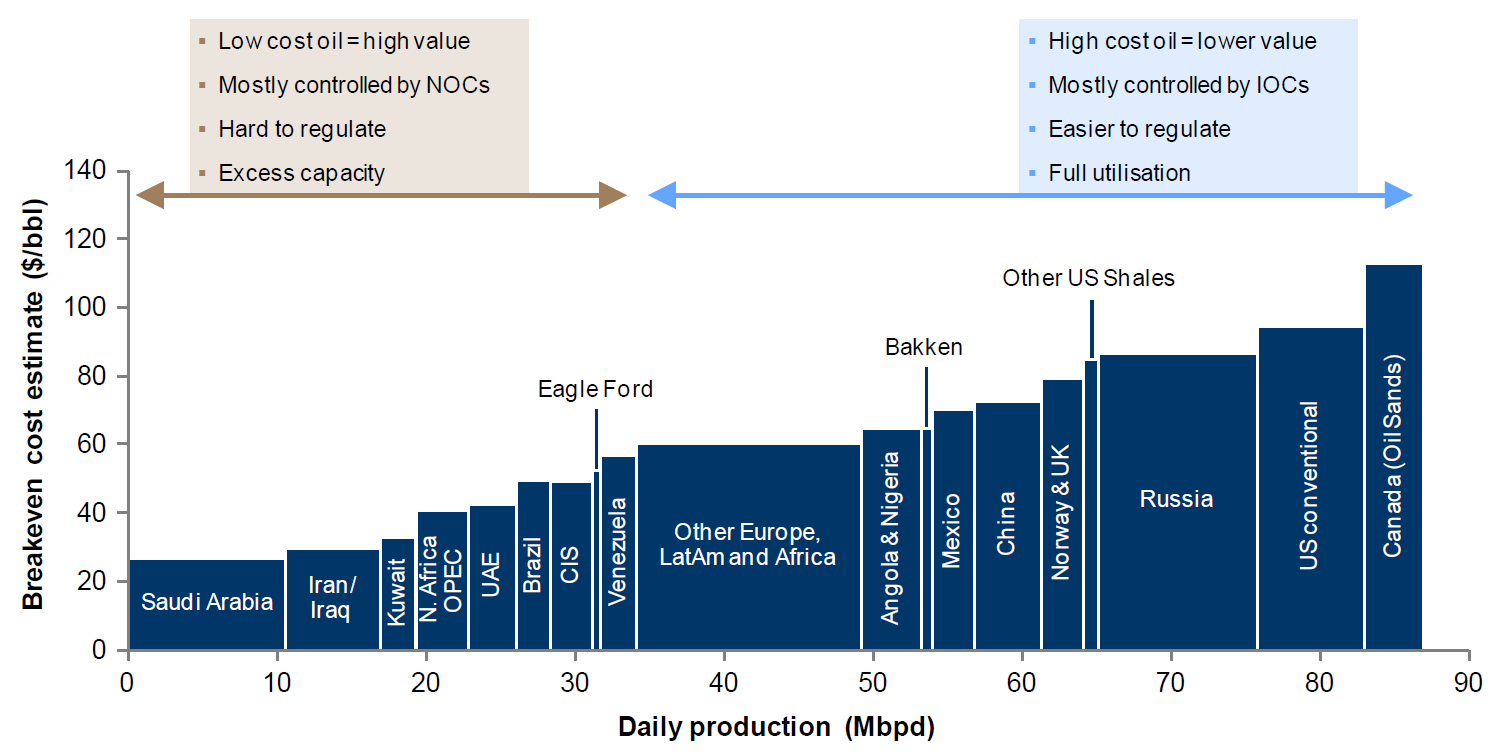
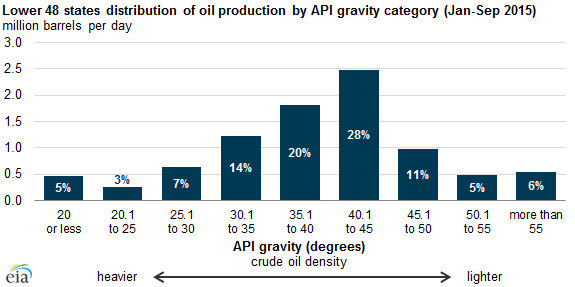
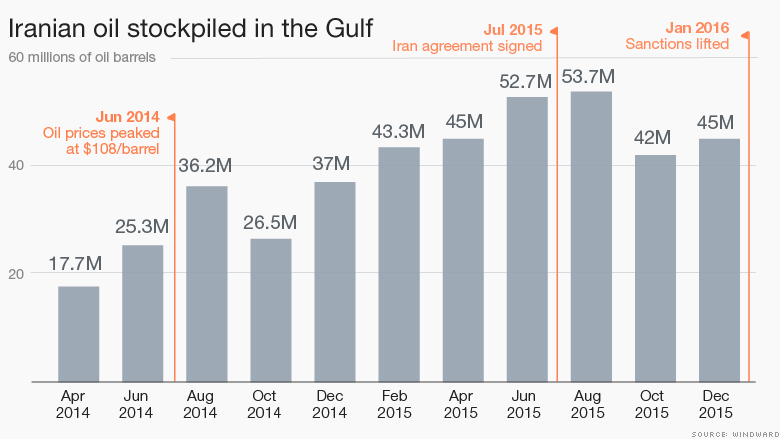
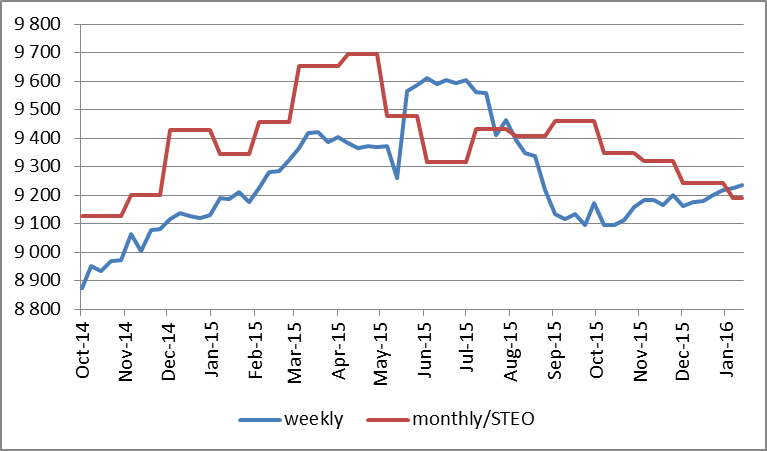
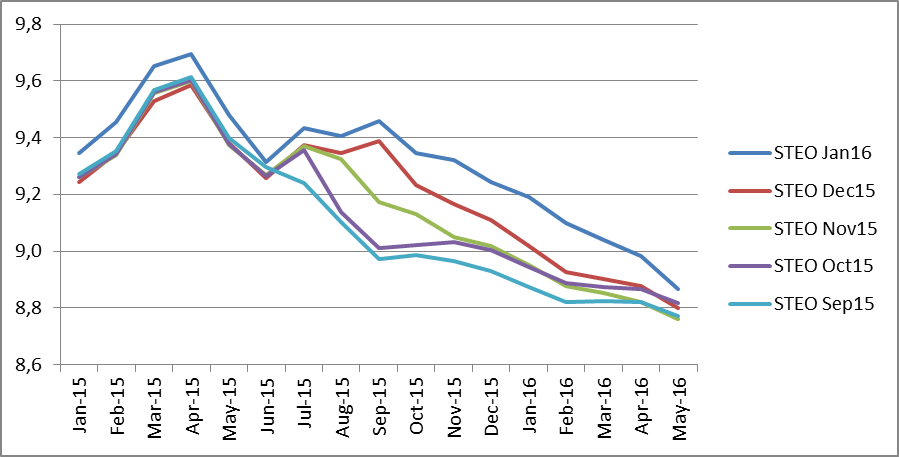

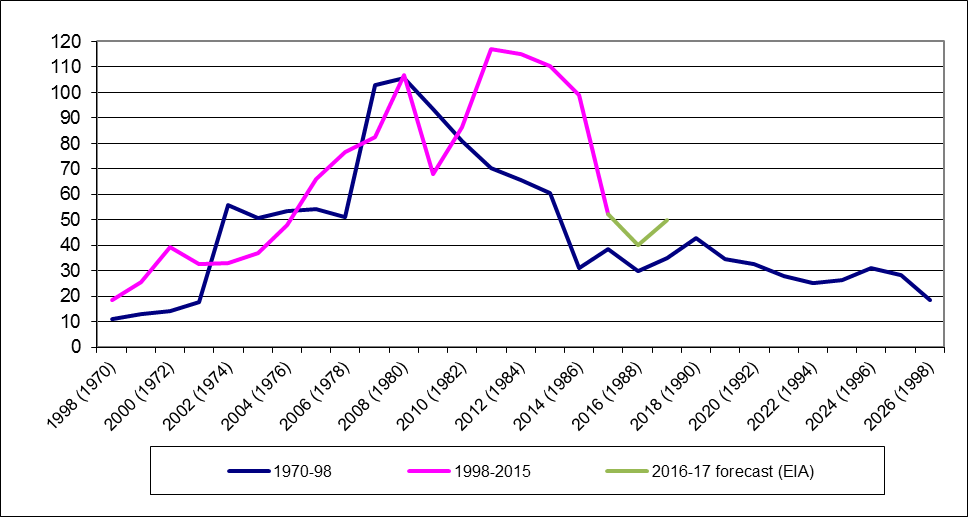
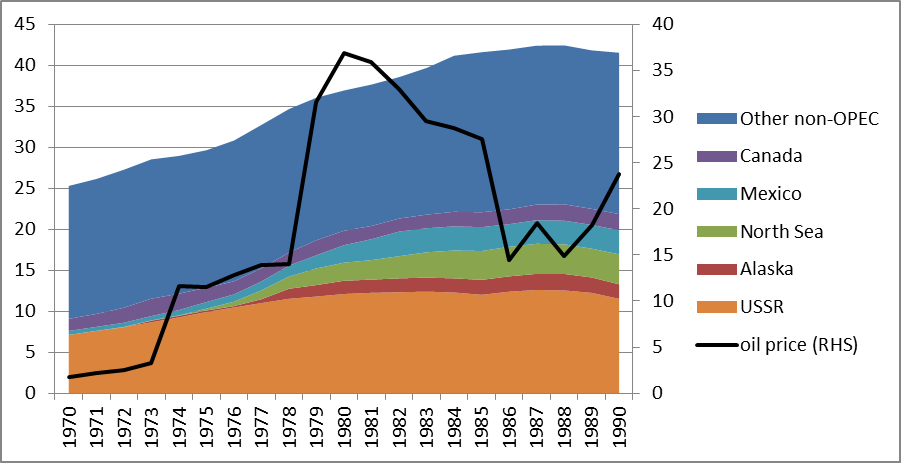
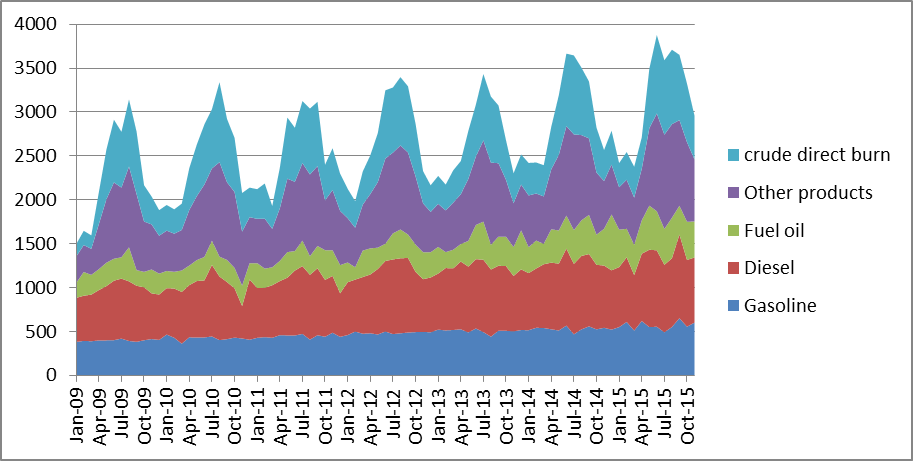
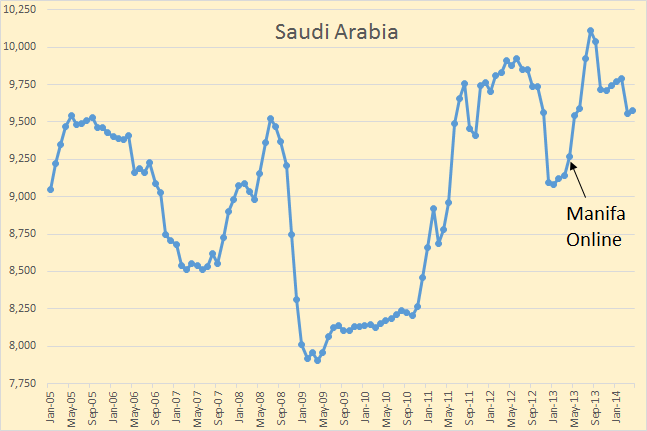


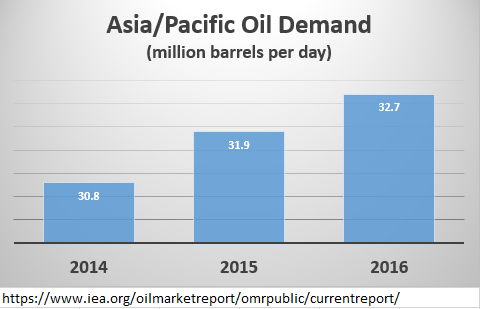

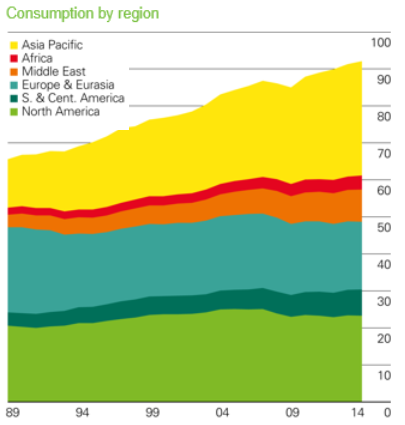
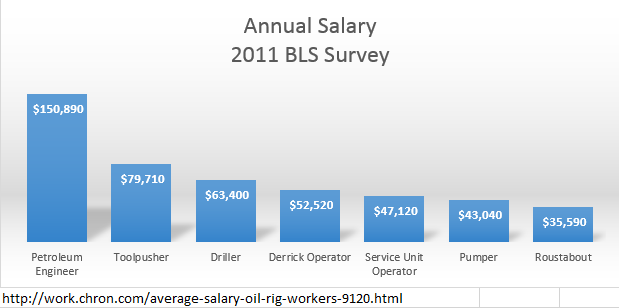
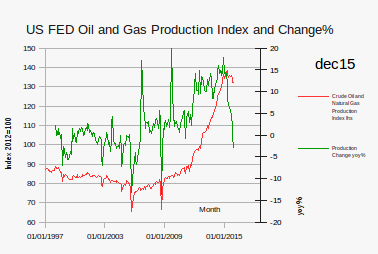
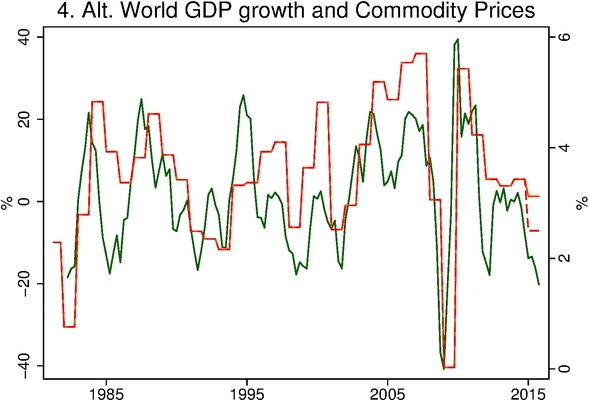
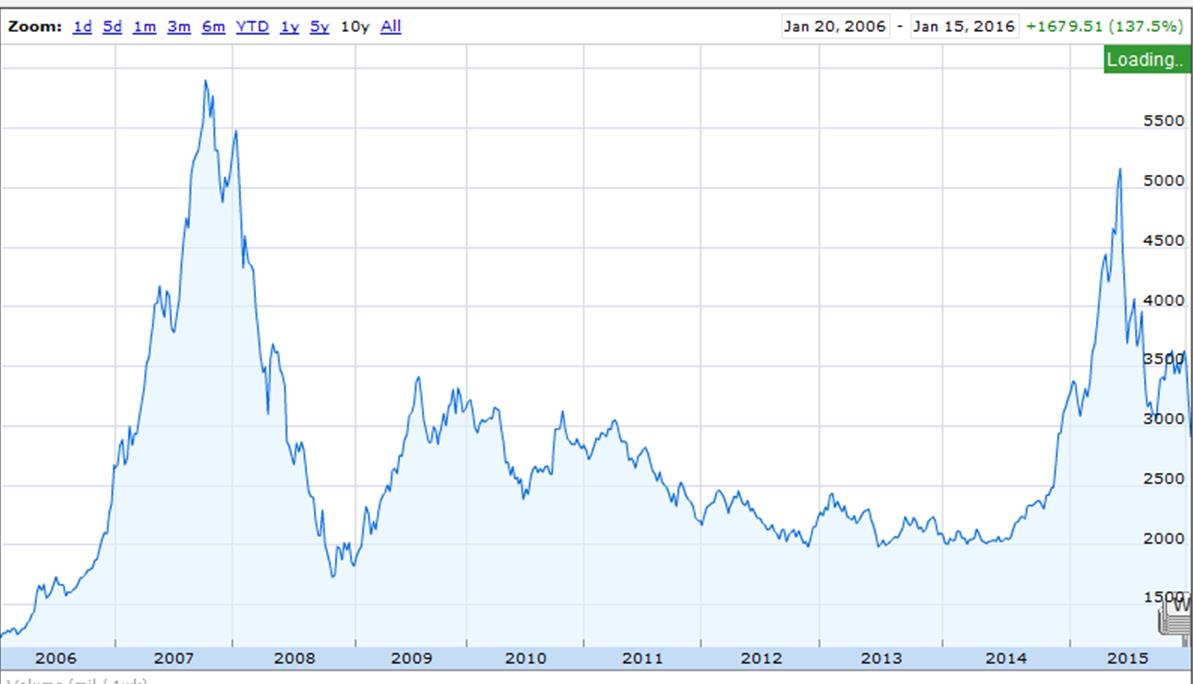

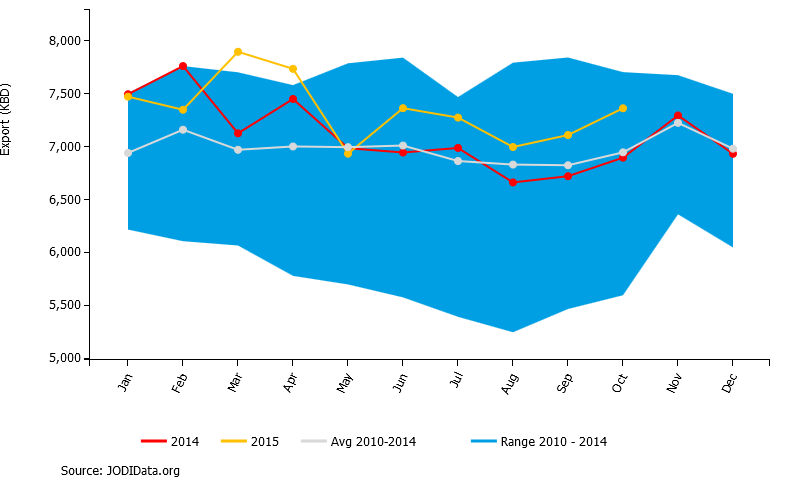
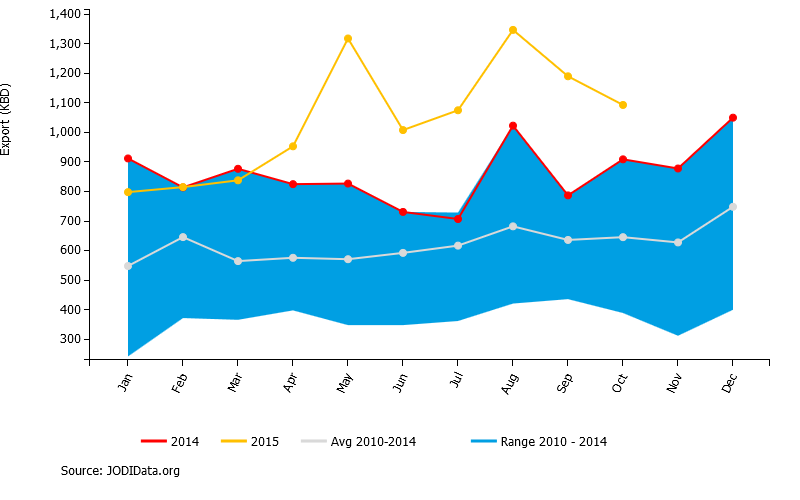
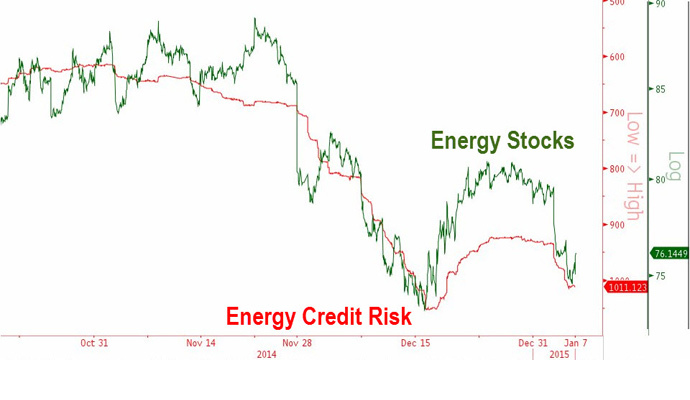


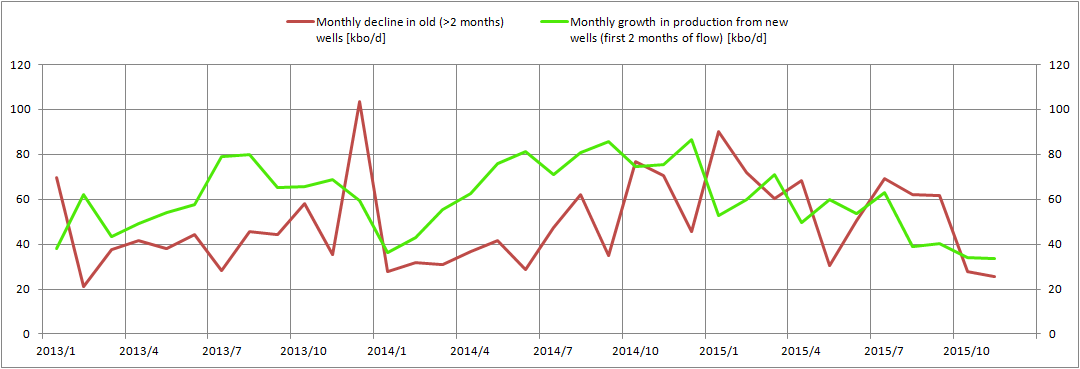
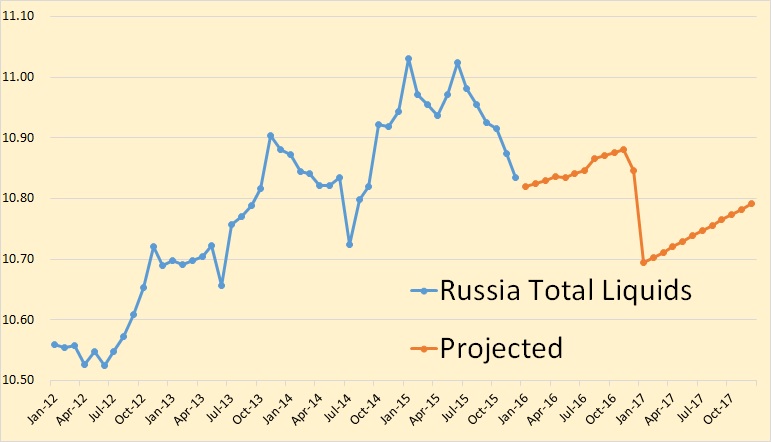
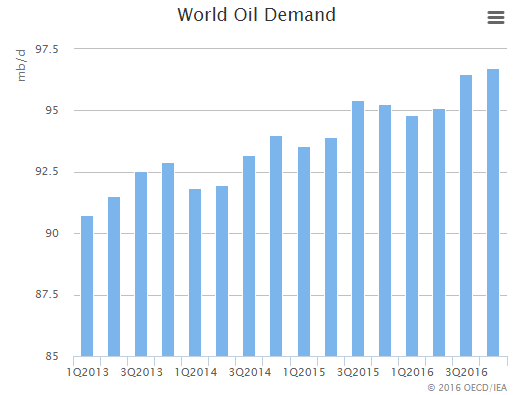
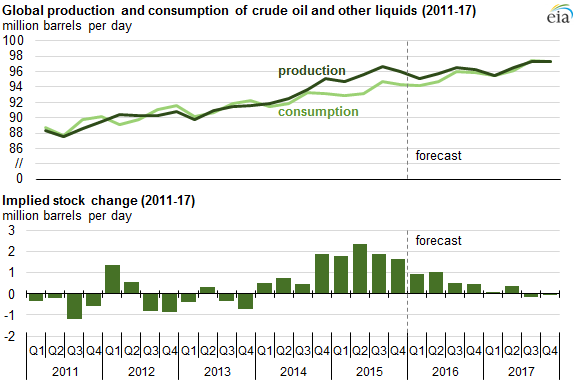
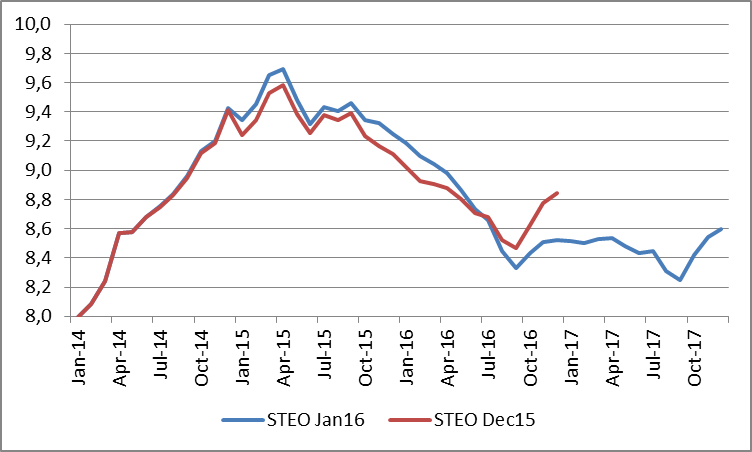
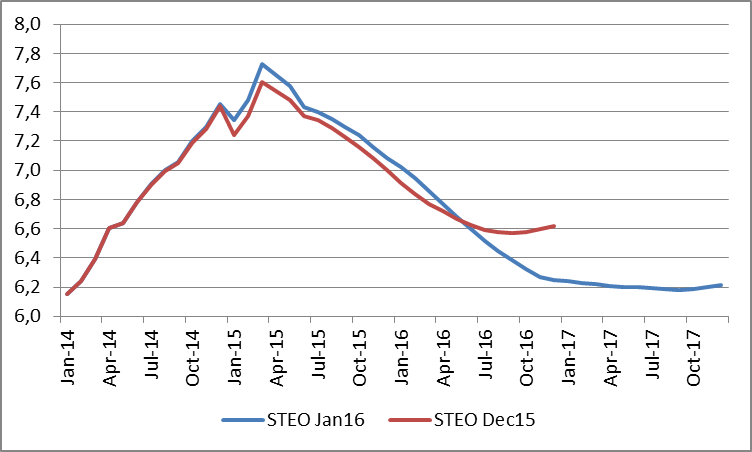
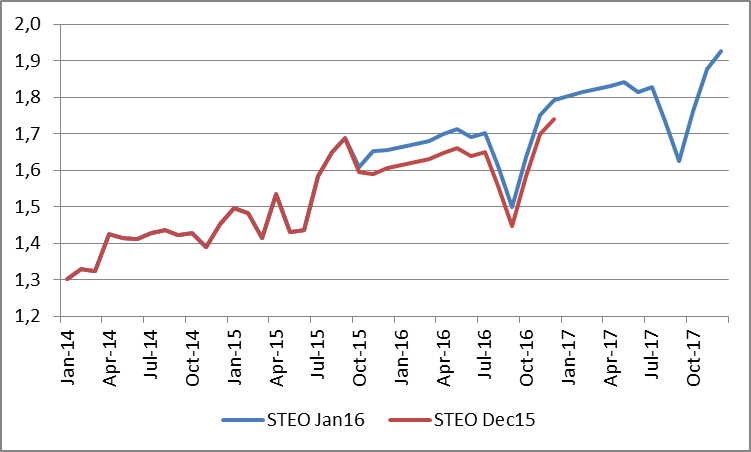
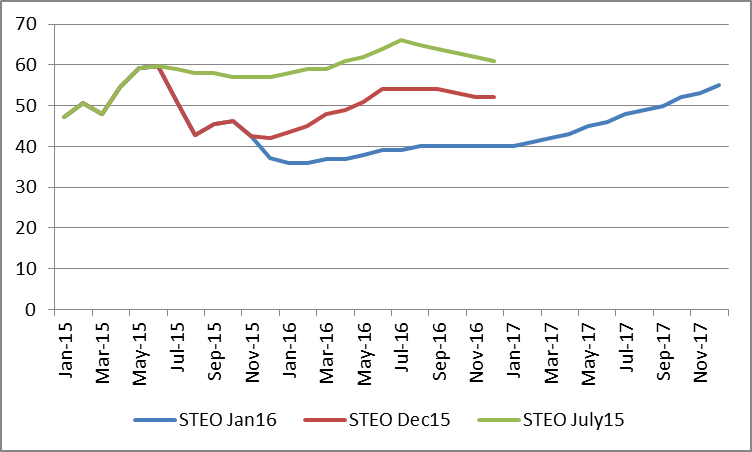
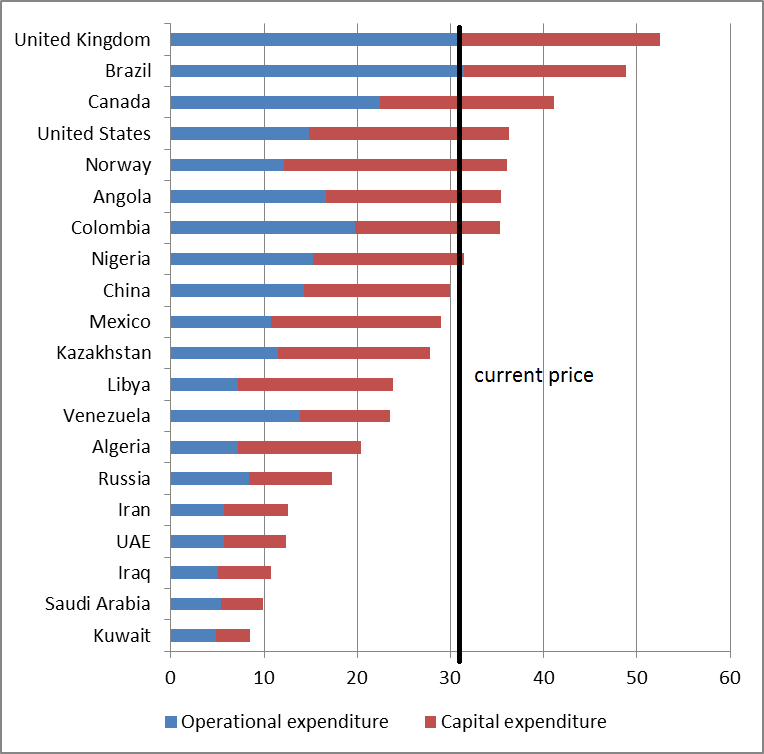
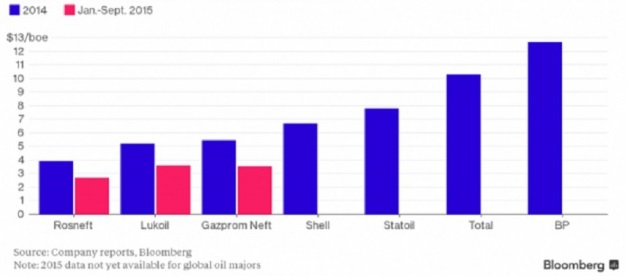


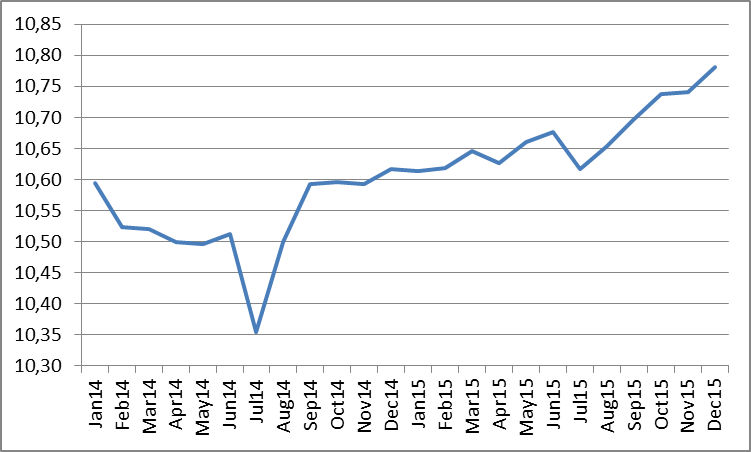
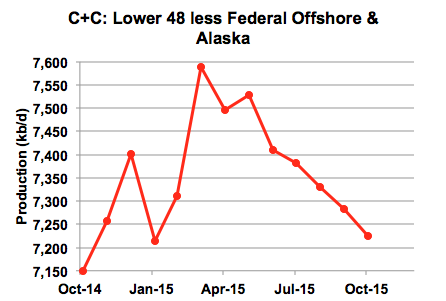
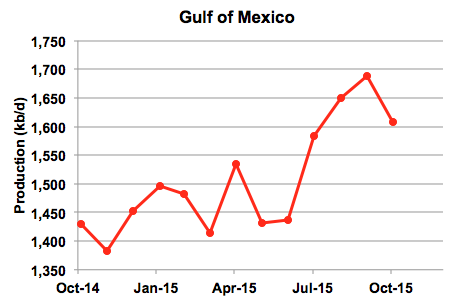
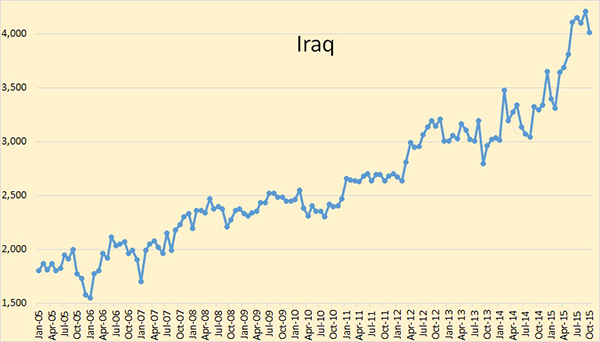
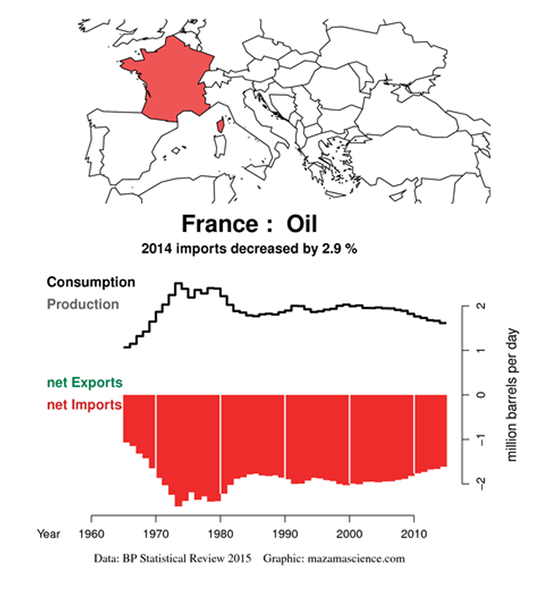

Interesting post. Presumably "Expectations" = Crude Oil Futures Contracts. If so, who controls the price of Oil futures contracts and made the decision to throw the Bakken under the bus, along with more than a few sovereign nations who rely to a significant degree on oil exports economically and to maintain domestic political stability?
Role of demand suppression from high levels of consumer debt, China's economic slowdown, ongoing fallout from the 2008 financial collapse, neoliberal government austerity policies, improvement in energy efficiency, emergence of renewables, and other factors were understated here IMO.
In the past here has also been a variable time lag between low oil prices and rising levels of economic activity.
But maybe this development is overall not such a bad thing given global warming considerations.
CG, I was thinking something similar, that "expectations" is the euphemism for speculation in the futures markets, which, as most know from this site, is now dominated by investor-speculators. The model they used refers to Killian who is one of the handful of academics who try to refute anyone who argues speculators have influenced oil (and other commodity) prices.
My own take (anyone interested can read it here) is there was a series of bubbles generated from the futures market that created the belief higher oil prices were here to stay.
Interesting blog post. Thanks, TiPS.
Noted your article was written before the Central Banks-Primary Dealer cartel renewed pumping equities on February 11 IMHO. Jury is out on whether they've jumped the shark. Also, whether they care.
'The observed drop in oil prices should have a slightly positive impact on the EU economy.'
Probably true. But likely there's a "J-curve effect."
That is, the initial deflationary shock hikes corporate bond spreads (driven by the energy sector) and feeds recession fears. Such fears encourage investors to seek the safe haven of government bonds, at the expense of stocks and credit bonds.
Later as confidence returns, the beneficial effect of lower energy costs (including bolstered consumer demand) can actually be realized.
Arguably, Jan-Feb 2016 constituted the bottom of the "J." We'll see.