|
|
Home | Switchboard | Unix Administration | Red Hat | TCP/IP Networks | Neoliberalism | Toxic Managers |
| (slightly skeptical) Educational society promoting "Back to basics" movement against IT overcomplexity and bastardization of classic Unix | |||||||
|
|
|
|
Quantmod is a rapid prototyping environment, where quant traders can quickly and cleanly explore and build trading models. The quantmod package for R is designed to assist the quantitative trader in the development, testing, and deployment of statistically based trading models.
Updated Charting Tools for 0.3-6!
A replacement for anything statistical. It has no 'new' modeling routines or analysis tool to speak of. It does now offer charting not currently available elsewhere in R, but most everything else is more of a wrapper to what you already know and love about the language and packages you currently use.
quantmod makes modeling easier by removing the repetitive workflow issues surrounding data management, modeling interfaces, and performance analysis.
Explore what is currently possible in the examples
It is possible with one quantmod function to load data from a variety of sources, including...
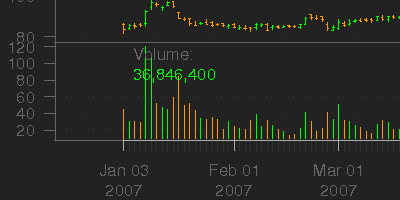
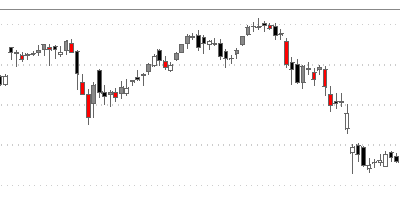
Now that we have some data we may want to look at it. Enter the new function chartSeries. At present this is a nice tool to visualize financial time series in a way that many practicioners are familiar with - line charts, as well as OHLC bar and candle charts. There are convenience wrappers to these different styles (lineChart,barChart, and candleChart), though chartSeries does quite a bit to automatically handle data in the most appropriate way.
A quick look at how to create some charts, including some features and a look at
what's coming in future releases. >
# Specify lookup parameters, and save for future sessions.
>
> getSymbols("AAPL",src="yahoo")
[1] "AAPL"
> barChart(AAPL)
Click to see the full chart:
> # Add multi-coloring and change background to white
> candleChart(AAPL,multi.col=TRUE,theme="white")
Click to see the full chart:
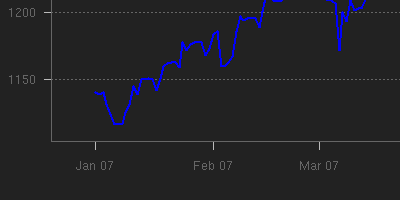
Non-OHLC and Volume series are handled automatically
> getSymbols("XPT/USD",src="oanda")
[1] "XPTUSD"
> chartSeries(XPTUSD,name="Platinum (.oz) in $USD")
Click to see the full chart:
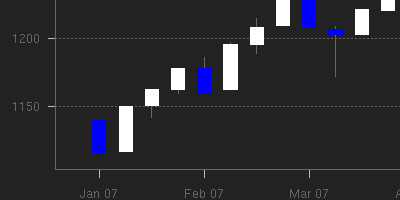
Platinum, now weekly with custom color candles using the quantmod function to.weekly
> chartSeries(to.weekly(XPTUSD),up.col='white',dn.col='blue')
Click to see the full chart:
Try it yourself here:
chartingwithquantmod.R
Building models will mostly be left for a later example series, but for those eager to continue wasting a Friday afternoon at work (when most of my visitors seem to appear), I will continue.
Modelling in R is what R is about. Data feeds into this discussion most prevalently due to the fact that much financial data is not contained in single data objects. Much, if not all, has to collected and aggregated by you, the modeler.
This is where pre-specifying data sources and connection parameters comes in so handy. setSymbolLookup allows the modeler the opportunity to instruct quantmod to source data - given a specific symbol - in a particular manner. When building models in R, often a formula is passed to the fitting function along with the appropriate data object to search.
To handle many different sources it is necessary to either create a data object with all the columns pre-specified, OR to use objects visible within the user's environment. Both have obvious drawbacks - not the least of which is a reliance on the modeler to have manually loaded and aligned the series in question.
At the very best this is time consuming and certainly not very enlightening. At its worst it can be dangerous as data handling is inherently error-prone. Data errors in research can be costly, data errors in trading can quickly lead to a new career. That said, I will reemphasize the terms of the LICENSE stating the COMPLETE LACK OF WARRANTY with regard to this software and all of R for that matter. User beware!
To facilitate this relatively unique data issue, quantmod dynamically creates data objects for use within the modelling process, creating a model frame internally after going through a series of steps to identify the sources of data required - loading if necessary. specifyModel is the workhorse function to handle all the data issues, and it's help file should be read to fully understand what is happening internally. For our purposes here, it is enough to know that one can specify ANY data within the call to specifyModel, and quantmod will handle to lookup and data aggregation for you. Of course the data has to be locatable and unique, but that was probably suspected.
Lets's take a look at an example of specifyModel: > # Create a quantmod object for use in
> # in later model fitting. Note there is
> # no need to load the data before hand.
>
> setSymbolLookup(SPY='yahoo',
+ VXN=list(name='^VIX',src='yahoo'))
>
> mm <- specifyModel(Next(OpCl(SPY)) ~ OpCl(SPY) + Cl(VIX))
>
> modelData(mm)
mm is now a quantmod object holding the model formula and data structure implying the next (Next) period's open to close of the S&P 500 ETF (OpCl(SPY)) is modelled as a function of the current period open to close and the current close of the VIX (Cl(VIX)).
The call to modelData extracts the relevant data set, with transforms magically applied. You can take the data and do with it as you'd like. A more direct function to accomplish the same end is buildData.
> getSymbols("GS") #Goldman OHLC from yahoo
[1] "GS"
> is.OHLC(GS) # does the data contain at least OHL and C?
> has.Vo(GS) # how about volume?
> Op(GS) # just the Open column please.
> seriesHi(GS) # where and what was the high point Probably not overly impressed at this point - but
I did preface the section with the basics.
Now it's time for a little more, um, action.
|
|
Switchboard | ||||
| Latest | |||||
| Past week | |||||
| Past month | |||||
June 26, 2010By C
(This article was first published on R-Chart, and kindly contributed to R-bloggers)
Want to do some quick, in depth technical analysis of Apple stock price using R? Theres a package for that!
The Quantmod package allows you to develop, testing, and deploy of statistically based trading models. It provides the infrastructure for downloading/importing data from a variety of locations, analyze that data and produce charts that help determine statistical trends. I appreciated Digital Dude calling this package to my attention in a recent comment. I also noticed that Revolution Analytics had highlighted the package on its finance page. Actually, I had come across quantmod a few months ago - and it instantly got me excited about the power of R. To give you an idea of typical usage, the following creates a stock chart of the last three months of Apple stock data.library('quantmod')
getSymbols("AAPL")
chartSeries(AAPL, subset='last 3 months')
addBBands()The getSymbols function is used to retrieve stock data. Data can originate in a number of locations. In the example above, we are obtaining a single stock, Apple. If you wanted to download several different stock quotes, you can do so in a single command.
getSymbols(c("ORCL","IBM"))
Once you have retrieved stock data, you can focus on subsets of dates quickly.
AAPL['2010-06-01::2010-06-26']
You can also merge data to view comparisons.
head(as.xts(merge(ORCL,IBM)))
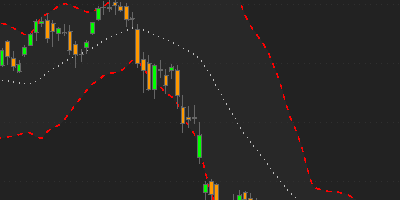
The chartSeries command creates the plot pictured above. It captures a large amount of information, the date, open and close price, and volume of trading for each day. Finally, the addBBands() call adds Bollinger Bands to the chart. Informally, this amounts to a line indicating moving average and two lines a standard deviation above and below this moving average. For the uninitiated, technical indicators (and overlays) can be broken up into four categories - Trend, Volatility, Momentum, and Volume. Those available in Quantmod are listed below.
Trend
Indicator TTR Name quantmod Name Welles Wilder's Directional Movement Indicator ADX addADX Double Exponential Moving Average DEMA addDEMA Exponential Moving Average EMA addEMA Simple Moving Average SMA addSMA Parabolic Stop and Reverse SAR addSAR Exponential Volume Weighted Moving Average EVWMA addEVWMA Moving Average Convergence Divergence MACD addMACD Triple Smoothed Exponential Oscillator TRIX addTRIX Weighted Moving Average WMA addWMA ZLEMA ZLEMA addZLEMA Volatility
Indicator TTR Name quantmod Name Average True Range ATR addATR Bollinger Bands BBands addBBands Price Envelope N/A addEnvelope
Momentum
Indicator TTR Name quantmod Name Commodity Channel Index CCI addCCI Chande Momentum Oscillator CMO addCMO Detrended Price Oscillator DPO addDPO momentum addMomentum Rate of Change ROC addROC Relative Strength Indicator RSI addRSI Stocastic Momentum Index SMI addSMI Williams %R WPR addWPR
Volume
Indicator TTR Name quantmod Name Chaiken Money Flow CMF addCMF Volume N/A addVo
This really just scratches the surface of what is possible with quantmod. For instance, see this post on using quantmod with gold related data.Later posts will include other applications - there is simply too much to cover at one time.
The getSymbols function
The getSymbols function loads (downloads) historic price data
R Code: The getSymbols function
> library(quantmod)
> args(getSymbols)
function (Symbols = NULL, env = parent.frame(), reload.Symbols = FALSE,
verbose = FALSE, warnings = TRUE, src = "yahoo", symbol.lookup = TRUE,
auto.assign = getOption("getSymbols.auto.assign", TRUE),
...)
NULL
Main arguments:
Symbols vector of symbols to be retrieved
src source of the data (Yahoo, Google, FRED, etc.)
env where to create objects†
auto.assign should results be loaded to env or returned†
Return value:
a time series object
†Defaults will change in quantmod version 0.5-0
Guy Yollin (Copyright © 2013) R Programming for Quantitative Finance Data Access with R 11 / 81
Google matched content |
...
quantmod Quantitative Financial Modelling Framework
Society
Groupthink : Two Party System as Polyarchy : Corruption of Regulators : Bureaucracies : Understanding Micromanagers and Control Freaks : Toxic Managers : Harvard Mafia : Diplomatic Communication : Surviving a Bad Performance Review : Insufficient Retirement Funds as Immanent Problem of Neoliberal Regime : PseudoScience : Who Rules America : Neoliberalism : The Iron Law of Oligarchy : Libertarian Philosophy
Quotes
War and Peace : Skeptical Finance : John Kenneth Galbraith :Talleyrand : Oscar Wilde : Otto Von Bismarck : Keynes : George Carlin : Skeptics : Propaganda : SE quotes : Language Design and Programming Quotes : Random IT-related quotes : Somerset Maugham : Marcus Aurelius : Kurt Vonnegut : Eric Hoffer : Winston Churchill : Napoleon Bonaparte : Ambrose Bierce : Bernard Shaw : Mark Twain Quotes
Bulletin:
Vol 25, No.12 (December, 2013) Rational Fools vs. Efficient Crooks The efficient markets hypothesis : Political Skeptic Bulletin, 2013 : Unemployment Bulletin, 2010 : Vol 23, No.10 (October, 2011) An observation about corporate security departments : Slightly Skeptical Euromaydan Chronicles, June 2014 : Greenspan legacy bulletin, 2008 : Vol 25, No.10 (October, 2013) Cryptolocker Trojan (Win32/Crilock.A) : Vol 25, No.08 (August, 2013) Cloud providers as intelligence collection hubs : Financial Humor Bulletin, 2010 : Inequality Bulletin, 2009 : Financial Humor Bulletin, 2008 : Copyleft Problems Bulletin, 2004 : Financial Humor Bulletin, 2011 : Energy Bulletin, 2010 : Malware Protection Bulletin, 2010 : Vol 26, No.1 (January, 2013) Object-Oriented Cult : Political Skeptic Bulletin, 2011 : Vol 23, No.11 (November, 2011) Softpanorama classification of sysadmin horror stories : Vol 25, No.05 (May, 2013) Corporate bullshit as a communication method : Vol 25, No.06 (June, 2013) A Note on the Relationship of Brooks Law and Conway Law
History:
Fifty glorious years (1950-2000): the triumph of the US computer engineering : Donald Knuth : TAoCP and its Influence of Computer Science : Richard Stallman : Linus Torvalds : Larry Wall : John K. Ousterhout : CTSS : Multix OS Unix History : Unix shell history : VI editor : History of pipes concept : Solaris : MS DOS : Programming Languages History : PL/1 : Simula 67 : C : History of GCC development : Scripting Languages : Perl history : OS History : Mail : DNS : SSH : CPU Instruction Sets : SPARC systems 1987-2006 : Norton Commander : Norton Utilities : Norton Ghost : Frontpage history : Malware Defense History : GNU Screen : OSS early history
Classic books:
The Peter Principle : Parkinson Law : 1984 : The Mythical Man-Month : How to Solve It by George Polya : The Art of Computer Programming : The Elements of Programming Style : The Unix Hater’s Handbook : The Jargon file : The True Believer : Programming Pearls : The Good Soldier Svejk : The Power Elite
Most popular humor pages:
Manifest of the Softpanorama IT Slacker Society : Ten Commandments of the IT Slackers Society : Computer Humor Collection : BSD Logo Story : The Cuckoo's Egg : IT Slang : C++ Humor : ARE YOU A BBS ADDICT? : The Perl Purity Test : Object oriented programmers of all nations : Financial Humor : Financial Humor Bulletin, 2008 : Financial Humor Bulletin, 2010 : The Most Comprehensive Collection of Editor-related Humor : Programming Language Humor : Goldman Sachs related humor : Greenspan humor : C Humor : Scripting Humor : Real Programmers Humor : Web Humor : GPL-related Humor : OFM Humor : Politically Incorrect Humor : IDS Humor : "Linux Sucks" Humor : Russian Musical Humor : Best Russian Programmer Humor : Microsoft plans to buy Catholic Church : Richard Stallman Related Humor : Admin Humor : Perl-related Humor : Linus Torvalds Related humor : PseudoScience Related Humor : Networking Humor : Shell Humor : Financial Humor Bulletin, 2011 : Financial Humor Bulletin, 2012 : Financial Humor Bulletin, 2013 : Java Humor : Software Engineering Humor : Sun Solaris Related Humor : Education Humor : IBM Humor : Assembler-related Humor : VIM Humor : Computer Viruses Humor : Bright tomorrow is rescheduled to a day after tomorrow : Classic Computer Humor
The Last but not Least Technology is dominated by two types of people: those who understand what they do not manage and those who manage what they do not understand ~Archibald Putt. Ph.D
Copyright © 1996-2021 by Softpanorama Society. www.softpanorama.org was initially created as a service to the (now defunct) UN Sustainable Development Networking Programme (SDNP) without any remuneration. This document is an industrial compilation designed and created exclusively for educational use and is distributed under the Softpanorama Content License. Original materials copyright belong to respective owners. Quotes are made for educational purposes only in compliance with the fair use doctrine.
FAIR USE NOTICE This site contains copyrighted material the use of which has not always been specifically authorized by the copyright owner. We are making such material available to advance understanding of computer science, IT technology, economic, scientific, and social issues. We believe this constitutes a 'fair use' of any such copyrighted material as provided by section 107 of the US Copyright Law according to which such material can be distributed without profit exclusively for research and educational purposes.
This is a Spartan WHYFF (We Help You For Free) site written by people for whom English is not a native language. Grammar and spelling errors should be expected. The site contain some broken links as it develops like a living tree...
|
|
You can use PayPal to to buy a cup of coffee for authors of this site |
Disclaimer:
The statements, views and opinions presented on this web page are those of the author (or referenced source) and are not endorsed by, nor do they necessarily reflect, the opinions of the Softpanorama society. We do not warrant the correctness of the information provided or its fitness for any purpose. The site uses AdSense so you need to be aware of Google privacy policy. You you do not want to be tracked by Google please disable Javascript for this site. This site is perfectly usable without Javascript.
Last modified: September, 12, 2017