|
|
Home | Switchboard | Unix Administration | Red Hat | TCP/IP Networks | Neoliberalism | Toxic Managers |
| (slightly skeptical) Educational society promoting "Back to basics" movement against IT overcomplexity and bastardization of classic Unix | |||||||
|
|
|
|
According to Wikipedia (Energy returned on energy invested)
In physics, energy economics and ecological energetics, energy returned on energy invested (EROEI or ERoEI); or energy return on investment (EROI), is the ratio of the amount of usable energy acquired from a particular energy resource to the amount of energy expended to obtain that energy resource.[1][2] When the EROEI of a resource is less than or equal to one, that energy source becomes an "energy sink", and can no longer be used as a primary source of energy.
General tendency of EROEI is a downtrend, which reflects "peak energy" situation much more vividly then just drop or plato in oil extracted from all sources. Not only amount of oil reached plato, the cost of extracting oil is rising which is reflected in EROEI dropping. When the EROEI of the main sources of energy for an economy fall energy becomes more difficult to obtain and its value rises relative to other resources and goods. Economy might reach "perma-stagnation" or "perma-recession" state is EROEI is rising too fast.
EROEI (for US, from Wikipedia)
The U.S. has expanded its use of energy at a typical rate of 2.9% per year since 1650 (previous post). We learned that continuation of this energy growth rate in any form of technology leads to a thermal reckoning in just a few hundred years (not the tepid global warming, but boiling skin!). What does this say about the long-term prospects for economic growth, if anything?
EROEI and Net energy (gain) measure the same quality of an energy source or sink in numerically different ways. Net energy describes the amounts, while EROEI measures the ratio or efficiency of the process. For example given a process with an EROEI of 5, expending 1 unit of energy yields a net energy gain of 4 units. The break-even point happens with an EROEI of 1 or a net energy gain of 0.
High per-capita energy use has been considered desirable as it is associated with a high standard of living based on energy-intensive machines. A society will generally exploit the highest available EROEI energy sources first, as these provide the most energy for the least effort. With non-renewable sources, progressively lower EROEI sources are then used as the higher-quality ones are exhausted.
For example, when oil was originally discovered, it took on average one barrel of oil to find, extract, and process about 100 barrels of oil. That ratio has declined steadily over the last century to about three barrels gained for one barrel used up in the U.S. (and about ten for one in Saudi Arabia).[citation needed] [3] Currently (2006) the EROEI of wind energy in North America and Europe is about 20:1[4] which has driven its adoption.
Although many qualities of an energy source matter (for example oil is energy-dense and transportable, while wind is variable), when the EROEI of the main sources of energy for an economy fall energy becomes more difficult to obtain and its value rises relative to other resources and goods. Therefore the EROEI gains importance when comparing energy alternatives. Since expenditure of energy to obtain energy requires productive effort, as the EROEI falls an increasing proportion of the economy has to be devoted to obtaining the same amount of net energy.
Since the invention of agriculture, humans have increasingly used exogenous sources of energy to multiply human muscle-power. Some historians have attributed this largely to more easily exploited (i.e. higher EROEI) energy sources, which is related to the concept of energy slaves. Thomas Homer-Dixon [5] demonstrates that a falling EROEI in the Later Roman Empire was one of the reasons for the collapse of the Western Empire in the fifth century CE. In "The Upside of Down" he suggests that EROEI analysis provides a basis for the analysis of the rise and fall of civilisations. Looking at the maximum extent of the Roman Empire, (60 million) and its technological base the agrarian base of Rome was about 1:12 per hectare for wheat and 1:27 for alfalfa (giving a 1:2.7 production for oxen). One can then use this to calculate the population of the Roman Empire required at its height, on the basis of about 2,500-3,000 calories per day per person. It comes out roughly equal to the area of food production at its height. But ecological damage (deforestation, soil fertility loss particularly in southern Spain, southern Italy, Sicily and especially north Africa) saw a collapse in the system beginning in the 2nd century, as EROEI began to fall. It bottomed in 1084 when Rome's population, which had peaked under Trajan at 1.5 million, was only 15,000. Evidence also fits the cycle of Mayan and Cambodian collapse too. Joseph Tainter[6] suggests that diminishing returns of the EROEI is a chief cause of the collapse of complex societies. Falling EROEI due to depletion of non-renewable resources also poses a difficult challenge for industrial economies.
Measuring the EROEI of a single physical process is unambiguous, but there is no agreed-upon standard on which activities should be included in measuring the EROEI of an economic process. In addition, the form of energy of the input can be completely different from the output. For example, energy in the form of coal could be used in the production of ethanol. This might have an EROEI of less than one, but could still be desirable due to the benefits of liquid fuels.
How deep should the probing in the supply chain of the tools being used to generate energy go? For example, if steel is being used to drill for oil or construct a nuclear power plant, should the energy input of the steel be taken into account, should the energy input into building the factory being used to construct the steel be taken into account and amortized? Should the energy input of the roads which are used to ferry the goods be taken into account? What about the energy used to cook the steelworker's breakfasts? These are complex questions evading simple answers. A full accounting would require considerations of opportunity costs and comparing total energy expenditures in the presence and absence of this economic activity.
However, when comparing two energy sources a standard practice for the supply chain energy input can be adopted. For example, consider the steel, but don't consider the energy invested in factories deeper than the first level in the supply chain.
Energy return on energy invested does not take into account the factor of time. Energy invested in creating a solar panel may have consumed energy from a high power source like coal, but the return happens very slowly, i.e. over many years. If energy is increasing in relative value this should favour delayed returns. Some believe this means the EROEI measure should be refined further.
Conventional economic analysis has no formal accounting rules for the consideration of waste products that are created in the production of the ultimate output. For example, differing economic and energy values placed on the waste products generated in the production of ethanol makes the calculation of this fuel's true EROEI extremely difficult.
EROEI is only one consideration and may not be the most important one in energy policy. Energy independence (reducing international competition for limited natural resources), freedom from pollution (including carbon dioxide and other green house gases), and affordability could be more important, particularly when considering secondary energy sources. While a nation's primary energy source is not sustainable unless it has a use rate less than or equal to its replacement rate, the same is not true for secondary energy supplies. Some of the energy surplus from the primary energy source can be used to create the fuel for secondary energy sources, such as for transportation.
A related recent concern is energy cannibalism where energy technologies can have a limited growth rate if climate neutrality is demanded. Many energy technologies are capable of replacing significant volumes of fossil fuels and concomitant green house gas emissions. Unfortunately, neither the enormous scale of the current fossil fuel energy system nor the necessary growth rate of these technologies is well understood within the limits imposed by the net energy produced for a growing industry. This technical limitation is known as energy cannibalism and refers to an effect where rapid growth of an entire energy producing or energy efficiency industry creates a need for energy that uses (or cannibalizes) the energy of existing power plants or production plants.[7]
The solar breeder overcomes some of these problems. A solar breeder is a photovoltaic panel manufacturing plant which can be made energy-independent by using energy derived from its own roof using its own panels. Such a plant becomes not only energy self-sufficient but a major supplier of new energy, hence the name solar breeder. Research on the concept was conducted by Centre for Photovoltaic Engineering, University of New South Wales, Australia.[8][9] The reported investigation establishes certain mathematical relationships for the solar breeder which clearly indicate that a vast amount of net energy is available from such a plant for the indefinite future.[10] BP Solar originally intended its plant in Frederick, Maryland to be such a Solar Breeder, but the project did not develop[citation needed]. Theoretically breeders of any kind can be developed.
|
|
Switchboard | ||||
| Latest | |||||
| Past week | |||||
| Past month | |||||
Jun 07, 2004 | hypertextbook.com
Energy Density of Natural Gas
An educational, fair use website
Bibliographic Entry Result
(w/surrounding text)Standardized
Result"Fuel." Encyclopedia Encarta . CD-ROM. Microsoft, 2003. "Gaseous fuels (Btu per cu ft): acetylene 1480; blast-furnace gas 93; carbon monoxide 317; coke-oven gas or coal gas about 600; hydrogen 319; natural gas 1050 to 2220; oil gas 516; producer gas 136." 39.1""82.7 MJ/m 3 Brennard, Timothy P. Natural Gas, A Fuel of Choice for China . Norwich: University of East Anglia, 2001: 81. "In calorific value it competes extremely well with other traditional commercial gasses: 37-41 MJ/m 3 i.e., twice coal gas, and eight times producer gas [Tiratsoo, 1976]." 37.0""41.0 MJ/m 3 E.N., Tiratsoo. Oilfields of the World . Scientific Press, 1973: 15. Reference in Understanding Natural Gas . "Calorific values: 900""1100 Btu/ft. 3 (33.4""40.9 MJ/m 3 )" 33.4""40.9 MJ/m 3 Bioenergy Conversion Factors . Bioenergy Information Network. "Natural gas: HHV = 1027 Btu/ft3 = 38.3 MJ/m 3 ; LHV = 930 Btu/ft3 = 34.6 MJ/m 3 [HHV""Higher Heating Level; LHV""Lower Heating Level]" 38.3 MJ/m 3
34.6 MJ/m 3Natural gas, a combustible mixture of hydrocarbons, is a very important source of energy since it is clean, cheap and efficient. The major component is methane, but it may also contain small amounts of other hydrocarbon compounds such as ethane or butane. A natural gas is described as sweet (with low sulfur contents) or sour (with high sulfur contents). It may also be wet or dry, depending on the presence of natural gas liquids and other energy gases. When more than 90% of a natural gas is composed of methane, it is referred to as dry.
Source: Background of Natural Gas Typical Composition of Natural Gas Methane CH 4 70-90% Ethane C 2 H 6 0-20% Propane C 3 H 8 Butane C 4 H 10 Carbon Dioxide CO 2 0-8% Oxygen O 2 0-0.2% Nitrogen N 2 0-5% Hydrogen sulphide H 2 S 0-5% Rare gases A, He, Ne, Xe trace There are three theories that explain the formation of natural gas. The first is that natural gas is formed when organic matter, such as the remains of a plant or animal, is compressed beneath the earth at high pressures for a long period of time. This is referred to as thermogenic methane.
Another theory suggests that natural gas is formed by the decomposition of organic matters by a microorganism. These microorganisms chemically break down the organic matters into pure methane, which is referred to as biogenic methane.
The third states that methane is formed by the reaction of hydrogen rich gases and carbon molecules deep inside the earth. In the absence of oxygen, they may combine to form hydrocarbon gases. Under high pressure, these gases may rise to the surface of the earth and form methane deposits.
Energy density is measured by the amount of energy stored in a given unit of matter or system. For natural gases, the energy density is the either the amount of energy stored per unit volume or per unit mass of the gas. The energy stored per unit volume is usually measured in British Thermal Units per cubic feet, or, the amount of natural gas that will produce enough energy to heat one pound of water one degree at normal pressure. The standard unit is megajoules per cubic meter. The energy density of a natural gas lies in the range of 900-2200 Btu/ft 3 or 33.4""82.7 MJ/m 3 .
Jessica Yan -- 2004
Jun 07, 2021 | hypertextbook.com
Energy Density of Natural Gas
An educational, fair use website
Bibliographic Entry Result
(w/surrounding text)Standardized
Result"Fuel." Encyclopedia Encarta . CD-ROM. Microsoft, 2003. "Gaseous fuels (Btu per cu ft): acetylene 1480; blast-furnace gas 93; carbon monoxide 317; coke-oven gas or coal gas about 600; hydrogen 319; natural gas 1050 to 2220; oil gas 516; producer gas 136." 39.1""82.7 MJ/m 3 Brennard, Timothy P. Natural Gas, A Fuel of Choice for China . Norwich: University of East Anglia, 2001: 81. "In calorific value it competes extremely well with other traditional commercial gasses: 37-41 MJ/m 3 i.e., twice coal gas, and eight times producer gas [Tiratsoo, 1976]." 37.0""41.0 MJ/m 3 E.N., Tiratsoo. Oilfields of the World . Scientific Press, 1973: 15. Reference in Understanding Natural Gas . "Calorific values: 900""1100 Btu/ft. 3 (33.4""40.9 MJ/m 3 )" 33.4""40.9 MJ/m 3 Bioenergy Conversion Factors . Bioenergy Information Network. "Natural gas: HHV = 1027 Btu/ft3 = 38.3 MJ/m 3 ; LHV = 930 Btu/ft3 = 34.6 MJ/m 3 [HHV""Higher Heating Level; LHV""Lower Heating Level]" 38.3 MJ/m 3
34.6 MJ/m 3Natural gas, a combustible mixture of hydrocarbons, is a very important source of energy since it is clean, cheap and efficient. The major component is methane, but it may also contain small amounts of other hydrocarbon compounds such as ethane or butane. A natural gas is described as sweet (with low sulfur contents) or sour (with high sulfur contents). It may also be wet or dry, depending on the presence of natural gas liquids and other energy gases. When more than 90% of a natural gas is composed of methane, it is referred to as dry.
Source: Background of Natural Gas Typical Composition of Natural Gas Methane CH 4 70-90% Ethane C 2 H 6 0-20% Propane C 3 H 8 Butane C 4 H 10 Carbon Dioxide CO 2 0-8% Oxygen O 2 0-0.2% Nitrogen N 2 0-5% Hydrogen sulphide H 2 S 0-5% Rare gases A, He, Ne, Xe trace There are three theories that explain the formation of natural gas. The first is that natural gas is formed when organic matter, such as the remains of a plant or animal, is compressed beneath the earth at high pressures for a long period of time. This is referred to as thermogenic methane.
Another theory suggests that natural gas is formed by the decomposition of organic matters by a microorganism. These microorganisms chemically break down the organic matters into pure methane, which is referred to as biogenic methane.
The third states that methane is formed by the reaction of hydrogen rich gases and carbon molecules deep inside the earth. In the absence of oxygen, they may combine to form hydrocarbon gases. Under high pressure, these gases may rise to the surface of the earth and form methane deposits.
Energy density is measured by the amount of energy stored in a given unit of matter or system. For natural gases, the energy density is the either the amount of energy stored per unit volume or per unit mass of the gas. The energy stored per unit volume is usually measured in British Thermal Units per cubic feet, or, the amount of natural gas that will produce enough energy to heat one pound of water one degree at normal pressure. The standard unit is megajoules per cubic meter. The energy density of a natural gas lies in the range of 900-2200 Btu/ft 3 or 33.4""82.7 MJ/m 3 .
Jessica Yan -- 2004
Mar 17, 2019 | energy.geothunder.com
Energy Returned on Energy Invested (EROEI) for Shale Oil and Shale Gas
by Ben | Oct 11, 2011 | Bakken , Fracking , Natural Gas , North Dakota , Oil | 0 comments Energy returned on energy invested (EROEI) Shale oil and shale gas
This is actually a follow-up to questions regarding energy return on investment in shale plays. The simple answer is probably best answered with a rhetorical question. Why would the number of drilling rigs in the Williston Basin go from 160 last winter to more than 200 this summer?
Answer: -> Profit
Profits and EROEI are actually closely related. The resources that are preferentially developed have the best EROEI. Energy is a currency, and in the case of oil wells, the return on investment is fast. The total payback time on most Bakken wells is under two years, and really good wells are less than a year. Money does not directly translate to energy, but in the case of hydrocarbons, it is fairly close.
If you are a strong contributor to the green movement, you should ask the same question about wind towers and solar panels, which are currently inefficient and expensive to produce. (I like alternative, but they just are not competitive. See information provided below or read my other post "what it means to be green" )
The energy ratios for fracked oil wells are probably a little better than an average oil well which are about 19:1, but it is important to note that ratio could be all over the place. In terms of energy, I'm not sure if fracked wells are really better than traditional oil wells, but the return on investment is certainly faster. In truth, there is not much decline curve data on fracked wells so nobody really knows just how much oil the wells can produce. Most estimates show a similar decline curve to traditional oil wells, but lack of data makes it difficult to history match so estimates will likely change. I anticipate fracked wells to have better decline curves than most traditional wells, but I could easily be wrong. It is important to note that new tertiary recovery techniques are being developed specifically for fracked wells.
Real-world problems associated with new drilling technologies relate to water usage, surface water contamination, and infrastructure degradation. All of these problems are being worked on, and state governments are working hard to deal with the problems associated with drilling. I say state governments because that is who should be able to control their situation. Geology is too variable across the country. Sweeping regulations are not the answer to new drilling technologies.
I sort of missed the gas portion of this post, but the same rules apply. The price of natural gas should speak for itself.
Some Data for the numbers people :
It is important to realize that these ratios change dramatically year to year based on technological changes. For instance, I know that the ratio for the tar sands is off, but that is not what this post is about, and I do not feel like trying to find data that may not exist yet.
Natural gas: 10:1
Coal: 50:1
Oil (Ghawar supergiant field): 100:1
Oil (global average): 19:1
Tar sands: 5.2:1 to 5.8:1
Oil shale: 1.5:1 to 4:1Wind: 18:1
Hydro: 11:1 to 267:1
Waves: 15:1
Tides: ~ 6:1
Geothermal power: 2:1 to 13:1
Solar photovoltaic power: 3.75:1 to 10:1
Solar thermal: 1.6:1Nuclear power: 1.1:1 to 15:1
Biodiesel: 1.9:1 to 9:1
Ethanol: 0.5:1 to 8:1This list comes from:
• Richard Heinberg, Searching for a Miracle: 'Net Energy' Limits & the Fate of Industrial Society .
Misconceptions regarding energy returned on energy invested of shale plays:
1. The oil is thick and does not flow without additional heat or fluids. "For example, an energy source like oil shale that is a solid material at room temperature and has low energy density per unit of weight, and volume is highly unlikely to be good as a transport fuel unless it can first somehow profitably be turned into a liquid fuel with higher-energy density (i.e., one that contains more energy per unit of weight or volume)."
This is simply false in most cases. The misconception is largely derived from people confusing the tar sands in Alberta, Canada, and the Green River Shale in Colorado and Utah with current shale oil plays.
For the most part, Bakken, Three Forks, and Niobrara have an API of 36 to 44 degrees. Since that number doesn't mean anything to most people Bakken oil looks a little like dark green swamp water. It flows and smells a little like a mix of solvents(alcohols). It can evaporate some and looks nothing like motor oil or tar.
2 Oil shales are mined not drilled.
The answer is the same as above, and refers to the Tar Sands and Green River Shale.
One little rant for good measure: If I read one more comment that says we should wait to develop our resources until we know how I might reach the computer screen and punch them in the face. There are two options if we wait. 1. Total economic collapse with nothing to show for it (This may be unavoidable at this point) 2. Oil companies will do their development overseas, and our economy will collapse for sure. Energy is more valuable than any currency because you can actually do something with it. Nothing beside energy can drive growth of any kind.
Mar 16, 2019 | peakoilbarrel.com
likbez says: 03/16/2019 at 9:34 pm
likbez says:Some arguments in defense of Ron estimates
1. When something is increasing 0.8% a year based on data with, say, 2% or higher margin of error this is not a growth. This is a number racket.
2. We need to use proper coefficients to correctly estimate energy output of different types of oil We do not know real EROEI of shale oil, but some sources claim that it is in the 1.5-4.5 range. Let's assume that it is 3. In comparison, Saudi oil has 80-100 range. In this sense shale oil is not a part of the solution; it is a part of the problem (stream of just bonds produced in parallel is the testament of that). In other words, all shale oil is "subprime oil," and an increase of shale oil production is correctly called the oil retirement party. The same is true for the tar sands oil.
So the proper formula for total world production in "normalized by ERORI units" might be approximated by the equation:
0.99* OPEC_oil + 0.97*other_conventional_oil + 0.95*shallow-water_oil + 0.9*deep_water_oil +0.75*(shale_oil+condensate) + 0.6*tar_sand_oil + 0.2*ethanol
where coefficients (I do not claim that they are accurate; they are provided just for demonstration) reflect EROEI of particular types of oil.
If we assume that 58% of the US oil production is shale oil and condensate then the amount of "normalized" oil extracted in the USA can be approximated by the formula
total * 0.83
In other words 17% of the volume is a fiction. Simplifying it was spent on extraction of shale oil and condensate (for concentrate lower energy content might justify lower coefficient; but for simplicity we assume that it is equal to shale oil).
Among other things that means that 1970 peak of production probably was never exceeded.
3. EROEI of most types of oil continues to decline (from 35 in 1999 to 18 in 2006 according to http://www.euanmearns.com/wp-content/uploads/2016/05/eroeihalletal.png). Which means that in reality physical volume became a very deceptive metric as you need to sink more and more money/energy into producing every single barrel and that fact is not reflected in the volume. In other words, the barrel of shale oil is already 50% empty when it was lifted to the ground (aka "subprime oil"). In this sense, shale wells with their three years of the high producing period are simply money dumping grounds for money in comparison with Saudi oil wells.
4. The higher price does not solve the problem of the decline of EROEI. It just allows the allocation of a larger portion of national wealth to the oil extraction putting the rest of the economy into permanent stagnation.
5. If we assume average EROEI equal 3 (or even 5) for shale oil then rising shale oil production along with almost constant world oil production is clearly a Pyrrhic victory. Again, putting a single curve for all types of oil is the number racket, or voodoo dances around the fire.
NOTES:
1. IMHO Ron made a correct observation about Saudi behavior: the declines of production can well be masked under pretention of meeting the quota to save face. That might be true about OPEC and Russia as a whole too. Exceptions like Iraq only confirm the rule.
2. EROEI of lithium battery is around 32
Jul 10, 2018 | oilprice.com
"Investors who had egged on management teams to reign in capex and return cash will lament the underinvestment in the industry," the analysts wrote . "Any shortfall in supply will result in a super-spike in prices, potentially much larger than the $150 a barrel spike witnessed in 2008."
... ... ...
Of course, for many, this is a problem for another day. The oil market is arguably facing a supply crisis right now. Until recently, the oil market assumed a loss of about 0.5 mb/d from Iran because of U.S. sanctions. But statements from the U.S. government about "zero tolerance" towards Iran could mean that those losses will end up being much higher. Just by shifting the supply outages from 0.5 to 1 mb/d would translate into an oil price increase of about $8 to $9 per barrel, according to Bank of America Merrill Lynch."We estimate that every million b/d shift in [supply and demand] balances would push the oil price by $17/bbl on average. So based on those assumptions, we estimate zero Iran exports could push oil up by $50/bbl if Saudi caps out. We expect in this game of chicken, someone will blink before that happens."
In other words, if Saudi Arabia is unable to plug the deficit, the U.S. would likely have to back down on its "zero tolerance" policy towards Iran. The oil market is too tight, and the supply gap would be too large. Cutting Iran exports by that much, in an increasingly tight oil market, would send prices skyrocketing, something that the Trump administration probably won't be able to stomach. If Trump proceeded, a price spike of that magnitude would lead to a meltdown in demand.
By Nick Cunningham of Oilprice.com
Mar 03, 2017 | peakoilbarrel.com
steve from virginia says: 02/24/2017 at 6:28 pmNobody uses AA batteries as a prime mover. People buy the batteries for their convenience.Cunning Linguist says: 02/25/2017 at 6:17 amThe next question is 'what is pay'?
Money is just a promise to borrow again later. That (empty) promise cannot put oil in the ground, in fact, nothing can. If the amount of work needed to lift oil is greater than the work that can be done with the oil the enterprise breaks down. At present the money system is unraveling due to the need for borrowings that are greater than what any number of promises can deliver. There is not enough borrowing and the oil remains in the ground because it is unaffordable.
Basically, this is what Exxon said in not so many words the other day when it wrote off 15% of its reserves.
"If the amount of work needed to lift oil is greater than the work that can be done with the oil the enterprise breaks down."George Kaplan says: 02/25/2017 at 9:26 am
~steve from virginiaSteve is absolutely correct on this.
If the mass (oil and water) and heat removed from a control volume (oil reservoir) are known, then the Entropy Rate Balance Equation For Control Volumes can be used to calculate the exact amount of energy expended in the process. Simple. This is the Energy Invested (EI) part of the ERoEI of oil.
The chemical energy of the oil, released through it's combustion, is the Energy Returned (ER).
It is pretty obvious that most people here simply don't understand even the most basic concepts of physics, or the Etp model, at all. The article by SK is total gibberish. Amazing.
Out of interest what do you think about the spanish article linked in the first comment above, also by a highly qualified and experienced academic who specialises in thermodynamics?
Jan 23, 2017 | economistsview.typepad.com
libezkova -> point... January 23, 2017 at 05:05 PM , 2017 at 05:05 PMERoEI is an important concept here, that is usually ignored by solar enthusiasts. One problem with wind and solar is the EroEI is low:libezkova -> libezkova... , January 23, 2017 at 05:11 PMhttps://en.wikipedia.org/wiki/Energy_returned_on_energy_invested
== quote ==
In physics, energy economics, and ecological energetics, energy returned on energy invested (EROEI or ERoEI); or energy return on investment (EROI), is the ratio of the amount of usable energy (the exergy) delivered from a particular energy resource to the amount of exergy used to obtain that energy resource.[1][2] It is a distinct measure from energy efficiency as it does not measure the primary energy inputs to the system, only usable energy.
A fuel or energy must have an EROEI ratio of at least 3:1 to be considered viable as a prominent fuel or energy source.[3][4]
EROEI = (Energy Delivered)/(Energy Required to Deliver that Energy)
When the EROEI of a resource is less than or equal to one, that energy source becomes a net "energy sink", and can no longer be used as a source of energy, but depending on the system might be useful for energy storage (for example a battery). A related measure Energy Store On Energy Invested (ESOEI) is used to analyze storage systems.[6][7]
A useful comment fromhttps://www.scientificamerican.com/article/eroi-behind-numbers-energy-return-investment/
== quote ==
3. Cliff Claven May 18, 2013This article does a good job of introducing a very complex subject, but a bad job of actually comparing alternatives. As the author lays out, there are EROIs, FERs, EERs and other measures of energy balance that all have different boundaries and tell a different story. One cannot cherry-pick one source's EROI to compare with another's EER. It is long past time, but the physics community is finally getting involved.
There is an excellent paper just published that goes the furthest yet in developing a rigorous, apples-to-apples comparison of electrical power generations alternatives (Weißbach et al. "Energy Intensities, EROIs (energy Returned on Invested), and Energy Payback Times of Electricity Generating Power Plants." Energy 52 (April 1, 2013): 210–221. doi:10.1016/j.energy.2013.01.029).
The key they have found is to normalize not just across power quantity, but also quality.
A key aspect of quality is "usability," which is the degree to which the supply of power matches the real-time demand. Intermittent and invariable baseload power sources must be adjusted for the amount of buffering necessary to match their output to the real world of variable demand.
The study authors did this by requiring each source to have the overcapacity and storage necessary to be compatible with a large international European grid scenario, and they used pumped-hydro power storage parameters since it is today's most cost-effective option for storage and buffering. The study is behind a paywall but the results have been posted online and are being updated as newer data is reviewed ( https://docs.google.com/spreadsheet/ccc?key=0Aux2QwQckeWEdE9UbHNKR3l6THItNi1RTUdxa1RrdUE#gid=0). In their analysis, they found that a minimum EROI of 7:1 was necessary for economic viability. With that in mind, here are their results:
- PV solar 2.3:1
- Biomass Boiler: 3.5:1
- Onshore Wind: 3.9:1
- CSP Solar : 9.6:1
- Natural Gas: 28:1
- Coal: 30:1
- Run-of-River Hydro: 35:1
- PWR Nuclear: 75:1
Oct 30, 2016 | peakoilbarrel.com
Rune Likvern: 10/28/2016 at 11:28 pmVK says: 10/29/2016 at 11:09 amI will continue with Volve (by North Sea standards a small and marginal discovery/field) which is an oil field that NPD now reports as shut down.
For 2015 Volve (discovered in 1993 and started in 2008) had an estimated operational EROEI of close to 12 (at the consumer end!).
The full life cycle EROEI for Volve is at an estimated 9 at the consumer level.So before anyone starts any discussions about boundaries this estimate includes everything from those starting to prepare the documentation to apply for the license (akind like engaging landmen), to shooting seismics and interpreting seismics, to planning and drilling wildcats and appraisal wells, total 5, to development building of the production installation and drilling producers, observer wells and water injectors (20) and all planning involved and operations, transport to refineries, refining and distribution to consumers.
I would strongly argue that going beyond what it takes to get all those involved to and from office, heliport or harbor is moving the boundaries to what is called society to further some agenda (or to display pure incompetence). Those engaged in these activities (operating Volve) have to purchase the end products at the same conditions as everyone else.
Assuming Volve in total and on average engages 400 persons (this includes several shifts offshore, support and administrative functions onshore (which are less energy intensive).
If these 400 persons (representing roughly the same amount of households) annually used about 1,200 liter gasoline with a heating value about 35 MJ/liter this would amount to about 16 TJ (Tera Joules (Tera; exp12) in a year.
In 2015 Volve extracted a gross of about 36.5 PJ (PJ, Peta Joules (Peta; exp15), in other words, those involved in the operations of Volve consumed an estimated privately and directly 0.044% of the energy extracted from Volve in the form of petroleum. No matter how this is tweaked without consideration of the contribution from other energy sources the energy consumed by those involved in the operations will amount to something which borders insignificant.
This should illustrate how preposterous Arnoux's claim is about the energy used by the oil companies in 2015 left the societies with only 8% of what was totally extracted.
(I got a lot more coming. Someone sent me the Hills Group report……. as a gift.)
 Thanks Rune, look forward to your analysis. The wide boundary condition for the oil sector involves close to 1.5 Billion people in the Hills Group Report from Steve's interview with Louis Arnoux. So technically the whole of Norway could well be involved in the extraction of oil from Volve. The boundary conditions are waaaay too wide.Rune Likvern says: 10/29/2016 at 12:32 pmVK, thanks.
I have pondered on responding to Steve's"Rune,
Did the Norwegian oil industry employ any people? Did they buy any pipe? Did they buy other supplies? Did they use any complex financial services? Did they use any large oil tankers? How many people built, service or run large tankers? I could go on and on.
This increased cost of energy in the entire system you continue to ignore.
Steve"
Yup, that is the kind of knee jerk reply I would expect from someone who does not know what he is talking about.
The oil industry (oil companies, petrochemical plants, oil refineries, oil service companies [Halliburton, Schlumberger etc], exploration firms, mechanical industry like shipyards (that also builds ships not directly involved in petroleum activities and exports products globally to other oil/gas producing countries), seismic companies, engineering firms, various suppliers including shipping, accommodation/cleaning and catering, transport and logistics employed about 300,000 people out of a population of 5.2 million of which about 2.6 million are employed. That is about 10% of the employed population are in some way engaged in the Norwegian petroleum activities.
Due to the collapse in the oil price about 30,000 jobs in the oil industry have been cut, and most of these former oil employees have found other (non oil related) jobs.
In 2015 Norway produced 1.95 Mb/d (including NGLs) and consumed 0.23 Mb/d (which also includes consumption for petroleum activities), a net export of 1.72 Mb/d.
In 2015 Norway produced 117.2 Gcm natural gas and consumed 4.8 Gcm (most in the petroleum sector), a net export of 112.4 Gcm. (World's third biggest net exporter of natural gas).
Norway during a "normal" year is also a net exporter of electricity. Until recently, Norway was also a net exporter of coal.
So apart from the oil industry, Norway has several aluminium plants (about 5% of global capacities), steel plants [which does not run on oil!], ferrous alloys, fish farming, ocean fisheries, farming, forestry (and derived industries like paper mills), shipping companies, airliners, telecom companies, weapon industry, construction, retail sales, tourism and then there is the public sector with health care, education, defense, railways, administrative functions of all kinds etc.
So out of about 10% of the employed population is somehow engaged along the logistics chain to explore, develop, operate and increasingly decommission fields.
And yes, there is no doubt that the energy industry is energy intensive (it takes energy to produce energy) and the energy intensive phase starts as a development is FIDed and not least during the operational phase. During the exploration and development phase one may say that the energy industry borrows energy from the society, but as demonstrated with Volve this energy is paid back within a few months after start up and from there societies enjoys a flow of surplus energy.
The oil companies surely would like the financial investment to be recovered this fast.
So let us say that about 25% of the Norwegian oil consumption in 2015 is used by 10% of those employed in the petroleum sector, this would mean 0.06 Mb/d is used by the oil industry to operate a flow of 1.95 Mb/d while exploring and developing discoveries. Then there are some energy consumption (losses) downstream the production facilities, that is from oil is pumped into tankers and delivered to refineries and further during refining and distribution to end consumers.
According to Arnoux just 0.16 Mb/d (8%) of this flow became useful (in 2015) for societies, that makes one wonder where (1.95 – 0.16 – 0.06) Mb/d = 1.73 Mb/d went (Yes some for transport, refining and distribution)?
Oct 28, 2016 | peakoilbarrel.com
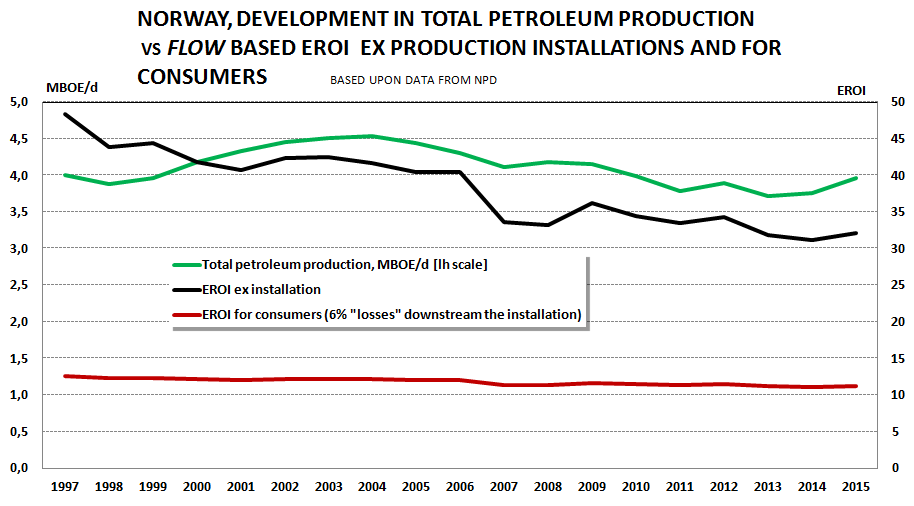
On EROEIEulenspiegel , 10/12/2016 at 10:28 amThe Norwegian Petroleum Directorate (NPD) has a lot of excellent statistics. One of these is annual CO2 emissions from combustion for power generation at the production installations. This makes it possible to derive estimates on flowing EROEI, both for all petroleum activities on the Norwegian shelf, but also for some individual fields.
Varg is an installation in the North Sea that is now being closed down and P&Aed and this happens as it produced about 8,500 boe/d (of which about 4 500 bo/d was crude oil and condensates).
Using data from an earlier year it was estimated that Varg used about 600 boe/d (primarily natural gas) to produce about 8,500 boe/d which results in a flow based EROEI of 14. The reason it is being shut down is that it has been running with a financial loss for about a year.
For all production in 2015 on NCS (about 4 mboe/d) it was found the flow based EROEI was just above 30 for 2015.
The EROEI for NCS has been in a slight decline.
EROEI is a lot more than the natural gas used to pump the oil – it't the steel of the platform, the special ships that towed it there, the pipes, the prospecting, the seismics, the driling, the Porsche the CEO drives (in fact all the people working there) and lots I forgot.Nick G , 10/12/2016 at 10:51 amthe Porsche the CEO drives (in fact all the people working there)Rune Likvern , 10/12/2016 at 11:37 amWell, probably you don't want to include the cars driven by employees. The boundaries of EROEI calculations are always difficult to draw, but…employees are people, and they're "ends", not "means". If they're not driving to this job, they'll be driving to another, or to the unemployment office.
Here's another way to think of it: commuting isn't part of the job. Employees could walk, bike, take the bus, live in an adjacent dorm (like in China) or drive an EV.
Eulenspieigel,Eulenspiegel , 10/12/2016 at 11:55 amThat is correct, but I was clear that this was about what is flowing and that is what matters in the near term. My point was also to show that a well/field is closed down long before its flowing EROEI reaches a level were it not delivers net energy.
The portion that takes the biggest portion of energy inputs of field developments is operations. When a discovery is developed the energy input for that is sunk. And what is wrong with using natural gas (and occasionally diesel) for the operations? Varg is operated by a floating process and storage vessel, and the ship Petrojarl may be used for other developments.
If I include helicopter transport of operators that would add an estimated 1 bo/d, which is well within the uncertainties. Transport of oil, the vessel has storage facilities for 470 000 barrels, which suggests the frequency of offloading. Recent production levels suggests offloading every 100 days.
I am willing to include other energy inputs if you are able to come up with good data.
Do you have references to other estimates that are more comprehensive?The cars of the employes add to EROEI – they could mine coal (perhaps with a better EROEI), or create Holywood films (then they are on the consuming side).Rune Likvern , 10/12/2016 at 12:11 pmAll ships(building and operating), helicopters, 100.000 tons of steel needed for operating and creating the wells + platforms + pipelines, the tanker fleet have to be added, if you want to compare the oil complex with coal, natgas, nuclear or solar for energy creating.
Coal you need other ships, with nuclear you need mines and safety personal and almost no ships, + electric wires + lots of police – or with wind building the thing, not much for operating, but hydro pump storage and wires. And all the people maintaining this.
So it's complex – I don't have numbers here, I think everyone can only guess.
I don't think oil has good numbers (besides Gulf oil), but is needed for transportation at the moment.
"I don't think oil has good numbers…"GoneFishing , 10/13/2016 at 9:08 am
So enlighten us what you think EROEI is for oil.
(Both flowing and for undeveloped discoveries)About 3.Watcher , 10/13/2016 at 11:33 amI've seen sub 4 oil sands numbers.George Kaplan , 10/12/2016 at 1:23 pmEveryone guesses except the Hills group, which gives the time we are going to go phht to within +/-4% apparently. If you are going to include the cars for the workers why not the trams used by the nursemaids who look after the babies of the workers who provide the machines that grind the flour that makes the bread that feeds the workers who build the cars for the workers on the oil rigs. EROEI is meaningless at that level. If you include all externalities then it is surely always going to be zero – all energy produced is used by the world: the endGoneFishing , 10/13/2016 at 9:18 amIf you are going to include the world then you must subtract out the useful energy provided by the sun, meaning we are running negative net energy.Nick G , 10/12/2016 at 2:46 pmThe cars of the employes add to EROEI – they could mine coal (perhaps with a better EROEI), or create Holywood films (then they are on the consuming side).Dennis Coyne , 10/12/2016 at 12:45 pmUS tax law may be helpful here: it defines an employee expense as a business expense when it is *mandated* by the employer. So, if an employer requires a uniform, then it's a business expense. If the employer requires you to drive to work, perhaps so you can inspect distant locations during work time, then it's a business expense.
Otherwise…it's your personal choice whether and how to commute, and it's not a business expense. Like that Porsche mentioned above: that's a purely personal choice.
Hi RuneRune Likvern , 10/12/2016 at 1:45 pmThanks.
I think the Hills group deducts thermal losses when the oil is burned and also includes transport, distribution and refining. So the 30 to 1 eroei would be reduced.
I don't have the data to estimate closely, but maybe 15 to one or less using a more comprehensive eroei analysis.
Dennis,Nick G , 10/12/2016 at 4:35 pmIn the estimates I presented the output is the ratio of gross produced on gross invested.
Yes, there are thermal losses as the producers and consumers spend their products so this ratio could change depending on who uses the energy most efficient. If thermal losses are equal, the EROEI remains.
As you point out there are other looses further downstream in the value chain, like (for the North Sea) helicopters, supply and stand by ships, work done in workshops on land, facility modifications, energy used for transport, refining, distribution to name some of the big ones
For transport (oil and gas, North Sea) the losses are about 1%, not sure for refineries (and distribution), but when I started to add those that was easy to check I found it hard to get the total losses above 10% (post the production installation), meaning that EROEI based on NPD emissions data shall come down as we move down the value chain.
The point with the exercise is to demonstrate that wells/fields are shut down while they still have a "high" EROEI.
We could take this further and also show how price moves the EROEI.
Rune,Rune Likvern , 10/12/2016 at 5:56 pmI think one puzzling question is why the Hill group thinks that falling EROEI would reduce the sales price of oil. If EROEI falls, then producer costs rise. If producer costs rise, that can only increase the price of oil.
To put it another way: producer costs are the business of producers, and are invisible to consumers. They won't affect demand.
Now, if consumers aren't willing to pay enough for producers to make a profit, then eventually oil production will fall. Falling supply is likely to raise the price.
Unless, of course, consumers have better and cheaper alternatives, like hybrids, EVs, car sharing, etc. Then oil prices would stagnate, production would fall, and eventually the oil industry would go away. Which would be a good thing assuming, again, that consumers have better alternatives.
And if they don't? Oil prices would rise…
Further up I said that a high price allows for a lower EROEI to become financially profitable.Dennis Coyne , 10/13/2016 at 11:27 amIn general costs for new oil (discoveries and developments) are on an upward trajectory. Growing unit costs acts as a proxy for lower EROEI.
A declining EROEI decreases surplus energy available for society which and all things equal would increase the price."If producer costs rise, that can only increase the price of oil."
Yes, if the pricing power is with the producer. The collapse of the oil price was supplies running ahead of consumption temporarily shifting pricing power to the consumer.
"Now, if consumers aren't willing to pay enough for producers to make a profit, then eventually oil production will fall. Falling supply is likely to raise the price."I agree and we are moving into this territory.
Hi Rune,Rune Likvern , 10/13/2016 at 12:41 pmYour numbers are very helpful. I have difficultly finding all the wonderful details at the NPD website. I assume you know far more about what is available there than I do. I was not sure if other information such as the average CAPEX per barrel produced is known or other energy inputs for electricity (although it may all be generated on site). If most of the C+C output is used for land transportation and the average vehicle gets 33% of the energy as work turning a shaft, the 30:1 EROEI is reduced to about 10:1. For natural gas some is used for heating (about 95% efficiency) and some for producing electricity (maybe about 50% efficiency), if we assume for simplicity it is split 50:50 for heat vs electric power, the EROEI would be about 20:1 for natural gas. Not sure on NGLs, a lot of those may be used in the chemical industry so EROEI is not relevant for that portion, the rest would probably be used for heating and might be close to 30:1.
I agree refining, distribution, and transport for North Sea oil probably doesn't change the picture very much, and you would know much better than me what is happening in Norway.
The other point that the Hills Group seems to miss is that net energy has very little to do with the price of oil. Even if net energy was zero or negative, if consumers need liquid fuel to use their cars, there will be a demand for oil and the price will depend on both the cost (in money) to produce the oil and the price that consumers are willing and able to pay.
What I have presented is gross energy output on gross energy input (no thermodynamic adjustments).Nick G , 10/13/2016 at 3:14 pmShould adjustments for thermal efficiencies be used to estimate EROEI that requires it is also applied with the producers. The producers may obtain/suffer from efficiencies of scale as natural gas/distillates can both be used for electricity generation and process heat from the exhaust gases.
Further natural gas exported from the installations goes mostly to heating (90+% thermal efficiencies) and power generation with thermal efficiencies as high as 60+%, depending on process/technology used.
Not sure how the average vehicle is defined, but if that means a normal household ICE car it gets a thermodynamic efficiency of about 25-30% when running at its best operational point, so the average is much dependent on the driving conditions (idling the car get a thermodynamic efficiency close to zero, but produces heat which may be useful when cold).
How the products are used by the end users (and their sizes) very much dictates how efficient oil and natural gas is used.
Short story you need to find the average weighted thermodynamic efficiencies for all the products used by the end users.NPD lists nominal investments (CAPEX) for each field and by year. NPD also list production numbers (for crude oil, natural gas, NGL and condensates) both monthly and annual.
What I presented is EROEI on gross returned on grossed invested.
With good data on annual CO2 emissions (in tons) it is possible to estimate gross (and net) input at the field.Assuming stochiometric combustion simply divide the CO2 emissions in weight by the specific weight of CO2 and out comes the volume of natural gas (Sm3) or diesel (litres) used in that year to power the production installation. It even includes gas flared as this is part of normal operations to produce oil and gas.
In Norway there is a CO2 tax in place which makes it possible to keep account of CO2 emission and SOX, NOX, methane etc.It is in theory possible to financially profitable operate a system with no or negative energy return due to price arbitrage simplistic illustrated below.
6 Mcf (1 boe) of natural gas is required to produce 1 bo (of some oil) and nat gas price is very low relative to oil.
So assuming the nat gas (used in the process [supplying both electricity and process heat]) with about 90% thermal efficiency, that is it gives 0.9 boe net energy.
The extracted barrel of oil (just assuming all of it becomes transport fuel) yields 0.25 boe of net useful energy (the other 0.75 boe becomes waste heat not used).
Gross input 1 boe (6 Mcf gas), gross output 1 bo.
Net useful input 0.9 boe, net useful output 0.25 boe.I don't think it makes sense to include the efficiencies of consumer applications. What matters for EROEI analysis is the ratio of inputs to outputs, and the outputs are at the point of delivery to the consumer. If the consumer wants to burn it, or bathe in it, it doesn't matter.Rune Likvern , 10/13/2016 at 5:45 pmHere's another way to think about it: from the point of view of a physicist, the efficiency of transportation is zero. Transportation moves (aka translates) an object from one point to another, but all of the energy is turned into heat of friction. No energy remains, so efficiency is zero. The output is the increased value to the user of having the object in a different place, but that value is completely subjective. Physically, it's a complete waste.
That is one of the reasons I found it useful to look at EROEI ex the installations (alternatively at distribution).Rune Likvern , 10/12/2016 at 6:10 pmEx installations gives a good baseline.
I will continue with Varg, as this is a very god example supported with good data to illustrate how wells/fields are shut down while they still have a "high" EROEI.Rune Likvern , 10/12/2016 at 6:31 pm
Using NPD data Varg had an EROEI (flowing) somewhere between 14 and 15 (ex the installation) as it was shut down.Having looked at some data for transport, refining and distribution (reaching end consumers) I found that about 6% (look upon that as an average number as there will be differences due to geography, modes of transport (trucking assumed with 5 mpg), distance from refinery to distributor etc) of the energy leaving the platform became unavailable to the consumers due to downstream "losses".
This results in an EROEI (based on flow) of about 8 (from the Varg reservoir to consumer; 7 boe of 8 boe is surplus energy). Higher oil/gas price could have kept Varg in operation at a lower EROEI.
Chart below shows development in estimated EROEI ex installations in Norway and for consumers.Dennis Coyne , 10/13/2016 at 12:40 pm
Note how slowly EROEI declines (I am not sure of the reason for the step down in 2007).
NOTES
1) NPD reports CO2 equivalents which also includes methane emissions (makes the EROEI slightly lower) and for 2015, 95% of the emissions was CO2.
2) Some of the installations uses hydroelectricity (makes the EROEI estimates somewhat higher).
These effects will to some degree cancel out each other.
 Thanks.trumphillarybad , 10/13/2016 at 11:48 pm
Very interesting analysis, as always.
I have been saying and M.King Hubert has said that too that we should trade energy instead of money. Money and debt is a completely outdated system.Survivalist , 10/12/2016 at 8:14 pmFor example, let's say one barrel of oil contain 10 BTU. Let's say that it takes 10 BTU to produce one pound of potato. So one barrel of oil buy 1 pound of potato. You exchange energy credit instead of money. Moving into an economical BTU based system of energy will also allow the see where the energy goes and where to cut useless stuff. Net energy credit get deposit into country central bank.
Something like that, just some thought I had thinking about how to change the trade system.
Anyway, I think it is too late now, the depletion is to advance to do that. It should have been done during 1970.OPEC MOMR is outGeorge Kaplan , 10/13/2016 at 6:07 am
OPEC up 220,ooo barrels per day.Iraq up 105,000
Libya up 92,000
Nigeria up 95,000
Iran up 21,000
Kuwait up 16,000
Saudia down 87,000
Venezuela down 18,000
Angola down 14,000
Gabon down 10,000How is Ecuador maintaining production? They must have some really good pumps or something.Fred Magyar , 10/13/2016 at 7:53 amHow is Ecuador maintaining production?shallow sand , 10/13/2016 at 9:17 amMaybe their pumps are being powered by hydro, wind and solar

Ecuador's 2008 Constitution explicitly states
that the government will promote the use of
clean and alternative energy sources, in
addition to energy efficiency, while providing
access to public services, preserving the
environment and maintaining food and water
security, among others.…The regulatory framework for electricity is the
Electric Law of 2015, which explicitly states the
objective of promoting renewable energy
sources, including solid-waste biomass. This
law establishes that the Ministry of Electricity
and Renewable Energy (Ministerio de
Electricidad y Energía Renovable – MEER) is the
governmental entity in charge of the
regulation and planning of the entire power
sector of the country, and hence carries the
responsibility of renewable energy promotion.
The law provides for preferential regulations
for renewable energy, which are still under
development by the newly created electricity
agency (ARCONEL) and expected in the second
half of 2015.Perhaps Correa has seen the writing on the wall and unlike Chavez and Maduro in Venezuela understands that hitching the economy exclusively to oil is sure way to political turmoil and strife and not conducive to his long term maintenance of personal power. I guess time will tell but I have a hunch that diversifying Ecuador's energy portfolio will only give Ecuador and its people a better chance at weathering the future storms of economic collapse due to 'Peak Oil'. If it works, the people of Ecuador may look the other way as Correa continues to consolidate his personal political power.
Ron/Dennis.Nathanael , 10/20/2016 at 10:39 pmI note EIA is no longer including crude lease stocks in inventory.
What is your take on this reporting change?
Really, all that matters is *economically recoverable* reserves, where *economically recoverable* is determined by the price of alternatives. Which means all these numbers are way too high. Reply
Oct 28, 2016 | peakoilbarrel.com
George Kaplan , 10/11/2016 at 4:36 amThe numbers are even harder to understand looking at some of the other individual countries. China and Mexico are in rapid decline at the moment but are supposed to have respectively, contingent 10 and 8 Gb and undiscovered 17 and 56 (!) – that has to be assuming a big shale resource for Mexico I'd guess.George Kaplan , 10/10/2016 at 3:49 pmChina has more rigs relative to its production than anywhere and this year is probably going to drill the most wells of any country. And yet they haven't found a new oil field for many years (quite a bit of gas though) and have only bought on a couple of small offshore fields recently. Mexico has decided they need help from outside IOCs to find and develop all that resource.
Norway and UK combined have developed a lot of their older contingent fields over the last few years, at very high cost and in some cases are now losing money on the investment.
Exploration success is now very low, reserve are being downgraded and yet they are supposed to have 7 + 4 Gb contingent and 13 + 6 Gb undiscovered. The 13 Gb for Norway includes frontier territory in the Barents Sea, but I think it's turning out that there is more gas there (TBC).
It will be interesting to see the final discovery number for this year from IHS, Richmond Energy Partners, Rystad and Wood Mackenzie. I doubt if they will include the recent Alaska discovery given that the test well wasn't flowed – the announcement looks to be more of a ploy to get some tax break and/or outside money into the private company. The other supposed monster find by Apache in Permian shale is 3 Gb equivalent oil in place, I'd expect it to be at the lower end for shale recovery, say 3 to 5%, so that could be only around 75 to 125 mmbbbls oil.George Kaplan , 10/11/2016 at 2:52 amIn GoM Fort Sumter was 125 mmbbls (equivalent) but it cn only be developed through Appomatox so might be many years away before there is processing capacity for it. Anadarko announced Caisco, but with no numbers which is usually a bad sign. On the other hand Hopkins looks to have been downgraded maybe 50%, so it is only a tie back option. Kaskida has gone quiet (HTHP and high sand), Shenandoah/Coronado (very HTHP probably needing 20 ksi wellheads) looks like it might be relatively smaller as a development than expected (or a series of smaller projects) , Freeport MacMoran projects (such as Horn Mountain Deep) are all on hold while it tries to sell up. Next year there is only Thunder Horse extension (27,000 bpd) and the year after Stampede (75,000) and Big Foot (80,000) ramping up in late 2018 through 2019.
A couple of highly anticipated and expensive frontier wildcats have been dry (Total offshore Uruguay and Shell offshore Nova Scotia – still drilling a second well there though). The Bight Basin in Australia is delayed because of environmental concerns.
The biggest two confirmed finds are gas offshore Angola and Senegal (400+ and 800+ mmboe respectively), both probably need to be developed through LNG so might be years away given the current glut and normal schedules for such projects).
In the North Sea reserves have been downgraded, not only because of price but also as some of the smaller finds no longer have options for tie backs because the possible hubs are coming to the end of their lives an new finds are in the 20 to 50 mmbbls range and heavy (also a number of dry wells there). I'd say it will likely be significantly worse than last year (which was the worst for 70 years) for both oil and gas discoveries.
At some point soon there's surely going to be realisation, maybe starting with the investors, that oil and gas industry BAU as it's been for the past 40 odd years is over and isn't going to come back the same no matter what the oil price does. I don't know what comes in it's place though.
By coincidence, this morning: "BP dumps plans to drill for oil in the Great Australian Bight"Matt Mushalik , 10/10/2016 at 4:10 pmI did this post on Rystad's oil reserves:Dennis Coyne , 10/11/2016 at 12:31 pm19/8/2016
Oil reserves and resources as function of oil price
http://crudeoilpeak.info/oil-reserves-and-resources-as-function-of-oil-priceOn US inventories:
8/10/2016
U.S. Storage Filling Up with Unaccounted-For Oil
http://crudeoilpeak.info/u-s-storage-filling-up-with-unaccounted-for-oilThanks Matt.Dean , 10/12/2016 at 3:16 amGreat job. Both pieces are excellent in my opinion (which has been the case for everything I have read which you have written).
Hi Matt, thanks for the interesting posts. I sent a comment to Art Berman to both his websites (artberman.com and forbes.com) about the post dealing with the unaccounted oil storage and I report it below (the comment is not yet visible there):SRSrocco , 10/10/2016 at 4:21 pm"Hi Art,
I agree with most of your article, but I would like to point out your attention to a possible explanation which can account for part of the unaccounted oil storage.
In the last 4 years, I have developed a methodology to re-construct the "real" Texas oil and gas production data using the data published by the Texas RRC: as it is well known, these data are only preliminary and it may take up to 2 years to have the final estimates. My method has proved to be reliable over time, providing estimates of Texas oil production very close to the final data and much earlier than the latter are published. Moreover, these estimates proved to be closer to the real data than the official EIA data for Texas: for example, on the 31/08/2016, with more than a 1-year delay, the EIA revised its Texas data for 2014 and 2015 and aligned it to my corrected Texas RRC data.
See below for more details about my methodology,
https://sites.google.com/site/deanfantazzini/nowcasting-texas-rrc-oil-and-gas-data-ongoing-project
and here for the latest update and additional comments on my methodology:
http://peakoilbarrel.com/texas-oil-and-natural-gas-update-sept-2016/
Having said that, if we compare my corrected Texas RRC data with the EIA data, it is visible that the EIA has started to increasingly underestimate Texas crudeoil production data since July 2015, and the cumulative sum of this discrepancy is approximately 46 million barrels.
Of course, this does not explain all unaccounted oil storage, and I agree with you that the real inventories are probably much lower than what is reported. However, one (minor) reason is the underestimated EIA production data for Texas. Thanks"
I would imagine the reserve numbers by Rystad Energy are likely to be more FICTION than REALITY. I spent a few hours talking to Bedford Hill of the Hills Group on their "Thermodynamic Oil Collapse" model, and the more I find out about it, the more I am convinced the reserve numbers shown in the table above are completely out of touch with reality.Rune Likvern , 10/10/2016 at 5:33 pmThe reason the Hills Group decided to design the software model to forecast the Thermodynamic oil Limit was due to one of the members losing money when a shale oil company overstated reserves by a wide margin. Thus, these engineers were tired of the crapola put out by either the EIA or the companies themselves.
It took several years and about 10,000 hours to create this ETP Oil price model as well as the Thermodynamic Oil Limit model. After they hit "ENTER", it took several hours before the results came out. From what Bedford told me, the results were so shocking, that they decided to sit on them for a few years before publishing.
From what I understand, a small team of oil engineers helped design the program. I asked Bedford how many of the engineers DID NOT AGREE with the results. He replied by saying, "Not one disagreed."
Furthermore, The Hills Group sent their report to dozens of professors in leading colleges (mostly professors teaching Thermodynamics), and none of them disagreed with the results, even though some had questions on the data or inputs used.
There is this notion that SUPPLY & DEMAND will continue to be the leading driver in controlling the price of oil in the future. However, the rapidly falling EROI is destroying the remaining net energy, thus leaving very little supply. Thus, Thermodynamics has been and will be the leading economic driver of human economies, not supply and demand.
This new story of a huge oil discovery in Alaska is just more WHITE NOISE in a sea of worthless chatter. I wrote about this in my newest article, Delusional Mainstream Media Distorts The Disaster & Reality As We Head Over The Cliff: https://srsroccoreport.com/delusional-mainstream-media-news-distorts-the-disaster-reality-as-we-head-over-the-cliff/
I gather I will see replies suggesting that I am completely insane on this issue. That's fine. Nothing wrong with a little debate.
steve
Steve,SRSrocco , 10/10/2016 at 9:03 pmWould you care to elaborate more on the claim below and illustrate it by some numbers and real world examples?
"However, the rapidly falling EROI is destroying the remaining net energy, thus leaving very little supply."
Rune,Rune Likvern , 10/10/2016 at 9:50 pmAccording to the Hills Group Thermodynamic Oil Limit model, they took the total amount of energy in a barrel of oil and subtracted the waste heat. They then programmed into the software all the inputs from the oil industry. Bedford stated that according to the second law of Thermodynamics the amount of energy consumed in the production of oil continues to increase. Their model predicted the oil price collapse and forecasts that within a decade (+/- 4%) there will be no more net energy from a barrel of oil by the oil industry.
There is this notion that SUPPLY & DEMAND or CREDIT & DEBT have distorted this thermodynamic oil limit. While these factors have changed the oil production graph, the Hills Group model suggests this has not changed the date. What has changed is that we have pulled future oil production forward which will make the Seneca Cliff much steeper.
With Chevron, ConocoPhillips and ExxonMobil losing $18 billion in the first six months of 2016 after CAPEX and Dividends were paid reveals just how bad the situation has become in the Major Oil Companies.
Furthermore, the U.S. Energy Sector interest on the debt consumed 86% of their operating income in the first quarter of 2016. The situation is much worse than the market has realized.
Anyhow, I will be interviewing Bedford Hill and Louis Arnoux in a few weeks on their ETP Oil Price Model and Thermodynamic Oil Collapse.
steve
SRSrocco , 10/10/2016 at 10:18 pm"According to the Hills Group Thermodynamic Oil Limit model, they took the total amount of energy in a barrel of oil and subtracted the waste heat. They then programmed into the software all the inputs from the oil industry."And the explanation in English is? Burning oil will ultimately lead to some thermodynamic losses. Hint oil is about 30-33% the worlds total energy consumption.
"Their model predicted the oil price collapse and forecasts that within a decade (+/- 4%) there will be no more net energy from a barrel of oil by the oil industry."
Was the oil price collapse due to thermodynamic reasons? If that is so [no net energy from a barrel of oil within a decade (2026)], then there should already be several real world examples to support this with.
What portion of present global oil production (C+C) is consumed by the oil industry? Surely the Hills Group must have the estimates for that as they have projected the development for the next decade.
"With Chevron, ConocoPhillips and ExxonMobil losing $18 billion in the first six months of 2016 after CAPEX and Dividends were paid reveals just how bad the situation has become in the Major Oil Companies. "
Are you confusing losses/profits with cash flows? Using figures for only Q1 16 does not justify a trend and certainly not justify a conclusion or projection.
Rune,Caelan MacIntyre , 10/11/2016 at 3:12 amYes, I was referring to the companies Free Cash Flow minus Dividends. While one quarter does not justify a trend, the Hills Group forecasts the price of oil to fall to $12 by 2020. This is due to what a net barrel would be worth to the Global Industrialized World.
Rune, they have calculated the waste energy of a barrel of oil to be one-third. So, what remains is net energy. However, the energy cost to produce this energy has continued to increase since the world started producing oil.
The waste energy of a barrel of oil is missed by most economists or analysts when forecasting price.
Rune, you are more than welcome to check out the Hills Group work at the site here: http://thehillsgroup.org/
steve
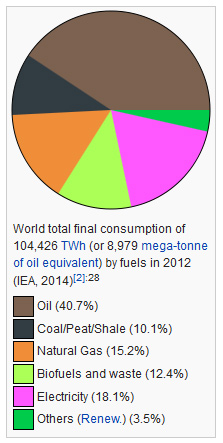
I am getting 40.7% for oil (in 2012?) and electricity is a secondary energy source, so I am wondering if the 40.7% includes some oil for that.Rune Likvern , 10/11/2016 at 8:24 am
Even so, how does that reflect the utility of oil, compared with the rest on that list? How well can the projection of political/military power and control be run on them?In any case, money/price, as a symbol, is a detachment from reality, along with too many human detachments from reality to list, so whatever the price of oil is, once thermodynamic reality and reality in general really start to kick in, the price of it, among a litany of other human detachments, won't matter anymore. I guess that's when things will be considered increasingly in the process of collapse or decline.
Steve, I am unsure about gold or silver by the way, since they are still mere symbols for reality (that rely on some sort of 'trust' of some system that may be dubious). Maybe they are more 'pegged' to it, but still symbols nonetheless, and so woefully-limited in their peg, their 'visceral tangibility'.
Also, as gold and silver are hoardable, would those who have and hoard more of it, such as governpimps and the elite, etc., be able to control it more, such as at the expense of those who have less of it?
I say, 'gift economy'. A real economy.
 Electricity is NOT an energy source – it is an energy carrier like hydrogen.Doug Leighton , 10/11/2016 at 9:14 am
BP SR 2016 has oil at about 33% of global energy consumption in 2015 which does not include biofuels and biomass.Electricity is considered a SECONDARY ENERGY SOURCE derived from whatever (nuclear power, wind, etc.). Of course, strictly speaking, electricity is just an accumulation OR motion of electrons. Therefore, a battery or a capacitor (accumulation of electrons) is a potential energy carrier.Rune Likvern , 10/11/2016 at 11:32 amI should have specified primary energy sources. Lumping together primary and secondary sources confuses the issue. Where in nature is there free electricity (apart from lightening)? Follow the flow and all energy is solar. :-)Rune Likvern , 10/11/2016 at 8:18 amTo some degree costs acts as a proxy for EROI. The general trend is for costlier oil.Caelan MacIntyre , 10/12/2016 at 3:51 am
Low priced oil => Higher (composite) EROI (Unprofitable oil is shut down)
High priced oil => Lower (composite) EROIThis article by Ron is about stocks and flows.
Thermodynamics is about flows.
– If net energy from oil move towards zero during the next decade, this implies that the oil companies would morph into giant heat engines and become bankrupt long before this (net energy becomes zero) happens.
Are there now any signs of this happening?– If EROI declines at the rate referred and estimated by the Hills Group, net oil (energy) would enter a steep decline and prices would move significantly and steadily up to reflect this.
It could be useful to present estimates at what EROI (based on flow) a well or field becomes shut in and later P&A ed.
Hi Rune,Rune Likvern , 10/12/2016 at 7:45 am'Cost', to me at least, is real and is different from 'price', which is symbolic, and 'Energy Returned on Energy Invested' is different than 'Energy Return On Investment', but I suppose it is treated the same to some.
Right now, from what has been read and understood at least, the 'money/finance/banking/BAU-cum-government-as-usual' clusterfuck of 'establishments' are looking very strange/bizarre/weird/crazy/etc. to the clusterfuck of many 'analysts/experts/pundits/etc.'. This seems indicative of an overlying symbolic/sociopolitical/socioeconomic (denialistic/extend-and-pretend) 'formative' response to an underlying thermodynamic issue/problem and maybe other problems as well, some as feedbacks/perturbations in/from the system.
Syria, Ukraine, ISIL, Brexit, national bankruptcies/debt crises, guaranteed income, refugees, etc….?
Along with the ostensibly-increasing and increasingly perverted financial smoke-and-mirrors, I wonder, in part, what the statistics are on company bankruptcies, takeovers and cannibalizations these days, as well as investments in so-called alternative energies.
Where's this stuff going?
Steve apparently says 'gold and silver', yes?, but I don't buy it (pun intended too) from a fundamental-problem-solving standpoint and neither should he.
Gold and silver seem just part of the same or similar scams, but just operate a little differently.Steve, if you're reading this, I noticed, under one of your articles on Zero Hedge, you arguing with some of the 'commentgentsia'…
Well, of coure, they know 'nothing', I know 'nothing', you know 'nothing' and Rune knows 'nothing'. Of course we know things, but we are all 'insignificant' cogs in this machined clusterfuck with limited autonomy and spending too much of our industrially-derived/putrified food energy and internet energy arguing about known unknowns and unknown knowns and what we and 'the others' know, don't know, think they know and want everyone to know, even if it's not true– whatever that means.
Alas, 'Leviathan', as Oldfarmermac has put it, will do what it has to to survive, come hell or high water or the puny little humans that it squishes along the way– maybe in its death throes. Why, there appear to be purveyors of Leviathan, or aspects thereof, right here on this very blog.
I just wish that I was not on the same ship, as I really dislike being dragged along for the ride.This comment was brought to you this week by the word, clusterfuck .
Caelan wrote;Caelan MacIntyre , 10/13/2016 at 2:03 pm"Where's this stuff going?"
That is something I observe a growing number of people wants to inform them about.
As we come to learn something we discover it is just a small piece of the BIG puzzle. We all have blind spots and are delusional.Sometime ago I watched some (BBC) documentaries about Keynes, Hayek and Marx and a very interesting interview with Bank of England's former director Sir Mervyn King (this appears to be a man of integrity and good moral compass).
There is one common message from all these;
"It is not possible to accurately predict human behavior."
Therein lies a very important bit of information.I hear you, Rune.Rune Likvern , 10/13/2016 at 5:41 pm
(That BBC piece might be on You Tube.)
Alas, it is of course impossible to predict anything with 100% certainty. If we could, then there would no consciousness, maybe no universe. And what fun would that be? 'u^Yes, the BBC 3 part series (from 2012) "Masters of Money" is available on YouTubeCaelan MacIntyre , 10/14/2016 at 1:32 am
First episode below
https://www.youtube.com/watch?v=nZNRfzkiiesAs Nate Hagens put it in one of his speeches:
"Embrace Uncertainties!" :-)Thanks for the link. While it is uncertain, I might have already seen it, as it rings a bell, but will check it out, just to be sure. 'u^George Kaplan , 10/11/2016 at 4:39 am" … within a decade (+/- 4%) there will be no more net energy from a barrel of oil by the oil industry."SRSrocco , 10/11/2016 at 10:46 amEROI is falling for new sources of oil but I don't know that it would count as "rapid" yet and it doesn't change much for already developed fields as they age – in fact if energy for the development stage is taken out then the EROI increases during operations.
If no more wells were drilled starting today then world oil production would fall at around 5%. So in a decade there would be 60% of current supply. The EROI on that wouldn't have changed much from today – there'd be proportionally a bit more water and gas to handle, but equally it could all go to the most efficient refineries. Therefore for the overall net energy to be zero would imply all new stuff bought on line is hugely negative. No such project would be even considered at conceptual stage and it would stand out a mile. The closest anything gets to that is Tar Sands where there is arbitrage from energy in natural gas converted to energy in synthetic oil, but while energy in gas is cheap this still makes sense (or made sense rather – as soon as the economics became bad, partly as a result of the net energy issues, the projects were stopped). So if new projects are so bad don't do them – the world might be in a mess at that point but the remaining oil would be a much sort after entity.
Also the shale reserve that initiated the study wasn't overstated because it's net energy was incorrectly estimated, it was because someone in the E&P company lied, or rather let's say 'dissimulated'.
George Kaplin,The reason much of the damage of the rapidly falling EROI is not made its way into global oil industry and the world financial-economic system is due to the massive amount of debt.
The Hills Group model calculates that the second law of Thermodynamics says that the amount of energy to produce oil has continued to increase since we started producing the liquid over 150 years ago.
They have developed this model showing the average increase in energy cost in terms of a barrel of oil. They remove the waste heat which is approximately one-third of the barrel. They model shows that within a decade, the Thermodynamic limit for oil will be reached, thus no net energy will be available.
Again, the massive amount of debt has distorted the global oil production curve, not the ultimate date of the thermodynamic collapse. So, we experience a much higher on violent SENECA CLIFF due to the massive amount of debt that has brought forward production.
You can check out their work here: http://thehillsgroup.org/
peakoilbarrel.com
Amatoori , 02/25/2016 at 11:40 am
http://in.reuters.com/article/oil-demand-kemp-idINL8N1644QUJef , 02/25/2016 at 6:28 pmNice piece of the puzzle Amat. Distillates is the glut.likbez , 02/25/2016 at 8:25 pmSO diesel demand has been tanking but gas remains strong. The economy is tanking but people are still driving around in circles.
Amatoori,Toolpush , 02/25/2016 at 10:40 pmVery good --
Some (albeit vague) support for a growing day-by-day "glut deniers" movement :-) . The newer part of the the argument revolves on fixed ratio of gasoline to distillate in refining process. Which supposedly caused a growth of distillate inventories due to weather induced low demand :
In the last year, U.S. refiners have been fairly successful in matching gasoline production and stockpiles with demand. Gasoline production remains at the centre of their operational planning.
Crude stocks have continued to increase, reflecting worldwide oversupply, though stockpiles are rising somewhat more slowly than at the start of 2015.But refiners lost control of distillate stocks in the second half of 2015 as freight demand slowed and El Nino ensured a warmer than normal winter across the United States and other parts of the northern hemisphere.
Winter heating demand across the United States has been around 17 percent below average, according to the National Oceanic and Atmospheric Administration.
And by the end of 2015, the volume of freight being moved across the United States by road, rail, pipeline, barge and air had fallen by more than 2 percent compared with the same period at year earlier.
Over the last four weeks, U.S. implied distillate consumption has averaged just 3.5 million barrels per day, which is 12 percent below the long-term average and 16 percent below the same period in 2015.
The fact that refiners have lost control of distillate stocks should come as no surprise because distillate is essentially a by-product of gasoline production.
Refineries have operated to maximise gasoline production but in the process created an enormous and growing oversupply of distillate.
There is some limited flexibility in the refining system to switch from distillate production to gasoline but it is typically only on the order of a few percentage points.
Massive overproduction of distillate has pushed gross refining margins for the fuel to the lowest level since 2010.
But refining margins for gasoline have been much healthier, at least until recently, which has encouraged refiners to continue maximising crude throughput.
As long as gasoline demand remains strong, refiners will continue to meet it, which is why the outlook for U.S. gasoline consumption is so critical for the oil market in 2016.
Amatoori,likbez , 02/25/2016 at 11:46 pmIt always surprises me, that when people talk about the year on year drop in diesel consumption, nobody mentions the fact of 1000 less drilling rig working, plus the lower demand from less fraccing, the transport of train loads of sand per well, etc.
I would have thought, the EROI boys would be all over it. As I feel this is where the theory of EROI being very low for unconventional oil and gas, actually starts to show up in day to day numbers.
Hi Toolpush,It always surprises me, that when people talk about the year on year drop in diesel consumption, nobody mentions the fact of 1000 less drilling rig working, plus the lower demand from less fraccing, the transport of train loads of sand per well, etc.
You made a very good point -- Thank you.
As EROEI boys are lazy bunch let me fill in. Let's assuming EROEI 10 for shale oil (which might be charitable; some sources claim 3-5)
https://en.wikipedia.org/wiki/Oil_shale_economics#Energy_usageA 1984 study estimated the EROEI of the different oil shale deposits to vary between 0.7–13.3:1.[21] More recent studies estimates the EROEI of oil shales to be 1–2:1 or 2–16:1 – depending on if self-energy is counted as a cost or internal energy is excluded and only purchased energy is counted as input.[20][22] According to the World Energy Outlook 2010, the EROEI of ex-situ processing is typically 4–5:1
So we need 4.2 gallon per bbl.
The EIA estimates in the Annual Energy Outlook 2015, that about 4.2 million barrels per day of crude oil were produced directly from tight oil resources in the United States in 2014.
So we are talking about 0.4 Mb/day of diesel consumption. Which is respectable 10% out of 4 Mb/d total US distillates consumption. So 2% drop (which amount to 20% drop of diesel consumption in oil patch) might be fully attributable to the lower activity of shale patch.
In other words you are right --
peakoilbarrel.com
Amatoori , 02/25/2016 at 11:40 am
http://in.reuters.com/article/oil-demand-kemp-idINL8N1644QUJef, 02/25/2016 at 6:28 pmNice piece of the puzzle Amat. Distillates is the glut.likbez, 02/25/2016 at 8:25 pmSO diesel demand has been tanking but gas remains strong. The economy is tanking but people are still driving around in circles.
Amatoori,Very good --
Some (albeit vague) support for a growing day-by-day "glut deniers" movement :-) . The newer part of the argument revolves around the fixed ratio of gasoline to distillate in refining process. Which supposedly caused a growth of distillate inventories due to the weather induced low demand :
In the last year, U.S. refiners have been fairly successful in matching gasoline production and stockpiles with demand. Gasoline production remains at the centre of their operational planning.
Crude stocks have continued to increase, reflecting worldwide oversupply, though stockpiles are rising somewhat more slowly than at the start of 2015.But refiners lost control of distillate stocks in the second half of 2015 as freight demand slowed and El Nino ensured a warmer than normal winter across the United States and other parts of the northern hemisphere.
Winter heating demand across the United States has been around 17 percent below average, according to the National Oceanic and Atmospheric Administration.
And by the end of 2015, the volume of freight being moved across the United States by road, rail, pipeline, barge and air had fallen by more than 2 percent compared with the same period at year earlier.
Over the last four weeks, U.S. implied distillate consumption has averaged just 3.5 million barrels per day, which is 12 percent below the long-term average and 16 percent below the same period in 2015.
The fact that refiners have lost control of distillate stocks should come as no surprise because distillate is essentially a by-product of gasoline production.
Refineries have operated to maximise gasoline production but in the process created an enormous and growing oversupply of distillate.
There is some limited flexibility in the refining system to switch from distillate production to gasoline but it is typically only on the order of a few percentage points.
Massive overproduction of distillate has pushed gross refining margins for the fuel to the lowest level since 2010.
But refining margins for gasoline have been much healthier, at least until recently, which has encouraged refiners to continue maximising crude throughput.
As long as gasoline demand remains strong, refiners will continue to meet it, which is why the outlook for U.S. gasoline consumption is so critical for the oil market in 2016.
Toolpush, 02/25/2016 at 10:40 pm
likbez, 02/25/2016 at 11:46 pmAmatoori,
It always surprises me, that when people talk about the year on year drop in diesel consumption, nobody mentions the fact of 1000 less drilling rig working, plus the lower demand from less fraccing, the transport of train loads of sand per well, etc.
I would have thought, the EROI boys would be all over it. As I feel this is where the theory of EROI being very low for unconventional oil and gas, actually starts to show up in day to day numbers.
Hi Toolpush,It always surprises me, that when people talk about the year on year drop in diesel consumption, nobody mentions the fact of 1000 less drilling rig working, plus the lower demand from less fraccing, the transport of train loads of sand per well, etc.
You made a very good point -- Thank you.
As EROEI boys are lazy bunch let me fill in. Let's assuming EROEI 10 for shale oil (which might be charitable; some sources claim 3-5)
https://en.wikipedia.org/wiki/Oil_shale_economics#Energy_usageA 1984 study estimated the EROEI of the different oil shale deposits to vary between 0.7–13.3:1.[21] More recent studies estimates the EROEI of oil shales to be 1–2:1 or 2–16:1 – depending on if self-energy is counted as a cost or internal energy is excluded and only purchased energy is counted as input.[20][22] According to the World Energy Outlook 2010, the EROEI of ex-situ processing is typically 4–5:1
So we need 4.2 gallon per bbl.
The EIA estimates in the Annual Energy Outlook 2015, that about 4.2 million barrels per day of crude oil were produced directly from tight oil resources in the United States in 2014.
So we are talking about 0.4 Mb/day of diesel consumption. Which is respectable 10% out of 4 Mb/d of the total US distillates consumption. So 2% drop (which amount to 20% drop of diesel consumption in oil patch) might be fully attributable to the lower activity of shale patch.
In other words you are right --
peakoilbarrel.com
Dennis Coyne, 01/28/2016 at 3:00 pm
likbez, 01/29/2016 at 10:43 amHi Jef,
The decision to produce or consume oil, natural gas, or coal is not decided based on EROEI, which is not very well measured, and estimates of EROEI vary a lot.
The EROEI concept applies to the economy as a whole for all energy resources. As long as the net energy of all energy used by the economic system is adequate to keep the system functioning then various types of energy will be produced as long as it can be done profitably (in money terms).
As net energy becomes scarce, energy in general will become more expensive and those types of energy with higher EROEI will become cheaper than low EROEI types of energy and society will move towards those types of energy.
In addition as energy becomes more expensive it will be used more efficiently.
The transition will be difficult, maybe not possible, but we will do the best we can.
On your "low price removes surplus", not really.
Low prices removes the highest cost energy, which has the lowest surplus energy, so very little surplus energy is removed by low prices.
If we look at the average amount of surplus energy per unit energy in the energy produced when energy prices are low, we would find that the surplus energy per unit energy produced had increased as the high cost (low surplus energy) production was shut down due to low energy prices.
Dennis,
"As long as the net energy of all energy used by the economic system is adequate to keep the system functioning then various types of energy will be produced as long as it can be done profitably (in money terms)."
Profitability is not enough. At some point quantity (price/EROEI) turns into quality ("secular stagnation"). Estimates vary but there is some evidence that EROEI in single digits is an invitation to troubles. Some researchers suggest that a minimum EROEI of 7 (average for all sources of energy used; individual sources can probably be lower if high EROEI sources are present in the mix) is necessary for avoiding "secular stagnation".
I site this from the comment to the article http://www.scientificamerican.com/article/eroi-behind-numbers-energy-return-investment/
This comment refers to the old 2013 paper that compared electrical power generations alternatives (Weißbach et al. "Energy Intensities, EROIs (energy Returned on Invested), and Energy Payback Times of Electricity Generating Power Plants." Energy 52 (April 1, 2013): 210–221. doi:10.1016/j.energy.2013.01.029).
the paper is behind pay wall but the link to the spreadsheet with result exists:
== quote ==
The key they have found is to normalize not just across power quantity, but also quality. A key aspect of quality is "usability," which is the degree to which the supply of power matches the real-time demand. Intermittent and invariable baseload power sources must be adjusted for the amount of buffering necessary to match their output to the real world of variable demand. The study authors did this by requiring each source to have the overcapacity and storage necessary to be compatible with a large international European grid scenario, and they used pumped-hydro power storage parameters since it is today's most cost-effective option for storage and buffering. The study is behind a paywall…
In their analysis, they found that a minimum EROI of 7:1 was necessary for economic viability. With that in mind, here are their results:
- PV solar 2.3:1
- Biomass Boiler: 3.5:1
- Onshore Wind: 3.9:1
- CSP Solar : 9.6:1
- Natural Gas: 28:1
- Coal: 30:1
- Run-of-River Hydro: 35:1
PWR Nuclear: 75:1
== end of quote ==BTW EROEI of ethanol is around 2 and oil sands below 7 which puts them at the bottom for liquid fuels
https://en.wikipedia.org/wiki/Oil_sands
== quote ==
Approximately 1.0–1.25 gigajoules (280–350 kWh) of energy is needed to extract a barrel of bitumen and upgrade it to synthetic crude. As of 2006, most of this is produced by burning natural gas.[57] Since a barrel of oil equivalent is about 6.117 gigajoules (1,699 kWh), its EROEI is 5–6. That means this extracts about 5 or 6 times as much energy as is consumed. Energy efficiency is expected to improve to average of 900 cubic feet (25 m3) of natural gas or 0.945 gigajoules (262 kWh) of energy per barrel by 2015, giving an EROEI of about 6.5.[58]oldfarmermac, 01/28/2016 at 8:17 pmCoyne – You are sounding more and more like a computer generated entity. Your response is no response at all. You dismiss all of what I said with a wave of your mouse.
I said energy AND revenue… you can't make a coherent argument by just considering one and then make another argument considering the other. Also trying to dismiss EROEI by stating that it is "not very well measured" is getting very old and is specious at best, EROEI does matter no matter what you say.
"As long as the net energy of all energy used by the economic system is adequate to keep the system functioning".
Well how well is the global economic system functioning? My Point AGAIN is it is obviously not functioning and to any degree that it is not out right collapsing is purely a function of financial/monetary policy and intervention which AGAIN is not news to anyone with a brain but has nothing to do with physical reality.
Hi Jef,Javier, 01/29/2016 at 5:08 amI thoroughly disagree. You sound a lot more like a man who has made his mind up,for good, and is unwilling to consider that he might not be in sole possession of the truth, the whole truth, and nothing but the truth, than Dennis Coyne.
EROEI is indeed not well measured, and estimates DO vary all over the place, especially when renewables are concerned.
I am not in the energy business, but for sure low prices tend to remove any excess production from any commodity market.
No doubt the world wide economy would be functioning BETTER if energy were cheaper, but there are MANY reasons it is not functioning too well these days, and there is no reason in particular, that I have seen that is clearly elucidated, to think THE KEY to current economic problems is the cost of energy.
I do agree that the cost of energy, and EROEI is A key to understanding economic issues and problems.
At one time, a few years back, I was sure the world would go to hell in a hand basket rather suddenly, with little warning, as the result of running short of various depleting natural resources, and still believe this MIGHT happen.
But while the fossil fuel age is going to be over in an eyeblink, in terms of history, it is still going to last out the next couple of generations of men, at the very least.
The amount of adaptation men are capable of in just ONE generation is almost beyond belief, when necessity puts the steel toed boot to the collective backside of a society.
EROEI is definitely important, but it is not a limit we are bumping up against, yet. Oil is still a bargain, in terms of the utility of it. The tar sands industry can BURN IT'S OWN feedstock, if necessary, and still deliver millions of barrels a day to market, at a good profit, when oil goes back up to seventy or eighty bucks.
Renewable wind and solar power may actually scale up to the point that ENERGY IN hardly matters at all, because the "IN "will be free and non depleting.
I usually find it necessary to open a couple of windows in our sun room on sunny winter days even when it is only around freezing outside, or else it gets uncomfortably hot.
It's FREE energy, you see, and it costs NOTHING to waste it.;-)
As oil and gas prices double, we will eventually adapt and use oil and gas twice as efficiently, unless something upsets the Business As Usual apple cart before we have time enough to adapt. Dennis sees it, I see it, and just about anybody with an open mind sees it. Of course at some point, we will have to not only use energy more efficiently, we are simply going to have to use a LOT less all the way around, unless we hit the renewables jackpot………….
If I were young, I would be installing solar panels, and buying a used Volt or Leaf, and damned near free myself of the necessity of buying gasoline for personal purposes. I have already fixed up the old farmhouse to get by with a quarter of the energy we used to use to heat it, maybe less.
I don't think we need to measure EROEI, because I am of the opinion that EROEI is reflected quite well in the cost of production. For example Canadian synthoil has a very low EROEI, and that is reflected in its high input costs that give it a high break-even cost.oldfarmermac, 01/29/2016 at 7:30 amSimilarly renewables that require heavy subsidizing to be installed are reflecting between other things a low EROEI.
So if we assume that true cost of production is a good proxy for EROEI the matter simplifies itself quite a lot. The true cost of production is a lot easier to calculate.
Well said, JavierYou expressed my thoughts about money and EROEI better than I did.
The only real hole in the argument of using money cost as a proxy is that sometimes one form of fossil fuel energy is a LOT cheaper than another, for instance the energy in natural gas sells for a lot less than the energy in oil.
This is because gas is not as useful as oil, for running cars and trucks, etc, but still relevant.
A product made using a lot of gas can sell cheaply enough that a lot of gas gets used up for trivial purposes, and gas gets burnt here in the USA, wasting most of it, heating poorly insulated houses and businesses.
peakoilbarrel.com
Javier , 01/16/2016 at 6:54 pmEveryday that it spends below $30 means a day that it has to spend significantly above $65 to give that average. In my humble opinion on a matter on which I am far from expertise, you are incorrect, Fernando. The economy cannot resist high oil prices right now, and I doubt the economy will improve that much in the coming months. If the global economy avoids a recession and improves, we might get an average between $40-$50. If not, it will be below $35. We will be swimming in oil that nobody can sell at the same time as production craters. A nightmarish scenario.AlexS , 01/16/2016 at 8:23 pmI do not think that oil price can reach $65 this year, not to say to average $65. But not because "The economy cannot resist high oil prices right now".Dennis Coyne , 01/16/2016 at 9:05 pmWhat is particularly wrong with the global economy, that it cannot afford $65? Do we have a worldwide recession?
China's economy is slowing not because of high oil prices, but because of long-term structural issues. Meanwhile, China's oil demand continues to grow.
Empirical evidence suggests that the "oil burden" (total amount of oil consumption X price of oil) becomes unaffordable for the global economy, when it reaches 5% of global GDP. At $65 it would be only between 2 and 2.5%.
The key reason for the current glut in the oil market is excess supply, not the weakness of the global economy.
Hi AlexS,Javier , 01/17/2016 at 7:05 amI agree $65/b average price seems too high, my guess would be $50/b for an average oil price, but $65/b by Dec 31 2015 seems possible, though I might guess $60/b for an average monthly price in Dec 2016.
Both Fernando and you know more about the industry than me, so both your guesses would be better.
Could you give us your guess for the average in 2016, it seems to be more than $30/b and less than $65/b based on previous comments, maybe $42.5/b ?
AlexS,Dennis Coyne , 01/16/2016 at 10:28 pmWhat is wrong with the global economy is that it is at the brink of global recession. The global economy was being sustained by strong debt-based growth in Chindia creating huge malinvestment there, manifested in ghost town projects. Whether China stabilizes or not, it is no longer capable of sustaining previous strong growth because of high indebtment and flow of capitals outside the country. OECD is in the midst of a deflationary situation with the economies temporarily stabilized by the collapse of oil prices, while all commodity exporting countries from the developing world are entering recession.
We were going directly towards a new global recession, when oil prices collapsed delaying it. But low oil prices are not a cure, they alleviate some symptoms while creating other serious problems.
I agree with Petro below that if oil price goes above $65 in the current situation, that would directly trigger a global recession. Since a global recession is the biggest fear to the economical powers of the world, oil prices are not going to be allowed to recover unless the global economy recovers.
I suppose it makes sense now why sanctions on Iran have been lifted at a time when the world does not need more oil, and when such a decision, pushed by the US and EU, was clearly going to worsen the situation of the US oil industry.
Oil prices have to remain depressed for the foreseeable future until a time when the economy improves enough to withstand higher oil prices. That time might not come. Alternatively oil prices could rise if the economic powers lose control of the situation. We definitely don't want that to happen.
Most people don't realize that most of the world is immersed in a deflationary crisis. A consumer crisis if you will. Due to long term unavoidable tendencies, population growth, robotics, globalization, there has been an excess supply of labor in the world. As a consequence labor has been cheated of their part of the increased wealth, and capital has retained the lion's share of it, giving rise to growing inequality. To compensate for their stagnated purchasing power, labor increased its debt load to saturation in many parts of the world. Japan was the first to enter the deflationary hole. Despite being a remarkable country with a lot of things in their favor, they have been unable to get out. Now most of OECD is joining and will drag the world's economy to the hole. This crisis has no solution, and Peak Oil will make sure our civilization never recovers.
Hi Fernando,Are you serious or just poking fun at me?
Even I think and average price for 2016 of $65/b is too high (the eternal optimist). I can see maybe $65/b by August 2016 (for the monthly average), but an average for 2016 of 55 to 60/b seems more reasonable, in my opinion. Though even that seems a little high, probably $50/b for 2016 would be my guess for the average 2016 oil price (WTI).
April 8, 2013 | The Oil Drum
JonReuters:
Nice article on Shell's projections, but the rule of thumb in business is that any projection beyond about 4 years is pretty worthless, much less 50+ years.
I wanted to post this next bit in the "Death of Peak Oil" thread but it's closed.
You might call it: "Peak Oil is not dead, it's sleeping!"
http://www.washingtonpost.com/blogs/wonkblog/wp/2013/04/13/peak-oil-isnt...
Peak oil isn't dead: An interview with Chris Nelder
CN: Not necessarily. In 2005, we reached 73 million barrels per day. Then, to increase production beyond that, the world had to double spending on oil production. In 2012, we're now spending $600 billion. The price of oil has tripled. And yet, for all that additional expenditure, we've only raised production 3 percent to 75 million barrels per day [since 2005].
JV:Luke HOil drilling depth have multiplied, offshore oil production has soared, and tar sands is actually being used to produce oil. We are past peak.
BoofThanks for the quick review, I'll have to look through the document. Your phrasing describing the power structure in the Oceans scenario was intriguing
This progress is seen as most likely through technological interconnection between entities that creates a new class of Mandarin who is less accountable to traditional masters. In this scenario, Shell sees the world increasingly run by more flexible and decentralized governments "that have embraced radical pathways to economic sustainability
Were giant global corporations (like Shell) classified as the traditional masters or the new Mandarins? Your phrasing kind of makes it sound like Shell sees the new Dutch East India Company's of the world as calling all the shots once they have usurped all the national powers that they found useful while discarding any responsibilities that might have been tied to those powers and concurrently delegating anything that might detract from the bottom line to the shell's of nations remaining so of course the costs could be spread away from the Company shareholders...oh that couldn't be the right interpretation as it is the ultimate outcome of continuing BAU and Oceans is all about shredding BAU if I understood you correctly.
I'd change the way all-liquids is defined just in case the cornucopians get over excited. One change would that liquids should be transport compatible. That is condensates like propane that are unlikely to make into petrol should be excluded. I realise LPG or autogas is a vehicle fuel but it is minor.
Secondly I would give each liquid a net energy weighting which I'd define as (e-1)/e where e = EROEI. If tar sands have an EROEI of 5 the weighting is 4/5. In other words knock off 20% from the number of barrels. If grain ethanol has EROEI of 1.25 the weighting would be 1/5. Check it. That combined series will be declining.
I have this idea that certain people have good hunches and Pickens may be one of them. The techno-optimists said the roads would be crammed with EVs by now but Pickens suggests NGVs could become popular.
A decade from now we'll know who is right. However if gas for transport is priced the same as petrol/diesel which is about $40 per GJ/mmbtu in Australia (including fuel excise) that price will be far too high for power stations and industrial gas users.
karlnick :
Weighting according to energy content and EROI really make sense.pi :
The recent reports of all the empty shelves in Walmart stores are an interesting case study in EROEI feedback and "biteback".After the 2008 financial crisis, Walmart laid off more than 100,000 workers in order to economize. Some of the shelves of their huge stores, built before 2008 to accommodate a more speedy, immense throughput (more embodied energy, that is) cannot be restocked. It is simply not worth it for Walmart to hire the people back to restock some shelves.
So what happens? People who used to drive to Walmart no longer do, because they burn too much gasoline going there to make the savings on goods worthwhile, since they cannot get all the items on their list anymore. The cycle is a vicious one, with economizing on the part of the customers leading to further restocking issues and more layoffs and reductions in time worked.
This is how we perceive EROEI---it's action on us is indirect---and to be sure, the same feedback mechanisms will claim (I mean stifle) economic activity at the tar sands and the shale plays, it is only a matter of time.
Overcapacity on all kinds of economic fronts is one way to see peak oil in action. And the analysts who deny peak oil are silent on the topic. Economics is not 'their sphere' of expertise, I am sure they would say.
Their ignorance of dependencies and feedback loops is their weakest and most vulnerable point.
Substrate:
"BTU arbitrage is real and we should not make the error of equating a BTU from coal with a BTU from WTI."JV:One of my favorite instances of "BTU arbitrage" can be found in the calculations this fellow did regarding the tar/oil/bitumen sands versus using the up-grade energy directly to charge the Chevy Volt.
http://www.hybridcars.com/the-oil-sands-surprising-new-nemesis-plug-in-v...
Let's use the 23.4 gallons figure to be generous. That's 301 kwh / 23.4 gal = 12.86 kwh /gal.
That's a 13 kwh of grid electricity that could have been delivered to your wall socket from the energy used to produce each gallon of oil sands based gasoline under ideal conditions. This doesn't take into account the energy used in finding, developing and finally repairing the environmental damage of the oil sands operation.
Accounting for average battery charge efficiency (see EPA sticker for each car), how much above the 23 mpg average can the new technology cars go on 13 kwhs from your wall socket? That's enough electricity for the Chevy Volt to go 37 miles, the same distance it can go burning the gasoline. The Nissan Leaf can go 38 miles, and the Tesla Model S 34 Miles. The Tesla family sedan also has the advantage of being able to spank many purpose-built sports cars such as the 10 mpg 500 hp Dodge Viper.
It appears that using natural gas and grid electricity to produce oil instead of applying it directly to our transportation needs is like feeding bread to a cow instead of grain. Yes it works, but it is an unnecessary and costly waste that only the baker benefits from.
If you include the energy efficiency of the power plant used to generate electricity, yes, in many cases electric doesn't compare favorably to a efficient diesel engine. If the electricity is generated by wind or solar, then electricity is a much better source.
The main problems with electric cars still being the availability of large volumes of electric vehicles and the fact that electric vehicle manufacture itself runs off the oil platform. Parts are delivered with vehicles or ships that use oil-based fuels.
Posted by patzek on November 19, 2012 - 1:26pm
[Editor's comment: This article is by Dr. Tad Patzek, chairman of the Department of Petroleum & Geosystems Engineering at The University of Texas at Austin. Dr. Patzek's research involves mathematical modeling of earth systems with emphasis on multiphase fluid flow physics and rock mechanics. He is also working on smart, process-based control of very large waterfloods in unconventional, low-permeability formations, and on the mechanics of hydrate-bearing sediments. In a broader context, Patzek works on the thermodynamics and ecology of human survival and energy supply schemes for humanity. He has participated in the global debate on energy supply schemes by giving hundreds of press interviews and appearing on the BBC, PBS, CBS, CNBC, ABC, NPR, etc., and giving invited lectures around the world. This article first appeared on Tad's blog Life Itself.]
Topic: Supply/Production
Tags: condensate, crude oil, demand, destruction, efficiency, energy, gain, independence, lpg, natural gas, petroleum, product, refineries, russia, saudi arabia, security, self-delusions [list all tags]Before I discuss the logic behind negating a peak of production of anything, let me sum up where we are in the U.S. in terms of crude oil production. According to the Energy Information Administration (EIA):
The United States consumed 18.8 million barrels per day (MMbd) of petroleum products during 2011, making us the world's largest petroleum consumer. The United States was third in crude oil production at 5.7 MMbd. But crude oil alone does not constitute all U.S. petroleum supplies. Significant gains occur, because crude oil expands in the refining process, liquid fuel is captured in the processing of natural gas, and we have other sources of liquid fuel, including biofuels. These additional supplies totaled 4.6 MMbd in 2011.
Let me parse this quote.
First, let's look at the history of oil production in the U.S., shown in the chart below. The vertical axis is scaled with a unit of power, exajoules (EJ) per year, very close to quadrillion BTUs (quads) per year. To convert from EJ/year to millions of barrels of crude oil per day (MMbopd), divide the vertical axis by roughly two, so 20 EJ/year is roughly equal to 10 MMbopd.
Historic production of crude oil in the U.S. is resolved into several Hubbert curves. The tallest one is the original Hubbert curve published in 1956. The smaller curves starting from 1960 were generated by producing shallow, deep and ultra-deep Gulf of Mexico, Alaska (mostly Prudhoe Bay), and then everything else that was not in the original curve: large waterflood projects, thermal and carbon dioxide enhanced oil recovery (EOR) projects, horizontal wells, hydrofractured wells, etc. The broad curve peaking in 2002 was introduced in late 2002, and the model represented fairly well the U.S. crude oil production until 2010. The last small green curve on the right was introduced last month to describe the Bakken and Eagle Ford shales, as well as the increased production of crude oil from the Permian Basin near Midland, TX. The right-most black curve depicts a hypothetical production of 7 billion barrels of oil from the Arctic Natural Wildlife Refuge (ANWR) in Alaska. So the last point on the blue step-line represents 5.7 MMbopd produced in the U.S. in 2011. This rate is predicted by EIA to grow to over 6 MMbopd in 2012.
Now, let's look at the refinery gains in the second chart. These gains arise because petroleum products are usually less dense than the crudes they are made from. Therefore, refinery gains are not really a replacement of imported crude oil, and demonstrate only that since 1993, the U.S. refining has been moving towards heavier crude oil feedstocks.
Oil refinery gains reported by EIA since 1993 hover around 1 million barrels of all petroleum products per day. These gains arise because the densities of petroleum products (gasoline, kerosene, diesel fuel, jet fuel, heating oil, etc.) are less than the density of crude oil they were made from. It is like making a low calorie butter or cheese from a normal butter or cheese by puffing them up with bubbles of air. Through refinery gains, we have not created new energy. Instead, we have just puffed up the crude oil feedstock by cracking heavier hydrocarbons and hydrogenation. Thus, refinery gains do not really count as a new source of energy, but only as a source of an increased volume of petroleum products.Corn ethanol comes next. I described the ethanol story completely in 2004, in my most popular paper ever. There was nothing new I would add in the intervening 8 years. Basically, ethanol is obtained from burning methane, coal, diesel fuel, gasoline, corn kernels, soil and environment. We destroy perhaps as many as 7 units of free energy in the environment and human economy to produce 1 unit of free energy as corn ethanol, and make a few clueless environmentalists happier and a few super rich corporations richer. The story is even worse for switchgrass ethanol. Finally, your mileage would drop by 33% if you were to use pure ethanol as a fuel for your car.
Production of corn ethanol in the U.S. Because ethanol has a lower heating value, its volume would be much lower when converted to equivalent crude oil.
Production of soybean biodiesel in the U.S. is too low to get excited. Production of soybean biodiesel in the U.S. is almost irrelevant, but also highly environmentally damaging. Since most of the obliteration of the irreplaceable biota occurs in the tropics, in Brazil, Argentina, Africa, and Asia Pacific, we really don't care. Either way, the rate of biodiesel production in the U.S. is too low to write home about it.
In summary, of the 4.6 million barrels of the other "oil" produced in 2011, 1.1 MMbopd were refinery gains, and another 0.6 MMbopd was the equivalent volume of oil corresponding to the production of roughly 0.9 MMbpd of ethanol. Biodiesel production was in the noise. I fear that EIA simply added volumes of the various fuels without converting them to oil equivalents based on a common oil density and heating value. The rest of the other "oil", 2.9 or 2.6 million barrels of oil equivalent (again I do not know how EIA made their conversions) were natural gas plant liquids and lease condensate. All of these liquids are significantly less dense than crude oil, and a proper conversion lowers their volume contribution by 25 percent.
Needless to say, refinery gains do not inject new energy into the U.S. economy, just add volume. Also, propane and butane are not crude oil, and ethanol is not a hydrocarbon. The only hard number here, 5.7 MMbopd of crude oil production is something to write home about. This level of production requires an incredible amount of new technology and technical skills that are available only in the U.S. My department graduates each year about 150 petroleum engineers of all levels, who make this huge effort such a smashing success. Their starting salaries are in excess of three-four times the national average for college graduates. And they all have jobs.
In conclusion, Russia is using similar technology to increase their rate of crude oil production to over 11 MMbopd, and Saudi Arabia is barely hanging in at 9-10 MMbopd. Both these countries also produce large volumes of lease condensates and natural gas plant liquids. The rate of U.S. crude oil production is a little more than 1/2 of either of these two rates, and we are no Russia or Saudi Arabia when it comes to producing oil per unit time. But this is just fine, so let's stop deluding ourselves with such tenacity.
In the next blog, I will talk about the various techniques of denying existence of peak oil (or climate change, or anything else we fear or do not like).
P.S. So, did I miss anything in my discussion of the EIA quote at the top of this blog? Think carefully... Yes, I did.
In 2011, we consumed 18.8 MMbpd of petroleum products, less by 1.6 MMbpd than our consumption of petroleum products in 2005. With less cash in pocket, less driving, and more efficient cars, we have destroyed demand for almost as much of real crude oil as all other imaginary "oils" quoted by EIA and dutifully propagated through the clueless mediadom.
Why isn't this achievement front-page news? We finally use less crude oil! We are more efficient! This incredible news is evidently not as sexy as making up imaginary "oil" to be on par with the Saudis. Have we gone mad?! I take it back: Have we stumbled even deeper into the destructive imperial madness that has infected us for the last 11 years?
And, you, corn ethanol lovers, read this and fear the future.
P.S.P.S. Five years after my well-researched plea to the EU Ministers of Environment and Transportation, EU is considering limiting use of biofuels:
The European Commission intends to limit the use of biofuels derived from food crops to 5% for transport fuel. This would be a substantial change to its present biofuels policy. According to the EU's climate-change and energy commissioners, Europe wants to cap the share of energy in the transport sector from food crop-based biofuels at current levels. The proposal, a draft of which was reported by Dow Jones Newswires, clashes with the target of having 10% of the energy used in transport coming from renewable sources by 2020. This goal was set by the EU three years ago because food crop-based biofuels account for most biofuels available in volumes at the moment. New types of alternative fuels are being developed, but they are mostly at the laboratory stage. At the same time, biofuels are expected to be the main renewable energy source used in transport in 2020.
Despite the obvious insanity of the last sentence, I say: Better late than never, dear Europe, and much better than the U.S.A., which seems to have a policy of accepting political donations from mega agricultural companies and all kinds of other companies, rather than having an energy policy.
(P.S.)-cubed on 11/13/2012. The Wall Street Journal insists on an alternative reality view of EIA reporting, by stating in a Review&Outlook piece, "Saudi America," that:
The U.S. will increase its production to about 23 million barrels a day in 10 years from about 18 million barrels a day now, the IEA predicts.
I have no idea what IEA predicts, but I surely know that this number is incorrect, if it implies current production of liquid hydrocarbons in the U.S.A.
Share | Show without comments | PDF version
Related articles (automatically generated)
- Oil Watch - World Total Liquids Production (November 21, 2012)
- Weekend Energy Listening: Ethanol's Energy Balance with Tad Patzek (May 25, 2008)
- Review: How Can We Outlive Our Way of Life? (October 2, 2007)
- Due Diligence: A reader's response to Khosla (August 13, 2006)
- Current and Projected Costs for Biofuels from Algae and Pyrolysis (June 4, 2012)
125 comments | Comments can no longer be added to this story.
Tribe Of Pangaea- First Member on November 19, 2012 - 2:45pm Permalink | Subthread | Comments top
Well, maybe like that Leonard Cohen song goes, 'everybody knows'. So, as someone else-- perhaps many others-- once suggested we do, many of us just 'play the game', 'play pretend'. If we didn't, Wall Street would crash overnight or something... Maybe Steven Chu or Tariel Morrigan said that.If you play pretend, the crash will be less severe and everyone will have time to prepare, so some theory goes... Well, that seems about as rational as the rest of it.
'Civilization is too big to fail'. Forget history, make that your mantra. Just keep repeating it over and over to yourself and it will all work out. But you have to believe it. Visualize those hydrocarbon lakes on Titan if it helps.
And get back in your car and go to work. Earn your salary, pay your taxes, mortgage, mow your lawn, deal with the bank, etc., and play the game.
Oh, and don't worry about progeny. It will all sort itself out. If you toe the line.
At that time, David Fridley, an expert on oil economics, worked under Chu. In an interview given in 2009, Fridley claims, "[Chu] was my boss...He knows all about peak oil, but he can't talk about it. If the government announced that peak oil was threatening our economy, Wall Street would crash.
He just can't say anything about it." It is interesting to note that Chu based his projections for peak oil on the calculations of Colin Campbell, an expert oil industry geologist, who supposedly based his estimates on the confidential data of the consulting firm Information Handling Services (IHS)...
The data and estimates of IHS on the global oil reserves are significantly less than those published in the public domain...
~ Tariel Morrigan, "Peak Energy, Climate Change, and the Collapse of Global Civilization: The Current Peak Oil Crisis"
mbnewtrain on November 19, 2012 - 1:51pm Permalink | Subthread | Comments top
Regarding refinery gains:When you take a long hydrocarbon chain molecule from a heavy crude batch, then separate it into two smaller molecules (lighter liquid) you need a couple of hydrogen atoms to replace the C - C bond that has been broken. This hydrogen usually comes from natural gas (CH4), so refinery gains are NOT FREE. They have taken energy from natural gas and embedded it in the processed crude. Besides, the heat to drive this process also comes from natural gas.
EIA clearly does not deduct energy from natural gas account when saying refinery liquid production increased due to refinery gains. We are taking from one energy account and transferring to another (with some loss). On a net energy basis refinery gains are a net loser.
Tribe Of Pangaea- First Member on November 19, 2012 - 2:29pm Permalink | Subthread | Parent | Parent subthread | Comments top
I have a metaphor: Creating a leak in a boat to seal another leak.Leak? What leak?
(Hidden behind bulkhead.)Tankingthinker on November 19, 2012 - 3:12pm Permalink | Subthread | Parent | Parent subthread | Comments top
It is all about net energy and that is how we should present our global energy production and use.Net energy is the best indicator of useful work as it takes into account the lower EROEI ratios of newer resources coming on-line.
If we used net energy in all of our arguments it would soon be clear that we now live in a negatively sloped net energy production world.
As the world's population numbers continue to rise and the net energy available to that rising human population per capita is calculated, the real picture is painted.
I don't understand why both net energy and population parameters continue to be ignored HERE on the TOD! I understand why the rest of the world ignores these trends but it seems even the most enlightened few that live in the TOD world are also hesitant to accept the true situation. Of course, the further away we are from the industry that provides our paycheck, the easier it is to see the forest for the trees. Perhaps the thought of the 150 year ride down the back side of the fossil fuel bell curve is just too depressing to think about. Regardless, the truth will improve our plans and policies and help mitigate the suffering. Not a soft landing but a softer landing.
NET ENERGY - POPULATION These are the two most important parameters in the energy discussion, by far. Funny how rare it is to hear their sound.
George.Mobus on November 19, 2012 - 3:56pm Permalink | Subthread | Parent | Parent subthread | Comments top
Indeed. I've been sounding that trumpet for years.For you doomers, my latest rantings FWIW.
Tribe Of Pangaea- First Member on November 20, 2012 - 2:16pm Permalink | Subthread | Parent | Parent subthread | Comments top
George, if I read you correctly, your death-wish appears, paradoxically perhaps, as a bit of a live-wish manifest over time as a dangerous lock-in.David Korowizc speaks about that and of course I sort of suggest it in my first comment here-- the idea of playing the game that you then can't easily or safely opt out of. Maybe a little like some movie-version of joining the mob and then trying to quit it and having your life threatened if you do.
According to him, the dystopia of the Wachowski Brothers' Matrix trilogy is already here: the technological-industrial 'machine' is already running the world, a world where individual humans are but insignificant little cogs with barely any autonomy. No single human being - neither the most powerful politician, nor the most powerful businessman - has the power to rein in the system. They necessarily have to follow the inexorable logic of what has been unleashed.
~ G Sampath on John ZerzanNeo: I can't go back, can I?
Morpheus: No. But if you could, would you really want to? ...We never free a mind once it's reached a certain age. It's dangerous, the mind has trouble letting go... As long as the Matrix exists, the human race will never be free.
~ The Matrixsleekeeboo on November 20, 2012 - 12:27am Permalink | Subthread | Parent | Parent subthread | Comments top
Your net energy point is well taken. When taking into account the efficiency (or lack thereof) of most energy-converting machines (35% at the top end), and adding this to the mix, it would appear we are net losers all the way around.The mirage is produced by economics. As long as money can be made from net loss energy schemes, they will somehow seem to be practical.
jokuhl on November 20, 2012 - 3:02pm Permalink | Subthread | Parent | Parent subthread | Comments top
It's just silly to say that Net Energy and Population are somehow missing from the conversations or the focus here. They've been gone over again and again.. with long and tedious repeats of the same points. While surely they have their proponents and their skeptics.. it's hardly an unheard note in this arena.If you're saying we haven't reached a solid consensus or come up with a clear solution to either point, well then let me be the first to wish you luck on the quest.
They are surely both key aspects to our energy predicament, each one woolly and scratchy in its own way. What would you do about them?
Tankingthinker on November 20, 2012 - 9:49pm Permalink | Subthread | Parent | Parent subthread | Comments top
Sorry for being "silly", jokuhl, but when you say, "somehow missing from the conversations or the focus here." don't you think that covers just about the entire gambit?jokuhlI mean, missing is never being said and focus is like the only thing being said. Right? So, I guess in that context, I am "silly". It would difficult to be anything but!
What would I do about them?
- Not be afraid to say population is the most important parameter when talking about resources.
- Remind the masses just how bad the IEA's past reports were and how they adjust them every year to better match reality. It should be obvious by now that they willfully do this so people don't panic or change their dreams of consumption. If we just used more simple net energy numbers, it would be far harder to hide reality with confusing and hard-to-pin-down terminology. Most people just need a whiff of doubt and they run with it.
- Always bring up net energy as the best indicator of our energy situation. Not GDP or refinery gains or net production of any form of energy, regardless of form or cost. Everything else is just used as a smokescreen.
With that said, I understand that the task of enlightening the masses is futile and that humanity has to learn The Great Lesson the hard way.
I only hope that the few small groups of people, many of them here on TOD, can keep a more consistent message of what is going on. Then we can say, "Well, it was all explained clearly on TOD (and other forums and papers). Perhaps that is just beating a dead horse and gets boring so we tend to mix it up for fun.
Perhaps we could vote on a suggested list of resources that people can view that will give them the best picture of reality. Something like a short program that can be followed, step by step, that lays it out in a clear way that most of us here agree with. How about a big green button that says, "If you are new or need a review, click here!" The TOD curriculum.
Then again, perhaps just enjoying a peak of human civilization is time better spent. ;)
Sorry if my retort was offensive, TT, but I was responding to this line.."I don't understand why both net energy and population parameters continue to be ignored HERE on the TOD!"
.. and they are simply NOT ignored here. We see continual appeals to the importance of both. I don't object to their importance, either.. while I do find the Pop. thread to be simply wearying, with their regular forays into catcalls of Eugenics and 'Stalinist Culling' and such. But above all, is the reliable resurrection of the plea that asks why we never talk about Population!
As far as outreach.. I'm afraid the Economists keep hogging the mic's, and people seem to let them, being so comforted by the reassurances that their money will be safe and sound.
Bob
Null Hypothesis on November 21, 2012 - 4:37am Permalink | Subthread | Parent | Parent subthread | Comments top
I see EROEI and population brought up all the time here, maybe more in the Drumbeat. It's just harder to quantify. Of course everything comes back to EROEI, that's the whole driving dynamic behind Peak Oil. And it's also the source of the current disconnect between the purchasing power of money and the resources available to back that up.As we run out of cheap easy oil with EROEI of 100:1 we move on to slow unconventional oil with EROEI below 10:1. This is enabled only partially by technological innovation, but mostly by high oil prices. And counterintuitively to the mainstream understanding, this actually unlocks lots of "new" oil that wasn't available before. This is the apparent paradox we are witnessing now, exactly as predicted by Peak Oil "theory", which is that as we "run out" of oil, our economically recoverable fossil fuel reserves actually grow, but this is only due to increasing prices.
The problem with the new unconventional oil sources is they are slow and expensive, and this kills demand. Eventually a peak, or plateau, is reached in production rate after which it declines.
Of course the cornucopian media latches on to the increase in recoverable reserves from unconventional sources as evidence that technology will conquer adversity, that our reserves are growing faster than our yearly consumption of them. This can continue for centuries, they argue. But take oil price back to $50 and see how many reserves we'd have left!
This increase in reserve size can't continue indefinitely. Eventually geology (or social collapse) takes over from price as the predominant parameter limiting production rate. What the media doesn't talk about is the dropping EROEI as reserve sizes increase. As Gail's triangle in the TOD post the other day shows, the reserves of unconventional fossil fuels at the base are quite large.
But it would have been more effective to draw that triangle differently, with a base that fizzles out into nothing, rather than being a hard line which tends to suggest at a quick glance that they are equivalent kinds of fossil fuels at the top and the bottom. But the base has such a low EROEI that at some point we won't be able to support society properly anymore even though we're still sitting on trillions of tonnes of fossil fuels. So without renewables, society ends somewhere at the base of that pyramid; where exactly, who knows, which is why there should be no hard line at the base.
Darwinian
Well there is one thing that is silly. And that is to imply that all different forms of energy are fungible. That is silly to the nth degree. You cannot fly a jet plane on coal, or electricity from a dam, or anything but petroleum for that matter.The liquids fuel problem is serious and just pretending we could, like overnight, convert to electricity or something else, is truly silly. Conversions will come slow and hard and at great expense. And some things will never be converted.
Ron P.
Tribe Of Pangaea- First Member
This whole culture is silly, and far worse.In order to change our ways, we seem to need to terrify ourselves... I literally can't stand being on the American highway. To me it is almost like being in a prison of madness... Driving like crazy people.
Where are they going? And why are so many of them going in that direction? They are all fleeing something.
I would like to inquire what is in those trucks that are tearing down the road. Is it something of no use at all? Or something which is present where it is going? And often I have seen trucks, apparently carrying identical cargo, going in opposite directions, carting it here and there. The drivers tell me that they are carrying widgets...
~ Bill Mollison
It's not just about EROEI of course, but the level of sanity/insanity behind its use.
Black_Dog
I think the EIA has been playing fast and loose with the petroleum statistics. As noted last week, the EIA Annual Review for 2010 states that the US produced a total of 9,443 mbbls/d, of which US crude production at 5,512 mbbls/day (which includes lease condensate), NGPL's at 2,001 mbbls/d and processing gain of 1,064 mbbls/d. The difference of 866 mbbls/d appears to be made up by biofuels.Total product supplied is said to have been 19,148 mbbls/d, with imports minus exports totaling 9,434 mbbls/d of that. The amount of crude imported was 9,163 mbbls/d. From these data, the total crude supplied to the refineries was 14,675 mbbls/d, of which 62% is imported.
I've previously suggested that assigning all the processing gains to US production is factually incorrect, instead the processing gains resulting from refining imported crude should be added to the total for imports. For a rough guess, using the fraction of crude imported given above, 664 mbbls/d should be subtracted from the US production and added to the import side of the accounting. This revision reduces US production to 8,779 mbbls/d and increases imports to 10,098 mbbls/d, increasing the fraction imported from 49% to 53%.
Of course, the EIA misses the whole discussion about biofuels, especially ethanol, which require a large input of fossil fuels to produce the final product. The EIA ignores this fuel input, showing biofuels as an input to the front end of the refining process.
With ethanol production now using about 40% of the US corn crop, it would be more accurate to consider this portion of the US agricultural system to have been added to the energy supply system and the energy used would thus become an internal consumption which would be subtracted from the petroleum energy available to the rest of society. Doing this calculation would increase the fraction of energy imported, which would give a more realistic picture of our situation...
E. Swanson
dunewalker on November 20, 2012 - 11:17am Permalink | Subthread | Parent | Parent subthread | Comments top
Black Dog, thanks for the very clear picture of current US production, this really lays it open.vtpeaknik on November 20, 2012 - 1:09pm Permalink | Subthread | Parent | Parent subthread | Comments top
Alas, they don't even subtract the energy inputs to the fossil fuel industries, e.g., all those trucks hauling fracking fluids.carnot on November 22, 2012 - 1:27pm Permalink | Subthread | Parent | Parent subthread | Comments top
Sorry Guys but you have missed the point on refinery gains. It is a mirage. Remember the 1st law of thermodynamics.Energy cannot be created or destroyed. US refiners continue to quote their refining capacities and products in barrels - a unit of volume which is meaningless unless a density unit is also quoted.
What you should consider is the mass unit. In ALL refineries if you measure in units of mass it should add up to 100% plus the mass of hydrogen and other inputs added which increase the mass. ( methanol for an MTBE unit for instance).
When the crude is distiller in the crude unit it will produce a number of products with different densities and therefore different mass per barrel. Measure the products in barrels and you will have the following barrels per tonne.
Butane. 11
Naphtha 9
Gasoline 8.7
Jet 8
Diesel 7.5
Vacuum gas oil 6.8
Fuel oil 6.5In a cat cracker, with no hydrogen addition the mass of products is constant but because the volume of LESS dense light products exceed the total volume of HEAVY dense products , hey presto there is a refinery gain - in volume but not in mass.
Some refinery gain is due to the addition of hydrogen but typically this is 2-3% of the overall mass flow. Refiners love to sell in units of volume as they can benefit form the sleight of hand of selling a less dense and lower energy product to unsuspecting drivers. When energy density is compared in mass units there is NO significant difference between gasoline, jet or diesel. It is about 42-44 MJ per Kg but very different in volume units. That is why diesels appear 30 % more fuel efficient on volumetric terms but in reality the differnce is much less.
xoddam on November 20, 2012 - 7:21am Permalink | Subthread | Parent | Parent subthread | Comments top
A number of people have posted the same argument each time "refinery gains" are mentioned, but it does not universally hold true.Cracking can be done without addition of hydrogen, either by separately coking the heavier fractions of the crude before cracking (producing large volumes of solid carbon-rich petroleum coke, frequently a desirable byproduct which is further improved for use in metallurgy), or coking by deposition on the catalytic cracker unit itself (usually simply burned off in batches).
In neither case does any non-crude-oil energy input contribute to the increased volume of the light hydrocarbon products. Indeed the liquid products are of considerably less mass and energy than the input crude petroleum.
Indeed to the best of my knowledge hydrogenation in cracking units is not the norm. The main use of hydrogen in petroleum processing is in fact to remove sulfur and nitrogen from the fuel -- in which process it does not add energy to the desulfurised fuel product, but rather to the sulfuric and nitric acid byproducts.
http://en.wikipedia.org/wiki/Hydrodesulfurization
The hydrogen may be generated by steam reformation of natural gas, but coke from crude oil is also used as feedstock for steam reformation.
RockyMtnGuy on November 20, 2012 - 10:22am Permalink | Subthread | Parent | Parent subthread | Comments top
Yes, thank you for clarifying that. I've tried to clarify it for people before, but your explanation is much better. People tend to assume that "refinery gain" comes from adding hydrogen, but that's not generally true - in most cases it comes from removing carbon, ie "coking". Refineries prefer to do it that way because hydrogen is very expensive, and petroleum coke is a valuable product. In either case, the EROEI is much less than unity - in the case of coking, it is less than zero.mbnewtrain on November 20, 2012 - 10:42am Permalink | Subthread | Parent | Parent subthread | Comments top
From a chemistry standpoint:dak664 on November 20, 2012 - 12:23pm Permalink | Subthread | Parent | Parent subthread | Comments topIf the refinery is breaking H-C bonds in the hydrocarbon chain molecule and producing free C (which you call coke), then the liquids produced have shorter chain molecules (total number of carbons reduced). Fewer H-C bonds mean lower energy. So using catalytic cracker that produces coke removes energy from the resulting liquid.
My claim of lower net energy in the oil product still stands regardless of refining method. In either case refinery gains should not be counted as energy production.
Ideally EROEI for an energy source would be the ratio of final work done to the sum of all gross energy consumed, e.g. for a coal power plant the kWh delivered to users divided by the embodied energy of all the inputs. This would take into account the conversion efficiency of inputs and outputs, e.g. the distance of the coal plant relative to the mine and final loads could be a trade-off of energy used to transport the coal vs. the energy lost by electrical transmission. For transportation I suppose it would convert to passenger-miles per joule, again based on refinery losses, engine efficiency, maintenance, etc.Consistent use of energy units such as Barrel of oil equivalent (1 BOE = 1.7 MWh) would be a step in that direction. Using volume is clearly a ploy to improve the numbers, as is the double counting of barrels that are used for production (e.g. a BBL used to extract 2:1 shale oil counts as 3 BBL, to make 1:1 ethanol counts as 2 BBL). This won't fool Mother Nature.
Luke H on November 20, 2012 - 3:21pm Permalink | Subthread | Parent | Parent subthread | Comments top
Ideally EROEI for an energy source would be the ratio of final work done to the sum of all gross energy consumed but that still leaves out something that is very difficult to quantify--the relative value of each unit of work to the economy.Very murky stuff there--and it is at the heart of the debate--good luck fleshing that out.
ERoEI only becomes an issue when the most critical units of work (they will make themselves obvious as the economy rapidly increases their value) suck up almost all the energy and almost none is left to go out and multiply (its value) in this unfathomably complex economy.
dak664 on November 20, 2012 - 5:52pm Permalink | Subthread | Parent | Parent subthread | Comments top
I didn't want to go there, but yes, critical uses will soon become more obvious. Energy production and transportation will be prime needs and determining their EROEI will be straightforward and essential.Consumer choices such as large-screen vs. small-screen televisions, LEDs vs. compact flourescents, Hummers vs. Tatas, could be "informed" by an embodied energy tax similar to the VAT. Or just pay for them with energy chits as in the technocrat economy.
speculawyer on November 20, 2012 - 10:06pm Permalink | Subthread | Parent | Parent subthread | Comments top
Well, a problem with EROEI is that all energy is not equal in cost. Hence you can run arbitrage between various energy sources. For example, Natural gas is pretty cheap right now so even though the EROEI of tar sands oil might not be great, the fact that the main energy input is cheap natural gas allows the tar sands to be made at not too high of a price.Money is what matters in the real world not EROEI as Rockman has pointed out many times.
Tankingthinker on November 21, 2012 - 12:10am Permalink | Subthread | Parent | Parent subthread | Comments top
"Money is what matters in the real world not EROEI as Rockman has pointed out many times."Funny, but I couldn't disagree more. I claim that the EROEI is all that matters in the real world. Then again, I guess it all depends on the definition of "real world". In fact, in my real world, money means nothing compared to net energy.
In any finite system of interest, if you don't have your EROEI set high enough, no amount of money, currency, gold, policy, technology or voodoo magic is going to change the inevitable.
Sure, short term systems often rely on a way of distributing resources that are very important and can seem to overshadow the importance of net energy. However, in the long term, none of that matters if there is not enough net energy to support the complexity of the system. You can be sitting on a mountain of resources but starve to death if you don't have the net energy needed to transform those resources in a way that supports your own complex system. The higher the net energy you have, the more complexity you can support, depending on the other available resources.
Money follows net energy, not the other way around. If there is not enough net energy, humans would not have enough time, beyond finding enough food, to invent money as a way of figuring out what to do with their free time.
Patrick R on November 21, 2012 - 12:19am Permalink | Subthread | Parent | Parent subthread | Comments top
Yes, surely money is an abstraction from real work; ie energy.Null Hypothesis on November 21, 2012 - 3:11am Permalink | Subthread | Parent | Parent subthread | Comments top
We should be more correct here -- it's about exergy, not energy. Exergy is useful energy available to do work. This then incorporates the concept of EROEI.Ulan Baskaw on November 25, 2012 - 1:06pm Permalink | Subthread | Parent | Parent subthread | Comments top
Has there verb been an exergy keypost on TOD to explain the concept?Seagatherer on November 21, 2012 - 3:46pm Permalink | Subthread | Parent | Parent subthread | Comments top
EROEI isn't nearly the whole story - utility is.Oil can be an energy sink and it will be viable to extract ie I can't put coal in my chainsaw.
An oil well could be drilled with electric power, oil sands can be extracted with eg natural gas inputs and nuclear electricity - the EROEI could potentially be negative - but I will still need liquid fuel for my chainsaw.
You see, it is not as simple as it appears. I have never seen it discussed, but I know that the end use of the oil matters too - there can be energy gain here also that is not practical with other forms of energy - but it is not considered EROEI.Seagatherer on November 21, 2012 - 6:29pm Permalink | Subthread | Parent | Parent subthread | Comments top
To clarify: I can buy 2 quarts of gasoline, assume EROEI of minus 10 on these 2 quarts, ie it took coal, gas, electricity equal to about 5 gallons of fuel to put these 2 quarts in my hand. I go out on my property, which is a mile from the nearest electricity, and cut 2 cord of maple to heat my house - the maple is equal to about 280 gallons of fuel oil. About 2 cups of gasoline in my tractor gets the wood back to my house, by the way.
Stranded gas, coal etc are cheap for a reason - they are not as useful.
EROEI applies in a very broad sense, clearly there must be a very positive source available somewhere. I don't think its as useful a parameter as many would have you believe though, since we are facing a crisis of utility more than anything.
It is clear to me that if we cannot find a source of power with comparable utility, we will be seeking oil that is available only at a loss of net energy, it will be profitable in some cases to do so, and there will be investment capital available - to what extent I don't know, but it will happen.
We won't be left with BAU by any stretch of the imagination in that case though.Null Hypothesis on November 21, 2012 - 3:18am Permalink | Subthread | Parent | Parent subthread | Comments top
Money is what matters in the real world not EROEI as Rockman has pointed out many times.I'd argue that there is an apparent and temporary disconnect between energy and money enabled only by ridiculously cheap debt (low interest rates), all imposed by the Fed. This leads some to believe that money is what matters in the real world (which it currently does), rather than energy. But this is only due to the ponzi scheme monetary system I'm always harping about. This rubber band is about to snap and the two concepts of energy and money will come back in line with each other soon, and this will be effected through a catastrophic collapse of the world's financial system.
Tribe Of Pangaea- First Member on November 21, 2012 - 9:01pm Permalink | Subthread | Parent | Parent subthread | Comments top
That's along the lines of what I was thinking before reading your comment. Money seems somewhat divorced from reality, from nature/natural mechanisms, land, resources, energy, labour, whatever. "We" only pretend it's married. Maybe it's kind of married, but has affairs, children from those affairs and sexually-transmitted diseases (fractional reserve/financial instruments/magic money-potions/etc.).If it's 'created out of thin air', as it is often described, then it has little or less to do with energy or a lot of other things, except where it begins to mess with/bump up against natural reality and then "runaway 'growth-house' effects" start happening-- your rubber band.
These days, what with financial corruption, money doesn't even appear to have much to do with its own rules anymore.
The gold standard and fractional reserve seem questionable just for those reasons and I have heard discussions along the lines of money needing to be tightly based on energy or land or somethings like that, or perhaps not being used at all, and using instead, credit, gifts, barter, truly local/ethical currencies, and/or similar.
While I have a hard time understanding money and trying to gives me a bit of a headache- (although some, who may appear to understand money, have a dubious grasp of its effects/dynamics)- it's yet another human system that can get mired in complexity and disasters of its own kinds.
dak664 on November 21, 2012If everybody knew the full facts about how money is issued, how it's put into circulation, who is issuing it, how they have power and control over the economy, and over individuals' lives, I think there'd be a lot of very unhappy people around.
~ Francis Ayley, Founder & President, Fourth Corner Exchange (alternative money system)That arbitrage is what conceals the true energy cost of any particular source. A 20:1 source can be leveraged to 40:1 by passing it through a 2:1 source like shale oil.Darwinian on November 20, 2012The overall EROEI is now 40:21 but the 2:1 producers make a nice profit and furthermore can claim the entire reserve as recoverable at the current cost.
After depletion of the 20:1 source they might have to use their own oil for production. Now half of the reserve is consumed to get the other half, and the extraction rate has to double to provide the same net output. A 100 year supply becomes a 25 year supply.
And that is assuming there is no increase to offset the loss of the 20:1 source. The price can be expected to rise correspondingly.
The US has refinery process gains of over one million barrels per day. That is almost as much as the rest of the world combined. They have to be counting refinery process gains on imported oil.RockyMtnGuyRon P.
That is correct. The EIA is counting "refinery gain" on imported oil as "US oil production". It is a totally bogus product by any standard, and the only reason I can imagine them doing it is to artificially inflate US oil production statistics. This has to be politically motivated.Black_DogAnd the IEA bought into the EIA's misinformation (call it a lie) with their latest report, which means either that they don't understand the EIA's reporting or they are complicit in the act of overstating US production. Your choice...RockyMtnGuyE. Swanson
There is an addition factor which the EIA is not going to want to make clear. US oil imports are increasingly coming from Canada, and most Canadian oil production is now from the oil sands as Canadian conventional oil production declines and oil sands production increases. Canada now exports more oil to the US than it consumes itself.The product which is exported is mostly bitumen, which is not "tar" as some people would have you believe, but it is about the heaviest grade of oil you can buy. Midwest oil refineries no longer have sufficient domestic oil to keep running, but there is lots of Canadian bitumen and it is very cheap to buy (although not to produce). They upgrade it using coking, and make a ton of money turning it into gasoline.
Despite the fact that the EROEI of coking is negative (there is an energy loss), there is a huge refinery gain in going from very heavy bitumen to much lighter gasoline. The EIA counts this as "US oil production" despite the fact it comes from the Canadian oil sands and involves a net loss of energy.
That's another factor in the huge "refinery gain" the EIA and therefore the IEA is counting in predicting the US will exceed Saudi oil production. It's not really oil, in physical terms it's some kind of an extreme vacuum, or a form of negative energy.
A solar panel reaps only a small portion of its potential due to night, weather, and seasons, simultaneously introducing intermittency so that massive storage is required to make solar power work at a large scale. A perennial proposition for surmounting these impediments is that we launch solar collectors into space-where the sun always shines, clouds are impossible, and the tilt of the Earth's axis is irrelevant. On Earth, a flat panel inclined toward the south averages about 5 full-sun-equivalent hours per day for typical locations, which is about a factor of five worse than what could be expected in space. More importantly, the constancy of solar flux in space reduces the need for storage-especially over seasonal timescales. I love solar power. And I am connected to the space enterprise. Surely putting the two together really floats my boat, no? No.I'll take a break from writing about behavioral adaptations and get back to Do the Math roots with an evaluation of solar power from space and the giant hurdles such a scheme would face. On balance, I don't expect to see this technology escape the realm of fantasy and find a place in our world. The expense and difficulty are incommensurate with the gains.
EROI
Posted by Gail the Actuary on August 1, 2013 - 4:14am Topic: Economics/Finance Tags: economic growth, energy return, eroei, eroi, falling wages [list all tags]
My major point when I gave my talk at the Fifth Biophysical Economics Conference at the University of Vermont was that our economy's overall energy return on investment is already too low to maintain the economic system we are accustomed to. That is why the US economy, and the economies of other developed nations, are showing signs of heading toward financial collapse. Both a PDF of my presentation and a podcast of the talk are available on Our Finite World, on a new page called Presentations/Podcasts.
My analysis is with respect to the feasibility of keeping our current economic system operating. It seems to me that the problems we are experiencing today–governments with inadequate funding, low economic growth, a financial system that cannot operate with "normal" interest rates, and stagnant to falling wages–are precisely the kinds of effects we might expect, if energy sources are providing an inadequate energy return for today's economy.
Commenters frequently remark that such-and-such an energy source has an Energy Return on Energy Invested (EROI) ratio of greater than 5:1, so must be a helpful addition to our current energy supply. My finding that the overall energy return is already too low seems to run counter to this belief. In this post, I will try to explain why this difference occurs. Part of the difference is that I am looking at what our current economy requires, not some theoretical low-level economy. Also, I don't think that it is really feasible to create a new economic system, based on lower EROI resources, because today's renewables are fossil-fuel based, and initially tend to add to fossil fuel use.
Adequate Return for All Elements Required for Energy Investment
In order to extract oil or create biofuels, or to make any other type of energy investment, at least four distinct elements described in Figure 1: (1) adequate payback on energy invested, (2) sufficient wages for humans, (3) sufficient credit availability and (4) sufficient funds for government services. If any of these is lacking, the whole system has a tendency to seize up.
Figure 1. One sheet from Biophysical Economics Conference Presentation
EROI analyses tend to look primarily at the first item on the list, comparing "energy available to society" as the result of a given process to "energy required for extraction" (all in units of energy). While this comparison can be helpful for some purposes, it seems to me that we should also be looking at whether the dollars collected at the end-product level are sufficient to provide an adequate financial return to meet the financial needs of all four areas simultaneously.
My list of the four distinct elements necessary to enable energy extraction and to keep the economy functioning is really an abbreviated list. Clearly one needs other items, such as profits for businesses. In a sense, the whole world economy is an energy delivery system. This is why it is important to understand what the system needs to function properly.
What Happens as Oil Prices Rise
When oil prices rise, wages for humans seem to fall, or at least stagnate (Figure 2, below). The comparison shown uses US per capita wages, so takes into account changes in the proportion of people with jobs as well as the level of wages.
Figure 2. High oil prices are associated with depressed wages. Oil price through 2011 from BP's 2012 Statistical Review of World Energy, updated to 2012 using EIA data and CPI-Urban from BLS. Average wages calculated by dividing Private Industry wages from US BEA Table 2.1 by US population, and bringing to 2012 cost level using CPI-Urban.
In fact, if we analyze Figure 2, we see that virtually all of the rise in US wages came in periods when oil prices were below $30 per barrel, in inflation-adjusted terms. The reason why the drop in wages happens at higher per-barrel levels is related to the drop in corporate profits that can be expected if oil prices rise, and businesses fail to respond. Let me explain this further with Figure 3, below.
Figure 3. Illustration by author of ways oil price rise could squeeze wages. Amounts illustrative, not based on averages.
Figure 3 is a bit complicated. What happens initially when oil prices rise, is illustrated in the black box at the left. What happens is that the business' profits fall, because oil is used as one of the inputs used in manufacturing and transportation. If the cost of oil rises and the sales price of the product remains unchanged, the company's profits are likely to fall. Additionally, there may be some reduction in demand for the product, because the discretionary income of consumers is reduced because of rising oil prices. Clearly, the business will want to fix its business model, so that it can again make an adequate profit.
There are three ways that a business can bring its profits back to a satisfactory level, illustrated in the last three columns of Figure 3. They are •Automation. Human energy is the most expensive type of energy a business can employ, because wages to paid to humans to do a given process (such as putting a label on a jar) are far higher than the cost of an electricity-based process to perform the same procedure. Thus, if a firm can substitute electrical or oil energy for human energy, its cost of production will be lower, and profits can be improved. Of course, workers will be laid off in the process, reducing total wages paid. •Outsourcing to a Country with Lower Costs. If part of the production cost can be moved to a country where wage costs are lower, this will reduce the cost of manufacturing the product, and allow the business to offset (partially or fully) the impact of rising oil prices. Of course, this will again lead to less US employment of workers. •Make a Smaller Batch. If neither of the above options work, another possibility is to cut back production across the board. Even if oil prices rise, there are still some consumers who can afford the higher prices. If a business can cut back in the size of its operations (for example, close unprofitable branches or fly fewer airplanes), it can cut back on outgo of many types: rent, energy products used, and wages. With reduced output, the company may be able to make an adequate profit by selling only to those who can afford the higher price.
In all three instances, an attempt to fix corporate profits leads to a squeeze on human wages–the highest cost source of energy services that there is. This seems to be Nature's attempt way of rebalancing the system, toward lower-cost energy sources.
If we look at the other elements shown in Figure 1, we see that they have been under pressure recently as well. The availability of credit to fund new energy investment is enabled by profits that are sufficiently high that they can withstand interest charges incurred in the payback of debt. Debt use is also enabled by growth, since if profits will be higher in the future, it makes sense to delay funding until the future. In recent years, central governments have seen a need to put interest rates at artificially low levels, in order to encourage borrowing. To me, this is a sign that the credit portion of the system is also under pressure.
Government's ability to fund its own needs has been under severe stress as well. Part of the problem comes from the inability of workers to pay adequate taxes, because their wages are lower. Part of the problem comes from a need for governments to pay out more in benefits, such as disability income, unemployment, and food stamps. The part that gets most stressed is the debt portion of government funding. This really represents the intersection of two different areas mentioned in Figure 1: (3) Adequacy of credit availability and (4) Funding for government services.
The constellation of energy problems we are now experiencing seems to me to be precisely what might be expected, if energy return is now, on average, already too low.
The Role of Energy Extraction in this Squeeze
When any energy producer decides to produce energy of a given type (say oil or uranium), the energy producer will look for the resource that can be extracted at lowest cost to the producer.
Figure 4. Resource triangle, with dotted line indicating uncertain financial cut-off.
Initially, production starts where costs are most affordable–not much energy is required for extraction; governments involved do not require too high taxes; and the cost of human labor is not too high. The producer may need debt financing, and this must also be available, at an affordable cost.
For example, easy-to-extract oil located in the US that could be extracted very simply in the early days of extraction (say before 1900), was very inexpensive to extract, and would be near the top of the triangle. Tight oil from the Bakken and bitumen from Canada would be examples of higher cost types of oil, located lower in the triangle.
As the least expensive energy is extracted, later producers wishing to extract energy must often settle for higher cost extraction. In some cases, technology advancements can help bring costs back down again. In others, such as recent oil extraction, the higher costs are firmly in place. Higher sales prices available in the market place enable production "lower in the triangle." The catch is that these higher oil prices lead to stresses in other systems: human employment, government funding, and ability for credit markets to work normally.
What Is Happening on an Overall Basis
Man has used external energy for a very long time, to raise his standard of living. Man started over 1,000,000 years ago with the burning of biomass, to keep himself warm, to cook food, and for use in hunting. Gradually, man added other sources of energy. All of these sources of energy allowed man to accomplish more in a given day. As a result of these greater accomplishments, man's standard of living rose–he could have clothes, food which had been cooked, sharper tools, and heat when it was cold.
Over time, man added additional sources of energy, eventually including coal and oil. These additional sources of energy allowed man to leverage his own limited ability to do work, using his own energy. Goods created using external energy tended to be less expensive than those made with only human energy, allowing prices to drop, and wages to go farther. Food became more available and cheaper, allowing population to rise. Money was also available for public health, allowing more babies to live to maturity.
What happened in the early 2000s was a sharp "bend" in the system. Instead of goods becoming increasingly inexpensive, they started becoming relatively more expensive relative to the earnings of the common man. For example, the price of metals, used in many kinds of goods started becoming more expensive.
Figure 5. Commodity Metals Price Index from the International Monetary Fund, adjusted by the US CPI-Urban to 2012 price levels. Commodity Metals include Copper, Aluminum, Iron Ore, Tin, Nickel, Zinc, Lead, and Uranium.
There seem to be two reasons for this: (1) In the early 2000s, oil prices started rising (Figure 2, above), and these higher prices started exerting an upward force on the price of goods. At the same time, (2) globalization took off, providing downward pressure on wages. The result was that suddenly, workers found it harder to keep a job, and even when they were working, wages were stagnant.
It seems to me that prior to the early 2000s, part of what buoyed up the system was the large difference between:
A. The cost of extracting a barrel of oil
B. The value of that barrel of oil to society as a whole, in terms of additional human productivity, and hence additional goods and services that barrel of oil could provide.
As oil prices rose, this difference started disappearing, and its benefit to the world economy started going away. The government became increasingly stressed, trying to provide for the many people without jobs while tax revenue lagged. Slower economic growth made the debt system increasingly fragile. The economy was gradually transformed from one which provided perpetual growth, to one where citizens were becoming poorer and poorer. This pushed the economy in the direction of collapse. Research documented in the book Secular Cycles by Turchin and Nefedov shows that in past collapses, the inability of governments to collect sufficient taxes from populations that were becoming increasingly poor (due to more population relative to resources) was a primary contributing factor in these collapses. The problems that the US and other developed countries are having in collecting enough taxes to balance their budgets, without continuing to add debt, are documentation that this issue is again a problem today. Greece and Spain are having particular problems in this regard.
A More Complete List of Inputs that Need Adequate Returns
My original list was 1.Energy counted in EROI calculation–mostly fossil fuels, sometimes biomass used as a fuel 2.Human labor 3.Credit system 4.Cost of government
To this we probably need to add: 1.Profits for corporations involved in these processes 2.Rent for land used in the process – this cost would be highest in biofuel operations. 3.Costs to prevent pollution, and mitigate its effects – not charged currently, except as mandated by law 4.Compensation for mineral depletion and degradation of soil. Degradation of soil would likely be an issue for biofuels. 5.Energy not counted in EROI calculations. This is mostly "free energy" such as solar, wind, and wave energy, but can include energy which is of limited quantity, such as biomass energy.
Given the diversity of items in this list, it is not clear that simply keeping EROI above some specified target such as 5:1 is likely to provide enough "margin" to cover the financial return needed to properly fund all of these elements. Also, because the need for government services tends to increase over time as the system gets more stressed, if there is an EROI threshold, it needs to increase over time.
It might also be noted that the amounts paid for government services are surprisingly high for fossil fuels. Barry Rodgers gave some figures regarding "government take" (including lease fees as well as other taxes and fees) in the May 2013 Oil and Gas Journal. According to his figures, the average government take associated with an $80 barrel of US tight oil is $33.29 per barrel. This compares to capital expenditures of $22.60 a barrel, and operating expenditures of $7.50 a barrel. If we are to leave fossil fuels, we would need to get along without the government services funded by these fees, or we would need to find a different source of government funding.
Source of the EROI 5:1 Threshold
To my knowledge, no one has directly proven that a 5:1 threshold is sufficient for an energy source to be helpful to an economy. The study that is often referred to is the 2009 paper, What is the Minimum EROI that a Sustainable Society Must Have? (Free for download), by Charles A. S. Hall, Steven Balogh, and David Murphy. This paper analyzes how much energy needs to provided by oil and coal, if the energy provided by those fuels is to be sufficient to pay not just for the energy used in its own extraction, but also for the energy required for pipeline and truck or train transportation to its destination of use. The conclusion of that paper was that in order to include these energy transportation costs for oil or coal, an EROI of at least 3:1 was needed.
Clearly this figure is not high enough to cover all costs of using the fuels, including the energy costs to build devices that actually use the fuels, such as private passenger cars, electrical power plants and transmission lines, and devices to use electricity, such as refrigerators. The ratio required would probably need to be higher for harder-to-transport fuels, such as natural gas and ethanol. The ratio would also need to include the energy cost of schools, if there are to be engineers to design all of these devices, and factory workers who can read basic instructions. If the cost of government in general were added, the cost would be higher yet. One could theoretically add other systems as well, such as the cost of maintaining the financial system.
The way I understood the 5:1 ratio was that it was more or less a lower bound, below which even looking at an energy product did not make sense. Given the diversity of what is needed to support the current economy, the small increment between 3 and 5 is probably not enough–the minimum ratio probably needs to be much higher. The ratio also seems to need to change for different fuels, with many quite a bit higher.
The Add-On Problem for Fossil Fuel Based Renewables
With renewables made using fossil fuels, such as hydroelectric, wind turbines, solar PV, and ethanol, the only way anyone can calculate EROI factors is as add-ons to our current fossil fuel system. These renewables depend on the fossil fuel system for their initial manufacture, for their maintenance, and for the upkeep of all the systems that allow the economy to function. There is no way that these fuels can power the whole system, based on what we know today, within the next hundred years. Thus, any EROI factor is misleading if viewed as the possibility what might happen if these fuels were to attempt to operate on a stand-alone basis. The system simply wouldn't work–it would collapse.
A related issue is the front-ended nature of the fossil fuels used in creating most of today's renewables. People today think of "financing" any new investment, with easy payments over a period of years. The catch (as Tom Murphy pointed out in his BPE talk) is that Nature Doesn't Do Financing. Nature demands up-front payment in terms of any fossil fuels used. Thus, if we build a huge new hydroelectric dam, such as the Three Gorges Dam in China, the fossil fuels required to make the concrete and to move huge amounts of soil come at the beginning of the project. This is also true if we make a huge number of solar panels. The saving we get are all only theoretical, and will take place only if we are actually able reduce the use of other fossil fuel energy sources in the future, because of the energy from the PV panels or other new renewable.
In nearly all cases, adding renewables requires increasing fossil fuel use for this reason. We could, in theory, reduce fossil fuel use elsewhere, to try to cover the greater fossil fuel use to add renewables, but this would mean cutting industries and jobs currently using the fuel, something that many find objectionable. Several readers have suggested that we could greatly ramp-up solar PV. Yes, we could, but we would have to greatly ramp up fossil fuel usage (mostly coal in China, if current manufacturing approaches are used) to create these panels. Any future savings would be theoretical, depending on how long we keep the new system operating, and how much fossil fuel energy consumption is actually reduced as a result of the new panels.
Conclusions
At this point, the foregoing analysis suggests that products created using today's oil and other energy products are not producing an adequate financial return to cover wages, interest expense, and necessary taxes. If EROI plays a major role in determining financial returns, EROI on average is already too low for many developed economies.
It is convenient to think that an economy can keep adding lower and lower EROI resources, but at some point, a "stop" signal starts appearing. I would argue that the issues we are seeing in many sectors of the economy are clear indicators that such a threshold is already being reached. An economy in which the wages of the common worker are buying less and less is an economy in trouble. I talk in another post (Energy and the Economy–Basic Principles and Feedback Loops) about the fact that economic growth seems to be the result of one set of feedbacks. As the price of oil rises and related changes take place, these feedbacks change from economic growth to economic contraction. It is these feedbacks that we are already having problems with.
One can argue that EROI has nothing to do with these issues. But if this is the case, what is the point it analyzing it in the first place? We clearly need to understand when an economy is giving us "stop" signals with respect to increasingly low quality energy inputs. If EROI is not helpful in this regard, perhaps we need to be looking at other indicators.
Originally posted at OurFiniteWorld.com.
Energy Products: Return on Investment Is Already Too Low
Share | Show without comments | PDF version
Related articles (automatically generated) Energy Return on (Energy) Invested (EROI), Oil Prices, and Energy Transitions (June 15, 2012) The Energy Return on Investment Threshold (November 25, 2011) Two Energy Books of Interest (April 18, 2012) Renewable Transition 2: EROEI Uncertainty (August 10, 2009) WSJ, Financial Times Raise Issue of Oil Prices Causing Recession (March 28, 2011)
128 comments | Comments can no longer be added to this story.
FMagyar on August 1, 2013 - 5:27am Permalink | Subthread |Gail the Actuary on August 1, 2013 - 8:49am Permalink | Subthread | Parent | Parent subthread |Also, I don't think that it is really feasible to create a new economic system, based on lower EROI resources, because today's renewables are fossil-fuel based, and initially tend to add to fossil fuel use.
Hi Gail, just curious, are you suggesting that this is the end of all economic systems, FULL STOP?
karlnick on August 1, 2013 - 1:35pm Permalink | Subthread | Parent | Parent subthread |People will always be trading goods and services, and converting the "cost" of goods to a common denominator--whether it is bushels of wheat or US dollars. People did this 5,000 years ago, with accounts kept on tablets of clay.
What will change is the proportion of goods coming available from "promises" in advance--I will work for 40 years, and you will promise to pay me a pension when I turn 65. These promises just don't work. Or I will make you a loan of $100,000, and you will pay it back in 10 years. If things are going downhill quickly, a high interest rate is needed to make such a loan viable.
Another thing that will change is the extent of International trade. There will be an increasing number of local currencies, that are not really convertible internationally, because things are changing quickly. (These will include countries like Syria and Egypt, with internal conflict situations, or Greece and Spain with changing financial situations.) Countries will tend to set up bilateral trade agreements with trusted friends, rather than "just anyone".
What will change is the ability of any kind of currency to "hold value" over time. Even if I own gold, it will buy fewer and fewer bushels of wheat, because society's ability to grow bushels of wheat is declining over time. Money of any kind that is saved for the future will be worth less and less over time.
So I guess it is a matter of definition. New systems will be much different, and much more limited.
Hoover on August 1, 2013 - 7:22am Permalink | Subthread |A lot of small currencies will decrease the need to move. Currency value will be adjusted so that it is cheaper to manufacture goods in a country with demand for imported goods.
Gail the Actuary on August 1, 2013 - 9:00am Permalink | Subthread | Parent | Parent subthread |First order of business for any successor to TOD:
Stop focusing on absolute EROI and start talking about RATE of energy return. I find this entire blog to be of very little practical use because it discusses absolute returns and not rate of return.
RATE of return is what matters, along with resource limitations and production constraints.
An oil sands operation could have an EROI of 1:1.1 - but it wouldn't matter if it was making that return on a daily basis. It would be returning 3,750% of the initial energy invested every year.
A solar PV installation might have an absolute EROI of 10:1. But if that 10 fold return happens over the course of 100 years then it is only returning 10% per year.
As someone who has made my share of pitches for project investment, I can promise that no financial investor would give you the time of day if you told him the absolute return without knowing the rate return (i.e. IRR). The principles are exactly the same here, and we need to start talking the right language if we are going to start understanding these issues properly.
Sorry Gail, other than that, thank you very much for your effort with TOD over the years. #legend.
Hoover on August 1, 2013 - 9:43am Permalink | Subthread | Parent | Parent subthread |The fact that EROI ignores timing is a major deficiency of this measure in my view. Early oil was pulled out, almost as investment was made. Intermittent renewables usually require huge up-front investments, which as you point out, is very different. This is an apples to oranges comparison.
There are major differences in types of energy as well. Intermittent electricity is not equivalent to "dispatchable" electricity, which is not equivalent to coal energy. These differences, plus "boundary issues" make comparisons from one type of energy to another very difficult.
Gail the Actuary on August 1, 2013 - 9:51am Permalink | Subthread | Parent | Parent subthread |Thanks, and thanks for not taking it personally! I agree with you on the other 2 points as well but I tend to see them as rather fudgy problems that can always be improved upon but never perfectly solved, whereas rate versus absolute returns is a relatively easy problem to solve and absolutely fundamental to understanding how useful energy can flow to society.
Cheers Ben
Ghung on August 1, 2013 - 11:28am Permalink | Subthread | Parent | Parent subthread |It is easy not to take it personally, because EROI is not my subject. I got drawn into it because others are using the measure.
Gail the Actuary on August 1, 2013 - 12:01pm Permalink | Subthread | Parent | Parent subthread |"Intermittent renewables usually require huge up-front investments..."
I agree this is necessary if one is to maintain one's current economic level. In my case, I intentionally crashed my personal energy economy and created a new base to work from. The modular nature of PV allowed me to build up a new energy economic system over time (new growth along a different path) while making more investments in types of efficiency that don't sacrifice resilience, both in infrastructure and in our behavior. Why I agree this is unlikely to work at scale:
1. I couldn't have done this without the macro, mostly fossil fuel based economy. My choices would have been much more primitive. Our current economy spawned the choices available.
2. I began planning and implementation ahead of the affective decline curve. I chose to divest in previous investments; emphasis on choice.
3. I had the willingness to reset my expectations.
4. The only people I had to convince were my immediate family (tribe) who were fully on board with the idea that I could, and would, accomplish my objectives; unity of purpose. They, too, gained a willingness to invest, and had time to reset their own expectations. They became convinced that the path I set was beneficial, if not necessary (over time).
5. I took care to convert surpluses into lasting investments, limiting waste.
6. This simply doesn't work at scale. Too many widely varying objectives; too many well-established competing investments limit the efficiency of process; our collective decision-making processes are inefficient and dysfunctional (political stalemate). Far too much denial and delusion begets inefficiencies that hinder affordability. Our current economies are largely waste-based. We are in the habit of squandering surplus. We, collectively, are too busy infighting to see who/what the real enemy is. Too late - the enemy is at our door.
This process will continue to be forced and chaotic with high levels of resentment, resistance and conflict. Too bad for those unwilling or unable to see this coming, many (most?) with few choices. Great opportunity for those who would exploit increasing vulnerabilities. In this age of triage, divisions, rather than unity will become the norm. The inevitable simplification from our hyper-complex state will be messy indeed.
Ghung on August 1, 2013 - 1:36pm Permalink | Subthread | Parent | Parent subthread |I sometimes talk about solutions for a small percentage of people who are able and willing to do a lot of up-front preparations vs solutions for society as a whole. Solar PV may be at least temporary (as long as the panels last, and the things they run last) solution for some small percentage of the population. They really are not a solution for society as a whole, for the reasons you mention. Once the panels cease to work, or the things that they run cease to work, there may be a need to downshift further.
bmiller on August 1, 2013 - 10:05pm Permalink | Subthread | Parent | Parent subthread |"They really are not a solution for society as a whole..."
...because, IMO, there aren't any. It's the nature of predicaments, and I'm largely in agreement with Orlov as he lays it out in his "Five Stages of Collapse", discussed here recently. Societies collapse and reform; a long, usually messy process. It comes down to buying time, creating buffers, especially in regard to basic necessities; slowing the process locally so that one's group has the oportunity (perhaps just a chance) to adapt rather than panic and react. Education, hope, and a proactive, early response is the best I could come up with under the circumstances.
I think many central bankers are aware of the direction that our society is headed in, and their response is to also buy time at a macro level. EOR in oil extraction is having the same effect, though, IMO, there's a much more costly downside to centralised, top-down responses; makes matters worse. Our resources should be applied to enabling less centralised adaptations, which would, of course, require an acceptance that BAU and growth are no longer supportable. This won't happen, as that would stampede the herd. Meanwhile, society cooks away in its own detritus, suffering the consequences and latching on to whatever false hopes come along. Hard to watch, even from the cheap seats.
Rocks and hard places...
Gail the Actuary on August 2, 2013 - 9:53am Permalink | Subthread | Parent | Parent subthread |Gail,
You're obviously an intelligent person who is very knowledgeable, but you're really doing a disservice by repeatedly talking down renewables. I don't mean to suggest renewables will be able to compensate for the decline in fossil fuels entirely, or that Humanity doesn't face daunting challenges, but by repeatedly slamming renewables you're just helping to perpetuate the current fossil fuel dominated system.
Gail, if Wind Power is such an inadequate energy source, why do I pay 9 cents per KWh for Wind Power that covers over 80% of my electricity consumption?
Again, I don't want people to take away the idea renewables will allow for the continuation of business as usual (BAU), but adding to the negativity regarding renewables is really counter-productive.
bmiller on August 2, 2013 - 3:05pm Permalink | Subthread | Parent | Parent subthread |If renewables could really replace oil, they would be producing enough profit that they could be paying high taxes like the oil and gas industry has been over the years, and still does now. The fact that wind energy still needs subsidies (and this is without considering the amount of grid upgrades needed) is verification that wind energy is a real problem for replacing oil. The fact that wind energy still needs subsidies means it isn't even very good for extending electricity--although if wind energy it is onshore, near where the wind energy is to be used, and the total penetration of the grid is kept low, it may be a passable "extender" for other electricity.
How long wind energy lasts is really a function of how long we can keep the electric grid working. It also depends on how long we can keep the wind turbines repaired. How long they can be used is the lower of these two lengths of time. All of the EROI studies that have been done assume that they will last their full planned working life, so are biased on the high side. The front-ended nature of the investment also makes comparability with other EROIs very "iffy."
I don't know how you get the wind rate you get for 80% of your electricity consumption, but I would be willing to bet that (1) it doesn't come from a grid system that in fact is generated 80% by wind and (2) the 9 cents per KWh rate reflects more than one kind of subsidy.
Rethin on August 2, 2013 - 5:12pm Permalink | Subthread | Parent | Parent subthread |You clearly have some axe to grind because no where did I say renewables would "replace oil." This is an apples to oranges comparison in the first place. As for Wind Energy "needing" subsidies, if I correctly recall the Oil and Gas Industry, in which you put so much faith in, receives considerable federal tax relief.
I'm going to ignore your last paragraph.
hugho on August 3, 2013 - 3:16pm Permalink | Subthread | Parent | Parent subthread |I'm going to ignore your last paragraph.
Why?
Hoover on August 3, 2013 - 4:58pm Permalink | Subthread | Parent | Parent subthread |Remarkable post Gail. I have not read this slant on EROEI before and wonder if this is original with you? I will need to mull it over at any rate and read the comments to see if I can understand it better and possibly refute some points. If I can't, then you have really drawn attention to a looming very serious problem. I also guess I don't understand the IRR comment including the (on the surface) absurd comment that an EROEI of 1.1 could return 3750% depending upon the rate of return. The math is unexplained and I suspect doesn't reflect a real world rate of return of the fossil based industry. People are going to be upset with their renewable strategies being minimized, probably because that was their last best hope. You pointed out some obvious oft repeated points about renewables needing subsidy (hidden or otherwise) from fossil fuels to exist,but even these comments upset folks. Too bad. What I would like to see emphasized is that solar and wind have a great future as well as a great past, and essential applicability going forward, but not for generating electricity but for doing work directly, grinding grain, pumping water and the like. Wind and water are extremely efficient driving dynamo generators yielding over 90% efficiency but once they jump on the grid you face line losses depending upon the distance from the source. Solar electricity generation is very inefficient and faces long term issues you covered. Solar is very diffuse but it works fabulously well for heating structures, water, and for drying. The final point of emphasis is the low efficiency of fossil fuels especially in transportation engines which perform in the 30% range. Burning coal is better in the best combined cycle plants, approaching 40%. Gas plants almost 50% better and not spewing heavy metals and leaving contaminated waste.If this isn't a reason to end coal powered generation, I don't know what is. I am from Wyoming and could get shot for that comment. Gail, you are so polite upsetting people's applecarts. Yesterday, I was on a long hike with some very fine, intelligent and oh so wealthy folks high above Jackson Hole. I tried to point out the risks of living in a remote mountain town devoid of resources, unable to feed itself and at the tail end of supply chains. I don't think I persuaded anyone. Once they have wrapped themselves in their Lexus Suv on their way to their Gulfstream where Ben Bernanke and his financial cronies are climbing off theirs, they just don't perceive the risk to continuing their energy extravagant lifestyles.The Bourbons didn't see the risk either. In conclusion, it is going to be painful to lose posts and comments such as yours with such a high level of value as we put TOD to bed. Thank you again , Gail.
robert wilson on August 3, 2013 - 7:02pm Permalink | Subthread | Parent | Parent subthread |"The math is unexplained"
Try this:
In this example The EROI is 1:1.1 because every time you put 1 unit of energy you get 1.1 units back. That is how EROI is measured. In this example the length of time of this cycle is 1 day.*
At the start of the year the oil sands company (SandTarInc)has 100 units of energy. This is the "energy investment" that the company uses to start up the operation for the whole year. This energy was lent to it by "society" and "society" had to forego some quality of life in order to give it to SandTarInc so they could start up the tar sands mining operation.
Importantly, all future energy required to keep the operation running will be taken from energy-flow that is generated as they goes along. Although all of the energy ever spent is acouunted for in the EROI accounts (to give us our 1:1.1m ratio) - only the first 100 units was ever put at risk and temporarily foregone by "society" the rest of it was just re-invested over and over again.
SandTarInc uses all 100 units on the first day, and at the end of the day it has produced 110 units of energy. It gives 10 units of energy back to "society" which has been waiting all day to have it's hot bath, and keeps 100 units back so it can operate again the next day.
The next day it again uses the entire 100 units that it saved from the last day but again produces 110 units. Again it gives 10 units back to society for its hot bath, and keeps 100 units back for the next day's operations.
He does this every day of the year except on December 31st when the CEO decides to quit to become a blogger about peak oil and the company folds. On this day it does not need to keep 100 units back for the next day so it gives that back to "society" as well.
So, "society" invested 100 units of its precious energy in SandTarInc at 12:01 on January 1st. It was then repaid 10 units of energy every day of the year. Therefore, over the course of the year received:
365 * 10 units = 3,650 units.
On the last day "society" was also given back an additional 100 units as it wasn't needed any more.
3,650 + 100 = 3,750
So, "society" invested 100 unit in OilTarInc and after one year had been given back 3,750 units, so after one year, its annual return was:
3,750 / 100 * 100(%) = 3,750%
And that's why the annual "internal" rate of return was 3,750% when the EROI was only 1:1.1
I hope that isn't patronising but you did say you didn't understand the maths. I had previously assumed it was obvious.
*Note: this is an oversimplified example that assumes 100% operational energy costs and 0% capital costs, but in a surface mining oil sands operation this is not such a terrible approximation - the vast majority of the energy costs are "variable" cost used throughout the life of the operation to power the machines that extract and transport the sands and then separate the bitumen from the sand. Relative to that the energy sunk in capital machinery is tiny over the lifetime of the operation.
Substrate on August 3, 2013 - 8:20pm Permalink | Subthread | Parent | Parent subthread |The math is technically correct. However in the real world such examples might be phony due to unaccounted monetary and energetic costs.
robert wilson on August 3, 2013 - 10:38pm Permalink | Subthread | Parent | Parent subthread |EROEI accounts for the energetic costs - that's the point. The monetary costs - I think that's why he picked out the examples he did. If a project doesn't make a monetary return on a scale we believe is appropriate we scoff at it, although it might be entirely suitable on an energy basis.
The biggest fault, by far, has been the lack of taking externalities into account. Pollution, displacement, etc. With biofuels it comes as soil mining and displacing of fields that could be used for food. There may also be pesticide pollution involved. Tar sands use a lot of water, fracking pollutes the water table.
AlanfromBigEasy on August 4, 2013 - 8:59am Permalink | Subthread | Parent | Parent subthread |Does ERORI account for the massive amounts of energy from nuclear radiation and gravitational collapse that originally allowed for the epithermal concentration of minerals? Does it account for the energy used to mine minerals essential to the energy industry or the energy consumed by workers (and their families) that commute to coal mines, stripper wells and wind farms?
hardhat on August 5, 2013 - 6:14am Permalink | Subthread | Parent | Parent subthread |Does EROEI account for Kim Kardishian ?
Without her to "entertain us", perhaps the workers and their spouses might not be motivated enough to not call in sick one day ?
The boundaries can be very wide in accounting for EROEI. Kim apparently (empirical evidence) performs some function in our overall economy. In theory, I personally cannot describe exactly what, but there is ample empirical evidence that she has some very indirect effect on EROEI.
Alan
Hoover on August 5, 2013 - 8:22am Permalink | Subthread | Parent | Parent subthread |The EROI is calculated daily, but the IRR was calculated annually? No wonder the IRR looks so good compared to the EROI.
I guess I am thinking that a 10% interest on my savings ( EROI 1.1 for every 1 I had the day before) , as a daily rate of return, would make me a rich man pretty fast, but on an annual basis, its less than a wash with inflation.
They burned up an enormous amount of energy to extract that 3,750 units which means society probably had to pay for that in other ways, i.e. heat pollution, greenhouse gas emissions, whatever.
Its not a pretty picture however you want to look at it. But if its all you have...
Nick on August 5, 2013 - 6:35pm Permalink | Subthread | Parent | Parent subthread |Hi Hardhat
You are right - the EROI in the first example is terrible, a horrible amount of energy has to be invested in order to keep supplying some net energy.
But as far as society is concerned it really doesn't matter. The net energy produced each year is still huge relative to the initial investment in energy. We are rich!! (in that example anyway, and at least until the tar-sands run out or the planet over-heats).
My point is that if you just focus on energy returns, and don't worry about environmental impacts or any constraints or limitations on the resource (which are not captured by EROI either) then some energy production operations will provide easily enough annual net energy returns on investment - despite having a very low absolute EROI - to keep society chugging along very happily. Meanwhile other types of primary energy production ("capital intensive" ones) might have quite a good EROI, but actually supply from those sources might not keep up with demand, giving us a big problem. Rate of net energy return (or Energy IRR) is much more important for society to know than absolute returns on energy.
Actually having looked at recent energy costs for solar PV, I am already getting more and more comfortable about energy returns. Without having applied enough academic rigour to strongly stand behind this, my own desktop-research is showing an Energy IRR of about 20% for good PV, supplied to a near-by grid with demand matching supply profile. That is very encouraging as it shows that PV - the least constrained of all energy resources and one with huge potential for further efficiency/cost-reduction gains - is already well ahead of the kind of growth levels that make society function well (which it has to be to drive available wealth, but growth is exponential so any difference at all will scale quickly).
Unfortunately I suspect that the amount of PV that can be supplied in this 20% scenario is relatively limited - the next stage would be to add bigger and bigger transmission lines and more and more overnight storage plus new electric vehicles - and that would incrementally take that E-IRR down to a much less comfortable level and eventually negative. The challenge for society is to keep improving the technology at a rate that is faster than the rate at which we will have to move to add capacity in the less atractive locations. I am quite optimistic about that, and I think we have quite a good timeframe to achieve it especially relative to what has been achieved already in the last 8 years alone.
AlanfromBigEasy on August 5, 2013 - 8:01pm Permalink | Subthread | Parent | Parent subthread |I would guess that a 100% renewable grid would be roughly very, very roughly 30% solar, 50% wind, and 20% other. Solar doesn't really need to provide anything like 100%.
Wind is around 50:1...
esldude on August 5, 2013 - 7:42pm Permalink | Subthread | Parent | Parent subthread |It very much depends upon the location. Solar in Iceland - not. In Saudi Arabia, potentially quite a bit.
Hydro and geothermal take as large a % as the local resource allows. HV DC (to trade renewables) and pumped storage will have to figure in most renewable grids.
Brazil could be 85% hydro, 18% solar and 2% wind for example. Iceland is about 70% hydro, 30% geothermal. etc.
Alan
Strummer on August 6, 2013 - 4:12am Permalink | Subthread | Parent | Parent subthread |Math was obvious to me.
I also think Hoover is onto something important. EROI has to add up in the positive to even have a chance for an energy source to be viable. But the rate of return is also very important, economically and otherwise. Perhaps more so than total EROI.
Looking at nature, haven't you wondered how it functions at such a low EROI? Plants and things are perhaps 2% efficient in converting solar to energy. Yet nearly all life is built upon this base of photosynthesis. Some of that is possible due to the rate and not just the total return. A small EROI per batch can be a large resource indeed if the batches are turned very quickly. Just like in Hoover's example.
That immediately points to one of the reasons solar hasn't taken off I think. The rate of turnover and payback is too slow and drawn out. Even though the total EROI is not too bad it just doesn't quite add up in the sense of rates of energy and rates of investment. It also points to maybe a different strategy for replacing fossil fuels. Things that can turn over quickly are more valuable to the flow of energy. It is the total flow our culture and economy are built upon. Yes, fossil fuels once had an EROI approaching 100, but they also had a very high rate of energy flow. Drilling wells didn't take long. Now with offshore deepwater oil drilling even if the EROI is positive look at the lag in flow how it impacts the rate at which energy is available.
Energy return rates on energy invested is a much more meaningful measure to our energy needs. Economies, civilizations, life itself are about energy flow rates. Feedbacks are about flow rates not total amounts. Money in terms of wealth is about money flowing in faster than it goes out more than about totals.
Nick on August 6, 2013 - 2:48pm Permalink | Subthread | Parent | Parent subthread |Looking at nature, haven't you wondered how it functions at such a low EROI?
Slowly. Very, very, slowly. And that's the problem. Nobody is saying that humans can not function at those energy rates. We did for million years, after all. It's just that those energy rates are too slow for our current civilization and our current population numbers.
Strummer on August 7, 2013 - 3:48am Permalink | Subthread | Parent | Parent subthread |Well, plants are pretty inefficient: overall, well below 1%. PV does a lot better. And, of course, wind is still at 50:1 EROEI.
The sun drops 100,000TW continuously on the earth - we're surrounded by vast, high quality energy - it's just a matter of figuring out how to capture it. And, we've now done that.
Nick on August 7, 2013 - 9:46am Permalink | Subthread | Parent | Parent subthread |Yes, but why are plants so slow? Because they depend on the cycle of water, nitrogen, phosphorus, etc... And they had billions of years to optimize those processes to run for another billions of years. We may have figured out how to outsmart them, but we did it by depending on external sources for metals and raw materials, sources that are just as limited as fossil fuels. The plants' solutions may be very slow, but they are infinitely scalable. Ours aren't.
FMagyar on August 6, 2013 - 1:07pm Permalink | Subthread | Parent | Parent subthread |Plants have grown just as far as they can.
No question humans have limits too, but we haven't really come to those imposed by energy supply. Pollution, on the other hand...
We need to eliminate FFs ASAP.
Nick on August 6, 2013 - 2:45pm Permalink | Subthread | Parent | Parent subthread |That immediately points to one of the reasons solar hasn't taken off I think. The rate of turnover and payback is too slow and drawn out. Even though the total EROI is not too bad it just doesn't quite add up in the sense of rates of energy and rates of investment. It also points to maybe a different strategy for replacing fossil fuels.
Perhaps not...
All of the US energy capacity added in March was solar-all 44 megawatts
For all the talk of a natural gas boom, it takes time to build multibillion-dollar power plants to take advantage of the current glut of cheap fuel. Case in point: In March, the US added a whopping-wait for it- 44 megawatts (MW) of new electricity generating capacity, according to the Federal Energy Regulatory Commission (FERC).
That's enough to keep espresso makers humming in about 30,000 American homes. Not exactly China-scale. But here's what's really interesting about that number: March marked the first time that 100% of new generating capacity in the US came from photovoltaic, or solar, power plants. (FERC doesn't count the electricity generated by solar panels installed on residential rooftops.)
...Why? It's simply much quicker and cheaper to install thousands of solar panels or erect wind turbines than build a complicated and capital-intensive natural gas power plant.
AlanfromBigEasy on August 3, 2013 - 6:30pm Permalink | Subthread | Parent | Parent subthread |Part of they dynamic here is that electricity demand is pretty flat, so new capacity isn't really needed. But...consumers still want solar, so they'll keep installing, and taking market share away from FFs.
WeekendPeak on August 4, 2013 - 6:09pm Permalink | Subthread | Parent | Parent subthread |I disagree with a number of your conclusions and the points made by Gail.
Renewables are viable sources for a high fraction of the electrical grid.
Unfortunately, I will be busy for a couple of days to properly refute her points.
See http://www.theoildrum.com/node/10052/972684
on this post.
Alan
Nick on August 5, 2013 - 6:38pm Permalink | Subthread | Parent | Parent subthread |On EROEI boundary conditions: http://connectrandomdots.blogspot.com/2012/07/test-post.html and analysis: http://connectrandomdots.blogspot.com/2012/12/scope-of-analysis.html
Rgds WP
karlnick on August 1, 2013 - 1:48pm Permalink | Subthread | Parent | Parent subthread |Gail, do you really feel that renewables are subsidized more heavily than fossil fuels??
What about the $2T oil war recently fought by the US to ensure the stability of oil supplies? That investment would have bought a lot EVs.
What about mountain top removal, coal ash, mercury, and CO2?
What about the vast subsidies to fossil fuel provided by governments around the world? $.10 per liter for gas in Venezuela, or Saudi Arabia isn't a subsidy?
Do you really see the oil industry as generating a lot of taxes? Remember, fuel taxes don't go into the general fund, they simply pay for road maintenance. Further, both the Federal and local governments subsidize road consruction and maintenance heavily.
Finally, do you really not believe in Climate Change, and the cost of all that CO2 pouring into the atmosphere?
Why, oh why, do you defend fossil fuels so much?
Gail the Actuary on August 1, 2013 - 2:03pm Permalink | Subthread | Parent | Parent subthread |To use wood as a heat source money need to be invested in a heating system and maybe also some forest.
An intersting thing with forests are even though it takes 70 to 80 years for the trees to grow large some large trees could be harvested every year provided that there are trees in all ages available. It is also possible to deplete the forest totally so no large trees could be harvested for 70 to 80 years.
Peat (turf) are continuosly replenished so even if takes thousands of years for a thick layer to develop some could be harvested every year but it could also be totally depleted so that it will take thousands or at least hundreds of years before any ny peat (turf) could be harvested.
I never heard any numbers of how fast other fossil fuels buried deeper in the earth like: natural gas, oil and coal replenish. Under the right conditions I guess it would possible to build a trap of silt or clay above peat (turf) so an oil accumulation is formed over time but in such case the peat (turf) can't be used today.
Ghung on August 1, 2013 - 2:25pm Permalink | Subthread | Parent | Parent subthread |Historically, there has been a lot of problem with deforestation, apparently even as far back as 4,000BCE, according to Sing Chew, "The Recurring Dark Ages". It is very tempting to cut down too many trees. For one thing, this can provide more arable land, at least until erosion depletes soil level. Even more importantly, forests can be used for heating homes and for making charcoal, to be used in making metals and glass. It is this use that tends to quickly lead to deforestation.
Peat in remade at a very slow rate. According to Wikipedia, "Peat usually accumulates slowly, at the rate of about a millimetre per year."
Wikipedia also says, ". . . peat is not generally regarded as a renewable source of energy, due to its extraction rate in industrialized countries far exceeding its slow regrowth rate of 1mm per year,[6] and as it is also reported that peat regrowth takes place only in 30-40% of peatlands." I don't think we should count on much from peat.
zaphod42 on August 1, 2013 - 6:05pm Permalink | Subthread | Parent | Parent subthread |It comes down to population and extraction rate. Avoiding overshoot is the key, something we'll come to terms with soon enough.
There's plenty of free energy if one just learns to utilize it. Passive solar/passive cooling are grossly under-utilized, and much higher levels of insulation and better construction techniques are examples of where efficiency and resilience coexist nicely. Many of our structures are much too big. Simply wearing the right clothing for the seasons and letting our bodies adapt to seasonal changes can reduce the need for external energy sources.
Gail the Actuary on August 2, 2013 - 10:01am Permalink | Subthread | Parent | Parent subthread |Isn't the problem more that we do not, conventionally, include all energy inputs when calculating EROEI. That is at least in part because they are so difficult to quantify. For instance, oil includes cost of producing pipes, cost of rigs, transportation of labor daily to and from rigs, storage facility manufacture, and later demolition, etc., etc. ad nauseam. Consequently, the input value is almost certain to be in error.
Then there are inputs later on in the cycle. Deliver vehicles (pipelines, railroads, rolling stock,) roads, more pipe manufacture, ships, disposal and clean up, and so forth.
Then there is the time value of money if there is a long time involved between start and delivery (by burning, or transforming into useful things).
I think it is more difficult to quantify the input than the output by far. The energy value of an oil or any hydrocarbon product can be measured easily in caloric terms.
Add to that the fact that some products are valuable not as energy delivery, but rather in some other sense, and can be used to create profit, even if at a net energy loss. Oil and gas would be extracted at negative EROEI for use in production of certain pharmaceuticals, and gas for use in production of plastics, as a few easy examples.
What we are left with is some generalities, and a "feeling" that at some point our economy will no longer be able to sustain if EROEI is too low.
Craig
Strummer on August 1, 2013 - 12:13pm Permalink | Subthread | Parent | Parent subthread |The EROEI calculations have been "sold" as a way of telling whether an energy product is "working" in terms of providing adequate energy for investment. Yet our economy is now presenting the classic symptoms of not enough net energy, and EROEI doesn't have a way of really showing this. EROEI values have generally been moving down over time. They also vary greatly around the world--something I doubt academic studies have been able to investigate in any meaningful way. The high EROEI values of the past have subsidized our economy, but there is no from the EROEI values of knowing when this subsidy is now inadequate.
Hoover on August 2, 2013 - 12:26pm Permalink | Subthread | Parent | Parent subthread |Hoover: "An oil sands operation could have an EROI of 1:1.1 - but it wouldn't matter if it was making that return on a daily basis. It would be returning 3,750% of the initial energy invested every year. A solar PV installation might have an absolute EROI of 10:1. But if that 10 fold return happens over the course of 100 years then it is only returning 10% per year."
I think you are looking at it wrong. EROEI is supposed to measure the TOTAL investment and TOTAL return over the entire lifecycle of a resource. Of course, that means that it is a very abstract measure, and a very hard (or nearly impossible) to calculate properly. Nevertheless, when you calculate the totals, then your examples are not correct, the first one would have a much higher EROEI and the second one much lower.
Nick on August 5, 2013 - 6:19pm Permalink | Subthread | Parent | Parent subthread |Hi Strummer, I hear what you are saying but I am already doing that. Obviously I have over-simplified in both cases and just used illustrative numbers, but that is just to demonstrate a point about rate of return versus absolute return it's not supposed to be a comment about either technology.
The PV example already uses the full lifetime of the PV panel - it has to because it is 100% upfront Capital investment and 0% ongoing operational investment. The tar sands example was the exact other way around 0% capital and 100% operational cost. Because it was 100% operational costs and the operational cycle in my example was 1 day, I just worked on that basis, but if the resource lasted 100 days (or years) both the inputs and the returns would be multiplied by 100 and you would still get the same EROI.
Of course in real life there will always be some capital investment so you will always have to work on the basis of the full lifetime of the investment (and likewise there will always be some ongoing operational costs as well). But none of that changes the point that EROI does not account for time and hence tells us next to no useful information about how free energy will flow to society or how that energy could be re-invested to make sure that even more free energy flows at some point in the future when we might need it.
Let's take it to the far extreme:
I find a resource into which, when I put 1 joule of energy it will pay me back 1.01 joule after 1 second. It doesn't matter how may joules I put in, I always get 1% more back in return, so it has an EROI of 1:0.01. If it was a limitless resource and I started the day with enough energy to power an LED lightbulb for 1 second, and kept on reinvesting my 1% gains every second, by the end of the day I would be producing - with my energy source EROI of 1% - far far more energy every minute than the entire human race could possibly consume in its history before our Sun goes super nova.
But if I had an energy source of EROI 1:1,000,000 that had a 100 year production cycle with all of the energy returns being generated in one go at the end... well it might have been some use to my grandkids, but they were never born because my own kids and I starved to death first.
They are stupid examples, that obviously don't exist, I am just trying to point out that to measure energy returns without knowing the rate of return is of purely academic interest and of no use to society.
Robert Rapier on August 6, 2013 - 6:46pm Permalink | Subthread | Parent | Parent subthread |This is a very good point, but more importantly: no financial investor would give you the time of day if you told him either the EROEI *or* the energy rate of return, without knowing the financial IRR.
EROEI is really only useful for analysis of unusual cases, like biofuels, where subsidies are large or the business case is still very theoretical. In the case of almost everything else, like PV and wind, the EROEI is "good enough", and the financial case (combined, of course, with all of the other important factors, like internalization of pollution and security) is the most important thing.
So, for instance, PV is now nearing and surpassing grid parity in many places, as the Germans, good engineers that they are, knew that it would.
Nick on August 6, 2013 - 7:26pm Permalink | Subthread | Parent | Parent subthread |"An oil sands operation could have an EROI of 1:1.1 - but it wouldn't matter if it was making that return on a daily basis. It would be returning 3,750% of the initial energy invested every year."
I point that out every time I talk about EROI, and I used an example like the one you did above. The other major caveat is that unless you are talking about fungible energy inputs you could have a situation with a poor EROI and great economics. The EROI in that case just means you are accelerating the depletion of the input energy, even though it may be cheap input energy.
Hoover on August 7, 2013 - 11:31am Permalink | Subthread | Parent | Parent subthread |Fungibility of energy inputs and outputs is such a basic problem.
What if the inputs are cheap natural gas, and the outputs are peak electricity, which is worth 3-10x as much per joule (to the grid and it's consumers) as the NG?
Or cheap NG, vs expensive liquid fuel?
Nick on August 7, 2013 - 12:28pm Permalink | Subthread | Parent | Parent subthread |Surely EROI (or E-IRR!) is only applicable to situations where primary energy is being produced?
As a power station developer I can honestly say that of the couple dozen or so projects I have worked on over the years not a single one of them had an EROI above 1:1 or a positive E-IRR.
At this point this is where the good old financial returns help us out - and as you said earlier Nick, we can never forget about those.
For energy accounting purposes though, I think some simple principles can give us a good idea:
gas to power: based on the efficiency of a good CCGT gas to liquids: volume weighted average of (a) efficiency of a GTL plant and (b) small scale liquefaction plant (volume weighting of LNG to depend on amount of LNG used in transport in that country, changing over time) power to liquids: arbitrage through gas liquids to other liquids: crack efficiencies anytime power to peak power: pumped storage efficiency etc etc etc
Roger K on August 7, 2013 - 7:29pm Permalink | Subthread | Parent | Parent subthread |I think some simple principles can give us a good idea
I take it you mean that these are good benchmarks for comparison & evaluation of a proposed project?
One quibble: for "anytime power to peak power": efficiency may be only a secondary criterion. In particular, if we're shifting surplus wind power from one part of the year to another, capital cost will be the overriding factor, not efficiency. So, a plant that uses surplus wind power to create hydrogen or methane (to be stored underground, or in the NG pipeline network) needs to have capex costs that are much, much lower than pumped storage, and can handle relatively low input./output efficiency.
Surely EROI (or E-IRR!) is only applicable to situations where primary energy is being produced?
Well, both wind and PV produce electricity, which is 3x as valuable as FF primary energy, joule for joule. If PV has a EROEI of 10, but uses NG to heat it's polysilicon, and outputs peak electricity, it's EROEI is arguable 3-10x higher, as a practical matter.
Nick on August 7, 2013 - 7:49pm Permalink | Subthread | Parent | Parent subthread |Most rate of energy return issues can be analyzed into resource cost issues. For example bio-energy crops require a growing season, so there appears to a time issue involved. But if we had enough fallow land available we could get very high yearly return rates. The fundamental economic issue is the opportunity cost of land use and not the rate at which crops can be produced. Of course energy balance matters since you need to know how much useful energy was produced for a given resource input.
Similarly how fast we can extract oil from the Canadian tar sands depends on how much capital and labor we are willing to invest. Again the basic issue is the opportunity cost of investing such resources rather than a time issue per se.
The use of EROEI as an economic parameter can charitably be interpreted as an attempt to make the input energy serve as a marker for the total resource opportunity cost of producing energy. But the idea that dealing with dimensionless energy ratios frees us from the complex process by which value is placed on various production resources is pseudo-intellectual delusion.
Boof on August 1, 2013 - 8:50am Permalink | Subthread |it's most useful for unusual situations, where EROEI is very low, or negative.
A classic example is Soviet toilet paper: if you subsidize it too much, the toilet paper makers start buying it from the stores, and using it to make new toilet paper, because it's cheaper than the normal wood feedstock!
Gail the Actuary on August 1, 2013 - 9:16am Permalink | Subthread | Parent | Parent subthread |I think high EROEI is necessary based on a couple of informal questions 1) what distinguishes us from hunter gatherers? 2) why can't we shake off coal?
We are different to Neolithic people because we have cars, computers, electric toothbrushes, air conditioning and effective medicine. These and a myriad other things make up the obligatory energy load for modern society. There's no EROEI for Medicare but the system needs high EROEI to pay for it. We used to get by burning wood grown in realtime then we changed to accumulated fossil fuels like coal, oil and gas. Now some think we can go back to realtime energy fluxes. Maybe not.
The coal and gas fudge. We look at PV and wind turbines and think ain't they sweet but without the despised fossil fuels we wouldn't have the necessary steel, silicon and cement nor most backup power. As Gail says things will be tough without fossil fuels unless wind and solar get to run their own mines, furnaces and factories.
Germany has an aggressive renewables program but is building new coal plants. Same goes for China who are now starting to publicly worry about extreme weather. There was an excellent show 'Ten Bucks A Litre' on Australian TV tonight hosted by businessman Dick Smith. He flew his own exec jet, helicopter, prop plane and ultralight to various energy installations. He covered nukes, wind farms, off grid PV, EVs, conventional and coal seam and shale gas, solar thermal and efficiency. There waiting on the coastline were all the coal ships going to China, India and elsewhere. For now some are saying we don't need no coal others can burn it for us. Maybe all the low EROEI stuff is a big delusion for domestic consumption so long as we can import manufactured goods made with coal.
speculawyer on August 1, 2013 - 7:29pm Permalink | Subthread | Parent | Parent subthread |I think trying to discourage coal usage internally while allowing importation of goods made with coal from the rest of the world is counterproductive. What happens is we send manufacture of goods overseas, where they are made with coal. Sending manufacturing of goods overseas has a multiplier effect, because those countries suddenly need all of the services, roads, and new homes that go with new prosperity. These are all created using coal. At the same time, the US and other developed goods get the "reverse multiplier" effect of losing the jobs that would have gone with manufacturing if it had stayed here. Think of Detroit, with its lower population, and less need for school teachers, police (?), grocery stores, and many other things.
Most of the time humans and pre-humans have lived on earth, we were hunter-gatherers. Even then, we did not live very sustainably, because we killed off the large animals and not-so-smart animals, such as the auk, as soon as we moved to new territory. We also burned down woods, in attempts to force animals out to where we could reach them. Even back then, we had a problem with rising population, so there was no doubt fighting among groups. I think the main thing that distinguishes us from hunter gatherers is that there are more of us now, so we have a need to use more resources than what can be obtained from simple hunting and gathering.
We can't shake off coal because in any economic contest, "cheap wins." Coal comes out at the bottom, or near the bottom, in almost any cost comparison.
tstreet on August 2, 2013 - 9:15am Permalink | Subthread | Parent | Parent subthread |Well perhaps what we need is a 'coal tax' put on imports from any nation that uses more than X amount of coal per capita. I agree eliminating CO2 output here only to have it increased overseas does not solve anything.
And if you look at the pollution in some coal-heavy areas, you'd think that they also realize that they need to reduce coal usage as well.
Ghung on August 2, 2013 - 9:49am Permalink | Subthread | Parent | Parent subthread |I don't know whether we can get off coal, but accepting Gail's thesis, it doesn't sound like we get off fossil fuels in general until we become unable to extract them. But since, apparently, renewables are dependent upon fossil fuels, we eventually end up in a hunter, gatherer situation assuming there is anything left to hunt and gather.
There is still a bit of an unknown for me as I see the production of solar, for example, becoming increasingly efficient. Will there ever come a day where solar electricity can be produced without any or significant fossil fuel input. I know this is a trivial example but I see some of the ff input being reduced locally by the fact that a local PV installer brings their panels and tools to the site via a bike hauler. Trivial but maybe it is the beginning to breaking down the whole process and trying to attack each step by figuring out a way to reduce or eliminate ff input.
Well, at least the bears and the ground squirrels here locally have figured out a way to deal with seasonal heat and cold with respect to their housing needs. But with 7 billion people and counting I think we will be overrun with global warming before we make a dent in this problem.
AlanfromBigEasy on August 3, 2013 - 9:08am Permalink | Subthread | Parent | Parent subthread |"Will there ever come a day where solar electricity can be produced without any or significant fossil fuel input."?
Latching onto the idea that fossil fuels are a direct requirement for the production of solar panels misses a broader point, one I think Gail makes and many are missing:
Can the complex systems of exchange, manufacturing, marketing, etc., required to produce and deploy PV at scale continue to function as they are? It's a hyper-complex system that requires many inputs, mostly subsidized by fossil fuels. Many things have to go right. The big question is; can a broader economy dependent on fossil fuels and many other inputs (mostly dependent on fossil fuels to be brought to market economically) continue to function at a level that allows things like PV panels to be produced and deployed,, and will we be able to afford such without the fossil fuel energy subsidy? With so many things pointing in the wrong direction, I have serious doubts. I think we'll be too busy feeding ourselves and trying to not kill each other; all competing for a declining, more expensive energy base.
Gail the Actuary on August 2, 2013 - 10:10am Permalink | Subthread | Parent | Parent subthread |The availability of fossil fuels is not an "On/Off" switch but a complex progression that varies by fuel type, fuel demand and likely locality (see LNG trade by tanker vs. US NG prices and availability).
I can see a European nation where people move with their feet, bicycles, trams and trains but ambulances, garbage trucks and fire engines move with ICEs - powered with either FF or renewables. Almost all cars are EVs and 18% of the population owns one. (18 cars per 100 population). Goods move mainly with electrified trains, ICE barges & coastal ships, EV delivery trucks with some ICE trucks for longer distances. Farms use ICE tractors and farm equipment. ICE is powered by a combination of FF and bio-fuels.
Only 1% of the population flies in any given year, using FF. Sort of like 1965 in that way. Trips up to 800 km (500 miles) are routinely made with high speed, or just fast (150 kph or so), trains. Some trips longer than 800 km are also made by train, usually with a change of trains in a major city.
Per capita electrical demand is down by half (say 1/4th of current US electrical demand) and the capitas are down too, perhaps -10% from the peak population.
Electrical production is mostly renewables (hydro being a good part) with lots of pumped storage, perhaps some nuclear and the balance coal to fill the gaps. HV DC to transmit surplus renewables and import hydro & other renewables as needed.
Such a nation could produce solar PV when electricity is cheap i.e. when renewables are in surplus. They could also use electric arc furnaces to recycle steel - again when renewables are in surplus. Steel that could be used for wind turbines and their towers. This is exactly the sort of scheduled demand needed for a high renewable grid, EV charging is another.
And this is clearly the trend for France and Denmark 2040+.
And it could be the United States as well. The French effort could be duplicated with a quarter of our subsidy for cheap gasoline and diesel - about $25 billion/year (adjusting for population and currency).
Both nations are net food exporters BTW.
Best Hopes for Those That Prepare,
Alan
For Denmark, hydro and pumped storage are in Norway. Today, four HV DC lines are in operation between Norway and Denmark. The basic trade is Danish wind (when in surplus) for Norwegian hydro (as needed). Somewhat similar trade between France (excess nuke power late at night) and Switzerland.
bristlecone on August 1, 2013 - 10:08am Permalink | Subthread |Actually, I think the limiting factor on fossil fuels will be sales price dropping too low, to keep up production. This limit will be reached because debt for goods like cars and homes doesn't keep growing, and because wages don't rise by much, so consumers cannot afford cars and new homes. Unwinding quantitative easing can also expected to have a downward impact on commodity prices, including those for energy products. So we indeed will get off fossil fuels, quite possibly in the very near future, because of prices too low to sustain production. This will not be a nice way of doing it, however.
HalfEmpty on August 1, 2013 - 10:20am Permalink | Subthread | Parent | Parent subthread |I need to comment on the rigor of this post. Analysis is not a proof-by-picture process. The association of oil price and wages in fig 2 is suspect. Such a claim would produce...eyeballing the picture.... a poor correlation. However, that is my point. The sweeping claims of this post are not convincing when built on poor analysis. Fig 2 and subsequent claims is a classic case of cherry picking. Shame on ToD for posting this. The quality used to be higher.
Ghung on August 1, 2013 - 10:38am Permalink | Subthread | Parent | Parent subthread |Rigor? Hell the Term EROI was used, what more do you want? Running with the Red Queen? BAU? Oldivi?
bristlecone on August 1, 2013 - 10:42am Permalink | Subthread | Parent | Parent subthread |"Shame on ToD for posting this."
Shame on you for not being more specific in your counter-points. Pot calls kettle black.
Ghung on August 1, 2013 - 11:01am Permalink | Subthread | Parent | Parent subthread |What is not specific about my claiming that Fig 2 should be a regression analysis to have any merit?
Specifically: a lagged regression model comparing change of wage with oil price.
It's not hard. A one-liner in any stat language given the dataset.
bristlecone on August 1, 2013 - 11:04am Permalink | Subthread | Parent | Parent subthread |If it's not hard, perhaps you can offer a more accurate analysis; fill the void you have created. Criticism is not a solution.
Gail the Actuary on August 1, 2013 - 12:34pm Permalink | Subthread | Parent | Parent subthread |It is called peer review. Something the editors should have done.
bristlecone on August 1, 2013 - 1:04pm Permalink | Subthread | Parent | Parent subthread |What I am saying is that the absolute level of oil price is important, relative to the change in wages. This is different from what you are trying to test. The reason is the one I gave--When oil prices are low, there is a large difference between:
A. The cost of extracting a barrel of oil
B. The value of that barrel of oil to society as a whole, in terms of additional human productivity, and hence additional goods and services that barrel of oil could provide.
This difference can, over time, feed into wages, because it looks like increased efficiency for humans, together with increased profits for a company. When oil prices are high, this difference disappears, and this difference can no longer act to support wages.
Gail the Actuary on August 1, 2013 - 1:34pm Permalink | Subthread | Parent | Parent subthread |If that is what you are arguing then the figure should be plotted as the relationship between those variables over the entire dataset. Otherwise, you are hand-picking data to support your argument and providing no statistical evidence of its likelihood. Plot: X-axis = absolute price of oil and Y-axis = change in wages (i.e., wage(t)-wage(t-1)). Perform regression (I would suggest at least a lag of 1-year) and post the r^2 values at least. I'm not saying you're wrong, I'm saying that Figure 2 is not evidence to support your argument; therefore, you have no argument.
Edit: As I posted below, if you post the raw data I will do the plot. I will plot: panel(a) the raw data as a time-series to recreate your figure (so everybody sees that it is the same dataset) and panel(b) the regression described above. I will even search over all possible lags to find the highest r^2 value to best support your claim. However, I am not satisfied with the evidence provided and it is below the lowest level I have yet seen on this site.
bristlecone on August 1, 2013 - 3:07pm Permalink | Subthread | Parent | Parent subthread |I attached he dataset, which can be found at this link.
Gail the Actuary on August 2, 2013 - 10:32am Permalink | Subthread | Parent | Parent subthread |I converted Gail's Excel file to csv format, removed header information, and rescaled wages to match her figure exactly, Panel (a). Panel (b) depicts the relative wage dependent on oil price. Note, r^2 of 0.086 means that only 8.6% of the variance is explained by the model http://en.wikipedia.org/wiki/Coefficient_of_determination. Panel (c) depicts r^2 values over various lagged regression models. The best explanation is a 7 year wage lag (r^2=.33 is still pretty weak evidence but moving in the right direction).
Here is the link to the figure. http://i.imgur.com/W5rENe3.png
Here is the source code Matlab version: 8.0.0.783 (R2012b)
%======================================== % Source: test_oil_wage.m % Author: bristlecone % Date: Aug 1, 2013 % % Purpose: Validate/refute hypothesis of the % relationship between abs oil price and % relative wage %======================================== clear all; close all;
%Format wages into figure units data = importdata('oil_wage.csv',','); data_v2 = data; data_v2(:,3) = data(:,3)*120/25;
figure(1) subplot(1,3,1); plot(data_v2(:,1),data_v2(:,2)); hold on; plot(data_v2(:,1),data_v2(:,3),'r'); hold off; %set(gca,'XTickLabel',data_v2(:,1)); title('Per capita non-gov wages compared to oil prices');
Nyears = 30; r2vec = zeros(1,Nyears);
for(i =1:Nyears)
lag = i;
regressX = data_v2((lag+1):end,2); regressY = data_v2((lag+1):end,3)-data_v2(1:(end-lag),3);
%Perform Regression p = polyfit(regressX,regressY,1);
%Compute r-squared f = polyval(p,regressX); yfit = p(1)*regressX+p(2); yresid = regressY-yfit; SSresid = sum(yresid.^2); SStotal = (length(regressY)-1)*var(regressY); r2 = 1-SSresid/SStotal;
r2vec(i) = r2;
if(lag==1) subplot(1,3,2) [ysort isort] = sort(regressX); scatter(regressX(isort),regressY(isort)); hold on; plot(regressX(isort),yfit(isort),'r-'); hold off; r2string = ['r^2=',num2str(r2)]; text(80,4,r2string); xlabel('Absolute oil price(year=t)'); ylabel('Change of wage: wage(year=t)-wage(year=t-1)'); end
end
subplot(1,3,3); plot(1:30,r2vec); xlabel('Wage lag'); ylabel('r^2 of model fit');
Ghung on August 1, 2013 - 1:48pm Permalink | Subthread | Parent | Parent subthread |I would observe that any mathematical model you put together has a number of built in assumptions. If a particular model doesn't fit, all that proves is that the particular model isn't right.
The way I look at things is to see what patterns I would expect to observe, based on the underlying interactions of the data. I want to understand how the system works first. Then I look at the data, to see whether it in fact fits the general shape I would expect. When I do the analysis this way, the data "makes sense." In general, growth in wages takes places when oil prices are low, but not otherwise.
Economics has developed an addiction to fancy models and expected changes in one variable based on small changes in other variables. These models may have nothing at all to do with underlying reality. The economy doesn't necessarily work in the way the model assumes. If a person can put together a sufficiently complex model that it somehow agrees with reality, there is a remote chance that it will have predictive power. But if it really doesn't incorporate the actual dynamics of how the "system works," the likelihood of this is very low. Starting from the assumption that year to year fluctuations changes are meaningful indicators of long term trends handicaps a person significantly in understanding the real interactions.
In my view, the best model is the simplest one. In fact, I talk about some indications of simple models in Energy and the Economy-Basic Principles and Feedback Loops.
Perk Earl on August 1, 2013 - 2:11pm Permalink | Subthread | Parent | Parent subthread |"However, I am not satisfied with the evidence provided and it is below the lowest level I have yet seen on this site."
Jeez, you are a bristly cone. Casting stones such as the above isn't improving the conversation nor the data. Best hopes for more constructive responses on all levels.
Scrub Puller on August 1, 2013 - 5:37pm Permalink | Subthread | Parent | Parent subthread |bristlecone you're detonating, which just comes across as arrogant since you are in this case merely a couch potato passing judgment on someone's else's effort. Why don't you contribute what you think would be a better fig. 2. Gail's given you the data link and you are apparently clear on what it should include. Have it done and posted by 5:00pm ET.
Matt on August 1, 2013 - 10:32am Permalink | Subthread |Yair . . . I am an old uneducated bushman and I tend to look at things through different eyes.
It won't happen but it is possible for humankind to live happy fulfilling lives without laying waste to all the wonder and beauty of this planet.
You have to get back to the basics. We need food, fresh water, a comfortable place to live and raise kids and creative things like art and storytelling and music to occupy our minds.
From what I have seen of the Pacific Islands, PNG and our own aboriginal cultures it seems to me populations were kept in check by the availability of local recourses and for the most part the people lived as described above.
Just as much pleasure can be obtained by gliding down a creek in a tin canoe as doing the same with a jetski . . . you just need the right mindset.
I too watched that Dick Smith program and found it quite disturbing to actually see the extent of the bull-shit going on to sustain an unsustainable way of life.
Cheers.
Gail the Actuary on August 1, 2013 - 12:06pm Permalink | Subthread | Parent | Parent subthread |A good example of what Gail writes about how companies try to survive:
HOLDEN OFFERS WORKERS PAY FREEZE TO KEEP ELIZABETH CAR MANUFACTURING PLANT OPEN 1/8/2013 Holden workers are facing a three-year pay freeze and cuts to conditions to keep the company's plant at Elizabeth in Adelaide's north open.
The car maker is looking to save $15 million annually in labour costs to stay viable.
John Camillo from the Federation of Vehicle Industry Unions says the future of 1,700 Holden workers hangs on their vote on Friday next week.
"Holden has made it quite clear that if the workers reject the variation they have decided to close the operation down in 2016," he said.
"There's no plan B in this one. The workers will make a decision on August 9 and if it's a no the company will close."
More than 50 per cent of workers must support the secret ballot for the changes to be accepted.
Mr Camillo says Holden's commitment to Australia is also dependent on continuing taxpayer support.
"If the workers say yes and the Federal Government is prepared to support GM there will be replacement of the Cruze and Commodore," he said.
Mr Camillo says a proposed 10 per cent pay cut has been taken off the table.
Holden's managing director Mike Devereux will be in Adelaide on Monday to speak to workers about the changes http://au.news.yahoo.com/latest/a/-/latest/18285088/holden-offers-worker...
My Last Words on August 1, 2013 - 11:26am Permalink | Subthread |THis really should be a comment in response to Bristlecone's post above. It is an example of why what I am saying is true about the connection of salaries with high energy costs. High cost feed through to lower worker wages.
bristlecone on August 1, 2013 - 11:52am Permalink | Subthread | Parent | Parent subthread |Gail, thanks for this interesting posting. However I think that this might be a typical case where the rule applies that correlation does not necessarily mean causation: It is true that wages went down when the oil prices were high - and the same is also true for many other industrialised countries. And I also can imagine that the oil price played some role But at least for the period after 2000 there were also other important factors that "helped" to bring wages down in these countries:
- I think that after the breakdown of the communist block there was a general shift in mentality to think that the western, capitalist system has shown to be superior - so the world would become even better the more capitalistic it gets. Thus, in many countries there was a strong tendency towards fixing or lowering wages (especially those of low-payed employees).
(Curiosly, as TOD readers know, the oil price also was one cause for the breakdown of the Soviet Union, which had problems with too little oil export revenues when the oil price was low.)
- Furthermore western enterprises felt challenged by the growing competition from China (especially in the area of low qualified jobs), which even more lead to bringing wages down to levels deemed "competitive" with China.
So, the oil price may have had its effect, but it is probably not the only cause. And it is probably almost impossible to disentangle this mess of causalities and effects.
sparky8 on August 1, 2013 - 12:03pm Permalink | Subthread | Parent | Parent subthread |I am not trying to troll this article today. I've been a daily reader of TOD for almost four years. However, this post crossed a line with me. Gail does not get a pass just because she is well known; she should be held to high standards, as non-technical people may take her at her word.
Correlation is not causation. This is true. However, she is claiming causal structure which is always correlated but may be so through a temporal lag (hence my requirement of lagged regression), or through nonlinearity (which is harder to show).
Gail's argument becomes invalid at the point of Figure 2. She has the data and as an actuary she should have the skills to produce a figure that satisfies my comment. Either she retracts the figure or she produces a new figure that overcomes my challenge. This is how quantitative arguments are made and supported. I'm not going to let TOD go to archive and mislead future readers and researchers without giving them pause as to the validity of the content . Either the authors step up or the editors step up, but this is not acceptable.
bristlecone on August 1, 2013 - 12:10pm Permalink | Subthread | Parent | Parent subthread |Can you disprove her figure 2? I believe the onus is on you...
bristlecone on August 2, 2013 - 8:07am Permalink | Subthread | Parent | Parent subthread |Without the dataset, no. If she posts it...I would be happy to run a figure and post the result with associated code.
And...no, the burden of proof is always on the author in the peer-review process...kind of like the "beyond a reasonable doubt" standard in law. Peer-review prevents tunnel vision and group think.
Gail the Actuary on August 2, 2013 - 10:37am Permalink | Subthread | Parent | Parent subthread |Figure 2 disproved. See my figure of the regression analysis in the post above.
bristlecone on August 2, 2013 - 11:08am Permalink | Subthread | Parent | Parent subthread |I disagree. The fact that a particular mathematical model doesn't fit just proves that this is the wrong mathematical model. It is not proving what I set out to show, which is verification that in general, the data is working in the direction one would expect it to work, from the underlying principles of the system. See my comment above.
The Wet One on August 1, 2013 - 4:27pm Permalink | Subthread | Parent | Parent subthread |And my argument is that you are responsible to show the correct model before making claims. I refuted the hypothesis class that you were using in your post.
Edit: I want to be very clear for 3rd party observers. Figure 2 is put forth as evidence of a correlation between absolute oil price and relative wage. I have shown via my analysis of the data that any such linear correlation (the common benchmark for such a claim) is refuted. Figure 2 should be retracted (or removed from the argument) unless a model of the data can be supplied that shows the claimed relationship.
Gail the Actuary on August 1, 2013 - 1:02pm Permalink | Subthread | Parent | Parent subthread |Ahhh.
One of the finest aspects of TOD comes to the fore. Learned, intelligent, focused and hard criticism of ideas, rather than ad hominem, bafflegab and nonsense that usually pervades discussion and debate essentially everywhere else on the web.
It will be a travesty great proportions to me when this place is gone.
AmyD on August 1, 2013 - 1:41pm Permalink | Subthread |I have been writing about globalization having an impact on wages, and indeed, this is a factor as well. In fact, I mention outsourcing to lower wage countries as being one of the issues.
Oil use and human wages are very closely related. The purchasers of human wages are also the purchasers of oil for making and transporting goods. If the cost of oil goes up, it disturbs the whole relationship. It raises the cost of the finished product. Higher oil prices also disturb demand for finished products of all types, because wage earners (including those not working for the company) find that their wages go less far, and must cut back on discretionary purchases. Hence, manufacturers are caught in a double-bind: less demand and higher costs. They must cut in one way or another, or go out of business. Wages are always affected. Note that in my calculation of wages, dropping out of the workforce or unemployment also counts as a reduction in wages--not just a cut in hourly pay.
The fact that other industrialized countries are seeing the same effects is showing that my theory is true, not refutation of it. They are big oil users as well, and have the same problems that we do.
Gail the Actuary on August 1, 2013 - 2:12pm Permalink | Subthread | Parent | Parent subthread |I am an Economics PhD student and I'm working on incorporating energy into macro models - and specifically hoping to show a relationship between EROI and wages. I wrote a short post about my model, which is definitely in the early stages, and I would love to hear feedback from TOD readers!
http://enginomics.wordpress.com/2013/08/01/oil-and-the-economy-part-2-of-2/
crunkcar on August 1, 2013 - 1:41pm Permalink | Subthread |This comment had been hidden, and I unhid it. The model proposed is incomplete, but seems to need a lot of work. I am sorry I don't have time to help with this, but perhaps someone else wants to look at this.
Gail the Actuary on August 2, 2013 - 10:56am Permalink | Subthread | Parent | Parent subthread |Of course Gail is an exceptional contributor, but with this kind of brilliant analysis appearing almost daily on TOD, analysis which is just not available on other sites, how can we imagine that TOD will go silent in just one month? Please say it ain't so.
crunkcar on August 1, 2013 - 3:47pm Permalink | Subthread |I continue to write on Our Finite World. In fact, Our Finite World carries many of my posts that are not on TOD. I often get 200+ comments on my posts on OFW. There are button on the front of the site for e-mail subscriptions (you may need to sign in to see it) and a place for RSS subscriptions. I also Tweet new posts, when I put them up. My Twitter address is @gailtheactuary . It is also possible to get notifications on Facebook and on LinkedIn of my posts.
AlanfromBigEasy on August 1, 2013 - 7:23pm Permalink | Subthread |The notion of momentum may be applied to oil extraction. This is closely linked to the price of a marginal barrel. The world is running on the momentum of past discoveries in Saudi Arabia Iraq and Russia.
If every oil of barrel used today required the same extraction price as current production in the Baaken or Albertan oil sands then the world's economy would be seriously in decline. But this is where we are headed, no doubt.
tstreet on August 2, 2013 - 10:14am Permalink | Subthread | Parent | Parent subthread |There is a solution - and both France and Denmark are going that way.
Per capita carbon emissions, 2007-2012, for Denmark are down -26.5%, France -14.8%.
Both are moving towards highly efficient oil free transportation. Both bicycling and electrified rail.
This is, perhaps, a "different economy", but I see it as a shift in priorities and mix.
Paris announced last March that they will double the Paris Metro, and make other major investments, so this transition should just speed up.
Best Hopes for Wise Public Policies,
Alan
AlanfromBigEasy on August 2, 2013 - 12:06pm Permalink | Subthread | Parent | Parent subthread |Is any of this reduction in carbon emissions attributable to importing more goods from China?
hot air on August 1, 2013 - 7:30pm Permalink | Subthread |Not materially. the EU imports less than the USA. I think Chinese imports may have dropped, rather than increased since the crisis of 2008.
Neither Denmark nor France has pushed solar PV (unlike Germany) so not much there.
Alan
WeekendPeak on August 2, 2013 - 12:16am Permalink | Subthread | Parent | Parent subthread |Doesn't globalisation increase wages? The effect you show of depressed US wages must be tiny compared to the boost in Chinese wages over the same period. If you want to claim that the net effect is depressing global wages, at the very least you have to include a decently representative sample rather than cherry picking US data to represent the global effect.
...
The idea that there is something magically better about energy from fossil fuel because it happens to be most of the current supply is a fantasy. Neither renewables nor fossil fuels care whether the energy used to extract them is renewable or fossil. Fossil fuels were originally extracted with renewable energy. That didn't prevent them being extracted with fossil energy later and the same goes for renewables.
...
EROI is a number that depends on arbitrary assumptions in its calculation to such as degree that the only useful information is whether its greater or less than 1. The exercise of calculating it can provide interesting information about a system, but its wholly inadequate for the sort of "society requires EROI of 5" type of argument. If you give someone an incentive to calculate an EROI of over 5, or 50, or 5,000,000 they can do so, as long as the system actually returns an excess of energy. And the converse is true. If you want to show that EROI is under 5, you can always do so. Its simply a matter of choosing where you define the system boundary. The analysis can be informative, but the only meaningful information in an EROI number that is divorced from the analysis that produced it, is whether its greater or less than 1.
Society needs more than 1, but EROI is not capable of measuring how much more than 1, because any number greater than 1 is interchangeable with any other at the whim of the analyst calculating it.
The financing effect Tom Murphy describes is real, but EROI is not up to the job of describing it. It requires using an energy analogue of the sort of tool that is actually used for evaluating financial investments instead.
bristlecone on August 2, 2013 - 8:04am Permalink | Subthread | Parent | Parent subthread |Thank you Reds wp
Gail the Actuary on August 2, 2013 - 11:13am Permalink | Subthread | Parent | Parent subthread |See my figure in the post above. The effect is very weak.
bristlecone on August 2, 2013 - 2:22pm Permalink | Subthread | Parent | Parent subthread |Also see my comment. Failure to prove, using a particular model, simply proves that chosen model is wrong.
zaphod42 on August 2, 2013 - 2:46pm Permalink | Subthread | Parent | Parent subthread |Gail's post makes a claim that my analysis, using standard methods on her dataset, refutes. It is the author's responsibility to provide some mathematical model that demonstrates the validity of the core statement of their argument. Otherwise, the argument is baseless. This problem should have been picked up by the editors of this site before posting. Again, I appeal to the editors of TOD to retract Figure 2 unless Gail can provide a model that supports her claim.
Pitt the Elder on August 7, 2013 - 9:17pm Permalink | Subthread | Parent | Parent subthread |I am uncomfortable with some off the figures used; for a different reason though.
It seems to me that there could be other factors(s) underlying both. There is so little time, and there are so many possible facts.
That I agree with the proposition that declining resources necessarily cause declining economies gives me pause as my skeptical nature says, "Show me." On the other hand, I am not sure Gail did any more than to state that the figure indicated a correlation. That she believes it causative is clear; whether she proved it not so much.
As stated elsewhere, some of the data are not clear either, such as, what does "energy invested" include? Whose wages are to be used? China's? India's? Or, those in the USA?
Further, we are all used to loose interpretations and assertions from some of our "holy books." (e.g., The Long Emergency, The Long Descent, etc.) where we accept almost without question that we have insufficient resources to retool, revise our electric grid, create sufficient solar arrays, etc.
Like most, we at TOD have a bit of a confirmation bias when searching through facts. More the pity since the situation may be as grim as the worst doomers on-site believe, and is at least not likely to be as trivial as others would like it.
The best we can do is to read, make public our criticisms, and try to do better in the future.
Which is all to say that you made your point, and quite strongly. We all understand, and agree or not, it is time to move along.
Craig
Ghung on August 2, 2013 - 9:22am Permalink | Subthread | Parent | Parent subthread |Failure to prove, using a particular model, simply proves that chosen model is wrong.
Or that the claim being asserted is not actually true.
That you don't seem to consider that possibility is telling.
Gail the Actuary on August 2, 2013 - 11:10am Permalink | Subthread | Parent | Parent subthread |"...compared to the boost in Chinese wages over the same period..."
It's an apples/oranges comparison. The Chinese economy is different in many ways than the US economy. Fuel in China is more subsidized and they have a history of getting more utility from their fuel. Of course, if they aspire to a more western lifestyle, this may change in time. Much of fuel use in the US is discretionary, supporting a discretionary economy which provides many jobs. When fuel prices rise, many of these discretionary uses of fuel are discarded, along with the jobs they provide. Replacement jobs are often part-time, lower paying, with fewer benefits.
While the claim that rising energy prices cut into wages may seem simplistic, saying it doesn't, or discussing lags, etc, is also simplistic. It's more complex than that, and there are other inputs to the system (QE, fiat capital, debt) that mask the role of energy in the system, especially when energy costs take their toll. Gail's, and/or Bristle's charts are thin slices of a broad set of metrics. It's hard to ascertain the real effects of rising energy costs in a system that is busy robbing Peter to pay Paul.
hot air on August 2, 2013 - 5:58pm Permalink | Subthread | Parent | Parent subthread |Whether or not globalization helps world wages, it doesn't help the financial condition of the countries whose wages decrease or fail to increase. If we look at historical collapses, the reason they have happened has been closely tied to governments not being able to collect adequate taxes from stagnating wages of workers (according to the research of Turchin and Nefedov in Secular Cycles). Stagnating wages also makes it very hard to repay debt.
Fossil fuels have been extracted in low quantity with renewable energy. At this point, I would expect that the vast majority of the amounts that can be extracted with renewable energy have already been extracted. Coal that is close to the surface, in readily accessible locations, and that does not need modern oil-based transportation to places where it can be used, is very limited in supply. Oil, natural gas, and uranium all need high tech methods for extraction now, that are only available with fossil fuels. Rare earth minerals extracted for use in "renewables" are terribly polluting. Whether they can be extracted with human and animal labor alone in such a polluted atmosphere seems doubtful.
mididoctors on August 3, 2013 - 4:51am Permalink | Subthread | Parent | Parent subthread |What makes you think that in the absence of globalisation they would have done better, rather than losing big time instead of small time? I am pretty sure it is possible to come up with a group of people that definitely lost from globalisation, but what gives them the right to keep all the ones that gained in poverty?
Which is better a world with one person at 10000$ and ninety nine at $1 each, or a world with one person at 9000$ and ninety nine at $100 each? Turn the clock in the opposite direction. What would you regard as the moral status of a person that would extract 99% of the income of 99 people already significantly poorer than himself in order to mildly enrich their lifestyle?
I'd say its not so much the inability to collect taxes from the stagnating wages as the unwillingness of the elite to forgo their exemptions as they take a steadily larger slice of the economy.
If it can be extracted with fossil energy it can be extracted with renewable electricity. I doubt there's much coal that would support a 21st century lifestyle when using 16th century extraction technology, but 16th century windmills weren't as effective at generating electricity from wind as 21st century ones are. The machinery doesn't care whether its electrons come from a wind turbine or a gas turbine, and it doesn't care if the gas in the turbine came from a biomass digester or a fracked well. There's good reason to believe that wind turbines and biomass generators aren't up to providing current levels of energy supply, because there just isn't enough wind or biomass, but there's good reason to believe that fossil fuels won't last forever at current rates of use too. However, there is enough sunlight.
WeekendPeak on August 2, 2013 - 12:20am Permalink | Subthread |intuition. Globilisation should over time even out wages with EROI and per capita energy UTILITY dictating the maximum permissible level of this global average per capita wage.
That said local and short term effects from changing oil prices are likely to slosh the wage allocation from expensive workers to cheaper and vice versa. There is going to be a fair amount of noise but perhaps less than one might imagine.
tstreet on August 2, 2013 - 10:21am Permalink | Subthread | Parent | Parent subthread |This is the type of article why TOD is shutting down.
No causality, no firm, well reasoned out logic. Very light on facts, heavy on unsubstantiated causal relationships. Cherry picking with respect to time frames and variables. EROI is one of the key concepts in this post yet not examined or questioned by either the OP or readers/commenters. Putting a couple of data series on graphs and suggesting causality without any solid logical basis. Having two data series trending in the same direction is meaningless without solid reasoning behind it. No review of peer reviewed research of any of the underlying concepts or data.
The very basis of this piece is BAU rather than out of the box thinking, which is what society so desperately needs
Sad, but it makes sense. Rgds wp
Robh on August 2, 2013 - 10:33am Permalink | Subthread | Parent | Parent subthread |Seriously? You think this is the reason TOD is closing down? Please refer me to a better site.
zaphod42 on August 2, 2013 - 11:54am Permalink | Subthread | Parent | Parent subthread |This seems to be a discussion, which is in the sub heading of The Oil Drum
I quite like to see the debate and it helps when people argue. We are all blind to some of our own thinking and seeing this kind of argument helps jolt these things into the open
WeekendPeak on August 2, 2013 - 6:39pm Permalink | Subthread | Parent | Parent subthread |Funny. I thought I had commented about the EROEI concept at 5:05pm.
Guess not, though, since you said there were no such comments at 11:20pm.
Maybe we should be checking out the logs in our eyes, eh?
Craig
orbit500 on August 7, 2013 - 11:28am Permalink | Subthread | Parent | Parent subthread |you're right, there was/were some discussions about it, but there is still a complete lack of thorough analysis of that concept, and other ones. The structure of TOD makes it hard to really flesh out an issue in depth over a period of time, but obviously there are many advantages to the current format.
Although clearly there are some really, really bright people on TOD who comment they are the ones who quietly step aside when poor articles come along so what happens is that the bad drives out the good.
I often don't comment on comments/statements are either false or completely void of significance. Mainly that is because when I do rebut/comment/point out particular issues with an argument or line of "reasoning" there is resounding silence. Also, unlike some on this site, like ELM Jeff I don't have the stamina to keep pointing out the same thing again and again. Sadly, although theoretically repetition does not strengthen an argument in reality one often has to beat people over the head with the same message over and over (and over and over) again to get it to sink in. Good for Jeff (and Alan, and a number of others), I wish I had the stomach for it too.
(to some other poster): Clearly this is not the cause of TOD shutting down but it is a good example of a poorly reasoned post. As such it is indicative of the lack of good quality articles that Leanan (and others?) have referred to. I am glad too see that some commenters are applying some solid critical thinking skills.
Rgds WP
PatOrmsby on August 2, 2013 - 10:51am Permalink | Subthread |I have to agree. I think bristle has struck that nail hard.
Substrate on August 2, 2013 - 12:25pm Permalink | Subthread |Gail, I've been a reader here for years, but this is my first time to comment. I have been in awe of your site, including the commenters. I've copied this article onto a file and stored it so it will be handy as friends and family go through the accusational stage of the hysteria that is collapse. Thank you for all these years of a wonderfully informational site. I will miss you.
Bandits on August 3, 2013 - 1:44am Permalink | Subthread | Parent | Parent subthread |"Given the diversity of what is needed to support the current economy, the small increment between 3 and 5 is probably not enough–the minimum ratio probably needs to be much higher."
I don't see where this was addressed - but thinking the difference between 3:1 and 5:1 is small is a serious blunder. When you get down into the lower numbers the difference in returned energy is huge.
http://static.seekingalpha.com/uploads/2009/6/8/152129-124447919060281-B...
I can't seem to find where the original is but that's the "net energy cliff" graph that Euan made - an excellent visual representation of EROEI in context to the return.
With renewables made using fossil fuels, such as hydroelectric, wind turbines, solar PV, and ethanol, the only way anyone can calculate EROI factors is as add-ons to our current fossil fuel system. These renewables depend on the fossil fuel system for their initial manufacture, for their maintenance, and for the upkeep of all the systems that allow the economy to function. There is no way that these fuels can power the whole system, based on what we know today, within the next hundred years. Thus, any EROI factor is misleading if viewed as the possibility what might happen if these fuels were to attempt to operate on a stand-alone basis. The system simply wouldn't work–it would collapse.
I LOVE the "Just a Fossil Fuel Extender" arguments. If the approach being taken that the current system needs to keep running then the JaFFE argument will slap you in the face because the instant you start that argument you've already lost.
If you agree that you get more energy out than is put in you've just conceded that it's worth it to do it.
The great overarching idea is that if fossil fuel is the only thing that works for modern civilization, and wind turbines, PV, wave, etc, are "just fossil fuel extenders" then shouldn't we be extending the hell out of fossil fuel? The alternative to fossil fuel extension is to just run out quickly and collapse.
I'm all for this argument because as alternatives are built out - wind and PV in particular - we're likely to find that they're perfectly adequate for keeping modernity intact and we'll find ourselves saying "Why did we need fossil fuels?"
Substrate on August 3, 2013 - 8:37pm Permalink | Subthread | Parent | Parent subthread |I'm all for this argument because as alternatives are built out - wind and PV in particular - we're likely to find that they're perfectly adequate for keeping modernity intact and we'll find ourselves saying "Why did we need fossil fuels?"
Will 7 billion and rising say "Why did we need fossil fuels?" or will modern civilization be reserved for a select few? Maybe we can continue up to 12-15 billion and build more "wind and PV", we need to run out of FF fast so we can get on with the job of "modernizing" the world. We can then all have electric cars and trains, eat jelly blubbers and cockroaches.
hightrekker on August 4, 2013 - 10:39am Permalink | Subthread | Parent | Parent subthread |I usually don't say anything until someone pushes the button but no - the Earth is incapable of sustaining even 7 billion people. It can be seen all around - aquifer depletion, fish populations in massive decline, coral destruction, soil mining, habitat destruction. 7 billion is too destructive, even for lower impact things like PV and electric transportation. A population of half that size might be able to live well if they do it purposefully low impact. Somewhere around 2 - 3 billion could likely continue to advance science and have a low enough impact to live "sustainably" on Earth.
hot air on August 3, 2013 - 6:11pm Permalink | Subthread |I think 2-3 billion is optimistic for a world with large fauna and intact ecosystems. It would be a sad impoverished place.
Hoover on August 5, 2013 - 8:24am Permalink | Subthread | Parent | Parent subthread |A parable on EROI
A sower went out to sow, and as he sowed some fell by the wayside and it was trodden down and the birds of the air came and devoured it, and some fell on stony ground, and when the sun came it was scorched for it had no depth of root and it withered away, and some fell among thorns and the thorns choked it and it bore no fruit and some fell on good ground and yielded fruit that sprang up and increased and brought forth thirty-fold. and sixty-fold, and an hundred-fold. And he said to them that had ears to hear,
What is the EROI of this sower?
And some said 100, for it is recorded that some seed brought forth 100-fold. And some said a googol, for a sower starts sowing at 20 lives for three score years and 10, and each of those 50 years returns an hundredfold. And some said 2, for half of the harvest is taken in tax to power the rest of society and after the seed is sown the remainder is a bare sufficiency to feed the sower and his family until the next harvest. And a scribe calculated it thus 50 seeds sown, of which the birds devoured 10, 10 withered in stony ground, 10 were choked by thorns, 15 brought forth 450, 4 brought 240, and 1 brought 100. The EROI is thus 790/50 = 15.8
...
Two scribes from the same school are likely to make the same assumptions in analysis and come up with the same answer, but the same types of argument that lead to 1e100 and 2 are also used, particularly when the analyst has an axe to grind. An analyst that wants to show how good renewables are will use methods that spin out the time and spin up the EROI. An analyst that wants to show they are hopeless will look to charge every conceivable externality against the process.
...
Say solar PV has an EROI of 20, is it better than than this biomass which the scribe says has an EROI of 15.8? You don't know. If you had the detail on the energy flows for the solar PV you could make a judgement on whether solar PV was a better investment than biomass, but critical information on whether its a good investment is not included in the EROI.
How rapidly could it be scaled up? You know from the data on the sower that reducing the tax rate from 340 per sower to 290 per sower would allow it to be doubled every year (as long as land remained and there were PV salesmen available for redeployment to sowing) There's nothing in the EROI that allows this judgement to be made though. The necessary information has not been included and you have no idea of how rapidly the solar with EROI of 20 can be scaled up.
EROI is a rubbish tool for investment judging and an economist ought to be able to come up with something better. How do solar, wind, biomass, coal, nuclear etc stack up on a net present energy basis? I don't know, but thats the sort of thing I'd expect someone with economic expertise to use. Something that is robust to whether a recycle is treated as internal to the process or a matching input and output, and something that takes time seriously.
AlanfromBigEasy on August 5, 2013 - 3:34pm Permalink | Subthread |It's IRR.
Nick on August 4, 2013 - 11:23pm Permalink | Subthread |One quote I very much disagree with.
Also, I don't think that it is really feasible to create a new economic system, based on lower EROI resources, because today's renewables are fossil-fuel based, and initially tend to add to fossil fuel use.
The solution is extraordinarily simple - divert consumption to investment. The energy and other resources dissipated today on consumption (usually quite unnecessary) could instead be devoted to long term renewable energy and efficiency investments.
In a relevant example, someone paid for their solar panels by forgoing two vacation trips (staying @ home) and from the energy savings from the first six or seven years of solar generation. Energy that could have been used on an overseas flight, and hotel & ground transportation, was "diverted" to solar panel production and installation. Plus a fraction of the future energy production (likely 50+ years) was borrowed from the future.
Even a few % of GDP wisely invested can make the difference.
The second solution is a bit more complex, but it is being done in Denmark, France and other nations, is a quick and dramatic drop in energy density in the economy. Denmark has reduced their per capita carbon emissions by -26.5% in just five years (2007-2012) and -14.8% for France.
The United States could achieve comparable results with better policies.
Best Hopes for Better Resource Allocation,
Alan
Nick on August 4, 2013 - 11:22pm Permalink | Subthread |This concern about EROEI is highly unrealistic.
Wind is the most important renewable at the moment, and even Hall shows 18:1. 2nd, Hall's data is very old: wind is around 50:1, and solar (CSP and PV) is at least 20:1.
Once EROEI is above, say 10:1, it really becomes irrelevant - it's just not the basis for competitive decisions. It's useful for analyzing bio-fuels, which are below 5:1, but not for wind and solar vs coal or NG.
Solar costs and manufacturing energy inputs are dropping fast, and wind's E-ROI is probably around 50.
Cutler Cleveland's summary of the literature (posted in the next comment, to avoid the delay of moderation) showed that wind's E-ROI was around 19. If you study his sources, you'll see that that most of the studies are quite old. If you look at the turbines analyzed in those studies, you'll see that they were much smaller than those in use today - look at Figure 2, and read the discussion. If you study that chart, you'll see a very clear correlation between turbine size and E-ROI. Given the recent very large increase in turbine size, it's perfectly clear that Vestas' claim for a current E-ROI of around 50 is entirely credible.
Again, an E-ROI of 19 is more than enough. There isn't an important difference between an E-ROI of 20 and an E-ROI of 50. It's like miles per gallon: we're confused by the fact that we're dividing output into input, when we should be doing the reverse, and thinking in terms of net energy. An E-ROI of 20 means a net energy of 95%, while an E-ROI of 50 means a net energy of 98%: there really isn't a significant difference.
Nick on August 4, 2013 - 11:25pm Permalink | Subthread |Cutler Cleveland's summary: http://www.eoearth.org/article/Energy_return_on_investment_(EROI)_for_wind_energy
Strummer on August 5, 2013 - 4:13am Permalink | Subthread | Parent | Parent subthread |Have oil shocks caused recessions?
Correlation is not causation.
A vast array of commodity prices peaked at the height of the economic bubble, and crashed afterwards, oil included.
The high price of oil was more important than other commodities, because oil is a large percentage of the overall commodity basket, but it was not the most important factor to the Great Recession. A contributor, no doubt, but a bubble is a bubble, and has to pop sooner or later.
There is just no way world economies can keep from shrinking if the oil supply starts to shrink.
I just don't understand why oil is considered by some to be so magical.
Sure, increasing import bills are a problem, but please note that OPEC countries are working very hard to spend their new income - that will tend to raise their non-oil imports, and raise oil-importer exports.
Yes, the cost of capex for substitutes will slow the economy down, but that's not overwhelming or permanent.
Yes, an oil shock can cause FUD, which slows down capex, but that's not permanent either. At a certain point EVs will gear up, and people will spend their money on them. In fact, car sales may go up, as there's actually a reason to buy a new car.
The US (and most of the OECD) has plenty of electricity, and plenty of time to transition from fossil fuel sources of electricity to renewable sources (not that we shouldn't transition away from FF much more quickly to reduce CO2 emissions...).
Our current operational problem is liquid fuels, and there are plenty of good substitutes for liquid fuels: electric vehicles (and their variants: hybrids, plug-in hybrids, extended range EVs, etc); freight reducing fuel consumption by 2/3 by moving from trucks to diesel trains, and then electric trains; heat pumps; and for the small percentage of energy that's needed for long-distance transportation, synthetic liquid fuels will work just fine.
At some point all the EVs etc will have been bought, and we'll not be worrying about oil any more.
Nick on August 5, 2013 - 5:26pm Permalink | Subthread | Parent | Parent subthread |I just don't understand why oil is considered by some to be so magical.
I guess to the historical fact that it was/is "magical" in building the current industrial civilization? Your examples and optimistic visions are very nice, but do you realize how extremely US-centric they are? There is a world beyond the 300 million USA, you know? It would be great if you could supply some more data on the costs of transitioning the global economy and infrastructure off of fossil fuels, not just the tiny sectors of US manufacturing and US personal transport. Those are negligible in the global view.
Nick on August 4, 2013 - 11:27pm Permalink | Subthread |Oil wasn't uniquely essential. Many other things built the industrial revolution.
Actually, it's this article that's US centric: the only data shown is for the US - why not use world data? We would see that world GDP is still growing, while crude oil is pretty flat.
Costs: renewables vary around the world, but they're much more widely distributed than FF. EVs are much cheaper to operate than ICE vehicles everywhere: that's why they outsell them in China (in the form of e-bikes).
pmagn on August 5, 2013 - 1:06am Permalink | Subthread | Parent | Parent subthread |Again, there is this puzzling assumption that oil can't be replaced, that it is somehow magically necessary for industrial/modern civilization. Oil has been cheap and convenient for the last 100 years, but the industrial revolution started without it, and modern civilization certainly will continue without it. The idea that oil is necessary is an argument against solutions to Climate Change, and an argument for "drill, baby, drill".
• 130 years ago, kerosene was needed for illumination, and then electric lighting made it obsolete. The whole oil industry was in trouble for a little while, until someone (Benz) came up the infernal combustion engine-powered horseless carriage. EVs were still better than these noisy, dirty contraptions, which were difficult and dangerous to start. Sadly, someone came up with the first step towards electrifying the ICE vehicle, the electric starter, and that managed to temporarily kill the EV.
Now, of course, oil has become more expensive than it's worth, what with it's various kinds of pollution, and it's enormous security and supply problems.
• 40 years ago oil was 20% of US electrical generation, and now it's less than .8%.
• 40 years ago many homes in the US were heated with heating oil - the number has fallen by 75% since then.
• US cars increased their MPG by 60% from about 1976 to about 1991.
• 50% of oil consumption is for personal transportation - this could be reduced by 60% by moving from the average US vehicle to something Prius-like. It could be reduced by 90% by going to something Volt-like. It could be reduced 100% by going to something Leaf-like. These are all cost effective, scalable, and here right now.
I personally prefer bikes and electric trains. But, hybrids, EREVs and EVs are cost effective, quickly scalable, and usable by almost everyone.
Sensible people won't move to a new home to reduce commuting fuel consumption. That would be far, far more expensive than replacing the car. It makes far more sense to buy an EV and amortize the premium over 10 years at a cost of about $1,000 per year (much less than their fuel savings), versus moving to a much higher cost environment (either higher rent or higher mortgage).
• As Alan Drake has shown, freight transportation can kick the oil-addiction habit relatively easily.
We don't need oil (or FF), and we should kick our addiction to it ASAP.
The only reason we haven't yet is the desperate resistance from the minority of workers and investors who would lose careers and investments if we made oil and other FFs obsolete.
All of the various kinds of EVs (hybrids, PHEVs and pure EVS) would be much farther advanced if it weren't for resistance from the automotive and oil industries. The first PHEV was demonstrated more than 100 years ago. Very large and reliable EREVs were developed 100 years ago in the form of diesel submarines. This isn't new stuff, and it would be far more useful and cheaper if we had started to really push them 40 years ago, when US oil fields clearly showed their limits.
Gas should be priced at European levels (say, around $7 per gallon), to reflect it's real costs. If it were, EVs in their various incarnations would be obviously cost effective, and consumers would have demanded them long ago.
Some might ask, what about our current debt problems?
Debt is a symbol, a marker - what matters is the underlying productive capability of our economy, which will be just fine. Could we screw up the management of our economy, and go into a depression? Sure. But it's not likely.
Don't these transitions take 50 years?
The transition from kerosene to electricity for illumination took roughly 30 years. The US transition away from oil-fired generation took very roughly 20 years. The transition away from home-heating oil was also faster than 50 years (though uneven).
The fast transition from steam to diesel locomotive engines is illustrative. There were a few diesel locomotives in use in the U.S. during World War II but steam dominated in 1945. However, the steam locomotives had been very heavily used during World War II, and they all wore out at approximately the same time the first few years after 1945. When steam locomotives wore out, they were invariably replaced by diesel in the mid 1940s. By 1949, almost all steam locomotives were gone. There were still some steam locos made in the late 40's, and they were still in service in the 50's but dwindling. The RR's also relegated the steamers to branch line and switcher use - replacing the most used lines with diesel first as you would expect. Cn rail retired its last steam engine in 1959.
Other, very slow transitions are not a good guide to the future. For instance, the transition from coal to oil could be very slow, because there was no pressure - it was a trade up, not a replacement of a scarce resource. Many transitions occurred because something new & better came along - but the older system was still available and worked just fine. Oil may become very expensive very fast and that would provide us an incentive to switch over much more quickly.
On the other hand, we can point to many energy transitions that were sideways or down. The early transition from wood to coal in the UK was a big step down: harder to find and transport, dirtier - a pain in every way. Coal's only virtue was it's abundance. The transition from EVs to ICEs took a while - only when ICEs started to electrify did they become competitive. And, of course, we hid the external costs of oil from consumers: freeways (built by "engine" Charley Wilson after he went from President of GM to Secretary of Defense), pollution, overseas wars, etc. I'd argue that ICEs were never better than EVs - they just appeared that way.
On the other hand, EVs are better right now. They have better driving performance (better acceleration, better handling), and lower total lifecycle costs.
Unfortunately, we have more than 50 years worth of things we can burn for electricity. Fortunately, it doesn't look like we will. For instance, coal consumption in the US dropped 9% last year, about half of that due to loss of market share.
The transition from heating with wood to heating with coal took a lot more than fifty years. Electrification of the U.S. from small beginnings in the late nineteenth century to finishing rural electrification during the Great Depression took at least forty years.
Sure. These involved an enormous amount of infrastructure. On the other hand, EV/EREV/HEVs are manufactured on the same assembly lines as ICE vehicles, and roughly 75% drivers in the US have access to an electrical plug where they park.
Alan Drake would tell you: We transformed transportation before, in just twenty years. From 1897 to 1916, over 500 cities, towns and villages built streetcar lines. In several richer rural areas, vast networks of interurban rail lines were built. This was a nation with very limited "advanced technology", a half rural, half urban population and 3% to 4% of the real GDP of today.
Nick on August 5, 2013 - 6:02pm Permalink | Subthread | Parent | Parent subthread |so what is powering the majority of the worlds electrical generation... coal. and its use is increasing world wide. yep. was there before oil.
Hoover on August 5, 2013 - 4:38am Permalink | Subthread | Parent | Parent subthread |Yes.
Time to eliminate both oil and coal...
Nick on August 5, 2013 - 5:53pm Permalink | Subthread | Parent | Parent subthread |Nick, it's a great post and timely. My thought process is very similar (at a high level anyway, we disagree on a lot of the detail) - peak oil is a technical, political and economic challenge that is there to be solved and for which some of the tools to solve it already exist. There is absolutely no need for it to be the end of civilisation as we know it.
That is not to deny the drama and history behind this transition which will bring about huge geo-political and social volatility while it is on-going, a process that has already started IMO in ways that are small and difficult to identify in most places except MENA where the Arab Spring is rather obvious.
Anyway, one piece of feedback, please take it constructively since I get the feeling you are making these same points elsewhere.
When you're make this comment:
"Gas should be priced at European levels (say, around $7 per gallon), to reflect its real costs. If it were, EVs in their various incarnations would be obviously cost effective, and consumers would have demanded them long ago."
I think you need to explain why a transiton to EVs hasn't happened yet in Europe despite the high gas prices. It may seem minor in relation to your overall argument but it rather attacks the strength of your EV argument which is pretty central to rest of it.
Nick on August 4, 2013 - 11:28pm Permalink | Subthread |That's a great question.
First, EVs are now growing pretty fast in Europe, as car makers begin to hit diminishing returns on ICE efficiency. 2nd, Europe took a different path, and so they have a different set of choices. Keep in mind that the average European only uses 18% as much fuel as the US, per capita.
There are a number of factors:
1) A different capital cost to operating cost picture.
EVs and PHEVs trade a higher purchase price for lower fuel consumption.
In Europe, fuel prices are 2-3 times as high as in the US, but due to historical factors (shorter distances, higher fuel taxes due to the high % of imports), the average car in Europe uses about 1/3 as much fuel as one in the US, due in roughly equal parts to lower kilometers driven per vehicle, and lower fuel consumption per km. Further, European taxes on new cars are generally much higher in the US.
Thus, the economic case for EVs and PHEVs is worse in Europe, and the lack of EVs and PHEVs in Europe really doesn't add any useful information to the question of how competitive electric powertrains really are with oil in the US.
2) Pure EV's still can't compete on convenience with ICE vehicles. Even in Europe, fuel costs are only a part of driving costs, and the lower cost of an EV weren't quite worth the inconvenience. The logical transition from an ICE to an EV is the PHEV, which for some reason wasn't explored seriously until very recently when GM took that path. Now that GM is pursuing PHEV extremely seriously, they've got an Opel version for Europe.
3) Europeans have fewer garages, as their housing is much older.
4) Tax preferenced diesel occupies the high-MPG niche.
and perhaps most importantly, there were large barriers to entry (billions in R&D and retooling, as well as resistance from ICE oriented manufacturers) for PHEV's, and there wasn't an obvious need for them. There was resistance from people in the industry who's careers would be hurt. This ranges from assembly line workers and roughnecks to automotive and chemical engineers.
In the US, the big low hanging fruit is personal transportation. In Europe, it's not personal cars, it's freight trucking.
pmagn on August 5, 2013 - 1:01am Permalink | Subthread |Continued:
http://en.wikipedia.org/wiki/List_of_streetcar_systems_in_the_United_States
http://www.railsandtrails.com/Maps/Interurban/default.htm
If we mobilized all our resources as we did in World War II with the single objective of getting off fossil fuels as fast as possible, wouldn't the transition still take at least twenty years, and probably longer than that?
Some things much easier than that. A transition to EVs requires only a change within the automotive industry (for most drivers). Slashing coal consumption involves pretty straightforward ramping up of wind energy. 75% reductions in fuel consumption by road transportation and coal consumption for electrical generation would be ambitious, but doable.
But are we actually seeing any replacements of oil?
Consumption in the US has fallen by more than 15% since it's recent peak in 2007 (while GDP has risen by 3%), and it continues to fall. Production has risen (both C&C and all liquids), and net imports have fallen by 38% since their peak in 2005.
http://www.eia.gov/cfapps/ipdbproject/iedindex3.cfm?tid=50&pid=76&aid=3&...
Didn't past transitions occur in a environment of growth, when making new investments was a good idea, and banks would lend?
The transition from horses to rail occurred mostly during the Long Depression from 1873-1890. The move from horses to tractors and automobiles continued at a very good speed during the depression, as did general electrification and business investment. The transition away from oil for electrical generation accelerated during the 1979-1981 recession(s), and CAFE standards rose.
Even at the depth of the Great Recession car sales were at least 60% of normal. Even with currently high oil prices car sales have recovered to about 14M per year, which is pretty strong. And finally, used cars were and are still turning over very 3 years, giving high-mileage/low income drivers an opportunity to switch to a more efficient vehicle.
Isn't this expensive?
EVs and their cousins (hybrids, plug-ins, EREVs, etc) don't require any more steel than ICE's, and they already have overall Total Cost of Ownership equal to or lower than ICE vehicles. We're making ICE's without a problem, and EVs aren't any harder. Wind turbines and solar panels really don't consume that much in the way of resources. Making long-haul trucks and coal plants prematurely obsolete is, of course, somewhat expensive, but the US has a big output gap (IOW, we have a lot of unemployed manufacturing and construction workers and empty manufacturing plants, waiting for something to do), and really, it would cost a lot less than another oil war.
Isn't "wasted" use of fuel is someones job providing a good or service? won't reducing fuel consumption cost jobs?
I'm thinking of the 50% of overall liquid fuel consumption that goes to personal transportation. That could be reduced easily without anyone losing their job.
Chevy Volts take as much labor to manufacture as vehicles that use 10x as much fuel. No problem there.
The average vehicle gets resold every 3 years: there's plenty of opportunity for higher mileage drivers to move to high MPG vehicles, even if they drive used.
Doesn't expanded rail mean wasteful & expensive extra handling?
Inter-modal container handling is well tested and is pretty efficient. More importantly, current distribution patterns were shaped under cheap oil. With higher oil prices the optimal mix of rail & truck has shifted sharply towards rail.
Alan Drake indicates that the clearest indicator of this is that Class I RRs are investing 18% of their GROSS revenues into capital projects. This is far higher than any other industry. The number of multi-modal transfer projects are exploding. Just 7 years ago, no Walmart distribution center was served by rail. Several new ones are. The number of factories and warehouses served by rail are expanding.
What about an emergency loss of oil supplies?
Carpooling works nicely: about 10% of all commuting is done via carpooling, more than mass transit and 3x as much as is done via commuter rail. Commuting is free, fast, and highly scalable, given that the average car only has about 1.15 passengers. Double that, and reduce overall fuel consumption by 25%. It could be done in weeks or months.
Isn't carpooling inconvenient and slow?
Yes, it's not an ideal long-term strategy. OTOH, it would work; it's bigger than bus & rail already; it's really cheap; it would eliminate congestion, which is why there are HOV lanes; and smart phones and modern telecom are making carpooling much easier.
The point is that we could reduce oil consumption very quickly, if we wanted to. If the alternative were really economic doom, carpooling wouldn't seem so bad, would it?
pmagn on August 5, 2013 - 1:13am Permalink | Subthread | Parent | Parent subthread |You also forgot that mostly all energy extraction requires uses subsidies from various sources as funding etc. These tend to be left out of EROIs. For instant low taxing, low gov leases on lands, low gov interest loans, massive gov infrastructure spending and investment to support extraction projects such as roads, railways, power lines etc.
So you see EROI is low ball by a very big amount. The feedback is also subtle on the infrastructure investment because obviously these require energy in the first place which is becoming more and more expensive with time.
Basically we had a party on easy fossil fuels because of the convenience of access to such a concentrated form of energy. We have failed to find a replacement and now we have also found out that nothing comes for free aka in this case we also get with it global warming and ocean acidification.
Nick on August 5, 2013 - 1:34am Permalink | Subthread |I also forgot a biggy. And that is the fact that the energy extraction and processing prices or costing currently does not reflect the cost of adequate pollution mitigation. So we get mines/well abandoned in such a state that tax payers usually have to foot the bill to right them and industrial accidents occurring which again much of the costs are not applied to the energy product but covered by tax payers. In the case of climate change we have a vague figure of around $120 / ton and rising for CO2.
so the EROI does not tend to take these into account. And I am sure there are some other ones by and by that we have missed.
Nordic_mist on August 5, 2013 - 3:44am Permalink | Subthread |Let me make the point above a little finer:
Businesses don't operate the in the way described above. Their first option when dealing with rising commodity prices isn't to lay off staff. Their first option is to use less of the commodity.
They might streamline their trucks, and them switch them to LNG. Their taxi's might move to hybrids. Their rail might electrify. Their plastic containers will be redesigned to remove mass, then be switched to glass or metal.
Companies don't take it lying down when oil/FF prices rise - they reduce their consumption, and if necessary they eventually eliminate it altogether.
Gail,
Your argumentation was somewhat the same in your post on the 4th March 2011: http://www.theoildrum.com/node/7499.
With the benefit of hindsight we can now answer your questions:
1. Is this really a new drilling technique? No. But does that matter?
2. How likely is the 2 million barrels a day of new production, and the 20% increase in US production, by 2015? Already achieved by 2013. In fact there has been an overall increase of 2 million barrels per day - an increase of 35%.
3. Can this additional oil supply really reduce the US's imports by over half? Yes. Easily. Imports are already reduced by 50% from peak and are still falling rapidly.
4. How much of a difference will this oil make to "peak oil"? Oil will peak as energy demand switches to other sources. Many countries are already far down the transition.
My point being: Isn't your argumentation just plain wrong?
Nordic.
Energy Products: Return on Investment Is Already Too Low
Share | Show without comments | PDF version
Related articles (automatically generated) Energy Return on (Energy) Invested (EROI), Oil Prices, and Energy Transitions (June 15, 2012) The Energy Return on Investment Threshold (November 25, 2011) Two Energy Books of Interest (April 18, 2012) Renewable Transition 2: EROEI Uncertainty (August 10, 2009) WSJ, Financial Times Raise Issue of Oil Prices Causing Recession (March 28, 2011)
1
Google matched content |
Society
Groupthink : Two Party System as Polyarchy : Corruption of Regulators : Bureaucracies : Understanding Micromanagers and Control Freaks : Toxic Managers : Harvard Mafia : Diplomatic Communication : Surviving a Bad Performance Review : Insufficient Retirement Funds as Immanent Problem of Neoliberal Regime : PseudoScience : Who Rules America : Neoliberalism : The Iron Law of Oligarchy : Libertarian Philosophy
Quotes
War and Peace : Skeptical Finance : John Kenneth Galbraith :Talleyrand : Oscar Wilde : Otto Von Bismarck : Keynes : George Carlin : Skeptics : Propaganda : SE quotes : Language Design and Programming Quotes : Random IT-related quotes : Somerset Maugham : Marcus Aurelius : Kurt Vonnegut : Eric Hoffer : Winston Churchill : Napoleon Bonaparte : Ambrose Bierce : Bernard Shaw : Mark Twain Quotes
Bulletin:
Vol 25, No.12 (December, 2013) Rational Fools vs. Efficient Crooks The efficient markets hypothesis : Political Skeptic Bulletin, 2013 : Unemployment Bulletin, 2010 : Vol 23, No.10 (October, 2011) An observation about corporate security departments : Slightly Skeptical Euromaydan Chronicles, June 2014 : Greenspan legacy bulletin, 2008 : Vol 25, No.10 (October, 2013) Cryptolocker Trojan (Win32/Crilock.A) : Vol 25, No.08 (August, 2013) Cloud providers as intelligence collection hubs : Financial Humor Bulletin, 2010 : Inequality Bulletin, 2009 : Financial Humor Bulletin, 2008 : Copyleft Problems Bulletin, 2004 : Financial Humor Bulletin, 2011 : Energy Bulletin, 2010 : Malware Protection Bulletin, 2010 : Vol 26, No.1 (January, 2013) Object-Oriented Cult : Political Skeptic Bulletin, 2011 : Vol 23, No.11 (November, 2011) Softpanorama classification of sysadmin horror stories : Vol 25, No.05 (May, 2013) Corporate bullshit as a communication method : Vol 25, No.06 (June, 2013) A Note on the Relationship of Brooks Law and Conway Law
History:
Fifty glorious years (1950-2000): the triumph of the US computer engineering : Donald Knuth : TAoCP and its Influence of Computer Science : Richard Stallman : Linus Torvalds : Larry Wall : John K. Ousterhout : CTSS : Multix OS Unix History : Unix shell history : VI editor : History of pipes concept : Solaris : MS DOS : Programming Languages History : PL/1 : Simula 67 : C : History of GCC development : Scripting Languages : Perl history : OS History : Mail : DNS : SSH : CPU Instruction Sets : SPARC systems 1987-2006 : Norton Commander : Norton Utilities : Norton Ghost : Frontpage history : Malware Defense History : GNU Screen : OSS early history
Classic books:
The Peter Principle : Parkinson Law : 1984 : The Mythical Man-Month : How to Solve It by George Polya : The Art of Computer Programming : The Elements of Programming Style : The Unix Hater’s Handbook : The Jargon file : The True Believer : Programming Pearls : The Good Soldier Svejk : The Power Elite
Most popular humor pages:
Manifest of the Softpanorama IT Slacker Society : Ten Commandments of the IT Slackers Society : Computer Humor Collection : BSD Logo Story : The Cuckoo's Egg : IT Slang : C++ Humor : ARE YOU A BBS ADDICT? : The Perl Purity Test : Object oriented programmers of all nations : Financial Humor : Financial Humor Bulletin, 2008 : Financial Humor Bulletin, 2010 : The Most Comprehensive Collection of Editor-related Humor : Programming Language Humor : Goldman Sachs related humor : Greenspan humor : C Humor : Scripting Humor : Real Programmers Humor : Web Humor : GPL-related Humor : OFM Humor : Politically Incorrect Humor : IDS Humor : "Linux Sucks" Humor : Russian Musical Humor : Best Russian Programmer Humor : Microsoft plans to buy Catholic Church : Richard Stallman Related Humor : Admin Humor : Perl-related Humor : Linus Torvalds Related humor : PseudoScience Related Humor : Networking Humor : Shell Humor : Financial Humor Bulletin, 2011 : Financial Humor Bulletin, 2012 : Financial Humor Bulletin, 2013 : Java Humor : Software Engineering Humor : Sun Solaris Related Humor : Education Humor : IBM Humor : Assembler-related Humor : VIM Humor : Computer Viruses Humor : Bright tomorrow is rescheduled to a day after tomorrow : Classic Computer Humor
The Last but not Least Technology is dominated by two types of people: those who understand what they do not manage and those who manage what they do not understand ~Archibald Putt. Ph.D
Copyright © 1996-2021 by Softpanorama Society. www.softpanorama.org was initially created as a service to the (now defunct) UN Sustainable Development Networking Programme (SDNP) without any remuneration. This document is an industrial compilation designed and created exclusively for educational use and is distributed under the Softpanorama Content License. Original materials copyright belong to respective owners. Quotes are made for educational purposes only in compliance with the fair use doctrine.
FAIR USE NOTICE This site contains copyrighted material the use of which has not always been specifically authorized by the copyright owner. We are making such material available to advance understanding of computer science, IT technology, economic, scientific, and social issues. We believe this constitutes a 'fair use' of any such copyrighted material as provided by section 107 of the US Copyright Law according to which such material can be distributed without profit exclusively for research and educational purposes.
This is a Spartan WHYFF (We Help You For Free) site written by people for whom English is not a native language. Grammar and spelling errors should be expected. The site contain some broken links as it develops like a living tree...
|
|
You can use PayPal to to buy a cup of coffee for authors of this site |
Disclaimer:
The statements, views and opinions presented on this web page are those of the author (or referenced source) and are not endorsed by, nor do they necessarily reflect, the opinions of the Softpanorama society. We do not warrant the correctness of the information provided or its fitness for any purpose. The site uses AdSense so you need to be aware of Google privacy policy. You you do not want to be tracked by Google please disable Javascript for this site. This site is perfectly usable without Javascript.
Last modified: June, 12, 2021