Linux implementation of sar
The sar suite of utilities originated in Solaris. Later it was ported to all major flavors of UNIX, including AIX, HP-UX, and
Linux. Sysstat package is installed
by default in standard Red Hat installation. For Suse it is not installed by default and you need to install
sysstat package manually (package is provided
by Novell).
Sar is an very good monitoring package capabilities of which are usually severely underutilized.
Very few system administrators have a habit of weekly looking at SAR logs (see
SAR reports). Moreover it often provide more reliable
information then commercial packages that cost considerable money. It can discover various
bottlenecks and are the simplest tool to decide if the server need hardware upgrade of not. And
hardware upgrades in a typical datacenter are a highly politically charged thing, so having some
more or less solid reference to an actual performance of the server greatly helps.
The reason for sar creation was that gathering system activity data from vmstat and
iostat is pretty time-consuming. If you try to automate the gathering of system activity data, and creation of periodic repots
you naturally come to creation of a tool like sar. To avoid reinventing the bicycle again and again, Sun engineers wrote
sar (System Activity Reporter) and included it in standard Solaris distribution. The rest is history.
Note: Linux implementation closely resembles Solaris. So most papers devoted to
Solaris sar are useful for Linux too. See Solaris
implementation of sar
Linux reimplementation is a part of sysstat package and like in
Solaris sar pulls its data out of the virtual /proc filesystem (pioneered by Solaris).
The sysstat package contains the sar, sadf, iostat, mpstat, and pidstat commands for Linux. The sar command collects and reports
system activity information. The statistics reported by sar concern I/O transfer rates, paging activity, process-related activites,
interrupts, network activity, memory and swap space utilization, CPU utilization, kernel activities, and TTY statistics, among others.
The sadf command may be used to display data collected by sar in various formats. The iostat command reports CPU statistics and
I/O statistics for tty devices and disks. The pidstat command reports statistics for Linux processes. The mpstat command reports
global and per-processor statistics.
In addition to sar, Linux sysstat package provides several other useful utilities:
- sadf(1) -- similar to sar but can write
its data in different formats (CSV, XML, etc.). This is useful to load performance data into a database, or import them in
a spreadsheet to make graphs.
- iostat(1) reports CPU statistics and
input/output statistics for devices, partitions and network filesystems.
- mpstat(1) reports individual or combined
processor related statistics.
- pidstat(1) reports statistics for
Linux tasks (processes) : I/O, CPU, memory, etc.
- nfsiostat(1) reports input/output
statistics for network filesystems (NFS).
- cifsiostat(1) reports CIFS statistics.
There are two main binaries and two shell scripts that constitute sar package:
- Binaries
- /usr/lib64/sa/sadc -- System activity data collector binary, a backend
to the sar command. Writes binary log of kernel data to the /var/log/sa/sadd
file, where the dd parameter indicates the current day
- /usr/bin/sar -- reporting utility
- Scripts
- /usr/lib64/sa/sa1
- /usr/lib64/sa/sa2
System Activity Recorder can monitor several system functions related to overall system performance, for example:
- cpu utilization (it is pretty effective tool for spotting CPU bottlenecks)
- hard disk utilization
- terminal IO
- number of files open
- processes running
SAR many options provides queuing, paging, CPU and many other metrics. The system maintains a series of system activity counters
that record various activities and provide the data that sar reports. The command merely extracts the data in the counters
and saves them based on the sampling rate and the number of samples specified to sar. Among potentially useful metrics:
- Input / Output and transfer rate statistics (global, per device, per partition, per network filesystem and per Linux task / PID).
- CPU statistics (global, per CPU and per Linux task / PID), including support for virtualization architectures.
- Memory and swap space utilization statistics.
- Virtual memory, paging and fault statistics.
- Per-task (per-PID) memory and page fault statistics.
- Global CPU and page fault statistics for tasks and all their children.
- Process creation activity.
- Interrupt statistics (global, per CPU and per interrupt, including potential APIC interrupt sources, hardware and software interrupts).
- Extensive network statistics: network interface activity (number of packets and kB received and transmitted per second, etc.)
including failures from network devices; network traffic statistics for IP, TCP, ICMP and UDP protocols based on SNMPv2 standards;
support for IPv6-related protocols.
- NFS server and client activity.
- Socket statistics.
- Run queue and system load statistics.
- Kernel internal tables utilization statistics.
- System and per Linux task switching activity.
- Swapping statistics.
- TTY device activity.
- Power management statistics (CPU clock frequency, fans speed, devices temperature, voltage inputs).
Here are files installed on Suse (RHEL is very similar, see below).
/etc/init.d/sysstat
/etc/sysstat
/etc/sysstat/sysstat
/etc/sysstat/sysstat.cron
/etc/sysstat/sysstat.ioconf
/usr/bin/iostat
/usr/bin/mpstat
/usr/bin/pidstat
/usr/bin/sadf
/usr/bin/sar
/usr/lib64/sa
/usr/lib64/sa/sa1
/usr/lib64/sa/sa2
/usr/lib64/sa/sadc  -- System activity data collector.
/usr/sbin/rcsysstat
/usr/share/doc/packages/sysstat
/usr/share/doc/packages/sysstat/CHANGES
/usr/share/doc/packages/sysstat/COPYING
/usr/share/doc/packages/sysstat/CREDITS
/usr/share/doc/packages/sysstat/FAQ
/usr/share/doc/packages/sysstat/README
/usr/share/doc/packages/sysstat/TODO
/usr/share/doc/packages/sysstat/sysstat-8.0.4.lsm
/usr/share/locale/af/LC_MESSAGES/sysstat.mo
/usr/share/locale/da/LC_MESSAGES/sysstat.mo
/usr/share/locale/de/LC_MESSAGES/sysstat.mo
/usr/share/locale/es/LC_MESSAGES/sysstat.mo
/usr/share/locale/fr/LC_MESSAGES/sysstat.mo
/usr/share/locale/it/LC_MESSAGES/sysstat.mo
/usr/share/locale/ja/LC_MESSAGES/sysstat.mo
/usr/share/locale/ky
/usr/share/locale/ky/LC_MESSAGES
/usr/share/locale/ky/LC_MESSAGES/sysstat.mo
/usr/share/locale/nb/LC_MESSAGES/sysstat.mo
/usr/share/locale/nl/LC_MESSAGES/sysstat.mo
/usr/share/locale/nn/LC_MESSAGES/sysstat.mo
/usr/share/locale/pl/LC_MESSAGES/sysstat.mo
/usr/share/locale/pt/LC_MESSAGES/sysstat.mo
/usr/share/locale/pt_BR/LC_MESSAGES/sysstat.mo
/usr/share/locale/ro/LC_MESSAGES/sysstat.mo
/usr/share/locale/ru/LC_MESSAGES/sysstat.mo
/usr/share/locale/sk/LC_MESSAGES/sysstat.mo
/usr/share/locale/sv/LC_MESSAGES/sysstat.mo
/usr/share/locale/vi/LC_MESSAGES/sysstat.mo
/usr/share/man/man1/iostat.1.gz
/usr/share/man/man1/mpstat.1.gz
/usr/share/man/man1/pidstat.1.gz
/usr/share/man/man1/sadf.1.gz
/usr/share/man/man1/sar.1.gz
/usr/share/man/man8/sa1.8.gz
/usr/share/man/man8/sa2.8.gz
/usr/share/man/man8/sadc.8.gz
/var/log/sa
Important part of implementation consist of scripts sa1 and sa2 that are invoked from cron, for example
# Activity reports every 10 minutes everyday
*/10 * * * * root [ -x /usr/lib64/sa/sa1 ] && exec /usr/lib64/sa/sa1 -S ALL 1 1
# Update reports every 6 hours
55 5,11,17,23 * * * root [ -x /usr/lib64/sa/sa2 ] && exec /usr/lib64/sa/sa2 -A
In all Linux implementation script sa1 calls sadc to write stats to the file /var/log/sa/sar${DAY} where
$DAY is the day of the week.
#!/bin/sh
# /usr/lib64/sa/sa1.sh
# (C) 1999-2006 Sebastien Godard (sysstat  wanadoo.fr)
#
umask 0022
ENDIR=/usr/lib64/sa
cd ${ENDIR}
if [ $# = 0 ]
then
# Note: Stats are written at the end of previous file *and* at the
# beginning of the new one (when there is a file rotation) only if
# outfile has been specified as '-' on the command line...
        exec ${ENDIR}/sadc -F -L 1 1 -
else
        exec ${ENDIR}/sadc -F -L $* -
fi
Script sa2 produces reports from the binary file
#!/bin/sh
# /usr/lib64/sa/sa2.sh
# (C) 1999-2006 Sebastien Godard (sysstat  wanadoo.fr)
#
# Changes:
# - 2004-01-22 Nils Philippsen
#   make history configurable
#
HISTORY=7
[ -r /etc/sysconfig/sysstat ] && . /etc/sysconfig/sysstat
[ ${HISTORY} -gt 25 ] && HISTORY=25
S_TIME_FORMAT=ISO ; export S_TIME_FORMAT
umask 0022
DATE=`date  +%d`
RPT=/var/log/sa/sar${DATE}
ENDIR=/usr/bin
DFILE=/var/log/sa/sa${DATE}
[ -f "$DFILE" ] || exit 0
cd ${ENDIR}
${ENDIR}/sar $* -f ${DFILE} > ${RPT}
find /var/log/sa \( -name 'sar??' -o -name 'sa??' \) -mtime +"${HISTORY}" -exec rm -f {} \;
On Suse we need to install two packages sysstat and sysstat-isag (the latter installs gnuplot
and other graphical packages to view reports). Like everything in Suse it is pretty convoluted: to activate sar
you need to
create a link in /etc/cron.d to /etc/sysstat/sysstat.cron
Running /etc/init.d/sysstat creates and deleted
this symbolic link to cron.d. Just run
/etc/init.d/boot.sysstat start
and you activate sar data collection and reporting on the server. As everything is Suse they overdid it and you can be
simple and just insert into cron the content of
/etc/sysstat/sysstat.cron
file.
# crontab for sysstat
# Activity reports every 10 minutes everyday
*/10 * * * * root [ -x /usr/lib64/sa/sa1 ] && exec /usr/lib64/sa/sa1 -S ALL 1 1
# Update reports every 6 hours
55 5,11,17,23 * * * root [ -x /usr/lib64/sa/sa2 ] && exec /usr/lib64/sa/sa2 -A
The idea of using a special script /etc/init.d/boot.sysstat to creates and deleted symbolic link to cron.d :
lrwxrwxrwx 1 root root 25 Sep 12 10:32 sysstat -> /etc/sysstat/sysstat.cron
allows to run sar only on selected run levels. For this purpose you need to add appropriate symbolic links to runlevels you
want sar running (typically 3 and 5) using chkconfig
|
On Suse /etc/init.d/boot.sysstat
creates and deleted symbolic link to cron.d on start and stop commands
|
Here is the relevant fragment of the /etc/init.d/boot.sysstat script :
case "$1" in
    start)
        echo "Running sadc"
        /usr/lib64/sa/sa1 1>/dev/null 2>&1 \
                && ln -fs /etc/sysstat/sysstat.cron /etc/cron.d/sysstat \
                || rc_failed 1
        rc_status -v
        ;;

    stop)
        echo "Removing sysstat's crontab"
        rm -f /etc/cron.d/sysstat
        rc_status -v
        ;;
This "over-complex" approach permits running sadc only on certain runlevels as well as the ability to
enable/disable data collection anytime. Whether it worth the price of additional complexity is another story :-)
On Red Hat /etc/init.d/sysstat the script inserts message LINUX RESTART
and tells sar that the kernel counters have been reinitialized (/usr/lib64/sa/sadc -F -L
-).
case "$1" in
  start)
        echo -n "Calling the system activity data collector (sadc): "
        /usr/lib64/sa/sadc -F -L - && touch /tmp/sysstat.run

# Try to guess if sadc was successfully launched. The difficulty
# here is that the exit code is lost when the above command is
# run via "su foo -c ..."
        if [ ! -f /tmp/sysstat.run ]; then
                RETVAL=1
        else
                rm -f /tmp/sysstat.run
        fi
        echo
        ;;
  stop|status|restart|reload)
        ;;
  *)
        echo "Usage: sysstat {start|stop|status|restart|reload}"
        exit 1
esac
exit ${RETVAL}
In RHEL, if sar package is activated, the crontab for root should contain something like this (this is actual Red Hat file
/etc/cron.d/sysstat ):
# run system activity accounting tool every 10 minutes
*/10 * * * * root /usr/lib64/sa/sa1 1 1
# generate a daily summary of process accounting at 23:53
53 23 * * * root /usr/lib64/sa/sa2 -A;
As you can see there are two shell scripts sa1 and sa2. While the first script invokes the utility
sard for collecting the data, the second produces reports if you want to get it periodically.
Summarizing it is important to understand that there are two programs sadc and sar that are not invoked
directly but via scripts sa1 and sa2. Those two shell scripts /usr/lib/sa/sa1 and
/usr/lib/sa/sa2
can be run by the cron daemon and provide daily statistics and reports.
See also sar reports
Here we will use Linux as an example.
The utility that writes data to disk is the binary utility /usr/lib64/sa/sadc It
is called system activity data collector binary, and it serves as a backend
to the sar command (generator of human readable reports).
By default /usr/lib64/sa/sadc writes binary log of kernel data to the
/var/log/sa/sadd
file, where the dd parameter is the current day (two
digits in the range 01-31).
This activity is controlled by cron script sysstat, which is stored in /etc/cron.d/systat
and is installed with the installation of the package.
The utility /usr/bin/sar is the command that generates human readable
report from binary "sa" file created by utility
/usr/lib64/sa/sadc
When script /usr/lib64/sa/sa2 in invoked from cron it writes report to
/var/log/sa directory. This "human readable" report has prefix sar and it
it easy to confuse it with binary files with prefix sa. I did it multiple times. So it is important to
understand the difference:
- Binary files created by /usr/lib64/sa/sadc have prefix sa, For
example
/var/log/sa/sa05
- Reports have prefix sar, For example
/var/log/sa/sar05
So for July 5, the report created by sar will be /var/log/sa/sar05. While the source binary report is /var/log/sa/sa05
Number of days preserved are controlled by /etc/sysconfig/sysstat file. Default is 28.
Daily "human readable" report typically is around 1 MB.
To print those data in human readable format from "sa" binary files you need to invoke the utility
sar
with option -f and specify binary file in question. For example:
sar -u -f /var/log/sa/sa05 > report05
See memory usage for particular period (useful for detecting memory leaks). For example, many
poorly programmed applications running under apache2 can leak memory.
sar -r -f /var/log/sa/sa20
Notes:
- Use “sar -R” to identify number of memory pages freed, used, and cached per second by the
system.
- Use “sar -H” to identify the hugepages (in KB) that are used and available.
- Use “sar -B” to generate paging statistics. i.e Number of KB paged in (and out) from disk per
second.
- Use “sar -W” to generate page swap statistics. i.e Page swap in (and out) per second.
CPU usage for particular period:
sar -u -f /var/log/sa/sa05 > report05
CPU Usage of Individual CPU or Core (sar -P)
(How to use sar for monitoring your Linux system sysstat sar examples and usage - blackMORE Ops
)
- sar -P ALL Displays CPU usage broken down by all cores
for the current day.
- sar -P ALL 1 3 Displays real time CPU usage for ALL
cores every 1 second for 3 times (broken down by all cores).
- sar -P 1 Displays CPU usage for core number 1 for the
current day.
- sar -P 1 1 3 Displays real time CPU usage for core
number 1, every 1 second for 3 times.
- sar -P ALL -f /var/log/sysstat/sa10 Displays CPU usage
broken down by all cores for the 10day day of the month from sa10 file.
Swap usage:
- sar -S
- sar -S 1 3
- sar -S -f /var/log/sysstat/sa10
Overall I/O Activities (sar -b)
Following fields are displayed:
- tps – Transactions per second (this includes both
read and write)
- rtps – Read transactions per second
- wtps – Write transactions per second
- bread/s – Bytes read per second
- bwrtn/s – Bytes written per second
- sar -b
- sar -b 1 3
- sar -b -f /var/log/sysstat/sa10
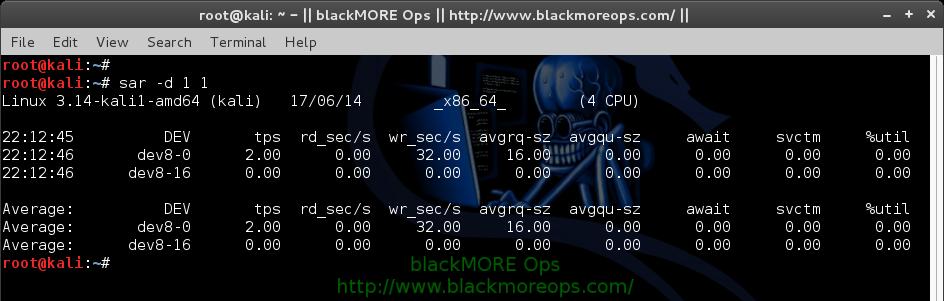
Individual Block Device I/O Activities (sar -d)
To identify the activities by the individual block devices (i.e a specific
mount point, or LUN, or partition), use “sar -d”
root@kali:~# sar -d 1 1
Linux 3.14-kali1-amd64 (kali)     17/06/14     _x86_64_    (4 CPU)

22:12:08          DEV       tps  rd_sec/s  wr_sec/s  avgrq-sz  avgqu-sz     await     svctm     %util
22:12:09       dev8-0      0.00      0.00      0.00      0.00      0.00      0.00      0.00      0.00
22:12:09      dev8-16      0.00      0.00      0.00      0.00      0.00      0.00      0.00      0.00

Average:          DEV       tps  rd_sec/s  wr_sec/s  avgrq-sz  avgqu-sz     await     svctm     %util
Average:       dev8-0      0.00      0.00      0.00      0.00      0.00      0.00      0.00      0.00
Average:      dev8-16      0.00      0.00      0.00      0.00      0.00      0.00      0.00      0.00
root@kali:~#
![How to use sar for monitoring - sysstat sar examples and usage - blackMORE Ops - 9]()
In the above example “DEV” indicates the specific block device.
For example: “dev53-1″ means a block device with 53 as major number, and 1
as minor number.
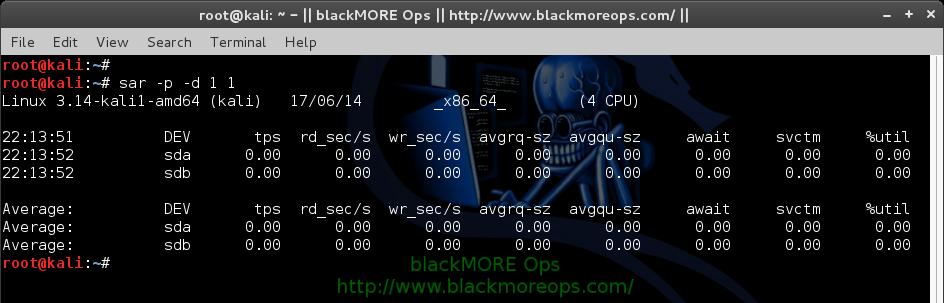
The device name (DEV column) can display the actual device name (for
example: sda, sda1, sdb1 etc.,), if you use the -p option (pretty print) as
shown below.
root@kali:~# sar -p -d 1 1
Linux 3.14-kali1-amd64 (kali)     17/06/14     _x86_64_    (4 CPU)

22:13:33          DEV       tps  rd_sec/s  wr_sec/s  avgrq-sz  avgqu-sz     await     svctm     %util
22:13:34          sda      0.00      0.00      0.00      0.00      0.00      0.00      0.00      0.00
22:13:34          sdb      0.00      0.00      0.00      0.00      0.00      0.00      0.00      0.00

Average:          DEV       tps  rd_sec/s  wr_sec/s  avgrq-sz  avgqu-sz     await     svctm     %util
Average:          sda      0.00      0.00      0.00      0.00      0.00      0.00      0.00      0.00
Average:          sdb      0.00      0.00      0.00      0.00      0.00      0.00      0.00      0.00
root@kali:~#
![How to use sar for monitoring - sysstat sar examples and usage - blackMORE Ops - 10]()
Following are few sar examples:
- sar -d
- sar -d 1 3
- sar -d -f /var/log/sysstat/sa10
- sar -p -d
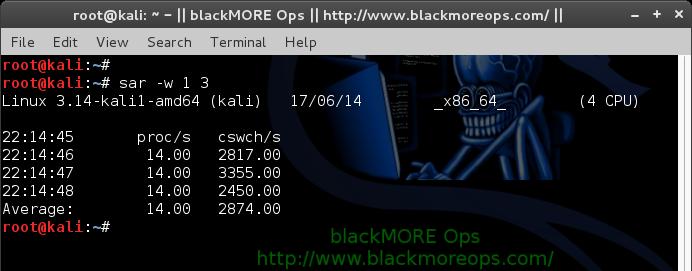
7. Display context switch per second (sar -w)
This reports the total number of processes created per second, and total
number of context switches per second. “1 3″ reports for every 1 seconds a
total of 3 times.
root@kali:~# sar -w 1 3
Linux 3.14-kali1-amd64 (kali)     17/06/14     _x86_64_    (4 CPU)

22:14:45       proc/s   cswch/s
22:14:46        14.00   2817.00
22:14:47        14.00   3355.00
22:14:48        14.00   2450.00
Average:        14.00   2874.00
root@kali:~#
![How to use sar for monitoring - sysstat sar examples and usage - blackMORE Ops - 11]()
Following are few sar examples:
- sar -w
- sar -w 1 3
- sar -w -f /var/log/sysstat/sa10
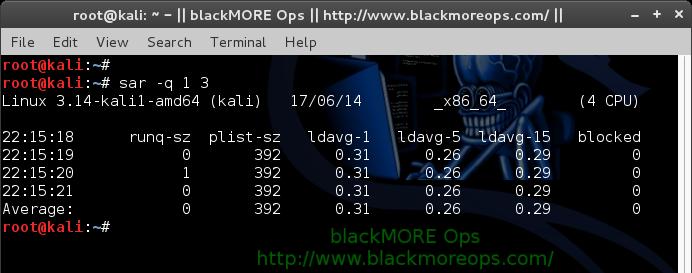
8. Reports run queue and load average (sar -q)
This reports the run queue size and load average of last 1 minute, 5
minutes, and 15 minutes. “1 3″ reports for every 1 seconds a total of 3 times.
root@kali:~# sar -q 1 3
Linux 3.14-kali1-amd64 (kali)     17/06/14     _x86_64_    (4 CPU)

22:15:18      runq-sz  plist-sz   ldavg-1   ldavg-5  ldavg-15   blocked
22:15:19            0       392      0.31      0.26      0.29         0
22:15:20            1       392      0.31      0.26      0.29         0
22:15:21            0       392      0.31      0.26      0.29         0
Average:            0       392      0.31      0.26      0.29         0
root@kali:~#
![How to use sar for monitoring - sysstat sar examples and usage - blackMORE Ops - 12]()
Note: The “blocked” column displays the number of tasks
that are currently blocked and waiting for I/O operation to complete.
Following are few sar examples:
- sar -q
- sar -q 1 3
- sar -q -f /var/log/sysstat/sa10
9. Report network statistics (sar -n)
This reports various network statistics. For example: number of packets
received (transmitted) through the network card, statistics of packet failure
etc.,. “1 3″ reports for every 1 seconds a total of 3 times.
sar -n KEYWORD
KEYWORD can be one of the following:
- DEV – Displays network devices vital statistics for eth0, eth1, etc.,
- EDEV – Display network device failure statistics
- NFS – Displays NFS client activities
- NFSD – Displays NFS server activities
- SOCK – Displays sockets in use for IPv4
- IP – Displays IPv4 network traffic
- EIP – Displays IPv4 network errors
- ICMP – Displays ICMPv4 network traffic
- EICMP – Displays ICMPv4 network errors
- TCP – Displays TCPv4 network traffic
- ETCP – Displays TCPv4 network errors
- UDP – Displays UDPv4 network traffic
- SOCK6, IP6, EIP6, ICMP6, UDP6 are for IPv6
- ALL – This displays all of the above information. The output will be
very long.
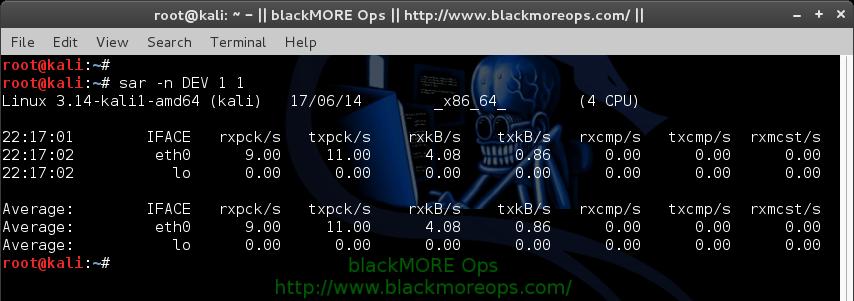
root@kali:~# sar -n DEV 1 1
Linux 3.14-kali1-amd64 (kali)     17/06/14     _x86_64_    (4 CPU)

22:16:15        IFACE   rxpck/s   txpck/s    rxkB/s    txkB/s   rxcmp/s   txcmp/s  rxmcst/s
22:16:16         eth0      4.00      4.00      0.92      0.26      0.00      0.00      0.00
22:16:16           lo      0.00      0.00      0.00      0.00      0.00      0.00      0.00

Average:        IFACE   rxpck/s   txpck/s    rxkB/s    txkB/s   rxcmp/s   txcmp/s  rxmcst/s
Average:         eth0      4.00      4.00      0.92      0.26      0.00      0.00      0.00
Average:           lo      0.00      0.00      0.00      0.00      0.00      0.00      0.00
root@kali:~#
![How to use sar for monitoring - sysstat sar examples and usage - blackMORE Ops - 13]()
10. Report Sar Data Using Start Time (sar -s)
When you view historic sar data from the /var/log/sysstat/saXX file using
“sar -f” option, it displays all the sar data for that specific day starting
from 12:00 a.m for that day.
Using “-s hh:mi:ss” option, you can specify the start time. For example, if
you specify “sar -s 10:00:00″, it will display the sar data starting from 10
a.m (instead of starting from midnight) as shown below.
You can combine -s option with other sar option.
For example, to report the load average on 26th of this month starting from
11 p.m in the morning, combine the -q and -s option as shown below.
root@kali:~# sar -q -f /var/log/sysstat/sa17 -s 23:00:01  | head
Linux 3.14-kali1-amd64 (kali)     17/06/14     _x86_64_    (4 CPU)

23:00:01      runq-sz  plist-sz   ldavg-1   ldavg-5  ldavg-15   blocked
23:02:01            2       381      0.19      0.36      0.37         0
23:04:01            0       381      0.19      0.28      0.33         0
23:06:01            0       382      0.07      0.20      0.30         0
23:08:01            1       382      0.17      0.18      0.28         0
23:10:01            1       373      0.06      0.14      0.25         0
23:12:01            0       372      0.10      0.13      0.23         0
23:14:01            0       372      0.36      0.19      0.24         0
root@kali:~#
There is no option to limit the end-time. You just have to get creative and
use head command as shown below.
For example, starting from 2300hrs (11PM) if you want to see 7 entries, you
have to pipe the above output to “head”
root@kali:~# sar -q -f /var/log/sysstat/sa17 -s 23:00:01  | head
Linux 3.14-kali1-amd64 (kali)     17/06/14     _x86_64_    (4 CPU)

23:00:01      runq-sz  plist-sz   ldavg-1   ldavg-5  ldavg-15   blocked
23:02:01            2       381      0.19      0.36      0.37         0
23:04:01            0       381      0.19      0.28      0.33         0
23:06:01            0       382      0.07      0.20      0.30         0
23:08:01            1       382      0.17      0.18      0.28         0
23:10:01            1       373      0.06      0.14      0.25         0
23:12:01            0       372      0.10      0.13      0.23         0
23:14:01            0       372      0.36      0.19      0.24         0
root@kali:~#
See also
Any tool that collects performance data has some impact on system performance, but with sar, it seems to be minimal. Even one minute
sampling usually does not cause any serious issues. That may not hold true on a system that is very busy.
Load averages can be extracted via -q, but you can't extract the one that you interested in. It's all or nothing report
and you need to grep it to get what you want.
# sar -q -f /var/log/sa/sa20
Linux 2.6.16.60-0.81.2-smp (myserver)   09/20/11

14:28:09      runq-sz  plist-sz   ldavg-1   ldavg-5  ldavg-15
14:30:01            5       198      3.21      3.18      3.18
14:40:01            5       195      3.20      3.23      3.19
14:45:01            4       192      3.05      3.16      3.16
14:46:01            1       191      3.07      3.14      3.16
14:47:01            1       190      3.11      3.14      3.16
14:48:01            1       191      3.16      3.16      3.16
- 20191108 : Command-line tools for collecting system statistics Opensource.com ( Nov 08, 2019 , opensource.com )
- 20190131 : Troubleshooting performance issue in CentOS-RHEL using collectl utility The Geek Diary ( Jan 31, 2019 , www.thegeekdiary.com )
- 20170403 : 10 Useful Sar (Sysstat) Examples for UNIX ( Linux Performance Monitoring )
- 20100912 : sysstat 9.1.5 ( sysstat 9.1.5, Sep 12, 2010 )
- 20100627 : dstat for Linux an alternative to sar-vmstat-iostst-etc. Retronux ( dstat for Linux an alternative to sar-vmstat-iostst-etc. Retronux, Jun 27, 2010 )
- 20090811 : SYSSTAT Howto A Deployment and Configuration Guide for Linux Servers ( SYSSTAT Howto A Deployment and Configuration Guide for Linux Servers, Aug 11, 2009 )
- 20090811 : Linux-101-Hacks ( Linux-101-Hacks, )
- 20090523 : Linux.com CLI Magic Tracking system performance with sar by Keith Winston ( March 20, 2006 )
- 20090523 : Project details for ksar ( Project details for ksar, )
- 20090523 : Project details for atsar ( Project details for atsar, )
- 20090523 : Project details for Sar P Plot ( Project details for Sar P Plot, )
- 20090523 : Project details for BSDsar ( Project details for BSDsar, )
- 20090523 : Red Hat Linux-Specific Information ( Red Hat Linux-Specific Information, )
- 20080202 : ITworld.com - UNIX SYSTEM ADMINISTRATION - Introducing SAR ( ITworld.com - UNIX SYSTEM ADMINISTRATION - Introducing SAR, Feb 2, 2008 )
- 20060818 : How To Monitor A System With Sysstat On Centos 4.3 HowtoForge - Linux Howtos and Tutorials ( How To Monitor A System With Sysstat On Centos 4.3 HowtoForge - Linux Howtos and Tutorials, Aug 18, 2006 )
- 20060818 : Optimizing AIX 5L performance Monitoring your CPU, Part 2 ( Optimizing AIX 5L performance Monitoring your CPU, Part 2, )
- 20060818 : Identifying I/O Bottlenecks Under UNIX ( Identifying I/O Bottlenecks Under UNIX, )
- 20060228 : Easy system monitoring with SAR by Sean Walberg ( Easy system monitoring with SAR, Feb 28, 2006 )
Examining collected data
The output from the sar command can be detailed, or you can choose to limit the data
displayed. For example, enter the sar command with no options, which displays only
aggregate CPU performance data. The sar command uses the current day by default, starting at
midnight, so you should only see the CPU data for today.
On the other hand, using the sar -A command shows all of the data that has been
collected for today. Enter the sar -A | less command now and page through the
output to view the many types of data collected by SAR, including disk and network usage, CPU
context switches (how many times per second the CPU switched from one program to another), page
swaps, memory and swap space usage, and much more. Use the man page for the sar command to
interpret the results and to get an idea of the many options available. Many of those options
allow you to view specific data, such as network and disk performance.
I typically use the sar -A command because many of the types of data available
are interrelated, and sometimes I find something that gives me a clue to a performance problem
in a section of the output that I might not have looked at otherwise. The -A
option displays all of the collected data types.
Look at the entire output of the sar -A | less command to get a feel for the
type and amount of data displayed. Be sure to look at the CPU usage data as well as the
processes started per second (proc/s) and context switches per second (cswch/s). If the number
of context switches increases rapidly, that can indicate that running processes are being
swapped off the CPU very frequently.
You can limit the total amount of data to the total CPU activity with the sar
-u command. Try that and notice that you only get the composite CPU data, not the data
for the individual CPUs. Also try the -r option for memory, and -S
for swap space. Combining these options so the following command will display CPU, memory, and
swap space is also possible:
sar -urS
Using the -p option displays block device names for hard drives instead of the
much more cryptic device identifiers, and -d displays only the block devices --
the hard drives. Issue the following command to view all of the block device data in a readable
format using the names as they are found in the /dev directory:
sar -dp | less
If you want only data between certain times, you can use -s and -e
to define the start and end times, respectively. The following command displays all CPU data,
both individual and aggregate for the time period between 7:50 AM and 8:11 AM today:
sar -P ALL -s 07:50:00 -e 08:11:00
Note that all times must be in 24-hour format. If you have multiple CPUs, each CPU is
detailed individually, and the average for all CPUs is also given.
The next command uses the -n option to display network statistics for all
interfaces:
sar -n ALL | less
Data for previous days
Data collected for previous days can also be examined by specifying the desired log file.
Assume that today's date is September 3 and you want to see the data for yesterday, the
following command displays all collected data for September 2. The last two digits of each file
are the day of the month on which the data was collected:
sar -A -f /var/log/sa/sa02 | less
You can use the command below, where DD is the day of the month for
yesterday:
sar -A -f /var/log/sa/saDD | less
Realtime data
You can also use SAR to display (nearly) realtime data. The following command displays
memory usage in 5- second intervals for 10 iterations:
sar -r 5 10
This is an interesting option for sar as it can provide a series of data points for a
defined period of time that can be examined in detail and compared. The /proc filesystem All of
this data for SAR and the system monitoring tools covered in my previous article must come from
somewhere. Fortunately, all of that kernel data is easily available in the /proc filesystem. In
fact, because the kernel performance data stored there is all in ASCII text format, it can be
displayed using simple commands like cat so that the individual programs do not
have to load their own kernel modules to collect it. This saves system resources and makes the
data more accurate. SAR and the system monitoring tools I have discussed in my previous article
all collect their data from the /proc filesystem.
Note that /proc is a virtual filesystem and only exists in RAM while Linux is running. It is
not stored on the hard drive.
Even though I won't get into detail, the /proc filesystem also contains the live kernel
tuning parameters and variables. Thus you can change the kernel tuning by simply changing the
appropriate kernel tuning variable in /proc; no reboot is required.
Change to the /proc directory and list the files there.You will see, in addition to the data
files, a large quantity of numbered directories. Each of these directories represents a process
where the directory name is the Process ID (PID). You can delve into those directories to
locate information about individual processes that might be of interest.
To view this data, simply cat some of the following files:
cmdline -- displays the kernel command line, including all parameters passed
to it.cpuinfo -- displays information about the CPU(s) including flags, model name
stepping, and cache size.meminfo -- displays very detailed information about memory, including data
such as active and inactive memory, and total virtual memory allocated and that used, that is
not always displayed by other tools.iomem and ioports -- lists the memory ranges and ports defined
for various I/O devices.
You will see that, although the data is available in these files, much of it is not
annotated in any way. That means you will have work to do to identify and extract the desired
data. However, the monitoring tools already discussed already do that for the data they are
designed to display.
There is so much more data in the /proc filesystem that the best way to learn more about it
is to refer to the proc(5) man page, which contains detailed information about the various
files found there.
Next time I will pull all this together and discuss how I have used these tools to solve
problems.
David Both - David Both is an Open Source Software and GNU/Linux
advocate, trainer, writer, and speaker who lives in Raleigh North Carolina. He is a strong
proponent of and evangelist for the "Linux Philosophy." David has been in the IT industry for
nearly 50 years. He has taught RHCE classes for Red Hat and has worked at MCI Worldcom, Cisco,
and the State of North Carolina. He has been working with Linux and Open Source Software for
over 20 years.
Troubleshooting performance issue in CentOS/RHEL using collectl utility
By admin
Unlike most monitoring tools that either focus on a small set of statistics, format their
output in only one way, run either interactively or as a daemon but not both, collectl tries to
do it all. You can choose to monitor any of a broad set of subsystems which currently include
buddyinfo, cpu, disk, inodes, InfiniBand, lustre, memory, network, nfs, processes, quadrics,
slabs, sockets and tcp.
Installing collectl
The collectl community project is maintained at http://collectl.sourceforge.net/ as well as provided in
the Fedora community project. For Red Hat Enterprise Linux 6 and 7, the easiest way to install
collectl is via the EPEL repositories (Extra Packages for Enterprise Linux) maintained by the
Fedora community.
Once set up, collectl can be installed with the following command:
# yum install collectl
The packages are also available for direct download using the following links:
RHEL 5 x86_64 (available in the EPEL archives) https://archive.fedoraproject.org/pub/archive/epel/5/x86_64/
RHEL 6 x86_64 http://dl.fedoraproject.org/pub/epel/6/x86_64/
RHEL 7 x86_64 http://dl.fedoraproject.org/pub/epel/7/x86_64/
General
usage of collectl
The collectl utility can be run manually via the command line or as a service. Data will be
logged to /var/log/collectl/*.raw.gz . The logs will be rotated every 24 hours by default. To
run as a service:
# chkconfig collectl on       # [optional, to start at boot time]
# service collectl start
Sample Intervals
When run manually from the command line, the first Interval value is 1 . When running as a
service, default sample intervals are as show below. It might sometimes be desired to lower
these to avoid averaging, such as 1,30,60.
# grep -i interval /etc/collectl.conf
#Interval =     10
#Interval2 =    60
#Interval3 =   120
Using collectl to troubleshoot disk or SAN storage performance
The defaults of 10s for all but process data which is collected at 60s intervals are best
left as is, even for storage performance analysis.
The SAR Equivalence
Matrix shows common SAR command equivalents to help experienced SAR users learn to use
Collectl. The following example command will view summary detail of the CPU, Network and Disk
from the file /var/log/collectl/HOSTNAME-20190116-164506.raw.gz :
# collectl -scnd -oT -p HOSTNAME-20190116-164506.raw.gz
#         <----CPU[HYPER]-----><----------Disks-----------><----------Network---------->
#Time     cpu sys inter  ctxsw KBRead  Reads KBWrit Writes   KBIn  PktIn  KBOut  PktOut
16:46:10    9   2 14470  20749      0      0     69      9      0      1      0       2
16:46:20   13   4 14820  22569      0      0    312     25    253    174      7      79
16:46:30   10   3 15175  21546      0      0     54      5      0      2      0       3
16:46:40    9   2 14741  21410      0      0     57      9      1      2      0       4
16:46:50   10   2 14782  23766      0      0    374      8    250    171      5      75
....
The next example will output the 1 minute period from 17:00 – 17:01.
# collectl -scnd -oT --from 17:00 --thru 17:01 -p HOSTNAME-20190116-164506.raw.gz
#         <----CPU[HYPER]-----><----------Disks-----------><----------Network---------->
#Time     cpu sys inter  ctxsw KBRead  Reads KBWrit Writes   KBIn  PktIn  KBOut  PktOut
17:00:00   13   3 15870  25320      0      0     67      9    251    172      6      90
17:00:10   16   4 16386  24539      0      0    315     17    246    170      6      84
17:00:20   10   2 14959  22465      0      0     65     26      5      6      1       8
17:00:30   11   3 15056  24852      0      0    323     12    250    170      5      69
17:00:40   18   5 16595  23826      0      0    463     13      1      5      0       5
17:00:50   12   3 15457  23663      0      0     57      9    250    170      6      76
17:01:00   13   4 15479  24488      0      0    304      7    254    176      5      70
The next example will output Detailed Disk data.
# collectl -scnD -oT -p HOSTNAME-20190116-164506.raw.gz

### RECORD    7 >>> tabserver <<< (1366318860.001) (Thu Apr 18 17:01:00 2013) ###

# CPU[HYPER] SUMMARY (INTR, CTXSW & PROC /sec)
# User  Nice   Sys  Wait   IRQ  Soft Steal  Idle  CPUs  Intr  Ctxsw  Proc  RunQ   Run   Avg1  Avg5 Avg15 RunT BlkT
     8     0     3     0     0     0     0    86     8   15K    24K     0   638     5   1.07  1.05  0.99    0    0

# DISK STATISTICS (/sec)
#          <---------reads---------><---------writes---------><--------averages--------> Pct
#Name       KBytes Merged  IOs Size  KBytes Merged  IOs Size  RWSize  QLen  Wait SvcTim Util
sda              0      0    0    0     304     11    7   44      44     2    16      6    4
sdb              0      0    0    0       0      0    0    0       0     0     0      0    0
dm-0             0      0    0    0       0      0    0    0       0     0     0      0    0
dm-1             0      0    0    0       5      0    1    4       4     1     2      2    0
dm-2             0      0    0    0     298      0   14   22      22     1     4      3    4
dm-3             0      0    0    0       0      0    0    0       0     0     0      0    0
dm-4             0      0    0    0       0      0    0    0       0     0     0      0    0
dm-5             0      0    0    0       0      0    0    0       0     0     0      0    0
dm-6             0      0    0    0       0      0    0    0       0     0     0      0    0
dm-7             0      0    0    0       0      0    0    0       0     0     0      0    0
dm-8             0      0    0    0       0      0    0    0       0     0     0      0    0
dm-9             0      0    0    0       0      0    0    0       0     0     0      0    0
dm-10            0      0    0    0       0      0    0    0       0     0     0      0    0
dm-11            0      0    0    0       0      0    0    0       0     0     0      0    0

# NETWORK SUMMARY (/sec)
# KBIn  PktIn SizeIn  MultI   CmpI  ErrsI  KBOut PktOut  SizeO   CmpO  ErrsO
   253    175   1481      0      0      0      5     70     79      0      0
....
Commonly used options
These generate summary, which is the total of ALL data for a particular type
- b - buddy info (memory fragmentationc cpu
- d - disk
- f - nfs
- i - inodes
- j - interrupts by CPU
- l - lustre
- m - memory
- n - network
- s - sockets
- t - tcp
- x – Interconnect
- y – Slabs (system object caches)
These generate detail data, typically but not limited to the device level
- C - individual CPUs, including interrupts if sj or sJ
- D - individual Disks
- E - environmental (fan, power, temp) [requires ipmitool]
- F - nfs data
- J - interrupts by CPU by interrupt number
- L - lustre
- M - memory numa/node
- N - individual Networks
- T - tcp details (lots of data!)
- X - interconnect ports/rails (Infiniband/Quadrics)
- Y - slabs/slubs
- Z - processes
The most useful switches are listed here
- -sD detailed disk data
- -sC detailed CPU data
- -sN detailed network data
- -sZ detailed process data
Final Thoughts
Performance Co-Pilot (PCP) is the preferred tool for collecting comprehensive performance
metrics for performance analysis and troubleshooting. It is shipped and supported in Red Hat
Enterprise Linux 6 & 7 and is the preferred recommendation over Collectl or Sar/Sysstat. It
also includes conversion tools between its own performance data and Collectl &
Sar/Syststat.
3. Memory Free and Used (sar -r)
This reports the memory statistics. "1 3" reports for every 1 seconds a total
of 3 times. Most likely you'll focus on "kbmemfree" and "kbmemused" for free and
used memory.
$ sar -r 1 3
Linux 2.6.18-194.el5PAE (dev-db)        03/26/2011      _i686_  (8 CPU)

07:28:06 AM kbmemfree kbmemused  %memused kbbuffers  kbcached  kbcommit   %commit  kbactive   kbinact
07:28:07 AM   6209248   2097432     25.25    189024   1796544    141372      0.85   1921060     88204
07:28:08 AM   6209248   2097432     25.25    189024   1796544    141372      0.85   1921060     88204
07:28:09 AM   6209248   2097432     25.25    189024   1796544    141372      0.85   1921060     88204
Average:      6209248   2097432     25.25    189024   1796544    141372      0.85   1921060     88204
Following are few variations:
- sar -r
- sar -r 1 3
- sar -r -f /var/log/sa/sa10
4. Swap Space Used (sar -S)
This reports the swap statistics. "1 3" reports for every 1 seconds a total of
3 times. If the "kbswpused" and "%swpused" are at 0, then your system is not
swapping.
$ sar -S 1 3
Linux 2.6.18-194.el5PAE (dev-db)        03/26/2011      _i686_  (8 CPU)

07:31:06 AM kbswpfree kbswpused  %swpused  kbswpcad   %swpcad
07:31:07 AM   8385920         0      0.00         0      0.00
07:31:08 AM   8385920         0      0.00         0      0.00
07:31:09 AM   8385920         0      0.00         0      0.00
Average:      8385920         0      0.00         0      0.00
Following are few variations:
- sar -S
- sar -S 1 3
- sar -S -f /var/log/sa/sa10
Notes:
- Use "sar -R" to identify number of memory pages freed, used, and cached per
second by the system.
- Use "sar -H" to identify the hugepages (in KB) that are used and available.
- Use "sar -B" to generate paging statistics. i.e Number of KB paged in (and
out) from disk per second.
- Use "sar -W" to generate page swap statistics. i.e Page swap in (and out)
per second.
5. Overall I/O Activities (sar -b)
This reports I/O statistics. "1 3" reports for every 1 seconds a total of 3
times.
Following fields are displays in the example below.
- tps – Transactions per second (this includes both read and write)
- rtps – Read transactions per second
- wtps – Write transactions per second
- bread/s – Bytes read per second
- bwrtn/s – Bytes written per second
$ sar -b 1 3
Linux 2.6.18-194.el5PAE (dev-db)        03/26/2011      _i686_  (8 CPU)

01:56:28 PM       tps      rtps      wtps   bread/s   bwrtn/s
01:56:29 PM    346.00    264.00     82.00   2208.00    768.00
01:56:30 PM    100.00     36.00     64.00    304.00    816.00
01:56:31 PM    282.83     32.32    250.51    258.59   2537.37
Average:       242.81    111.04    131.77    925.75   1369.90
Following are few variations:
- sar -b
- sar -b 1 3
- sar -b -f /var/log/sa/sa10
Note: Use "sar -v" to display number of inode handlers, file
handlers, and pseudo-terminals used by the system.
6. Individual Block Device I/O Activities (sar -d)
To identify the activities by the individual block devices (i.e a specific
mount point, or LUN, or partition), use "sar -d"
$ sar -d 1 1
Linux 2.6.18-194.el5PAE (dev-db)        03/26/2011      _i686_  (8 CPU)

01:59:45 PM       DEV       tps  rd_sec/s  wr_sec/s  avgrq-sz  avgqu-sz     await     svctm     %util
01:59:46 PM    dev8-0      1.01      0.00      0.00      0.00      0.00      4.00      1.00      0.10
01:59:46 PM    dev8-1      1.01      0.00      0.00      0.00      0.00      4.00      1.00      0.10
01:59:46 PM dev120-64      3.03     64.65      0.00     21.33      0.03      9.33      5.33      1.62
01:59:46 PM dev120-65      3.03     64.65      0.00     21.33      0.03      9.33      5.33      1.62
01:59:46 PM  dev120-0      8.08      0.00    105.05     13.00      0.00      0.38      0.38      0.30
01:59:46 PM  dev120-1      8.08      0.00    105.05     13.00      0.00      0.38      0.38      0.30
01:59:46 PM dev120-96      1.01      8.08      0.00      8.00      0.01      9.00      9.00      0.91
01:59:46 PM dev120-97      1.01      8.08      0.00      8.00      0.01      9.00      9.00      0.91
In the above example "DEV" indicates the specific block device.
For example: "dev53-1" means a block device with 53 as major number, and 1 as
minor number.
The device name (DEV column) can display the actual device name (for example:
sda, sda1, sdb1 etc.,), if you use the -p option (pretty print) as shown below.
$ sar -p -d 1 1
Linux 2.6.18-194.el5PAE (dev-db)        03/26/2011      _i686_  (8 CPU)

01:59:45 PM       DEV       tps  rd_sec/s  wr_sec/s  avgrq-sz  avgqu-sz     await     svctm     %util
01:59:46 PM       sda      1.01      0.00      0.00      0.00      0.00      4.00      1.00      0.10
01:59:46 PM      sda1      1.01      0.00      0.00      0.00      0.00      4.00      1.00      0.10
01:59:46 PM      sdb1      3.03     64.65      0.00     21.33      0.03      9.33      5.33      1.62
01:59:46 PM      sdc1      3.03     64.65      0.00     21.33      0.03      9.33      5.33      1.62
01:59:46 PM      sde1      8.08      0.00    105.05     13.00      0.00      0.38      0.38      0.30
01:59:46 PM      sdf1      8.08      0.00    105.05     13.00      0.00      0.38      0.38      0.30
01:59:46 PM      sda2      1.01      8.08      0.00      8.00      0.01      9.00      9.00      0.91
01:59:46 PM      sdb2      1.01      8.08      0.00      8.00      0.01      9.00      9.00      0.91
Following are few variations:
- sar -d
- sar -d 1 3
- sar -d -f /var/log/sa/sa10
- sar -p -d
7. Display context switch per second (sar -w)
This reports the total number of processes created per second, and total number
of context switches per second. "1 3" reports for every 1 seconds a total of 3
times.
$ sar -w 1 3
Linux 2.6.18-194.el5PAE (dev-db)        03/26/2011      _i686_  (8 CPU)

08:32:24 AM    proc/s   cswch/s
08:32:25 AM      3.00     53.00
08:32:26 AM      4.00     61.39
08:32:27 AM      2.00     57.00
Following are few variations:
- sar -w
- sar -w 1 3
- sar -w -f /var/log/sa/sa10
8. Reports run queue and load average (sar -q)
This reports the run queue size and load average of last 1 minute, 5 minutes,
and 15 minutes. "1 3" reports for every 1 seconds a total of 3 times.
$ sar -q 1 3
Linux 2.6.18-194.el5PAE (dev-db)        03/26/2011      _i686_  (8 CPU)

06:28:53 AM   runq-sz  plist-sz   ldavg-1   ldavg-5  ldavg-15   blocked
06:28:54 AM         0       230      2.00      3.00      5.00         0
06:28:55 AM         2       210      2.01      3.15      5.15         0
06:28:56 AM         2       230      2.12      3.12      5.12         0
Average:            3       230      3.12      3.12      5.12         0
Note: The "blocked" column displays the number of tasks that
are currently blocked and waiting for I/O operation to complete.
Following are few variations:
- sar -q
- sar -q 1 3
- sar -q -f /var/log/sa/sa10
9. Report network statistics (sar -n)
This reports various network statistics. For example: number of packets
received (transmitted) through the network card, statistics of packet failure
etc.,. "1 3" reports for every 1 seconds a total of 3 times.
sar -n KEYWORD
KEYWORD can be one of the following:
- DEV – Displays network devices vital statistics for eth0, eth1, etc.,
- EDEV – Display network device failure statistics
- NFS – Displays NFS client activities
- NFSD – Displays NFS server activities
- SOCK – Displays sockets in use for IPv4
- IP – Displays IPv4 network traffic
- EIP – Displays IPv4 network errors
- ICMP – Displays ICMPv4 network traffic
- EICMP – Displays ICMPv4 network errors
- TCP – Displays TCPv4 network traffic
- ETCP – Displays TCPv4 network errors
- UDP – Displays UDPv4 network traffic
- SOCK6, IP6, EIP6, ICMP6, UDP6 are for IPv6
- ALL – This displays all of the above information. The output will be very
long.
$ sar -n DEV 1 1
Linux 2.6.18-194.el5PAE (dev-db)        03/26/2011      _i686_  (8 CPU)

01:11:13 PM     IFACE   rxpck/s   txpck/s   rxbyt/s   txbyt/s   rxcmp/s   txcmp/s  rxmcst/s
01:11:14 PM        lo      0.00      0.00      0.00      0.00      0.00      0.00      0.00
01:11:14 PM      eth0    342.57    342.57  93923.76 141773.27      0.00      0.00      0.00
01:11:14 PM      eth1      0.00      0.00      0.00      0.00      0.00      0.00      0.00
10. Report Sar Data Using Start Time (sar -s)
When you view historic sar data from the /var/log/sa/saXX file using "sar -f"
option, it displays all the sar data for that specific day starting from 12:00 a.m
for that day.
Using "-s hh:mi:ss" option, you can specify the start time. For example, if you
specify "sar -s 10:00:00", it will display the sar data starting from 10 a.m
(instead of starting from midnight) as shown below.
You can combine -s option with other sar option.
For example, to report the load average on 26th of this month starting from 10
a.m in the morning, combine the -q and -s option as shown below.
$ sar -q -f /var/log/sa/sa23 -s 10:00:01
Linux 2.6.18-194.el5PAE (dev-db)        03/26/2011      _i686_  (8 CPU)

10:00:01 AM   runq-sz  plist-sz   ldavg-1   ldavg-5  ldavg-15   blocked
10:10:01 AM         0       127      2.00      3.00      5.00         0
10:20:01 AM         0       127      2.00      3.00      5.00         0
...
11:20:01 AM         0       127      5.00      3.00      3.00         0
12:00:01 PM         0       127      4.00      2.00      1.00         0
There is no option to limit the end-time. You just have to get creative and use
head command as shown below.
For example, starting from 10 a.m, if you want to see 7 entries, you have to
pipe the above output to "head -n 10".
$ sar -q -f /var/log/sa/sa23 -s 10:00:01 | head -n 10
Linux 2.6.18-194.el5PAE (dev-db)        03/26/2011      _i686_  (8 CPU)

10:00:01 AM   runq-sz  plist-sz   ldavg-1   ldavg-5  ldavg-15   blocked
10:10:01 AM         0       127      2.00      3.00      5.00         0
10:20:01 AM         0       127      2.00      3.00      5.00         0
10:30:01 AM         0       127      3.00      5.00      2.00         0
10:40:01 AM         0       127      4.00      2.00      1.00         2
10:50:01 AM         0       127      3.00      5.00      5.00         0
11:00:01 AM         0       127      2.00      1.00      6.00         0
11:10:01 AM         0       127      1.00      3.00      7.00         2
There is lot more to cover in Linux performance monitoring and tuning. We are
only getting started. More articles to come in the performance series.
The sysstat package contains the sar, sadf, iostat, mpstat, and pidstat commands for Linux. The sar command collects and reports
system activity information. The statistics reported by sar concern I/O ... transfer rates, paging activity, process-related activites,
interrupts, network activity, memory and swap space utilization, CPU utilization, kernel activities, and TTY statistics, among others.
The sadf command may be used to display data collected by sar in various formats. The iostat command reports CPU statistics and
I/O statistics for tty devices and disks. The pidstat command reports statistics for Linux processes. The mpstat command reports
global and per-processor statistics. The nfsiostat command reports I/O statistics for network filesystems. The cifsiostat command
reports I/O statistics for CIFS filesystems
(more)
Changes: Voltage input statistics, together with some other metrics, have been added
to sar's power management group of statistics. NLS has been updated. A Czech translation has been added.
Written in python, dstat is a neat piece of tooling. It
is a monitoring tool akin to sar, iostat, vmstat, etc. It allows you to measure a host of metrics. You can install it on any modern
ubuntu box by typing "apt-get install dstat" (and I am sure it is available for any major distro).
SYSSTAT is a software application comprised of several tools that offers advanced system performance monitoring. It provides the
ability to create a measurable baseline of server performance, as well as the capability to formulate, accurately assess and conclude
what led up to an issue or unexpected occurrence. In short, it lets you peel back layers of the system to see how it's doing...
in a way it is the blinking light telling you what is going on, except it blinks to a file. SYSSTAT has broad coverage of performance
statistics and will watch the following server elements:
- Input/Output and transfer rate statistics (global, per device, per partition, per network filesystem and per Linux task
/ PID)
- CPU statistics (global, per CPU and per Linux task / PID), including support for virtualization architectures
- Memory and swap space utilization statistics
- Virtual memory, paging and fault statistics
- Per-task (per-PID) memory and page fault statistics
- Global CPU and page fault statistics for tasks and all their children
- Process creation activity
- Interrupt statistics (global, per CPU and per interrupt, including potential APIC interrupt sources)
- Extensive network statistics: network interface activity (number of packets and kB received and transmitted per second,
etc.) including failures from network devices; network traffic statistics for IP, TCP, ICMP and UDP protocols based on SNMPv2
standards.
- NFS server and client activity
- Socket statistics
- Run queue and system load statistics
- Kernel internal tables utilization statistics
- System and per Linux task switching activity
- Swapping statistics
- TTY device activity
(List source - http://pagesperso-orange.fr/sebastien.godard/features.html)
Scope
This article covers a brief overview of how the SYSSTAT utility works, initial configuration, deployment and testing on Linux
based servers. It includes an optional system configuration guide for writing SYSSTAT data into a MySQL database. This article is
not intended to be an in-depth explanation of the inner workings of SYSSTAT, nor a detailed manual on database storage operations.
Now... on to the interesting parts of SYSSTAT!
Overview
The SYSSTAT software application is composed of several utilities. Each utility has a specific function:
- iostat reports CPU statistics and input/output statistics for devices, partitions and network filesystems.
- mpstat reports individual or combined processor related statistics.
- pidstat reports statistics for Linux tasks (processes) : I/O, CPU, memory, etc.
- sar collects, reports and saves system activity information (CPU, memory, disks, interrupts, network interfaces,
TTY, kernel tables, NFS, sockets etc.)
- sadc is the system activity data collector, used as a backend for sar.
- sa1 collects and stores binary data in the system activity daily data file. It is a front end to sadc designed to
be run from cron.
- sa2 writes a summarized daily activity report. It is a front end to sar designed to be run from cron.
- sadf displays data collected by sar in multiple formats (CSV, XML, etc.) This is useful to load performance data
into a database, or import them in a spreadsheet to make graphs.
(List source - http://pagesperso-orange.fr/sebastien.godard/documentation.html)
The four main components used in collection activities are sar, sa1, sa2 and cron. Sar is
the system activity reporter. This tool will display interpreted results from the collected
data. Sar is ran interactively by an administrator via command line. When a sar file is created, it is written into the /var/log/sa
directory and named sar##. The ## is a numerical value that represents the day of the month (i.e. sa03 would
be the third day of the month). The numerical value changes accordingly without system administrator intervention. There are many
option flags to choose from to display data in a sar file to view information about server operations, such as cpu, network activity,
NFS and sockets. These options can be viewed by reviewing the man pages of sar.
Sa1 is the internal mechanism that performs the actual statistical collection and writes the data to a binary file at
specified times. Information is culled from the /proc directory where the Linux kernel writes and maintains pertinent data
while the operating system is running. Similar to sar, the binary file is written into /var/log/sa and named sa##.
Again, the ## represents the day of the month (i.e. sar03 would be the third day of the month). Once more, the numerical
value changes accordingly without system administrator intervention.
Sa2 is responsible for converting the sa1 binary file into a human readable format. Upon successful creation of the binary
file sa## it becomes necessary to set up a cron task that will call the sa2 libraries to convert the sa1 binary file into
the human-readable sar file. SYSSTAT utilizes the scheduled cron command execution to draw and record specified performance data
based upon pre-defined parameters. It is not necessary to run the sa2 cron at the same time or as often as the sa1
cron. The sa2 function will create and write the sar file to the /var/log/sa directory.
How often SYSSTAT "wakes up" to record and what data is captured, is determined by your operational needs, regulatory requirements
and purposes of the server being monitored. These logs can be rotated to a central logging server and stored for analysis at a later
date if desired.
Display CPU Statistics using Sar Command
# sar –u
Linux 2.6.9-42.ELsmp (dev-db) 01/01/2009
12:00:01 AM CPU %user %nice %system %iowait %idle
12:05:01 AM all 3.70 0.00 0.85 0.00 95.45
12:10:01 AM all 4.59 0.00 1.19 0.06 94.16
12:15:01 AM all 3.90 0.00 0.95 0.04 95.11
12:20:01 AM all 4.06 0.00 1.00 0.01 94.93
12:25:01 AM all 3.89 0.00 0.87 0.00 95.23
12:30:01 AM all 3.89 0.00 0.87 0.00 95.23
Skipped..
Average: all 4.56 0.00 1.00 0.15 94.29
Note:
If you need a break down of the performance data
for the individual CPU's, execute the following command.
# sar -u -P ALL
Display Disk IO Statistics using sar command
# sar –d
Linux 2.6.9-42.ELsmp (dev-db) 01/01/2009
12:00:01 AM DEV tps rd_sec/s wr_sec/s
12:05:01 AM dev2-0 1.65 1.28 45.43
12:10:01 AM dev8-1 4.08 8.11 21.81
Skipped..
Average: dev2-0 4.66 120.77 69.45
Average: dev8-1 1.89 3.17 8.02
Display networking Statistics using sar command
# sar -n DEV | more
Linux 2.6.9-42.ELsmp (dev-db) 01/01/2009
12:00:01 AM IFACE rxpck/s txpck/s rxbyt/s txbyt/s rxcmp/s txcmp/
s rxmcst/s
12:05:01 AM lo 0.17 0.16 25.31 23.33 0.00 0.0
0 0.00
12:10:01 AM eth0 52.92 53.64 10169.74 12178.57 0.00 0.0
0 0.00
# sar -n SOCK |more
Linux 2.6.9-42.ELsmp (dev-db) 01/01/2009
12:00:01 AM totsck tcpsck udpsck rawsck ip-frag
12:05:01 AM 50 13 3 0 0
12:10:01 AM 50 13 4 0 0
March 20, 2006
Sadc (system activity data collector) is the program that gathers performance data. It pulls its data out of the virtual /proc filesystem,
then it saves the data in a file (one per day) named /var/log/sa/saDD where DD is the day of the month.
Two shell scripts from the sysstat package control how the data collector is run. The first script, sa1, controls how often data
is collected, while sa2 creates summary reports (one per day) in /var/log/sa/sarDD. Both scripts are run from cron. In the default
configuration, data is collected every 10 minutes and summarized just before midnight.
If you suspect a performance problem with a particular program, you can use sadc to collect data on a particular
process (with the -x argument), or its children (-X), but you will need to set up a custom script using
those flags.
As Dr. Heisenberg showed, the act of measuring something changes it. Any tool that collects performance data has some overall
negative impact on system performance, but with sar, the impact seems to be minimal. I ran a test with the sa1 cron job set to gather
data every minute (on a server that was not busy) and it didn't cause any serious issues. That may not hold true on a busy system.
Creating reports
If the daily summary reports created by the sa2 script are not enough, you can create your own custom reports using sar. The
sar program reads data from the current daily data file unless you specify otherwise. To have sar read a particular data file, use
the -f /var/log/sa/saDD option. You can select multiple files by using multiple -f options. Since many
of sar's reports are lengthy, you may want to pipe the output to a file.
To create a basic report showing CPU usage and I/O wait time percentage, use sar with no flags. It produces a report
similar to this:
01:10:00 PM       CPU     %user     %nice   %system   %iowait     %idle
01:20:00 PM       all      7.78      0.00      3.34     20.94     67.94
01:30:00 PM       all      0.75      0.00      0.46      1.71     97.08
01:40:00 PM       all      0.65      0.00      0.48      1.63     97.23
01:50:00 PM       all      0.96      0.00      0.74      2.10     96.19
02:00:00 PM       all      0.58      0.00      0.54      1.87     97.01
02:10:00 PM       all      0.80      0.00      0.60      1.27     97.33
02:20:01 PM       all      0.52      0.00      0.37      1.17     97.94
02:30:00 PM       all      0.49      0.00      0.27      1.18     98.06
Average:          all      1.85      0.00      0.44      2.56     95.14
If the %idle is near zero, your CPU is overloaded. If the %iowait is large, your disks are overloaded.
To check the kernel's paging performance, use sar -B, which will produce a report similar to this:
11:00:00 AM  pgpgin/s pgpgout/s   fault/s  majflt/s
11:10:00 AM      8.90     34.08      0.00      0.00
11:20:00 AM      2.65     26.63      0.00      0.00
11:30:00 AM      1.91     34.92      0.00      0.00
11:40:01 AM      0.26     36.78      0.00      0.00
11:50:00 AM      0.53     32.94      0.00      0.00
12:00:00 PM      0.17     30.70      0.00      0.00
12:10:00 PM      1.22     27.89      0.00      0.00
12:20:00 PM      4.11    133.48      0.00      0.00
12:30:00 PM      0.41     31.31      0.00      0.00
Average:       130.91     27.04      0.00      0.00
Raw paging numbers may not be of concern, but a high number of
major faults (majflt/s) indicate that the system needs more
memory. Note that majflt/s is only valid with kernel versions 2.5 and later.
For network statistics, use sar -n DEV. The -n DEV option tells sar to generate a report that shows
the number of packets and bytes sent and received for each interface. Here is an abbreviated version of the report:
11:00:00 AM     IFACE   rxpck/s   txpck/s   rxbyt/s   txbyt/s
11:10:00 AM        lo      0.62      0.62     35.03     35.03
11:10:00 AM      eth0     29.16     36.71   4159.66  34309.79
11:10:00 AM      eth1      0.00      0.00      0.00      0.00
11:20:00 AM        lo      0.29      0.29     15.85     15.85
11:20:00 AM      eth0     25.52     32.08   3535.10  29638.15
11:20:00 AM      eth1      0.00      0.00      0.00      0.00
To see network errors, try sar -n EDEV, which shows network failures.
Reports on current activity
Sar can also be used to view what is happening with a specific subsystem, such as networking or I/O, almost in real time. By
passing a time interval (in seconds) and a count for the number of reports to produce, you can take an immediate snapshot of a system
to find a potential bottleneck.
For example, to see the basic report every second for the next 10 seconds, use sar 1 10. You can run any of the
reports this way to see near real-time results.
Benchmarking
Even if you have plenty of horsepower to run your applications, you can use sar to track changes in the workload over time. To
do this, save the summary reports (sar only saves seven) to a different directory over a period of a few weeks or a month. This
set of reports can serve as a baseline for the normal system workload. Then compare new reports against the baseline to see how
the workload is changing over time. You can automate your comparison reports with
AWK or your favorite programming language.
In large systems management, benchmarking is important to predict when and how hardware should be upgraded. It also provides
ammunition to justify your hardware upgrade requests.
Digging deeper
In my experience, most hardware performance problems are related to the disks, memory, or CPU. Perhaps more frequently, application
programming errors or poorly designed databases cause serious performance issues.
Whatever the problems, sar and friends can give you a comprehensive view of how things are working and help track down bottlenecks
to fix a sluggish system. The examples here just scratch the surface of what sar can do. If you take a look at the man pages, it
should be easy to customize a set of reports for your needs.
Java-based
freshmeat.net
ksar is a sar graphing tool that can graph Linux, Mac OS X, AIX, and Solaris sar output. A sar statistics graph can be output
to a PDF file.
freshmeat.netThe atsar command can be used to detect performance
bottlenecks on Linux systems. It is similar to the sar command on other UNIX platforms. Atsar has the ability to show what is happening
on the system at a given moment. It also keeps track of the past system load by maintaining history files from which information
can be extracted. Statistics about the utilization of CPUs, disks and disk partitions, memory and swap, tty's, TCP/IP (v4/v6), NFS,
and FTP/HTTP traffic are gathered. Most of the functionality of atsar has been incorporated in the atop project.
Author:
Gerlof Langeveld [contact developer]
Perl based
freshmeat.net
Sar P Plot is a simple application which takes the output of the atsar application and puts it into Gnuplot data files. It can
be useful on server systems for performance analysis.
Perl scripts for processing sar data
freshmeat.net
BSDsar generates a history of usage on a FreeBSD machine. It logs data such as CPU usage, disk activity, network bandwidth usage
and activity, NFS information, memory, and swap. It is similar to atsar (for Linux) and sar (for Solaris).
2.5.4.3. The sadc command
As stated earlier, the sadc command collects system utilization data and writes it to a file for later
analysis. By default, the data is written to files in the /var/log/sa/ directory. The files are named
sa<dd>, where <dd>
is the current day's two-digit date.
sadc is normally run by the sa1 script. This script is periodically invoked
by cron via the file sysstat, which is located in /etc/crond.d.
The sa1 script invokes sadc for a single one-second measuring interval. By default,
cron runs sa1 every 10 minutes, adding the data collected during each interval
to the current /var/log/sa/sa<dd> file.
2.5.4.4. The sar command
The sar command produces system utilization reports based on the data collected by
sadc. As configured in Red Hat Linux, sar is automatically run to process the
files automatically collected by sadc. The report files are written to /var/log/sa/
and are named sar<dd>, where
<dd> is the two-digit representations of the previous day's two-digit date.
sar is normally run by the sa2 script. This script is periodically invoked
by cron via the file sysstat, which is located in /etc/crond.d.
By default, cron runs sa2 once a day at 23:53, allowing it to produce a report
for the entire day's data.
2.5.4.4.1. Reading sar Reports
The format of a sar report produced by the default Red Hat Linux configuration consists of multiple
sections, with each section containing a specific type of data, ordered by the time of day that the data was collected. Since
sadc is configured to perform a one-second measurement interval every ten minutes, the default
sar reports contain data in ten-minute increments, from 00:00 to 23:50[2].
Each section of the report starts with a heading that illustrates the data contained in the section. The heading is repeated
at regular intervals throughout the section, making it easier to interpret the data while paging through the report. Each section
ends with a line containing the average of the data reported in that section.
Here is a sample section sar report, with the data from 00:30 through 23:40 removed to save space:
00:00:01          CPU     %user     %nice   %system     %idle
00:10:00          all      6.39      1.96      0.66     90.98
00:20:01          all      1.61      3.16      1.09     94.14
…
23:50:01          all     44.07      0.02      0.77     55.14
Average:          all      5.80      4.99      2.87     86.34
|
In this section, CPU utilization information is displayed. This is very similar to the data displayed by
iostat.
Other sections may have more than one line's worth of data per time, as shown by this section generated from CPU utilization
data collected on a dual-processor system:
00:00:01          CPU     %user     %nice   %system     %idle
00:10:00            0      4.19      1.75      0.70     93.37
00:10:00            1      8.59      2.18      0.63     88.60
00:20:01            0      1.87      3.21      1.14     93.78
00:20:01            1      1.35      3.12      1.04     94.49
…
23:50:01            0     42.84      0.03      0.80     56.33
23:50:01            1     45.29      0.01      0.74     53.95
Average:            0      6.00      5.01      2.74     86.25
Average:            1      5.61      4.97      2.99     86.43
|
There are a total of seventeen different sections present in reports generated by the default Red Hat Linux
sar configuration; many are discussing in upcoming chapters. For more information about the data contained
in each section, see the sar(1) man page.
An underused tool for looking into system performance, the sar command samples system activity counters available in the Unix
kernel and prepares reports. Like most tools for measuring performance, sar provides a lot of data but little analysis, which probably
explains why it doesn't get much more of a workout. It's up to the user to interpret the numbers and determine how a system is performing
(or what is slowing it down).
Some companies bridge the gap between an excessive amount of available data and the bottom line system performance by creating
or employing evaluation tools for the raw numbers and preparing a report that provides conclusions, not just numbers. SarCheck (a
tool available from Aptitune Corporation) is one such tool. It provides some of the performance insights that might otherwise only
be available to those staffs blessed by the presence of a performance specialist.
The sar command can be thought of as running in two modes: interactive or "real-time". "Real-time" mode reports on the system's
current activity and "historical", which uses data previously collected and stored in log files. In both cases, the reports reflect
data that is routinely collected in the kernel but, in the latter case, this data is sampled and stored so that past performance
can be analyzed.
sar is not strictly a Solaris tool, either. It's available in other flavors of Unix as well, though configuration and default
behavior may vary between implementations. RedHat Linux systems collect system activity data routinely and save it in files in the
/var/log/sa directory. Solaris systems come prepared for running sar in either mode, but collection of data in performance logs
must be specifically invoked by un-commenting lines in the start script (/etc/rc2.d/S21perf) and crontab file (/var/spool/cron/crontabs/sys)
associated with the tool.
The Solaris package containing the sar commands is called SUNWaccu. The interactive and historical versions of the sar command
differ only in where the data is coming from -- from the kernel moment by moment or from one of the log files containing previously
collected performance data.
A common task for System Administrators is to monitor and care for a server. That's fairly easy to do at a moment's notice, but
how to keep a record of this information over time? One way to monitor your server is to use the Sysstat package.
Sysstat is actually a collection of utilities designed to collect information about the performance of a linux installation,
and record them over time.
It's fairly easy to install too, since it is included as a package on many distributions.
To install on Centos 4.3, just type
the following:
yum install sysstat
We now have the sysstat scripts installed on the system. Lets try the
sar command.
sar
Linux 2.6.16-xen (xen30)        08/17/2006

11:00:02 AM       CPU     %user     %nice   %system   %iowait     %idle
11:10:01 AM       all      0.00      0.00      0.00      0.00     99.99
Average:          all      0.00      0.00      0.00      0.00     99.99
Several bits of information, such as Linux kernel, hostname, and date are reported.
More importantly, the various ways CPU time being spent on the system is shown.
- %user, %nice, %system,
%iowait, and %idle
describe ways that the CPU may be utilized.
- %user and
%nice refer to your software programs, such as MySQL or Apache.
- %system refers to the kernel's internal workings.
- %iowait is time spent waiting for Input/Output, such as
a disk read or write. Finally, since the kernel accounts for 100% of the runnable time it can schedule, any unused time goes
into %idle.
The information above is shown for a 1 second interval. How can we keep track of that information over time?
If our system was consistently running heavy in %iowait, we might
surmise that a disk was getting overloaded, or going bad.
At least, we would know to investigate.
So how do we track the information over time? We can schedule sar to run at regular intervals, say,
every 10 minutes.
We then direct it to send the output to sysstat's special log files for later reports.
The way to do this is with the Cron daemon.
By creating a file called sysstat in
/etc/cron.d, we can tell cron to run sar every day.
Fortunately, the Systat package that yum installed already did this step for us.
more /etc/cron.d/sysstat
# run system activity accounting tool every 10 minutes
*/10 * * * * root /usr/lib/sa/sa1 1 1
# generate a daily summary of process accounting at 23:53
53 23 * * * root /usr/lib/sa/sa2 -A
The sa1 script logs sar output into sysstat’s binary log file format, and
sa2 reports it back in human readable format. The report is written to a file in /var/log/sa.
ls /var/log/sa
sa17 sar17
sa17 is the binary sysstat log, sar17 is the report. (Today's date is
the 17th)
There is quite alot of information contained in the sar report, but there are a few values that can tell us how busy the server
is.
Values to watch are swap usage, disk IO wait, and the run queue. These can be obtained by running sar
manually, which will report on those values.
sar
Linux 2.6.16-xen (xen30)        08/17/2006

11:00:02 AM       CPU     %user     %nice   %system   %iowait     %idle
11:10:01 AM       all      0.00      0.00      0.00      0.00     99.99
11:20:01 AM       all      0.00      0.00      0.00      0.00    100.00
11:30:02 AM       all      0.01      0.26      0.19      1.85     97.68
11:39:20 AM       all      0.00      2.41      2.77      0.53     94.28
11:40:01 AM       all      1.42      0.00      0.18      3.24     95.15
Average:          all      0.03      0.62      0.69      0.64     98.02
There were a few moments where of disk activity was high in the %iowait
column, but it didn't stay that way for too long. An average of 0.64 is pretty good.
How about my swap usage, am I running out of Ram? Being swapped out is normal for the Linux kernel, which will swap from time
to time. Constant swapping is bad, and generally means you need more Ram.
sar -W
Linux 2.6.16-xen (xen30)        08/17/2006

11:00:02 AM  pswpin/s pswpout/s
11:10:01 AM      0.00      0.00
11:20:01 AM      0.00      0.00
11:30:02 AM      0.00      0.00
11:39:20 AM      0.00      0.00
11:40:01 AM      0.00      0.00
11:50:01 AM      0.00      0.00
Average:         0.00      0.00
Nope, we are looking good. No persistant swapping has taken place.
How about system load? Are my processes waiting too long to run on the CPU?
sar -q
Linux 2.6.16-xen (xen30)        08/17/2006

11:00:02 AM   runq-sz  plist-sz   ldavg-1   ldavg-5  ldavg-15
11:10:01 AM         0        47      0.00      0.00      0.00
11:20:01 AM         0        47      0.00      0.00      0.00
11:30:02 AM         0        47      0.28      0.21      0.08
11:39:20 AM         0        45      0.01      0.24      0.17
11:40:01 AM         0        46      0.07      0.22      0.17
11:50:01 AM         0        46      0.00      0.02      0.07
Average:            0        46      0.06      0.12      0.08
No, an average load of .06 is really good. Notice that there is a 1, 5, and 15 minute interval on the right.
Having the three time intervals gives you a feel for how much load the system is carrying.
A 3 or 4 in the 1 minute average is ok, but the same number in the 15 minute
column may indicate that work is not clearing out, and that a closer look is warranted.
This was a short look at the Sysstat package.
We only looked at the out put of three of sar's attributes, but there are others.
Now, armed with sar in your toolbox, your system administration job just became a little easier.
This page is released into the public domain.
Using sar
The next command, sar, is the UNIX System Activity Reporting tool (part of the bos.acct fileset). It has been around
for what seems like forever in the UNIX world. This command essentially writes to standard output the contents of the cumulative
activity, which you would have selected as its flag. For example, the following command using the -u flag reports CPU
statistics. As with vmstat, if you are using shared partitioning in a virtualized environment, it reports back two additional columns
of information; physc and entc, which define the number of physical processors consumed by the partitions as well
as the percentage of entitled capacity utilized.
I ran this command on the system (see Listing 3) when there were no users around. Unless
there were some batch jobs running, I would not expect to see a lot of activity.
Listing 3. Running sar with no users around
# sar -u 1 5 (or sar 1 5)

AIX test01 3 5     03/18/07

System configuration: lcpu=2

17:36:53    %usr    %sys    %wio   %idle   physc
17:36:54       0       0       0     100    2.00
17:36:55       1       0       0     99     2.00
17:36:56       0       0       0     100    2.00
17:36:57       0       0       0     100    2.00
17:36:58       0       0       0     100    2.00

Average        0       0       0     100    2.00
Clearly, this system also shows no CPU bottleneck to speak of.
The columns used above are similar to vmstat entry outputs. The following table correlates sar and vmstat descriptives (see
Table 1).
Table 1. sar output fields and the corresponding vmstat field
| sar |
vmstat |
| %usr |
us |
| %sys |
sy |
| %wio |
wa |
| %idle |
id |
One of the reasons I prefer vmstat to sar is that it gives you the CPU utilization information, and it provides overall monitoring
information on memory and I/O. With sar, you need to run separate commands to pull the information. One advantage that sar gives
you is the ability to capture daily information and to run reports on this information (without writing your own script to do so).
It does this by using a process called the System Activity Data Collector, which is essentially a back-end to the sar
command. When enabled, usually through cron (on a default AIX partition, you would usually find it commented out), it collects data
periodically in binary format.
www.ibm.com/developerworks
Extracting useful information
Data is being collected, but it must be queried to be useful. Running the sar command without options generates
basic statistics about CPU usage for the current day. Listing 2 shows the output of
sar without any parameters. (You might see different column names depending on the platform. In some UNIX flavors,
sadc collects more or less data based on what's available.) The examples here are from Sun Solaris 10; whatever platform
you're using will be similar, but might have slightly different column names.
Listing 2. Default output of sar (showing CPU usage-bash-3.00$ sar
SunOS unknown 5.10 Generic_118822-23 sun4u 01/20/2006
00:00:01 %usr %sys %wio %idle
00:10:00 0 0 0 100
. cut ...
09:30:00 4 47 0 49
Average 0 1 0 98
Each line in the output of sar is a single measurement, with the timestamp in the left-most column. The other columns
hold the data. (These columns vary depending on the command-line arguments you use.) In Listing
2, the CPU usage is broken into four categories:
- %usr: The percentage of time the CPU is spending on user processes, such as applications, shell scripts, or interacting
with the user.
- %sys: The percentage of time the CPU is spending executing kernel tasks. In this example, the number is high, because
I was pulling data from the kernel's random number generator.
- %wio: The percentage of time the CPU is waiting for input or output from a block device, such as a disk.
- %idle: The percentage of time the CPU isn't doing anything useful.
The last line is an average of all the datapoints. However, because most systems experience busy periods followed by idle periods,
the average doesn't tell the entire story.
Watching disk activity
Disk activity is also monitored. High disk usage means that there will be a greater chance that an application requesting data
from disk will block (pause) until the disk is ready for that process. The solution typically involves splitting file systems across
disks or arrays; however, the first step is to know that you have a problem.
The output of sar -d shows various disk-related statistics for one measurement period. For the sake of brevity,
Listing 3 shows only hard disk drive activity.
Listing 3. Output of sar -d (showing disk activity)
$ sar -d

SunOS unknown 5.10 Generic_118822-23 sun4u    01/22/2006

00:00:01   device       %busy   avque   r+w/s  blks/s  avwait  avserv
. cut ...
14:00:02   dad0             31     0.6      78   16102     1.9     5.3
           dad0,c            0     0.0       0       0     0.0     0.0
           dad0,h           31     0.6      78   16102     1.9     5.3
           dad1              0     0.0       0       1     1.6     1.3
           dad1,a            0     0.0       0       1     1.6     1.3
           dad1,b            0     0.0       0       0     0.0     0.0
           dad1,c            0     0.0       0       0     0.0     0.0
As in the previous example, the time is along the left. The other columns are as follows:
- device: This is the disk, or disk partition, being measured. In Sun Solaris, you must translate this disk into a
physical disk by looking up the reported name in /etc/path_to_inst, and then cross-reference that information to the entries
in /dev/dsk. In Linux®, the major and minor numbers of the disk device are used.
- %busy: This is the percentage of time the device is being read from or written to.
- avque: This is the average depth of the queue that is used to serialize disk activity. The higher the avque value,
the more blocking is occurring.
- r+w/s, blks/s: This is disk activity per second in terms of read or write operations and disk blocks, respectively.
- avwait: This is the average time (in milliseconds) that a disk read or write operation waits before it is performed.
- avserv: This is the average time (in milliseconds) that a disk read or write operation takes to execute.
Some of these numbers, such as avwait and avserv values, correlate directly into user experience. High wait times
on the disk likely point to several people contending for the disk, which should be confirmed with high avque numbers. High avserv
values point to slow disks.
Other metrics
Many other items are collected, with corresponding arguments to view them:
- The
-b argument shows information on buffers and the efficiency of using a buffer versus having to go to disk.
- The
-c argument shows system calls broken down into some of the popular calls, such as fork(),
exec(), read(), and write(). High process creation can lead to poor performance and is
a sign that you might need to move some applications to another computer.
- The
-g, -p, and -w arguments show paging (swapping) activity. High paging is a sign
of memory starvation. In particular, the -w argument shows the number of process switches: A high number can mean
too many things are running on the computer, which is spending more time switching than working.
- The
-q argument shows the size of the run queue, which is the same as the load average for the time.
- The
-r argument shows free memory and swap space over time.
Each UNIX flavor implements its own set of measurements and command-line arguments for sar. Those I've shown are
common and represent the elements that I find more useful.
Softpanorama Recommended
sysstat package contains utilities to monitor system performance and usage activity. Sysstat contains various utilities, common
to many commercial Unixes, and tools you can schedule via cron to collect and historize performance and activity data.
- iostat(1) reports CPU statistics
and input/output statistics for devices, partitions and network filesystems.
- mpstat(1) reports individual or
combined processor related statistics.
- pidstat(1) reports statistics
for Linux tasks (processes) : I/O, CPU, memory, etc.
- sar(1) collects, reports and saves
system activity information (CPU, memory, disks, interrupts, network interfaces, TTY, kernel tables,etc.)
- sadc(8) is the system activity data
collector, used as a backend for sar.
- sa1(8) collects and stores binary
data in the system activity daily data file. It is a front end to sadc designed to be run from cron.
- sa2(8) writes a summarized daily
activity report. It is a front end to sar designed to be run from cron.
- sadf(1) displays data collected
by sar in multiple formats (CSV, XML, etc.) This is useful to load performance data into a database, or import them in a spreadsheet
to make graphs.
- nfsiostat(1) reports input/output
statistics for network filesystems (NFS).
- cifsiostat(1) reports CIFS
statistics.
Feb 28, 2006 | IBM DeveloperWorks
How To Monitor A System With Sysstat On Centos 4.3 HowtoForge
- Linux Howtos and Tutorials by
Quantact-Tim
Linux.com CLI Magic Tracking system performance with sar
ITworld.com - UNIX SYSTEM ADMINISTRATION - Introducing
SAR
PDF]
Solaris Performance monitoring - sar - NCCCS Systems Office Wiki
freshmeat.net Project details for BSDsar -- BSDsar generates
a history of usage on a FreeBSD machine. It logs data such as CPU usage, disk activity, network bandwidth usage and activity, NFS information,
memory, and swap. It is similar to atsar (for Linux) and sar (for Solaris).
The atsar command can be used to detect performance bottlenecks on Linux systems. It is similar to the sar command on other UNIX
platforms. Atsar has the ability to show what is happening on the system at a given moment. It also keeps track of the past system
load by maintaining history files from which information can be extracted. Statistics about the utilization of CPUs, disks and disk
partitions, memory and swap, tty's, TCP/IP (v4/v6), NFS, and FTP/HTTP traffic are gathered. Most of the functionality of atsar has
been incorporated in the atop project.
Author:
Gerlof Langeveld [contact developer]
Sar P Plot is a simple application which takes the output of the atsar application and puts it into Gnuplot data files. It can
be useful on server systems for performance analysis.
Perl scripts for processing sar data
BSDsar generates a history of usage on a FreeBSD machine. It logs data such as CPU usage, disk activity, network bandwidth usage
and activity, NFS information, memory, and swap. It is similar to atsar (for Linux) and sar (for Solaris).
RedHat has
sysstat preinstalled and collect system activity data routinely. It logs it in the /var/log/sa directory. For Suse it needs
to be installed manually.
Linux implementation is well described in Linux.com article CLI
Magic Tracking system performance with sar
Sadc (system activity data collector) is the program that gathers performance data. It pulls
its data out of the virtual /proc filesystem, then it saves the data in a file (one per day) named /var/log/sa/saDD where DD is
the day of the month.
Two shell scripts from the sysstat package control how the data collector is run. The first script, sa1, controls how often data
is collected, while sa2 creates summary reports (one per day) in /var/log/sa/sarDD. Both scripts are run from cron. In the default
configuration, data is collected every 10 minutes and summarized just before midnight.
If you suspect a performance problem with a particular program, you can use sadc to collect data on a particular
process (with the -x argument), or its children (-X), but you will need to set up a custom script using
those flags.
As Dr. Heisenberg showed, the act of measuring something changes it. Any tool that collects performance data has some overall
negative impact on system performance, but with sar, the impact seems to be minimal. I ran a test with the sa1 cron job set to gather
data every minute (on a server that was not busy) and it didn't cause any serious issues. That may not hold true on a busy system.
Creating reports
If the daily summary reports created by the sa2 script are not enough, you can create your own custom reports using sar. The
sar program reads data from the current daily data file unless you specify otherwise. To have sar read a particular data file, use
the -f /var/log/sa/saDD option. You can select multiple files by using multiple -f options. Since many
of sar's reports are lengthy, you may want to pipe the output to a file.
To create a basic report showing CPU usage and I/O wait time percentage, use sar with no flags. It produces a report
similar to this:
01:10:00 PM       CPU     %user     %nice   %system   %iowait     %idle
01:20:00 PM       all      7.78      0.00      3.34     20.94     67.94
01:30:00 PM       all      0.75      0.00      0.46      1.71     97.08
01:40:00 PM       all      0.65      0.00      0.48      1.63     97.23
01:50:00 PM       all      0.96      0.00      0.74      2.10     96.19
02:00:00 PM       all      0.58      0.00      0.54      1.87     97.01
02:10:00 PM       all      0.80      0.00      0.60      1.27     97.33
02:20:01 PM       all      0.52      0.00      0.37      1.17     97.94
02:30:00 PM       all      0.49      0.00      0.27      1.18     98.06
Average:          all      1.85      0.00      0.44      2.56     95.14
If the %idle is near zero, your CPU is overloaded. If the %iowait is large, your disks are overloaded.
To check the kernel's paging performance, use sar -B, which will produce a report similar to this:
11:00:00 AM  pgpgin/s pgpgout/s   fault/s  majflt/s
11:10:00 AM      8.90     34.08      0.00      0.00
11:20:00 AM      2.65     26.63      0.00      0.00
11:30:00 AM      1.91     34.92      0.00      0.00
11:40:01 AM      0.26     36.78      0.00      0.00
11:50:00 AM      0.53     32.94      0.00      0.00
12:00:00 PM      0.17     30.70      0.00      0.00
12:10:00 PM      1.22     27.89      0.00      0.00
12:20:00 PM      4.11    133.48      0.00      0.00
12:30:00 PM      0.41     31.31      0.00      0.00
Average:       130.91     27.04      0.00      0.00
Raw paging numbers may not be of concern, but a high number of
major faults (majflt/s) indicate that the system needs more
memory. Note that majflt/s is only valid with kernel versions 2.5 and later.
For network statistics, use sar -n DEV. The -n DEV option tells sar to generate a report that shows
the number of packets and bytes sent and received for each interface. Here is an abbreviated version of the report:
11:00:00 AM     IFACE   rxpck/s   txpck/s   rxbyt/s   txbyt/s
11:10:00 AM        lo      0.62      0.62     35.03     35.03
11:10:00 AM      eth0     29.16     36.71   4159.66  34309.79
11:10:00 AM      eth1      0.00      0.00      0.00      0.00
11:20:00 AM        lo      0.29      0.29     15.85     15.85
11:20:00 AM      eth0     25.52     32.08   3535.10  29638.15
11:20:00 AM      eth1      0.00      0.00      0.00      0.00
To see network errors, try sar -n EDEV, which shows network failures.
Reports on current activity
Sar can also be used to view what is happening with a specific subsystem, such as networking or I/O, almost in real time. By
passing a time interval (in seconds) and a count for the number of reports to produce, you can take an immediate snapshot of a system
to find a potential bottleneck.
For example, to see the basic report every second for the next 10 seconds, use sar 1 10. You can run any of the
reports this way to see near real-time results.
Benchmarking
Even if you have plenty of horsepower to run your applications, you can use sar to track changes in the workload over time. To
do this, save the summary reports (sar only saves seven) to a different directory over a period of a few weeks or a month. This
set of reports can serve as a baseline for the normal system workload. Then compare new reports against the baseline to see how
the workload is changing over time. You can automate your comparison reports with
AWK or your favorite programming language.
In large systems management, benchmarking is important to predict when and how hardware should be upgraded. It also provides
ammunition to justify your hardware upgrade requests.
Society
Groupthink :
Two Party System
as Polyarchy :
Corruption of Regulators :
Bureaucracies :
Understanding Micromanagers
and Control Freaks : Toxic Managers :
Harvard Mafia :
Diplomatic Communication
: Surviving a Bad Performance
Review : Insufficient Retirement Funds as
Immanent Problem of Neoliberal Regime : PseudoScience :
Who Rules America :
Neoliberalism
: The Iron
Law of Oligarchy :
Libertarian Philosophy
Quotes
War and Peace
: Skeptical
Finance : John
Kenneth Galbraith :Talleyrand :
Oscar Wilde :
Otto Von Bismarck :
Keynes :
George Carlin :
Skeptics :
Propaganda : SE
quotes : Language Design and Programming Quotes :
Random IT-related quotes :
Somerset Maugham :
Marcus Aurelius :
Kurt Vonnegut :
Eric Hoffer :
Winston Churchill :
Napoleon Bonaparte :
Ambrose Bierce :
Bernard Shaw :
Mark Twain Quotes
Bulletin:
Vol 25, No.12 (December, 2013) Rational Fools vs. Efficient Crooks The efficient
markets hypothesis :
Political Skeptic Bulletin, 2013 :
Unemployment Bulletin, 2010 :
Vol 23, No.10
(October, 2011) An observation about corporate security departments :
Slightly Skeptical Euromaydan Chronicles, June 2014 :
Greenspan legacy bulletin, 2008 :
Vol 25, No.10 (October, 2013) Cryptolocker Trojan
(Win32/Crilock.A) :
Vol 25, No.08 (August, 2013) Cloud providers
as intelligence collection hubs :
Financial Humor Bulletin, 2010 :
Inequality Bulletin, 2009 :
Financial Humor Bulletin, 2008 :
Copyleft Problems
Bulletin, 2004 :
Financial Humor Bulletin, 2011 :
Energy Bulletin, 2010 :
Malware Protection Bulletin, 2010 : Vol 26,
No.1 (January, 2013) Object-Oriented Cult :
Political Skeptic Bulletin, 2011 :
Vol 23, No.11 (November, 2011) Softpanorama classification
of sysadmin horror stories : Vol 25, No.05
(May, 2013) Corporate bullshit as a communication method :
Vol 25, No.06 (June, 2013) A Note on the Relationship of Brooks Law and Conway Law
History:
Fifty glorious years (1950-2000):
the triumph of the US computer engineering :
Donald Knuth : TAoCP
and its Influence of Computer Science : Richard Stallman
: Linus Torvalds :
Larry Wall :
John K. Ousterhout :
CTSS : Multix OS Unix
History : Unix shell history :
VI editor :
History of pipes concept :
Solaris : MS DOS
: Programming Languages History :
PL/1 : Simula 67 :
C :
History of GCC development :
Scripting Languages :
Perl history :
OS History : Mail :
DNS : SSH
: CPU Instruction Sets :
SPARC systems 1987-2006 :
Norton Commander :
Norton Utilities :
Norton Ghost :
Frontpage history :
Malware Defense History :
GNU Screen :
OSS early history
Classic books:
The Peter
Principle : Parkinson
Law : 1984 :
The Mythical Man-Month :
How to Solve It by George Polya :
The Art of Computer Programming :
The Elements of Programming Style :
The Unix Hater’s Handbook :
The Jargon file :
The True Believer :
Programming Pearls :
The Good Soldier Svejk :
The Power Elite
Most popular humor pages:
Manifest of the Softpanorama IT Slacker Society :
Ten Commandments
of the IT Slackers Society : Computer Humor Collection
: BSD Logo Story :
The Cuckoo's Egg :
IT Slang : C++ Humor
: ARE YOU A BBS ADDICT? :
The Perl Purity Test :
Object oriented programmers of all nations
: Financial Humor :
Financial Humor Bulletin,
2008 : Financial
Humor Bulletin, 2010 : The Most Comprehensive Collection of Editor-related
Humor : Programming Language Humor :
Goldman Sachs related humor :
Greenspan humor : C Humor :
Scripting Humor :
Real Programmers Humor :
Web Humor : GPL-related Humor
: OFM Humor :
Politically Incorrect Humor :
IDS Humor :
"Linux Sucks" Humor : Russian
Musical Humor : Best Russian Programmer
Humor : Microsoft plans to buy Catholic Church
: Richard Stallman Related Humor :
Admin Humor : Perl-related
Humor : Linus Torvalds Related
humor : PseudoScience Related Humor :
Networking Humor :
Shell Humor :
Financial Humor Bulletin,
2011 : Financial
Humor Bulletin, 2012 :
Financial Humor Bulletin,
2013 : Java Humor : Software
Engineering Humor : Sun Solaris Related Humor :
Education Humor : IBM
Humor : Assembler-related Humor :
VIM Humor : Computer
Viruses Humor : Bright tomorrow is rescheduled
to a day after tomorrow : Classic Computer
Humor
The Last but not Least Technology is dominated by
two types of people: those who understand what they do not manage and those who manage what they do not understand ~Archibald Putt.
Ph.D
Copyright © 1996-2021 by Softpanorama Society. www.softpanorama.org
was initially created as a service to the (now defunct) UN Sustainable Development Networking Programme (SDNP)
without any remuneration. This document is an industrial compilation designed and created exclusively
for educational use and is distributed under the Softpanorama Content License.
Original materials copyright belong
to respective owners. Quotes are made for educational purposes only
in compliance with the fair use doctrine.
FAIR USE NOTICE This site contains
copyrighted material the use of which has not always been specifically
authorized by the copyright owner. We are making such material available
to advance understanding of computer science, IT technology, economic, scientific, and social
issues. We believe this constitutes a 'fair use' of any such
copyrighted material as provided by section 107 of the US Copyright Law according to which
such material can be distributed without profit exclusively for research and educational purposes.
This is a Spartan WHYFF (We Help You For Free)
site written by people for whom English is not a native language. Grammar and spelling errors should
be expected. The site contain some broken links as it develops like a living tree...
Disclaimer:
The statements, views and opinions presented on this web page are those of the author (or
referenced source) and are
not endorsed by, nor do they necessarily reflect, the opinions of the Softpanorama society. We do not warrant the correctness
of the information provided or its fitness for any purpose. The site uses AdSense so you need to be aware of Google privacy policy. You you do not want to be
tracked by Google please disable Javascript for this site. This site is perfectly usable without
Javascript.
Last modified:
February 19, 2020